Detailed Analysis ofCarding Quality and Its Influence on...
8
Indian Journal of Textile Research Vol. 4, June 1979, pp. 63-70 Detailed Analysis of Carding Quality and Its Influence on Processing and Yarn Properties S K NERURKAR- The Bombay Textile Research Association, Bombay 400086 Received 17 June 1978; accepted 22 April 1979 Detailed analysis of card web/sliver and other post-card products has been done for obtaining improved understanding about the changes in the characteristics of card web/sliver with carding quality and the impact of carding quality on the pro- perties of yarn spun on different spinning systems. The analysis has shown that although the routine tests of carding quality such as trash in sliver, neps in card web, cylinder load, etc. assist in grading carding quality, other card web characteristics such as evenness in card web weight per unit area, short term variation in sliver thickness, fibre parallelization, fibre to fibre separation are also important parameters of card web contributing to carding quality. Although bad carding gives better parallelization, the rate of improvement in parallelization in the subsequent processes is better with good carding, probably due to better fibre separation. Fibre separation seems to influence carding quality more than fibre parallelization. The size of trash particles does not change much with carding condition. Open end spinning has been found to be more sensitive to carding condition both for performance and yam quality than ring spinning. These findings suggest that by carding material under adverse conditions many carding quality characteristics other than the routine ones get changed and the influence on spinning performance and yarn quality depends on the spinning system used. Although the influence of carding quality on post- carding processes and yarn quality is well accepted, the term 'carding quality' has not been defined precisely. This is due to incomplete understanding about the different measurements required to fully describe carding quality and also due to many non-measurable characteristics of card web in a routine manner. The need to have a more detailed understanding for carding quality is now felt due to the phenomenal increase in production rate of card, when carding quality becomes critical at such rate, and also due to the advent of many new spinning systems in recent years which may require different configurations of fibres in a sliver than for ring spinning for better performance. Recently, Ashnin 1 developed a high speed method for assessing web quality, while Sundra and Swiech" tried to relate the purity of card web to yarn properties. Ul'man" tried to evaluate card web quality by counting the number of holes containing neps on the web deposited on the plate. Barella and colleaguest-" developed an electronic instrument for measuring the unevenness and neps in card web, while Jackowski" measured fibre distribution across the flat carding surface. After the -This work was carried out by the author at the Southern Regional Research Center of United States Department of Agriculture at New Orleans, USA, while pursuing the fellowship sponsored by the World Association of Industrial & Technological Research Organisation, Vancouver, Canada. discovery of hooks in card web by Morton and Summer", hook measurement and configuration of fibres in a sliver were studied by several workers. Simpson and Fiori 8 found that both hooks and fibre parallelization must be measured to characterize the card sliver and processing performance. The concept of card loading was developed by Kaufmann", while Krylov'? devised a simple method for measuring transfer efficiency. These different parameters of carding quality did not seem to encompass all the determinants of carding quality. Although the routine tests of card web such as neps, trash particles and cleaning efficiency help to grade the carding quality to some extent, and the same were emphasized more in the past, not much information is available as to how with the deterioration in carding quality evenness in card web weight per unit area, short and long term variation in sliver thickness, fibre separation and fibre paralle1ization, etc. are affected at card stage and also at subsequent stages. In an attempt to get a better understanding of the subject of carding quality, card web and its post-card products obtained under widely different carding conditions have been examined in detail. The changes in different characteristics of card web/sliver due to carding conditions have also been examined and their influence on spinning and yarn quality has been studied. It is envisaged that this approach may help in improving understanding of carding quality to some extent, 63
Transcript of Detailed Analysis ofCarding Quality and Its Influence on...
Indian Journal of Textile ResearchVol. 4, June 1979, pp. 63-70
Detailed Analysis of Carding Quality and Its Influence on Processing and YarnProperties
S K NERURKAR-The Bombay Textile Research Association, Bombay 400086
Received 17 June 1978; accepted 22 April 1979
Detailed analysis of card web/sliver and other post-card products has been done for obtaining improved understandingabout the changes in the characteristics of card web/sliver with carding quality and the impact of carding quality on the pro-perties of yarn spun on different spinning systems. The analysis has shown that although the routine tests of carding qualitysuch as trash in sliver, neps in card web, cylinder load, etc. assist in grading carding quality, other card web characteristics suchas evenness in card web weight per unit area, short term variation in sliver thickness, fibre parallelization, fibre to fibreseparation are also important parameters of card web contributing to carding quality. Although bad carding gives betterparallelization, the rate of improvement in parallelization in the subsequent processes is better with good carding, probably dueto better fibre separation. Fibre separation seems to influence carding quality more than fibre parallelization. The size of trashparticles does not change much with carding condition. Open end spinning has been found to be more sensitive to cardingcondition both for performance and yam quality than ring spinning. These findings suggest that by carding material underadverse conditions many carding quality characteristics other than the routine ones get changed and the influence on spinningperformance and yarn quality depends on the spinning system used.
Although the influence of carding quality on post-carding processes and yarn quality is well accepted, theterm 'carding quality' has not been defined precisely.This is due to incomplete understanding about thedifferent measurements required to fully describecarding quality and also due to many non-measurablecharacteristics of card web in a routine manner. Theneed to have a more detailed understanding for cardingquality is now felt due to the phenomenal increase inproduction rate of card, when carding quality becomescritical at such rate, and also due to the advent of manynew spinning systems in recent years which mayrequire different configurations of fibres in a sliver thanfor ring spinning for better performance. Recently,Ashnin 1 developed a high speed method for assessingweb quality, while Sundra and Swiech" tried to relatethe purity of card web to yarn properties. Ul'man" triedto evaluate card web quality by counting the number ofholes containing neps on the web deposited on theplate. Barella and colleaguest-" developed anelectronic instrument for measuring the unevennessand neps in card web, while Jackowski" measured fibredistribution across the flat carding surface. After the
-This work was carried out by the author at the SouthernRegional Research Center of United States Department ofAgriculture at New Orleans, USA, while pursuing the fellowshipsponsored by the World Association of Industrial & TechnologicalResearch Organisation, Vancouver, Canada.
discovery of hooks in card web by Morton andSummer", hook measurement and configuration offibres in a sliver were studied by several workers.Simpson and Fiori8 found that both hooks and fibreparallelization must be measured to characterize thecard sliver and processing performance. The concept ofcard loading was developed by Kaufmann", whileKrylov'? devised a simple method for measuringtransfer efficiency. These different parameters ofcarding quality did not seem to encompass all thedeterminants of carding quality.
Although the routine tests of card web such as neps,trash particles and cleaning efficiency help to grade thecarding quality to some extent, and the same wereemphasized more in the past, not much information isavailable as to how with the deterioration in cardingquality evenness in card web weight per unit area, shortand long term variation in sliver thickness, fibreseparation and fibre paralle1ization, etc. are affected atcard stage and also at subsequent stages. In an attemptto get a better understanding of the subject of cardingquality, card web and its post-card products obtainedunder widely different carding conditions have beenexamined in detail. The changes in differentcharacteristics of card web/sliver due to cardingconditions have also been examined and their influenceon spinning and yarn quality has been studied. It isenvisaged that this approach may help in improvingunderstanding of carding quality to some extent,
63
INDIAN J. TEXT. RES., VOL. 4, JUNE 1979
although it may not suggest any new definition ofcarding quality.
Experimental ProcedureBlowroom laps of 140z/yd made from two
American cottons, Middling (clean) and Low Middling(dirty), were processed on Whitin metallic card with aCrosrol doffer take off and crush roll attachment undertwo different carding conditions. The fibre propertiesofthe cottons are given in Tablel. The card particularsare given in Table 2. The card sliver was given twopassages of drawings, then processed on roving andtwo carded counts, i.e. 12/1 and 24/1, were spun onRobberts ring frame with 4.2 TM and at 9100 and12000 (rpm) spindle speed respectively, on 2.25 indiameter ring. The ringframe used was with 240spindles and end breakage study was conducted for 720
Table I-Fibre Properties
Middling Low MiddlingLengthClasser's, in 1-3/32 1-1/16
Digital jibrograph2.5% span length, in 1.08 1.0650% do 0.47 0.46Uniformity ratio 43 43Micronaire reading 4.60 4.60
StelometerZero gauge, g/tex 40.3 41.81/8 in gauge, g/tex 22.6 23.0Elongation, % 8.43 7.28
Shirley analyzerTrash, % 0.82 2.87
Table 2-Card Processing 'Particulars for Good and BadCarding Condition
Carding conditionSpeed and production parti-
culars on cardHank of blowroom lap fed to card
_Licker in, rpmCylinder, rpmDolTer, rpmFlats, in/minHank of card sliverTotal mechanical draft at"cardGrains per yard of card sliverProduction rate at card, lb/hr
Good Bad
0.0013674530020.8
5.50.167
122.450.030.0
0.0013645018525.80.875O.lll
81.675.056.0
Card settingsFlat to cylinder, 0.001 inAll other settings
10Normal
34Normal
64
spindle hours for each count. As the hank of card sliverwas different for the two carding conditions, the samewas adjusted to a common hank of 0.16 Ne in two post-card drawing passages in steps.
The part of the material after the second drawingwas spun on Toyoda OE spinning with 5.19 and5.23 TM for 12/1 and 24/1 counts respectively, and at34,000 rpm rotor speed and 6000 rpm opening rollspeed. End breakage study on OE spinning wasconducted on 20 rotors and for 80 spindle hours.
The fibre and yarn properties were determined bymethods recommended by the American Society forTesting and Materials 11. Sliver uniformity was testedon the Saco-Lowell sliver thickness tester converted toelectrical recordings 12. The 'between length' measurewas 1 in and the 'within length' measure was 1yd. TheCV% of 20 one-yard samples was averaged for a test.Sliver and roving evenness and yarn imperfections anduniformity were measured on Uster IIevenness testerat standard recommended speeds for the respectivematerials.
Fibre hooks were measured by cutting ratio andfibre parallelization by projected mean length onSRRL triple clamp instrument'". The sizes of dustparticles were measured using a Coulter counter. Thepercentage card waste was calculated by processing200 lb of lap cotton for each trial. Five readings ofcylinder load, flat load and transfer efficiency, equallyspaced in the entire duration of trial, were taken foreach trial. Transfer efficiency and cylinder load weremeasured by Krylov method 10, while flat load wasestimated by actual weighing of the flat strips from 15flats removed by flat comb during normal working.The number of neps and trash particles was counted bytemplate method. For each trial, 36 readings weretaken for nep and trash study. The variation in weightof card web per unit area was calculated by weighing 40web pieces of 4 x 4 in size. This was done bysandwiching the card web at the front of cros-rol ofcard, between a pair of plastic sheets of appropriatesize.
Results and DiscussionCard waste study-The results of card waste study
given in Table 3 show that under bad cardingcondition less waste is removed than under goodcarding condition. This has resulted in poor cleaning atcard under bad carding condition, as seen from thelower cleaning efficiency.
N ep count and variation in weight of card web per unitarea-The numbers of neps and trash particles in cardweb and CV% in weight of card web per unit area aregiven in Table 4. Under bad carding condition, highernumbers of neps and trash particles are obtained atcard stage with both the cottons. Variation in weight of
NERURKAR: CARDING QUALITY & ITS INFLUENCE ON PROCESSING & YARN PROPERTIES
Table 3-Percentage of Card Waste and Cleaning Efficiencyof Card at Different Carding Conditions
Middling(clean)
Low Middling(dirty)
Carding condition
Total visible w-aste, %Good
1.76
Bad
0.54
Good
2.57
Bad
1.08
Break-up of waste, %(a) Licker-in droppings(b) Flat stripsCleaning efficiency of card, %
0.331.43
72.5
0.190.35
29.7
1.101.47
83.8
0.620.46
41.1
Table 4-Nep and Trash Level in Card Web and Variationin Card Web Weight Per Unit Area
Middling LowMiddling(clean) (dirty)
Carding condition Good Bad Good Bad
Neps/grain in card sliver 4.4 10.3 4.0 6.1No. of trash particles/grain 2.2 3.3 3.0 3.7in card sliver
Coefficient of variation (%) in 14.5 16.4 19.2 29.1card web weight of 4 x 4 in size
web per unit area was found to be high under badcarding condition for both the cottons. This differencein CV% of the weight of card web per unit area arisingdue to carding condition was more with dirty cottonthan with clean cotton. The differences in CV% due tocarding conditions was significant only in dirty cotton.The finding of high CV% under bad carding conditionwas also supported by high short term variation insliver thickness as measured on Saco-lowell tester,which is discussed later. However, since the card web isfolded to form a sliver, the differences in CV% of webweight per unit area arising due to carding conditiondiminish while measuring the variation in the thicknessof card sliver at 1 in length (Tables 4 and 6).
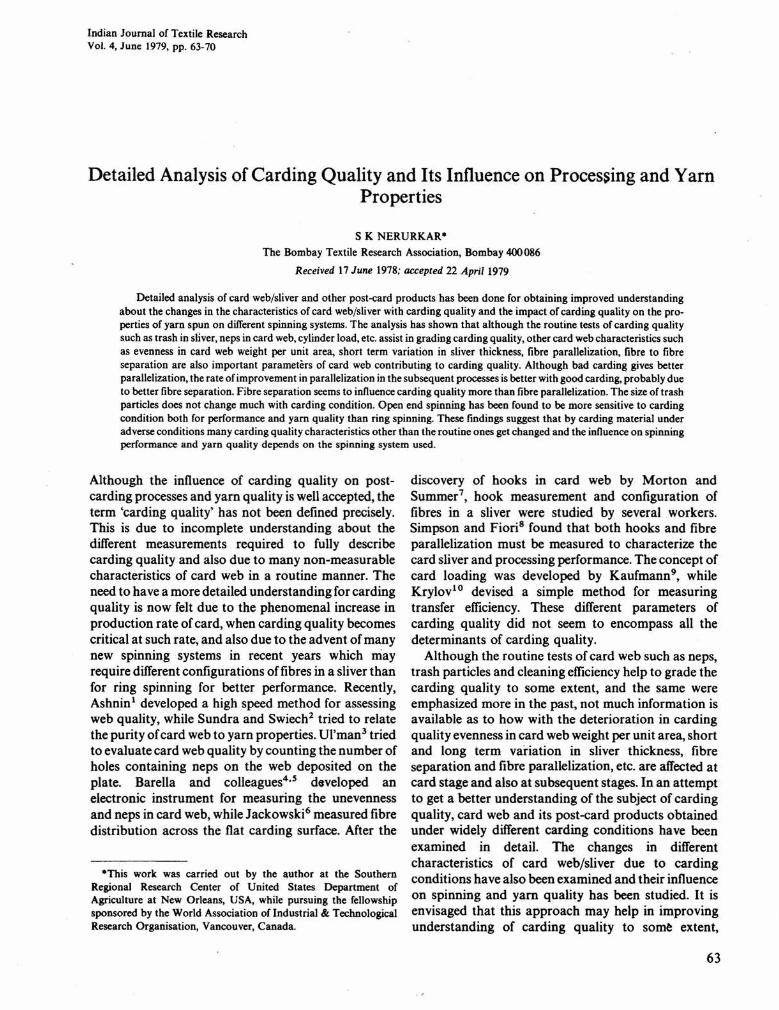
Measurement of hooks and fibre parallelization incard, drawing sliver and roving-The values ofprojected mean length and cutting ratio obtained forcard sliver and I and II drawing sliver and roving areplotted in Figs. 1and 2. It is evident from Fig. 1that theprojected mean length of fibres in sliver and rovingwhich measures the degree ofparallelization of fibres insliver and roving was higher under bad cardingconditions at all stages from card I drawing, II drawingand roving, as seen by higher values of PML with badcarding. The values of PML with bad carding weremuch higher than those with good carding at cardstage and subsequently as the sliver was processedthrough drawing and roving, this difference in PML at
card stage due to carding condition got narroweddown as the rate of improvement of parallelization inthe subsequent process was higher with good carding,possibly due to better fibre to fibre separation(obtained with good carding) and lower degree ofparallelization obtained with good carding. However,
.sC!J' -2~ 75XI0~ ina:
SlIVER __ i':~1l0RAWING
KEY----CLEAN COTTON--OIRTY COTTONCII
a:w>:::;VI
~VIwa:mii: 21L60XU) -o inX•...t!)Zw-'zcl
'"2Qw•...u'"6a:0.. -2
45i~IO LG;;;OOO:6:;;;:-----;B~AO~---::G:;::O""OO;::------::B:-I:~'::'D--::I75X102
CARDING CONDITION In
0--------<>ROVING
_--00--
Fig. I-Effect of carding conditions on projected mean length offibres in card sliver, I and II drawing sliver and roving
0'10 9 r---:-A-::D~O:::T'--I~N~D-::IC:-:AT=:E:-::S:-::B7AD=-::CA~RD:-::I:-:NG::-:-WH=IL-::E:-----'
'NO DOT'INDICATES GOOD CARDING
--CLEAN COTTON--- --DIRTY COTTON----
~IIIII~,
\\ MAJORITY HOOK
V1\IIII1\IIIII~hI.~
1\
"1\
"IIIII I\II'x.IX
0·009 CARD
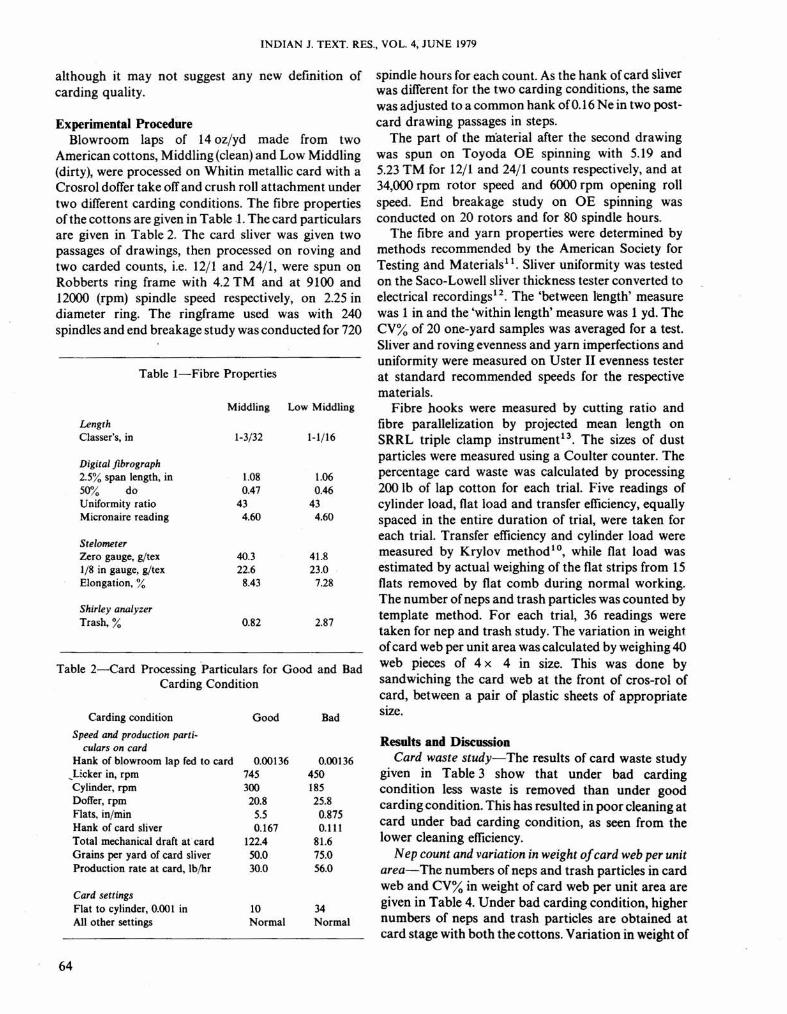
Fig. 2-Effect of carding conditions on majority and minority hooksat card and I and II drawings
65
INDIAN J. TEXT. RES., VOL. 4, JUNE 1979
- - - CLEAN COTTON-- DIRTY COTTON0----0 GOOD CARDING~ BAD CARDING
~II/I1/II
o II.., II, 1/
R \ /I\ , 1/, ,II
\' :,\ .,\ .'\J.
1 11 I 111 DRAWING TOTAL
CLEAN COTTONDRAWING TOTALDIRTY COTTON
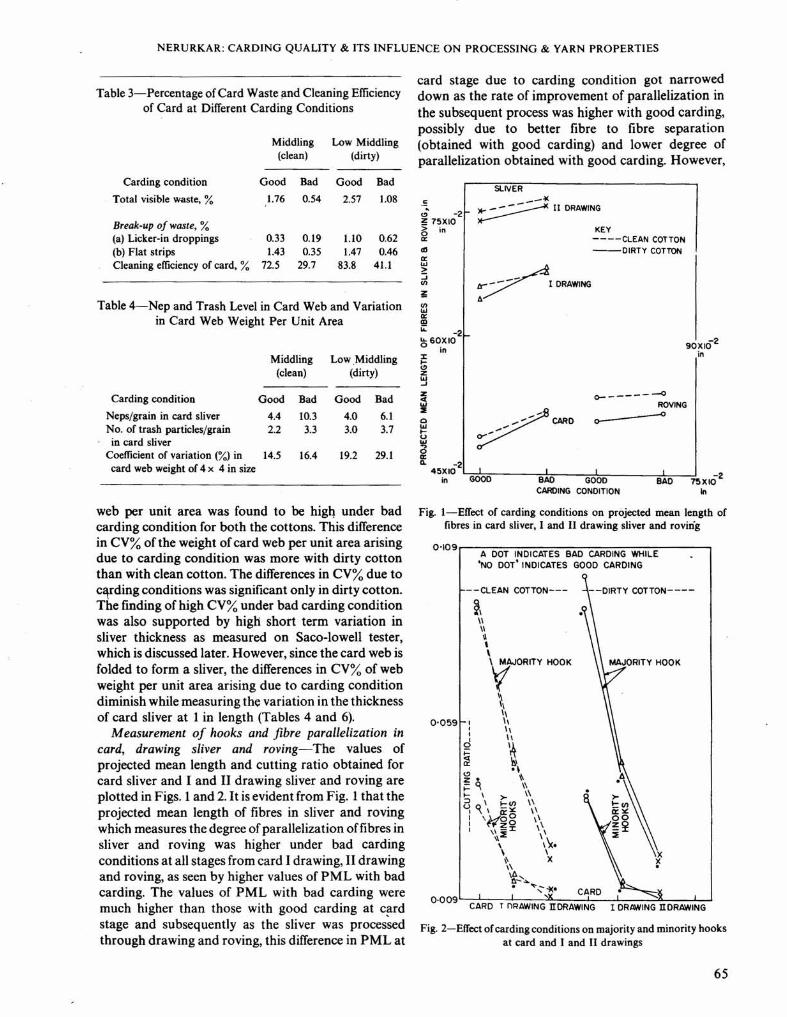
Fig. 3- EIT~t of carding conditions on the rate of improvement inparallelization of fibres at I and II drawing process
it is worth noting from Fig. 1 that this difference inPML never vanishes completely even up to roving. Therate of improvement of parallelization at passage I andII of drawing and the total rate of improvement of theparallelization for the two drawings together are givenin Fig. 3 which shows higher rate of improvement inparallelization when the sliver was obtained from goodcarding.
The better parallelization of fibres under badcarding condition at card stage can be explained asfollows.
For bad carding condition, cylinder speed wasreduced from 300 to 185 rpm, while dofTerspeed wasincreased from 20.8 to 25.8 rpm. These twosimultaneous changes in cylinder and dofTer speedhave increased the relative speed of dofTerwith respectto cylinder at the cylinder-dofTer transfer point whichmight have resulted in improved parallelization offibres during its transfer to dofTer.
Another effect of increased relative speed of dofTerwas reduction in majority hooks and increase inminority hooks at card stage with bad carding'?(Fig. 2). It is seen from Fig. 2 that majority hooks aremore under good carding than under bad carding con-dition, at card stage and this trend continues up to Idrawing and II drawing in most ofthe cases. Similarly,minority hooks are more under bad carding than withgood carding condition, at card stage; this trendcontinues up to I drawing and II drawing. So thepeculiar pattern of hooks observed at card stage due tocarding condition continues up to II drawing stage.This indicates that the rate of unhooking the hookedfibre during drafting, at drawing, remains sameirrespective of the carding conditions under whichhooks are formed.
Cylinder and flat load, and transfer efficiency-Thevalues of cylinder load, flat load and transfer efficiencyof card given in Table 5 show that for any given cotton,bad carding condition reduces transfer efficiency andconsequently increases the cylinder load. However, theincrease in flat load due to bad carding conditions ismuch less than the corresponding increase in cylinderload.
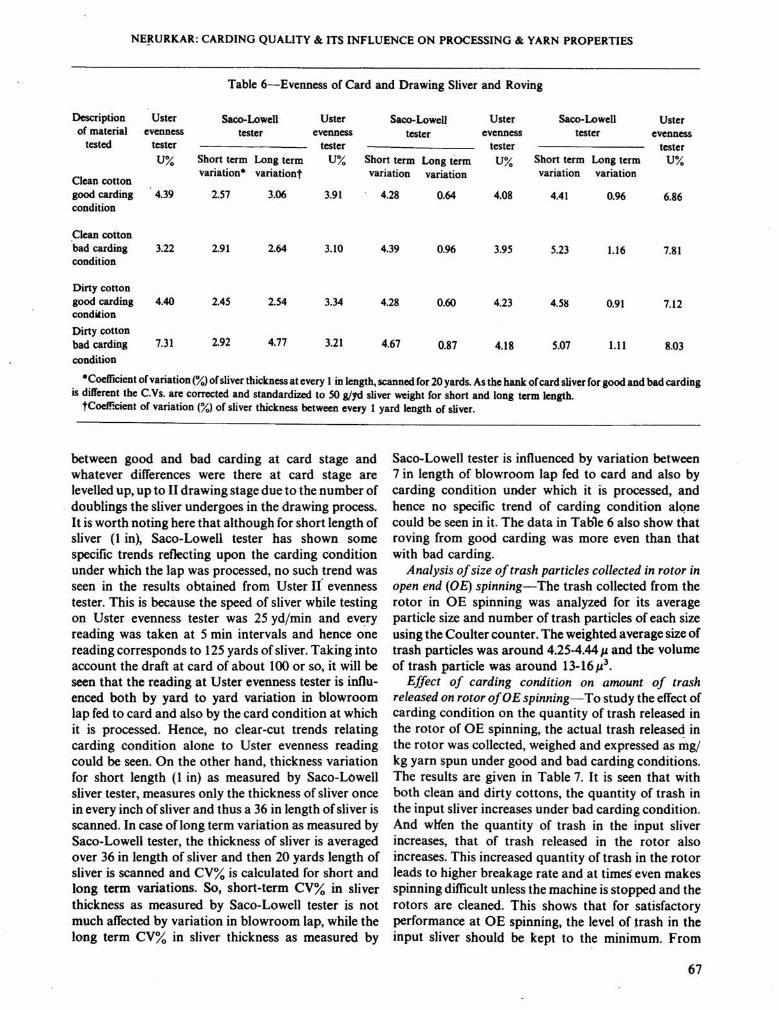
Sliver evenness at card, drawing and roving-Thevalues of evenness of card sliver, I and II drawing sliverand roving are given in Table 6. It is evident that atcard stage, short term variation in sliver thickness asmeasured by Saco-Lowell tester is higher under badcarding condition than under good carding condition.This short term variation in sliver thickness increasesfrom card to II drawing continuously and hence at IIdrawing also, bad carding has shown more unevennessthan that obtained under good carding condition. Inother words, the variation in thickness in sliverobserved at card due to carding condition increasescontinuously up to II drawing. For a given cotton, thedifference in CV% in sliver thickness at every 1 inlength arising due to carding condition was found to bestatistically significant at card, I drawing and IIdrawing stages for both the cottons, except for cleancotton at I drawing stage.
In case ofJong term variation, as measured on Saco-Lowell thickness tester, no specific trend was found
Table 5-Cylinder Load, Flat Load and Transfer Efficiency of Card at Good and Bad Carding Conditions
Good Carding Bad Carding
Type of cotton Cylinder Flat load of Transfer Cylinder Flat load of Transferused load 15 Oats efficiency load 15 Oats efficiency
gr gr % gr gr %Clean cotton 114.6 139.2 10.2 384.7 331.8 9.2Dirty cotton 115.7 168.7 10.1 443.7 419.6 7.9
66
NE~URKAR: CARDING QUALITY & ITS INFLUENCE ON PROCESSING & YARN PROPERTIES
Table 6-Evenness of Card and Drawing Sliver and Roving
Description Uster Saco-Lowell Uster Saco-Lowell Uster Saco- Lowell Usterof material evenness tester evenness tester evenness tester evenness
tested tester tester tester testerU% Short term Long term U% Short term Long term U% Short term Long term U%
Clean cottonvariation* variationt variation variation variation variation
good carding 4.39 2.57 3.06 3.91 4.28 0.64 4.08 4.41 0.96 6.86condition
Clean cottonbad carding 3.22 2.91 2.64 3.10 4.39 0.96 3.95 5.23 1.16 7.81condition
Dirty cottongood carding 4.40 2.45 2.54 3.34 4.28 0.60 4.23 4.51S 0.91 7.12conditionDirty cottonbad carding 7.31 2.92 4.77 3.21 4.67 0.87 4.18 5.07 1.11 8.03condition
*Coefficient of variation (%)of sliver thickness at every 1 in length, scanned for 20 yards. As the hank of card sliver for good and bad cardingis different the C.Vs. are corrected and standardized to SO gjyd sliver weight for short and long term length.
tCoeff.'Cient of variation (%) of sliver thickness between every I yard length of sliver.
between good and bad carding at card stage andwhatever differences were there at card stage arelevelled up, up to II drawing stage due to the number ofdoublings the sliver undergoes in the drawing process.It is worth noting here that although for short length ofsliver (1 in), Saco-Lowell tester has shown somespecific trends reflecting upon the carding conditionunder which the lap was processed, no such trend wasseen in the results obtained from Uster It evennesstester. This is because the speed of sliver while testingon Uster evenness tester was 25 yd/min and everyreading was taken at 5 min intervals and hence onereading corresponds to 125 yards of sliver. Taking intoaccount the draft at card of about 100 or so, it will beseen that the reading at Uster evenness tester is influ-enced both by yard to yard variation in blowroomlap fed to card and also by the card condition at whichit is processed. Hence, no clear-cut trends relatingcarding condition alone to Uster evenness readingcould be seen. On the other hand, thickness variationfor short length (1 in) as measured by Saco-Lowellsliver tester, measures only the thickness of sliver oncein every inch of sliver and thus a 36 in length of sliver isscanned. In case of long term variation as measured bySaco-Lowell tester, the thickness of sliver is averagedover 36 in length of sliver and then 20 yards length ofsliver is scanned and CV% is calculated for short andlong term variations. So, short-term CV% in sliverthickness as measured by Saco-Lowell tester is notmuch affected by variation in blowroom lap, while thelong term CV% in sliver thickness as measured by
Saco-Lowell tester is influenced by variation between7 in length of blowroom lap fed to card and also bycarding condition under which it is processed, andhence no specific trend of carding condition alonecould be seen in it. The data in Table 6 also show thatroving from good carding was more even than thatwith bad carding.
Analysis of size of trash particles collected in rotor inopen end (0 E) spinning- The trash collected from therotor in OE spinning was analyzed for its averageparticle size and number of trash particles of each sizeusing the Coulter counter. The weighted average size oftrash particles was around 4~25-4.44Jl and the volumeof trash particle was around 13-16 Jl3.
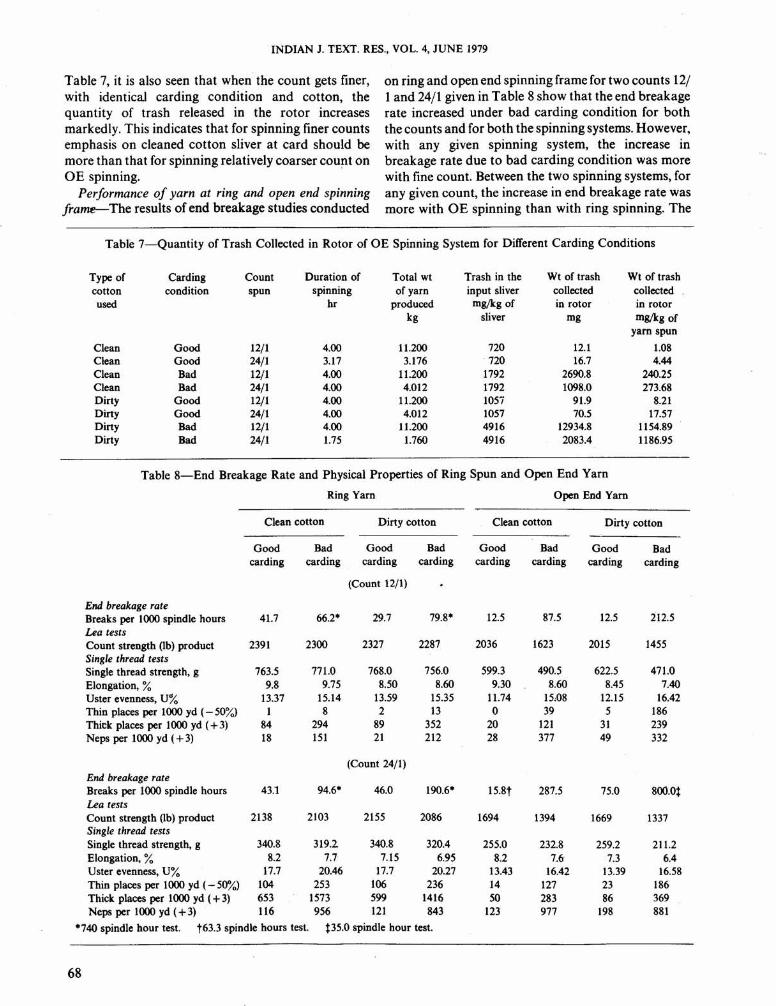
Effect of carding condition on amount of trashreleased on rotor ofOE spinning-To study the effect ofcarding condition on the quantity of trash released inthe rotor of OE spinning, the actual trash released inthe rotor was collected, weighed and expressed as mg/kg yarn spun under good and bad carding conditions.The results are given in Table 7. It is seen that withboth clean and dirty cottons, the quantity of trash inthe input sliver increases under bad carding condition.And when the quantity of trash in the input sliverincreases, that of trash released in the rotor alsoincreases. This increased quantity of trash in the rotorleads to higher breakage rate and at times even makesspinning difficult unless the machine is stopped and therotors are cleaned. This shows that for satisfactoryperformance at OE spinning, the level of trash in theinput sliver should be kept to the minimum. From
67
INDIAN J. TEXT. RES., VOL. 4, JUNE 1979
Table 7, it is also seen that when the count gets finer,with identical carding condition and cotton, thequantity of trash released in the rotor increasesmarkedly. This indicates that for spinning finer countsemphasis on cleaned cotton sliver at card should bemore than that for spinning relatively coarser count onOE spinning.
Performance of yarn at ring and open end spinningframe-- The results of end breakage studies conducted
on ring and open end spinning frame for two counts 12/1and 24/1 given in Table 8 show that the end breakagerate increased under bad carding condition for boththe counts and for both the spinning systems. However,with any given spinning system, the increase inbreakage rate due to bad carding condition was morewith fine count. Between the two spinning systems, forany given count, the increase in end breakage rate wasmore with OE spinning than with ring spinning. The
Table 7-Quantity of Trash Collected in Rotor of OE Spinning System for Different Carding Conditions
Type of Carding Count Duration of Total wt Trash in the Wt of trash Wt of trashcotton condition spun spinning of yarn input sliver collected collectedused hr produced mgJkg of in rotor in rotor
kg sliver mg mg/kg ofyarn spun
Clean Good 12/1 4.00 11.200 720 12.1 1.08Clean Good 24/1 3.17 3.176 720 16.7 4.44Clean Bad 12/1 4.00 11.200 1792 2690.8 240.25Clean Bad 24/1 4.00 4.012 1792 1098.0 273.68Dirty Good 12/1 4.00 11.200 1057 91.9 8.21Dirty Good 24/1 4.00 4.012 1057 70.5 17.57Dirty Bad 12/1 4.00 11.200 4916 12934.8 1154.89Dirty Bad 24/1 1.75 1.760 4916 2083.4 1186.95
Table 8-End Breakage Rate and Physical Properties of Ring Spun and Open End Yarn
Ring Yarn Open End Yarn
Clean cotton Dirty cotton Clean cotton Dirty cotton
Good Bad Good Bad Good Bad Good Badcarding carding carding carding carding carding carding carding
(Count 12/1)
End breakage rateBreaks per 1000 spindle hours 41.7 66.2· 29.7 79.8* 12.5 87.5 12.5 212.5Lea testsCount strength (lb) product 2391 2300 2327 2287 2036 1623 2015 1455Single thread testsSingle thread strength, g 763.5 771.0 768.0 756.0 599.3 490.5 622.5 471.0Elongation, % 9.8 9.75 8.50 8.60 9.30 8.60 8.45 7.40Uster evenness, U% 13.37 15.14 13.59 15.35 11.74 15,08 12.15 16.42Thin places per 1000 yd ( - 50%) 1 8 2 13 0 39 5 186Thick places per 1000 yd (+ 3) 84 294 89 352 20 121 31 239Neps per 1000 yd (+ 3) 18 151 21 212 28 377 49 332
(Count 24/1)End breakage rateBreaks per 1000 spindle hours 43.1 94.6· 46.0 190.6* 15.8t 287.5 75.0 8oo.0tLea testsCount strength (lb) product 2138 2103 2155 2086 1694 1394 1669 1337Single thread testsSingle thread strength, g 340.8 319.2 340.8 320.4 255.0 232.8 259.2 211.2Elongation, % 8.2 7.7 7.15 6.95 8.2 7.6 7.3 6.4Uster evenness, U% 17.7 20.46 17.7 20.27 13.43 16.42 13.39 16.58Thin places per 1000 yd ( - 50"1.) 104 253 106 236 14 127 23 186Thick places per 1000 yd (+ 3) 653 1573 599 1416 50 283 86 369Neps per 1000 yd (+3) 116 956 121 843 123 977 198 881
*740 spindle hour test. t63.3 spindle hours test. tJ5.0 spindle hour test.
68

NERURKAR: CARDING QUALITY & ITS INFLUENCE ON PROCESSING s. YARN PROPERTIES
high end breakage rate in OE spinning with badcarding may be due to the high level of trash in theinput sliver and so in the rotor (Table 7), and also dueto insufficient separation of fibres due to bad carding.
Physical properties of yarn- The physical propertiesof yarns spun on ring and open end spinning frames aregiven in Table 8. It is evident that the count-strengthproduct (obtained from lea strength) decreases slightlyunder bad carding condition, in-ring spun yarn, butdrops markedly in open end yarn, for both the countsspun. The bad carding condition has not led to highcount variation (data not given in Table 8) at yarnstage with both spinning. systems, although the shortterm variation in sliver thickness (Saco-Lowell) wasaffected by carding conditions, as seen earlier, at cardand drawing stage. As regards single thread strength,there is no consistent drop in strength with badcarding. The same can be said about yarn elongation.The yarn evenness as measured by Uster II evennesstester (U%) was markedly poor under bad cardingcondition with both the spinning systems. Butdeterioration in evenness (U%) due to bad carding wasmore in OE yarn than in ring spun yarn for 'any givencotton. The same trend was seen only in the number ofthin places per 1000 yards with 12s/1 count. Thenumber of neps increased under bad carding conditionin both the spinning systems.
DiscussionThis study has brought out that the carding
condition affects not only the routine and knowncharacteristics of web/sliver such as neps, trash, hookpattern at card, but also weight variation in card web,% improvement in fibre parallelization obtained insubsequent drafting after carding, variation in sliverthickness between 1 in length of sliver and also fibre tofibre separation and fibre parallelization. The highervariation in the weight of card web per unit areaobserved with bad carding was measured directly andwas also supported by high short-term variation in thethickness-at card, I and II drawing sliver as measured atevery inch, on Saco-Lowell thickness tester. the higherrate of improvement in fibre parallelization with goodcarding was confirmed by the improvement in thepercentage increase in the projected mean length atdifferent stages of drawing and also at roving.Although the better fibre to fibre separation with goodcarding could not be measured directly, the same canbe inferred from the better evenness obtained at roving.It is also interesting to note that at card stage, fibre-parallelization was poor with goo_d carding andalthough it improved rapidly in subsequent drawing,probably due to the better fibre separation obtainedwith good carding, it was not better than that at badcarding even up to the II drawing and roving stage. But
still the performance at spinning with both thespinning systems and also the yarn quality in terms ofstrength, evenness, thin places and thick places wasbetter with good carding. This indicates that fibre tofibre separation (which is better with good carding)contributes more towards the yarn quality and ringframe performance than fibre parallelization (whichwas better with bad carding). This suggests that whileassessing carding quality along with the routine cardsliver characteristics other card web/sliver parameterslike variation in weight of card web per unit area,variation in sliver thickness (1 in length), fibreparallelization can be incorporated for getting a betterunderstanding of carding quality over and above thepresent determinants of card web.
Conclusions(1) Bad carding condition gives lower card waste,
poor cleaning efficiency at card, higher neps in cardsliver, higher weight variation in web (weight of cardweb per unit area) and higher short term CV% in sliverthickness measured at every 1 in length (as measuredby Saco-Lowell thickness tester),
(2) The increased doffer speed under bad cardingcondition causes reduction in the majority hooks andincrease in the minority hooks. This peculiar pattern ofhooks observed at card stage continued up to IIdra wing in most of the cases as the rate of unhooking ofhooked fibres during drafting was not affected bycarding condition at which hooks are formed.
(3) Bad carding condition gives longer projectedmean length (PML) for card sliver, which indicatesbetter fibre parallelization under bad cardingcondition. This is explained as being due to the higherrelative speed of doffer with respect to cylinder, atcylinder-doffer transfer point. However, the rate ofimprovement in fibre parallelization in subsequentdrawings was higher with good carding and hence thedifferences in PML at card stage due to cardingcondition were reduced when the sliver was processedthrough drawing and roving. This high rate ofimprovement in fibre parallelization in drawing androving can be possibly due to the better fibre to fibreseparation obtained under good carding condition andalso due to the initial lower degree of parallelizationobtained under good carding condition.
(4) Under good carding condition, cylinder and flatload were lower, while the transfer efficiency was higherthan that under bad carding condition.
(5)The thickness variation of sliver (Saco-Lowell) ofshort term nature (1 in) was found to be higher underbad carding condition; this trend continued up to IIdrawing stage. The variation of long-term nature(between 1 yard specimens) did not show any clearcuttrends relating to carding conditions. -
69
INDIAN J. TEXT. RES., VOL. 4, JUNE 1979
(6) Evenness of roving as measured by Usterevenness tester was found to be better for the rovingobtained from good carding.
(7) The average size of trash particles collected inrotor of0E spinning did not show much change in sizewith carding conditions. However, as the type of trashvaries widely with the area and picking methods, etc.further work will be required to confirm this finding.
(8) Bad carding condition released more quantity oftrash in rotor of OE spinning and this affected the endbreakage rate markedly in OE spinning. With a givenback material, the quantity of trash released in therotor increased with the fineness of count.
(9) The end breakage rate was higher under badcarding condition on the two spinning systems tried,but the difference in end breakage rate due to cardingcondition was more with OE spinning system than thatwith ring spinning. This indicates that the OE spinningsystem was more sensitive to carding condition.
(10)The count variation did not show any trend withcarding condition; however, the yarn evenness (U%)was poor with bad carding on both the spinningsystems. The influence of carding condition on yarnevenness was more pronounced in OE spinning systemthan in ring spinning system. The same trend of resultswas also observed only in thin places with 12s/1 count.
(11) The level of neps in yarn increased under badcarding conditions in both the spinning systems.
(12) Detailed analysis of card web and sliver madehere showed that apart from routine measurementssuch as trash in sliver, neps in card web, cylinderloading, transfer efficiency, other card web/sliverparameters like variation in weight of card web per unit
70
area, vanation in sliver thickness and fibreparallelization can be taken into account whiledetailing the quality of carding.
AcknowledgementThe author is thankful to the staff of the Cotton
Textile Processing Division of SRRC of USDA, NewOrleans, USA, for helpful consultations and excellentcooperation extended in the course of work in theirlaboratory and to Dr N Balasubramanian for usefuldiscussion in interpreting some of the data and to ShriT V Ananthan, Director, BTRA, for permission topublish this work.
References1 Ashnin N M, Technol Text lnd, USSR, No.4 (1972) 37-41.2 Sundra A & Swiech T, Tech Wlok, 21(5) (1972) 136-42.3 Ul'man Z V, Te/<stProm, 22(5) (1962) 39-41.4 Barella A et al., Text Res J, 32 (1962) 428-30.5 Barella A et al., Text Res J, 33 (1963) 411-16.6 Jackowski T & Pyziak T, Przegl wlok, 26(4/5) (1972) 237-40.7 Morton W E & Summer R J, J Text Inst, 40 (1949) 106-16.8 Simpson J & Fiori L A, Premier Symposium International de la
Recherche Textile Cotonnie're, Paris (Institut Textile DeFrance, Aboidances, 92 Boulogne SISeine, Paris) 1969,229-48.
9 Kaufmann D, Text Prax, 12(11) (1957) 1077-82.10 Krylov V V, Technol Text lnd, USSR, No.2 (1962) 46-53.11 ASTM Designation: D 2255-64, D 1440-65, D 1446-66T, D 1425-
67, D 1445-67,D 144,7-67,D1578-67,D 1769-67,D 1448-68,D2256-69, D 1442-70 and D 2812-70 (American Society forTesting and Materials, Committee D-13, Philadelphia,Pennsylvania, 1970, 24 and 25.
12 Rusca B A, Text Res J, 20 (1950) 780-86.13 Simpson J & Patureau M A, Text Res J, 40 (1970) 956-57.14 Simpson J, Deluca L B & Fiori L A, Text ResJ, 37 (1967) 504-9.