
DESY Infusion R&D
19
DESY Infusion R&D Results and status at DESY Bate Christopher on behalf of the SRF Team Sendai, 31.10.2019
Transcript of DESY Infusion R&D
DESY Infusion R&D
Results and status at DESY
Bate Christopher on behalf of the SRF Team
Sendai, 31.10.2019
Page 2
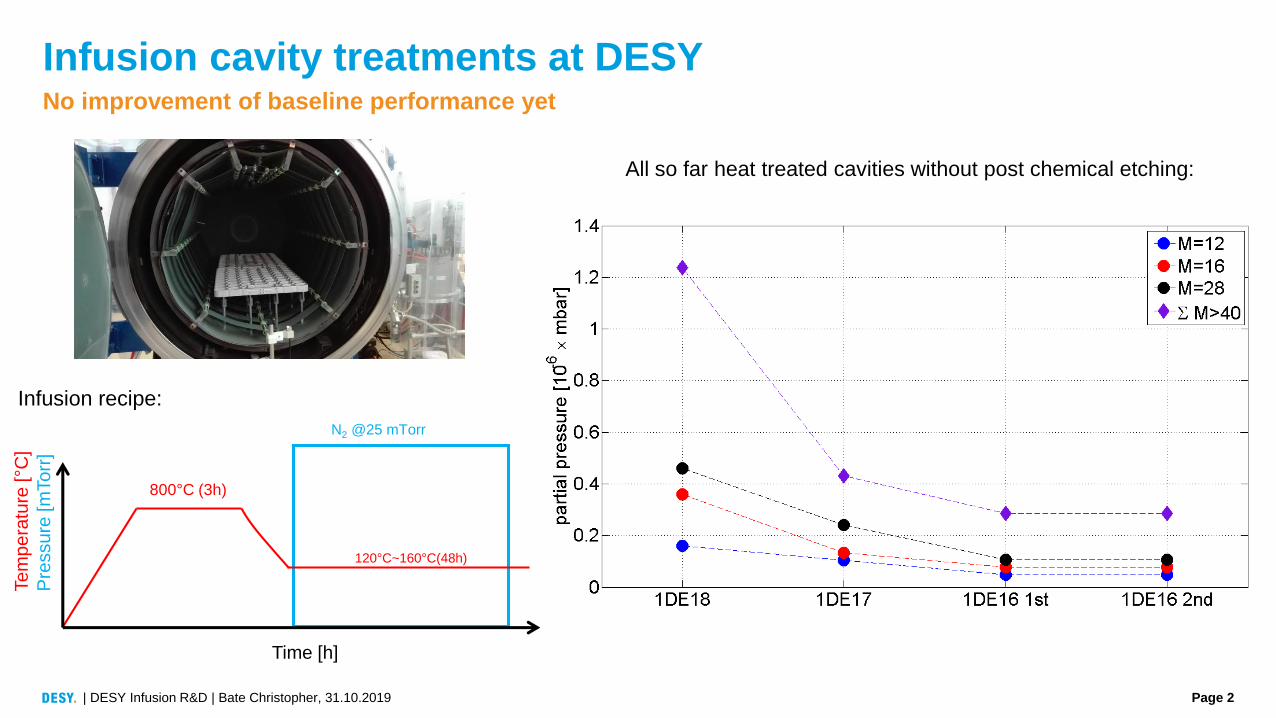
Infusion cavity treatments at DESYNo improvement of baseline performance yet
1E+08
1E+09
1E+10
1E+11
0 10 20 30 40Q
0~
1/R
s
Eacc [MV/m]
Baseline After treatment
| DESY Infusion R&D | Bate Christopher, 31.10.2019
All so far heat treated cavities without post chemical etching:
Time [h]
Te
mp
era
ture
[°C
]
Pre
ssu
re[m
To
rr]
800°C (3h)
120°C~160°C(48h)
N2 @25 mTorr
Infusion recipe:
Page 3
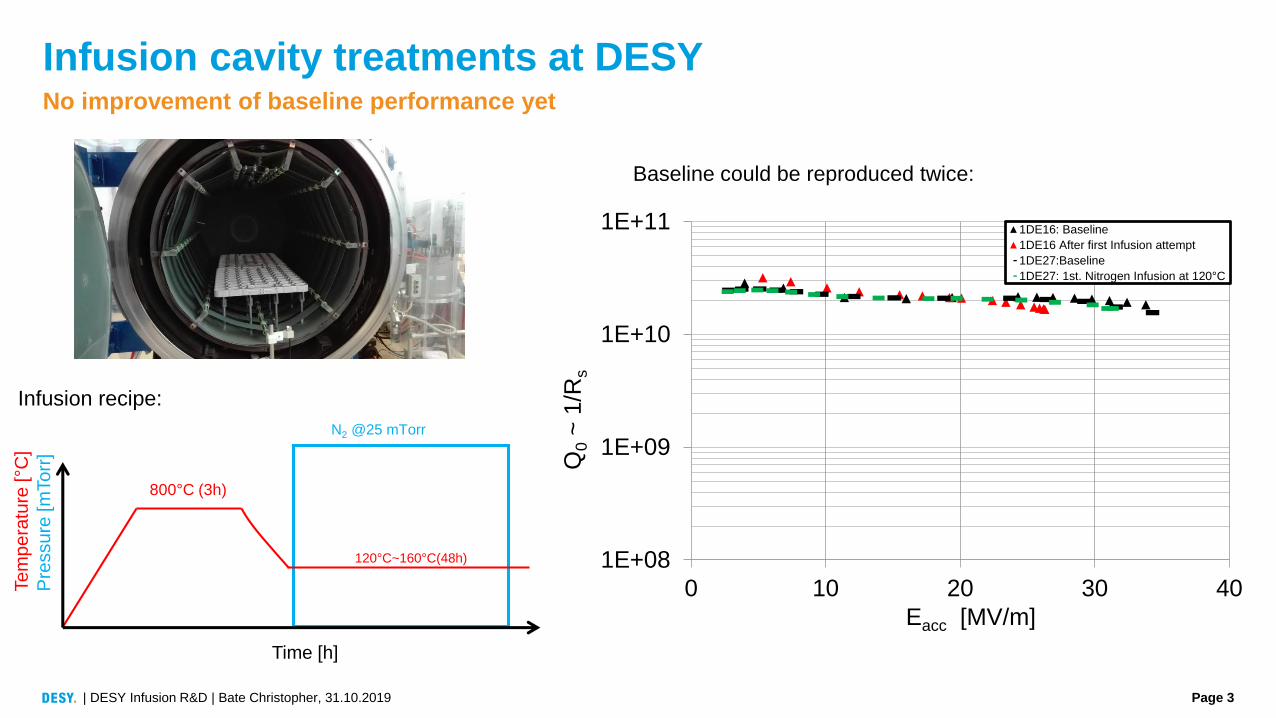
Infusion cavity treatments at DESYNo improvement of baseline performance yet
1E+08
1E+09
1E+10
1E+11
0 10 20 30 40Q
0~
1/R
s
Eacc [MV/m]
1DE16: Baseline
1DE16 After first Infusion attempt
1DE27:Baseline
1DE27: 1st. Nitrogen Infusion at 120°C
| DESY Infusion R&D | Bate Christopher, 31.10.2019
Infusion recipe:
Baseline could be reproduced twice:
Time [h]
Te
mp
era
ture
[°C
]
Pre
ssu
re[m
To
rr]
800°C (3h)
120°C~160°C(48h)
N2 @25 mTorr
Page 4
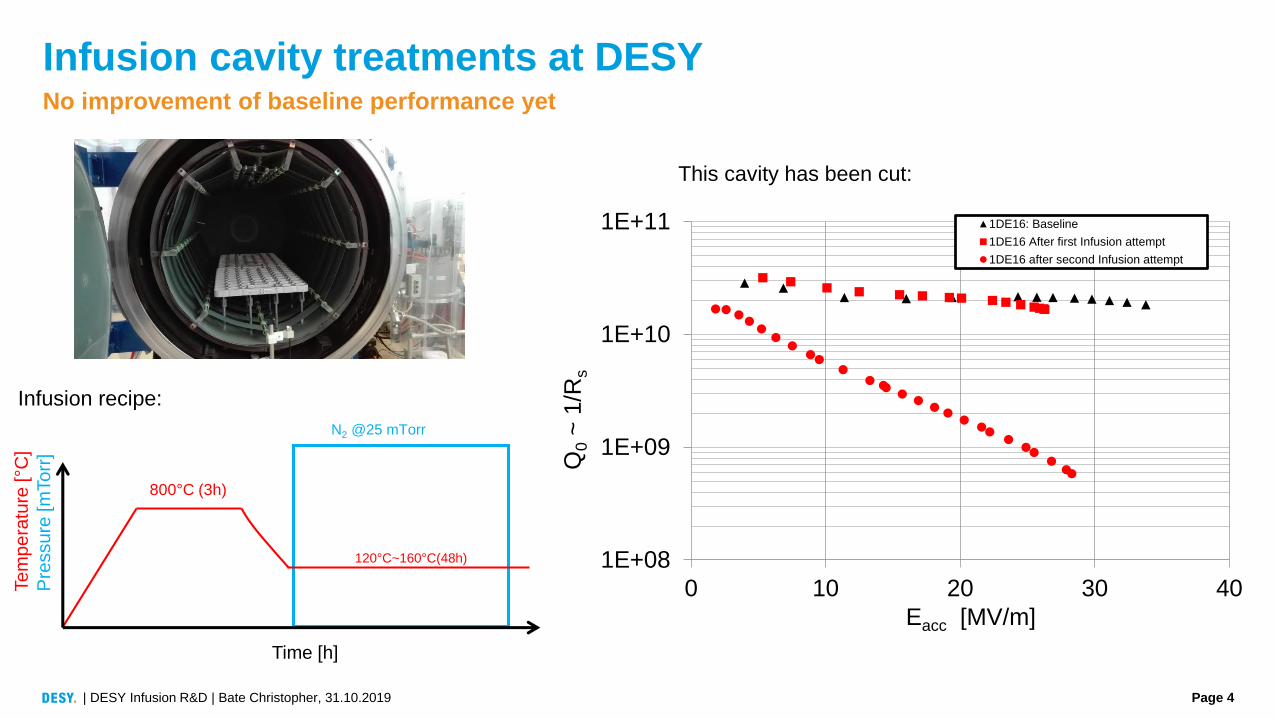
Infusion cavity treatments at DESYNo improvement of baseline performance yet
1E+08
1E+09
1E+10
1E+11
0 10 20 30 40Q
0~
1/R
s
Eacc [MV/m]
1DE16: Baseline
1DE16 After first Infusion attempt
1DE16 after second Infusion attempt
This cavity has been cut:
| DESY Infusion R&D | Bate Christopher, 31.10.2019
Infusion recipe:
Time [h]
Te
mp
era
ture
[°C
]
Pre
ssu
re[m
To
rr]
800°C (3h)
120°C~160°C(48h)
N2 @25 mTorr
Page 5
Cavity cutout
| DESY Infusion R&D | Bate Christopher, 31.10.2019
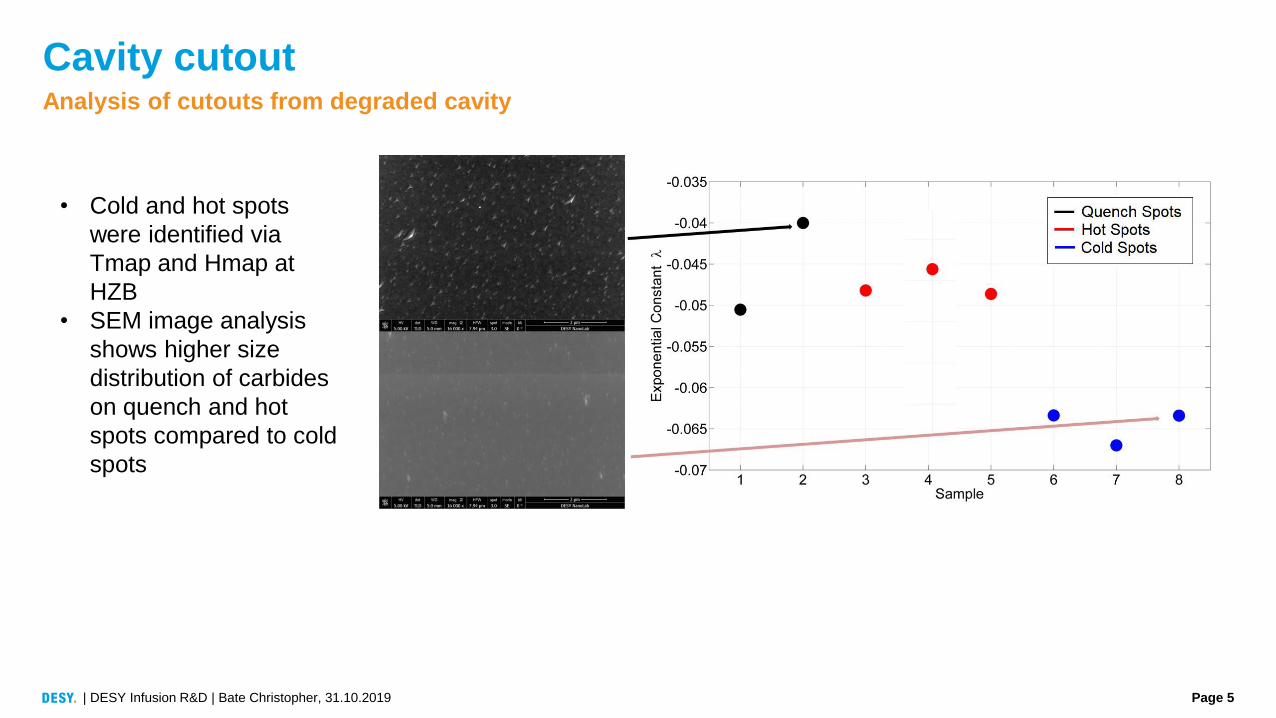
Analysis of cutouts from degraded cavity
• Cold and hot spots
were identified via
Tmap and Hmap at
HZB
• SEM image analysis
shows higher size
distribution of carbides
on quench and hot
spots compared to cold
spots
Page 6
Cavity cutout
| DESY Infusion R&D | Bate Christopher, 31.10.2019
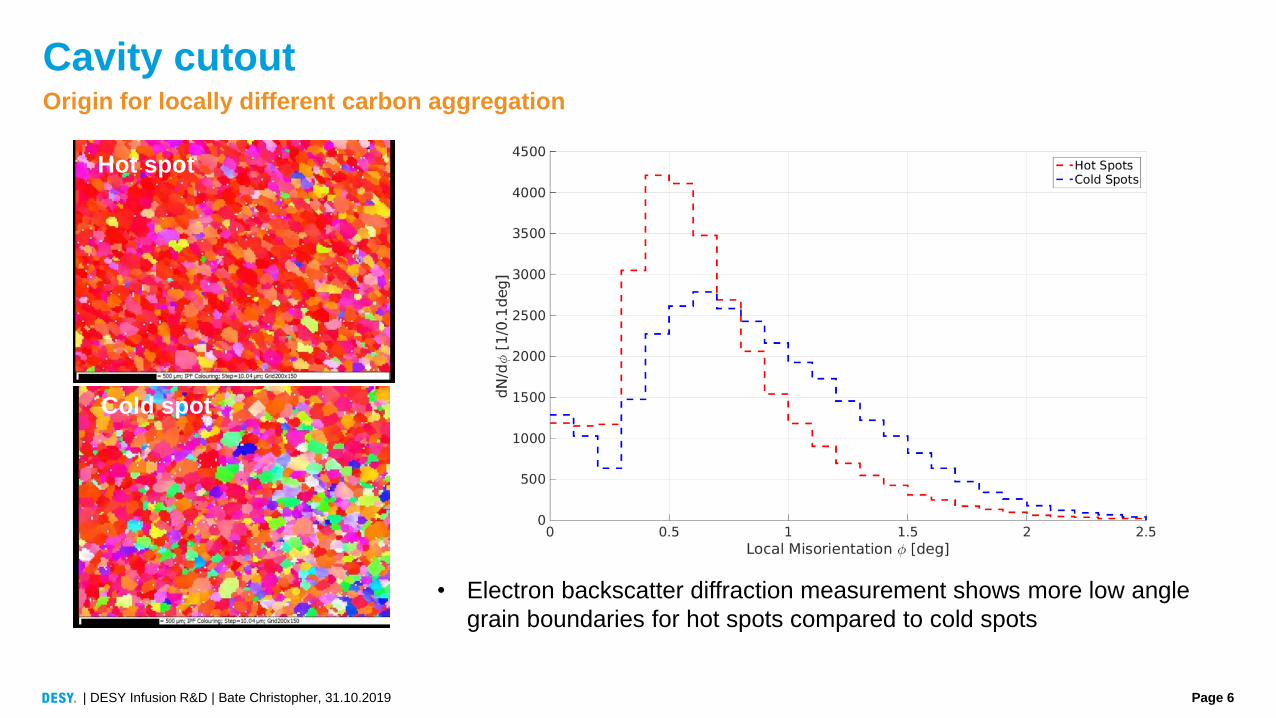
Origin for locally different carbon aggregation
• Electron backscatter diffraction measurement shows more low angle
grain boundaries for hot spots compared to cold spots
Hot spot
Cold spot
Page 7
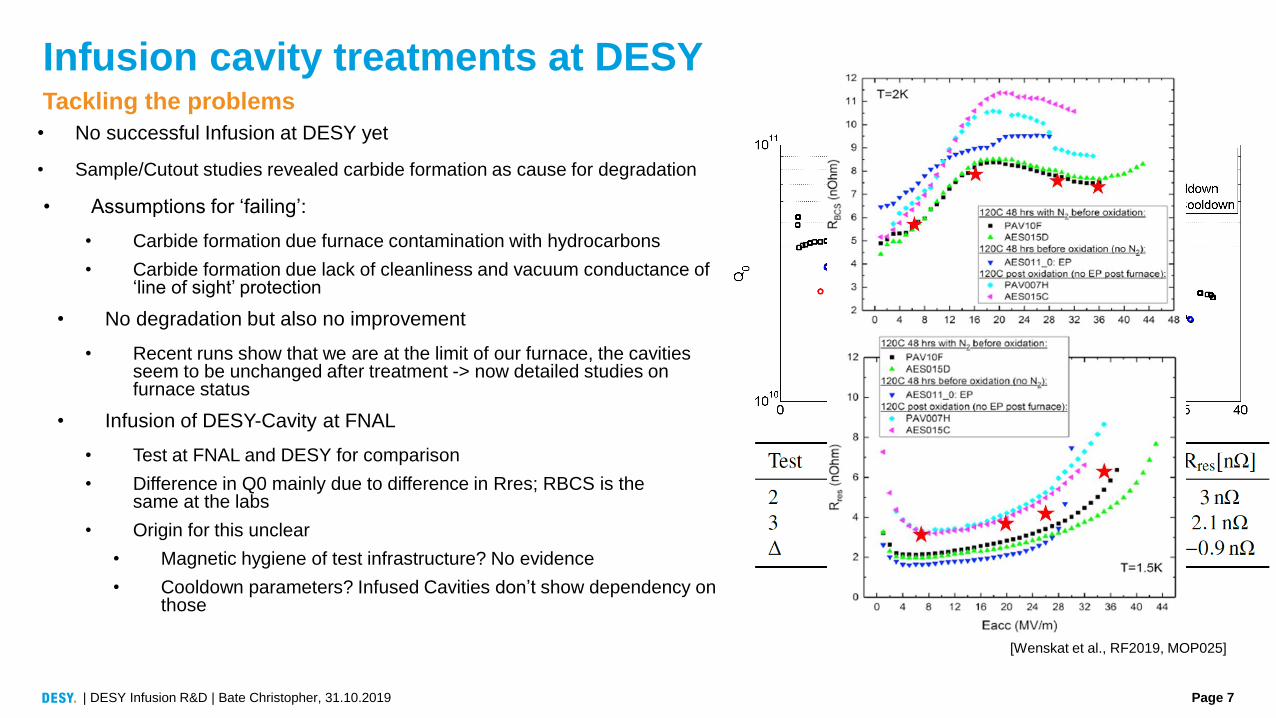
[Wenskat et al., RF2019, MOP025]
Infusion cavity treatments at DESY
| DESY Infusion R&D | Bate Christopher, 31.10.2019
Tackling the problems
• No successful Infusion at DESY yet
• Sample/Cutout studies revealed carbide formation as cause for degradation
• Assumptions for ‘failing’:
• Carbide formation due furnace contamination with hydrocarbons
• Carbide formation due lack of cleanliness and vacuum conductance of ‘line of sight’ protection
• No degradation but also no improvement
• Recent runs show that we are at the limit of our furnace, the cavities seem to be unchanged after treatment -> now detailed studies on furnace status
• Infusion of DESY-Cavity at FNAL
• Test at FNAL and DESY for comparison
• Difference in Q0 mainly due to difference in Rres; RBCS is the same at the labs
• Origin for this unclear
• Magnetic hygiene of test infrastructure? No evidence
• Cooldown parameters? Infused Cavities don’t show dependency on those
Page 8
Carbide precipitation during heat treatment
| DESY Infusion R&D | Bate Christopher, 31.10.2019
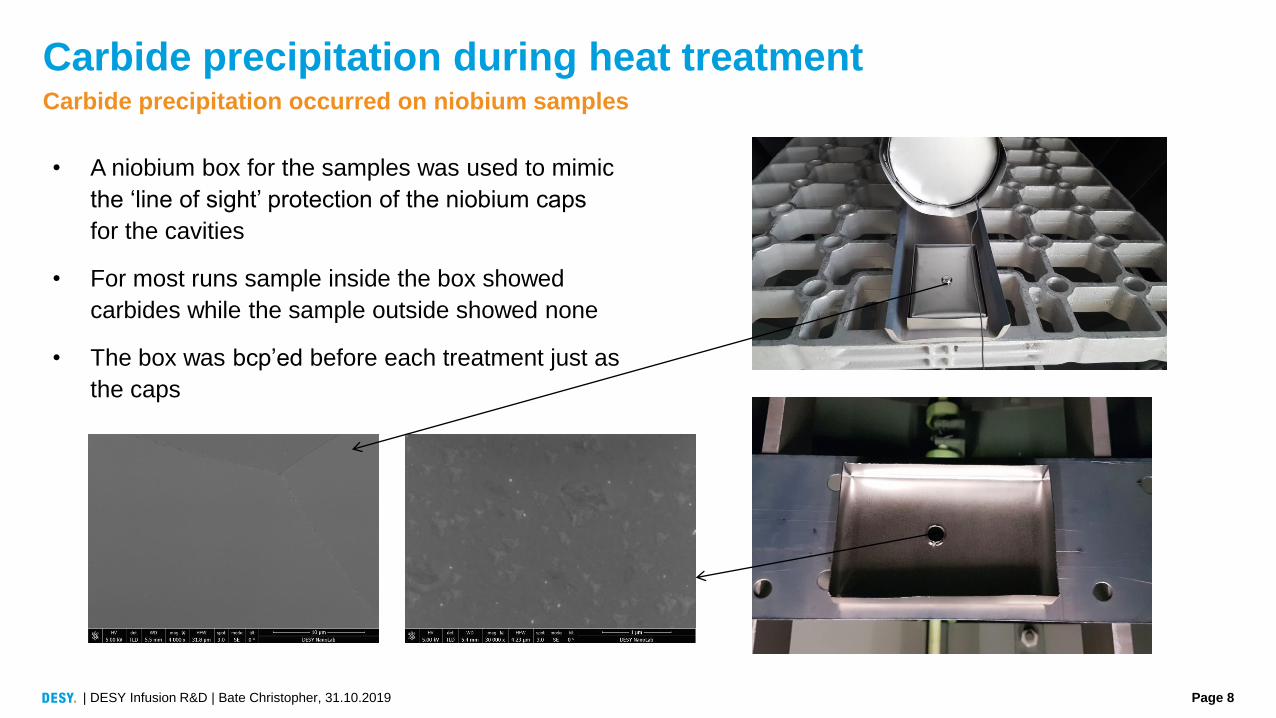
Carbide precipitation occurred on niobium samples
• A niobium box for the samples was used to mimic
the ‘line of sight’ protection of the niobium caps
for the cavities
• For most runs sample inside the box showed
carbides while the sample outside showed none
• The box was bcp’ed before each treatment just as
the caps
Page 9
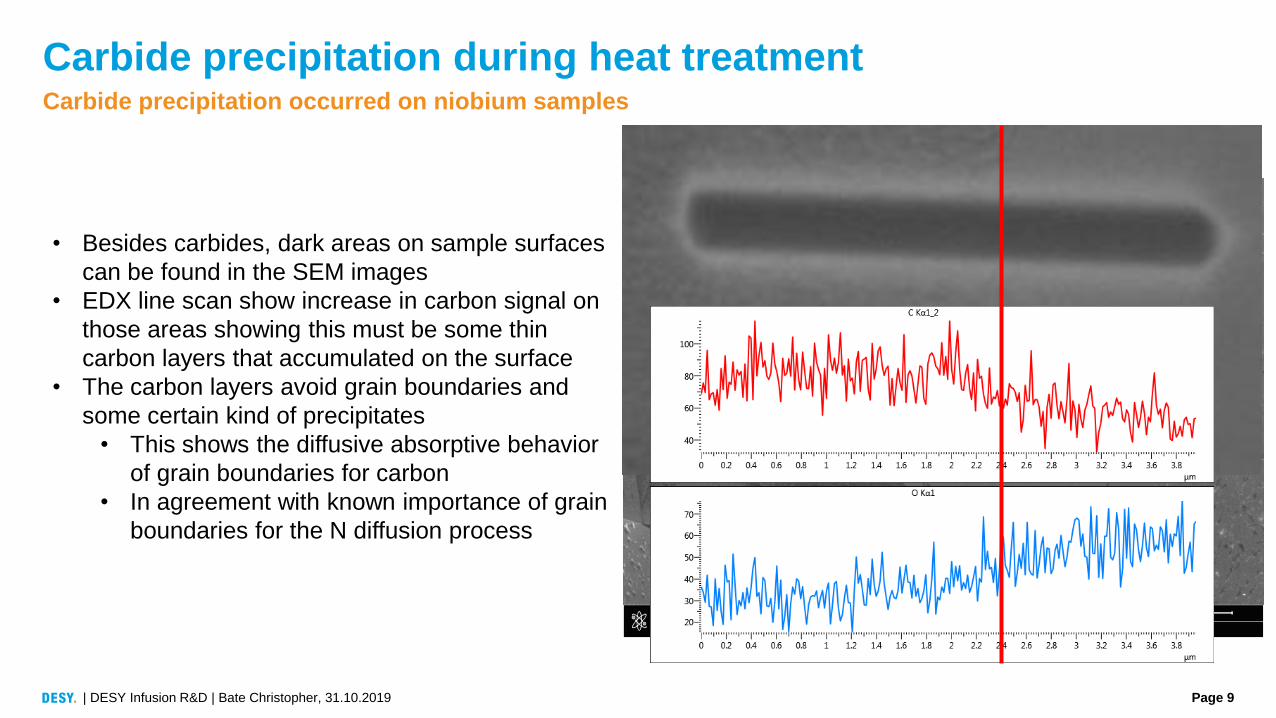
• Besides carbides, dark areas on sample surfaces
can be found in the SEM images
• EDX line scan show increase in carbon signal on
those areas showing this must be some thin
carbon layers that accumulated on the surface
• The carbon layers avoid grain boundaries and
some certain kind of precipitates
• This shows the diffusive absorptive behavior
of grain boundaries for carbon
• In agreement with known importance of grain
boundaries for the N diffusion process
Carbide precipitation during heat treatment
| DESY Infusion R&D | Bate Christopher, 31.10.2019
Carbide precipitation occurred on niobium samples
Page 10
C-doping
| DESY Infusion R&D | Bate Christopher, 31.10.2019
Where does the carbon come from?
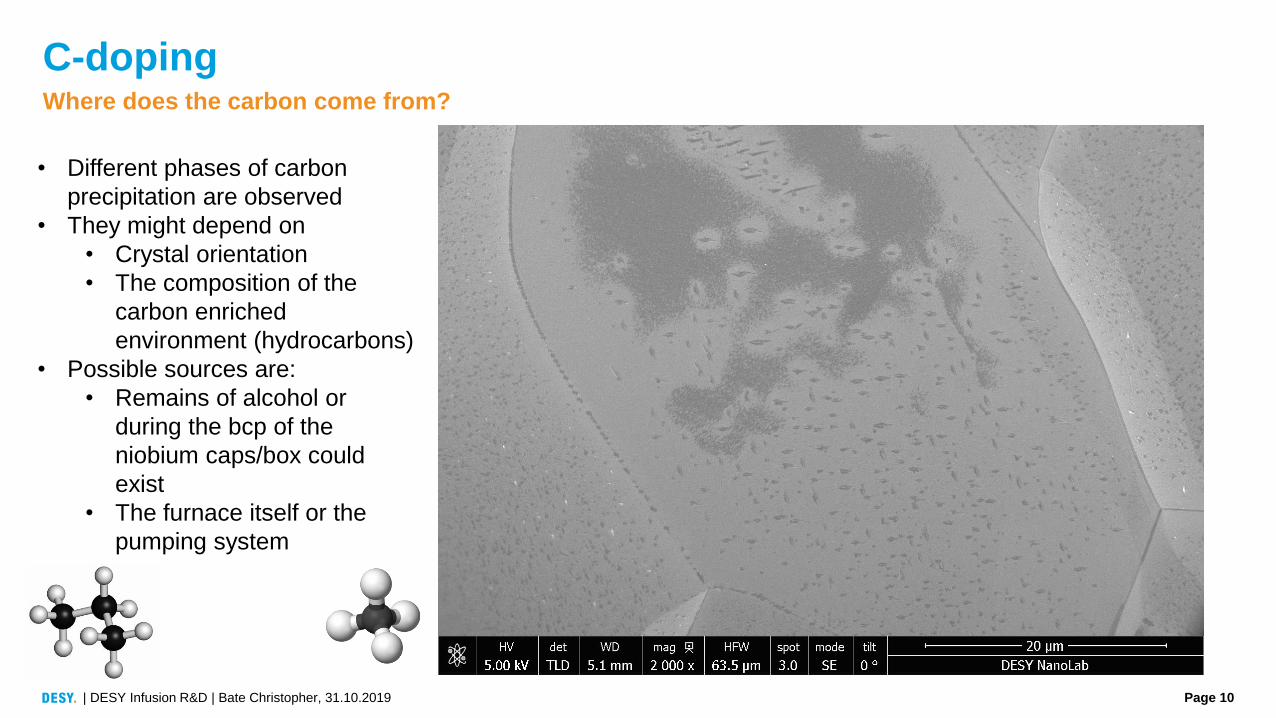
• Different phases of carbon
precipitation are observed
• They might depend on
• Crystal orientation
• The composition of the
carbon enriched
environment (hydrocarbons)
• Possible sources are:
• Remains of alcohol or
during the bcp of the
niobium caps/box could
exist
• The furnace itself or the
pumping system
Page 11
Vacuum conductance of line of sight protection
| DESY Infusion R&D | Bate Christopher, 31.10.2019
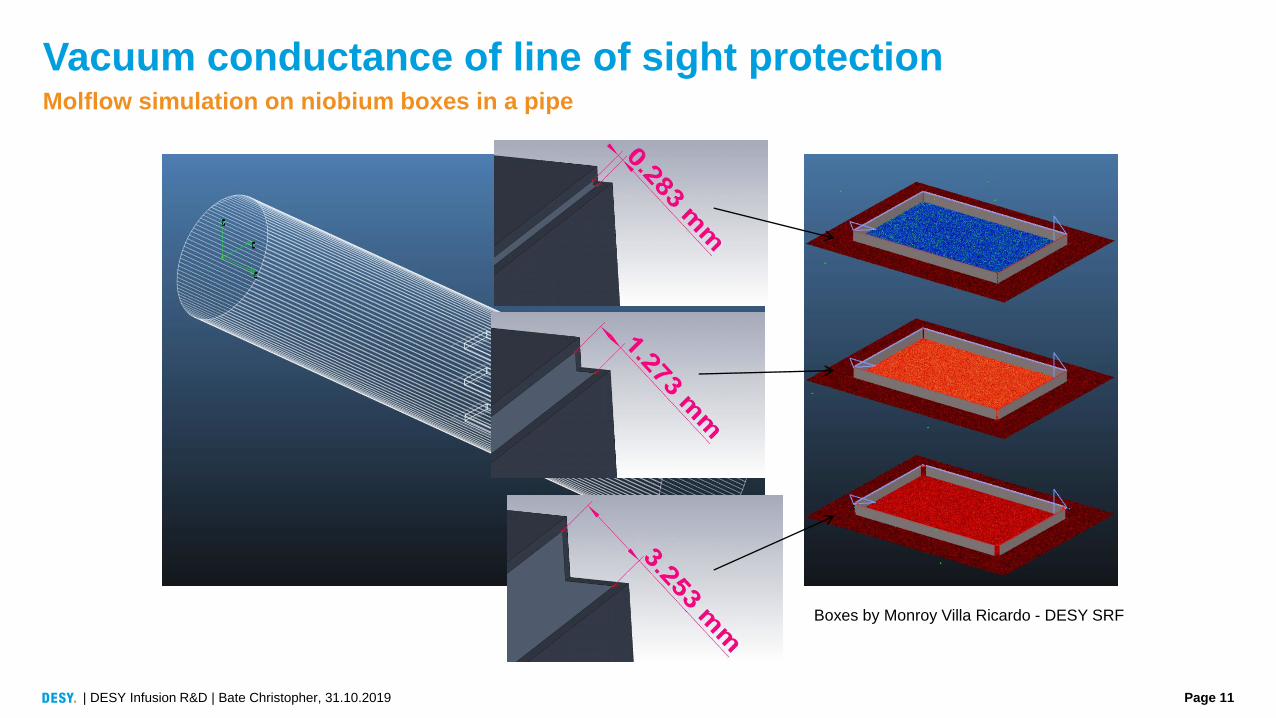
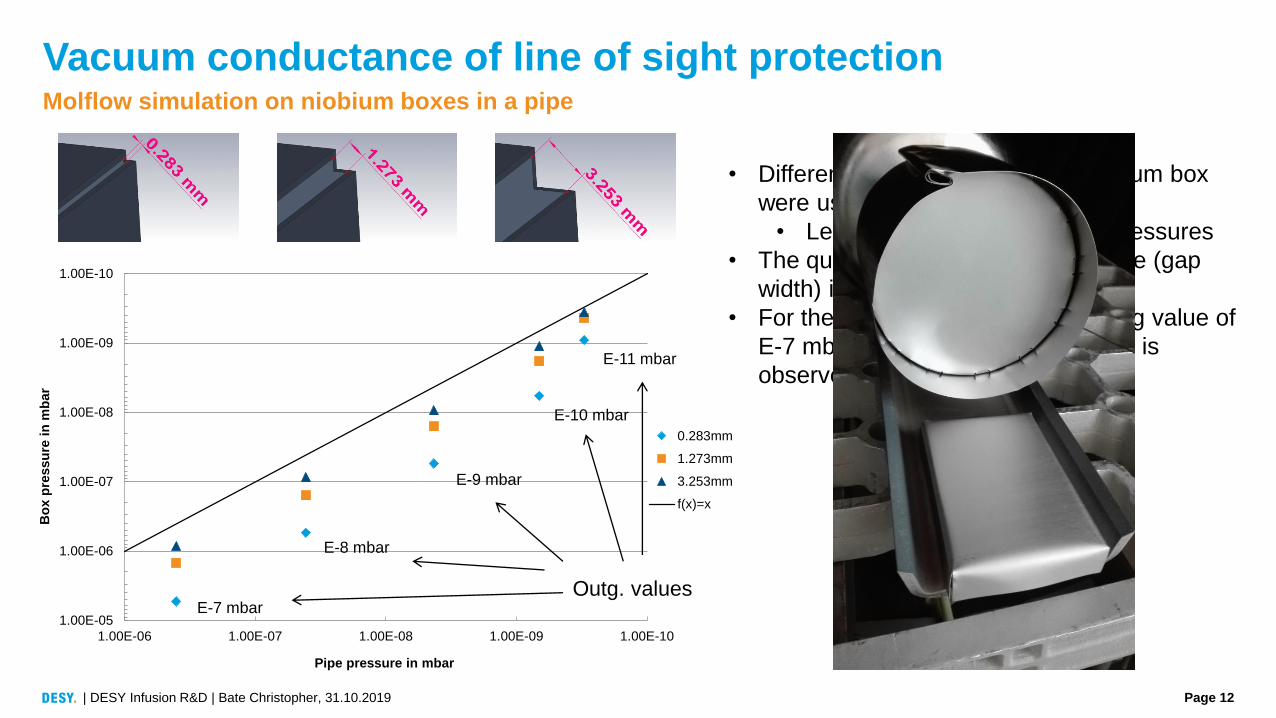
Molflow simulation on niobium boxes in a pipe
Boxes by Monroy Villa Ricardo - DESY SRF
Page 12
• Different outgassing values of niobium box
were used
• Leading to the different pipe pressures
• The quadratic behavior on the orifice (gap
width) is observed
• For the small gap and an outgassing value of
E-7 mbar a pressure of ~5E-6 mbar is
observed!
Vacuum conductance of line of sight protection
| DESY Infusion R&D | Bate Christopher, 31.10.2019
Molflow simulation on niobium boxes in a pipe
1.00E-10
1.00E-09
1.00E-08
1.00E-07
1.00E-06
1.00E-05
1.00E-101.00E-091.00E-081.00E-071.00E-06
Bo
x p
ressu
re i
n m
bar
Pipe pressure in mbar
0.283mm
1.273mm
3.253mm
f(x)=x
E-7 mbar
E-8 mbar
E-9 mbar
E-10 mbar
E-11 mbar
Outg. values
Page 13
New runs with different line of sight protection
| DESY Infusion R&D | Bate Christopher, 31.10.2019
Furnace assessment
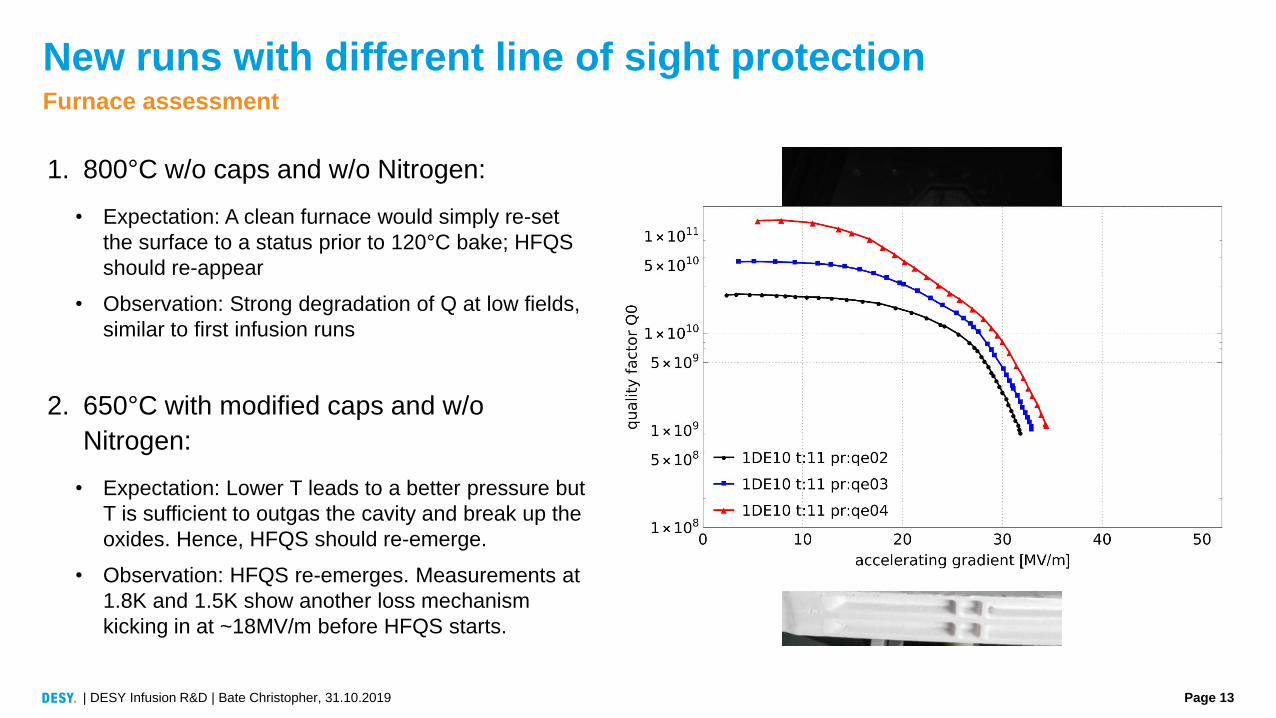
1. 800°C w/o caps and w/o Nitrogen:
• Expectation: A clean furnace would simply re-set
the surface to a status prior to 120°C bake; HFQS
should re-appear
• Observation: Strong degradation of Q at low fields,
similar to first infusion runs
2. 650°C with modified caps and w/o
Nitrogen:
• Expectation: Lower T leads to a better pressure but
T is sufficient to outgas the cavity and break up the
oxides. Hence, HFQS should re-emerge.
• Observation: HFQS re-emerges. Measurements at
1.8K and 1.5K show another loss mechanism
kicking in at ~18MV/m before HFQS starts.
Page 14
Summary
| DESY Infusion R&D | Bate Christopher, 31.10.2019
• Evidence for correlation between carbides and
cavity performance degradation
• Carbide formation is in connection with
• Cleanliness and vacuum conductance of line of sight
protection
• Furnace conditions
• Our cavity furnace will undergo an upgrade till Q3
2020 (oil free pre-pumps and software upgrade)
• Magnetic hygiene will be studied and Helmholtz-
Coils for active field cancellation will be prepared
for future tests.
• Origin for difference in Rres for FNAL and DESY tests
of 1DE20 is unclear

Thank you
Page 16
BACKUP - pre-treatment of line of sight protection
| DESY Infusion R&D | Bate Christopher, 31.10.2019
Influence from line of sight pre-treatment on sample surface
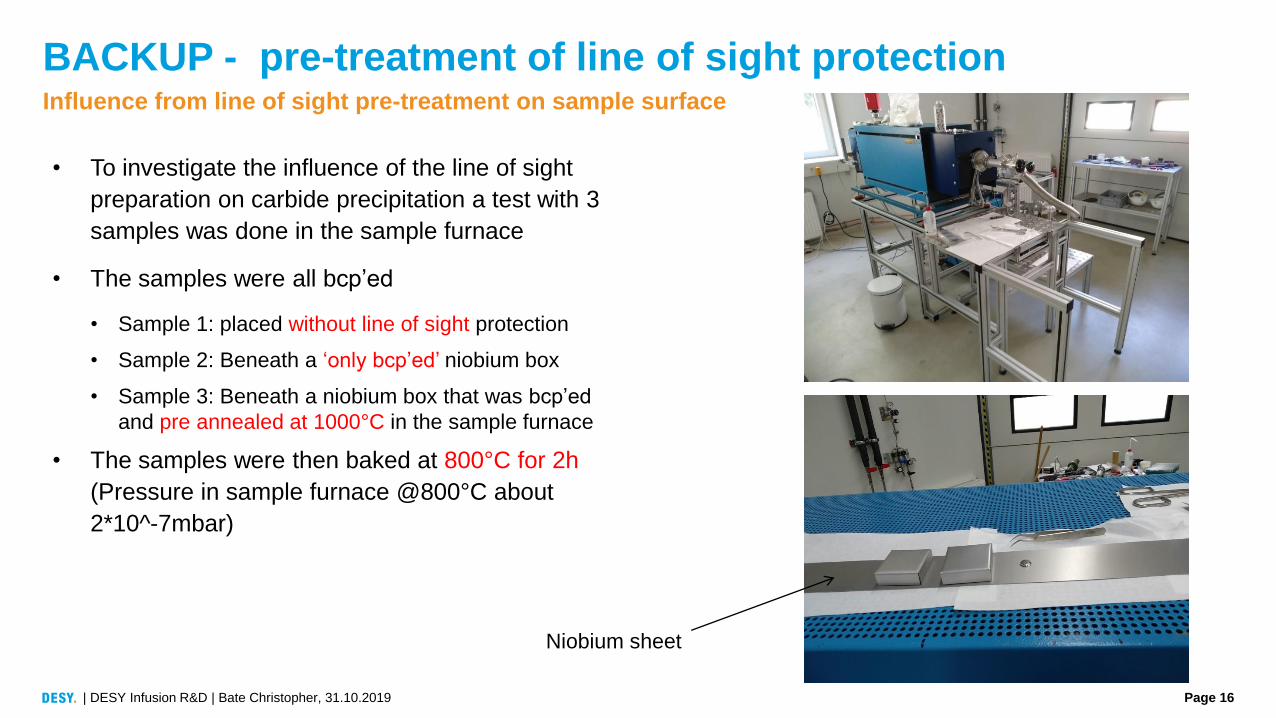
• To investigate the influence of the line of sight
preparation on carbide precipitation a test with 3
samples was done in the sample furnace
• The samples were all bcp’ed
• Sample 1: placed without line of sight protection
• Sample 2: Beneath a ‘only bcp’ed’ niobium box
• Sample 3: Beneath a niobium box that was bcp’ed
and pre annealed at 1000°C in the sample furnace
• The samples were then baked at 800°C for 2h
(Pressure in sample furnace @800°C about
2*10^-7mbar)
Niobium sheet
Page 17
BACKUP - pre-treatment of line of sight protection
| DESY Infusion R&D | Bate Christopher, 31.10.2019
Influence from line of sight pre-treatment on sample surface
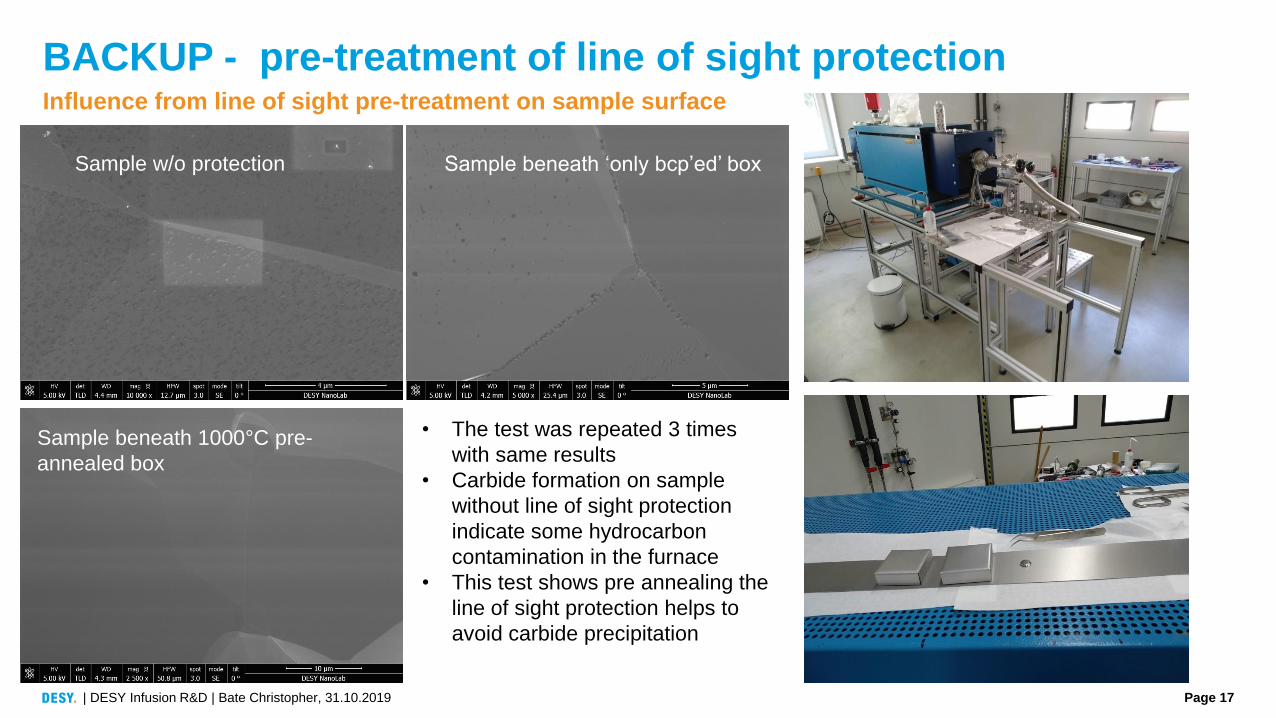
Sample w/o protection Sample beneath ‘only bcp’ed’ box
Sample beneath 1000°C pre-
annealed box
• The test was repeated 3 times
with same results
• Carbide formation on sample
without line of sight protection
indicate some hydrocarbon
contamination in the furnace
• This test shows pre annealing the
line of sight protection helps to
avoid carbide precipitation
Page 18
BACKUP - Nitrogen Infusion in sample furnace
| DESY Infusion R&D | Bate Christopher, 31.10.2019
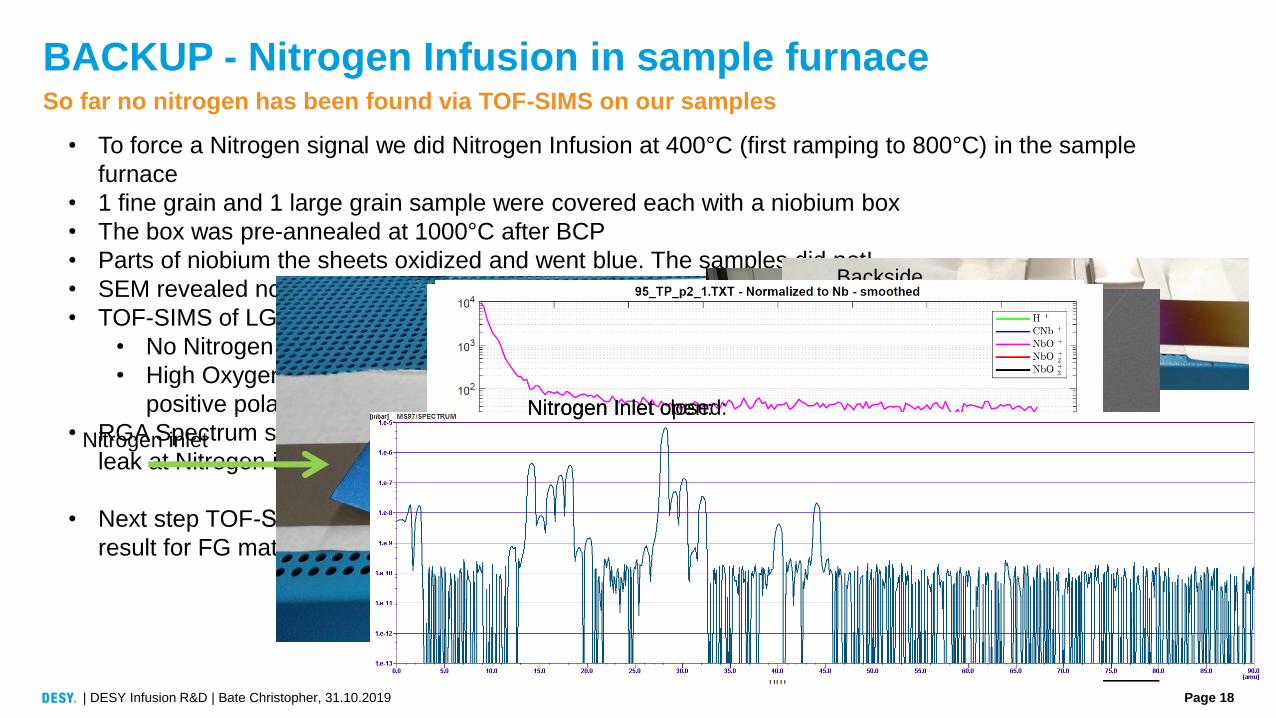
So far no nitrogen has been found via TOF-SIMS on our samples
• To force a Nitrogen signal we did Nitrogen Infusion at 400°C (first ramping to 800°C) in the sample
furnace
• 1 fine grain and 1 large grain sample were covered each with a niobium box
• The box was pre-annealed at 1000°C after BCP
• Parts of niobium the sheets oxidized and went blue. The samples did not!
• SEM revealed no precipitation
• TOF-SIMS of LG sample
• No Nitrogen
• High Oxygen signal in
positive polarity
• RGA Spectrum shows
leak at Nitrogen inlet
• Next step TOF-SIMS of FG sample! Diffusive ‘behaviour’ of grain boundaries might lead to a different
result for FG material.
Nitrogen inlet Pump
Backside
Backside
Nitrogen Inlet open:Nitrogen Inlet closed:
Page 19
BACKUP - Nitrogen Infusion in sample furnace
| DESY Infusion R&D | Bate Christopher, 31.10.2019
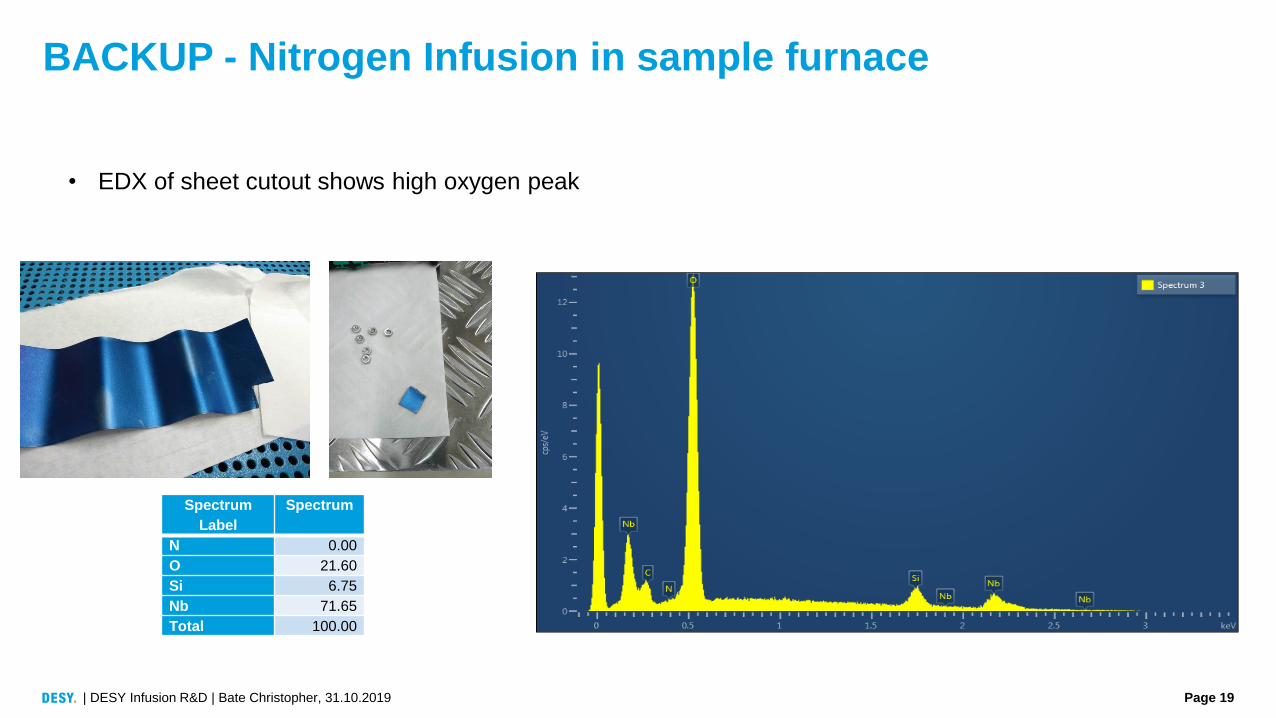
• EDX of sheet cutout shows high oxygen peak
Spectrum
Label
Spectrum
N 0.00
O 21.60
Si 6.75
Nb 71.65
Total 100.00