Designing Patient-Centered Diagnostic Networks
24
1 Designing Patient-Centered Diagnostic Networks Sidharth Rupani, LLamasoft, Inc. With Input From: Heidi Albert, Kekeletso Kao, Zachary Katz, FIND Ryan Purcell, LLamasoft, Inc.
Transcript of Designing Patient-Centered Diagnostic Networks
1
Designing Patient-Centered
Diagnostic Networks
Sidharth Rupani, LLamasoft, Inc.
With Input From:
Heidi Albert, Kekeletso Kao, Zachary Katz, FIND
Ryan Purcell, LLamasoft, Inc.

2
Primary Donors and Partners
3
Why Diagnostics?
• Diagnosis is the first step on the path to treatment and the foundation of disease control and prevention. As William Osler, sometimes described as the father of modern medicine, said in 1892: “There are three phases to treatment: diagnosis, diagnosis and diagnosis.”
• Diagnostic tests guide clinical decision-making. By helping to ensure the use of appropriate treatments, diagnostics improve the efficiency of health care spending, and help us to fight antimicrobial resistance by guiding the appropriate use of antibiotics.
• Diagnostic tests are also the foundation of disease surveillance and elimination.
- Foundation for Innovative New Diagnostics website. “Why Diagnostics?”
4
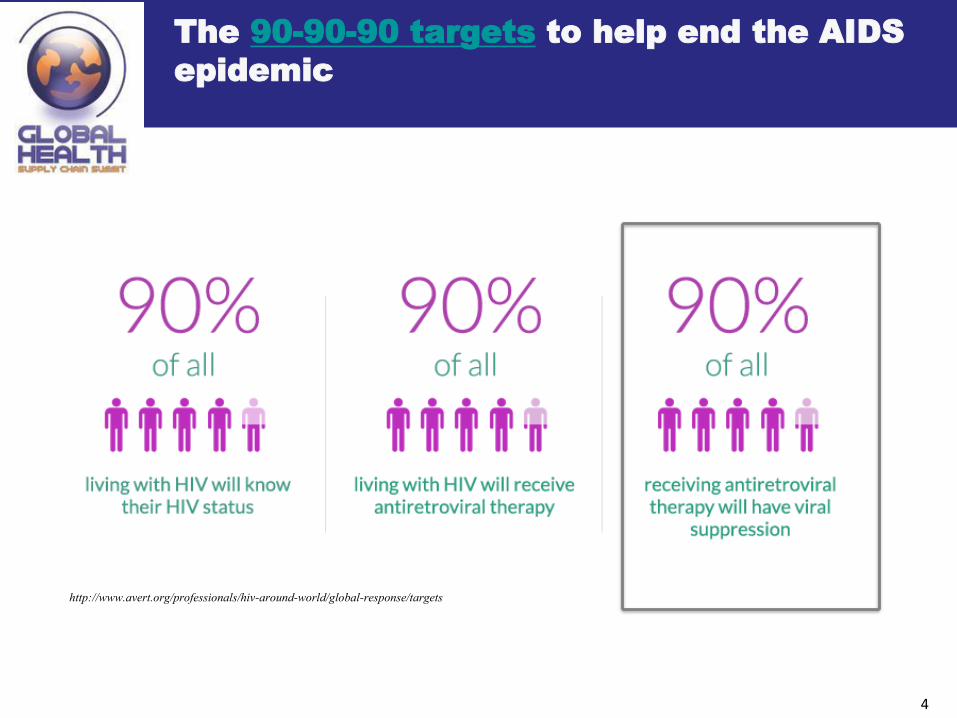
The 90-90-90 targets to help end the AIDS
epidemic
http://www.avert.org/professionals/hiv-around-world/global-response/targets
5
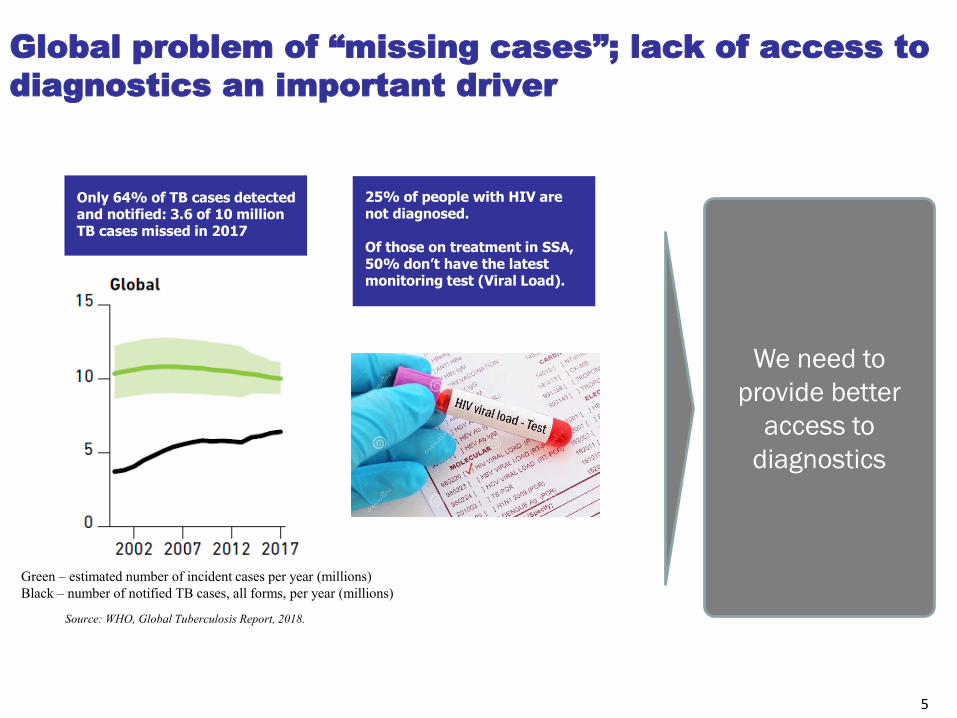
Global problem of “missing cases”; lack of access to
diagnostics an important driver
Only 64% of TB cases detected and notified: 3.6 of 10 million TB cases missed in 2017
Source: WHO, Global Tuberculosis Report, 2018.
Green – estimated number of incident cases per year (millions)
Black – number of notified TB cases, all forms, per year (millions)
25% of people with HIV are not diagnosed.
Of those on treatment in SSA, 50% don’t have the latest monitoring test (Viral Load).
We need to
provide better
access to
diagnostics
6
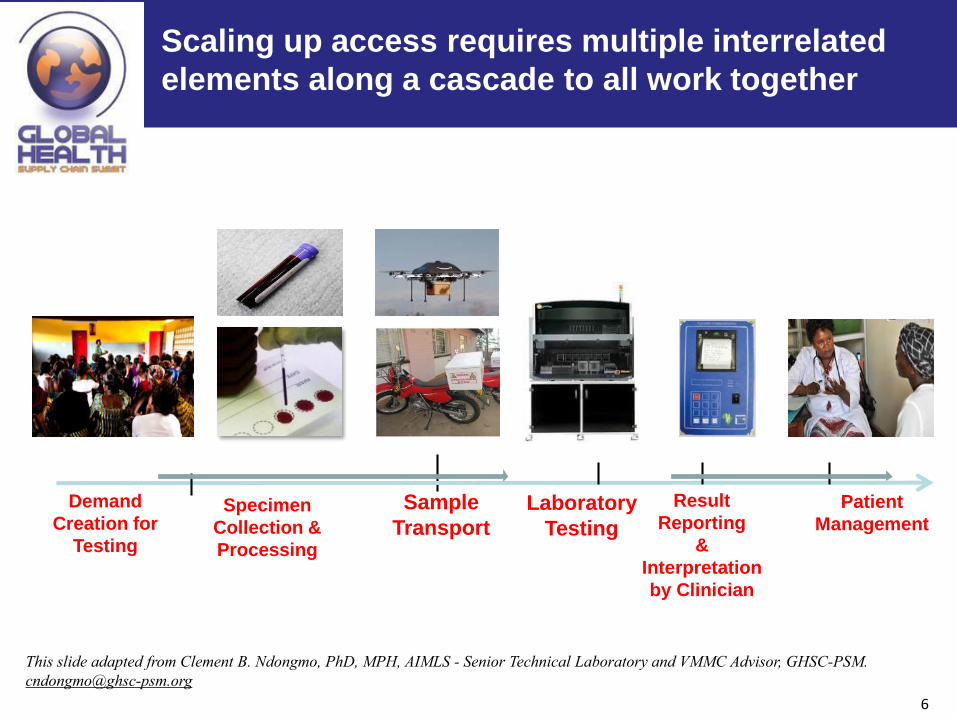
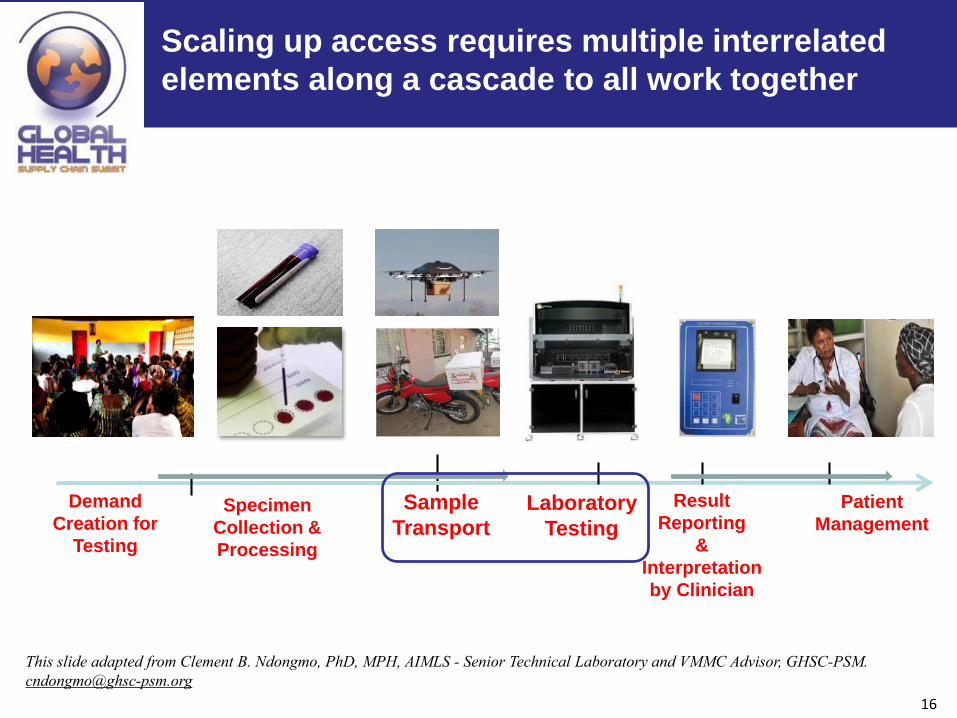
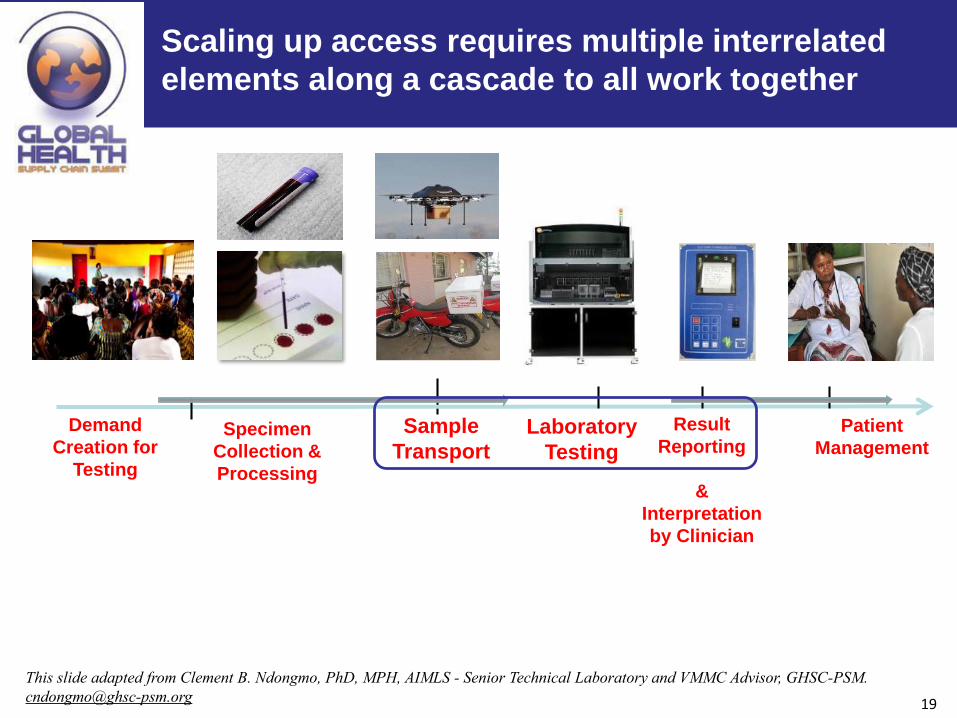
The Viral Load Cascade
Sample
Transport
Laboratory
Testing
Result
Reporting
&
Interpretation
by Clinician
Patient
ManagementSpecimen
Collection &
Processing
Demand
Creation for
Testing
Scaling up access requires multiple interrelated
elements along a cascade to all work together
This slide adapted from Clement B. Ndongmo, PhD, MPH, AIMLS - Senior Technical Laboratory and VMMC Advisor, GHSC-PSM.
7
Design Objective – v1
Increase access to diagnostics, cost-effectively
8
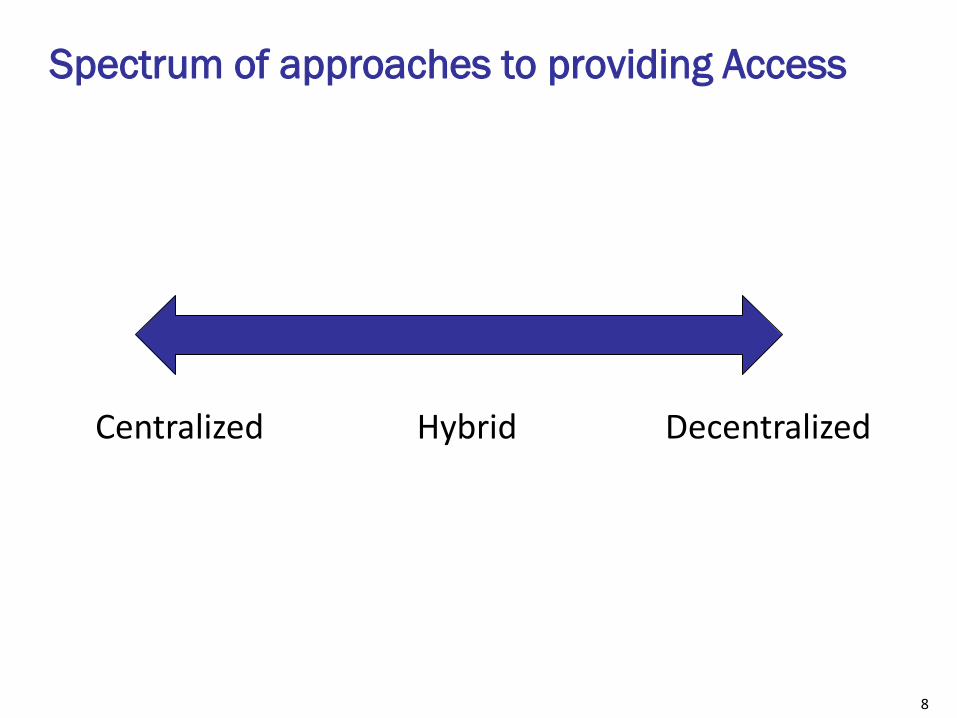
Spectrum of approaches to providing Access
Centralized DecentralizedHybrid

9
A powerful starting point – Network Optimization:
How many machines? Where to put them? How to refer samples?
• A proposed solution:
purchase many
diagnostic machines and
distribute them widely
across country
• Budgets are constrained
BU
T

10
“Puzzling” factor: In current state available
machines are underutilized
• Underused machines
could be addressed by
better referral flows.
• Low demand machines
with utilization <X%
(average daily tests <Y)
could be replaced by
better suited smaller or
POC machines.
Utilization by facility
Utilization by district

11
Design the network: optimize instrument number, placement,
and referral flows
Public
Private
Facilities with new machines
Non-optimal locations
Optimal locations to place machines
Optimal locations to place POC
Existing facilities with machines
Level 1 facilities without machines
Sample Flows
Recommendations:
1. 50+% of new machines in country
should be moved.
2. Adjust referral flows across district
borders.
3. Drop the other Y machines planned
for purchase.
4. Z POC machines should be added
12
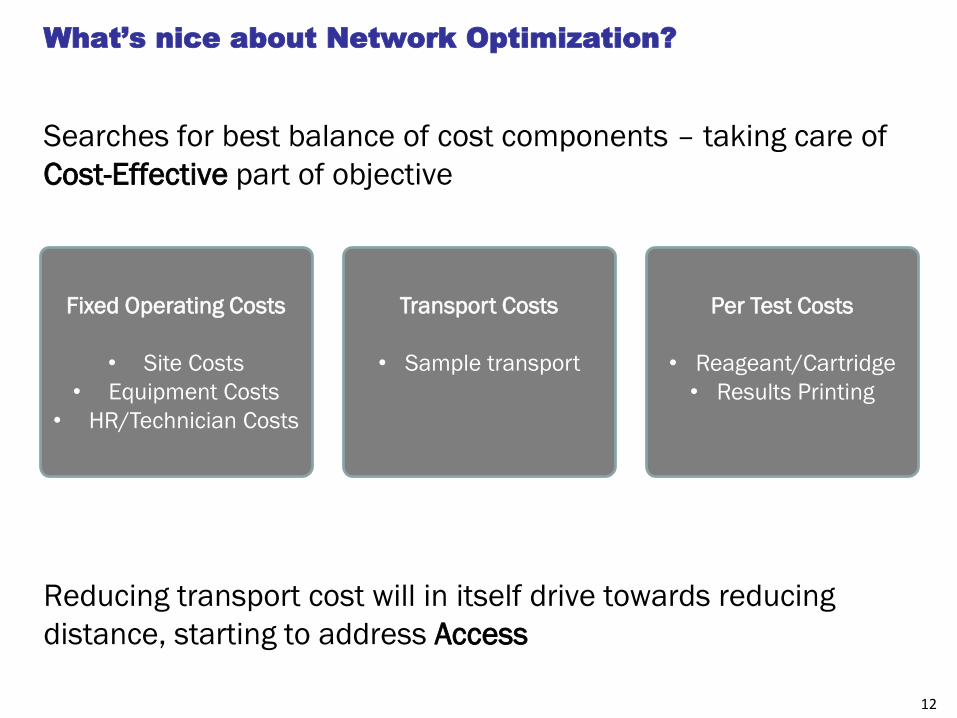
What’s nice about Network Optimization?
Searches for best balance of cost components – taking care of
Cost-Effective part of objective
Reducing transport cost will in itself drive towards reducing
distance, starting to address Access
Fixed Operating Costs
• Site Costs
• Equipment Costs
• HR/Technician Costs
Transport Costs
• Sample transport
Per Test Costs
• Reageant/Cartridge
• Results Printing
13
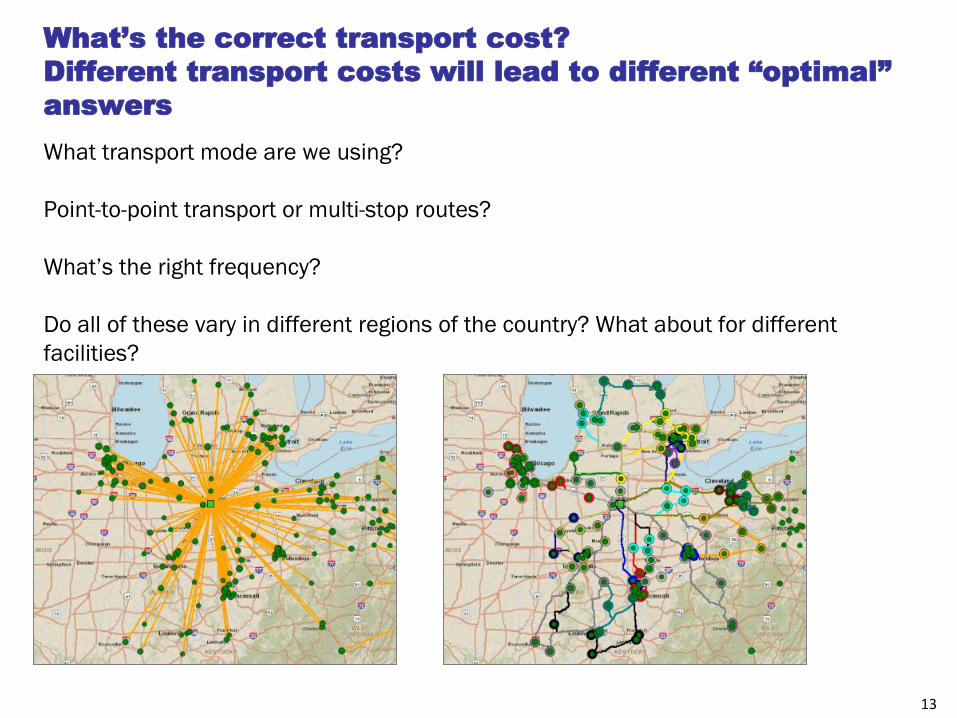
What’s the correct transport cost?
Different transport costs will lead to different “optimal”
answers
What transport mode are we using?
Point-to-point transport or multi-stop routes?
What’s the right frequency?
Do all of these vary in different regions of the country? What about for different
facilities?
14
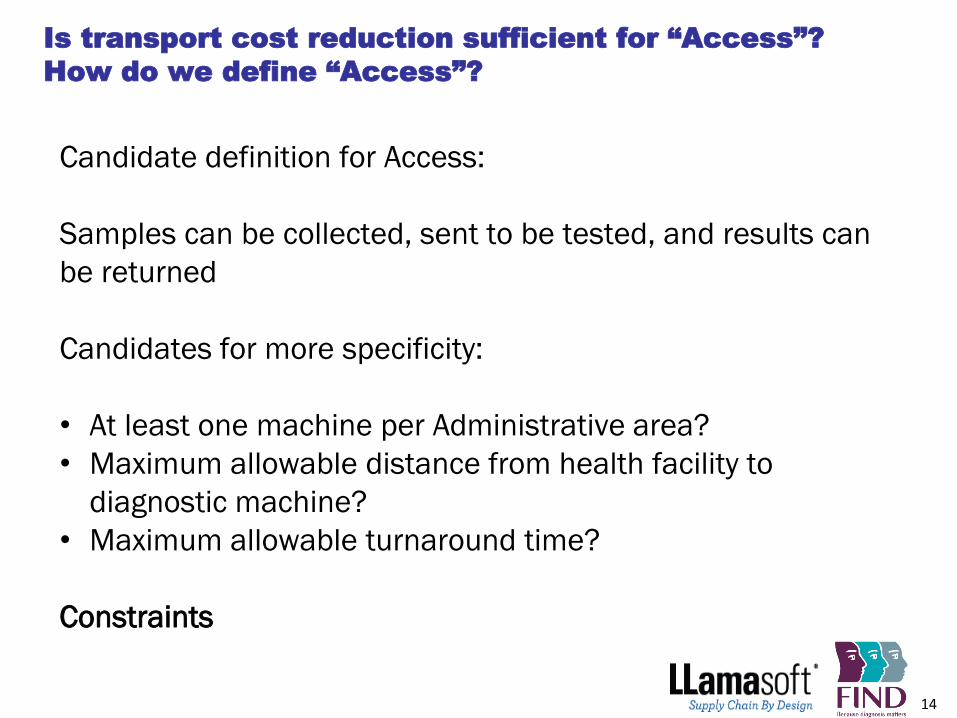
Is transport cost reduction sufficient for “Access”?
How do we define “Access”?
Candidate definition for Access:
Samples can be collected, sent to be tested, and results can
be returned
Candidates for more specificity:
• At least one machine per Administrative area?
• Maximum allowable distance from health facility to
diagnostic machine?
• Maximum allowable turnaround time?
Constraints
15
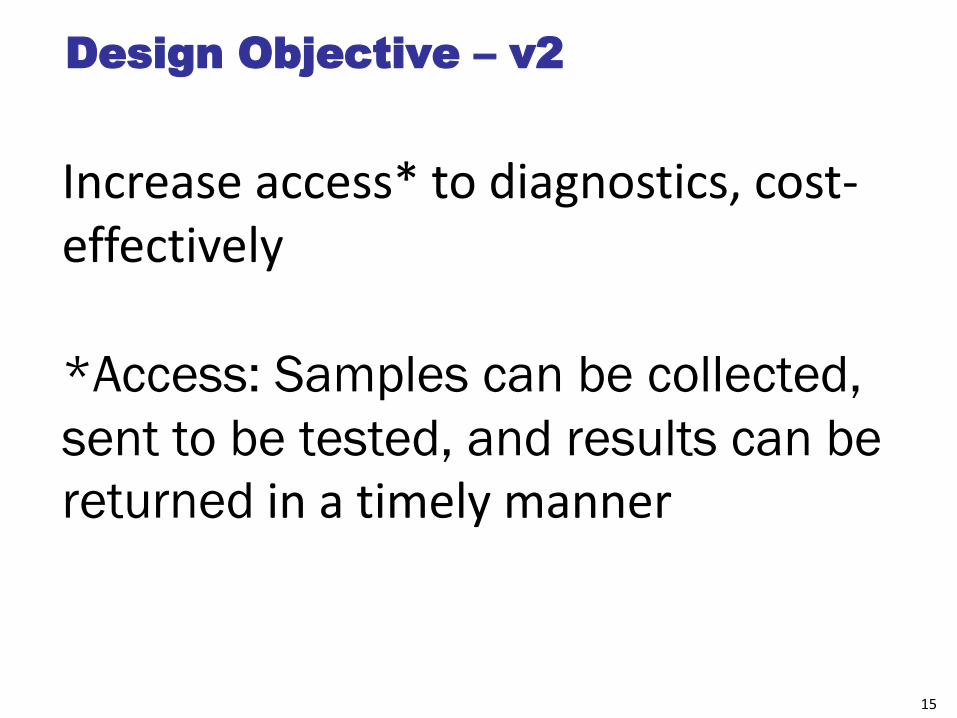
Design Objective – v2
Increase access* to diagnostics, cost-effectively
*Access: Samples can be collected,
sent to be tested, and results can be
returned in a timely manner
16
The Viral Load Cascade
Sample
Transport
Laboratory
Testing
Result
Reporting
&
Interpretation
by Clinician
Patient
ManagementSpecimen
Collection &
Processing
Demand
Creation for
Testing
Scaling up access requires multiple interrelated
elements along a cascade to all work together
This slide adapted from Clement B. Ndongmo, PhD, MPH, AIMLS - Senior Technical Laboratory and VMMC Advisor, GHSC-PSM.
17
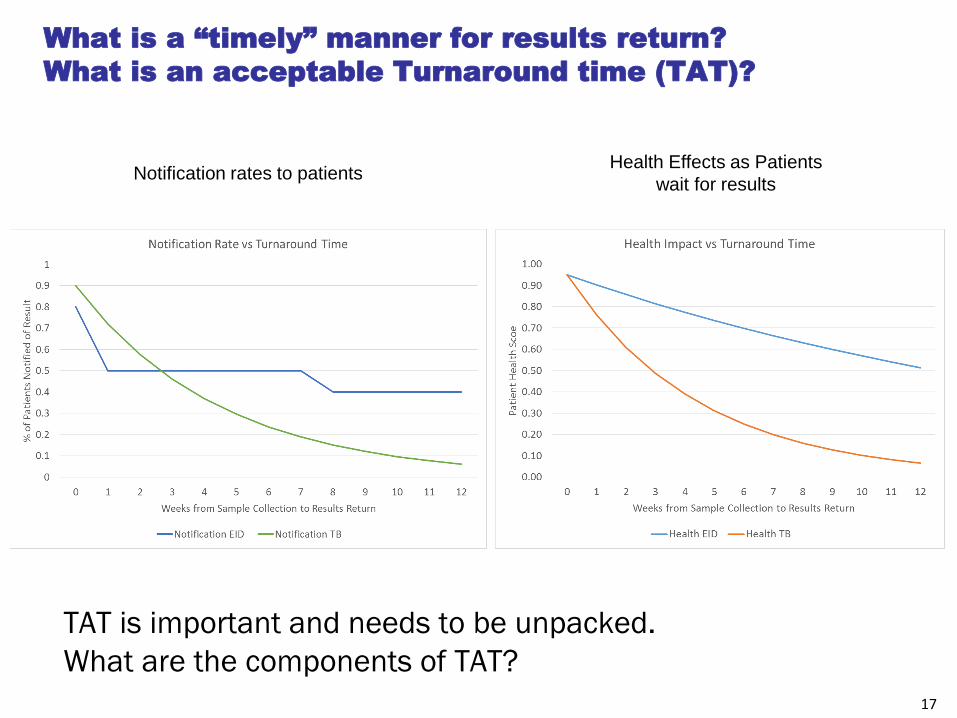
What is a “timely” manner for results return?
What is an acceptable Turnaround time (TAT)?
TAT is important and needs to be unpacked.
What are the components of TAT?
Notification rates to patientsHealth Effects as Patients
wait for results
18
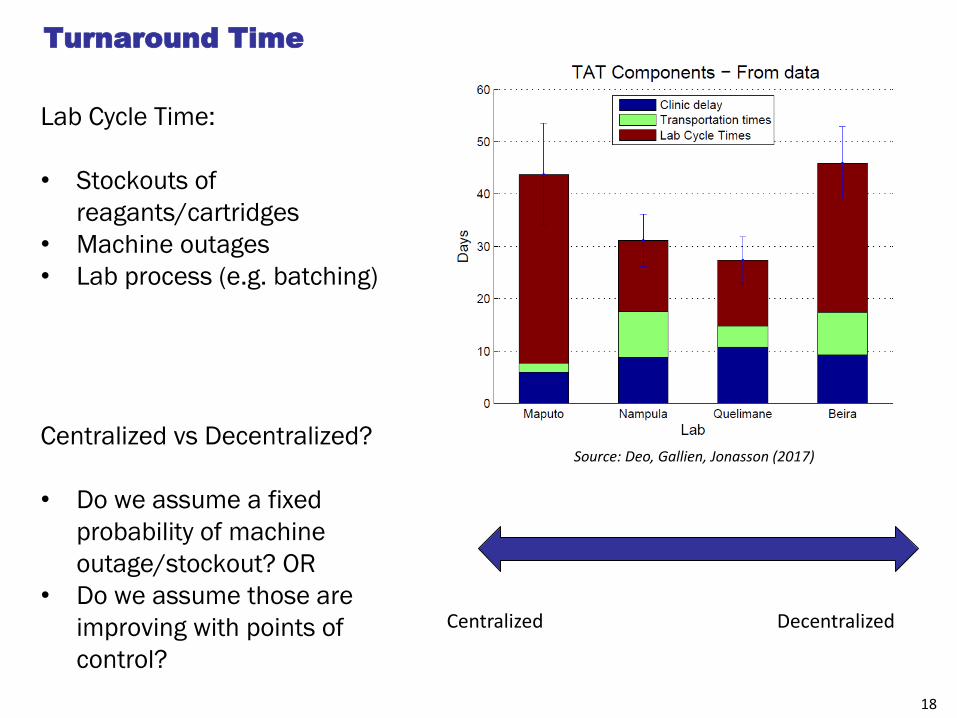
Turnaround Time
Lab Cycle Time:
• Stockouts of
reagants/cartridges
• Machine outages
• Lab process (e.g. batching)
Centralized vs Decentralized?
• Do we assume a fixed
probability of machine
outage/stockout? OR
• Do we assume those are
improving with points of
control?
Centralized Decentralized
Source: Deo, Gallien, Jonasson (2017)
19
The Viral Load Cascade
Sample
Transport
Laboratory
Testing
Result
Reporting
&
Interpretation
by Clinician
Patient
ManagementSpecimen
Collection &
Processing
Demand
Creation for
Testing
Scaling up access requires multiple interrelated
elements along a cascade to all work together
This slide adapted from Clement B. Ndongmo, PhD, MPH, AIMLS - Senior Technical Laboratory and VMMC Advisor, GHSC-PSM.
20
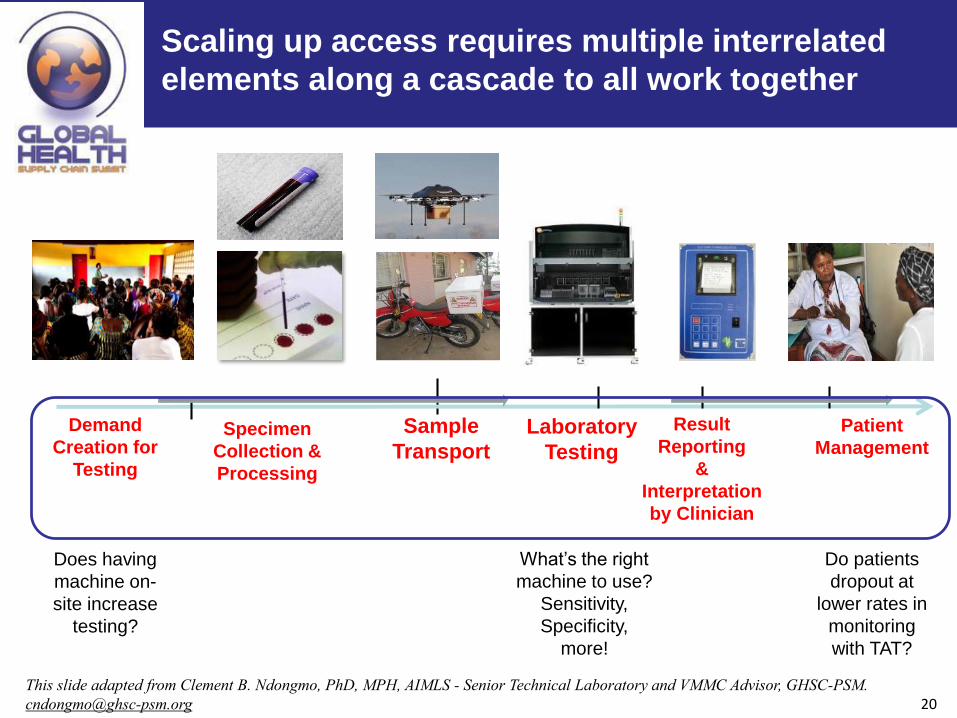
The Viral Load Cascade
Sample
Transport
Laboratory
Testing
Result
Reporting
&
Interpretation
by Clinician
Patient
ManagementSpecimen
Collection &
Processing
Demand
Creation for
Testing
Scaling up access requires multiple interrelated
elements along a cascade to all work together
This slide adapted from Clement B. Ndongmo, PhD, MPH, AIMLS - Senior Technical Laboratory and VMMC Advisor, GHSC-PSM.
Does having
machine on-
site increase
testing?
Do patients
dropout at
lower rates in
monitoring
with TAT?
What’s the right
machine to use?
Sensitivity,
Specificity,
more!
21
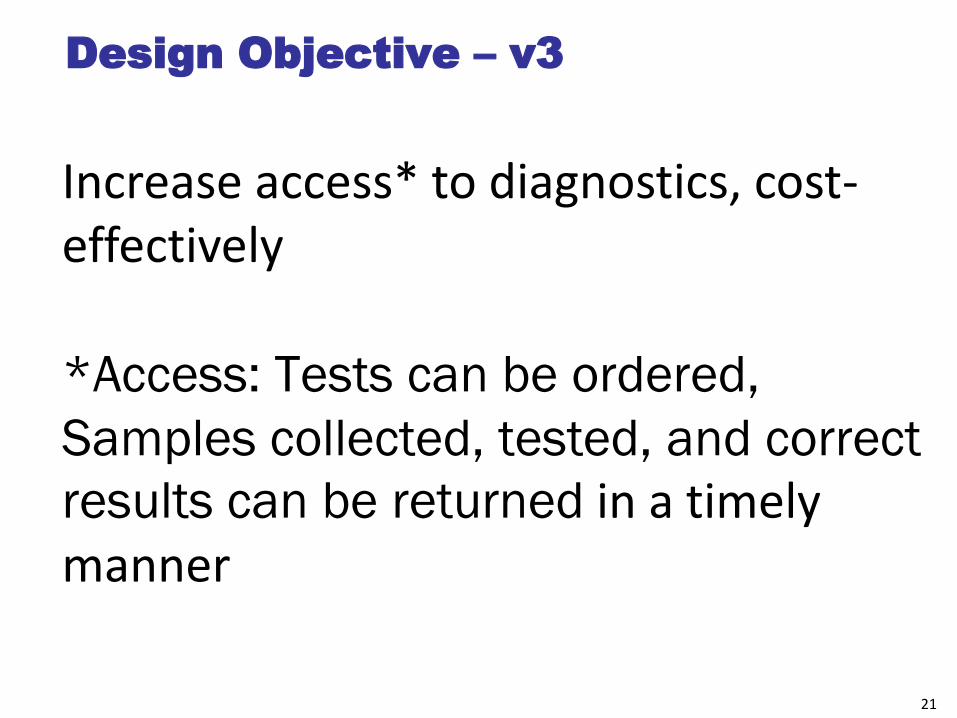
Design Objective – v3
Increase access* to diagnostics, cost-effectively
*Access: Tests can be ordered,
Samples collected, tested, and correct
results can be returned in a timely manner
22
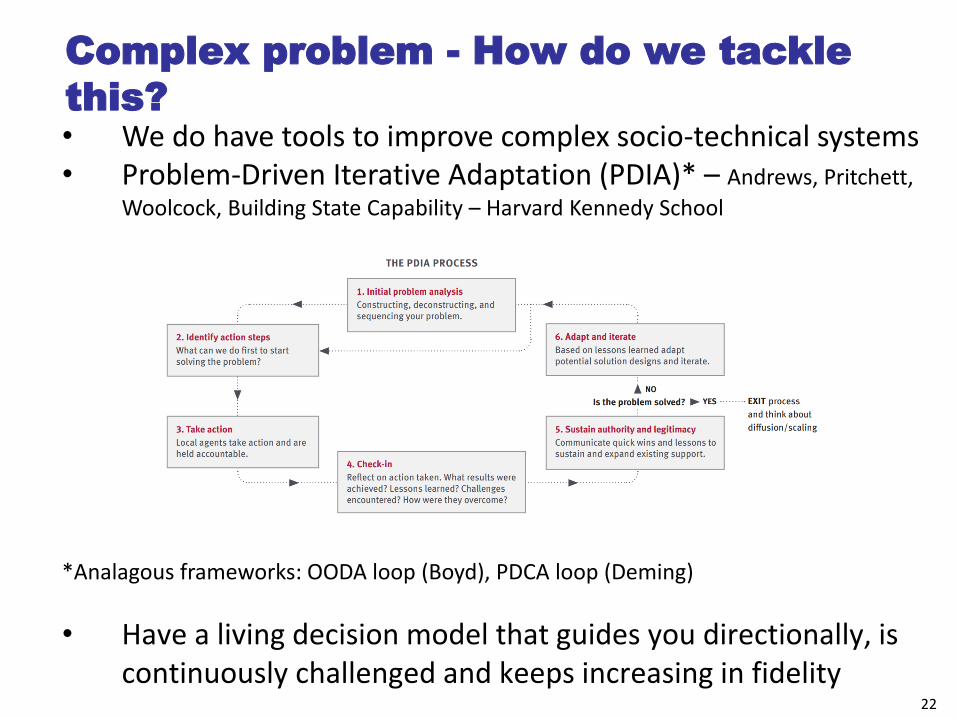
Complex problem - How do we tackle
this?• We do have tools to improve complex socio-technical systems• Problem-Driven Iterative Adaptation (PDIA)* – Andrews, Pritchett,
Woolcock, Building State Capability – Harvard Kennedy School
*Analagous frameworks: OODA loop (Boyd), PDCA loop (Deming)
• Have a living decision model that guides you directionally, is continuously challenged and keeps increasing in fidelity
23
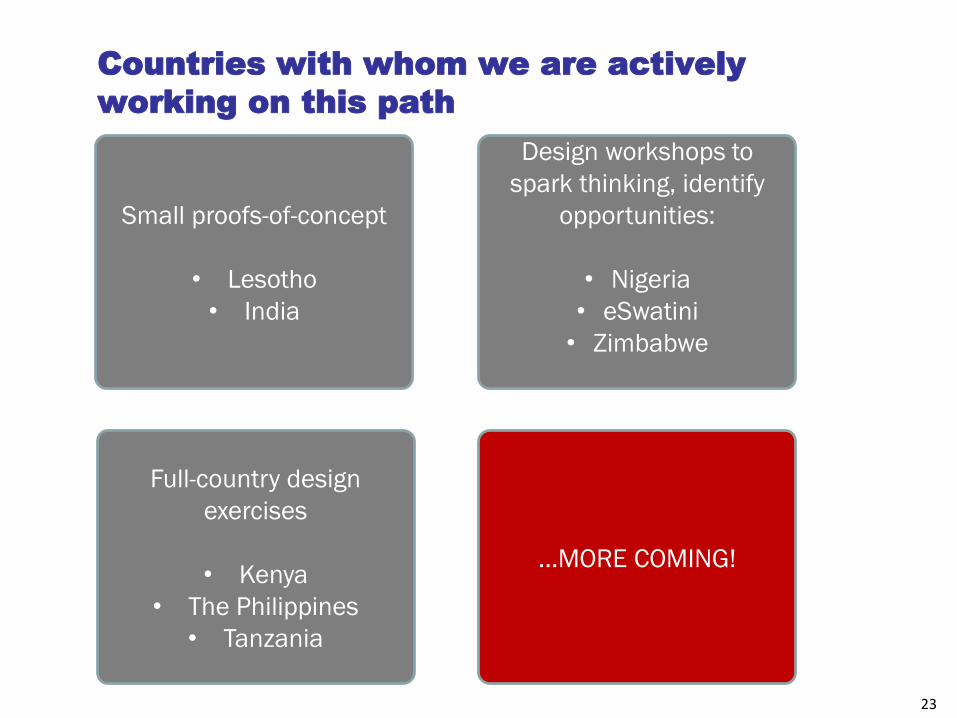
Countries with whom we are actively
working on this path
Small proofs-of-concept
• Lesotho
• India
Design workshops to
spark thinking, identify
opportunities:
• Nigeria
• eSwatini
• Zimbabwe
Full-country design
exercises
• Kenya
• The Philippines
• Tanzania
…MORE COMING!

24
THANK YOU!