Designing Laboratory Experiment on Thermoelectric Power ...€¦ · Designing Laboratory Experiment...
20
Designing Laboratory Experiment on Thermoelectric Power Generation Marshall Bernklow MQP 4/1/2014
Transcript of Designing Laboratory Experiment on Thermoelectric Power ...€¦ · Designing Laboratory Experiment...
Designing Laboratory Experiment on
Thermoelectric Power Generation Marshall Bernklow
MQP
4/1/2014
Abstract/Executive Summary This project was designed with the focus of improving alternative energy education at WPI.
Laboratory experiences for students need to incorporate both the knowledge that students need as well
as a practical hands on experience with the subject matter, in this case thermoelectrics. Research was
conducted to identify similar projects and experiments used in other academic and professional
curriculums that would relate to the individual topics of alternative energy. From there a laboratory
procedure was created that would not only be informative for students about the specific alternative
energy topic, but could also be engaging so as to promote subject retention. This lab was broken into 2
parts, one focusing on the basics of thermoelectrics while the other focuses on understanding some of
the more complicated concepts. The labs were reviewed and run through by the MQP group in order to
stream-line the procedure and determine overall effectiveness.
Acknowledgements
I would like to thank Isa Bar-on for being the MQP advisor for this project, and for
allowing me to be a part of this experience.
Authorship
This paper was written by Marshall Bernklow
Contents Abstract/Executive Summary.................................................................................................................... 2
Acknowledgements ................................................................................................................................... 2
Authorship ................................................................................................................................................ 2
Figures ....................................................................................................................................................... 3
Introduction/Objectives ............................................................................................................................ 3
Lit review ................................................................................................................................................... 6
Lab 1 .......................................................................................................................................................... 7

Lab 1 intro/abstract .............................................................................................................................. 7
Procedure (inc. materials) ..................................................................................................................... 8
What to measure ................................................................................................................................ 11
Expected Calculations/Conclusions .................................................................................................... 11
Lab Part 2 ................................................................................................................................................ 11
Lab part 2 intro/abstract ..................................................................................................................... 11
Procedure (inc. materials) ................................................................................................................... 13
What to measure ................................................................................................................................ 15
Expected Calculations/Conclusions .................................................................................................... 16
Challenges/Future Work ......................................................................................................................... 17
Conclusions ............................................................................................................................................. 18
Bibliography ................................................................................................................................................ 19
Figures Figure 1.1 and 1.2 Copper-copper and Chromel-copper Thermocouple (Auparay, 2013) ........................... 5
Figure 2 Biolite Stove (Biolite, n.d.)............................................................................................................... 8
Figure 3 Biolite Stove soldered wires .......................................................................................................... 10
Figure 4 Laboratory Set-up example (Phillips, 2009) .................................................................................. 15
Figure 5 Figure of Merit Equation (Phillips, 2009) ...................................................................................... 16
Figure 6 Electrical Power Equation (Phillips, 2009) .................................................................................... 16
Figure 7 Seebeck Coeff equation (Phillips, 2009) ....................................................................................... 16
Introduction/Objectives The act of creating an electrical current through the thermoelectrics is mainly possible due to
3 different effects, the Seebeck, Peltier, and Thomson effect. The Seebeck effect is when there is
an electromotive force and subsequently an electrical current that is produced when at least 2
dissimilar conductors are made into a loop, while maintaining 2 different junctions at differing
temperatures. This was discovered in 1821 by German physicist Thomas Johann Seebeck, and it
is important to note that although the conductors are more commonly metals, they are not
required to be, and are not even required to be solids in some cases (Seebeck effect, n.d.).
The Peltier effect is when there is a circuit made of 2 dissimilar conductors, with a
maintained electrical current, has one junction being cooled and the other being heated. It is
found that when the circuit contains semiconductors that are more dissimilar this effect is even

stronger. This effect was discovered by Jean-Charles-Athanase Peltier, a French Physicist in
1834 (Peltier Effect, n.d.).
Finally the Thomson effect is the heat absorption as the electrical current passes through the
circuit, when it is composed of a single material with a temperature difference along its length.
While this heat is being transferred, you superimpose the common production of heat that is
associated with the electrical resistance to the current that is found inside one of the conductors.
This effect was discovered in 1854 by the British physicist William Thomson (Thomson effect,
n.d.).
The Seebeck effect is important in understanding thermocouples. In this case, a thermocouple
is a device to generate thermoelectric energy, made from 2 dissimilar metals which are
connected at 2 different points. Use a copper wire as an example. Copper is a metal, and because
of this the electrons are free to move along the wire. When heat is applied to it, the electrons will
diffuse uniformly along the length of the wire from the hot side to the cold side. Since this
diffusion of the copper electrons is uniform, however, if you were to place a voltmeter along the
length of the wire, you would not be able to detect any voltage difference.
With respect to the above scientific principles, you can create either a thermocouple or a
thermoelectric generator. A thermocouple is often used as a way of measuring temperature.
Since the 2 dissimilar conductors are at 2 separate temperatures on the loop, you can determine
the temperature of one by knowing the temperature of the other, and measuring the voltage that
is being produced through the wire. Thermocouples, therefore, are found often in measurement
and control situations as temperature sensors. Thermoelectric generators operate under the same
principle, but instead of using the voltage produced to determine a temperature, the known
voltages were used to simply produce electricity. This application has been ongoing since
Thomas Seebeck first characterized multiple metals as good thermoelectric materials, but it was
not until 1909 when Edmund Altenkirch used the constant property model to derive the
maximum efficiency of a thermoelectric generator. (California Institute of Technolody, n.d.)
This specific facet of renewable energy is also quite an important one when you think about
where humanity is in terms of development. Humans have sent the voyager space satellite out
into the universe to try and explore the reaches of space, as well as the curiosity rover to mars to
try and explore the planets that exist within our very own solar system Both of these 2 space

explorers are run on a system that is designed to be a continual alternative energy. They run on
thermoelectrics, they convert heat from radioactive material that they carry with them in order to
produce energy, and though the energy is finite for them, the principle of using a fuel source like
this is something that can be explored further. The voyager, running on 3 radioisotope
thermoelectric generators is expected to last until approximately 2025, when it was launched in
1977. This probe holds the record, at 1.909*10^10 km as the farthest human-made object from
earth, a feat performed by thermoelectric engines. (Nasa, n.d.) (Wahlquist, 1999)
Now in the following example if one side of the copper wire were to be exchanged for
another conductor, say chromel. In this example, with the same temperature difference as before,
the voltmeter that is hooked up to the circuit will register a voltage between the 2 junctions.
There are differing transport properties found between the copper and the chromel wires, and this
is what causes the potential difference. Simplifying this, it means that at the warm side of the
copper wire, the free electrons have a different speed then the free electrons that are present at
the warmer side of the chromel wire. This flow from warmer to colder side creates this potential
difference, thus a voltage can be found. This means that the temperature difference in the
junctions causes the voltage, so an increase in the temperature difference would cause an
increased voltage, as they are directly proportional. The figure below can illustrate this concept
above (Auparay, 2013).
Figure 1.1 and 1.2 Copper-copper and Chromel-copper Thermocouple (Auparay, 2013)
These principles are the foundation of the laboratory experiment. This lab obviously
needs to explore the capabilities of thermoelectric power, but there is another goal that is
important inside of the experiments. A sub-goal of this lab is to create an experience that the
students find interesting, so that it would be easier for them to recollect. Obviously not every

laboratory experience is memorable/interesting, but if these labs can be then it will hopefully
make it easier for students to recollect the lessons and experiments for future projects. Any
attempt to create a memorable lab experience is only a smaller goal of the project, with the main
goal being experience with thermoelectric properties.
Lit review
The research done for this paper focused exclusively on thermoelectrics and
thermocouples. The goal was to look into research papers that existed and were done by other
universities/companies that could be simplified/modified to fit into the time frame that students
are going to be working in, that would demonstrate the various capabilities of thermoelectrics.
The first part of the research involved looking into the ideas of using car engines in some
capacity. This seemed to be a good start, since there is a huge supply of them, and a large portion
of them run off combustion engines. Two such projects looked into were “Experiments and
simulations on low-temperature waste heat harvesting system by thermoelectric power
generators” from a prestigious university in Taiwan, the National Tsing Hua university, and
“exhaust energy conversion by thermoelectric generator: Two cast studies” which was a study
sponsored by the New York State Energy Research and Development Authority. Combustion
engines produce heat, and some of this heat is lost in the engines workings, so the use of a
thermoelectric generator to absorb the waste heat could be a source of energy, and since engines
have cooling systems they already have an available heat sink to create the cold junction. The
drawbacks for this type of project is that it requires the engine of an automobile, so there needs
to be some work done outside of the lab, and to properly manufacture the parts that are required
for the experiment it can take too much time to be only a part of a lab experience in alternative
energy.

Lab 1
Lab 1 intro/abstract
This lab focuses in on the basic ideals of thermoelectric power generation. Thermoelectric
power generation occurs when a heat is applied to 2 dissimilar conductors connected the electrons will
flow along the wires, causing a voltage which can be used to do work. For this experiment we use a
stove, called the Biolite camp stove. This stove, from the biolite company, uses a thermoelectric unit.
This stove takes the heat generated from burning biomass, creating a voltage from a small
thermoelectric generator. This voltage is stored inside of a small battery pack located inside of the main
component of the stove, and is also used to power a small fan that is located inside the unit. This fan
increases the efficiency of the heat generation by gently blowing upon the fire, stoking it.
This lab will focus mainly on real world applications of this method of energy generation. The
main use, considering the low efficiency found in thermoelectrics, is as a parasitic system. A combustion
engine produces excess heat when it is being used to power, say, a car. This excess heat is usually lost
because of the nature of energy/heat transfer. A parasitic system would be able to fit neatly onto the
pre-existing engine (or in the case of a car possibly onto its exhaust system) and from this extra heat
that would otherwise be wasted an electrical charge can be produced and saved.
The concept that this lab is trying to impart upon the students is that as of now the uses of
thermoelectrics are generally more limited, but that does not mean there are no situations where it can
be used. Prime examples of modern uses of thermoelectrics can be seen in such examples as the Mars
rover, the pioneer, Viking, Galileo, Apollo, Cassini, and Voyager spacecrafts. These all rely on
Radioisotope thermoelectric generators. In these cases, the designers use the energy produced from
radioactive materials to create a hot junction, and possibly the vacuum of space as the heat sink to
provide the cold junction. This is all an example of the first labs concept, that even considering the low
level of efficiency that these generators can have, there are some situations where the power
generation is effective. The Voyagers power sources are still operating even after operating for more
than 35 years. (California Institute of Technolody, n.d.)
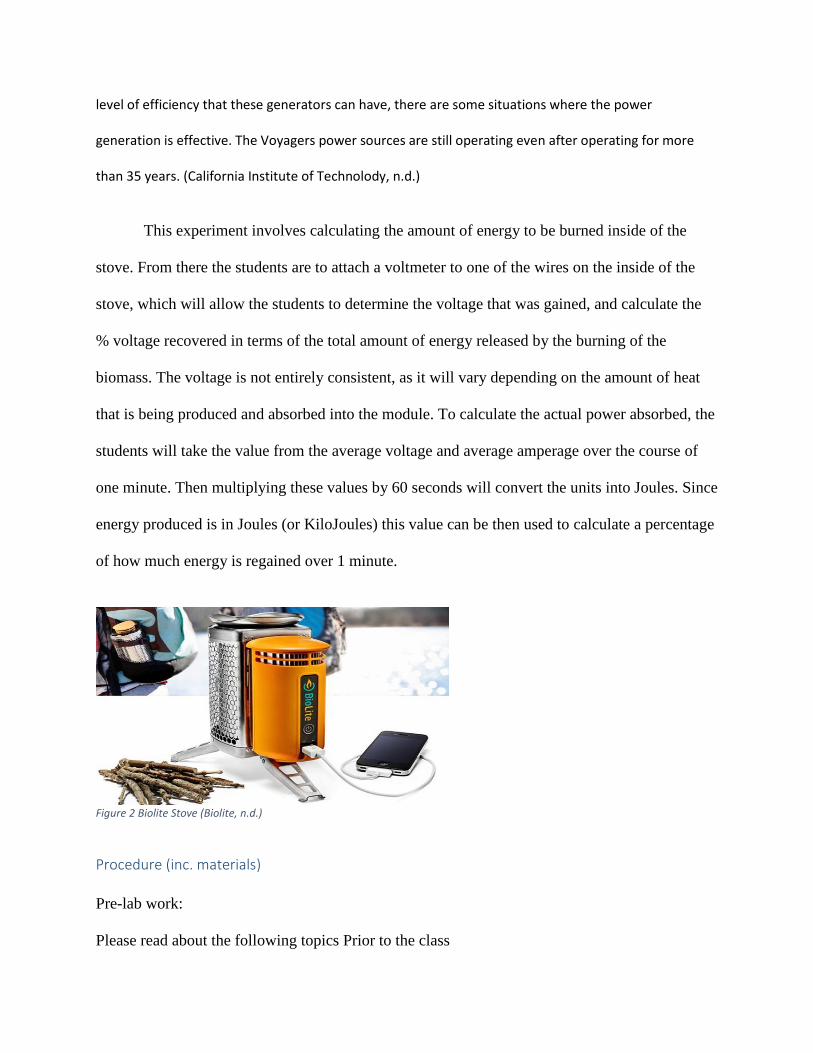
This experiment involves calculating the amount of energy to be burned inside of the
stove. From there the students are to attach a voltmeter to one of the wires on the inside of the
stove, which will allow the students to determine the voltage that was gained, and calculate the
% voltage recovered in terms of the total amount of energy released by the burning of the
biomass. The voltage is not entirely consistent, as it will vary depending on the amount of heat
that is being produced and absorbed into the module. To calculate the actual power absorbed, the
students will take the value from the average voltage and average amperage over the course of
one minute. Then multiplying these values by 60 seconds will convert the units into Joules. Since
energy produced is in Joules (or KiloJoules) this value can be then used to calculate a percentage
of how much energy is regained over 1 minute.
Figure 2 Biolite Stove (Biolite, n.d.)
Procedure (inc. materials)
Pre-lab work:
Please read about the following topics Prior to the class
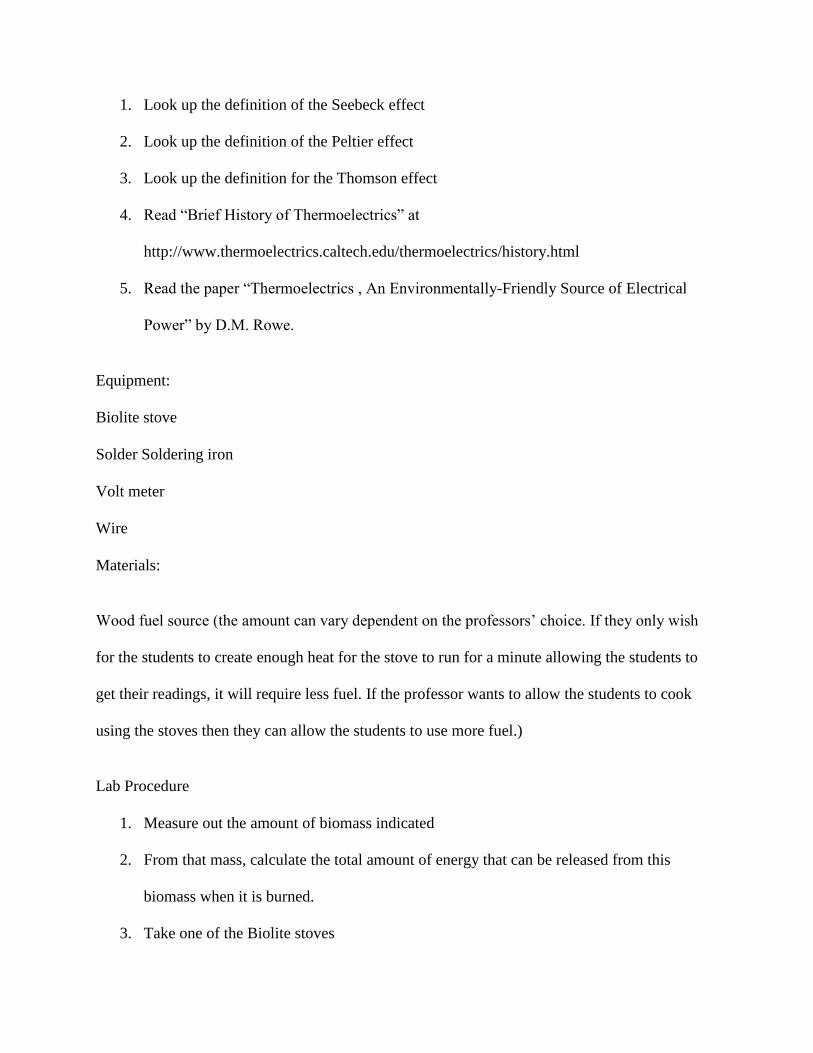
1. Look up the definition of the Seebeck effect
2. Look up the definition of the Peltier effect
3. Look up the definition for the Thomson effect
4. Read “Brief History of Thermoelectrics” at
http://www.thermoelectrics.caltech.edu/thermoelectrics/history.html
5. Read the paper “Thermoelectrics , An Environmentally-Friendly Source of Electrical
Power” by D.M. Rowe.
Equipment:
Biolite stove
Solder Soldering iron
Volt meter
Wire
Materials:
Wood fuel source (the amount can vary dependent on the professors’ choice. If they only wish
for the students to create enough heat for the stove to run for a minute allowing the students to
get their readings, it will require less fuel. If the professor wants to allow the students to cook
using the stoves then they can allow the students to use more fuel.)
Lab Procedure
1. Measure out the amount of biomass indicated
2. From that mass, calculate the total amount of energy that can be released from this
biomass when it is burned.
3. Take one of the Biolite stoves

4. Take the housing off of the electrical components of the stove
5. Find the wire that connects from the thermoelectric generator to the circuitry.
6. Cut into this wire to open it up, the photo of such being located below
Figure 3 Biolite Stove soldered wires
7. Solder a piece of wire to each side of the wire inside of the stove
8. Lead the wires out of the stove and reattach the housing
9. Connect a multimeter to the wires
10. Place the biomass inside the stove and light it
11. When the voltage seems to have reached a stable value, take 3 samples over the course of
a minute. Also take 3 samples of the amperage over this time. Average these samples,
and multiply these values together to get a power in watts. Then, multiply this value by
60 seconds.
12. Use this voltage gained to calculate the amount of power that was regained as a
percentage of the total power released from the biomass

13. While the stove is cooking, small(er) items can be cooked over the top of it, such as
coffee, hot chocolate, marshmallows, hot dogs, and cell phones with a USB charger can
be charged from the front of the stove
What to measure
In this lab the measurement mainly comes from the voltage/current that is being
determined. This is found by cutting open one of the wires that comes from the thermoelectric
module to the circuitry inside of the stove. The photo above contains a picture of the cut
connector.
Expected Calculations/Conclusions
First the students will calculate the total energy being released from the burning biomass fuel.
These values are found from the bomb calorimeter experiment that was created by the other
MQP group. From the experiments the students will take the average voltage over 1 minute, and
the average amperage over that same minute. These 2 values are multiplied together to get a
value in watts, then this is multiplied by the 60 second time we had determined the averages for.
This will give a final power in joules, and this can then be compared to the value of the total
energy released, which is in joules (or kilojoules). This energy value for 1 minute is then
converted into a percentage, so the students can see what percentage of energy is being regained
for 1 average minute that the stove will be running for.
Lab Part 2
Lab part 2 intro/abstract
The second lab involves setting up the experiment, not having the cold and hot junctions
already created. There are more calculations that will be done in this second lab, including
calculating the seebeck effect and the figure of merit. This experiment does not involve setting
up a thermoelectric generator to run on waste heat, it will take heat generated from cartridge
heater. This experiment was developed by an MIT student in 2009, as part of an experiment to
characterize thermal efficiency. This experiment allows the students involved to have the
experience in creating their own thermoelectric power generator, which consists of 2 dissimilar
conductors, and a hot and cold junction. Allowing the students this experience will aid them in
the future, so that they can know how to properly create their own experiment set-ups to take
advantage of heat to be used for thermoelectric power generation.
The lab will involve some different calculations then the first lab. The main calculation
from the first lab involved the power generated over a period of time and then comparing it to the
total energy being released. This second lab focuses on using the given equations to determine
the figure of merit, the seebeck coefficient, and the electrical power being generated. The figure
of merit for thermoelectrics is a dimensionless number, generally below 1, that is a rating of how
compatible the 2 conductors are to allowing a current to pass through them, with a higher value
allowing a larger current to generally be created. The seebeck coeff, which is used in the
calculation of the figure of merit, which is the measure of the magnitude of an induced voltage,
which comes from a temperature difference across the material. The last calculation is an
electrical power output value, similar to the one in lab 1, but with a different formula.
This lab was originally designed to also take into account the heat transfer of the
apparatus that was being set-up. In this lab, however, we will not be focusing on that part of the
lab procedure, so some of the directions have been changed to reflect that. There will no longer
be a need for a container to house the entire system to provide a closed system for the heat

transfer calculations. While students are working through this laboratory experience they need to
be conscious of the calculations that they will be working through afterwards. Including
calculating the Seebeck coefficient as well as the thermoelectric figure of merit and the electric
power.
Procedure (inc. materials)
Pre-lab
1. Read “Characterizing the Thermal Efficiency of Thermoelectric Modules” By Samuel S.
Phillips
Materials:
2 copper plates
2 k-type thermocouples
Bismuth telluride thermoelectric module
Multimeter
Thermocouple reader
Potentiometer
Heat sink
Heat cartridge
Heavier copper weight
Lab Procedure:
1. A thermoelectric module is placed between 2 copper plates, one K type thermocouple in
the top plate and one in the bottom plate to measure the temperature difference

2. Calibrate the thermocouples against each other at ambient temperature (by subtracting the
difference)
3. Place the cartridge heater on top of the top copper plate
4. A cold water heat exchanger is to be used at the bottom of the apparatus as a heat sink for
the lab set-up
5. Calculate the heater power using the resistive power generation formula
6. Attach a digital multimeter and thermocouple reader to the set up.
7. As the set-up is heated, the transformer is increased in increments of 5V (allow the device
to reach thermal equilibrium before taking any measurements)
8. The temperature difference is shown by the thermocouple reader
9. To measure the power input/Seebeck coeff. Place the electrodes from the multimeter on
the terminal so that the hot face is the positive side
10. Use a potentiometer to measure the power being dissipated by the resistance
The design for the experiment should look similar to the figure below, except that figure
includes a chamber to insulate the apparatus and that is not required in this lab experiment.

Figure 4 Laboratory Set-up example (Phillips, 2009)
What to measure
The temperature difference of the hot and cold sides are to be recorded along the
experiment, and these values, along with the current generated at these values, are to be used to
create a graph, showing how the current increases with the temperature difference. (Phillips,
2009)
The Seebeck Coeff. Value is to be calculated using the equations below and the recorded
values from the experiment. This is to be plotted on a graph against the temperature difference,
in Kelvins. Create a polynomial fit and then compare this value to the published data for a
bismuth telluride module. (Phillips, 2009)
The figure of merit is to be calculated from the equation below. This value is to be
calculated, and then a graph is to be a plotted of the figure of merit against the temperature
difference in kelvins. Create a polynomial fit line for the graph, and compare it to the published
data for a bismuth telluride module. (Phillips, 2009)

Expected Calculations/Conclusions
Figure 5 Figure of Merit Equation (Phillips, 2009)
Z=figure of merit
S=Seebeck Coeff.
Tave=(Thot+Tcold)/2
R=total electrical resistivity
K=thermal conductivity
Figure 6 Electrical Power Equation (Phillips, 2009)
Qelec=electrical power
V=induced voltage
R=total electrical resistivity
Figure 7 Seebeck Coeff equation (Phillips, 2009)
S=Seebeck coeff.
V=induced voltage
∆T=temperature difference
If the experiment is successful, then the graphs listed above (the amperage v.s. ΔT, the figure
of merit v.s. ΔT, and the seebeck coeff v.s. ΔT) that the students create should look similar to the
graphs located in the pre-lab reading on Thermoelectric module thermal efficiency. These graphs
previously reviewed by the students can be used to compare and make certain that the
experiment is proceeding correctly and that the student has completed the set-up properly.
The thermoelectric figure of merit is an important function in the thermoelectric area. It is a
dimensionless figure that is used to characterize the efficiency with which a material can produce
thermoelectric power. Since these modules are heat engines, this figure is limited in its efficiency
by the Carnot efficiency.
Challenges/Future Work
As with any experiment there is more work to be done in the future. The experiments that the
students run through in this laboratory course are just designed to give the students enough
information to be able to set up these systems on their own. Students could then decide to take
these lessons a step further and work on larger scale experiments, such as the exhaust projects
described earlier.
Another issue comes from the fact that technological improvements in the field of
thermoelectric generation efficiency have been slow. Because of this there is not as large a focus
on using thermoelectrics as an alternative energy method so the efficiency of the modules that
are being used are low. This lack of depth in the field could negatively affect the student’s
perceptions of its use in the engineering world, because the parasitic applications of
thermoelectrics are still a valid source of energy, as evidenced by NASA’s use of these systems.
The ideal situation would be to allow students to work and create thermoelectric generators for
heat sources such as boilers, or engines. These are sources of constant heat output, so a
thermoelectric generator for the item would be able to continually produce a voltage from the
lost heat while the sources of heat are active.
A future lab could focus more on the figure of merit value by using multiple different
thermoelectric modules, each of which would have their own metal combination. These different
values would allow the students more experience in understanding that the figure of merit will
always occur, but that its value does not always need to be high. Any 2 different metals
combined in this way have the capability of producing an electrical output as long as the heat is
variable from one side to the other, but the figure of merit shows which ones are effective to use.
As students go through this experiment they would be able to see the figure of merit of very
common thermocouples such as bismuth telluride or lead telluride with other metal materials that
are chosen by the students.
Conclusions
The Laboratory experiences above can give the students an understanding of the
thermoelectric system. While the first laboratory experience exists mainly to give the students
some experience in the prevailing uses of thermoelectrics, that being parasitic energy absorption
from sources that would generally produce heat as a waste product. This energy is then reused
and converted into some actually useable, through a small module. This amount of energy
produced, though, will of course be small considering the small efficiency that is to be found in
your average module.
Whereas the first laboratory experiment exists so that students can learn the facts of how
thermoelectrics can work, the second lab experience exists to teach the students how to set up
their own thermoelectric generators. This experience, of creating their own electrical generator
from 2 conductors and a hot and cold junction on the wire, should provide enough insight into
the principles so that any student in the future who wishes to create a thermoelectric generator
will understand how to set one up. This ability to create a thermoelectric generator, and how to
influence values such as the seebeck coeff and the figure of merit by varying the temperature
values for a specific type of thermoelectric module, along with the knowledge gained from the
first lab on when to use thermoelectrics, should give students all the background that they need
to work in thermoelectrics for their future projects.
The labs were also designed to give the students a lab experience that would be novel in
some way, allowing for the students to be able to retain/remember the information that was
provided to them during the course of the lab experiences given. These labs, as a part of a larger
overarching lab experience of the different alternative energy methods, would be quite effective
at giving the students the background in the topic, as well as hopefully creating an interest in the
topics to encourage the students to pursue in future projects.
Bibliography Auparay, N. (2013). Room Temperature Seebeck Coefficient Measurement of Metals and
Semiconductors. Corvallis: Oregon State University.
Biolite. (n.d.). Biolite Camp Stove. Retrieved from www.Biolitestove.com:
http://www.biolitestove.com/campstove/camp-overview/features/
California Institute of Technolody. (n.d.). Thermoelectrics: Caltech Materials Science. Retrieved from
Brief History of Thermoelectrics:
http://www.thermoelectrics.caltech.edu/thermoelectrics/history.html
Peltier Effect. (n.d.). Retrieved from Encyclopedia Brittanica:
http://www.britannica.com/EBchecked/topic/449424/Peltier-effect
Phillips, S. S. (2009). Characterizing the Thermal Efficiency of Thermoelectric Modules. Boston: MIT.
Seebeck effect. (n.d.). Retrieved from Encyclopedia Brittanica:
http://www.britannica.com/EBchecked/topic/532358/Seebeck-effect

Thomson effect. (n.d.). Retrieved from Encyclopedia Brittanica:
http://www.britannica.com/EBchecked/topic/593136/Thomson-effect