Designing In-Vehicle Message Delivery with Manual and ...
27
Designing In-Vehicle Message Delivery with Manual and Highly Automated Driving NCDOT Project 2018-26 FHWA/NC/2018-26 August 2020 Jing Feng, PhD Department of Psychology North Carolina State University David Kaber, PhD Department of Industrial and Systems Engineering University of Florida Christopher Cunningham, MCE, PE Institute of Transportation Research and Education North Carolina State University
Transcript of Designing In-Vehicle Message Delivery with Manual and ...

Designing In-Vehicle Message Delivery
with Manual and Highly Automated
Driving
NCDOT Project 2018-26
FHWA/NC/2018-26
August 2020
Jing Feng, PhD
Department of Psychology
North Carolina State University
David Kaber, PhD
Department of Industrial and Systems Engineering
University of Florida
Christopher Cunningham, MCE, PE
Institute of Transportation Research and Education
North Carolina State University

North Carolina Department of Transportation Office of Research
Designing In-Vehicle Message Delivery
With Manual and Highly Automated Driving

Technical Report Documentation Page
1. Report No. FHWA/NC/2018-26
2. Government Accession No.
3. Recipient’s Catalog No.
4. Title and Subtitle
Designing In-Vehicle Message Delivery with Manual and Highly Automated
Driving
5. Report Date
August 13, 2020
6. Performing Organization Code
7. Author(s)
Jing Feng, David Kaber, Christopher Cunningham
8. Performing Organization Report No.
9. Performing Organization Name and Address
Department of Psychology, North Carolina State University
2310 Stinson Drive, Raleigh, NC 27695
Department of Industrial and Systems Engineering, University of Florida
303 Weil Hall, Gainesville, FL 32603
Institute of Transportation Research and Education, North Carolina State
University
909 Capability Dr, Raleigh, NC 27606
10. Work Unit No. (TRAIS)
11. Contract or Grant No.
12. Sponsoring Agency Name and Address
North Carolina Department of Transportation
Research and Development Unit
13. Type of Report and Period Covered
Final Report
104 Fayetteville Street
Raleigh, North Carolina 27601
July 1, 2017 to June 30, 2020
14. Sponsoring Agency Code
NCDOT Project 2018-26
Supplementary Notes:
16. Abstract
With the rapid development of sensor and computing technologies, personal vehicles are now capable of collecting
voluminous information on vehicle status and the road environment, as well as making proximity estimates and predicting
potential driving events. Recent advances in vehicle automation have envisioned future driving without the need for drivers to
attend to the road. With these trends in vehicle technology for the driving task, a shift in information communication is taking
place from driver-roadway interaction to driver and in-vehicle display interaction. This project examined the influence of in-
vehicle dynamic message displays of trip-related but non-safety critical information on driver visual behavior and driving
performance, as compared with conventional on-road guide or logo sign use, during manual and highly automated driving. To
achieve this goal, we first conducted a literature review on relevant topics. Two experiments were then conducted using the
NCSU advanced driving simulator examining how drivers respond to messages posing various information loads during manual
driving and automated driving. Our findings support the use of in-vehicle displays, especially in combination with on-road
signage.
17. Key Words
Data and Information Technology; Highways;
Operations and Traffic Management; Vehicles and
Equipment
18. Distribution Statement
19. Security Classif. (of this report)
Unclassified
20. Security Classif. (of this page)
Unclassified
21. No. of Pages
27
22. Price
Form DOT F 1700.7 (8-72) Reproduction of completed page authorized

DISCLAIMER The contents of this report reflect the views of the author(s) and not necessarily the
views of the University. The author(s) are responsible for the facts and the accuracy
of the data presented herein. The contents do not necessarily reflect the official views
or policies of either the North Carolina Department of Transportation or the Federal
Highway Administration at the time of publication. This report does not constitute a
standard, specification, or regulation.

North Carolina Department of Transportation Office of Research
Acknowledgement
This study was supported by a grant from the North Carolina Department of Transportation (NCDOT RP 2018-26). The
authors would like to thank the project Steering and Implementation Committee chaired by Joseph Hummer and
Renee Roach, for their insightful feedback on the project and the NCDOT Research and Development office for their
continued support.
Research Team: Steering and Implementation Committee:
Jing Feng Principal Investigator Renee Roach Chair
David Kaber Other Investigator Joe Hummer Co-Chair
Christopher Cunningham
Other Investigator
Kevin Lacy Member
Yulin Deng Graduate Student Lisa Penny Member
Stephen Cauffman Graduate Student Matthew Springer Member
Mei Lau Graduate Student Tyler Stanton Member
Yunmei Liu Graduate Student Chris Howard Member
Ebony Johnson Graduate Student
Kihyun Pyo Graduate Student

North Carolina Department of Transportation Office of Research
1
Executive Summary
With the rapid development of sensor and computing technologies, personal vehicles are now capable of collecting voluminous information on vehicle status and the road environment, as well as making proximity estimates and predicting potential driving events. Recent advances in vehicle automation have envisioned future driving without the need for drivers to attend to the road. With these trends in vehicle technology for the driving task, a shift in information communication is taking place from driver-roadway interaction to driver and in-vehicle display interaction.
Despite decades of research on in-vehicle notification display designs, the majority of studies have concentrated on presenting information related to the driving task, such as display of collision warnings and navigation information. There is little knowledge on how to effectively present information that is secondary to driving but important for a trip, such as notifications of a rest area and local businesses. This information is conventionally presented on a guide or logo sign. Furthermore, existing research on in-vehicle information presentation during highly automated driving has only focused on safety critical messages such collision warnings. These studies do not necessarily generalize to notifications that are trip-related but non-safety critical information, as driver attentional processing could differ depending on the degree of relevance of the notification to the driving task and under various levels of automation.
This project examined the influence of in-vehicle dynamic message displays of trip-related but non-safety critical information on driver visual behavior and driving performance, as compared with conventional on-road guide or logo sign use, during manual and highly automated driving. To achieve this goal, we first conducted a literature review on the following topics: (1) advances in content and update rates of in-vehicle trip-related messaging, (2) driver interaction with autonomous vehicle technology, (3) driver alertness and information processing, and (4) human factors issues in design of driver notification systems. The research team also performed two empirical studies using the NCSU advanced driving simulator, with the first experiment (E1) examining how drivers respond to messages posing various information loads during manual driving and the second (E2) investigating driver responses to messages when driving with high-level automation.
Our findings support the use of in-vehicle displays, especially in combination with on-road signage.
Under manual driving:
Driver reactions to road hazards were slower when logos were present but the number of collisions did not increase.
The use of in-vehicle displays produced better vehicle control with comparable workload and visual distraction, as compared to on-road signage.
Simultaneous in-vehicle and on-road displays showed a benefit on hazard negotiation (fewer collisions).
Some age differences were observed in driving and visual behaviors, but the evidence does not suggest any particular age-related safety concerns.
When driving with partial automation (level 2):
Simultaneous in-vehicle and on-road displays led to the highest logo identification accuracy and little impairment of hazard negotiation when logos were present.
Simultaneous in-vehicle and on-road displays led to shorter single off-road glance durations and mitigated the effect of information load on driver visual processing. Drivers made fewer but longer glances to on-road signage, as compared to in-vehicle displays.
Older drivers were less accurate in logo identification than young and middle-aged drivers. However, all three age groups showed comparable driving performance, glance durations, and number of glances.
When driving with conditional automation (level 3):
Compared to (SAE) Level 2, drivers under Level 3 automation were less accurate in logo identification, likely due to a reduced number of glances to on-road signs.

North Carolina Department of Transportation Office of Research
2
Table of Contents 1. Background ................................................................................................................................................................ 3
2. Research Questions ................................................................................................................................................... 4
3. Overview of Project Tasks ......................................................................................................................................... 4
4. Literature Review ...................................................................................................................................................... 4
5. Study 1 ....................................................................................................................................................................... 5
6. Study 2 ..................................................................................................................................................................... 13
7. Findings and Conclusions ........................................................................................................................................ 20
8. Recommendations................................................................................................................................................... 21
9. Implementation and Technology Transfer Plan ...................................................................................................... 21
10. References ........................................................................................................................................................... 21

North Carolina Department of Transportation Office of Research
3
1. Background
Conventional road signage communicates traffic laws and route information to drivers via visual signs in or near the right-of-way. This form of communication is one-way communication and some research has identified limited effectiveness in terms of information transfer (Castro, Horberry, & Tornay, 2004; Tiffin & Kissling, 2005). For example, driver awareness of a road sign can be easily affected by weather (e.g., fog vs. clear), lighting conditions (e.g., night vs. day), vegetation growth (e.g., tree branches covering a sign), and sign legibility (e.g., font size of a street name being too small to see). In addition, even when a driver is aware of the presence of a road sign, because they may not perceive an associated action as necessary, driver compliance with some road signs has been found to be surprisingly low. For example, a driver may ignore the need to stop at a stop sign when there is no traffic at an intersection. A comparison across studies conducted from 1931 to 1999 on driver compliance with conventional stop signs using traffic counts revealed a sharp decline in the percentage of drivers who made a full stop at stop signs (Noble, Dingus, & Doerzaph, 2016; p. 2775, Table XIV; full stop from 47% in 1931 to 1% in 1996, full violation from 42% in 1931 to 97% in 1996).
With the development of highly advanced automobile technologies, such as connected vehicles, in-vehicle information systems have been proposed as a potential alternative, or supplement, to road signage (e.g., Creaser & Manser, 2013; Lee, Gore, & Campbell, 1999; Toffin & Kissling, 2005; Zalacain, 2013). Compared to conventional signs, in-vehicle information has many advantages, such as being less susceptible to poor weather conditions and presenting messages that are tailored to traffic conditions (current and anticipatory) as well as driver information needs (e.g., more frequent display of lodging information in the evening). However, very little research has been conducted to guide the presentation of in-vehicle information. Lee et al. (1999) found that in-vehicle messages, such as warnings about “icy roadway” and “accident in lane”, were much more effective when presented as redundant information, in addition to road signs, than when presented alone. Caird et al. (2008) found that in-vehicle display of traffic light notifications 8 to 12 s before arriving at an intersection reduced the frequency of drivers running yellow lights. In Creaser and Manser (2013), drivers were provided with in-vehicle speed limit information. Although the displays did not lead to significant improvements in driving performance, drivers rated the in-vehicle information as favorable and helpful when following an unfamiliar route. It is important to note that this limited body of research has focused on in-vehicle display of safety-critical messages. Delivery of non-safety-critical, but trip-related, information (e.g., available local services) remains unexplored. Because our attention varies according to the relevance of a message to concurrent tasks (e.g., safely maneuvering a vehicle; Biehl et al., 2013; Egner & Hirsch, 2005), the findings on in-vehicle messages of safety-critical information may not generalize to messages of non-safety-critical information, such as that presented on guide and logo signs.
With high levels of automation becoming a reality in personal vehicles, the “driving” task for human drivers is being redefined in the context of this new technology. When driving with “full automation”, the driver is essentially a “passenger” in the vehicle. Although their responsibilities to vehicle safety may remain unchanged relative to manual control, the extent to which they are involved in vehicle state monitoring, action planning and execution vary according to the “level of automation”. A range of changes in driver attention and behavior are expected with increasing automation in vehicles. For example, higher levels of vehicle automation may lead to reduced vigilance of a driver to the road (Saxby et al., 2013), increased driver boredom and drowsiness (Miller et al., 2015; Schömig et al., 2015), more driver engagement in non-driving-related activities (Carsten et al., 2012; Merat et al., 2012), and overreliance on automation (Lee & See, 2004; Saffarian et al., 2012). Given lower levels of vigilance are associated with impaired perceptual, attentional, decision making and motor functions (Oken, Salinsky, & Elsas, 2006), how to deliver in-vehicle messages when a driver is potentially in a low vigilance state remains unclear. In addition, how characteristics of in-vehicle messages (e.g., the amount of information, update rate, and number of messages/graphics for simultaneous presentation) impact overall driver vigilance and, thus influence the effectiveness of driver interaction with a highly automated vehicle, is yet another issue that needs to be examined.

North Carolina Department of Transportation Office of Research
4
2. Research Questions
The specific research questions addressed by this project include the following:
When using in-vehicle messaging, can we effectively deliver more information about a business than is typically displayed on a road sign (Information load);
Does in-vehicle messaging enhance or detract from information on roadside signs (when presented simultaneously) (Information Source);
Are the effects of information load and source similar or different among younger, middle-aged and older drivers (Age);
Are any effects of information load and source, as well as driver age, different under different levels of automation (Level of Automation).
3. Overview of Project Tasks
The first objective of the proposed work was to develop a protocol for examining in-vehicle message delivery of trip-related information that has been conventionally presented on roadside signs (e.g., guide and logo signs). The protocol and associated apparatus were used for the two planned experiments but can also be used in future research on advanced strategies for in-vehicle message delivery. A second objective of the research was to identify the characteristics of effective message delivery (e.g., the amount of information, update rate, and number of logos for simultaneous presentation) during manual driving. A third objective of the work was to extend our understanding of effective message delivery of trip-related information in a vehicle utilizing high-level automation. The supporting literature review and empirical research activities comprised nine tasks, as illustrated in Figure 1 and described below:
Figure 1. Phases of research and task sequence.
4. Literature Review
We reviewed relevant research findings on advances in messaging content and update rates, driver interaction with high-level vehicle automation, driver alertness and information processing, and human factors issues in design of driver notification systems. Below is an abbreviated summary of and our full literature review manuscript. The manuscript is also attached as Appendix A.

North Carolina Department of Transportation Office of Research
5
4.1 Review summary
This literature review was motivated by the need to identify critical considerations in effective design and development of in-vehicle road signage presentation. The intent was to provide a detailed review and analysis of knowledge gaps to drive future research on the topic and development of in-vehicle interface designs for highly automated driving.
As automated vehicles become more prevalent on roadways, it is necessary to research driver behavior during interaction with these systems. With higher levels of vehicle automation, drivers can become less engaged with the road environment. For example, how to effectively deliver information that has been traditionally shown on roadside signage is a challenge for state departments of transportation.
In this review, we summarize current knowledge on three existing domains of research: (1) the effectiveness of traditional road signage, (2) vehicle automation and human factors considerations, and (3) current design guidelines of in-vehicle information presentation. Based on a review of existing empirical studies, we identify critical research gaps in the literature to guide the design of effective communication of road signage information in automated vehicles. We also propose a framework (see Figure 2) highlighting various factors that could determine the effectiveness of in-vehicle messaging. These factors include trait-based and state-based characteristics of the driver (e.g., attentional capability, experience with technology), characteristics of the driving environment (e.g., visibility) and vehicle automation (e.g., level of automation), as well as design parameters of the in-vehicle display (e.g., information content and display format).
4.2 Proposed conceptual framework of factors
Figure 2. A conceptual framework of factors that could influence the effectiveness of in-vehicle message delivery.
5. Study 1
5.1 Summary
This study investigated the effects of information source and load on driver signage logo identification, glance behavior, and vehicle control among younger, middle-aged and older drivers. Logos were presented on: (1) an on-road

North Carolina Department of Transportation Office of Research
6
sign panel, (2) an in-vehicle display, or (3) a combination of both, with half of the drives showing logos only, and the other half showing logos plus additional text.
The general findings support the use of in-vehicle displays, especially when it is presented simultaneously with on-road signs. In-vehicle displays did not lead to higher workload or more visual distraction than the on-road signage only, and simultaneous in-vehicle and on-road displays resulted in slightly better speed control. Findings also revealed minimal negative impacts from increased information load. Significant age group differences were found, including older drivers performing less well in sign identification and vehicle control. Older drivers also exhibited longer glances to logo information, suggesting design considerations should be made to accommodate specific driver characteristics.
The research team collected two sets of data: a first set with 36 participants and a second set of 18 participants (see Table 1). The two datasets differed slightly in terms of the data collection procedure. The first data set did not included observations on driver use of signage when exposed to roadway hazards. The second data set did include such observations. Findings from both datasets have been reported in a published HFES (Human Factors & Ergonomics Society) paper/presentation (Deng et al., 2019), a TRB (Transportation Research Board) abstract/poster (Deng et al., 2020), and an ICHMS (International Conference on Human-Machine Systems) paper (Deng et al., 2020). In addition, a journal manuscript has been prepared. All documents are attached in the appendix. Here, we focus on results from the second dataset.
Table 1. Participant demographic data for Datasets 1 and 2.
Participant Set 1 (n=36): Participant set 2 (n=18):
5.1 Method
5.2 Methods
5.2.1 Participants
Eighteen participants (9 males, 9 females; dataset 2) were recruited from three age groups, including: (1) younger drivers (19-22 years of age), middle-aged drivers (23-64 years of age) and older drivers (65 years of age or older).
5.2.2 Apparatus
Driving simulator. The experiment took place in a lab that was used exclusively for driving simulator research. The simulator is a high-fidelity, full motion system. The vehicle cab is a full-size model of a Hyundai vehicle cockpit. Participants interacted with the simulator through a full sized steering wheel and modular accelerator and brake pedal unit. The simulator includes eight surrounding monitors that provide a 365 degree field of view. The virtual driving environment was simulated using the Forum8 UC/WinRoad software (Tokyo, Japan). The simulator allowed for synchronized motion with the virtual vehicle (Figure 3a).
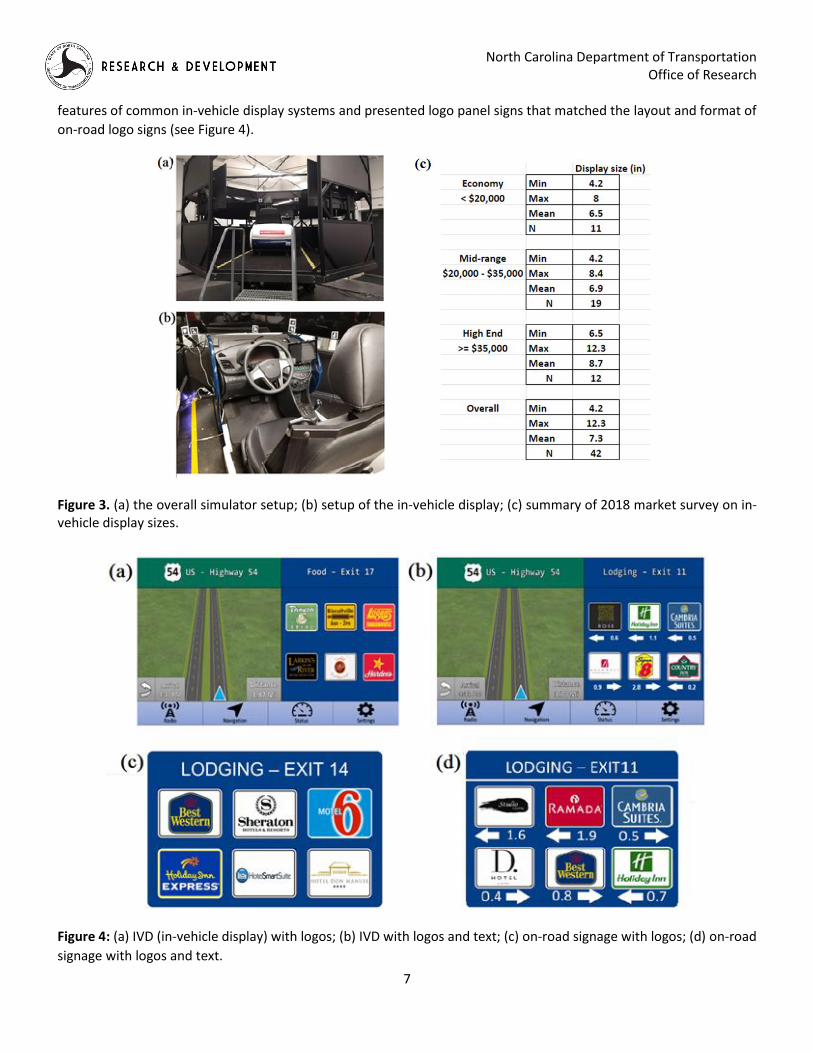
In-vehicle display. Based on a market survey done by the research team showing trends of in-vehicle display sizes
(Figure 3c), a 10.5-inch tablet computer was used as an in-vehicle display (Figure 3b). The size of the display was
determined based on a survey of commercial vehicles as well as the assumption that the size of in-vehicle displays will
continue to increase in the future. The tablet was integrated with the driving simulation system. It incorporated basic
North Carolina Department of Transportation Office of Research
7
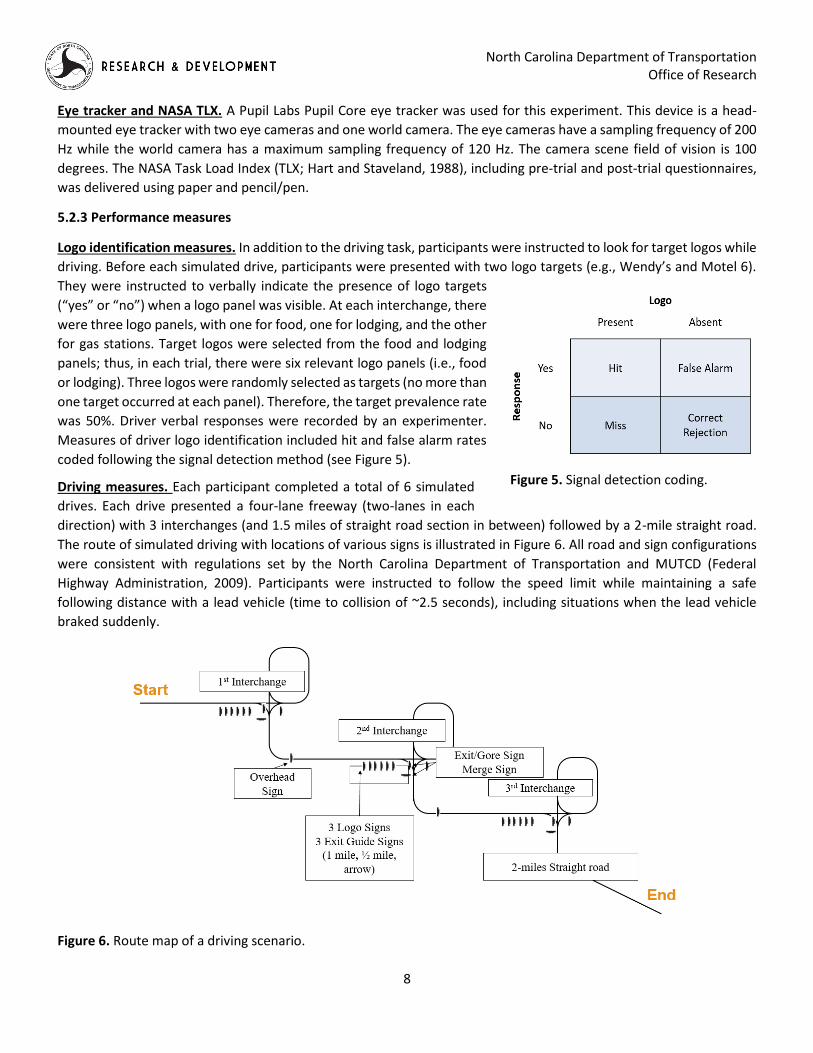
features of common in-vehicle display systems and presented logo panel signs that matched the layout and format of
on-road logo signs (see Figure 4).
Figure 3. (a) the overall simulator setup; (b) setup of the in-vehicle display; (c) summary of 2018 market survey on in-vehicle display sizes.
Figure 4: (a) IVD (in-vehicle display) with logos; (b) IVD with logos and text; (c) on-road signage with logos; (d) on-road
signage with logos and text.
North Carolina Department of Transportation Office of Research
8
Eye tracker and NASA TLX. A Pupil Labs Pupil Core eye tracker was used for this experiment. This device is a head-
mounted eye tracker with two eye cameras and one world camera. The eye cameras have a sampling frequency of 200
Hz while the world camera has a maximum sampling frequency of 120 Hz. The camera scene field of vision is 100
degrees. The NASA Task Load Index (TLX; Hart and Staveland, 1988), including pre-trial and post-trial questionnaires,
was delivered using paper and pencil/pen.
5.2.3 Performance measures
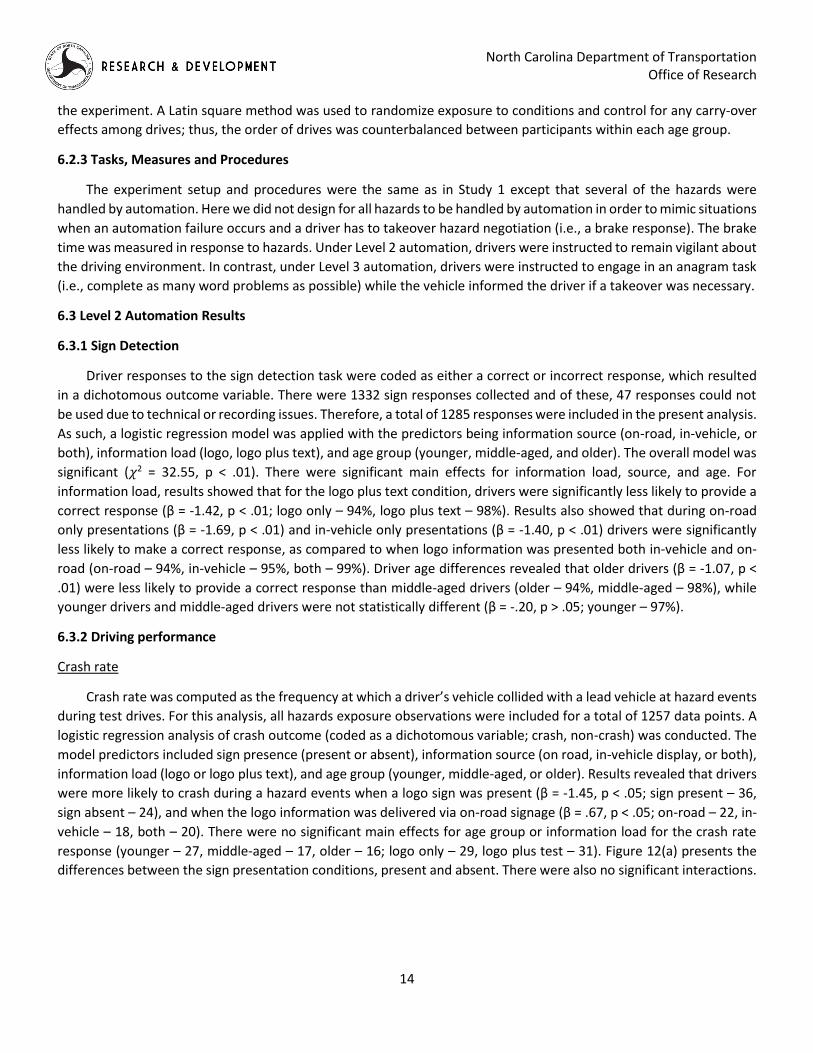
Logo identification measures. In addition to the driving task, participants were instructed to look for target logos while
driving. Before each simulated drive, participants were presented with two logo targets (e.g., Wendy’s and Motel 6).
They were instructed to verbally indicate the presence of logo targets
(“yes” or “no”) when a logo panel was visible. At each interchange, there
were three logo panels, with one for food, one for lodging, and the other
for gas stations. Target logos were selected from the food and lodging
panels; thus, in each trial, there were six relevant logo panels (i.e., food
or lodging). Three logos were randomly selected as targets (no more than
one target occurred at each panel). Therefore, the target prevalence rate
was 50%. Driver verbal responses were recorded by an experimenter.
Measures of driver logo identification included hit and false alarm rates
coded following the signal detection method (see Figure 5).
Driving measures. Each participant completed a total of 6 simulated
drives. Each drive presented a four-lane freeway (two-lanes in each
direction) with 3 interchanges (and 1.5 miles of straight road section in between) followed by a 2-mile straight road.
The route of simulated driving with locations of various signs is illustrated in Figure 6. All road and sign configurations
were consistent with regulations set by the North Carolina Department of Transportation and MUTCD (Federal
Highway Administration, 2009). Participants were instructed to follow the speed limit while maintaining a safe
following distance with a lead vehicle (time to collision of ~2.5 seconds), including situations when the lead vehicle
braked suddenly.
Figure 6. Route map of a driving scenario.
Figure 5. Signal detection coding.

North Carolina Department of Transportation Office of Research
9
Glance behavior measures. Two areas of visual interest (AOIs) were specified for the study, including: the in-vehicle
display and the on-road signage panel. Glance duration was defined as the time between one entry of gaze point to
the following exit of gaze point from a specific AOI during an observation period (the period when a logo signs were
visible to drivers). The longest single glance duration was computed for each observation period within each drive for
every participant. The longest single glance duration was used to assess visual demands when drivers processed
signage information.
Workload measure. The NASA TLX (Hart & Staveland, 1988) was used to measure driver workload. Participants rated
perceived workload on a 100-point scale for six different demand components, including: mental demand, physical
demand, temporal demand, performance, effort, and frustration. At the beginning of the experiment participants
completed pairwise comparisons of these demand components to obtain rankings. Participants completed ratings after
each trial. The TLX composite score was computed as a rank-weighted sum of all ratings.
5.2.4 Procedure
Participants were given sufficient practice allowing them to become familiar with the simulator and were instructed to
drive safely by maintaining a proper lane position, adhering to the posted speed limit (65 mph), as well as being vigilant
at all times and responding properly whenever a road hazard occurred. To increase task fidelity, drivers were presented
a scenario in which they were travelling to a particular destination. Prior to each simulated drive, a target destination
was identified and drivers were required to take the exit for the target destination. Their responses (through action)
were recorded by experimenters. Driving measures included vehicle control performance such as speed and lane
deviations and driver hazard negotiation performance, including crash rate and brake reaction time. A diagram of the
procedure is provided in Figure 7.
Figure 7. Procedure of Study 1.

North Carolina Department of Transportation Office of Research
10
5.3 Results
5.3.1 Logo identification
Hits
A Chi-square analysis was conducted to assess driver target response accuracy based on “hit” responses. A significant age effect was identified (Pearson Chi-square=9.855, p=0.0072), which indicated that older drivers produced fewer hits than younger and middle-aged groups: younger - 95.83%, middle-aged - 97.22%, older - 84.72%. There were no significant differences among information sources (Pearson Chi-square=0.945, p=0.6234): in-vehicle - 90.28%, on-road - 94.44%, both - 93.06%. There was also no significant effect of information load (Pearson Chi-square=0.443, p=0.5450): logo only - 89.91%, logo plus text - 93.37%.
False alarms
A Chi-square analysis was also performed on false alarm rates. Driver age was found to be significant (Pearson Chi-square=7.821, p=0.02). Older drivers (9.09%) produced more false alarms than younger (0%) and middle-aged (2.86%) groups. In-vehicle displays were found to produce more false alarms than on road signs or the combination of on-road and in-vehicle displays (Pearson Chi-square=7.23, p=0.0269): in-vehicle - 8.7%, on-road - 0%, both - 2.94%. There was no significant effect of information load (Pearson Chi-square=2.43, p=0.119): logo - 4.76%, logo plus text - 2.97%.
5.3.2 Visual behavior
Max single glance durations
To compare the visual demands of various message formats (in-vehicle vs. on-road vs. both) and information load (logo vs. logo plus text) across the three age groups, the longest single glance duration was captured for each combination of conditions for every participant. Therefore, in drives with only the in-vehicle display presentation or the on-road signage presentation, the longest glance duration was determined for either area of interest (AOI). In drives with simultaneous in-vehicle and on-road displays, the longest glance duration was identified among all durations for both AOIs. An ANOVA procedure was performed to examine the effects of information source, information load, age, and their interactions. The data did not meet the ANOVA normality assumption; thus, a rank transformation was performed. Driver age was found to have significant effect on gaze duration (F(2,339) = 5.2540, p = 0.00057, 1-β = 0.8314). Old drivers exhibited a significantly longer gaze duration than young drivers (see Figure 9).
The information source was not significant but its interaction with age (F(2,339) = 2.8138, p = 0.0256, 1-β = 0.7658) was significant. It appeared that older drivers exhibited longer glances when using on-road signage, as compared with in-vehicle display or simultaneous presentations. Middle-aged drivers exhibited the shortest gaze durations while using on road signage. Younger drivers’ gaze duration was not significantly affected by information source. Information load was also found to be significant (F(1,339) = 5.7316, p = 0.0173, 1-β = 0.6652). Signage with logo and text information produced longer glance durations than logo only (see Figure 9).
Figure 8. Significant effects of age and
information source on logo identification.

North Carolina Department of Transportation Office of Research
11
Figure 9. The three age groups differed significantly on max single glance durations. A higher information load also led to longer max gaze durations.
The second analysis investigated driver visual engagement with either information source (in-vehicle or on-road signage) when both are available. This analysis only included drives in which both in-vehicle and on-road signage were displayed simultaneously. An ANOVA procedure was performed to examine the effects of information source (in-vehicle vs. on-road), information load (logo vs. logo plus text), age group (younger vs. mid-aged vs. older), and their interactions. The data again did not meet the ANOVA normality assumption; thus, a rank transformation was performed. There was a significant effect of information source (F(1,240)= 24.5519, p <0.0001, 1-β = 0.9985). Drivers had longer single glance durations to the on-road signage AOI than the in-vehicle display AOI. The interaction of age group and information source was also significant (F(2,240)= 7.0354, p =0.0011, 1-β = 0.9257). Glances durations for the in-vehicle display AOI and on-road signage panels were comparable for younger drivers and older drivers, while middle-aged drivers had longer glance durations to the on-road signage AOI than the in-vehicle display AOI.
Figure 10. With simultaneous in-vehicle and on-road displays, maximum single glance durations were longer for on-road signage. Older drivers showed more balanced maximum glance durations to both sources.

North Carolina Department of Transportation Office of Research
12
5.3.3 Vehicle control
Vehicle control performance was examined in terms of speed and lane deviation. First, driving performance during hazard-free sign observation periods was inspected with a total of 480 observations. As previously stated, participants were instructed to drive in the same lane during sign observation and to maintain 65 mph throughout the experiment, aside from hazard encounters. Performance deviations from instructions were considered as indicators of performance degradation or hazard mitigation techniques. There was a total of 205 observations on hazard responses. However, effect sizes suggested insufficient numbers of participants and observations for analysis of the hazard response measures; thus, only vehicle control performance measures are reported here.
Speed Deviation
Speed deviation was defined as the absolute value of vehicle speed deviations from the posted 65 mph limit. A log transformation was applied to the data set to meet the ANOVA test assumptions. Both main effects of age group (F(1,458) = 18.67, p <0.0001, 1-β = 0.9999) and information source (F(1,458) = 3.44, p = 0.0329, 1-β = 0.6444) were found to be significant. Further application of Tukey’s HSD post-hoc test on age group effect revealed that older drivers exhibited greater speed deviations than younger and middle-aged counterparts. As for the information source effect, an application of Dunnett’s test revealed the simultaneous presentation of road signs to produce lower speed deviations than the in-vehicle display or on-road signs, alone. The remaining main effect of presentation format was not significant; however, its interaction with information source was found to be significant in the statistical model. In particular, Tukey’s post-hoc test revealed the logo plus text format to produce higher speed deviations with the in-vehicle display and the lowest speed deviation (greater vehicle control) was achieved by presenting logos plus text information with both road signs and in-vehicle displays.
Lane Deviation
Lane deviation was defined in this experiment as the absolute value of deviations from the lane center. The only significant factor found in this analysis was a main effect of age group (F(1,458) = 26.32, p <0.0001, 1-β = 1.0) where elderly drivers were found to exhibit significantly higher lane deviations than other driver groups. All other factors in the model were found to be insignificant.
Figure 11. Simultaneous presentation of in-vehicle displays and on-road signs led to lower speed deviations. Older drivers exhibited greater speed and lane deviations than the other drivers.

North Carolina Department of Transportation Office of Research
13
5.3.4 Workload
For the NASA TLX composite score, a mixed-model ANOVA was significant (𝑟2=0.857, p < 0.0001). The untransformed
response data satisfied parametric test assumptions. There was a main effect of age group (F[2, 37] = 11.249, p <
0.0001,1-β = 0.990): younger - 33.0, middle-aged - 41.2, and older - 40.9. There were significant individual differences
within age group, F[15, 37] = 24.014, p < 0.001, 1-β = 1.00. and an effect of test trial (F[5, 37] = 3.820, p = 0.004,1-β =
0.921) was also present. Post-hoc tests (Student-Newman-Keuls) revealed the younger age group to perceive workload
to be significantly less than the middle and older age groups. Post-hoc tests also revealed that the composite TLX score
for Trial 1 was significantly higher than Trials 3-6, suggesting that driver time-on-task played a role in the workload
rating.
6 Study 2
6.1 Summary
This study investigated the presentation of service logo information under partially automated driving. Drivers
completed simulated drives with partial vehicle automation during which they had to detect target logo signs and react
to hazards by taking over vehicle control when needed. Driver performance was measured in terms of sign detection
rate, crash rate, and hazard response time. A number of factors, including sign information source, sign information
load, and driver age group, were investigated. In general, our findings support the delivery of service logo information
via in-vehicle displays under partially automated driving, especially when the in-vehicle display occurred
simultaneously with on-road signage. Under this presentation condition, drivers were most accurate in detecting target
logo signs, and showed little impairment from processing sign information as a secondary task when negotiating a
hazard. Simultaneous presentation of in-vehicle displays and on-road signage also mitigated negative impacts of higher
information load on total and single glance durations. On-road only presentation led to longer glance durations as well
as a greater number of long (> 2s) glances.
6.2 Method
6.2.1 Participants
Thirty-six (36) participants were recruited from the area around a medium-sized southern city to participate in
this study. The sample was balanced across age and gender. The three age groups were younger (18-23 years), middle-
aged (24-64 years) and older (65 and above years) drivers. We recruited participants via online advertisements and
visits to retirement communities. Each driver was compensated $20 per hour of participation. Every participant had a
valid driver’s license and normal or corrected-to-normal vision and was driving regularly at the time of participation.
6.2.2 Design
There were a total of eight simulated drives: six under (SAE) Level 2 automation and two under Level 3 automation.
For the Level 2 automated driving scenarios, the experiment followed a 2×3×3 mixed factorial design (information
source × load × age). The two Level 3 drives presented logos only via in-vehicle display or on-road sign, which were
contrasted with two other matched drives under Level 2 automation, forming a 2x2x3 design (information source x
level of automation x age).There were three age groups: younger, middle-aged, and older. Information source and load
were within-subject manipulations. Information source had three levels (on-road vs. in-vehicle vs. both) and
information load had two levels (logo vs. logo plus text), yielding a total of six combinations of conditions. There was
one simulated drive for each combination of conditions. Every participant completed a total of six simulated drives for
North Carolina Department of Transportation Office of Research
14
the experiment. A Latin square method was used to randomize exposure to conditions and control for any carry-over
effects among drives; thus, the order of drives was counterbalanced between participants within each age group.
6.2.3 Tasks, Measures and Procedures
The experiment setup and procedures were the same as in Study 1 except that several of the hazards were
handled by automation. Here we did not design for all hazards to be handled by automation in order to mimic situations
when an automation failure occurs and a driver has to takeover hazard negotiation (i.e., a brake response). The brake
time was measured in response to hazards. Under Level 2 automation, drivers were instructed to remain vigilant about
the driving environment. In contrast, under Level 3 automation, drivers were instructed to engage in an anagram task
(i.e., complete as many word problems as possible) while the vehicle informed the driver if a takeover was necessary.
6.3 Level 2 Automation Results
6.3.1 Sign Detection
Driver responses to the sign detection task were coded as either a correct or incorrect response, which resulted
in a dichotomous outcome variable. There were 1332 sign responses collected and of these, 47 responses could not
be used due to technical or recording issues. Therefore, a total of 1285 responses were included in the present analysis.
As such, a logistic regression model was applied with the predictors being information source (on-road, in-vehicle, or
both), information load (logo, logo plus text), and age group (younger, middle-aged, and older). The overall model was
significant (𝜒2 = 32.55, p < .01). There were significant main effects for information load, source, and age. For
information load, results showed that for the logo plus text condition, drivers were significantly less likely to provide a
correct response (β = -1.42, p < .01; logo only – 94%, logo plus text – 98%). Results also showed that during on-road
only presentations (β = -1.69, p < .01) and in-vehicle only presentations (β = -1.40, p < .01) drivers were significantly
less likely to make a correct response, as compared to when logo information was presented both in-vehicle and on-
road (on-road – 94%, in-vehicle – 95%, both – 99%). Driver age differences revealed that older drivers (β = -1.07, p <
.01) were less likely to provide a correct response than middle-aged drivers (older – 94%, middle-aged – 98%), while
younger drivers and middle-aged drivers were not statistically different (β = -.20, p > .05; younger – 97%).
6.3.2 Driving performance
Crash rate
Crash rate was computed as the frequency at which a driver’s vehicle collided with a lead vehicle at hazard events
during test drives. For this analysis, all hazards exposure observations were included for a total of 1257 data points. A
logistic regression analysis of crash outcome (coded as a dichotomous variable; crash, non-crash) was conducted. The
model predictors included sign presence (present or absent), information source (on road, in-vehicle display, or both),
information load (logo or logo plus text), and age group (younger, middle-aged, or older). Results revealed that drivers
were more likely to crash during a hazard events when a logo sign was present (β = -1.45, p < .05; sign present – 36,
sign absent – 24), and when the logo information was delivered via on-road signage (β = .67, p < .05; on-road – 22, in-
vehicle – 18, both – 20). There were no significant main effects for age group or information load for the crash rate
response (younger – 27, middle-aged – 17, older – 16; logo only – 29, logo plus test – 31). Figure 12(a) presents the
differences between the sign presentation conditions, present and absent. There were also no significant interactions.

North Carolina Department of Transportation Office of Research
15
Hazard Response Time
Driver braking response time, was computed as the difference in time between when a hazard event began and when the participant manually decelerated to a rate equal to or more than -3.048 m/s2. This deceleration criterion has been used in prior studies involving braking response time (Institute of Transportation Engineers, 2016). For this analysis, only those hazards for which drivers exhibited a manual response were analyzed. Observations were categorized based on whether a crash had occurred or not. Cook’s D was then used to identify outliers in the dataset. Two observations were removed based on the Cook’s D criterion. This process resulted in a total 1208 observations where the automation failed during a hazard exposure.
A mixed factorial ANOVA was conducted to determine differences in braking response time for the sign presentation condition (present, absent), information source (on-road, in-vehicle, both), information load (logo, logo plus text), and age group (younger, middle-aged, older). Results revealed significant main effects for sign presence [F(1,1172) =25.17 p < .05] and information source [F(2,1126) = 3.03, p < .05]. The main effects for information load and age group were not significant (logo only – 2.30s, logo plus test – 2.27s; younger – 2.34s, middle-aged – 2.19, older – 2.31). A Tukey’s HSD post-hoc test was conducted to explore the significant effects of sign presence and information source. Results revealed that drivers took longer to takeover control (i.e., a longer braking response time) when logo signs were present (M = 2.43 s) than when there was no sign (present – 2.43s, absent – 2.21s). For information source, driver hazard response time was slowest when logo information was presented only on the in-vehicle display. Drivers were slightly faster with on-road information presentation, and fastest when information was presented on both in-vehicle and on-road displays (on-road – 2.30s, in-vehicle – 2.45s, both – 2.13s).
Aside from the main effects, there was a significant two-way interaction between sign presence and information source [F(2, 1172) = 3.44, p < .05] such that when a logo sign was present, on-road and in-vehicle presentation resulted in the slowest response times (Figure 12(b)). When a logo sign was present and delivered via both the in-vehicle display and on-road signage, the braking response times were similar to when no-sign was present.
(a) number of crashes (b) brake response time
Figure 12. Drivers crashed more when logos were present. Simultaneous presentation mitigated the effect of sign
presence on the number of crashes and brake response time.

North Carolina Department of Transportation Office of Research
16
6.3.3 Driver Glance Behavior
As noted above, Areas of Interest (AOIs) were specified for the driving simulation environment, including: in-vehicle
display, and on-road sign. Beginning and end times for glances to each AOI were manually coded through the analysis
of Pupil Lab videos showing gaze fixations overlaid on the simulated driving scene. Observation periods began as
soon as logo information was perceptible in foveal vision and ended when the information was no longer viewable.
Two student researchers were responsible for coding all videos. Multiple training sessions were completed with both
researchers before the coding task was completed.
A total of 1221 data points were included in the present analysis. Given that there was some loss of eye tracking data
due to technical issues during the experiment with a number of participants, we analyzed glance data via Mixed
Effect Models (SPSS MIXED procedure) instead of the conventional Repeated Measures ANOVA. Each outcome
variable was modeled with the fixed effects of age group, information source, information load, and their 2-way and
3-way interactions (full factorial), as well as random slopes for participants.
Total Glance Duration
The analysis revealed no significant effect of information source/display location (in-vehicle – 1859ms, on-road –
2010ms, both – 2167ms), F(2, 52.737) = 1.180, p = .315. However, the effect of information load approached
significance, F(1, 23.222) = 3.559, p = .072, with a tendency for participants to spend greater time viewing a sign
when there was text accompanying logos (logo – 1867ms, logo plus text – 2158ms). There was a significant
interaction between information load and source, F(2, 435.709) = 3.109, p = .046, with the higher load (logo+text)
more consistently led to greater viewing time of a sign.
The three age groups exhibited similar total glance duration (younger – 1969ms, mid-aged – 2103ms, older –
1964ms), F(2, 85.291) = .192, p = .826. No interaction was found between age and other factors. There was a
significant 3-way interaction, age x source x load, F(4, 434.760) = 3.468, p = .008. As shown in Figure 13, increasing
load generally led to greater view time except when mid-aged drivers used only the in-vehicle display and when older
drivers used both the in-vehicle display and on-road signs.
Figure 13. Trend of longer glance durations for logo plus text vs. logo only. Trend varied among sources with smaller
differences when both displays were available. Simultaneous in-vehicle and on-road displays may mitigate negative
impacts of higher information load (logo plus text), particularly for older drivers.
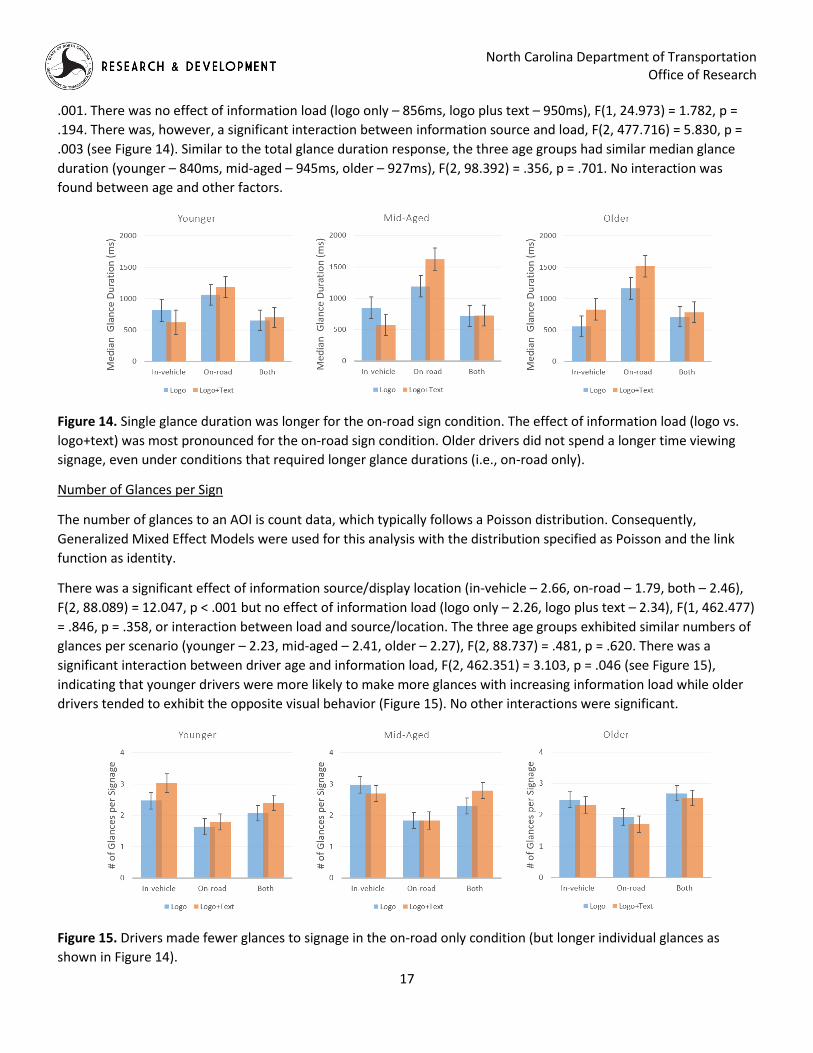
Median Glance Duration
In this study, median glance duration was used to estimate single glance duration. There was a significant effect of
information source/display location (in-vehicle – 708ms, on-road – 1289ms, both – 715ms), F(2, 60.803) = 15.635, p <
North Carolina Department of Transportation Office of Research
17
.001. There was no effect of information load (logo only – 856ms, logo plus text – 950ms), F(1, 24.973) = 1.782, p =
.194. There was, however, a significant interaction between information source and load, F(2, 477.716) = 5.830, p =
.003 (see Figure 14). Similar to the total glance duration response, the three age groups had similar median glance
duration (younger – 840ms, mid-aged – 945ms, older – 927ms), F(2, 98.392) = .356, p = .701. No interaction was
found between age and other factors.
Figure 14. Single glance duration was longer for the on-road sign condition. The effect of information load (logo vs.
logo+text) was most pronounced for the on-road sign condition. Older drivers did not spend a longer time viewing
signage, even under conditions that required longer glance durations (i.e., on-road only).
Number of Glances per Sign
The number of glances to an AOI is count data, which typically follows a Poisson distribution. Consequently,
Generalized Mixed Effect Models were used for this analysis with the distribution specified as Poisson and the link
function as identity.
There was a significant effect of information source/display location (in-vehicle – 2.66, on-road – 1.79, both – 2.46),
F(2, 88.089) = 12.047, p < .001 but no effect of information load (logo only – 2.26, logo plus text – 2.34), F(1, 462.477)
= .846, p = .358, or interaction between load and source/location. The three age groups exhibited similar numbers of
glances per scenario (younger – 2.23, mid-aged – 2.41, older – 2.27), F(2, 88.737) = .481, p = .620. There was a
significant interaction between driver age and information load, F(2, 462.351) = 3.103, p = .046 (see Figure 15),
indicating that younger drivers were more likely to make more glances with increasing information load while older
drivers tended to exhibit the opposite visual behavior (Figure 15). No other interactions were significant.
Figure 15. Drivers made fewer glances to signage in the on-road only condition (but longer individual glances as
shown in Figure 14).

North Carolina Department of Transportation Office of Research
18
Number of Long Glances (>2s) per Sign
We also calculated the number of long glances (duration > 2s) for each AOI, as this type of glance is particularly
threatening to driving safety (NHTSA, 2013). The effect of information source/location approached significance, F(2,
44.317) = 2.900, p = .065, revealing in-vehicle displays to demand fewer long glances (.166) than on-road signage
(2.89) or simultaneous presentation of both in-vehicle and on-road displays (.263). There was no effect of
information load on the occurrence of long glances (logo – .212, logo plus text – .267), F(1,18.896) = 2.190, p = .155,
but there was a significant interaction between information source/display location and information load, F(2,
506.456) = 4.009, p = .019.
The three age groups exhibited a similar overall frequency of long glances (younger – .222, mid-aged – .261, older –
.234), F(2, 89.330) = .214, p = .808, and there were no 2-way interactions between age group and other experimental
factors. The 3-way interaction of age x load x source/location was, however, significant, F(4, 505.455) = 3.199, p =
.019 (see Figure 16).
Figure 16. The number of glances was the lowest for the in-vehicle display condition and did not differ significantly
among the age groups.
6.4 Results on Level 2 vs. Level 3 Automated Driving
In this section, we address comparison of the SAE Level 2 and Level 3 automated driving behaviors observed during
the experiment. As in the previous analysis, driver target sign detection, vehicle control performance, and visual
behavior were analyzed.
6.4.1 Sign Detection
Sign detection was defined as the driver’s ability to correctly identify whether a target sign was present or absent
during each presentation of blue sign as part of a simulated drive. For this analysis, Level 2 automation scenarios
were compared to Level 3. In order to conduct a balanced comparison, data points from trials in which the
information load was logo + text, or the information source was both on-road and in-vehicle, were omitted from the
analysis. Consequently, we only made comparison of the use of automation when the information load was logo only
and the information source was either in-vehicle or on-road. As such, there were 848 sign observations for analysis. A
logistic regression model was applied to the dataset with the predictors being source (on-road or in-vehicle), age
group (older, middle-aged, or younger), and level of automation (Level 2 or Level 3). The overall model was
significant (𝜒2 = 19.57, p < .01). There was a significant main effect for age group, such that older drivers were less
likely to provide a correct sign responses than middle-aged drivers (β = -.91, p < .01; older = 84%, middle-aged =
93%). Younger drivers were not significantly different from middle-aged drivers (β = -.38, p = .21; younger = 90%).
North Carolina Department of Transportation Office of Research
19
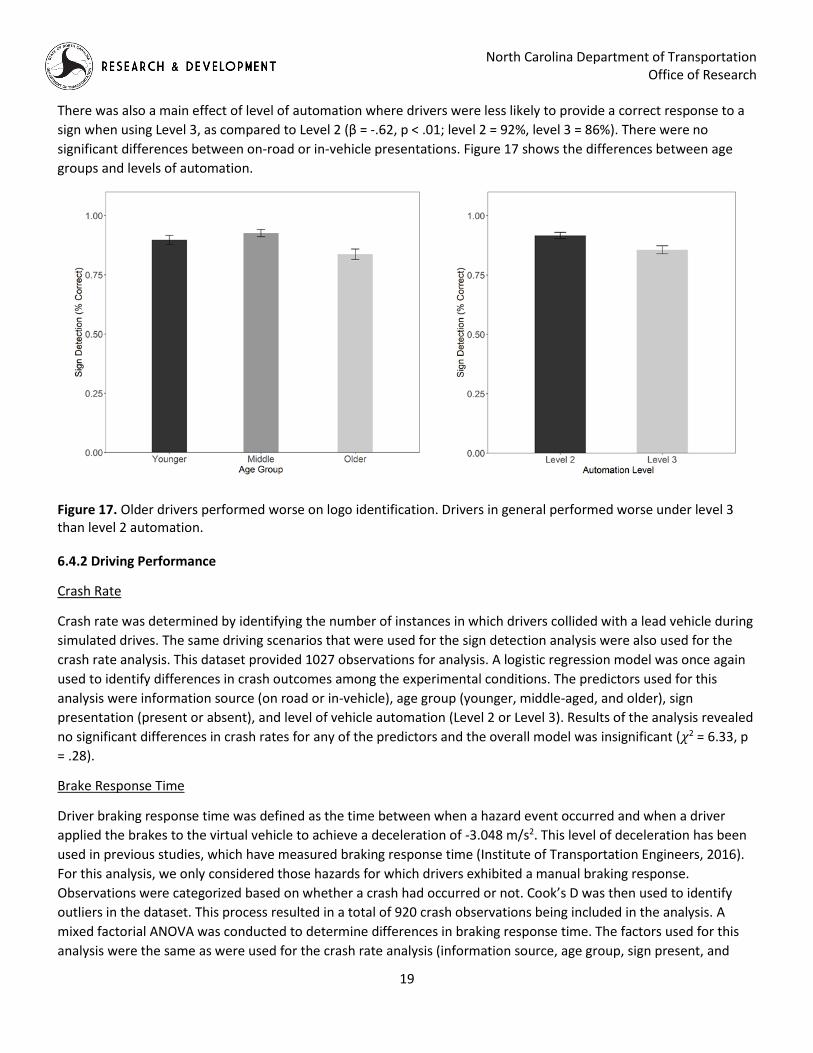
There was also a main effect of level of automation where drivers were less likely to provide a correct response to a
sign when using Level 3, as compared to Level 2 (β = -.62, p < .01; level 2 = 92%, level 3 = 86%). There were no
significant differences between on-road or in-vehicle presentations. Figure 17 shows the differences between age
groups and levels of automation.
Figure 17. Older drivers performed worse on logo identification. Drivers in general performed worse under level 3 than level 2 automation.
6.4.2 Driving Performance
Crash Rate
Crash rate was determined by identifying the number of instances in which drivers collided with a lead vehicle during
simulated drives. The same driving scenarios that were used for the sign detection analysis were also used for the
crash rate analysis. This dataset provided 1027 observations for analysis. A logistic regression model was once again
used to identify differences in crash outcomes among the experimental conditions. The predictors used for this
analysis were information source (on road or in-vehicle), age group (younger, middle-aged, and older), sign
presentation (present or absent), and level of vehicle automation (Level 2 or Level 3). Results of the analysis revealed
no significant differences in crash rates for any of the predictors and the overall model was insignificant (𝜒2 = 6.33, p
= .28).
Brake Response Time
Driver braking response time was defined as the time between when a hazard event occurred and when a driver
applied the brakes to the virtual vehicle to achieve a deceleration of -3.048 m/s2. This level of deceleration has been
used in previous studies, which have measured braking response time (Institute of Transportation Engineers, 2016).
For this analysis, we only considered those hazards for which drivers exhibited a manual braking response.
Observations were categorized based on whether a crash had occurred or not. Cook’s D was then used to identify
outliers in the dataset. This process resulted in a total of 920 crash observations being included in the analysis. A
mixed factorial ANOVA was conducted to determine differences in braking response time. The factors used for this
analysis were the same as were used for the crash rate analysis (information source, age group, sign present, and

North Carolina Department of Transportation Office of Research
20
automation level). The results of the analysis determined that there were no significant differences in braking
response time between any of the factors included in the model.
6.4.3 Glance behavior
This analysis involved comparison of driver total and median glance durations as well as the number of glances and
long glances (> 2s) to an AOI. A total of 691 data points were included in this analysis. The SPSS MIXED procedure was
used to analyze these response measures with fixed effects including age group, information source/display location,
information load, and all 2-way and 3-way interactions, as well as random slopes for participants.
There was a significant effect of level of automation on the number of glances, F(1, 31.137) = 6.362, p = .017. There
was also some trend of total glance duration but it did not reach significance, F(1, 39.672) = 2.169, p = .149 (Figure
18). There was no effect of level of automation on median glance duration, F(1,32.020) = .060, p = .808 or the
number of long glances, F(1, 47.480) = .146, p = .704.
Figure 28. Drivers made fewer glances to signage information under level 3 automation.
7 Findings and Conclusions
The purpose of this study was to investigate the presentation of non-safety-related sign information, specifically service
logo signs, on driver performance during manual and automated driving. Driver performance in sign detection and
hazard responses were examined along with visual behaviors.
Findings suggest a dual-task cost on hazard response time when drivers were required to negotiate a hazard event in
the presence of target sign detection. Inflated hazard response time appeared to occur as a result of general driver
distraction in processing logo sign information. However, the in-vehicle display, as well as simultaneous presentation
condition (both in-vehicle and on-road displays), seemed to mitigate the distraction effect. In contrast, on-road
presentation conditions led to the most crashes, longer hazard response times, longer single glance durations, and
more long glances (> 2s).
Participants self-reported acceptance of on-road signs and there may have been some bias in responses due to driver
familiarity with this particular type of information source. Nonetheless, driver vehicle control performance suggested
a benefit of in-vehicle displays especially when coupled with the on-road signs. Information load, including logos vs.
logos plus text, had modest to no effects on various outcome measures, likely due to the small difference in the amount
of information presented in each condition.

North Carolina Department of Transportation Office of Research
21
Older drivers did not demonstrate longer gaze durations to information displays when using Level 2 or Level 3 vehicle
automation, possibly due to a lack of trust in the technology. Older drivers appeared to pay more attention to the road
than the other two age groups. Consequently, few age-related differences were observed in driving performance. Older
driver poor performance in logo identification also suggested that they may have prioritized the driving task over the
sign detection, as compared to the other age groups.
8 Recommendations
Our general findings support the use of in-vehicle displays, especially when logo information was presented
simultaneously via in-vehicle display and on-road signs. Simultaneous presentation, as compared to the other two
conditions (i.e., in-vehicle only or on-road only), result in the safest driving outcomes and most effective signage
communication. Future research can examine asynchronous presentations of a variety of sign types via in-vehicle
displays and on-road signs under different levels of vehicle automation.
9 Implementation and Technology Transfer Plan
Products from this project, including the developed driving scenarios and task set up, will enable the research team
to effectively deploy studies on signage, information delivery to drivers, and vehicle automation. The findings would
support preliminary guideline to enable in-vehicle displays of service logos, and to use both on-road and in-vehicle
presentations to promote sign recognition. Our research team would be very interested in continuing this line of
work, investigating applied questions to promote the safe and effective delivery of signage and other information to
drivers in both manual and automated driving.
10 References
Biehl, S. C., Ehlis, A.-C., Müller, L D., Niklaus, A., Pauli, P., & Herrmann, M. J. (2013). The impact of task relevance and
degree of distraction on stimulus processing. BMC Neuroscience, 14:107.
Caird, J. K., Chisolm, S. L., & Lockhart, J. (2008). Do in-vehicle advanced signs enhance older and younger drivers’
intersection performance? Driving simulation and eye movement results. International Journal of Human-
Computer Studies, 66, 132-144.
Carsten, O., Lai, F., Barnard, Y., Jamson, A., Merat, N. (2012). Control task substitution in semi-automated driving:
does it matter what aspects are automated? Human Factors, 54, 747–761.
Castro, C., Horberry, T., & Tornay, F. (2004). The effectiveness of transport signs. In C. Castro, & T. Horberry (Eds.).
The Human Factors of Transport Sings. CRC Press: Boca Raton, Florida.
Cauffman, S. J., Deng, Y., Liu, Y., Cunningham, C., Kaber, D., & Feng, J. (2020). Driver logo sign detection and hazard
responses during partially automated driving. To appear in The Proceedings of the 2020 International Annual
Meeting of the Human Factors and Ergonomics Society, online.
Creaser, J., & Manser, M. (2013). Evaluation of driver performance and distraction during use of in-vehicle signing
information. Transportation Research Record: Journal of the Transportation Research Board. DOI:
10.3141/2365-01.
Deng, Y., Cauffman, S., Lau, M., Johnson, E., Cunningham, C., Kaber, D., & Feng, J. (2019). On-road and In-vehicle
Delivery of Non-Safety-Related Messages: How Information Source and Presentation Format Impact Driver’

North Carolina Department of Transportation Office of Research
22
Processing of Logo Signs and Hazard Response. In The Proceedings of the 2019 Transportation Research
Board Meeting, Washington, DC, USA.
Deng, Y., Cauffman, S. J., Lau, M. Y., Johnson, E., Avr, A., Cunningham, C., Kaber, D., & Feng, J. (2020). Driver logo sign
detection and hazard responses during partially automated driving. To appear in The Proceedings of the 1st
IEEE International Conference on Human Machine Systems, online.
Deng, Y., Lau, M. L., Cauffman, S. J., Ebony, J., Cunningham, C., Kaber, D., & Feng, J. (2020). Display of non-safety-
related information through in-vehicle displays. Abstract and poster presented at the 2020 Transportation
Research Board Meeting, Washington, DC.
Egner, T., & Hirsch, J. (2005). Cognitive control mechnisms resolve conflict through cortical amplification of task-
relevant information. Nature Neuroscience, 8, 1784-1790.
Federal Highway Administration. (2009). The Manual on Uniform Traffic Control Devices. Washington, D.C.
Hart, S. G., & Staveland, L. E. (1988). Development of NASA-TLX (Task Load Index): Results of empirical and
theoretical research. In Advances in psychology 52, 139-183). North-Holland.
Institute of Transportation Engineers. (2016). The Traffic Engineering Handbook (7th Edition). John Wiley and Sons.
Lee, J. D., Gore, B. F., & Campbell, J. L. (1999). Display alternatives for in-vehicle warning and sign information:
message style, location, and modality. Transportation Human Factors, 1(4), 347-375.
Lee, J., & See, K. (2004). Trust in automation: designing for appropriate reliance. Human Factors, 46, 50–80.
Merat, N., Jamson, H., Lai, F., Carsten, O. (2012). Highly automated driving: secondary task performance and driver
state. Human Factors, 54, 762–771.
Miller, D., Sun, A., Johns, M., Ive, H., Sirkin, D., Aich, S., Ju, W. (2015). Distraction becomes engagement in automated
driving. In the Proceedings of the 59th Annual Meeting of the Human Factors and Ergonomics Society, 1676–
1680.
National Highway Traffic Safety Administration (NHTSA). (2103). Visual-manual NHTSA driver distraction guidelines
for in-vehicle electronic devices. Document No. 2013-09883.
Noble, A., Dingus, T. A., & Doerzaph, Z. (2016). Influence of in-vehicle adaptive stop display on driving behavior and
safety. IEEE Transactions on Intelligent Transportation Sytems, 17(10), 2767-2776.
Oken, B. S., Salinsky, M. C., & Elsas, S. M. (2006). Vigilance, alertness, or sustained attention: physiological basis and
measurement. Clinical Neurophysiology, 117(9), 1885-1901.
Saffarian, M., de Winter, J., Happee, R. (2012). Automated driving: human-factors issues and design solutions. In the
Proceedings of the 56th Annual Meeting of the Human Factors and Ergonomics Society, 2296–2300.
Saxby, D.J., Matthews, G., Warm, J.S., Hitchcock, E.M., Neubauer, C. (2013). Active and passive fatigue in simulated
driving: discriminating styles of workload regulation and their safety impacts. Journal of Experimental
Psychology: Applied, 19(4), 287.
Schömig, N., Hargutt, V., Neukum, A., Petermann-Stock, I., Othersen, I. (2015). The interaction between highly
automated driving and the development of drowsiness. Procedia Manufacture, 3, 6652–6659.
Tiffin, J., & Kissling, C. (2004). The future of road signage. Presented at Bridging the Gap: IPENZ Transportation
Conference, Auckland. Retrieved from URL:
http://www.transportationgroup.nz/papers/2005/07_Kissling_Tiffin.pdf