Designing eye tracking experiments to measure human … · Embeded processor or dedicated gaze data...
42
8/18/2010 1 Designing eye tracking experiments to measure human behavior Eindhoven, The Netherlands August, 2010 Ricardo Matos Tobii Technology Steps involved in measuring behaviour 1 Formulate and initial question and make preliminary 1. Formulate and initial question and make preliminary observations 2. Formulate hypothesis and make predictions 3. Choose behavioural measures and research design 4. Define each measure 5. Select the appropriate recording method 6. Practice the recording method 7. Collect data 8. Analyse data
-
Upload
hoangthien -
Category
Documents
-
view
215 -
download
0
Transcript of Designing eye tracking experiments to measure human … · Embeded processor or dedicated gaze data...
8/18/2010
1
Designing eye tracking experiments to measure human behaviorEindhoven, The Netherlands
August, 2010Ricardo Matos
Tobii Technology
Steps involved in measuring behaviour
1 Formulate and initial question and make preliminary1. Formulate and initial question and make preliminaryobservations
2. Formulate hypothesis and make predictions3. Choose behavioural measures and research design4. Define each measure5. Select the appropriate recording method6. Practice the recording method7. Collect data8. Analyse data
8/18/2010
2
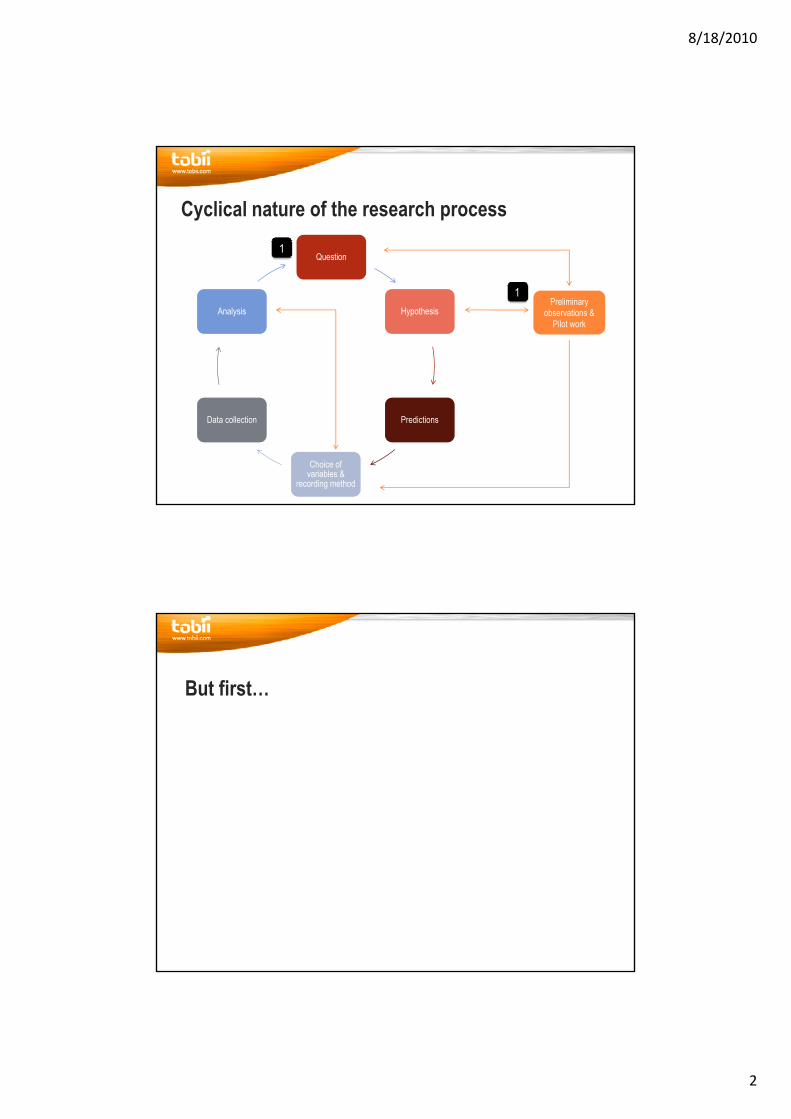
Cyclical nature of the research process
Question1
HypothesisAnalysisPreliminary
observations & Pilot work
1
Predictions
Choice of variables &
recording method
Data collection
But first…
8/18/2010
3
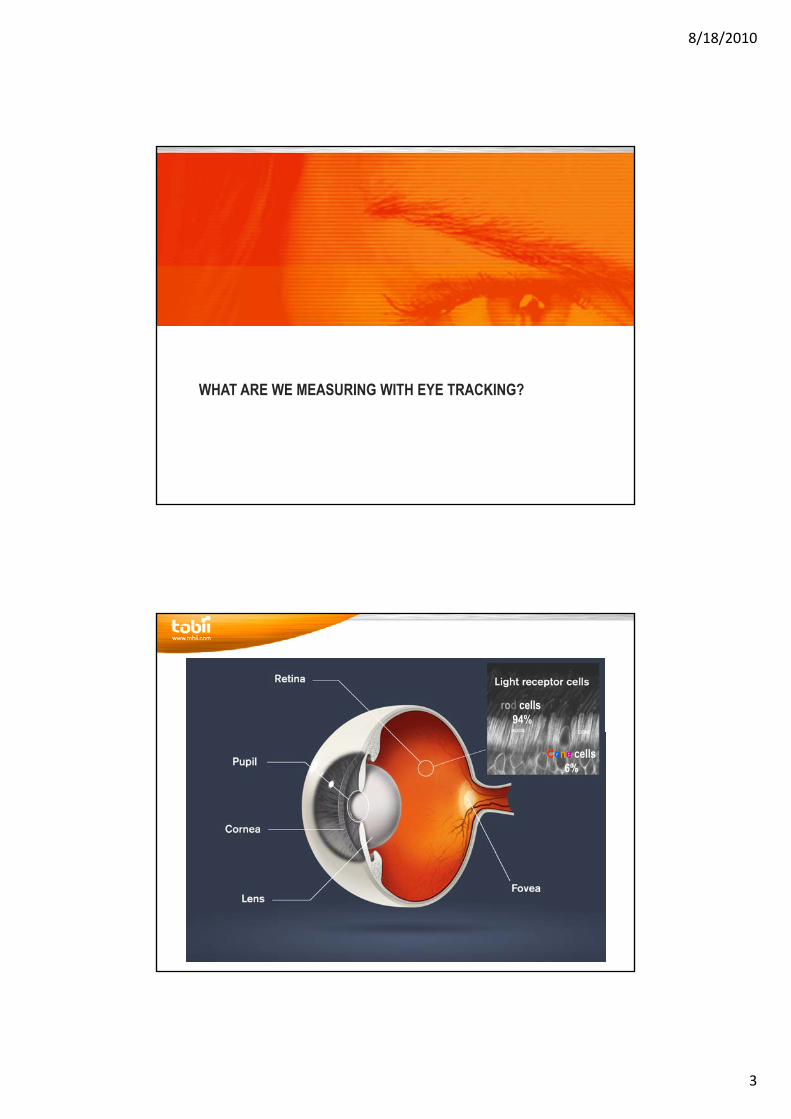
WHAT ARE WE MEASURING WITH EYE TRACKING?WHAT ARE WE MEASURING WITH EYE TRACKING?
rod cells 94%
Cone cells6%
8/18/2010
4
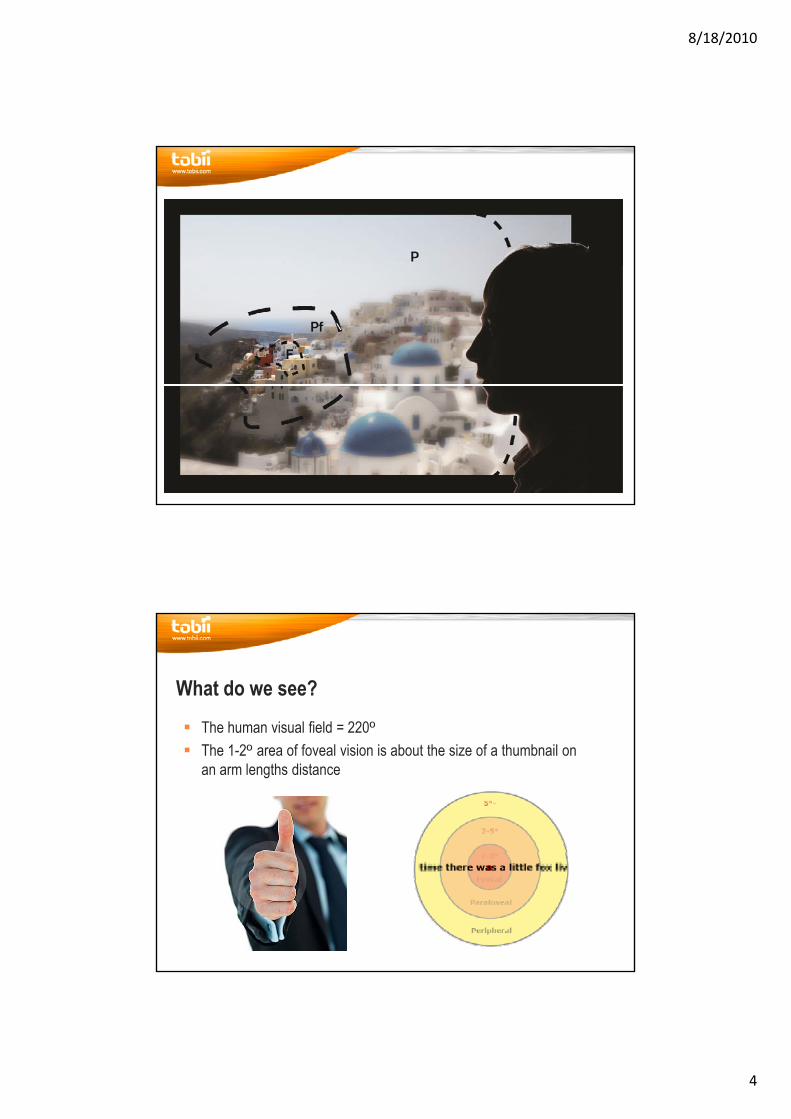
What do we see?The human visual field = 220ºThe human visual field 220The 1-2º area of foveal vision is about the size of a thumbnail on an arm lengths distance
8/18/2010
5
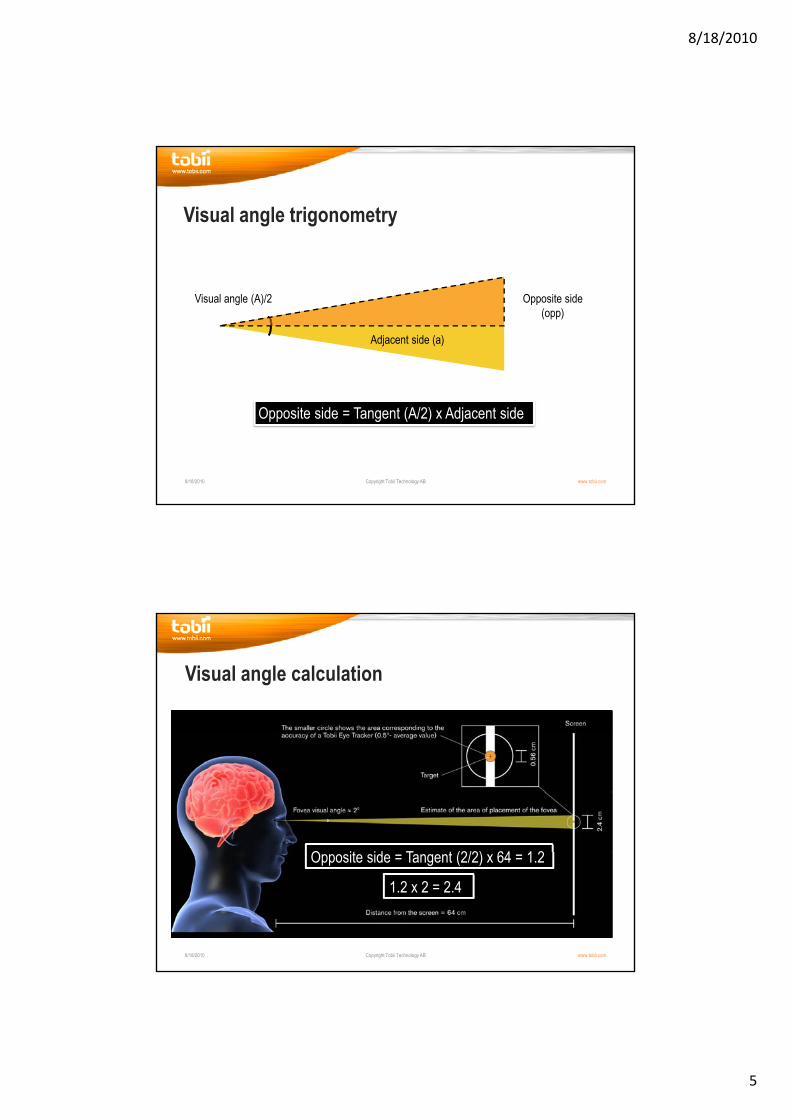
Visual angle trigonometry
Visual angle (A)
Opposite side(opp)
Adjacent side (a)
Visual angle (A)/2
8/18/2010 Copyright Tobii Technology AB www.tobii.com
Opposite side = Tangent (A/2) x Adjacent side
Visual angle calculation
O it id T t (2/2) 64 1 2
8/18/2010 Copyright Tobii Technology AB www.tobii.com
Opposite side = Tangent (2/2) x 64 = 1.2
1.2 x 2 = 2.4
8/18/2010
6
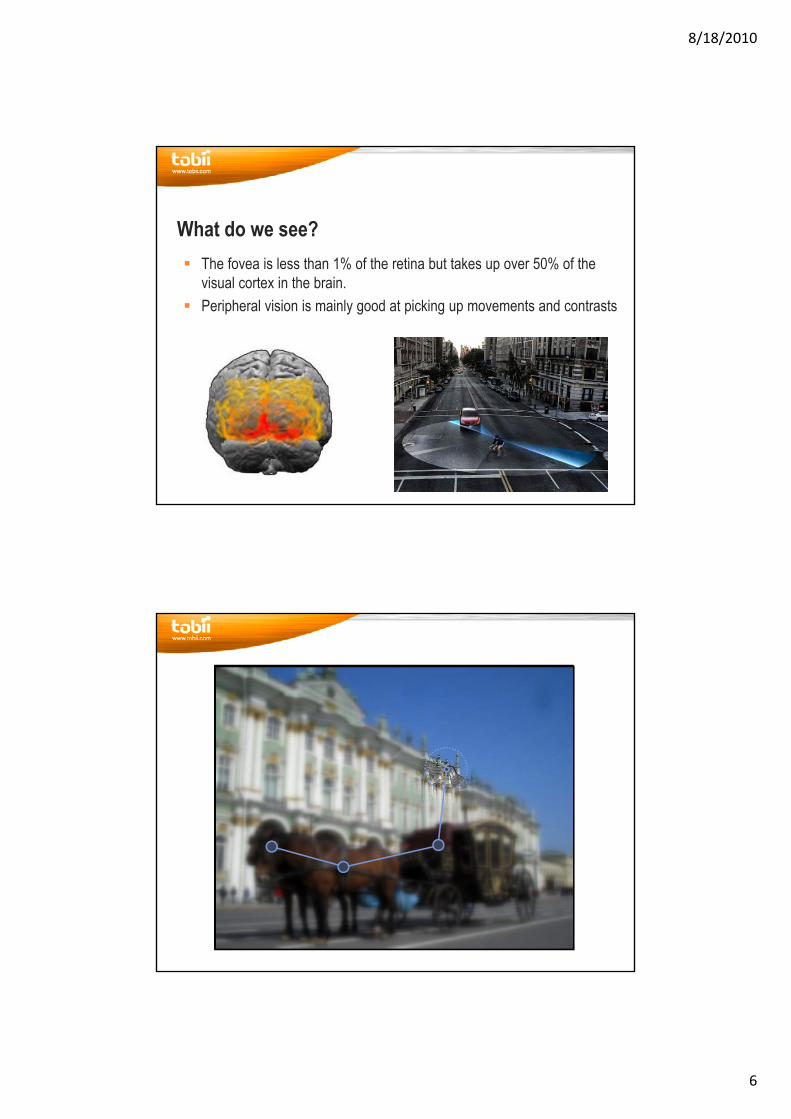
What do we see?The fovea is less than 1% of the retina but takes up over 50% of the The fovea is less than 1% of the retina but takes up over 50% of the visual cortex in the brain.Peripheral vision is mainly good at picking up movements and contrasts
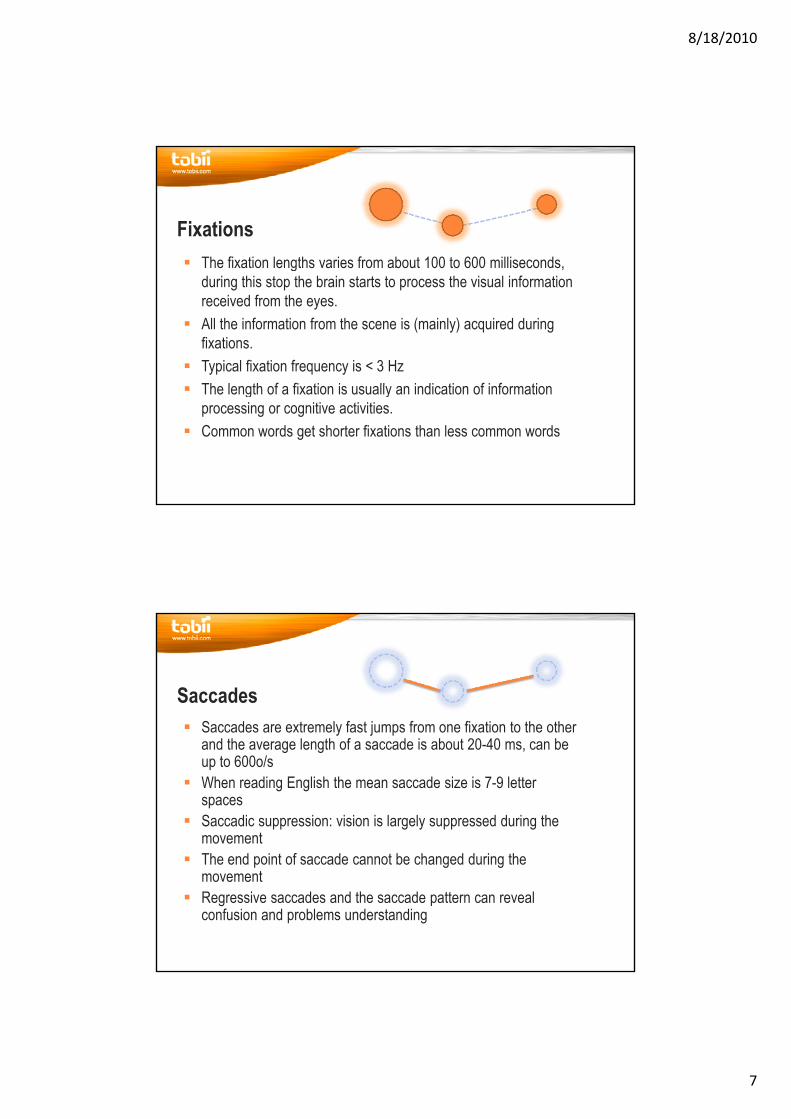
Fixation
Saccade
The area of foveal vision
8/18/2010
7
FixationsThe fixation lengths varies from about 100 to 600 milliseconds The fixation lengths varies from about 100 to 600 milliseconds, during this stop the brain starts to process the visual information received from the eyes. All the information from the scene is (mainly) acquired during fixations.Typical fixation frequency is < 3 HzTh l th f fi ti i ll i di ti f i f ti The length of a fixation is usually an indication of information processing or cognitive activities. Common words get shorter fixations than less common words
SaccadesSaccades are extremely fast jumps from one fixation to the other Saccades are extremely fast jumps from one fixation to the other and the average length of a saccade is about 20-40 ms, can be up to 600o/sWhen reading English the mean saccade size is 7-9 letter spacesSaccadic suppression: vision is largely suppressed during the movementThe end point of saccade cannot be changed during the movementRegressive saccades and the saccade pattern can reveal confusion and problems understanding
8/18/2010
8
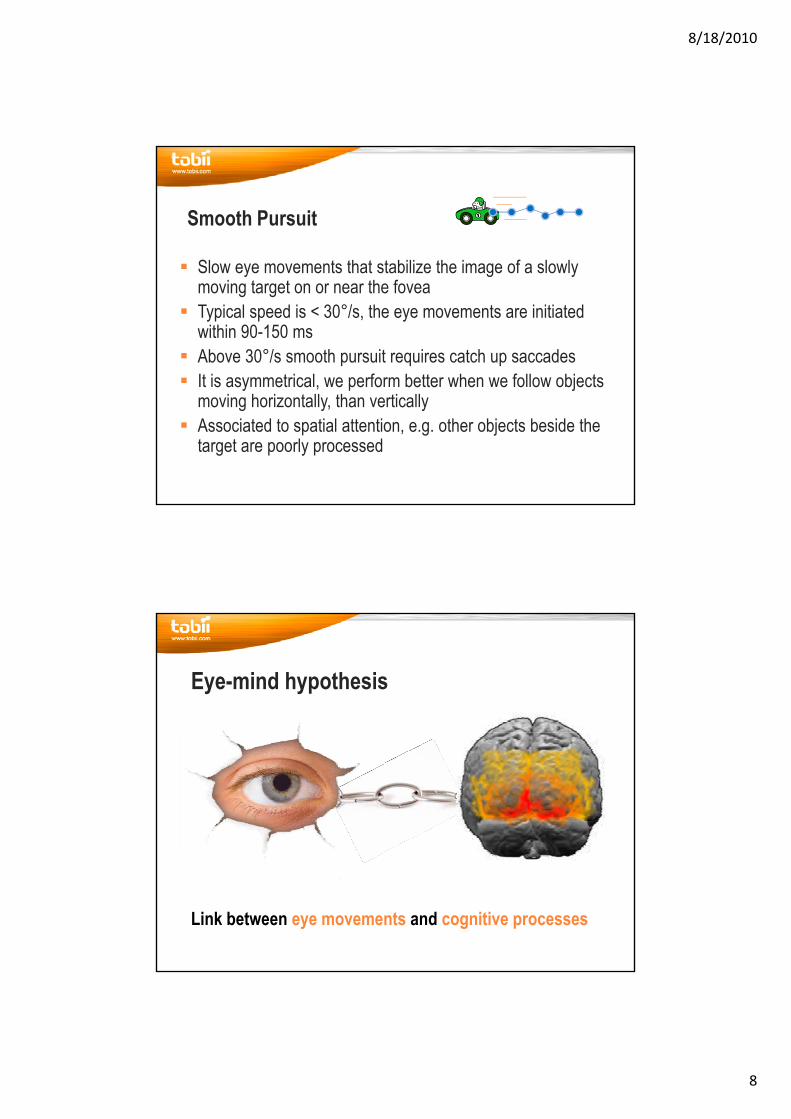
Smooth Pursuit
Slow eye movements that stabilize the image of a slowly Slow eye movements that stabilize the image of a slowly moving target on or near the fovea Typical speed is < 30°/s, the eye movements are initiated within 90-150 msAbove 30°/s smooth pursuit requires catch up saccadesIt is asymmetrical, we perform better when we follow objects It is asymmetrical, we perform better when we follow objects moving horizontally, than verticallyAssociated to spatial attention, e.g. other objects beside the target are poorly processed
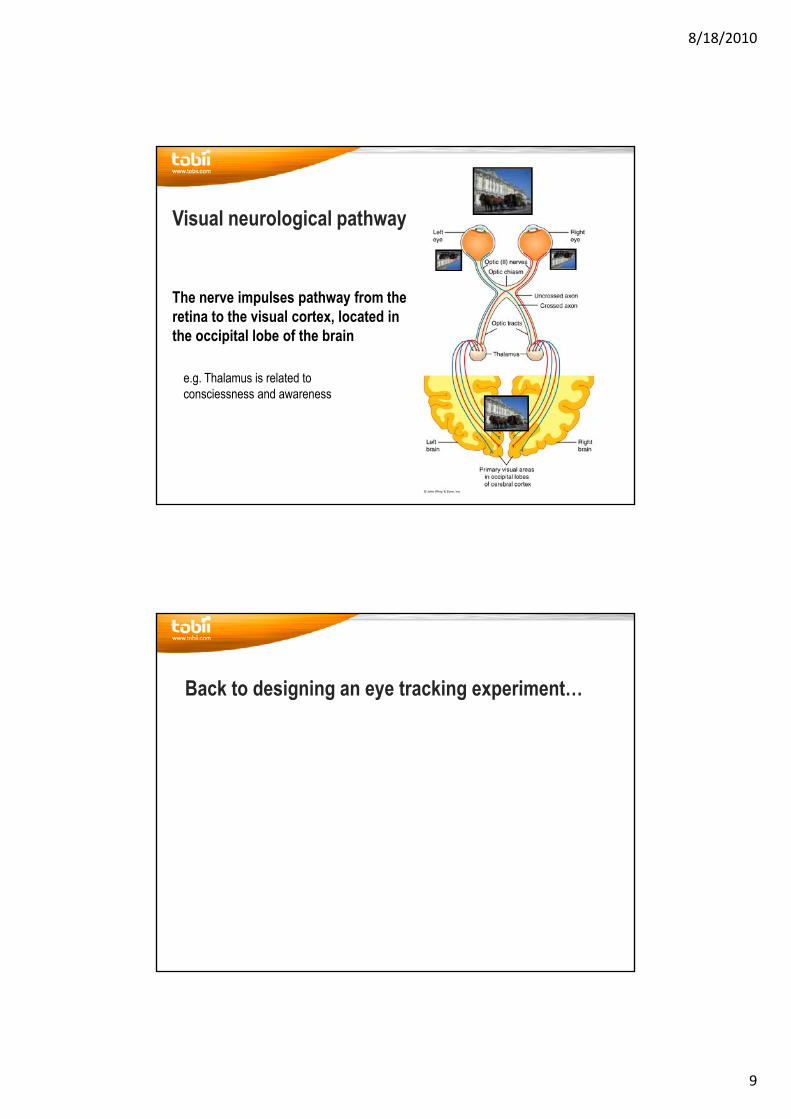
Eye-mind hypothesis
Link between eye movements and cognitive processes
8/18/2010
9
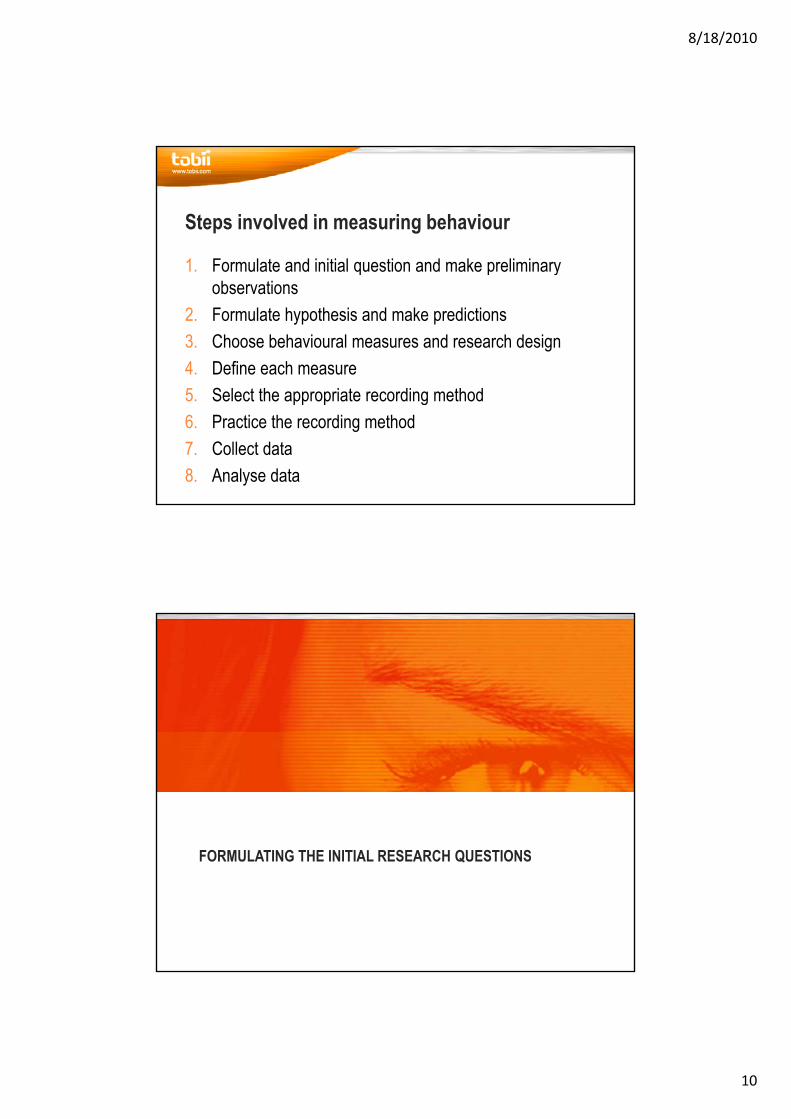
Visual neurological pathway
The nerve impulses pathway from the retina to the visual cortex, located in the occipital lobe of the brain
e.g. Thalamus is related to consciessness and awareness
Back to designing an eye tracking experiment…
8/18/2010
10
Steps involved in measuring behaviour
1 Formulate and initial question and make preliminary1. Formulate and initial question and make preliminaryobservations
2. Formulate hypothesis and make predictions3. Choose behavioural measures and research design4. Define each measure5. Select the appropriate recording method6. Practice the recording method7. Collect data8. Analyse data
FORMULATING THE INITIAL RESEARCH QUESTIONSFORMULATING THE INITIAL RESEARCH QUESTIONS
8/18/2010
11
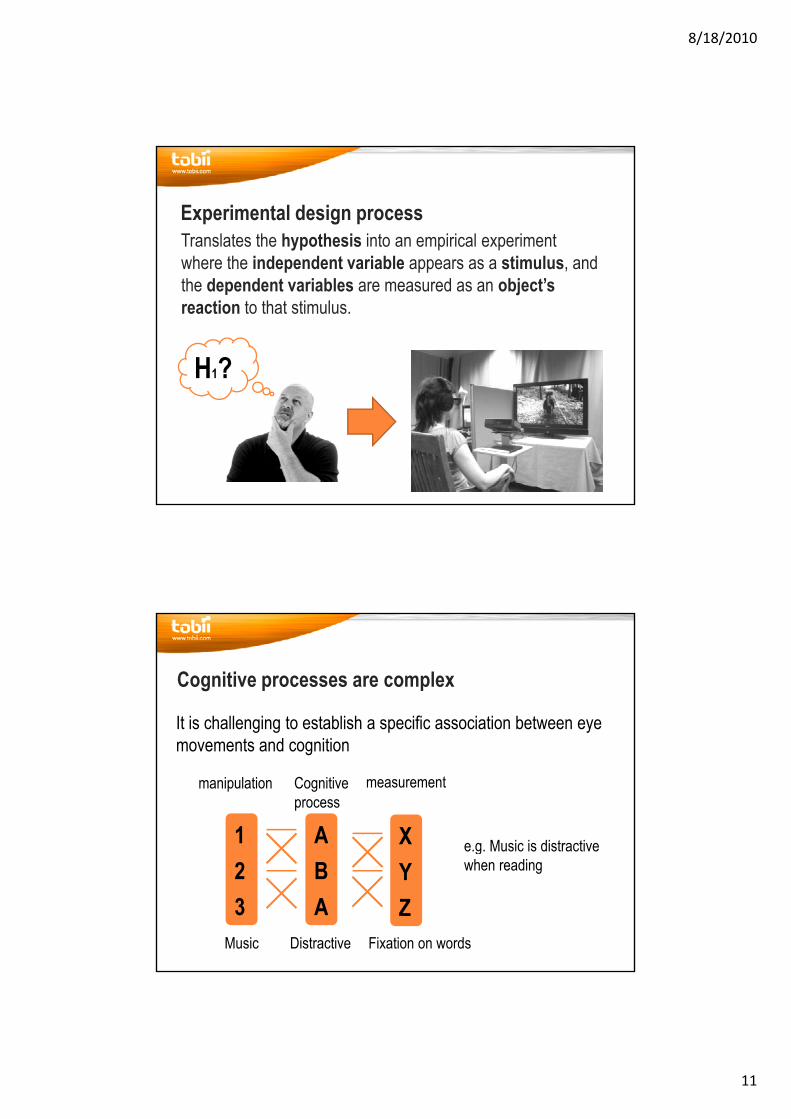
Experimental design processTranslates the hypothesis into an empirical experiment where the independent variable appears as a stimulus and where the independent variable appears as a stimulus, and the dependent variables are measured as an object’sreaction to that stimulus.
H1?
Cognitive processes are complex
It is challenging to establish a specific association between eye g g p ymovements and cognition
1
manipulation
A
Cognitiveprocess
X
measurement
e.g. Music is distractive
23
BA
YZ
gwhen reading
Distractive Fixation on wordsMusic
8/18/2010
12
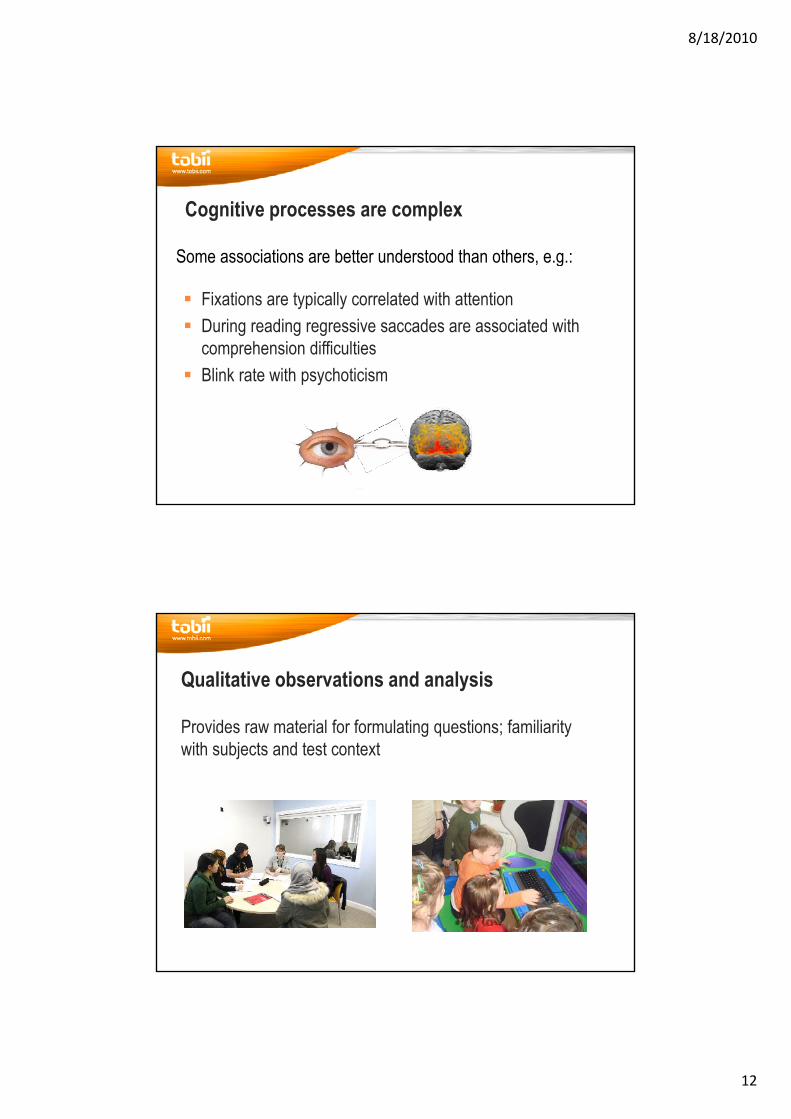
Some associations are better understood than others, e.g.:
Cognitive processes are complex
g
Fixations are typically correlated with attentionDuring reading regressive saccades are associated with comprehension difficulties Blink rate with psychoticism
Qualitative observations and analysis
Provides raw material for formulating questions; familiarityProvides raw material for formulating questions; familiaritywith subjects and test context
8/18/2010
13
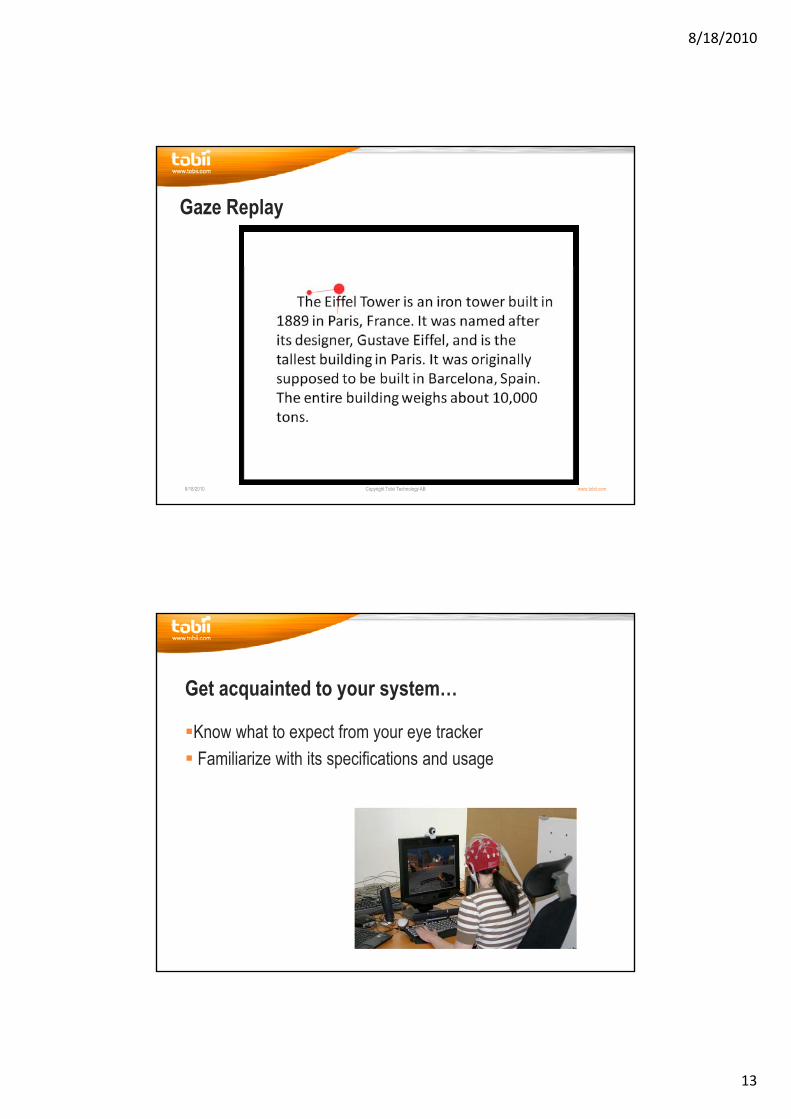
Gaze Replay
8/18/2010 Copyright Tobii Technology AB www.tobii.com
Get acquainted to your system…
Know what to expect from your eye trackerKnow what to expect from your eye trackerFamiliarize with its specifications and usage
8/18/2010
14
REMOTE EYE TRACKERSREMOTE EYE TRACKERS
How does remote eye tracking works
8/18/2010
15
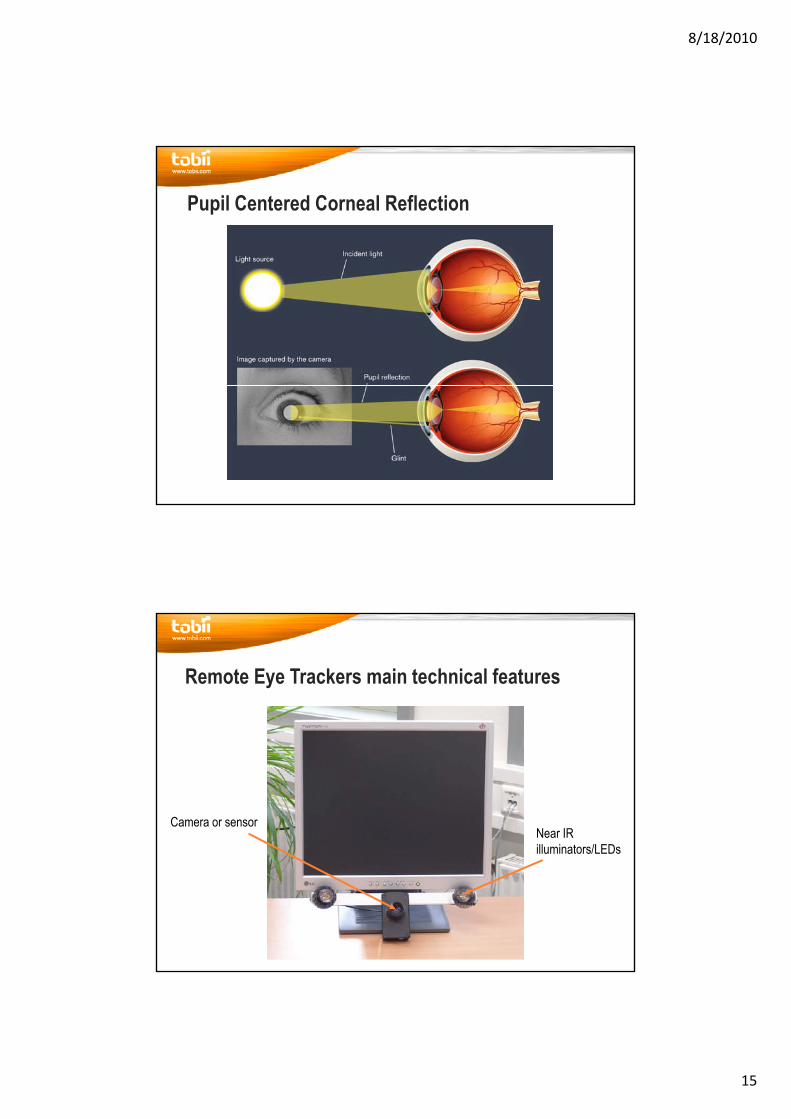
Pupil Centered Corneal Reflection
Remote Eye Trackers main technical features
Near IR illuminators/LEDs
Camera or sensor
illuminators/LEDs
8/18/2010
16
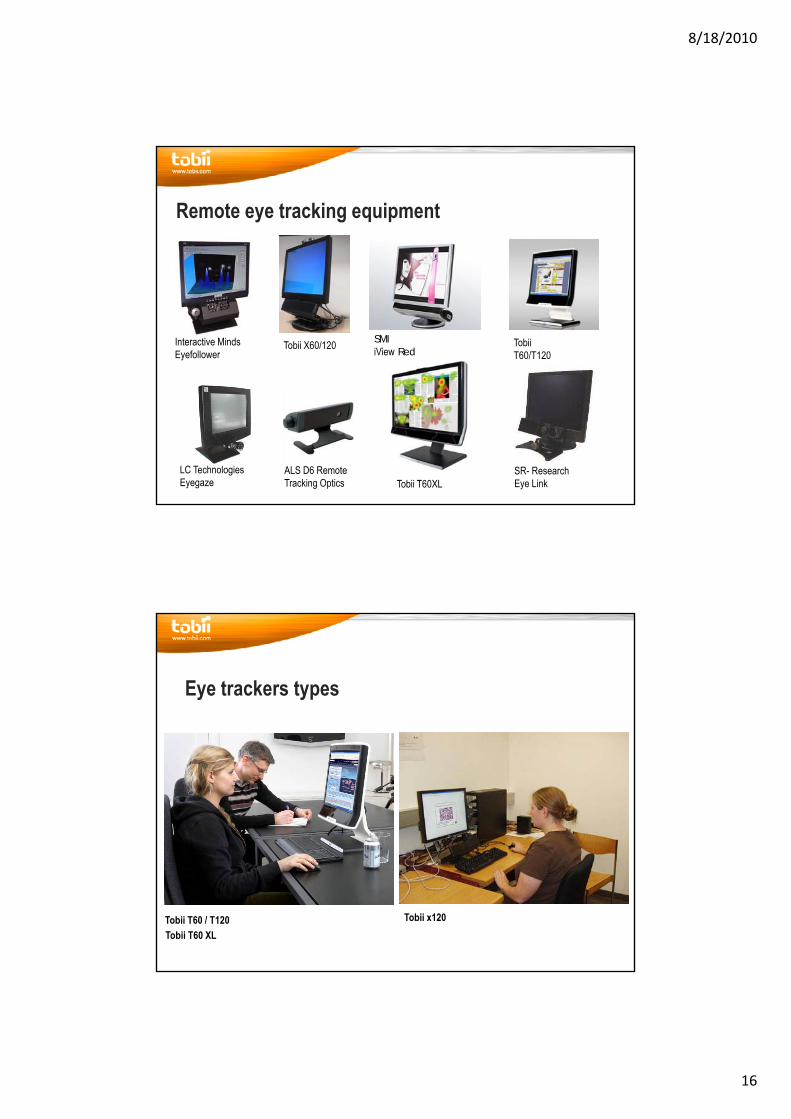
Remote eye tracking equipment
SMIiView Red
Tobii T60/T120
Tobii X60/120Interactive MindsEyefollower
LC TechnologiesEyegaze
ALS D6 RemoteTracking Optics Tobii T60XL
SR- Research Eye Link
Eye trackers types
Tobii x120Tobii T60 / T120Tobii T60 XL
8/18/2010
17
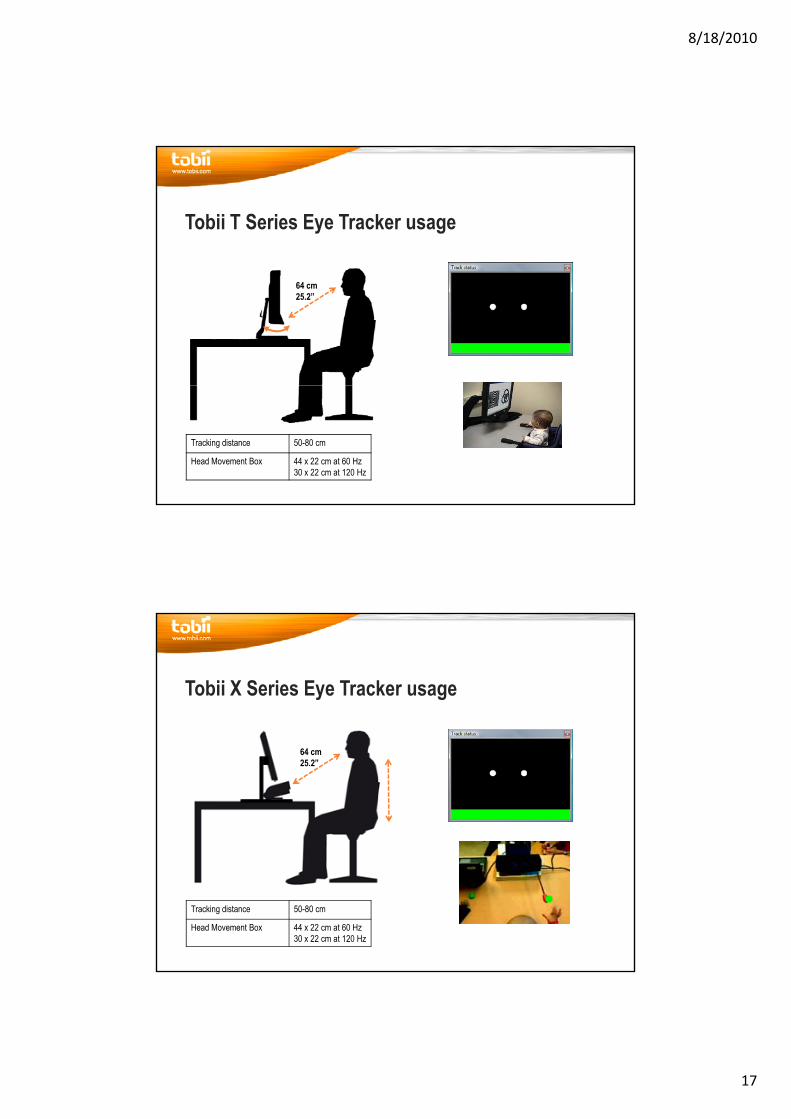
Tobii T Series Eye Tracker usage
64 cm25.2”
Tracking distance 50-80 cm
Head Movement Box 44 x 22 cm at 60 Hz30 x 22 cm at 120 Hz
Tobii X Series Eye Tracker usage
64 cm25.2”
Tracking distance 50-80 cm
Head Movement Box 44 x 22 cm at 60 Hz30 x 22 cm at 120 Hz
8/18/2010
18
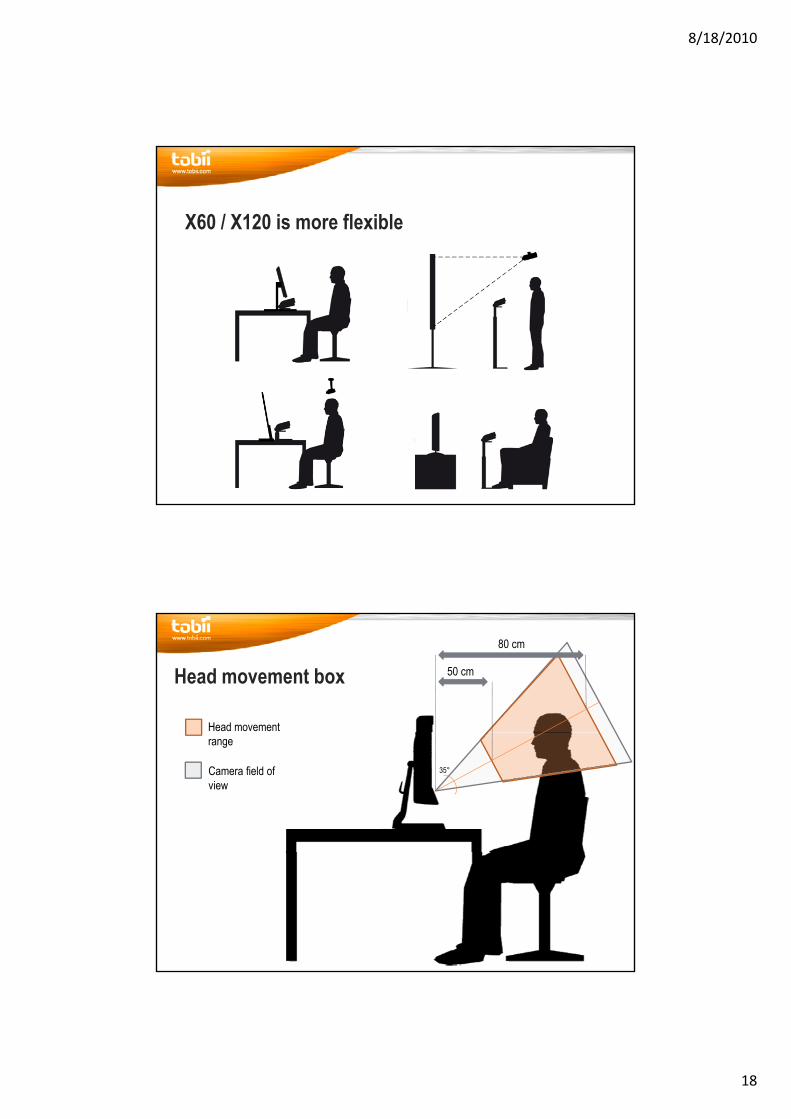
X60 / X120 is more flexible
50 cm
80 cm
Head movement
Head movement box
35°
range
Camera field of view
8/18/2010
19
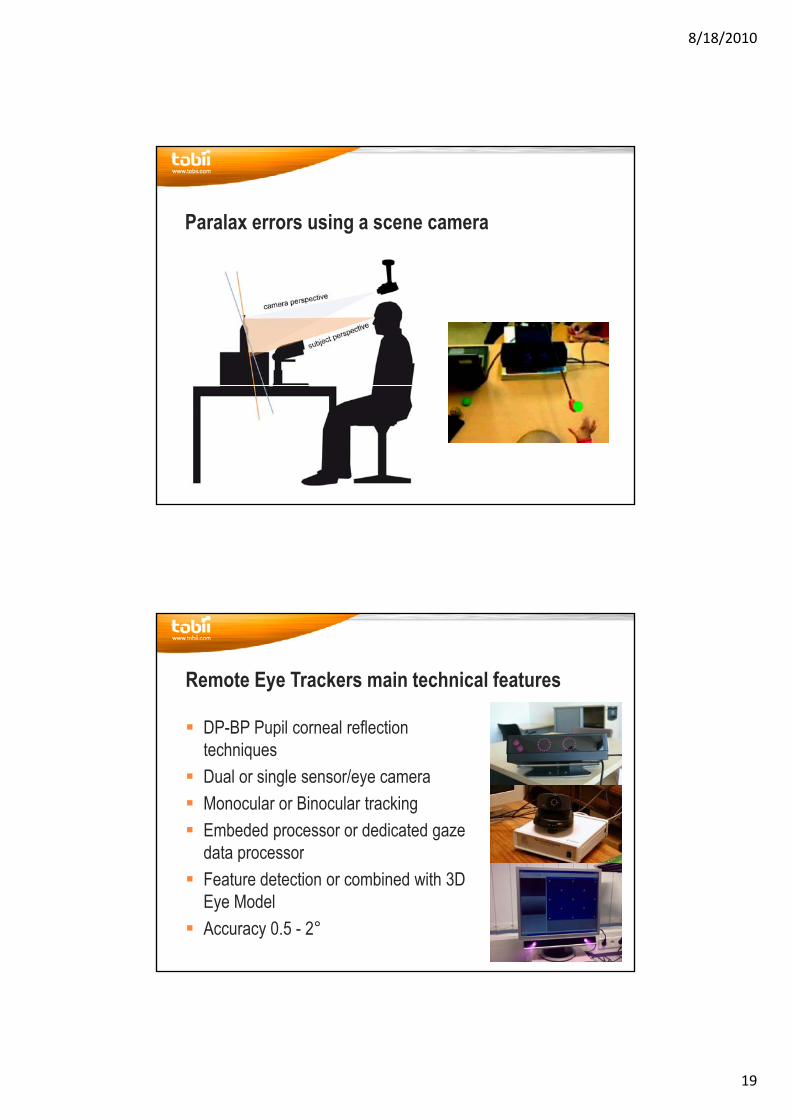
Paralax errors using a scene camera
Remote Eye Trackers main technical features
DP-BP Pupil corneal reflection DP BP Pupil corneal reflection techniquesDual or single sensor/eye cameraMonocular or Binocular trackingEmbeded processor or dedicated gaze data processordata processorFeature detection or combined with 3D Eye Model Accuracy 0.5 - 2°
8/18/2010
20
Difficult eye tracking circumstances
Very high surrounding NIR-light levels (bright daylight or focused Very high surrounding NIR light levels (bright daylight or focused halogen spotlights)Some bi-focal and progressive glassesVery damaged or very dirty glassesVery ”droopy” eye-lids or extremely small pupilsVery dark environmentsAlways calibrate with background intensity similar to that of the stimuliTobii Eye Trackers work with about 95% of the population but expect to have some problems with about 5-10% of your respondents.
RESEARCH DESIGN AND CHOOSING THE BEHAVIORAL RESEARCH DESIGN AND CHOOSING THE BEHAVIORAL MEASURES
8/18/2010
21
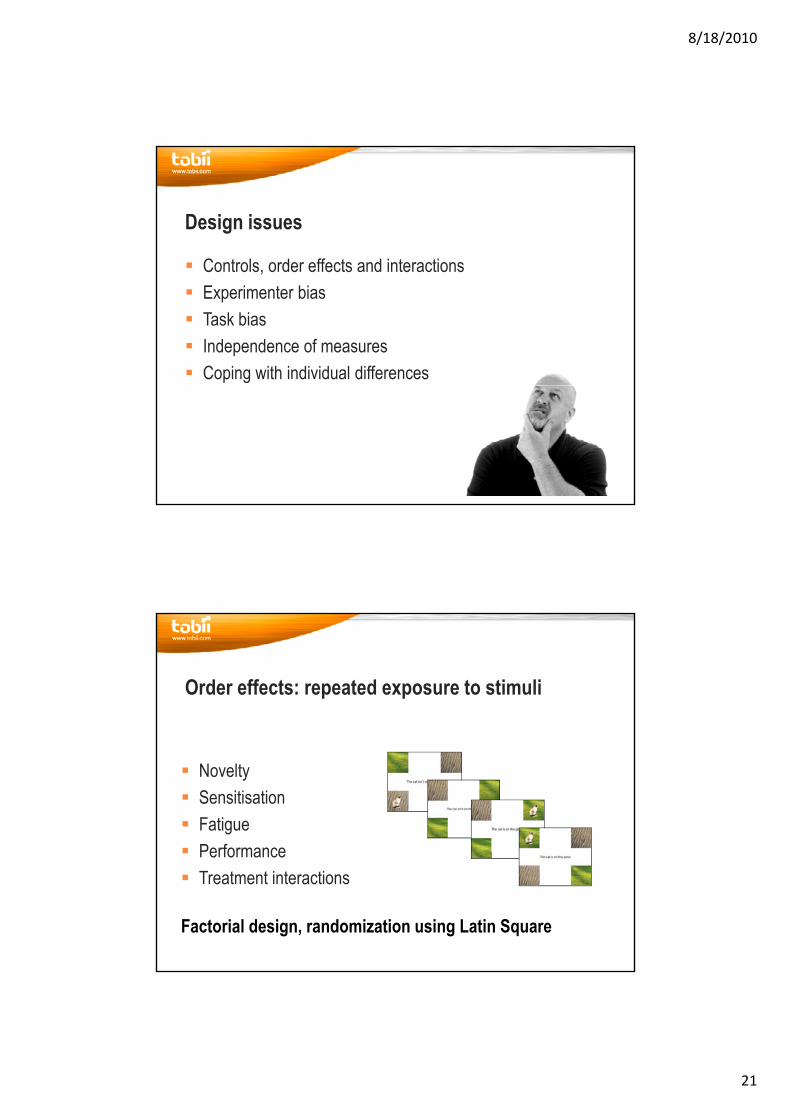
Design issues
Controls order effects and interactionsControls, order effects and interactionsExperimenter biasTask biasIndependence of measuresCoping with individual differences
Order effects: repeated exposure to stimuli
NoveltySensitisationFatiguePerformancePerformanceTreatment interactions
Factorial design, randomization using Latin Square
8/18/2010
22
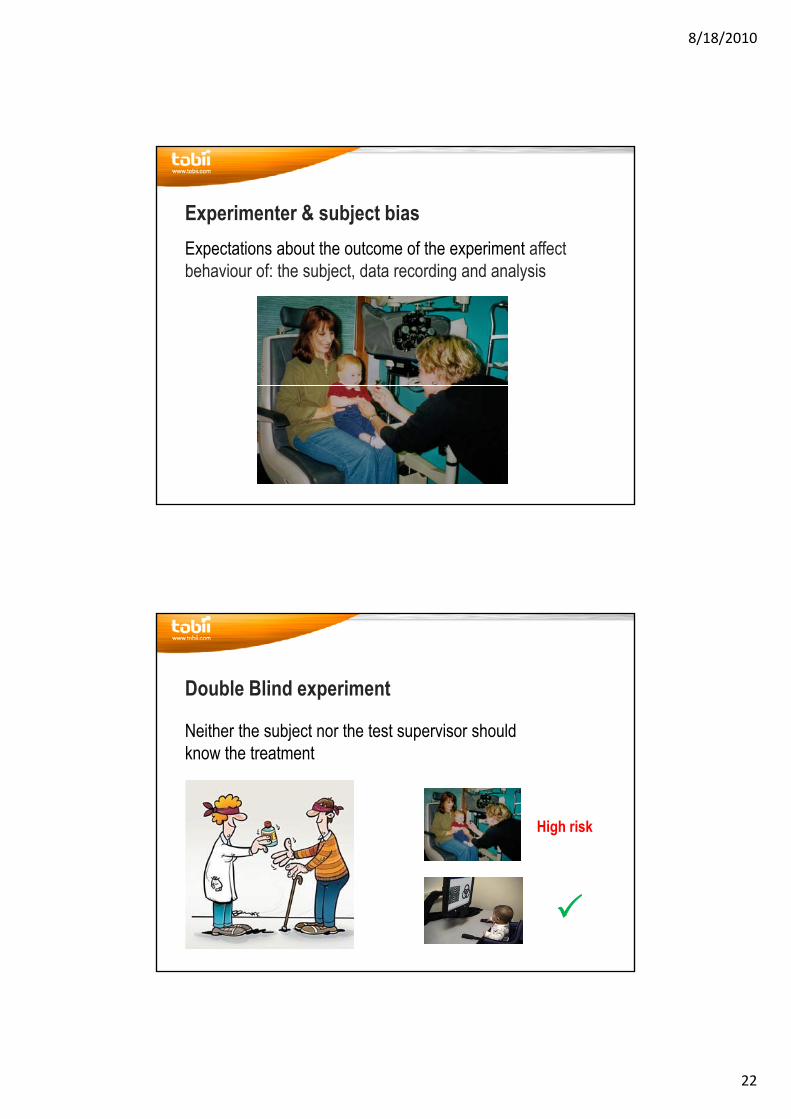
Experimenter & subject biasExpectations about the outcome of the experiment affectb h i f th bj t d t di d l ibehaviour of: the subject, data recording and analysis
Neither the subject nor the test supervisor should
Double Blind experiment
Neither the subject nor the test supervisor shouldknow the treatment
High risk
8/18/2010
23
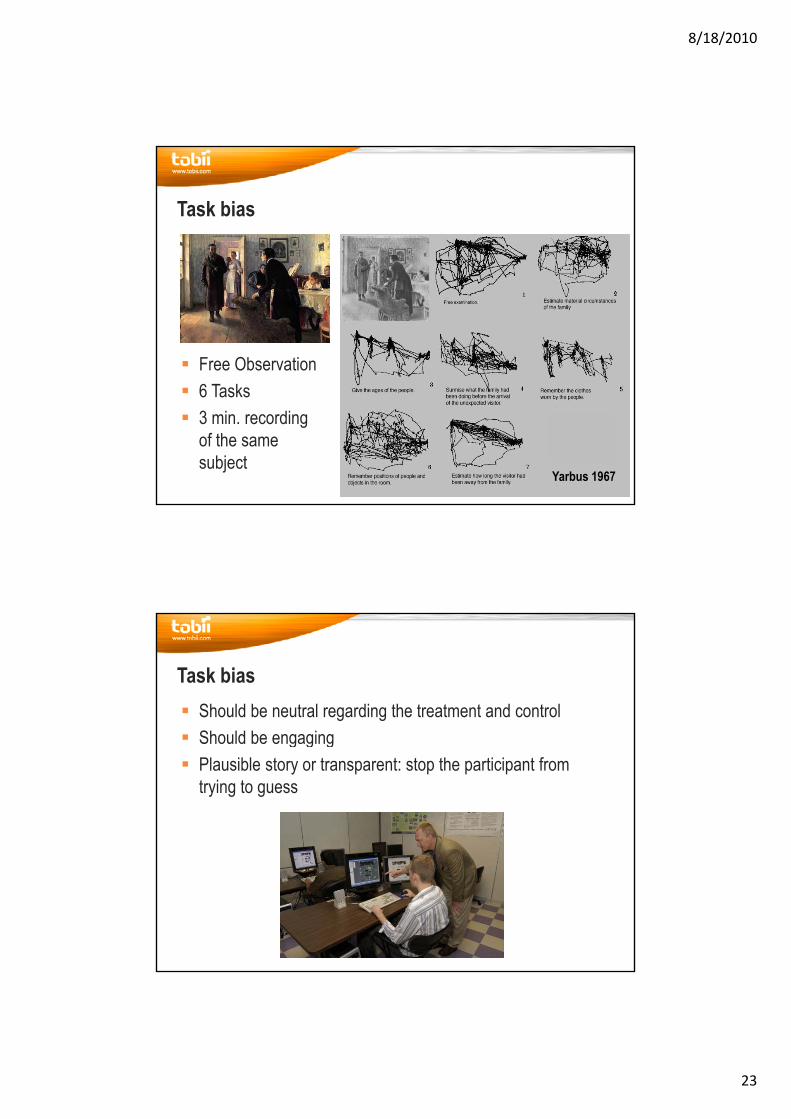
Task bias
Free Observation6 T k6 Tasks3 min. recording of the same subject
Yarbus 1967
Task biasShould be neutral regarding the treatment and controlSh ld b iShould be engagingPlausible story or transparent: stop the participant from trying to guess
8/18/2010
24
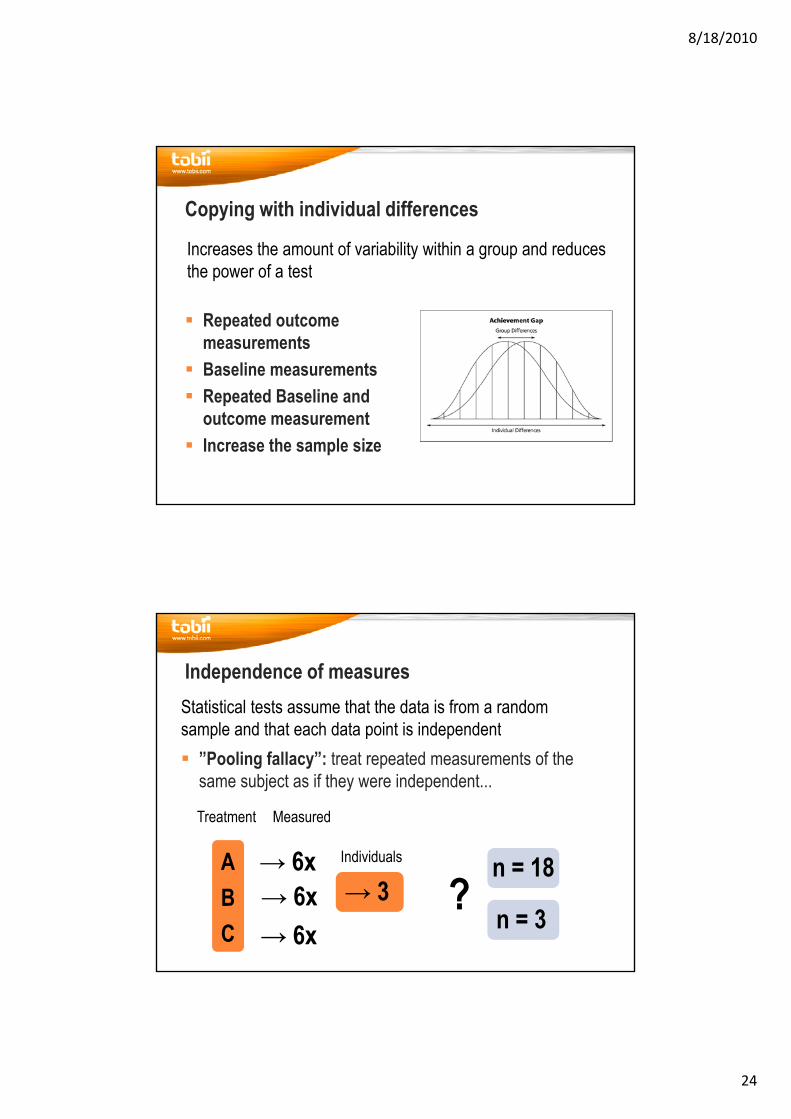
Copying with individual differences
Increases the amount of variability within a group and reduces th f t t
Repeated outcome measurementsBaseline measurements
the power of a test
Repeated Baseline and outcome measurementIncrease the sample size
Independence of measuresStatistical tests assume that the data is from a random sample and that each data point is independent
”Pooling fallacy”: treat repeated measurements of the same subject as if they were independent...
sample and that each data point is independent
6
MeasuredTreatment
I di id l→ 6xABC
→ 6x→ 6x
→ 3Individuals
n = 3
n = 18?
8/18/2010
25
Independence of measuresStatistical tests assume that the data is from a random
l d th t h d t i t i i d d t
Group effects: within group variation < between group… e.g. children belonging to the same school
M h i i l i i fi i
sample and that each data point is independent
Measures have non-trivial associations:… e.g. fixations can be measured in duration, number of occurrences and mean duration. Only two of these measurements are independent.
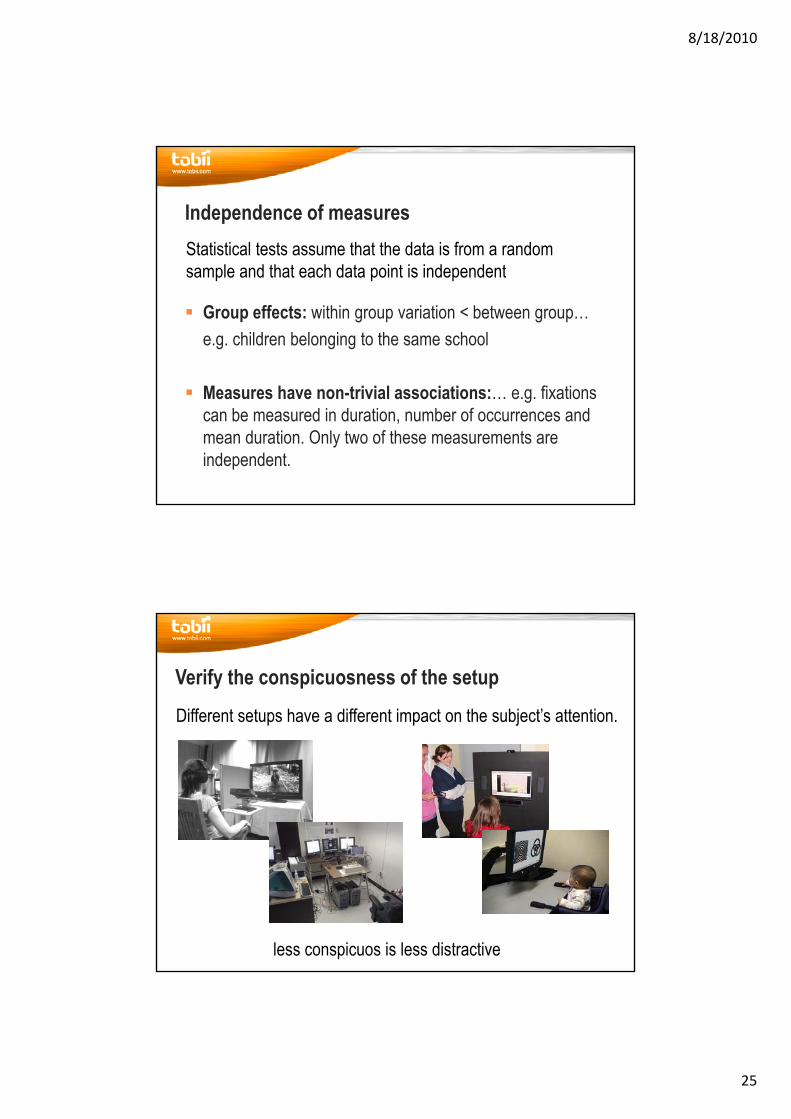
Verify the conspicuosness of the setupDifferent setups have a different impact on the subject’s attention.
less conspicuos is less distractive
8/18/2010
26
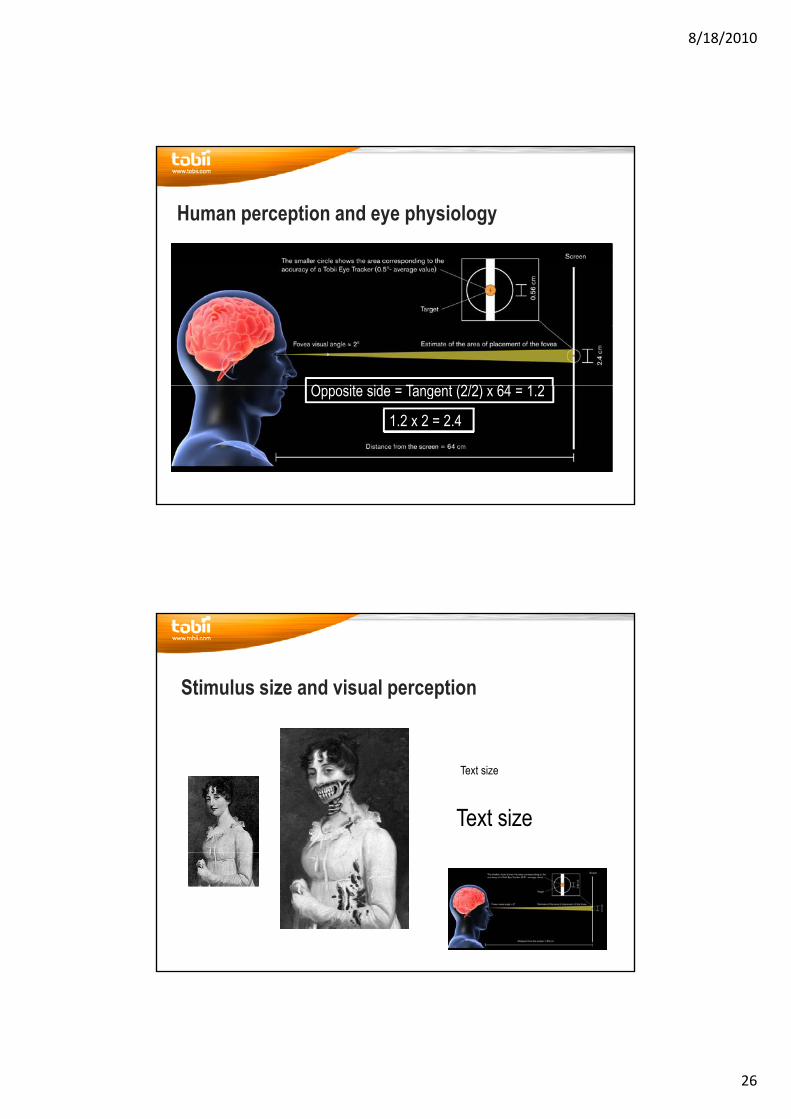
Human perception and eye physiology
O it id T t (2/2) 64 1 2Opposite side = Tangent (2/2) x 64 = 1.2
1.2 x 2 = 2.4
Stimulus size and visual perception
Text size
Text size
8/18/2010
27
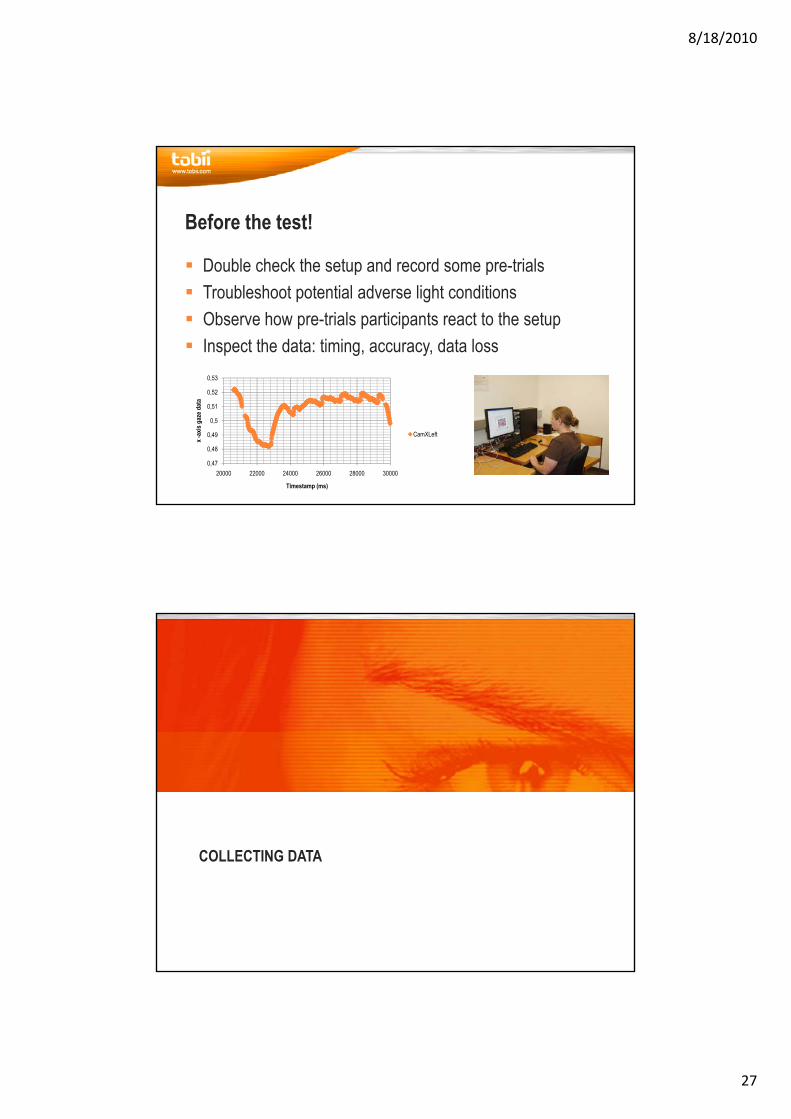
Before the test!
Double check the setup and record some pre trialsDouble check the setup and record some pre-trialsTroubleshoot potential adverse light conditionsObserve how pre-trials participants react to the setupInspect the data: timing, accuracy, data loss
0,53
0,47
0,48
0,49
0,5
0,51
0,52
20000 22000 24000 26000 28000 30000
x -ax
is ga
ze d
ata
Timestamp (ms)
CamXLeft
COLLECTING DATACOLLECTING DATA
8/18/2010
28
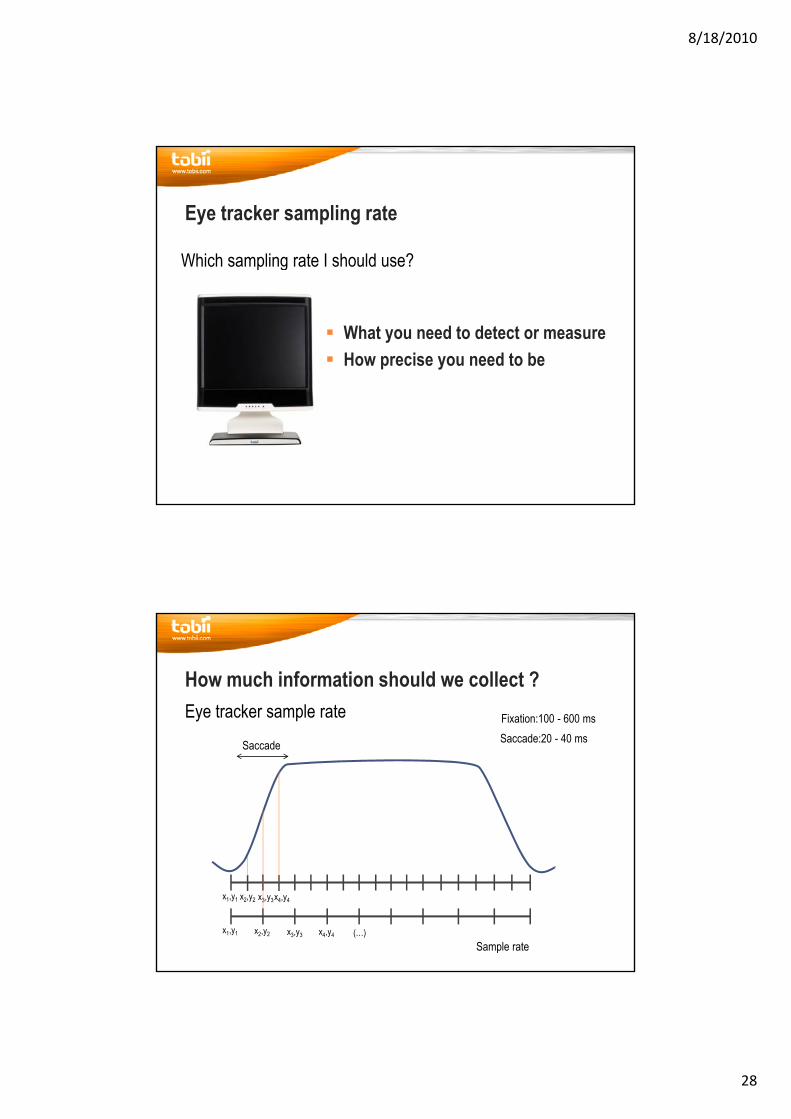
Eye tracker sampling rate
Which sampling rate I should use?Which sampling rate I should use?
What you need to detect or measureHow precise you need to be
How much information should we collect ?Eye tracker sample rate Fixation:100 - 600 ms
Saccade Saccade:20 - 40 ms
x1,y1 x2,y2 x3,y3 x4,y4 (…)Sample rate
x1,y1 x2,y2 x3,y3x4,y4
8/18/2010
29
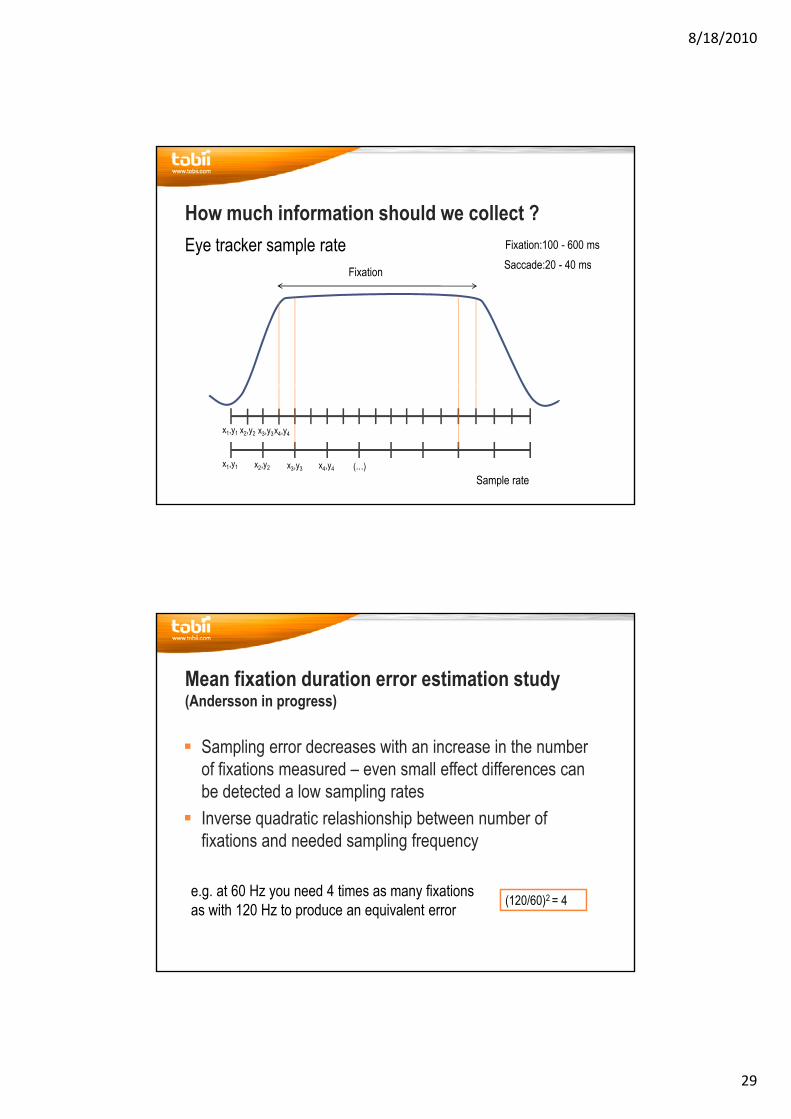
How much information should we collect ?Eye tracker sample rate Fixation:100 - 600 ms
Saccade:20 - 40 msFixation Saccade:20 - 40 ms
x1,y1 x2,y2 x3,y3 x4,y4 (…)Sample rate
x1,y1 x2,y2 x3,y3x4,y4
Mean fixation duration error estimation study(Andersson in progress)
Sampling error decreases with an increase in the numberof fixations measured – even small effect differences canbe detected a low sampling ratesInverse quadratic relashionship between number of fixations and needed sampling frequency
e.g. at 60 Hz you need 4 times as many fixationsas with 120 Hz to produce an equivalent error (120/60)2 = 4
8/18/2010
30
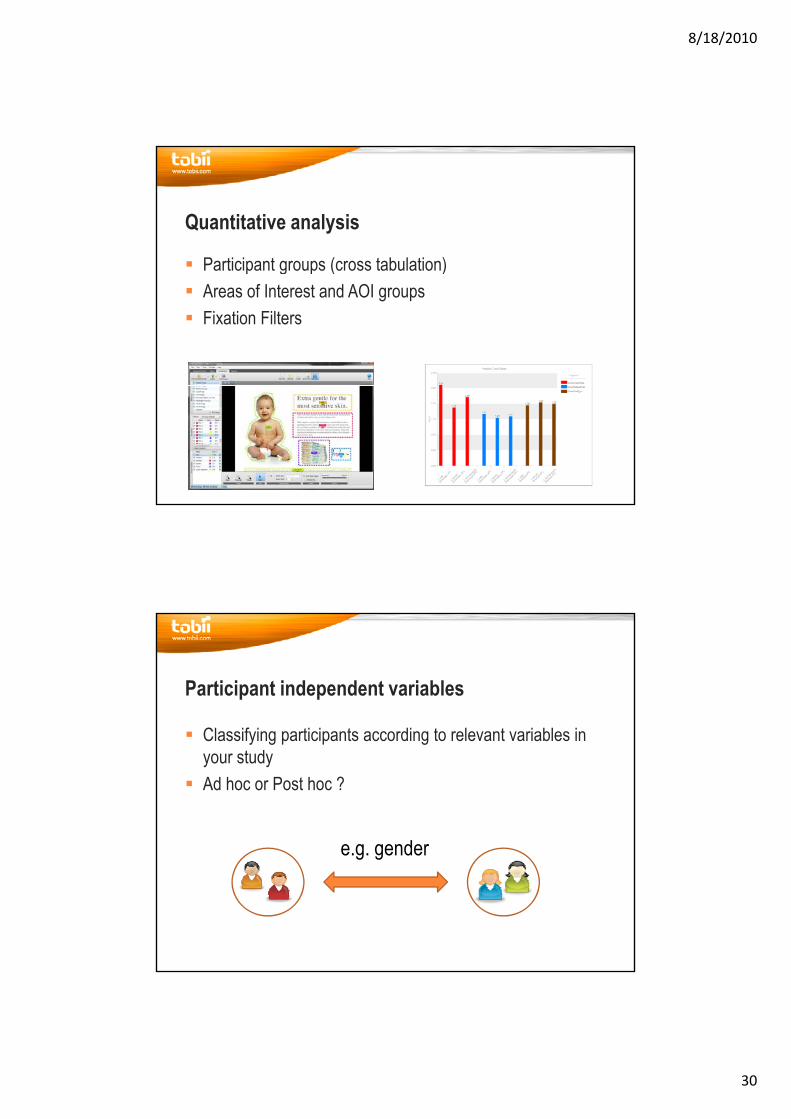
Quantitative analysis
Participant groups (cross tabulation)Participant groups (cross tabulation)Areas of Interest and AOI groupsFixation Filters
Participant independent variables
Classifying participants according to relevant variables in Classifying participants according to relevant variables in your studyAd hoc or Post hoc ?
e g gendere.g. gender
8/18/2010
31
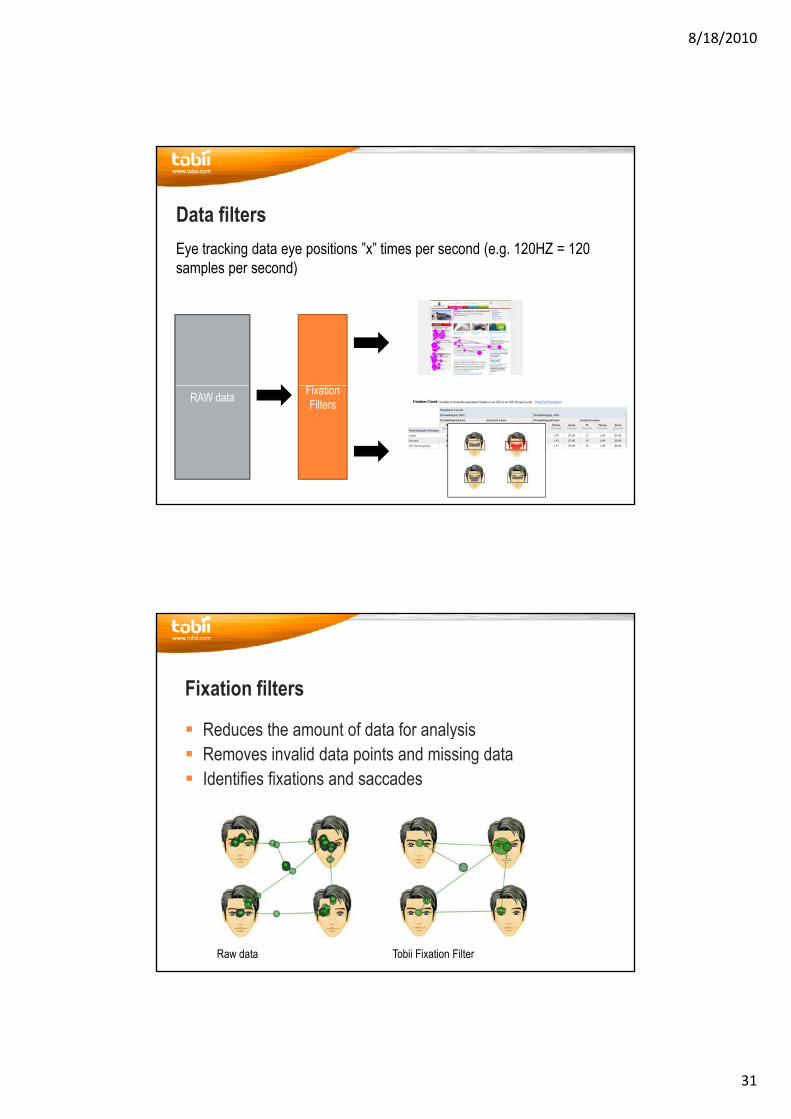
Data filters Eye tracking data eye positions ”x” times per second (e.g. 120HZ = 120 samples per second)samples per second)
RAW data FixationFilters
Fixation filters
Reduces the amount of data for analysisReduces the amount of data for analysisRemoves invalid data points and missing dataIdentifies fixations and saccades
Raw data Tobii Fixation Filter
8/18/2010
32
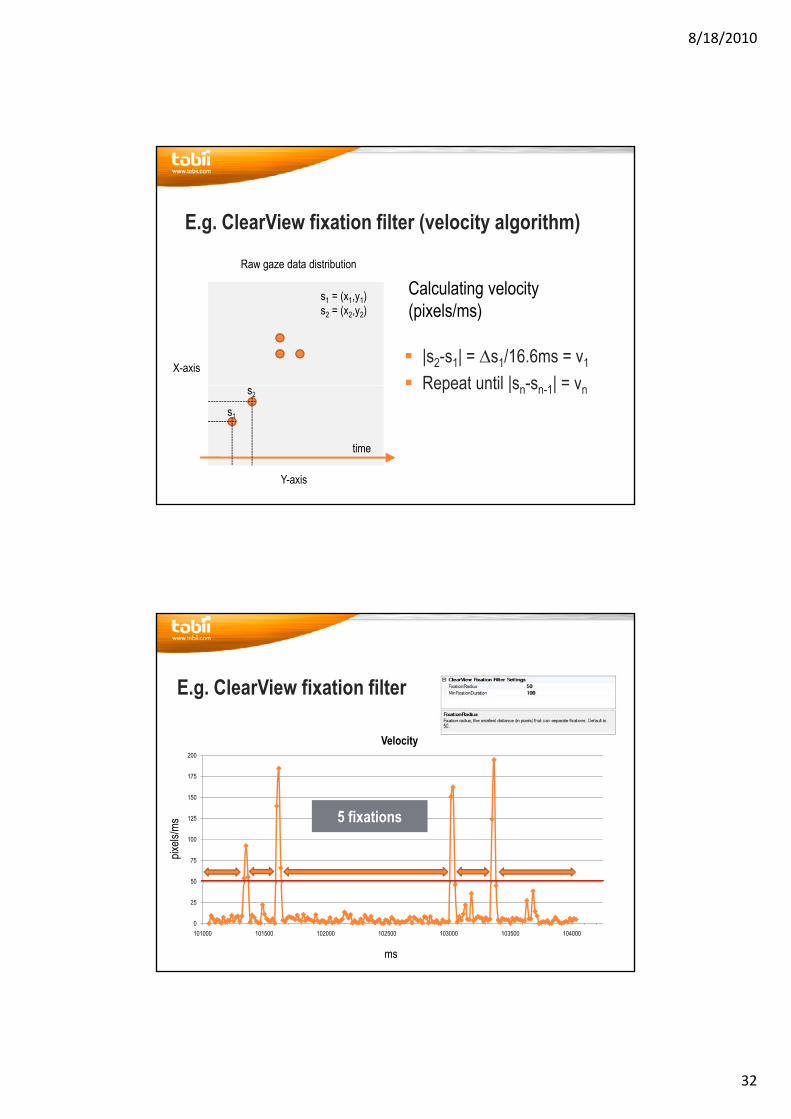
E.g. ClearView fixation filter (velocity algorithm)
Raw gaze data distribution
|s2-s1| = ∆s1/16.6ms = v1
Repeat until |s -s 1| = vX-axis
Raw gaze data distribution
s1 = (x1,y1)s2 = (x2,y2)
Calculating velocity(pixels/ms)
Repeat until |sn sn-1| vn
Y-axis
time
s1
s2
E.g. ClearView fixation filter
100
125
150
175
200
Velocity
xels/
ms
5 fixations
0
25
50
75
101000 101500 102000 102500 103000 103500 104000
pi
ms
8/18/2010
33
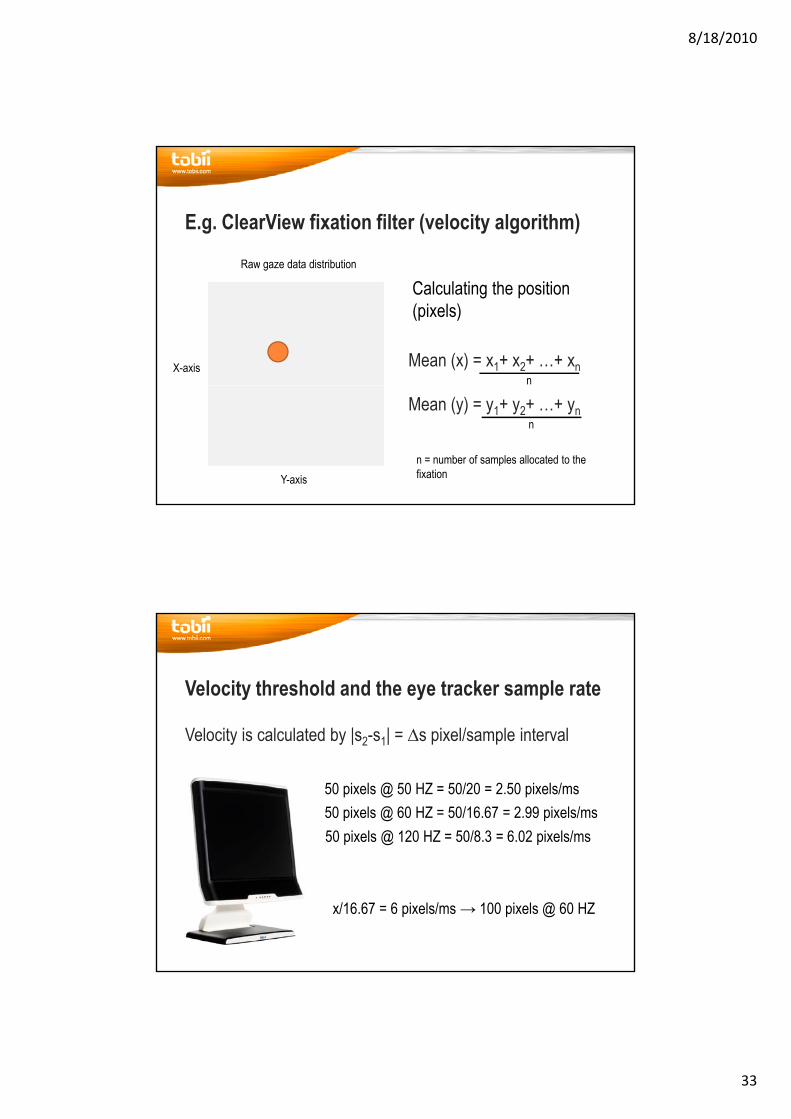
E.g. ClearView fixation filter (velocity algorithm)
Raw gaze data distribution
X-axis
Raw gaze data distribution
s1
s2
s1 = (x1,y1)s2 = (x2,y2)s3 = (x3,y3)
Calculating the position (pixels)
Mean (x) = x1+ x2+ …+ xns3
n
Y-axisn = number of samples allocated to the fixation
Mean (y) = y1+ y2+ …+ ynn
Velocity threshold and the eye tracker sample rate
Velocity is calculated by |s s | = ∆s pixel/sample interval Velocity is calculated by |s2-s1| = ∆s pixel/sample interval
50 pixels @ 60 HZ = 50/16.67 = 2.99 pixels/ms50 pixels @ 120 HZ = 50/8.3 = 6.02 pixels/ms
50 pixels @ 50 HZ = 50/20 = 2.50 pixels/ms
x/16.67 = 6 pixels/ms → 100 pixels @ 60 HZ
8/18/2010
34
How to choose the right settings?
Choose the settings according to litterature or previousChoose the settings according to litterature, or previousresearchChoose the settings based on your research questionPlot a velocity diagaram of your gaze coordinates and check:
The lowest velocity saccades you want to keepy y pThe highest velocity noise within fixation
It should always be higher than the fixation noise
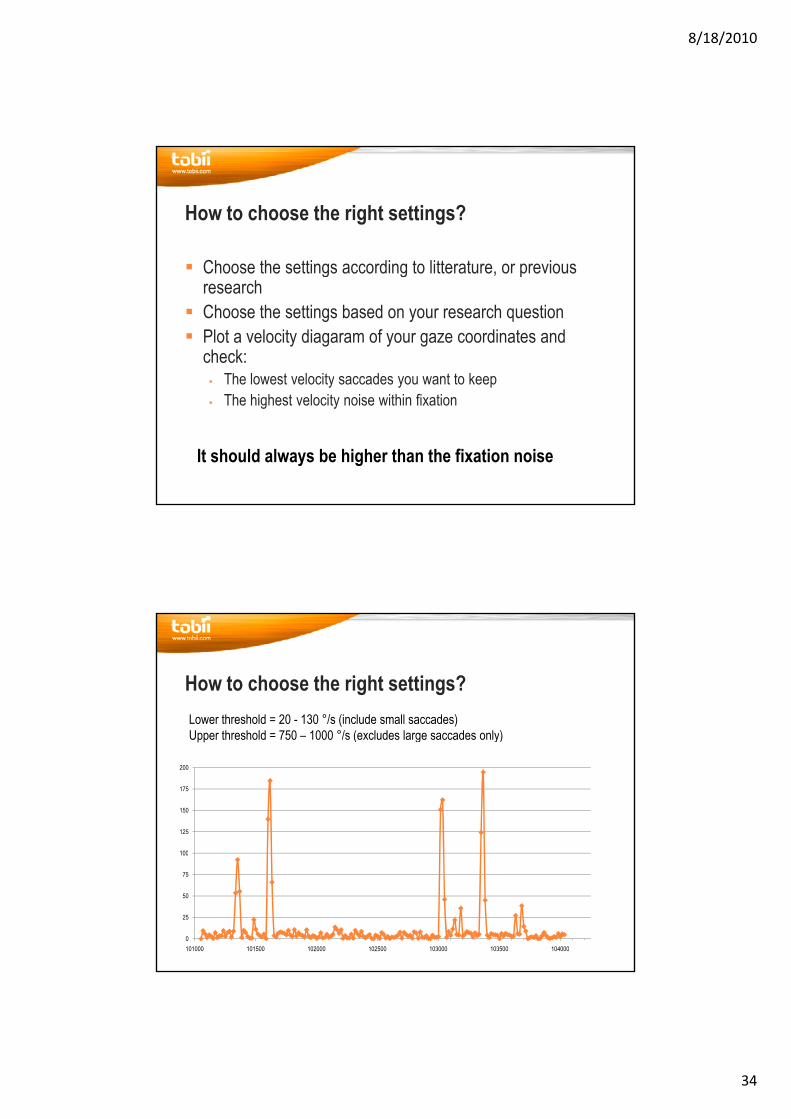
How to choose the right settings?Lower threshold = 20 - 130 °/s (include small saccades)U th h ld 750 1000 °/ ( l d l d l )
100
125
150
175
200
Upper threshold = 750 – 1000 °/s (excludes large saccades only)
0
25
50
75
100
101000 101500 102000 102500 103000 103500 104000
8/18/2010
35
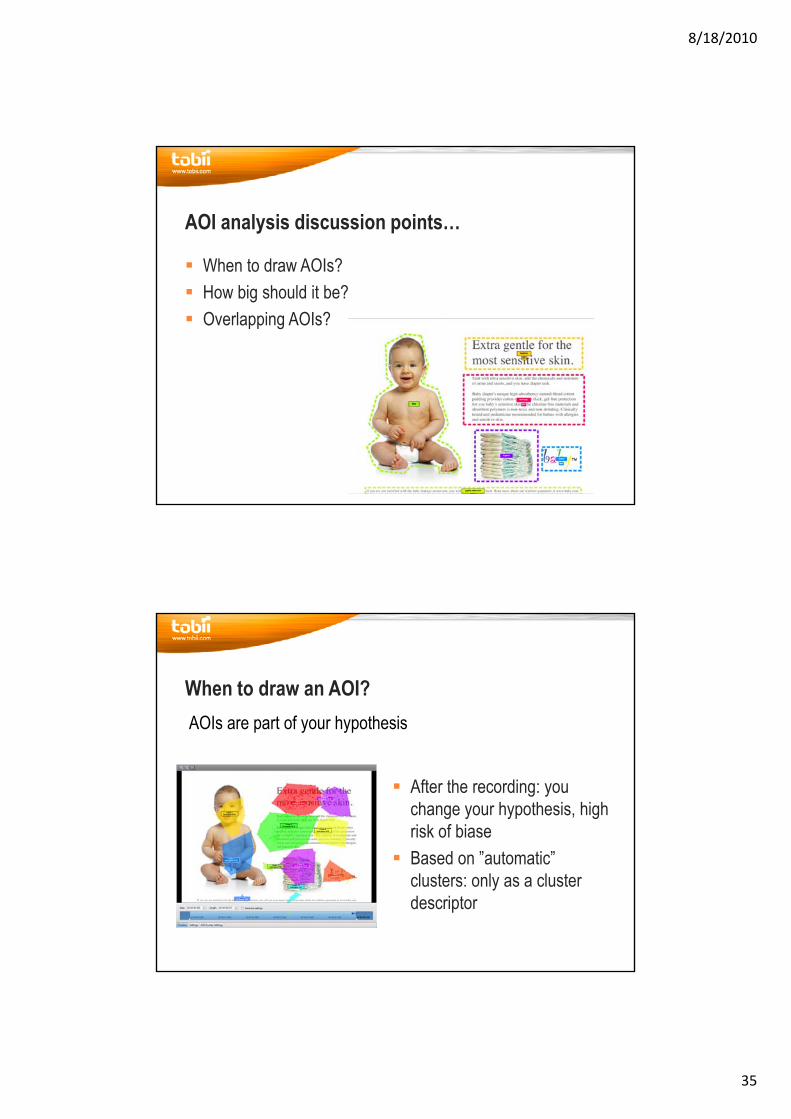
AOI analysis discussion points…
When to draw AOIs?When to draw AOIs?How big should it be?Overlapping AOIs?
When to draw an AOI?AOIs are part of your hypothesis
After the recording: you change your hypothesis, high risk of biaseB d ” t ti ”
p y yp
Based on ”automatic” clusters: only as a cluster descriptor
8/18/2010
36
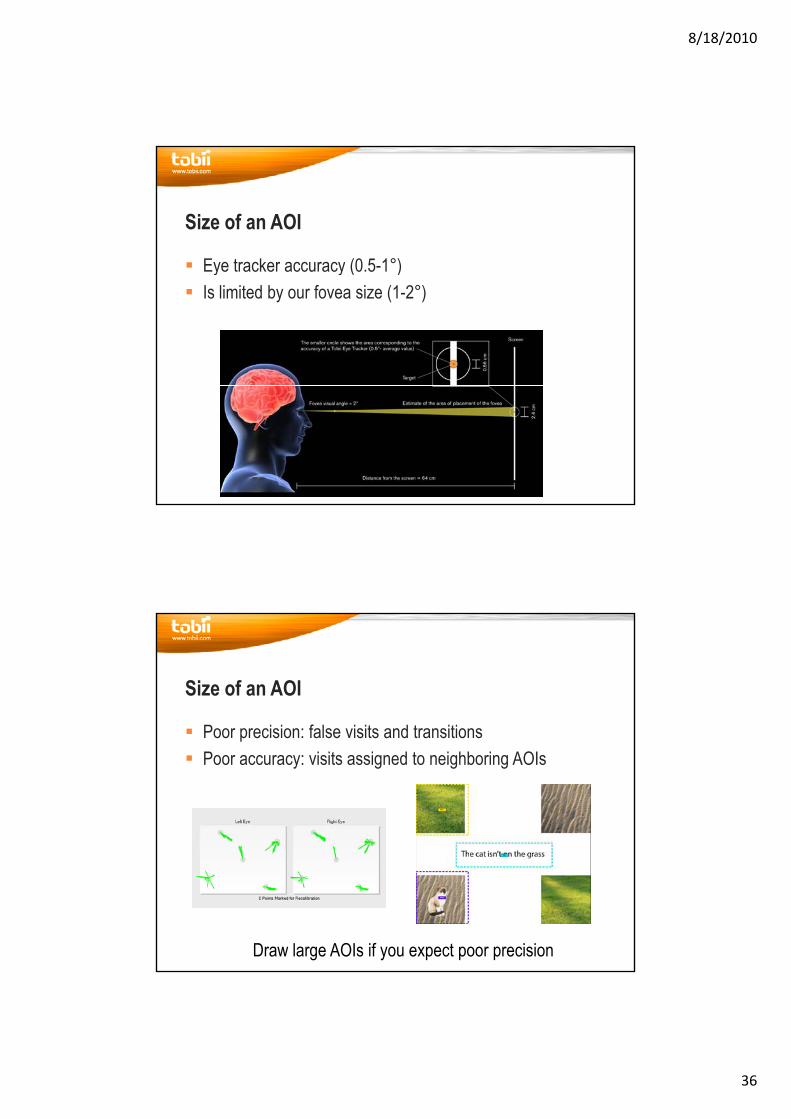
Size of an AOI
Eye tracker accuracy (0 5 1°)Eye tracker accuracy (0.5-1 )Is limited by our fovea size (1-2°)
Size of an AOI
Poor precision: false visits and transitions Poor precision: false visits and transitions Poor accuracy: visits assigned to neighboring AOIs
Draw large AOIs if you expect poor precision
8/18/2010
37
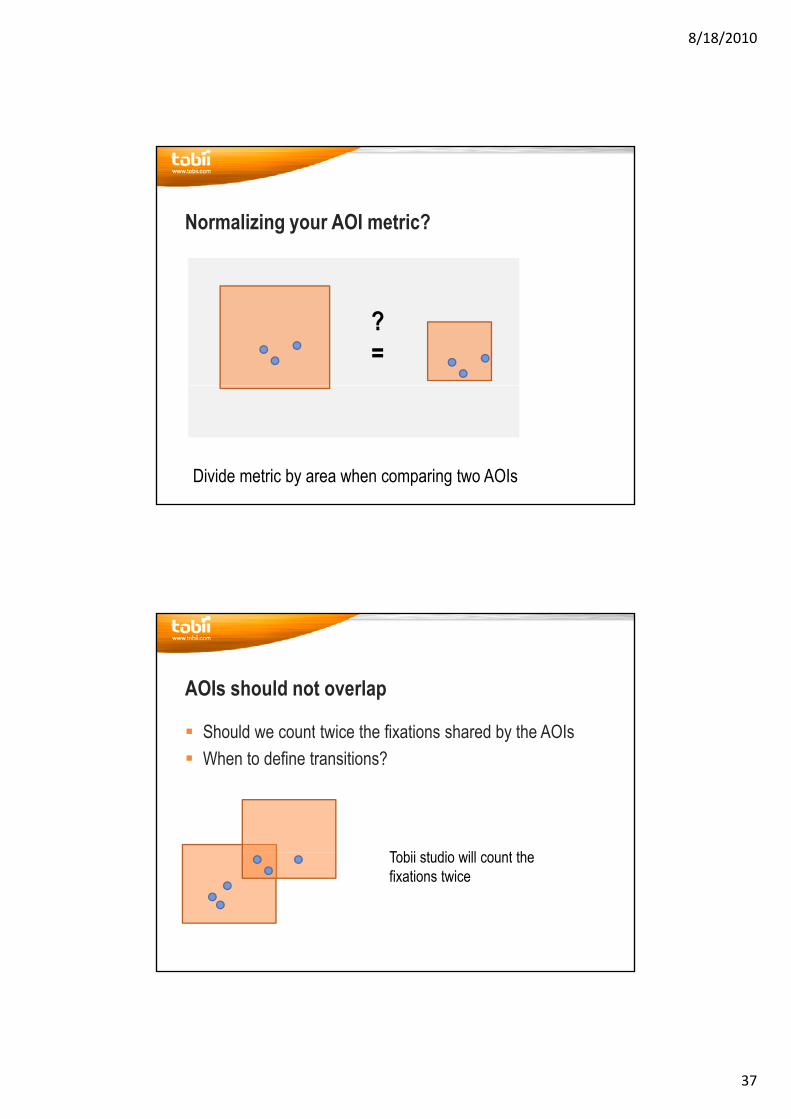
Normalizing your AOI metric?
?=
Divide metric by area when comparing two AOIs
AOIs should not overlap
Should we count twice the fixations shared by the AOIsShould we count twice the fixations shared by the AOIsWhen to define transitions?
T bii t di ill t th Tobii studio will count the fixations twice
8/18/2010
38
EYE TRACKING METRICSEYE TRACKING METRICS
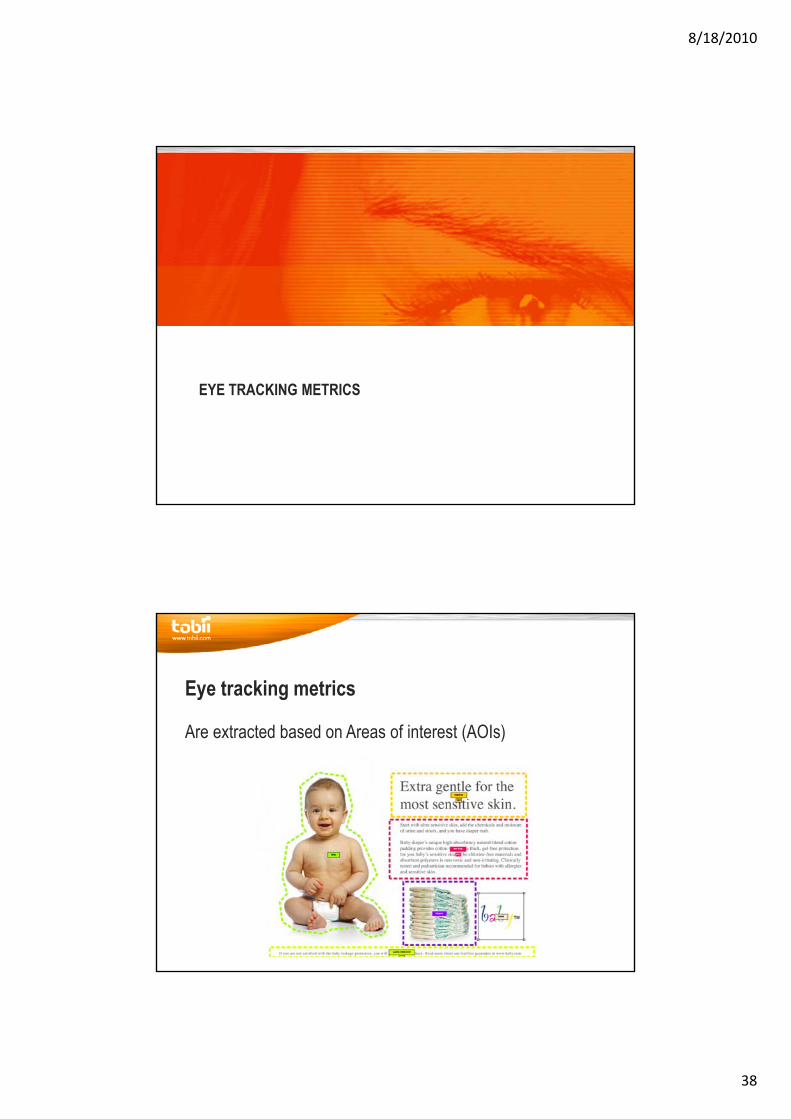
Eye tracking metrics
Are extracted based on Areas of interest (AOIs)Are extracted based on Areas of interest (AOIs)
8/18/2010
39
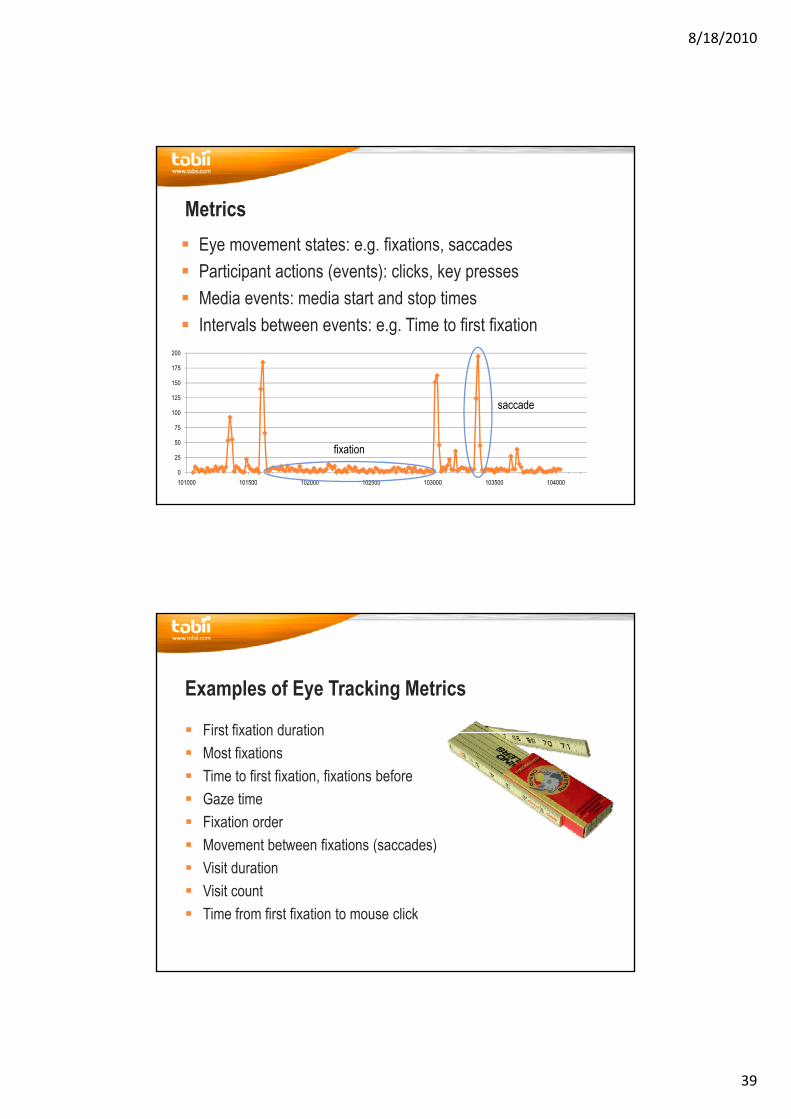
MetricsEye movement states: e.g. fixations, saccadesP ti i t ti ( t ) li k k Participant actions (events): clicks, key pressesMedia events: media start and stop timesIntervals between events: e.g. Time to first fixation
150
175
200
0
25
50
75
100
125
101000 101500 102000 102500 103000 103500 104000
fixation
saccade
Examples of Eye Tracking Metrics
First fixation durationFirst fixation durationMost fixationsTime to first fixation, fixations beforeGaze timeFixation orderMovement between fixations (saccades)( )Visit durationVisit countTime from first fixation to mouse click
8/18/2010
40
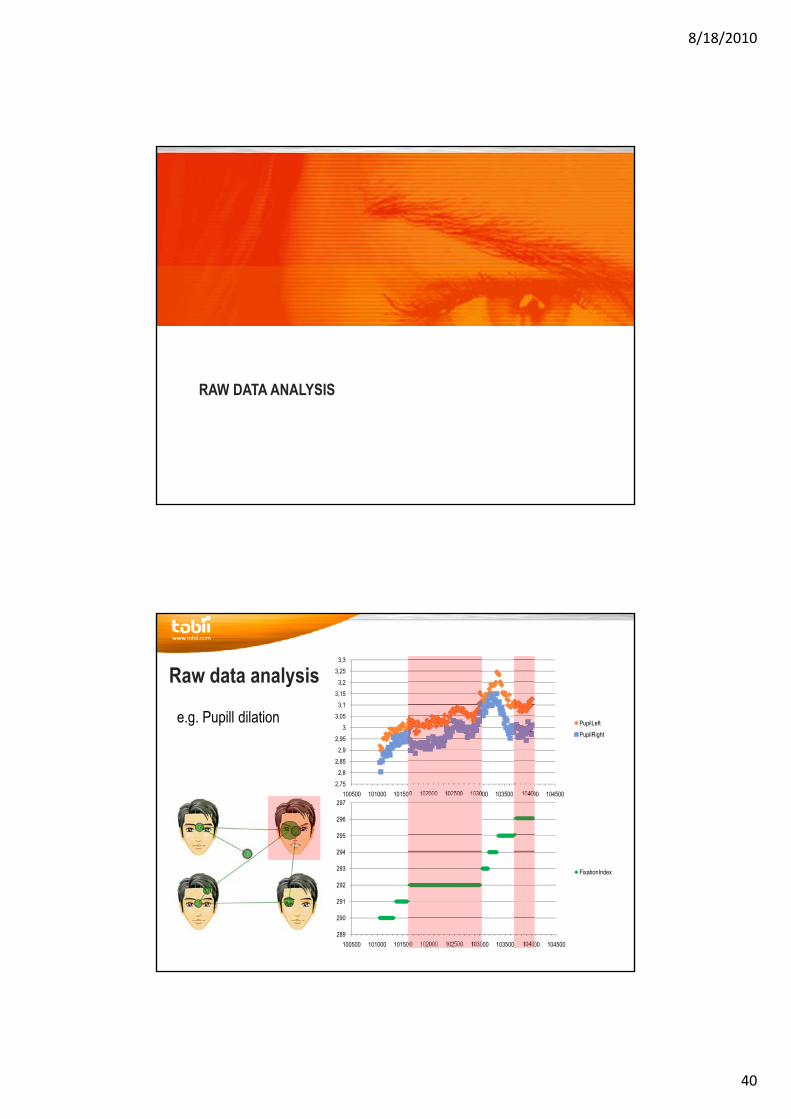
RAW DATA ANALYSISRAW DATA ANALYSIS
33,05
3,13,15
3,23,25
3,3
PupilLeftP ilRi ht
Raw data analysis
e.g. Pupill dilation
2,752,8
2,852,9
2,95
100500 101000 101500 102000 102500 103000 103500 104000 104500
PupilRight
294
295
296
297
289
290
291
292
293
294
100500 101000 101500 102000 102500 103000 103500 104000 104500
FixationIndex
8/18/2010
41
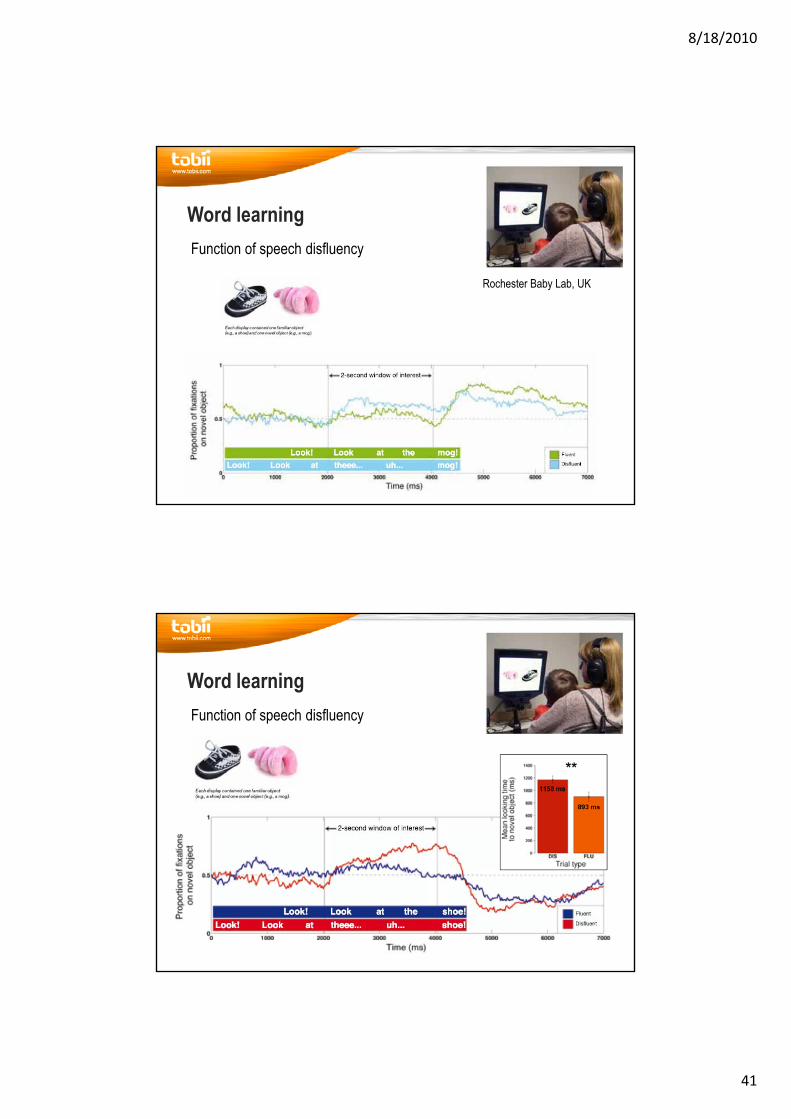
Word learningFunction of speech disfluency
Rochester Baby Lab, UK
Word learningFunction of speech disfluency
8/18/2010
42
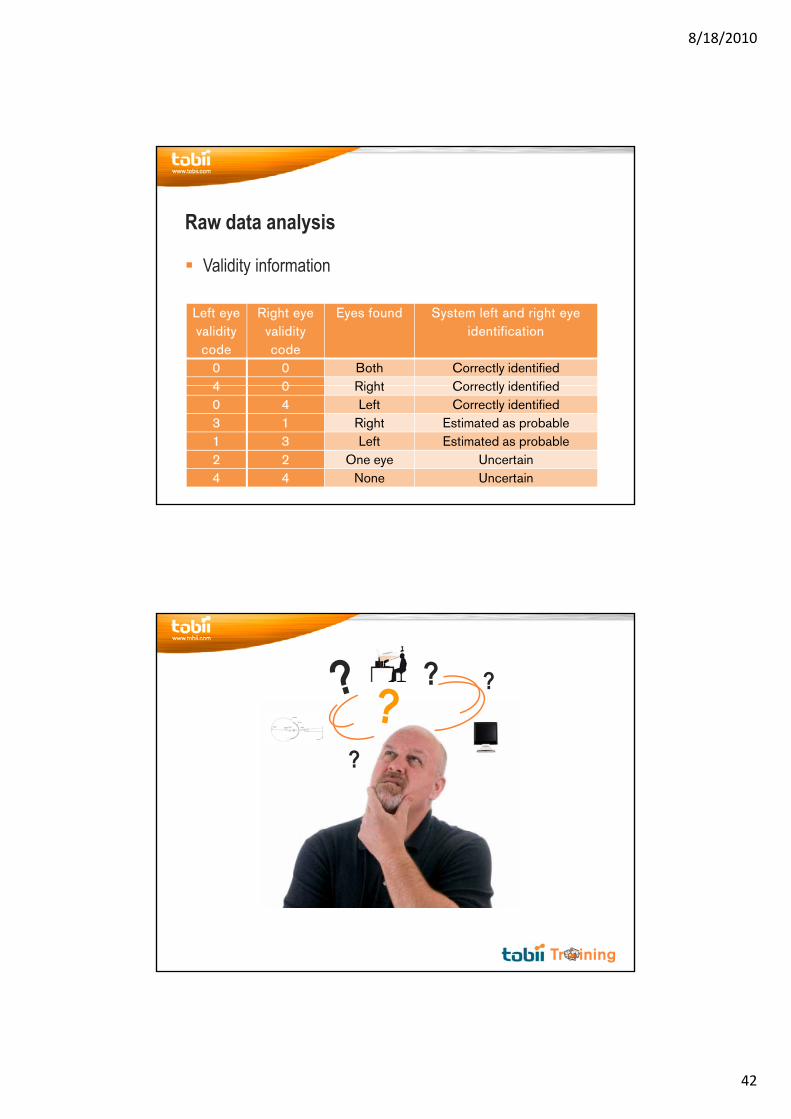
Raw data analysis
Validity informationValidity information
Left eye validity code
Right eye validity code
Eyes found System left and right eye identification
0 0 Both Correctly identified4 0 Right Correctly identified4 0 Right Correctly identified0 4 Left Correctly identified3 1 Right Estimated as probable1 3 Left Estimated as probable2 2 One eye Uncertain4 4 None Uncertain
? ?
?
Tr ining