
DESIGNING AND MANUFACTURING OF COMPUTER …
126
T.C. MARMARA UNIVERSITY ENGINEERING DEPARTMENT DESIGNING AND MANUFACTURING OF COMPUTER CONTROLLED HYDRAULIC TENSILE TESTING MACHINE REMZİ ŞAHİNOĞLU MECHANICAL ENGINEERING THESIS ADVISOR ASSIT.PROF. BÜLENT EKİCİ January, 2013
Transcript of DESIGNING AND MANUFACTURING OF COMPUTER …
T.C.
MARMARA UNIVERSITY
ENGINEERING DEPARTMENT
DESIGNING AND MANUFACTURING OF COMPUTER
CONTROLLED HYDRAULIC TENSILE TESTING
MACHINE
REMZİ ŞAHİNOĞLU
MECHANICAL ENGINEERING
THESIS
ADVISOR
ASSIT.PROF. BÜLENT EKİCİ
January, 2013

T.C.
MARMARA UNIVERSITY
ENGINEERING DEPARTMENT
DESIGNING AND MANUFACTURING OF COMPUTER
CONTROLLED HYDRAULIC TENSILE TESTING
MACHINE
REMZİ ŞAHİNOĞLU
MECHANICAL ENGINEERING
_______________
ASSIT.PROF. BÜLENT EKİCİ
(Advisor)
_______________ ________________
PROF. DR. ABDÜLKERİM KAR ASSIT.PROF. AYKUT KENTLİ
(Jury Member) (Jury Member)
January, 2013

i
CONTENTS
Page
CONTENTS ................................................................................................................... i
ABSTRACT ................................................................................................................... iii
TABLE LIST ................................................................................................................. iv
FIGURE LIST ............................................................................................................... v
SYMBOL LIST ............................................................................................................. vii
ABBREVIATIONS LIST .......................................................................................... viii
APPENDIX LIST ......................................................................................................... ix
I. INTRODUCTION ................................................................................................... 1
I.1 INTRODUCTION TO TENSILE TESTING ............................................. 1
I.2 HISTORY ....................................................................................................... 2
I.3 STANDARDS ................................................................................................. 5
II. GENERAL BACKGROUND ............................................................................ 8
II.1. TENSILE SPECIMEN ................................................................................ 8
II.2. GRIPPING TECHNIQUES ........................................................................ 14
II.3. ALIGNMENT .............................................................................................. 16
II.3.1. Sample Preparation .......................................................................... 16
II.3.2. The test set-up ................................................................................... 17
II.4. TENSILE TEST MACHINE ...................................................................... 20
II.4.1. Electromechanical Machines ........................................................... 21
II.4.2. Servo Hudraulic Machines ............................................................... 23
II.5. CONTROL OF MACHINE ........................................................................ 23
II.6. SPEED OF TESTING ................................................................................. 24

ii
II.6.1. Strain Rate ......................................................................................... 25
II.6.2. Stress Rate ......................................................................................... 26
II.6.3. Cross-head separation rate .............................................................. 28
II.6.3. Elapsed time ...................................................................................... 29
II.7. MACHINE STIFNESS ................................................................................ 29
II.7.1. Determination of Testing Machine Stiffness .................................. 31
II.8. TENSILE TESTING EQUIPMENTS ........................................................ 32
II.8.1. Load Cells .......................................................................................... 32
II.8.2. Extensometry ..................................................................................... 33
III. THE STUDY .......................................................................................................... 35
III.1. WEDGE GRIP ............................................................................................ 37
III.2. THE MAIN CONSTRUCTION ................................................................ 43
III.3. HYDRAULIC CYLINDER AND UNITE ................................................ 45
III.4. ELECTRIC PANEL .................................................................................. 48
III.5. SENSOR CONNECTIONS ...................................................................... 50
III.6. DATA OF TESTING ................................................................................ 51
III.7. TROUBLESSHOOTING ...................................................................................... 55
IV. RESULTS AND ARGUMENTS ..................................................................... 56
V. CONCLUDING ....................................................................................................... 57
ACKNOWLEDGEMENT ........................................................................................ 58
RESOURCES ................................................................................................................ 59
APPENDIX ..................................................................................................................... 60

iii
ABSTRACT
DESIGNING AND MANUFACTURING OF COMPUTER
CONTROLLED HYDRAULIC TENSILE TESTING MACHINE
What is a universal tensile testing machine, where are the used for what purpose, and the
history of the types are assaied. In the following sections by considering the factors that
should be considered when designing the machine is capable of 5tonf a tensile testing
machine has been designed and manufactured, and is controlled with a computer. Chapter
1, the history of this machine, and created standards for tensile tests are discussed. In
general, the preparation of these standards on the specimen geometry. Chapter 2 focuses on
machine design issues must be considered. Affect the selection of equipment required for
this machine to get the correct result. Chapter 3, information and documentation relating to
the design are made and manufactured in compliance with the matters in the previous
section. The results obtained and discussed in chapters 4 and 5 were necessary experience.
ÖZET
Üniversal bir çekme testi makinasının ne olduğuna, ne amaçla nelerde kullanıldığına,
tiplerine ve tarihçesine bakılmıştır. İlerleyen bölümlerde makina tasarımı yapılırken dikkat
edilmesi gereken hususlar dikkate alınarak 5tonf kapasitesine sahip bir çekme testi
makinası tasarlanıp imal edilmiş ve bilgisayar ile kontrol edilmeye çalışılmıştır. Bölüm
1’de bu makinaın tarihçesinden ve çekme testi için oluşturulmuş standartlardan
bahsedilmiştir. Bu standartlar genel olarak numune parçanın hazırlanması üzerindedir.
Bölüm 2’de makine tasarımında dikkat edilmesi gereken hususlar üzerinde durulmuştur. Bu
makine için gerekli olan ekipmanların seçilmesi doğru sonuç almayı etkiler. Bölüm 3’de bi
önceki bölümdeki hususlara uyularak tasarım yapılmış ve imal edilmesiyle ilgili bilgiler ve
dokumantasyonlar verilmiştir. Bölüm 4 ve 5’te elde edilen sonuçlar tartışılmış ve gerekli
tecrübeler çıkarılmıştır.

iv
TABLES
Table I.1 Tensile testing standards for various materials ................................................... 5
Table II.1 Cross sections of semi-finished specimens ....................................................... 9
Table II.2 0.1-0.3 metal flat specimens .............................................................................. 11
Table II.3 Diameter > 4 mm circular cross-section tensile test specimens ........................ 13
Table II.4 Strain rate ranges for different tests .................................................................. 26
Table II.5 Classification of extensometer systems............................................................. 34
v
FIGURES
Fig I.1 Petrus van Musschenbroek lever testing machine .................................................. 3
Fig I.2 George Rennie’s lever tensile testing machine. ...................................................... 4
Fig I.3 Fairbain’s tensile testing machine used for high temperature tensile testing ......... 4
Fig I.4 Fairbain’s tensile testing machine used for high temperature tensile testing ......... 4
Fig I.5 Bauschinger’s Roller and Mirror Extensometer ..................................................... 4
Fig I.6 Robotic Tensile Test Machines and MULTI-Line with 2 integrated machines ..... 5
Fig I.7 Standard ASTM geometry for threaded tensile specimens ..................................... 7
Fig II.1 Headed and headless specimen of tensile testing .................................................. 10
Fig II.2 Headless tensile test specimen rod and wire ......................................................... 12
Fig II.3 Diameter > 4 mm circular tensile test samples sizes of products .......................... 12
Fig II.4 d >3 mm from the tensile test specimens with dimensions of flat materials ......... 13
Fig II.5 Systems for gripping tensile specimens ................................................................ 15
Fig II.6 Improper and proper alignment of specimen......................................................... 17
Fig II.7 Improper and proper alignment of specimen......................................................... 18
Fig II.8 Proper and improper engagement of a specimen in wedge grips .......................... 18
Fig II.9 Components of an electromechanical (screw-driven) testing machine ................. 22
Fig II.10 Schematic of a basic servohydraulic, closed-loop testing machine .................... 23
Fig II.11 Examples of stress-strain curves exhibiting pronounced yield-point behavior ... 27
Fig II.12 Illustration of the differences between constant stress and strain ....................... 28
Fig II.13 Schematic illustrating crosshead displacement and elastic deflection ................ 30
Fig II.14 S-beam Load Cell 5tonf....................................................................................... 32
Fig II.15 Test specimen with an extensometer attached to measure .................................. 33
Fig II.16 Strain gages mounted directly to a specimen ...................................................... 33
Fig III.1 3D view the tensile test machine(left) and the real image(right) ......................... 36
Fig III.2 Wedge type tensile test machine grip(left) and specimen position(right) ........... 38
Fig III.3 Mesh diagram block part on solid works ............................................................. 38

vi
Fig III.4 The block stress and displacement distrubution .................................................. 39
Fig III.5 The block screw nut stress and displacement distrubution .................................. 39
Fig III.6 The connection screw stress and displacement distrubution ............................... 40
Fig III.7 The block screw nut ............................................................................................. 40
Fig III.8 The wedge stress and displacement distrubution ................................................. 41
Fig III.9 Some images of manufacturing of the wege grips ............................................... 42
Fig III.10 The Guide shaft bearing(top), real image of bottom view (bottom) .................. 43
Fig III.11 The guide shaft stress and displacement distrubution ....................................... 44
Fig III.12 The Chassis designed on solidworks(left) and real image(right) ...................... 45
Fig III.13 3D view, real image of hydraulic clinder and hydraulic unite ........................... 46
Fig III.14 Hydraulic Circuit Diagram ................................................................................ 46
Fig III.15 Electric Panel(left), Control buttons(right) ........................................................ 49
Fig III.16 Logic diagram to lock down for same two signal if on, and case diagram ....... 49
Fig III.17 Typical Tension Stress-Strain Diagram ............................................................. 54
Fig III.18 Simple Matlab Program about recieving,calculation and showing datas .......... 54
vii
SYMBOLS
A0 : Initial Area
a : Thickness of specimen
b : Width of specimen
d : Diameter of rounded specimen
e : Engineering Strain
ep : The average plastic strain in the specimen
E : Modulus of Elasticity
k : Coefficient of specimen length
K : The stiffness of the machine
L0 : Initial Length
Lc : Body Length
Lt : Total Length
µ : micro
P0 : Specimen load rate
s : Second
S0 : Initial Cross Sectional Area
σ : Stress
ε : Strain
viii
ABBREVIATIONS
ASTM : American Society for Testing and Materials
ISO : International Organization for Standardization
JIS : Japanese Industrial Standards
UTM : Universal Test Machine
UYS : Upper Yield Stress
LYS : Lower Yield Stress
YPE : Yield-Point Elongation
EL : Elastic Limit

ix
APPENDIX LIST
APP.1: Technical Drawings of The Machine ..................................................................... 59
APP.2: Technical Drawings of The Chassis....................................................................... 65
APP.3: Technical Drawings of The Guide Shaft................................................................ 70
APP.4: Technical Drawings of The Wedge Grip ............................................................... 82
APP.5: Technical Drawings of The Hydraulic Cylinder .................................................... 97
APP.6: G-Codes of The Grip Parts...................................................................................107
APP.7: Electronic Circuit Diagrams.................................................................................111
APP.8: Electric Terminal Connection...............................................................................112

1
CHAPTER I
I.1. INTRODUCTION TO TENSILE TESTING
THE TENSILE TEST is one of the most commonly used tests for evaluating materials. In
its simplest form, the tensile test is accomplished by gripping opposite ends of a test piece
(specimen) within the load frame of a test machine. A tensile force is applied by the
machine, resulting in the gradual elongation and eventual fracture of the test piece. During
the process, force-extension data, a quantitative measure of how the test piece deforms
under the applied tensile force, usually are monitored and recorded. When properly
conducted, the tensile test provides force-extension data that can quantify several important
mechanical properties of a material. These mechanical properties determined from tensile
tests include, but are not limited to, the following:
● Elastic deformation properties, such as the modulus of elasticity (Young‘s modulus) and
Poisson‘s ratio
● Yield strength and ultimate tensile strength
● Ductility properties, such as elongation and reduction in area
● Strain-hardening characteristics
These material characteristics from tensile tests are used for quality control in production,
for ranking performance of structural materials, for evaluation of newly developed alloys,
and for dealing with the static strength requirements of design. The results from the test are
commonly used to select a material for an application, for quality control, and to predict
how a material will react under other types of forces. Properties that are directly measured
via a tensile test are ultimate tensile strength, maximum elongation and reduction in
area. From these measurements the following properties can also be determined: Young's
modulus,Poisson's ratio, yield strength, and strain-hardening characteristics.
2
I.2. HISTORICAL BACKGROUND
The knowledge of a materials ability to safely sustain a load before breaking has been of
paramount importance to man ever since structures were first built. It is difficult to
Conceive that the qualitative ranking of softwoods, hardwoods and stone were unknown in
the Neolithic time, and the Greek, Egyptian, Roman and Norman civilizations clearly had
an understanding of material strength perhaps purely based on experience. However it is
not until the Renaissance period in the 16th century that documentary evidence from the
writings of Leonardo da Vinci are found, which show that quantitative methods were
employed to measure the differences in the material properties, Timoshenko (1953) and
Gray (1988).
Thomas Young [1773-1829] is now associated with the measurement of the modulus of
elasticity of materials although most modern day research workers would not recognise the
description that he used to express the relationship between stress and strain:
‗A modulus of the elasticity of any substance is a column of the same substance
capable of producing a pressure on its base which is the weight causing a certain
degree of compression as the length of the substance is to the diminution of its length.‘
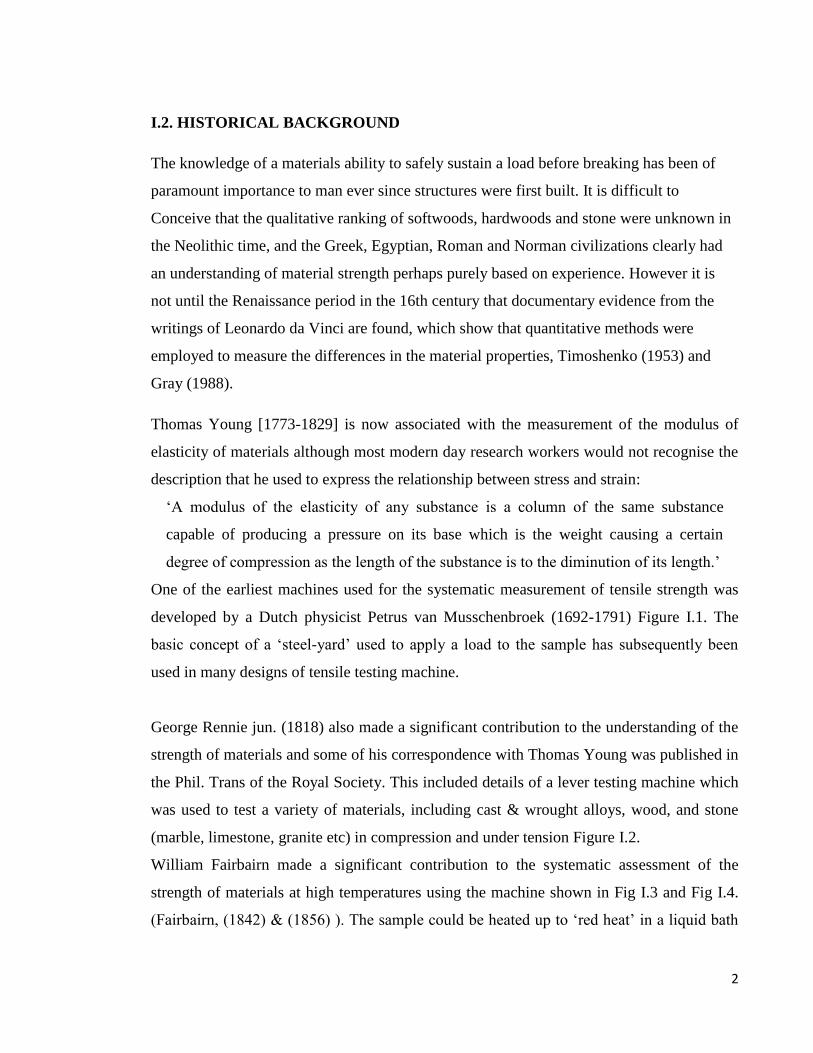
One of the earliest machines used for the systematic measurement of tensile strength was
developed by a Dutch physicist Petrus van Musschenbroek (1692-1791) Figure I.1. The
basic concept of a ‗steel-yard‘ used to apply a load to the sample has subsequently been
used in many designs of tensile testing machine.
George Rennie jun. (1818) also made a significant contribution to the understanding of the
strength of materials and some of his correspondence with Thomas Young was published in
the Phil. Trans of the Royal Society. This included details of a lever testing machine which
was used to test a variety of materials, including cast & wrought alloys, wood, and stone
(marble, limestone, granite etc) in compression and under tension Figure I.2.
William Fairbairn made a significant contribution to the systematic assessment of the
strength of materials at high temperatures using the machine shown in Fig I.3 and Fig I.4.
(Fairbairn, (1842) & (1856) ). The sample could be heated up to ‗red heat‘ in a liquid bath
3
heated by a fire grate, which would be removed when the desired temperature had been
achieved. Loads up to 446 kN could be applied to the testpieces by the lever system (Smith,
(1963) & Loveday,(1982)).
Prof Johann Bauschinger [1834 – 1893] is credited with the introduction of the double-
sided extensometers, Figure I.5, which allow compensation for curvature or misalignment
of the testpiece. This made a significant improvement to the measurement of tensile strain,
and allowed sufficient precision of measurement to observe that yield stress is lowered
when deformation in one direction is followed by deformation in the opposite direction.
This is now known as the ‗Bauschinger effect‘ (Bauschinger,(1881)).
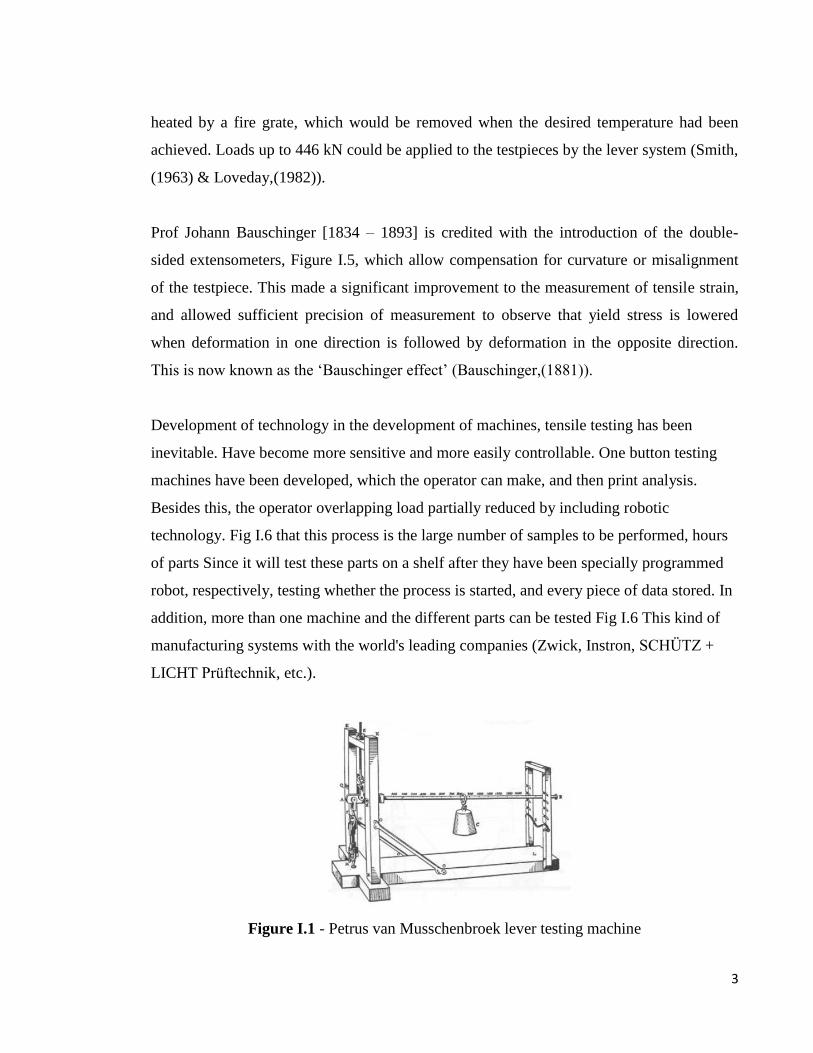
Development of technology in the development of machines, tensile testing has been
inevitable. Have become more sensitive and more easily controllable. One button testing
machines have been developed, which the operator can make, and then print analysis.
Besides this, the operator overlapping load partially reduced by including robotic
technology. Fig I.6 that this process is the large number of samples to be performed, hours
of parts Since it will test these parts on a shelf after they have been specially programmed
robot, respectively, testing whether the process is started, and every piece of data stored. In
addition, more than one machine and the different parts can be tested Fig I.6 This kind of
manufacturing systems with the world's leading companies (Zwick, Instron, SCHÜTZ +
LICHT Prüftechnik, etc.).
Figure I.1 - Petrus van Musschenbroek lever testing machine

4
Fig I.2 - George Rennie‘s lever tensile testing machine. (Rennie, (1818))
Fig I.3,4 - Fairbain‘s tensile testing machine used for high temperature tensile testing
Fig I.5 - Bauschinger‘s Roller and Mirror Extensometer ( Unwin (1910))
5
Fig I.6 - Robotic Tensile Test Machines and MULTI-Line with 2 integrated machines
I.3. TENSILE TESTING REQUIREMENTS AND STANDARDS
Tensile testing requirements are specified in various standards for a wide variety of
different materials and products. Table 1 lists various tensile testing specifications from
several standards organizations. These specifications define requirements for the test
apparatus, test specimens, and test procedures. Standard tensile tests are conducted using a
threaded tensile specimen geometry, like the standard ASTM geometry (Fig I.7) of ASTM
E 8. To load the specimen in tension, the threaded specimen is screwed into grips attached
to each crosshead. The boundary condition, or load, is applied by moving the crossheads
away from one another.
Table I.1 - Tensile testing standards for various materials and product forms
Specification number - Specification title
ASTM A 770 Standard Specification for Through-Thickness Tension Testing of Steel
Plates for Special Applications
ASTM A 931 Standard Test Method for Tension Testing of Wire Ropes and Strand
6
ASTM B 557 Standard Test Methods of Tension Testing Wrought and Cast Aluminum-
and Magnesium-Alloy Products
ASTM B 557M Standard Test Methods of Tension Testing Wrought and Cast Aluminum-
and Magnesium-Alloy Products [Metric]
ASTM C 565 Standard Test Methods for Tension Testing of Carbon and Graphite
Mechanical Materials
ASTM C 1275 Standard Test Method for Monotonic Tensile Strength Testing of
Continuous Fiber-Reinforced Advanced Ceramics with
Solid Rectangular Cross-Section Specimens at Ambient Temperature
ASTM C 1359 Standard Test Method for Monotonic Tensile Strength Testing of
Continuous Fiber-Reinforced Advanced Ceramics with
Solid Rectangular Cross-Section Specimens at Elevated Temperatures
ASTM D 76 Standard Specification for Tensile Testing Machines for Textiles
ASTM E 8 Standard Test Methods for Tension Testing of Metallic Materials
ASTM E 8M Standard Test Methods for Tension Testing of Metallic Materials [Metric]
ASTM E 338 Standard Test Method of Sharp-Notch Tension Testing of High-Strength
Sheet Materials
ASTM E 345 Standard Test Methods of Tension Testing of Metallic Foil
ASTM E 602 Standard Method for Sharp-Notch Tension Testing with Cylindrical
Specimens
ASTM E 740 Standard Practice for Fracture Testing with Surface-Crack Tension
Specimens
ASTM E 1450 Standard Test Method for Tension Testing of Structural Alloys in Liquid
Helium
ASTM F 1501 Standard Test Method for Tension Testing of Calcium Phosphate Coatings
ASTM F 152 Standard Test Methods for Tension Testing of Nonmetallic Gasket Materials
ASTM F 19 Standard Test Method for Tension and Vacuum Testing Metallized Ceramic
Seals
ASTM F 1147 Standard Test Method for Tension Testing of Porous Metal Coatings
BS EN 10002 Tensile Testing of Metallic Materials

7
BS 18 Method for Tensile Testing of Metals (Including Aerospace Materials)
BS 4759 Method for Determination of K-Values of a Tensile Testing System
BS 3688-1 Tensile Testing
BS 3500-6 Tensile Stress Relaxation Testing
BS 3500-3 Tensile Creep Testing
BS 3500-1 Tensile Rupture Testing
BS 1687 Medium-Sensitivity Tensile Creep Testing
BS 1686 Long-Period, High-Sensitivity, Tensile Creep Testing
DIN 53455 Tensile Testing: Testing of Plastics
DIN 53328 Testing of Leather, Tensile Test
DIN 50149 Tensile Test, Testing of Malleable Cast Iron
EN 10002-1 Metallic Materials—Tensile Testing—Part 1: Method of Test at Ambient
Temperature
ISO 204 Metallic Materials—Uninterrupted Uniaxial Creep Testing Intension—Method of
Test
ISO 783 Metallic Materials—Tensile Testing at Elevated Temperature
ISO 6892 Metallic Materials—Tensile Testing at Ambient Temperature
JIS B 7721 Tensile Testing Machines
JIS K 7113 Testing Methods for Tensile Properties of Plastics (English Version)
Fig I.7 Standard ASTM geometry for threaded tensile specimens.Dimensions for the
specimen are taken from ASTM E 8M (metric units), or ASTM E 8 (English units).

8
CHAPTER II
This chapter is about issue matters to be considered in the design of a tensile testing
machine mentioned. First, the standard mesasurements for the test specimen should be
prepared in which the part indicated. Then the tensile test specimens were examined and
grips of a tensile test piece is connected incorrectly focused on what kind of conclusions
emerged. Second tensile testing machines as the main subject discussed and how they are
controlled drive systems on the investigation which are electromechanical and hydraulic
systems. The most important topics which are the test speed and machine stifness are
examined. The speed of testing is extremely important because mechanical properties are a
function of strain rate. It is, therefore, imperative that the speed of testing be specified in
either the tension-test method or the product specification. Finally, when the force applied
tensile test machine did not affect only the sample pieces, the machine also is deformed and
carried out an examination on this issue machines is known and has been sought for
deformation.
In light of this information has been used and the average capacity a tensile testing machine
has been designed and manufactured in the next chapter.
II.1. TENSILE SPECIMEN
The sample must be uniform along the length of the body sections. During that same cross-
section measurements should be continued. How will the section, to samples of products
from cross-section depends also on its own. Rounds of this circular cross-sections, square,
rectangular and ring-shaped and in some cases can also be a special profile.

9
Specimen Flat
Specimen
Pipe Wire, Rod Rod Profile
Specimen
Geometry
Thickness
class
0.1 < t < 3 EN10002/1 4 > thickness 4 > thickness 4 > thickness
Table II.1 - cross sections of semi-finished specimens
The test pieces are usually divided into semi-finished Its small sample size of elements can
be turned or cast or forged parts. Constant cross-section Maule (profiles, rods, wires, etc.)
with the bulk samples (cast iron, nonferrous alloys, etc.) may be tested before processing.
In the first cross-sectional area of the original gauge length of samples is proportional to the
samples calculated according to √ the formula. internationally accepted value of k
is 5.65. The first measurement of the samples should not be less than proportional to the
size ‘. S0 the first kesiy area of 5.65 when the coefficient k of the sample is too
small for this rule is made, which is a higher value of k using a sample of the original gauge
length of 11.3 or the veya 80 mm is disproportionate. Samples that are
disproportionate to the original gauge length and the first cross-sectional area and are
independent. Is present in samples per clutch, clutch head and body of the samples of at
least 12 mm radius (radius) must. The heads of the sample, if any, in accordance with the
sample and extrusion machine can be chosen freely.
II.1.1. Between 0.1 and 3.0 mm thickness of the flat tensile test specimens of products
Between 0.1 and 3.0 mm in thickness made of flat products must comply with the samples
sizes in the figure. As can be seen that the long edges parallel to each other accepted.
10
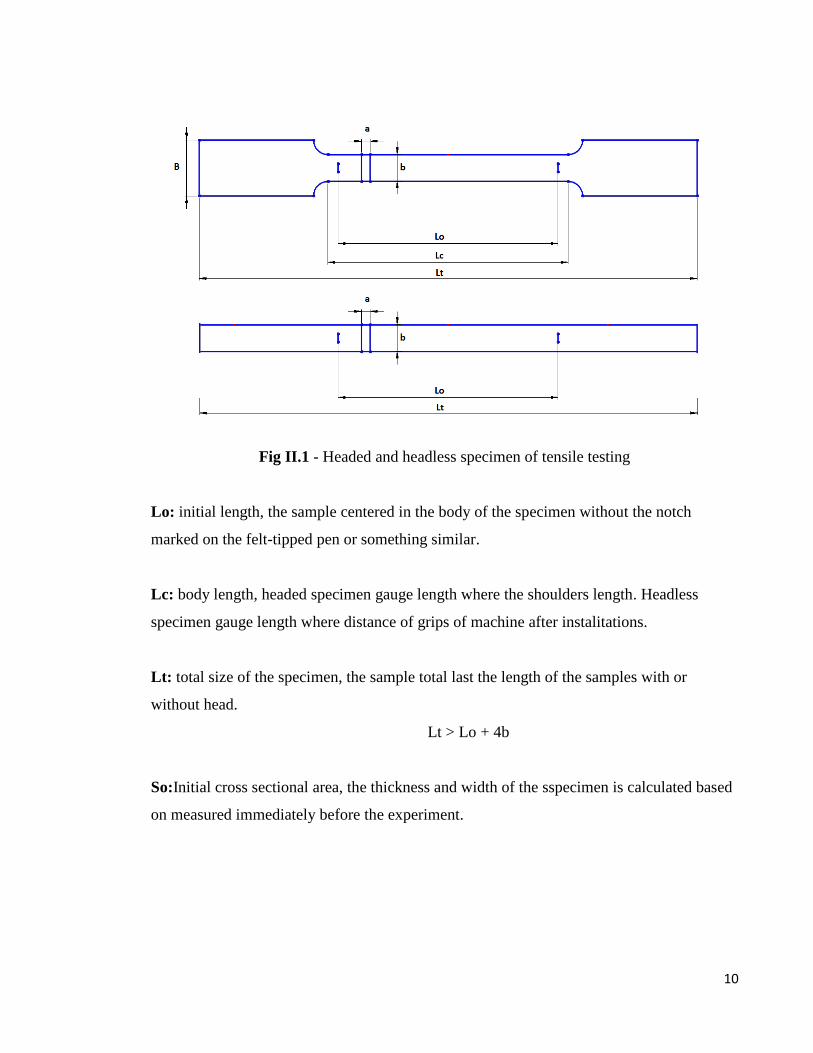
Fig II.1 - Headed and headless specimen of tensile testing
Lo: initial length, the sample centered in the body of the specimen without the notch
marked on the felt-tipped pen or something similar.
Lc: body length, headed specimen gauge length where the shoulders length. Headless
specimen gauge length where distance of grips of machine after instalitations.
Lt: total size of the specimen, the sample total last the length of the samples with or
without head.
Lt > Lo + 4b
So:Initial cross sectional area, the thickness and width of the sspecimen is calculated based
on measured immediately before the experiment.

11
Table II.2 - 0.1-0.3 metal flat specimens
II.1.2. The diameter and thickness under 4mm wire, rod and profile materials, specimens
Unprocessed samples are used directly as a sample cut and metal products. These headless
samples.
Initial gauge length of specimen is marked as L0=200mm or L0=100mm. Specimen
diametre d > 1 gauge length is L0=11,3√ .
Normally distance length between tensile machine grips must be at least L0+50 mm. L0,
this range is very-fine diametre samples to be equal. If the total length L of the sample of
sufficient length should be (L> L0, +150 mm) taken.
Range is required to determine an elongation at break of at least 50mm between the grips
can be determined.

12
Fig II.2 - Headless tensile test specimen rod and wire
II.1.3. The thickness of 3mm or 4mm thicker than the outside diameter or larger than the
thickness of flat products and wire, rod and profile materials tensile test samples.
Fig II.3 – diameter > 4 mm circular tensile test samples sizes of products

13
Table II.3 – diameter > 4 mm circular cross-section tensile test specimens
The head portions of the samples, tensile machine grips width and length desired can be
produced according to conditions. The transition region between the head body and circular
samples of at least 2mm in thickness and at least 12 mm radius of rectangular cross-section
of the specimen is required. Proportionality between the thickness of the samples ―a‖ with
rectangular cross-section width ―b‖ may be the most 8:1. 4-5 mm diameter sample is taken
from the thin material headless. Is not recommended because the body is less than 4mm in
diameter in the neck.
Fig II.4 - Greater than 3 mm from the tensile test specimens with dimensions of flat
materials
14
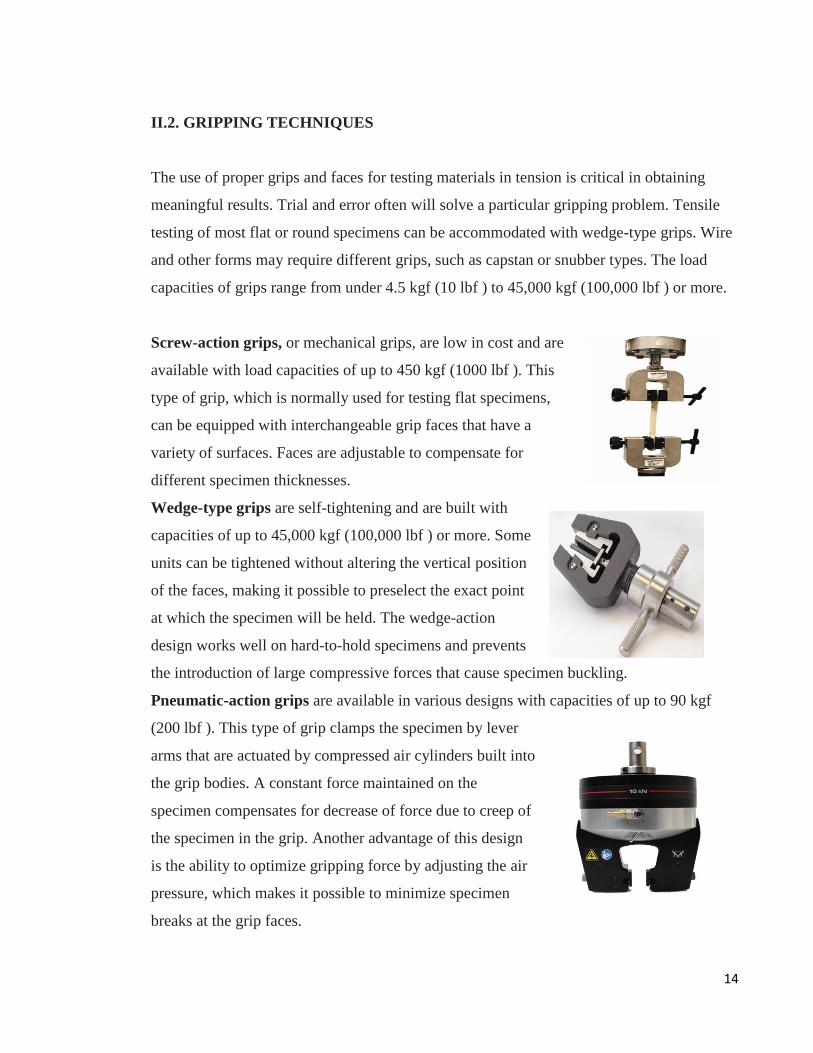
II.2. GRIPPING TECHNIQUES
The use of proper grips and faces for testing materials in tension is critical in obtaining
meaningful results. Trial and error often will solve a particular gripping problem. Tensile
testing of most flat or round specimens can be accommodated with wedge-type grips. Wire
and other forms may require different grips, such as capstan or snubber types. The load
capacities of grips range from under 4.5 kgf (10 lbf ) to 45,000 kgf (100,000 lbf ) or more.
Screw-action grips, or mechanical grips, are low in cost and are
available with load capacities of up to 450 kgf (1000 lbf ). This
type of grip, which is normally used for testing flat specimens,
can be equipped with interchangeable grip faces that have a
variety of surfaces. Faces are adjustable to compensate for
different specimen thicknesses.
Wedge-type grips are self-tightening and are built with
capacities of up to 45,000 kgf (100,000 lbf ) or more. Some
units can be tightened without altering the vertical position
of the faces, making it possible to preselect the exact point
at which the specimen will be held. The wedge-action
design works well on hard-to-hold specimens and prevents
the introduction of large compressive forces that cause specimen buckling.
Pneumatic-action grips are available in various designs with capacities of up to 90 kgf
(200 lbf ). This type of grip clamps the specimen by lever
arms that are actuated by compressed air cylinders built into
the grip bodies. A constant force maintained on the
specimen compensates for decrease of force due to creep of
the specimen in the grip. Another advantage of this design
is the ability to optimize gripping force by adjusting the air
pressure, which makes it possible to minimize specimen
breaks at the grip faces.

15
Hydraulic Grips are generally designed for testing of
metallic or non-metallic materials in both flat or round
specimen shapes. Hydraulic grips have a compact
body with large working space, and integrated
connections for other connection or gripping
elements. The eccentric piston shape with long piston
travel creates a deep positioning for the gripping
areas, and also a long gripping path. The required oil
pressure on the hydraulic unit is adjusted according to
the specimen grip's closing pressure. The control unit
will control the opening and closing sequences
separately for both the upper and lower specimen grips. Also the closing process has two
phases of clamping and gripping.
Fig II.5 - Systems for gripping tensile specimens. For round specimens, these include
threaded grips (a), serrated wedges (b), and, for butt end specimens, split collars
constrained by a solid collar (c). Sheet specimens may be gripped with pins (d) or serrated
wedges (e).
16
II.3. ALIGNMENT
The force application axis of the gripping device must coincide with the longitudinal axis of
symmetry of the test piece. If these axes do not coincide, the test piece will be subjected to
a combination of axial loading and bending. The stress acting on the different locations in
the cross section of the test piece then varies, from the sum of the axial and bending stresses
on one side of the test piece, to the difference between the two stresses on the other side.
Obviously, yielding will begin on the side where the stresses are additive and at a lower
apparent stress than would be the case if only the axial stress were present. For this reason,
the yield stress may be lowered, and the upper yield stress would appear suppressed in test
pieces that normally exhibit an upper yield point. For ductile materials, the effect of
bending is minimal, other than the suppression of the upper yield stress. However, if the
material has little ductility, the increased strain due to bending may cause fracture to occur
at a lower stress than if there were no bending.
II.3.1. Sample Preparation
Test samples must be prepared properly to achieve accurate results. The following rules
are suggested for general guidance. First, as each sample is obtained, it should be identified
as to material description, source, location and orientation with respect to the body of
material, processing status at the time of sampling, and the data and time of day that the
sample was obtained. Second, test specimens must be made carefully, with attention to
several details. The specimen axis must be properly aligned with the material rolling
direction, forging grain pattern, or composite layup. Cold working of the test section must
be minimized. The dimensions of the specimen must be held within the allowable
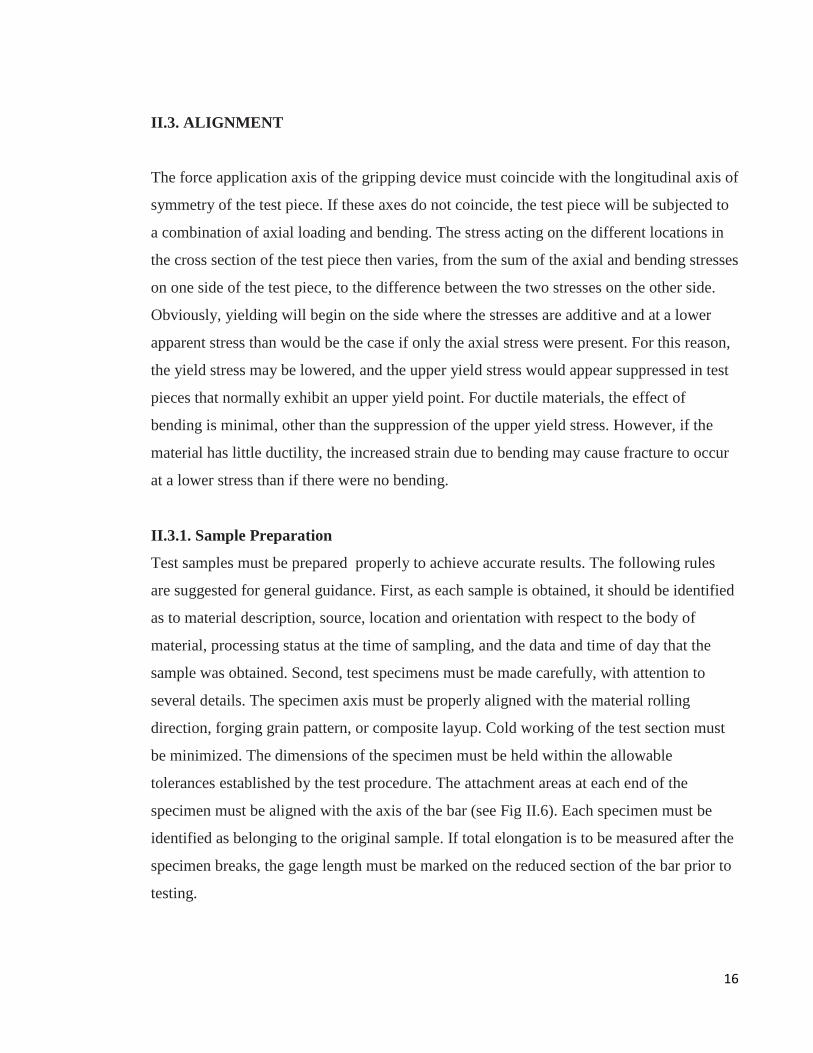
tolerances established by the test procedure. The attachment areas at each end of the
specimen must be aligned with the axis of the bar (see Fig II.6). Each specimen must be
identified as belonging to the original sample. If total elongation is to be measured after the
specimen breaks, the gage length must be marked on the reduced section of the bar prior to
testing.
17
Fig II.6 - Improper (left) and proper (right) alignment of specimen attachment areas with
axis of specimen
II.3.2. The test set-up
Requires that equipment be properly matched to the test at grips. There are three
requirements of the testing machine: force capacity sufficient to break the specimens to be
tested; control of test speed (or strain rate or load rate), as required by the test
specification; and precision and accuracy sufficient to obtain and record properly the load
and extension information generated by the test. This precision and accuracy should be
ensured by current calibration certification. For grips, of which many types are in common
use in tensile testing, only two rules apply: the grips must properly fit the specimens (or
vice versa), and they must have sufficient force capacity so that they are not damaged
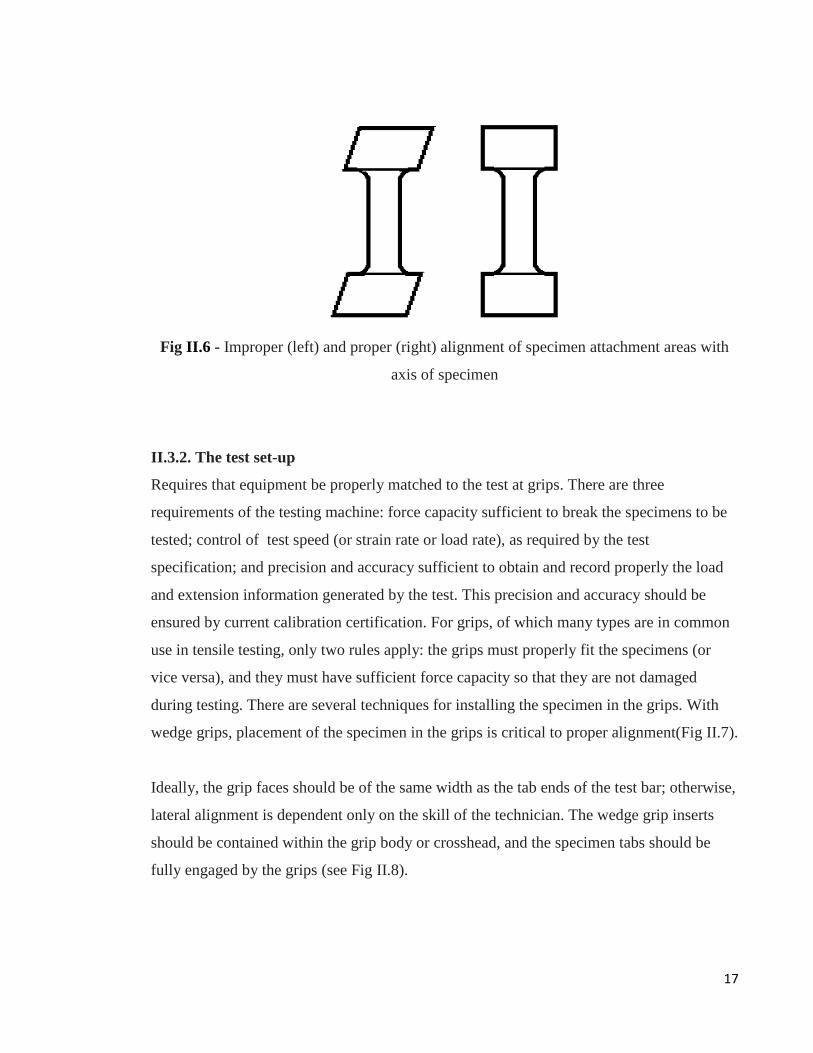
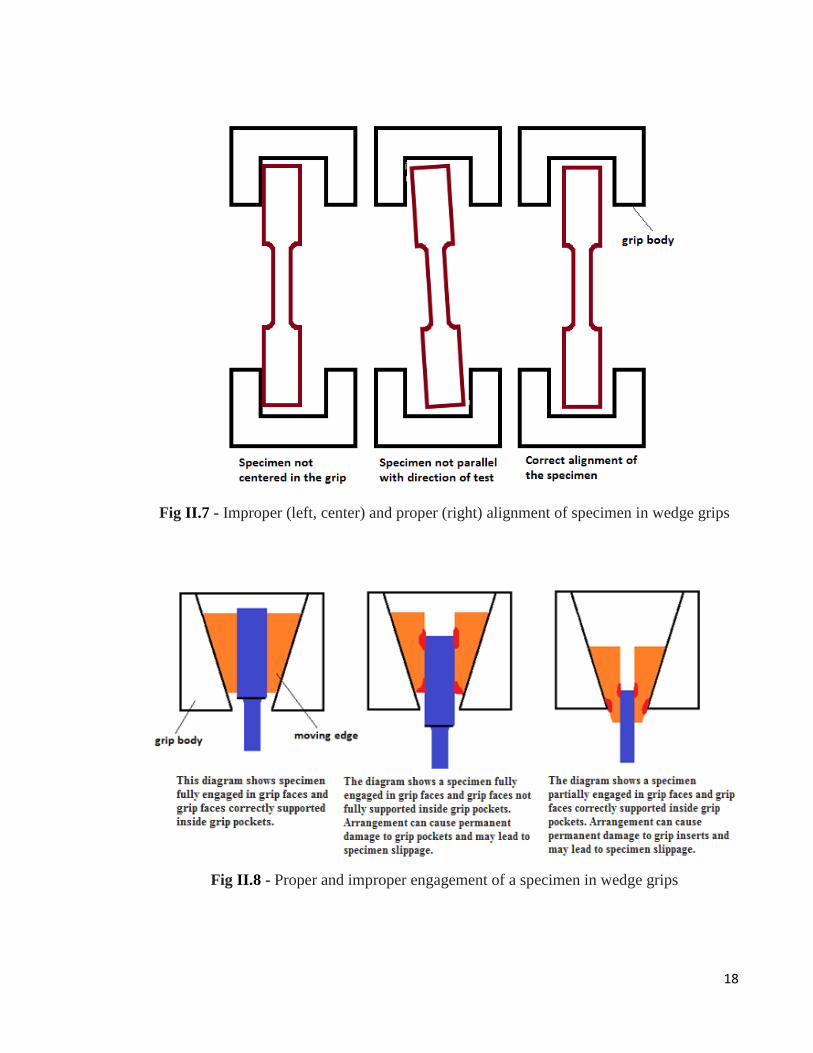
during testing. There are several techniques for installing the specimen in the grips. With
wedge grips, placement of the specimen in the grips is critical to proper alignment(Fig II.7).
Ideally, the grip faces should be of the same width as the tab ends of the test bar; otherwise,
lateral alignment is dependent only on the skill of the technician. The wedge grip inserts
should be contained within the grip body or crosshead, and the specimen tabs should be
fully engaged by the grips (see Fig II.8).
18
Fig II.7 - Improper (left, center) and proper (right) alignment of specimen in wedge grips
Fig II.8 - Proper and improper engagement of a specimen in wedge grips

19
There are several potential problems that must be watched for during the test set-up,
including specimen misalignment and worng grips. The physical alignment of the two
points of attachment of the specimen is important, because any off-center loading will exert
bending loads on the specimen. This is critical in testing of brittle materials, and may cause
problems even for ductile materials. Alignment will be affected by the testing-machine
loadframe, any grips and fixtures used, and the specimen itself. Misalignment may also
induce load-measurement errors due to the passage of bending forces through the load-
measuring apparatus. Such errors may be reduced by the use of spherical seats or ―Ujoints‖
in the set-up. Worn grips may contribute to off-center loading. Uneven tooth marks across
the width of the specimen tab are an indication of trouble in wedge grips. Split-collar grips
may also cause off-center loading. Uneven wear of grips and mismatching of split-shell
insert pairs are potential problem areas.
The technician must be responsible for doing the test according to specifications. He should
be aware of the potential errors introduced by the machine, extensometer, grips and
specimen irregularities, and also should alert the Lab supervisor when problems arise. In
short, the technician should be trained in correctly generating the stress vs. strain curve for
a given test method.
Correct alignment of the grips and the specimen, when clamped in the grips, is important.
Offsets in alignment will create bending stresses and lower tensile stress readings. It may
even cause the specimen to fracture outside the gage length.

20
II.4. TENSILE TEST MACHINES
The most common testing machines are universal testers, which test materials in tension,
compression, or bending. Their primary function is to create the stress-strain. Testing
machines are either electromechanical or hydraulic. The principal difference is the method
by which the load is applied. We will make a study of hydraulic tensil test machines.
Electromechanical machines are based on a variable-speed electric motor; a gear reduction
system; and one, two, or four screws that move the crosshead up or down. This motion
loads the specimen in tension or compression. Crosshead speeds can be changed by
changing the speed of the motor. A microprocessor-based closed-loop servo system can be
implemented to accurately control the speed of the crosshead.
Hydraulic testing machines are based on either a single or dual-acting piston that moves the
rosshead up or down. However, most static hydraulic testing machines have a single acting
piston or ram. In a anually operated machine, the operator adjusts the orifice of a pressure-
compensated needle valve to control the rate of loading. In a closed-loop hydraulic servo
system, the needle valve is replaced by an electrically perated servo valve for precise
control.
In some light-capacity machines (only a few hundred pounds maximum), the force is
applied by an air piston and cylinder. Gear-driven systems obtain load capacities up to
approximately 600 kN (1.35x10^5 lbf ), while hydraulic systems can obtain forces up to
approximately 4500 kN (1x10^6 lbf ). Whether the machine is a gear-driven system or
hydraulic system, at some point the test machine reaches a maximum speed for loading the
specimen. Gear driven test machines have a maximum crosshead speed limited by the
speed of the electric motor in combination with the design of the gear box transmission.
Crosshead speed of hydraulic machines is limited to the capacity of the hydraulic pump to
deliver a steady pressure on the piston of the actuator or crosshead. Servohydraulic test
machines offer a wider range of crosshead speeds; however, there are continuing advances

21
in the speed control of screw-driven machines, which can be just as versatile as, or perhaps
more versatile than, servohydraulic machines.
Conventional gear-driven systems are generally designed for speeds of about 0.001 to 500
mm/min (4x10^-6 to 20 in/min), which is suitable for quasi-static testing. Servohydraulic
systems are generally designed over a wider range of test speeds, such as:
● 1 µm/h test speeds for creep-fatigue, stresscorrosion, and stress-rupture testing
● 1 µm/min test speeds for fracture testing of brittle materials
● 10 m/s (400 in/s) test speeds for dynamic testing of components like bumpers or seat
belts
II.4.1. Electromechanical Machines
Gear-driven (or screw-driven) machines are electromechanical devices that use a large
actuator screw threaded through a moving crosshead (Fig. II.9). The screw is turned in
either direction by an electric motor through a gear reduction system. The screws are
rotated by a variable-control motor and drive the moveable crosshead up or down. This
motion can load the specimen in either tension or compression, depending on how the
specimen is to be held and tested. Screw-driven testing machines currently used are of
either a one-, two-, or four-screw design. To eliminate twist in the specimen from the
rotation of the screws in multiple-screw systems, one screw has a right-hand thread, and the
other has a left-hand thread. For alignment and lateral stability, the screws are supported in
bearings on each end. In some machines, loading crossheads are guided by columns or
guideways to achieve alignment. A range of crosshead speeds can be achieved by varying
the speed of the electric motor and by changing the gear ratio. A closed-loop servodrive
system ensures that the crosshead moves at a constant speed. The desired or userselected
speed and direction information is compared with a known reference signal, and the
servomechanism provides positional control of the moving crosshead to reduce any error or
difference. State-of-the-art systems use precision optical encoders mounted directly on

22
preloaded twin ball screws. These types of systems are capable of measuring crosshead
displacement to an accuracy of 0.125% or better with a resolution of 0.6 µm.
Fig II.9 - Components of an electromechanical (screw-driven) testing machine. For the
configuration shown, moving the lower (intermediate) head upward produces tension in the
lower space between the crosshead and the base
23
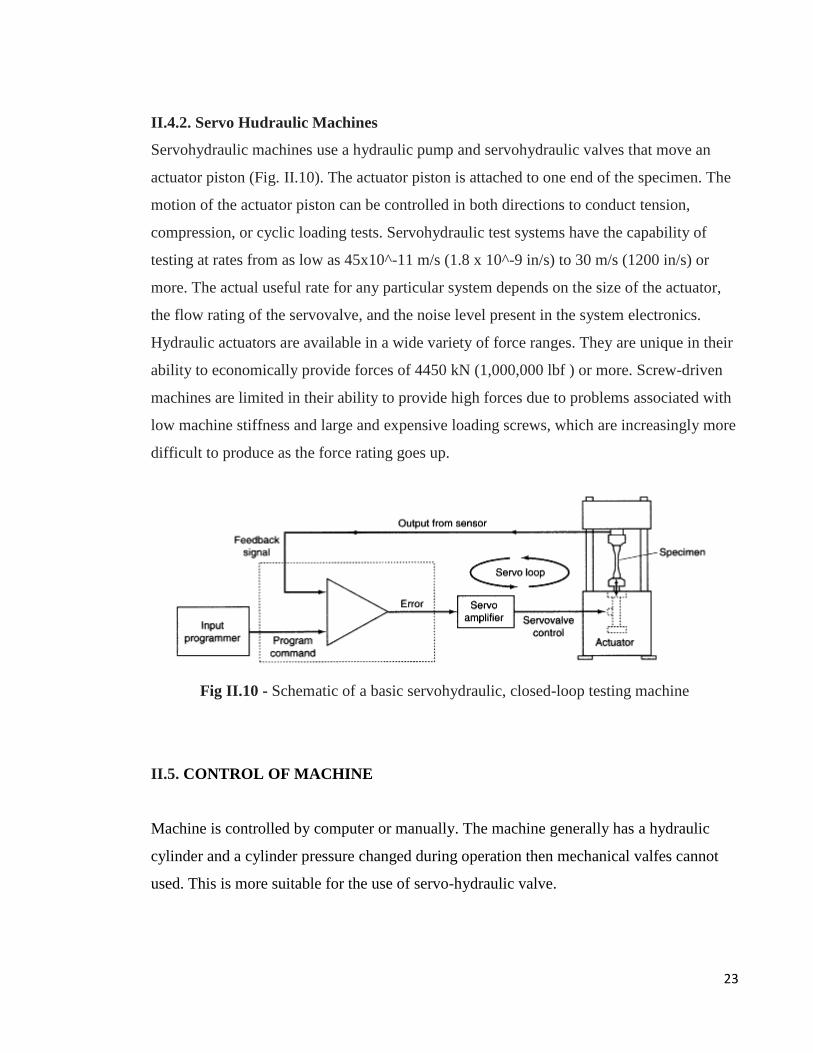
II.4.2. Servo Hudraulic Machines
Servohydraulic machines use a hydraulic pump and servohydraulic valves that move an
actuator piston (Fig. II.10). The actuator piston is attached to one end of the specimen. The
motion of the actuator piston can be controlled in both directions to conduct tension,
compression, or cyclic loading tests. Servohydraulic test systems have the capability of
testing at rates from as low as 45x10^-11 m/s (1.8 x 10^-9 in/s) to 30 m/s (1200 in/s) or
more. The actual useful rate for any particular system depends on the size of the actuator,
the flow rating of the servovalve, and the noise level present in the system electronics.
Hydraulic actuators are available in a wide variety of force ranges. They are unique in their
ability to economically provide forces of 4450 kN (1,000,000 lbf ) or more. Screw-driven
machines are limited in their ability to provide high forces due to problems associated with
low machine stiffness and large and expensive loading screws, which are increasingly more
difficult to produce as the force rating goes up.
Fig II.10 - Schematic of a basic servohydraulic, closed-loop testing machine
II.5. CONTROL OF MACHINE
Machine is controlled by computer or manually. The machine generally has a hydraulic
cylinder and a cylinder pressure changed during operation then mechanical valfes cannot
used. This is more suitable for the use of servo-hydraulic valve.

24
Servo valves, hydraulic systems, control technology, although little used to provide many
advantages. In general, prices have to be expensive, complex electronic circuits feeding,
very limited repair facilities, to be more sensitive to reasons such as pollution fields that
restricts the use of valves. However, emerging technologies become more and more high-
quality, make the need for faster and more reliable materials. In this case, the design of the
hydraulic systems with high sensitivity and high dynamic properties is becoming a need for
the use of proportional and servo valves.
Servo valves for controlling the setting to primarily to process the is required. So the result
is the desired result, if the expectation instead of the comparative it does not come
embodiment, the necessary corrections should be made. For this reason, the results obtained
must be known. Any feedback is called to read the results.
As seen in Fig II.10 of a valve according to the desired value by the computer with the
drive connected to the computer and load cell sensor or feedback extensometers made
according to the data from the machine control can be achieved.
II.6. SPEED OF TESTING
The speed of testing is extremely important because mechanical properties are a function of
strain rate. It is, therefore, imperative that the speed of testing be specified in either the
tension-test method or the product specification. In general, a slow speed results in lower
strength values and larger ductility values than a fast speed; this tendency is more
pronounced for lower-strength materials than for higherstrength materials and is the reason
that a tensiontest must be conducted within a narrow testspeed range. In order to quantify
the effect of deformation rate on strength and other properties, a specific definition of
testing speed is required. A conventional (quasi-static) tensile test, for example, ASTM E 8,
prescribes upper and lower limits on the deformation rate, as determined by one of the
following methods during the test:
25
● Strain rate
● Stress rate (when loading is below the proportional limit)
● Cross-head separation rate (or free-running cross-head speed) during the test
● Elapsed time
These methods are listed in order of decreasing precision, except during the occurrence of
upper-yield-strength behavior and yield point elongation (YPE) (where the strain rate may
not necessarily be the most precise method). For some materials, elapsed time may be
adequate, while for other materials, one of the remaining methods with higher precision
may be necessary in order to obtain test values within acceptable limits. ASTM E 8
specifies that the test speed must be slow enough to permit accurate determination of forces
and strains. Although the speeds specified by various test methods may differ somewhat,
the test speeds for these methods are roughly equivalent in commercial testing.
II.6.1. Strain Rate
Strain rate is expressed as the change in strain per unit time, typically expressed in units of
min^-1 or s^-1 because strain is a dimensionless value expressed as a ratio of change in
length per unit length. The strain rate can usually be dialed, or programmed, into the control
settings of a computer-controlled system or paced or timed for other systems.
Strain rate, or the rate at which a specimen is deformed, is a key test variable that is
controlled within prescribed limits, depending on the type of test being performed. Table
II.4 summarizes the general strain-rate ranges that are required for various types of property
tests. Conventional (quasi-static) tensile tests require strain rates between 10^-5 and 10^-1
s^-1. A typical mechanical test on metallic materials is performed at a strain rate of
approximately 10^-3 s^-1, which yields a strain of 0.5 in 500 s. Conventional equipment
and techniques generally can be extended to strain rates as high as 0.1 s^-1 without
difficulty. Tests at higher strain rates necessitate additional considerations of machine
stiffness and strain measurement techniques. In terms of machine capability, servohydraulic
load frames equipped with high-capacity valves can be used to generate strain rates as high

26
as 200 s^-1. These tests are complicated by load and strain measurement and data
acquisition. If the crosshead speed is too high, inertia effects can become important in the
analysis of the specimen stress state. Under conditions of high crosshead speed, errors in
the load cell output and crosshead position data may become unacceptably large. A
potential exists to damage load cells and extensometers under rapid loading. The damage
occurs when the specimen fractures and the load is instantaneously removed from the
specimen and the load frame.
Table II.4 - Strain rate ranges for different tests
II.6.2. Stress Rate
Stress rate is expressed as the change in stress per unit of time. When the stress rate is
stipulated, ASTM E8 requires that it not exceed 100 ksi/min. This number corresponds to
an elastic strain rate of about 5x10^-5 s^-1 for steel or 15x10^-5 s^-1 for aluminum. As
with strain rate, stress rate usually can be dialed or programmed into the control settings of
computer-controlled test systems. However, because most older systems indicate force
being applied, and not stress, the operator must convert stress to force and control this
quantity. Many machines are equipped with pacing or indicating devices for the
measurement and control of the stress rate, but in the absence of such a device, the average
stress rate can be determined with a timing device by observing the time required to apply a
known increment of stress. For example, for a test piece with a cross section of 0.500 in by
0.250 in and a specified stress rate of 100,000 psi/min, the maximum force application rate
would be 12,500 lbf/min (force = stress rate x area = 100,000 psi/min x (0.500 in x 0.250
in.)). A minimum rate of 1⁄10 of the maximum rate is usually specified.
27
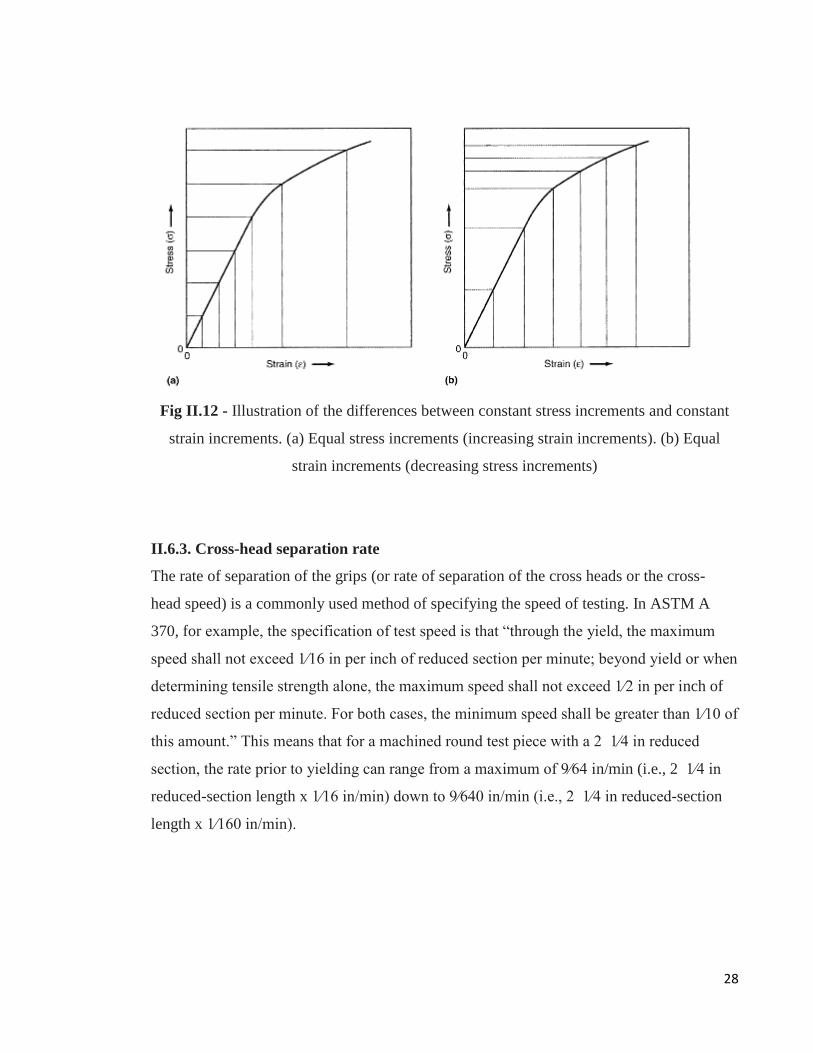
Figure II.12 compares strain-rate control with stress-rate control for describing the speed of
testing. Below the elastic limit, the two methods are identical. However, as shown in Fig.
II.12, once the elastic limit is exceeded, the strain rate increases when a constant stress rate
is applied. Alternatively, the stress rate decreases when a constant strain rate is specified.
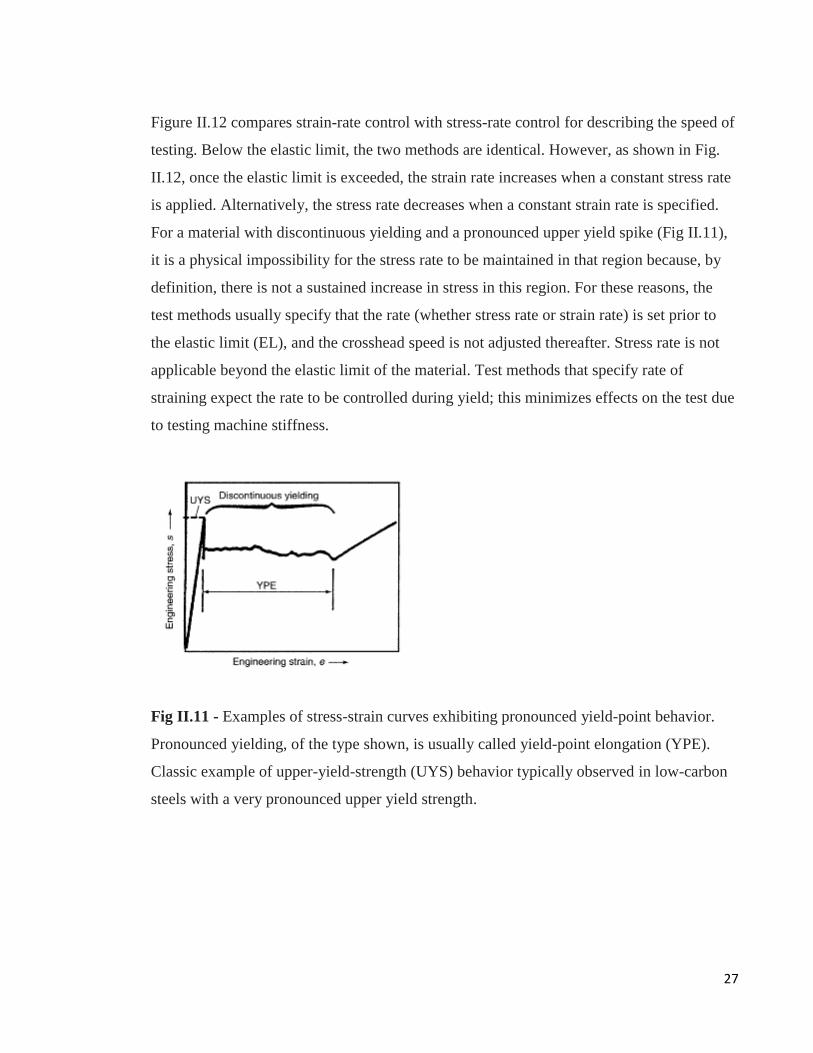
For a material with discontinuous yielding and a pronounced upper yield spike (Fig II.11),
it is a physical impossibility for the stress rate to be maintained in that region because, by
definition, there is not a sustained increase in stress in this region. For these reasons, the
test methods usually specify that the rate (whether stress rate or strain rate) is set prior to
the elastic limit (EL), and the crosshead speed is not adjusted thereafter. Stress rate is not
applicable beyond the elastic limit of the material. Test methods that specify rate of
straining expect the rate to be controlled during yield; this minimizes effects on the test due
to testing machine stiffness.
Fig II.11 - Examples of stress-strain curves exhibiting pronounced yield-point behavior.
Pronounced yielding, of the type shown, is usually called yield-point elongation (YPE).
Classic example of upper-yield-strength (UYS) behavior typically observed in low-carbon
steels with a very pronounced upper yield strength.
28
Fig II.12 - Illustration of the differences between constant stress increments and constant
strain increments. (a) Equal stress increments (increasing strain increments). (b) Equal
strain increments (decreasing stress increments)
II.6.3. Cross-head separation rate
The rate of separation of the grips (or rate of separation of the cross heads or the cross-
head speed) is a commonly used method of specifying the speed of testing. In ASTM A
370, for example, the specification of test speed is that ―through the yield, the maximum
speed shall not exceed 1⁄16 in per inch of reduced section per minute; beyond yield or when
determining tensile strength alone, the maximum speed shall not exceed 1⁄2 in per inch of
reduced section per minute. For both cases, the minimum speed shall be greater than 1⁄10 of
this amount.‖ This means that for a machined round test piece with a 2 1⁄4 in reduced
section, the rate prior to yielding can range from a maximum of 9⁄64 in/min (i.e., 2 1⁄4 in
reduced-section length x 1⁄16 in/min) down to 9⁄640 in/min (i.e., 2 1⁄4 in reduced-section
length x 1⁄160 in/min).

29
II.6.4. Elapsed time
The elapsed time to reach some event, such as the onset of yielding or the tensile strength,
or the elapsed time to complete the test, is sometimes specified. In this case, multiple test
pieces are usually required so that the correct test speed can be determined by trial and
error. Many test methods permit any speed of testing below some percentage of the
specified yield or tensile strength to allow time to adjust the force application mechanism,
ensure that the extensometer is working, and so on. Values of 50 and 25%, respectively, are
often used.
II.7. MACHINE STIFNESS
The most common misconception relating to strain rate effects is that the testing machine is
much stiffer than the specimen. Such an assumption leads to the concept of deformation of
the specimen by an essentially rigid machine. However, for most tests the opposite is true:
the conventional tensile specimen is much stiffer than most testing machines. As shown in
Fig. II.13, for example, if crosshead displacement is defined as the relative displacement,
D, that would occur under conditions of zero load, then with a specimen gripped in a testing
machine and the driving mechanism engaged, the crosshead displacement equals the
deformation in the gage length of the specimen plus elastic deflections in components such
as the machine frame, load cell, grips, and specimen ends. Before yielding, the gage length
deformation is a small fraction of the crosshead displacement. After the onset of gross
plastic yielding of the specimen, conditions change. During this phase of deformation, the
load varies slowly as the material strain hardens. Thus, the elastic deflections in the
machine change slowly, and most of the relative crosshead displacement produces plastic
deformation in the specimen. Qualitatively, in a test at approximately constant crosshead
speed, the initial elastic strain rate in the specimen will be small, but the specimen strain
rate will increase when plastic flow occurs. Quantitatively, this effect can be estimated as
follows. Consider a specimen having an initial cross-sectional area Ao and modulus of
elasticity E gripped in a testing machine so that its axially stressed gage length initially is
30
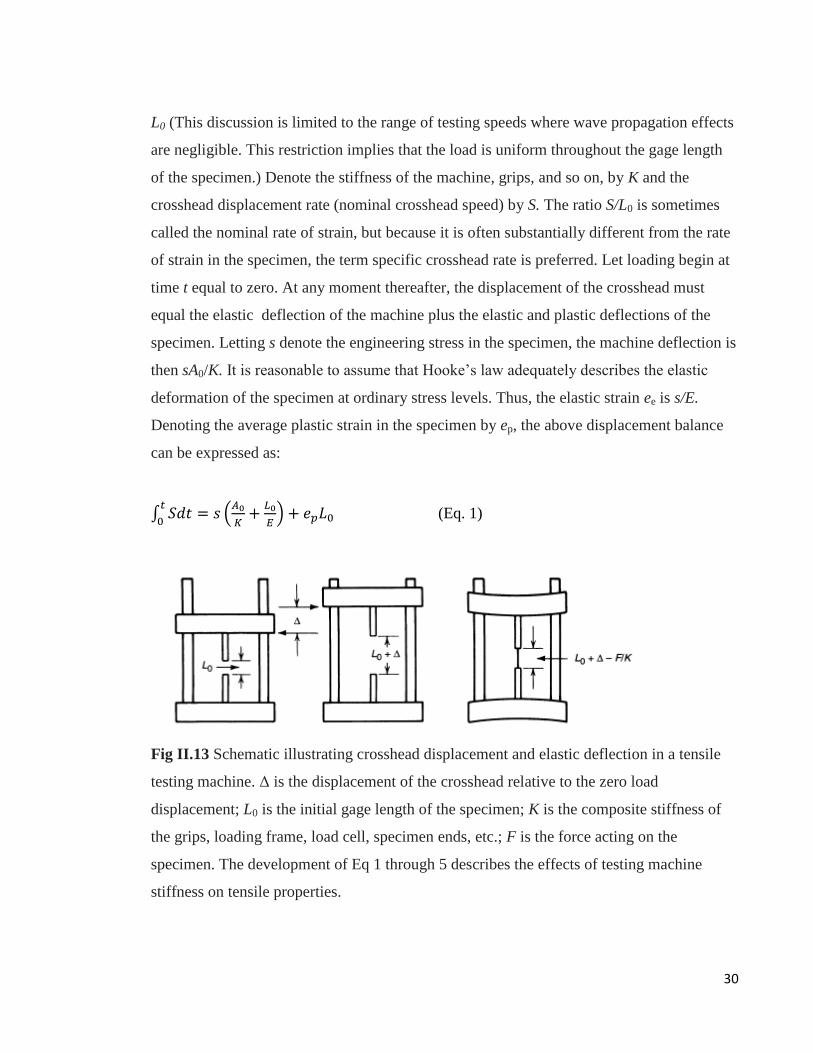
L0 (This discussion is limited to the range of testing speeds where wave propagation effects
are negligible. This restriction implies that the load is uniform throughout the gage length
of the specimen.) Denote the stiffness of the machine, grips, and so on, by K and the
crosshead displacement rate (nominal crosshead speed) by S. The ratio S/L0 is sometimes
called the nominal rate of strain, but because it is often substantially different from the rate
of strain in the specimen, the term specific crosshead rate is preferred. Let loading begin at
time t equal to zero. At any moment thereafter, the displacement of the crosshead must
equal the elastic deflection of the machine plus the elastic and plastic deflections of the
specimen. Letting s denote the engineering stress in the specimen, the machine deflection is
then sA0/K. It is reasonable to assume that Hooke‘s law adequately describes the elastic
deformation of the specimen at ordinary stress levels. Thus, the elastic strain ee is s/E.
Denoting the average plastic strain in the specimen by ep, the above displacement balance
can be expressed as:
∫ (
)
(Eq. 1)
Fig II.13 Schematic illustrating crosshead displacement and elastic deflection in a tensile
testing machine. Δ is the displacement of the crosshead relative to the zero load
displacement; L0 is the initial gage length of the specimen; K is the composite stiffness of
the grips, loading frame, load cell, specimen ends, etc.; F is the force acting on the
specimen. The development of Eq 1 through 5 describes the effects of testing machine
stiffness on tensile properties.
31
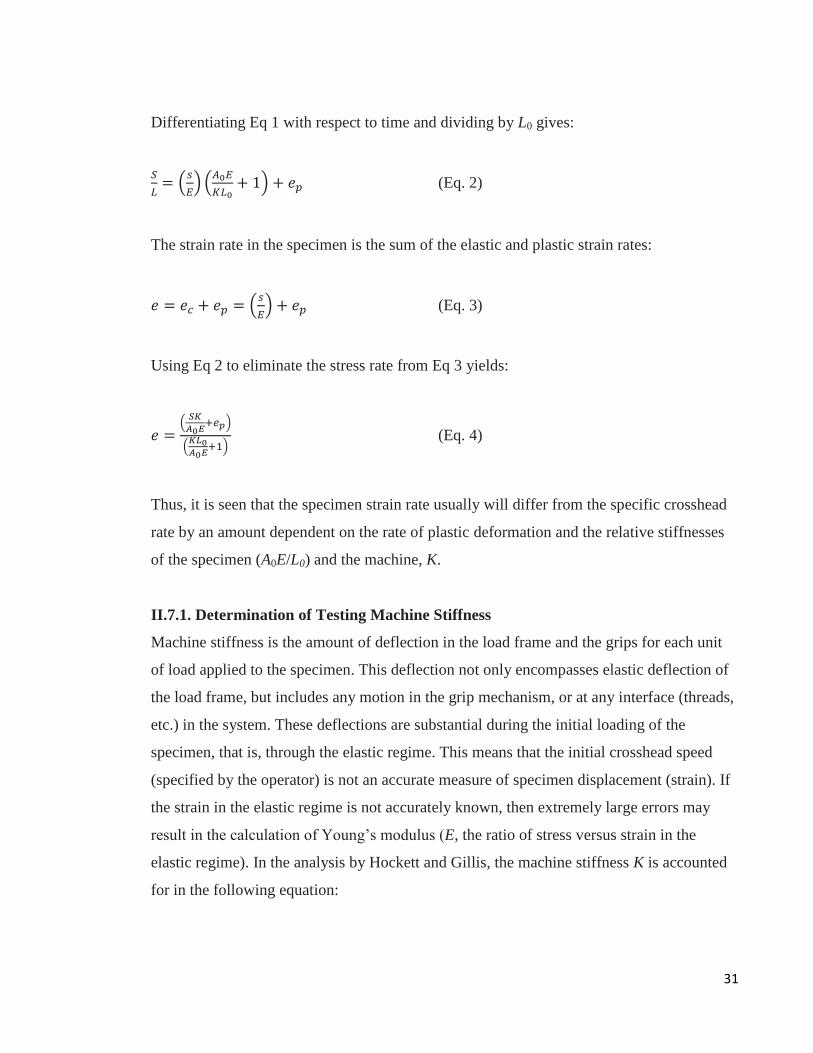
Differentiating Eq 1 with respect to time and dividing by L0 gives:
(
) (
) (Eq. 2)
The strain rate in the specimen is the sum of the elastic and plastic strain rates:
(
) (Eq. 3)
Using Eq 2 to eliminate the stress rate from Eq 3 yields:
(
)
(
) (Eq. 4)
Thus, it is seen that the specimen strain rate usually will differ from the specific crosshead
rate by an amount dependent on the rate of plastic deformation and the relative stiffnesses
of the specimen (A0E/L0) and the machine, K.
II.7.1. Determination of Testing Machine Stiffness
Machine stiffness is the amount of deflection in the load frame and the grips for each unit
of load applied to the specimen. This deflection not only encompasses elastic deflection of
the load frame, but includes any motion in the grip mechanism, or at any interface (threads,
etc.) in the system. These deflections are substantial during the initial loading of the
specimen, that is, through the elastic regime. This means that the initial crosshead speed
(specified by the operator) is not an accurate measure of specimen displacement (strain). If
the strain in the elastic regime is not accurately known, then extremely large errors may
result in the calculation of Young‘s modulus (E, the ratio of stress versus strain in the
elastic regime). In the analysis by Hockett and Gillis, the machine stiffness K is accounted
for in the following equation:
32
(
)
(Eq. 5)
where L0 is initial specimen gage length, S is crosshead speed of the testing machine, A0 is
initial cross-sectional area of the specimen, P0 is specimen load rate (dF/dt = A0 s˙), and E
is Young‘s modulus of the specimen material.
II.8. TENSILE TESTING EQUIPMENTS
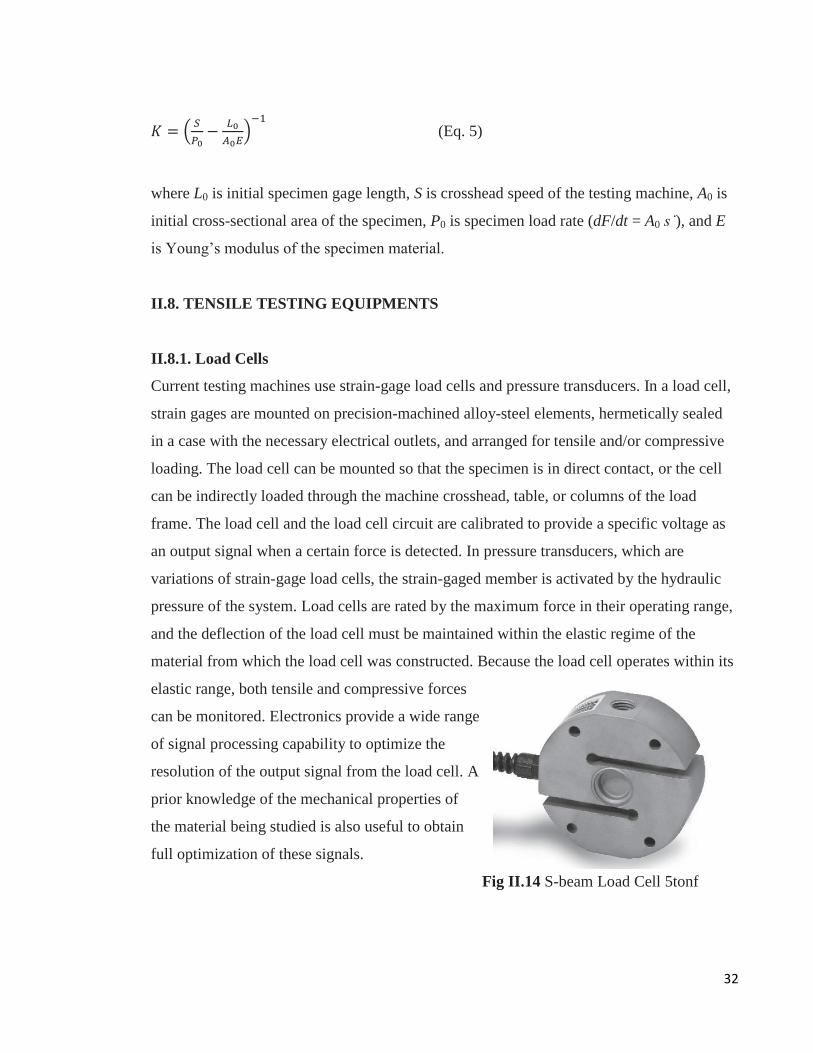
II.8.1. Load Cells
Current testing machines use strain-gage load cells and pressure transducers. In a load cell,
strain gages are mounted on precision-machined alloy-steel elements, hermetically sealed
in a case with the necessary electrical outlets, and arranged for tensile and/or compressive
loading. The load cell can be mounted so that the specimen is in direct contact, or the cell
can be indirectly loaded through the machine crosshead, table, or columns of the load
frame. The load cell and the load cell circuit are calibrated to provide a specific voltage as
an output signal when a certain force is detected. In pressure transducers, which are
variations of strain-gage load cells, the strain-gaged member is activated by the hydraulic
pressure of the system. Load cells are rated by the maximum force in their operating range,
and the deflection of the load cell must be maintained within the elastic regime of the
material from which the load cell was constructed. Because the load cell operates within its
elastic range, both tensile and compressive forces
can be monitored. Electronics provide a wide range
of signal processing capability to optimize the
resolution of the output signal from the load cell. A
prior knowledge of the mechanical properties of
the material being studied is also useful to obtain
full optimization of these signals.
Fig II.14 S-beam Load Cell 5tonf
33
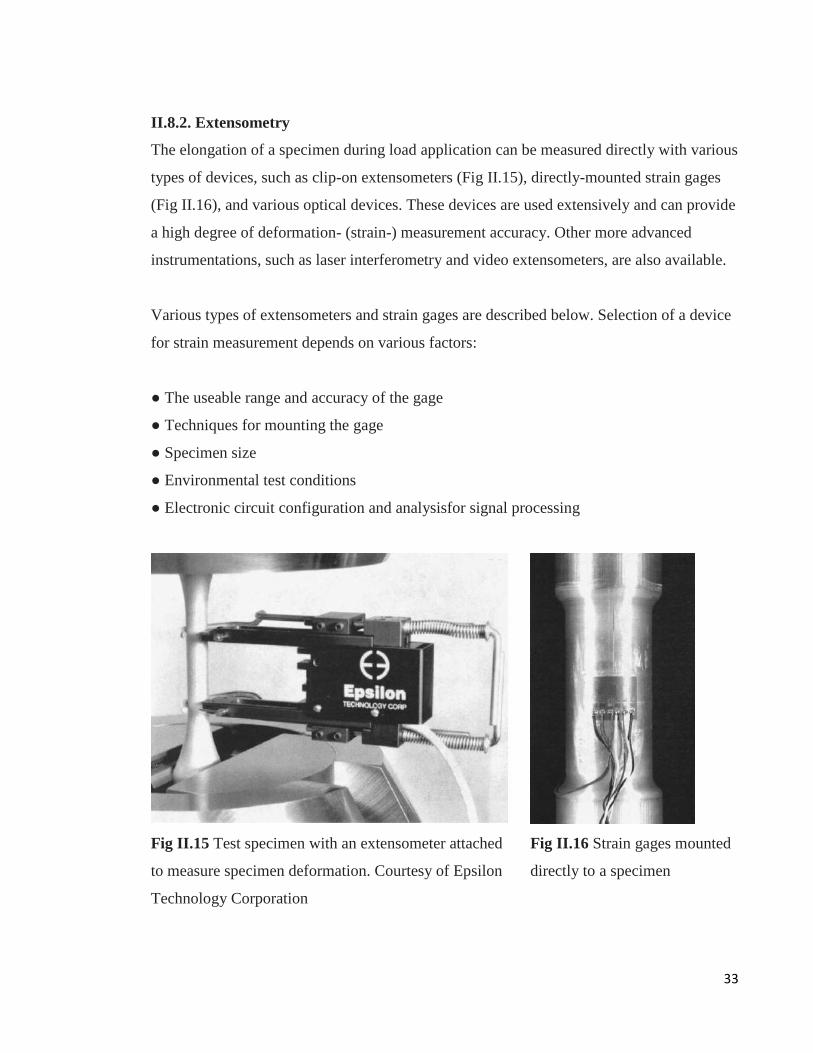
II.8.2. Extensometry
The elongation of a specimen during load application can be measured directly with various
types of devices, such as clip-on extensometers (Fig II.15), directly-mounted strain gages
(Fig II.16), and various optical devices. These devices are used extensively and can provide
a high degree of deformation- (strain-) measurement accuracy. Other more advanced
instrumentations, such as laser interferometry and video extensometers, are also available.
Various types of extensometers and strain gages are described below. Selection of a device
for strain measurement depends on various factors:
● The useable range and accuracy of the gage
● Techniques for mounting the gage
● Specimen size
● Environmental test conditions
● Electronic circuit configuration and analysisfor signal processing
Fig II.15 Test specimen with an extensometer attached
to measure specimen deformation. Courtesy of Epsilon
Technology Corporation
Fig II.16 Strain gages mounted
directly to a specimen

34
Clip-on extensometers can be attached to a test specimen to measure elongation or strain
as the load is applied. This is particularly important for metals and similar materials that
exhibit high stiffness. As shown in Fig II.15, typical extensometers have fixed gage lengths
such as 25 or 50 mm (1 or 2 in.). They are also classified by maximum percent elongation
so that a typical 25mm (1 in.) gage length unit would have different models for 10, 50, or
100% maximum strain. Extensometers are used to measure axial strain in specimens. There
also are transverse strainmeasuring devices that indicate the reduction in width or diameter
as the specimen is tested.
Optical Systems Lasers and other systems can also be used to obtain linear strain
measurements. Optical extensometers are particularly useful with materials such as rubber,
thin films, plastics, and other materials where the weight of a conventional extensometer
would distort the workpiece and affect the readings obtained. In the past, such strain-
measuring systems were expensive, and their principal use has been primarily in research
and development work. However, these optical techniques are becoming more accessible
for commercial testing machines. For example, bench-top UTM systems with a laser
extensometer are available. This laser extensometer allows accurate measurement of strain
in thin films, which would not otherwise be practical by mechanical attachment of
extensometer devices. Optical systems also allow noncontact measurement from
environmental test chambers.
Table II.5 Classification of extensometer systems

35
CHAPTER III
After literature review, in this chapter we will discuss how to machine designed and passed
manufacturing processes. At first we decided how wiII be the machine drive system and
mechanisim. As a result of research which concluded the decision to elect the two systems
which are gear system and hydraulic system. Hydraulic drive system is choosen system.
The biggest reason that support of the sponsor company in hydraulic systems . The
company produces its own cylinders, hydraulic cylinder production greatly facilitated on
the job. Other raw materials were supplied part of the factory junkyard and the final
products are obtained through production processes in the same factory. The steel material
used is a type of AISI 1045 steel. Sensors are provided in the other companies. Whether the
electrical panel design installation by an electrician at the factory. Daqcard for purchase
from the sensor data have been used. Daqcard is used to send the data read from the sensors
to the computer was obtained from the university.
First, the capacity of the machine has been decided how many kN or tonf. This capacity
universal testing machine capacity up to an average five tonf. This value will be
considering the design. Second, grips system design. I examined the mechanisms available
for the grips, and wedge construction of the grip has been decided. Do you wiII be at the
bottom of the hydraulic cylinder on the machine or on a small exchange of ideas were
made. Hydraulic cylinder is decided to be at the bottom of the machine. Then, the fixed
grip and the other one movable thought to connect the structure to be decided. Considered a
system of guide shafts bed.
Electrical and electronic part of the works in two ways. Utility to perform the control of the
hydraulic cylinder back and forth to the computer and data transmission. As well as the
manual control of the hydraulic cylinder can be controlled by buttons.

36
A computer program written for the processing of data is received. Office programs, such
as Excel could be use for this work. In addition, data have to be used in the daqcard has its
own special software.
3D designs, technical drawings and analyzes were made of solid works program. Besides
this, catia program to create videos on the mechanism used. Proteus for the design of
printed circuit board electronic circuit diagrams, and electronic drawing program.
Automation Studio software has been used for the hydraulic circuit diagram. matlab or
excel program was used for the data coming from the sensors.
Fig III.1 3D view the tensile test machine(left) and the real image(right)
37
III.1. WEDGE GRIP SYSTEM
The Grips system was designed as a wedge type. This type of connection of the grip
features an easy connection of parts and components of various geometries and self-locking
to specimen with wedge parts. This are very common in this type of area. We have
designed the system design places the mechanical wedge. Mechanical wedge grips
compression of the parts are provided turned the tightening ears. The systems are available
with electro-wedge. The systems are available with electro-wedge. This style has an
actuator systems, and you can move the opening and closing wedges with a computer or
buttons.
The mechanical structure of this design is completely unique and based on the up to 10 tonf
but due to the safety factor 2 must be used up to the maximum 5tonf. The wedge inner
surfaces hardened because of that the inner surfaces damaged the most places. The distance
between wedges to connect the flat shape of samples 0 - 11mm, cylindrical samples, this
value is designed to be 14.2mm max min 4mm. Reason for wedges min value is not 0 for
the positioning of the cylindrical part must be alignment which mentinod on chapter 2. This
hollow allows to aligned cylindrical parts connected to the grip.
The working principle is briefly as follows. The connection screw fixed the grips to
machine. With the tightening ears turning, the block to move up and down by the block
screw fixed the block. The block moves up the connection screw is fixed and the wedge
head in the screw conneciton to because they have a fixed wedge is forced to move down.
so that the wedges closing each other by the inner surfaces due to the geometry of the part
compresses the specimen.
Force loaded is fitted on where the part is determined to be analyzed on SolidWorks
Simulation. Then, the force applied the place, the direction and magnitude which is 50kN
are determined. After, the part is meshed with high precision and run the simulation in
order to take result. According to the results we obtain three different representative picture.

38
they stress, displacement and strain distribution. Figure III.3, III4 show that mesh of the
block, distribution of stress and dicplacment.
Fig III.2 Wedge type tensile test machine grip(left) and specimen position(right)
Fig III.3 Mesh diagram block part on solid works

39
Fig III.4 The block stress and displacement distrubution
According to the above figures the block under 50kN (5tonf) force of the minimum stress
of 8.57 MPa, the maximum stress is 154 MPa. The yield strength is 530 MPa for the safety
factor of 50kN n = 530/145 from 3.45. This value is suitable for design. The deformation
value of 4.57 for the maximum 5-002 mm seems to be 50kN on scale. This is a rather small
value for 50kN. Round corners on the inner side of the block in order to reduce stresses
designed geometry. Fig III.2 shows the round corners. The wedges slip angle was
möeasured is 70 degrees by examining a number of different grips design. This angle is
much less than in the case of stress, and increasing the friction increases the self-locking
feature makes it ineffective.
Fig III.5 The block screw nut stress and displacement distrubution
40
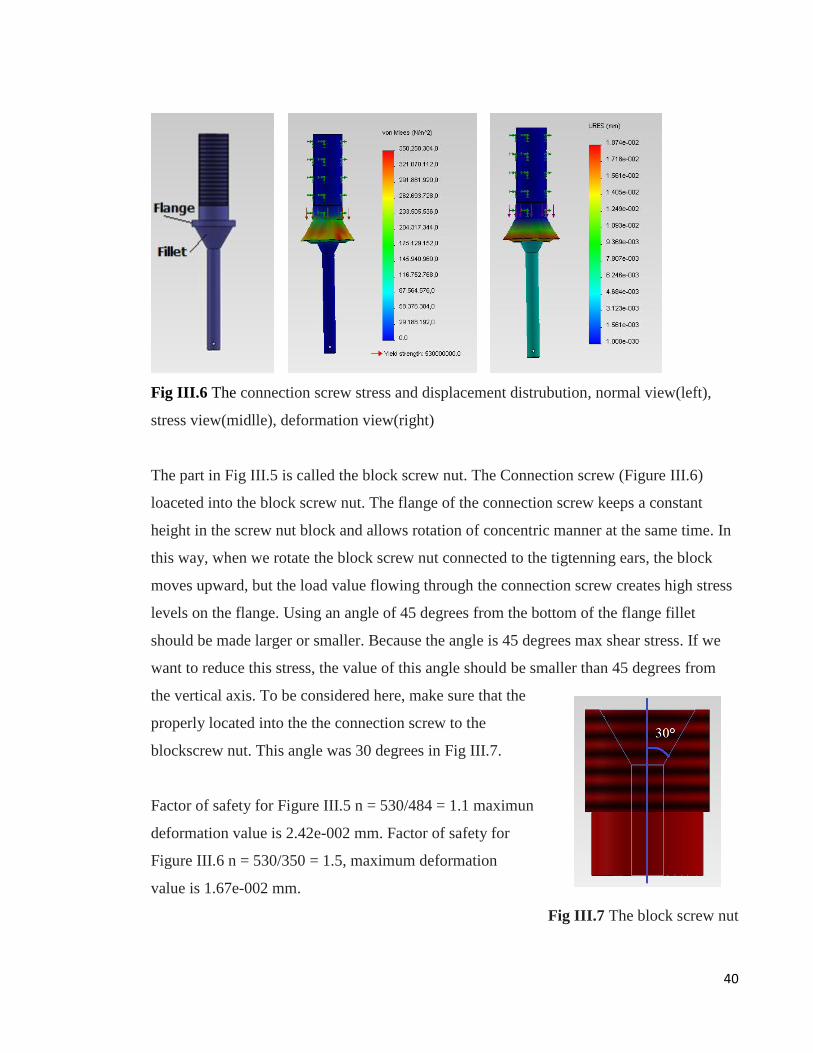
Fig III.6 The connection screw stress and displacement distrubution, normal view(left),
stress view(midlle), deformation view(right)
The part in Fig III.5 is called the block screw nut. The Connection screw (Figure III.6)
loaceted into the block screw nut. The flange of the connection screw keeps a constant
height in the screw nut block and allows rotation of concentric manner at the same time. In
this way, when we rotate the block screw nut connected to the tigtenning ears, the block
moves upward, but the load value flowing through the connection screw creates high stress
levels on the flange. Using an angle of 45 degrees from the bottom of the flange fillet
should be made larger or smaller. Because the angle is 45 degrees max shear stress. If we
want to reduce this stress, the value of this angle should be smaller than 45 degrees from
the vertical axis. To be considered here, make sure that the
properly located into the the connection screw to the
blockscrew nut. This angle was 30 degrees in Fig III.7.
Factor of safety for Figure III.5 n = 530/484 = 1.1 maximun
deformation value is 2.42e-002 mm. Factor of safety for
Figure III.6 n = 530/350 = 1.5, maximum deformation
value is 1.67e-002 mm.
Fig III.7 The block screw nut

41
Fig III.8 The wedge stress and displacement distrubution
The force applied on simulation 5tonf on two wedges. They are divided into two, so you
performed to analysis 2.5tonf as the value of the force. Safety factor according to this value
530/348 = 1.52, max deformation is 2.55-002 mm.
Cuttued surface behind of the wedges is slot of the wedge key in seen fig III.8. The wedge
key placed there ensures that the horizontal axis aligned with each other. This is guaranteed
to be aligned on the vertical axis of specimens. After analysis, technical drawing are created
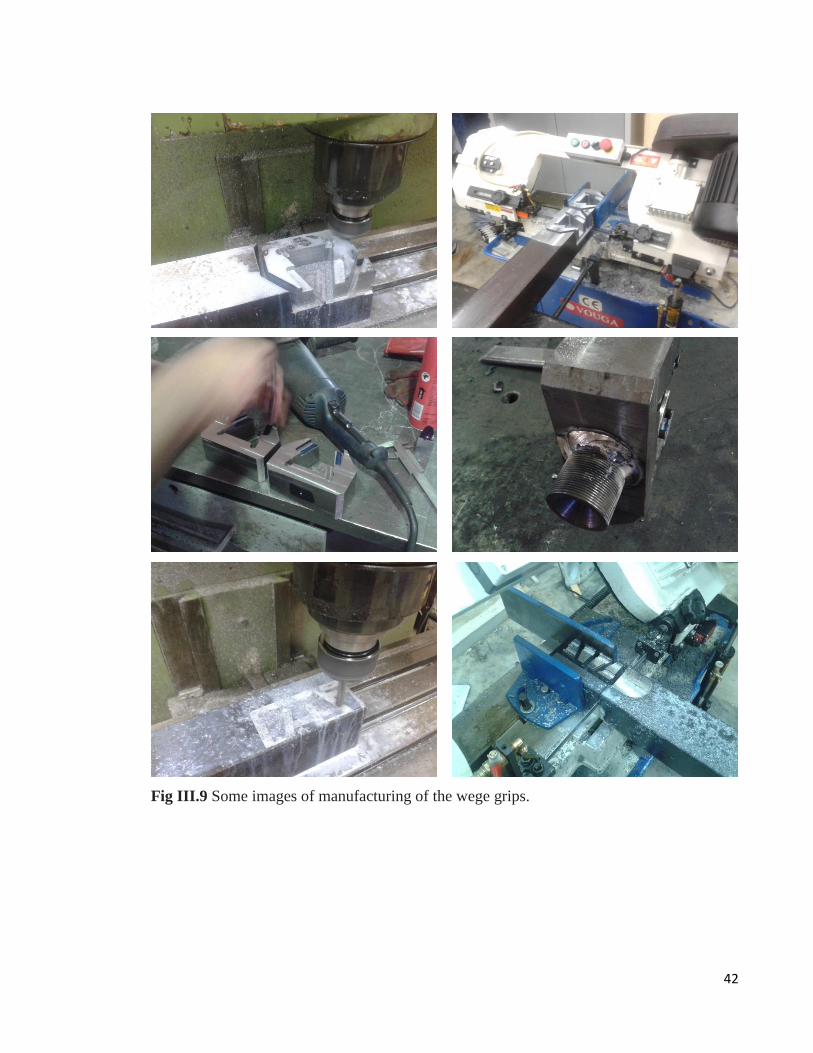
on SolidWorks to manufactur parts. Used for this purpose lathe machines, cnc milling
machines, oxygen cutting, band saw and welding machine. During the manufacturing
process of parts benefited from the experience of the masters in factoty.
CNC work is done at the university lab, I-Deas program is used to obtain the cnc code.
There are three cnc code which are belongs to the four of wedge, two of the block and four
of the wedge holders. The full CNC code added at appendix.
After manufacturing, in order to assembly of the grips must be follow exploded view on
technical drawings on appendix. Also created a video about how to assembly the grip and
other parts.
42
Fig III.9 Some images of manufacturing of the wege grips.
43
III.2. THE MAIN CONSTRUCTION
We mentioned design and manufacture of the grip mechanism. Now we will begin how to
move the grip and talk about set them on the chassis. One of the two grips shape allows us
to design the most suitable to be fixed and the other movable. Drive power of the hydraulic
cylinder, which is below the moving means the grip will be attached to it. In this case, the
bridge must be connected to the upper part of the fixed grip. For loadcell the most suitable
palce is the connection between the grip and the top bridge. The grip can move up and
down without misalignment must be designed and beared the guide shafts. The brass
material is used for this bearing the guide shafts into the honned pipe which are used
hydraulic cylinder. Other material could be used for this operation is teflon but, teflon is
more expensive than brass material. These materials are not damage during sliding on the
bearing materials.
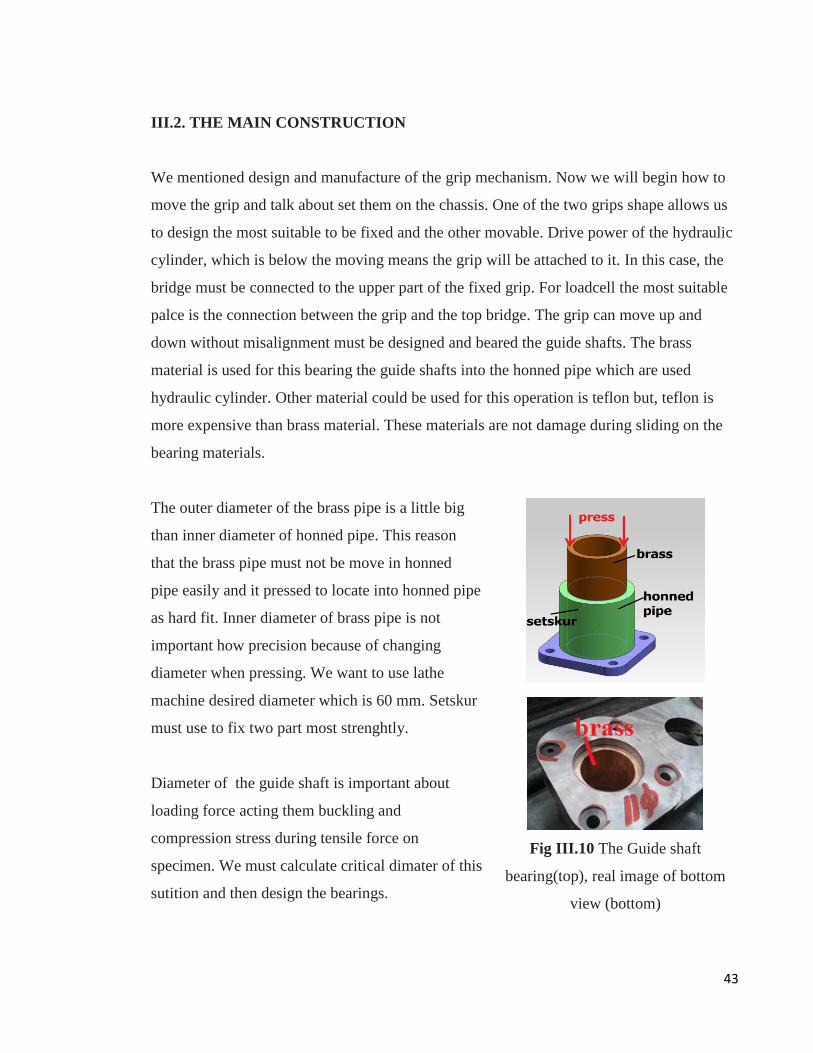
The outer diameter of the brass pipe is a little big
than inner diameter of honned pipe. This reason
that the brass pipe must not be move in honned
pipe easily and it pressed to locate into honned pipe
as hard fit. Inner diameter of brass pipe is not
important how precision because of changing
diameter when pressing. We want to use lathe
machine desired diameter which is 60 mm. Setskur
must use to fix two part most strenghtly.
Diameter of the guide shaft is important about
loading force acting them buckling and
compression stress during tensile force on
specimen. We must calculate critical dimater of this
sutition and then design the bearings.
Fig III.10 The Guide shaft
bearing(top), real image of bottom
view (bottom)
44
Critical diameter for buckling:
(Eq. 6)
Pcr = 50 kN, Le = 2 m (effective length for fix-free connection, 2L ), E = 207e09 Pa,
, from Eq.6 gives us radius r = 18.7 mm, diameter D = 37.5 mm. We used
diameter is 60 mm. Then Safety factor is n = 60/37.5 = 1.6
For compresion:
(Eq. 7)
, , , fron Eq.7 gives us radius r = 11 mm, diameter D =
22 mm calculated. This value gives us safety factor as n = 60/22=2.7.
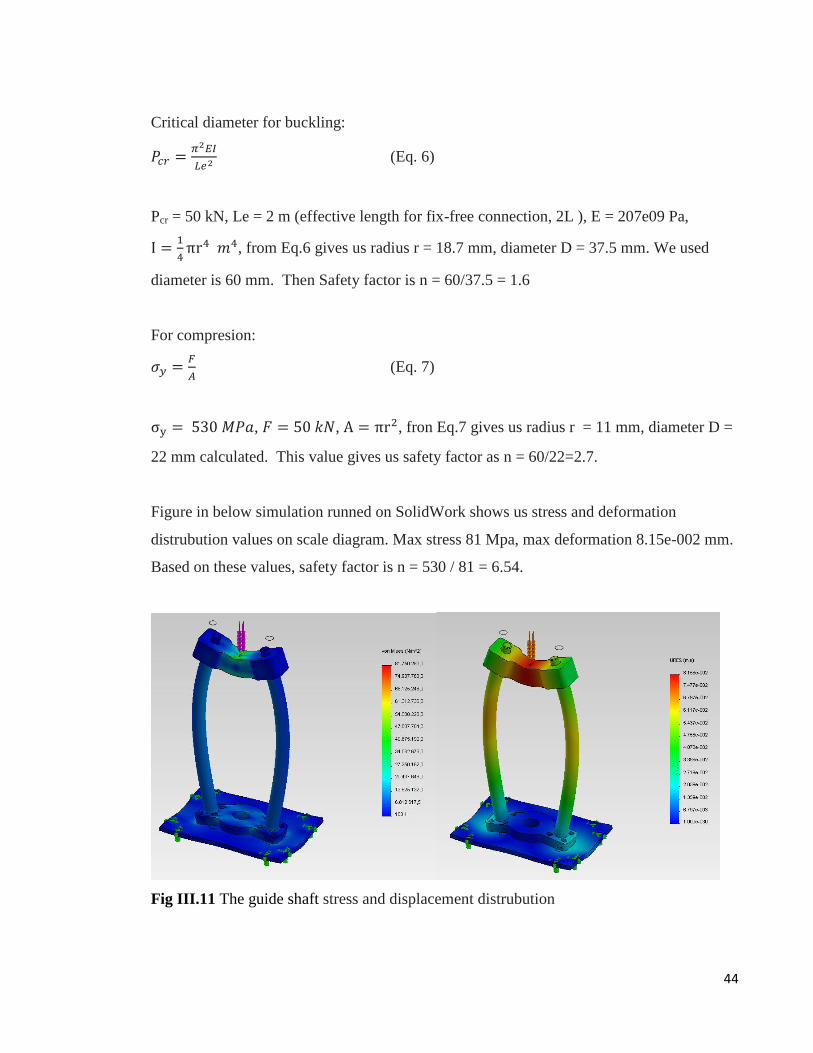
Figure in below simulation runned on SolidWork shows us stress and deformation
distrubution values on scale diagram. Max stress 81 Mpa, max deformation 8.15e-002 mm.
Based on these values, safety factor is n = 530 / 81 = 6.54.
Fig III.11 The guide shaft stress and displacement distrubution

45
Steel profiles are used to creating the chassis which carry the guide shaft mechanisim and
all upper parts grips, sensors. Tensile force during testing does not affect on these profiles.
They just carry weight of upper mechanisim and parts. Hence, The general framework are
made from 40x60 mm pipe-square profile and traverse are made from 40x40 mm pipe-
square profile. Connection between chassis and the table are connect with 8 pieces counter-
sunk head screw M10x1.25. There is the technical drawings in detail on the size at
appendix.
Fig III.12 The Chassis designed on solidworks(left) and real image(right)
III.3 HYDRAULIC CYLINDER AND UNITE
Double-acting hydraulic cylinder is used for the tensile test machines in general. Double-
acting cylinder means hydraulic cylinder can move both side with high pressure. How will
be producing hydraulic cylinder pipe and shaft diameter should be determined by your
application as well as the direction of the force applied. Differences in size, consisting of,
or otherwise insufficient thrust cause more weight and cost disadvantage. That influence it
seals which sealing will be damaged. and hydraulic cylinders does not work properly most
probably leaks. Hydraulic unit is supplied as ready. It has hyfraulic pump, hydraulic tank,
valves and variable non return throttle valves each way. Its pressure adjust to 180 bar.
Pressure can adjustable allen key. On 4/3 NC spring return solenoid valve is used with this
valve can send two-way hydraulic cylinder produced a high-pressure oil by hydraulic unit.

46
Hydraulic cylinder tube inner diameter 80 mm, the shaft diameter 40 mm was chosen.
Stroke is 150 mm. We obtain the following results if arrange max pressure 180 bar of
hydraulic units:
(Eq. 8)
Pressure: P = 180 bar = 180e05 Pa max, Area:
radius for forward force r = 0.04 m (high pressure), Area = 5.027 x10⁻³
m2
radius for back force r = (0.042-0.02
2) / 2 = 0.02 mm (low pressure), Area = 3.77 x10
-3 m
2
High pressure force F = 90.5 kN (~9 tonf ). we do not use this force because of our
hydraulic cylinder assemblied upward position. So, tensile force occurs when hydraulic
cylinder moves down. If we want a compression test, we use this hydraulic cylinder for 5-7
tonf, but important point that loadcell capacity is 5tonf and bucling of hydraulic cylinder
shaft.
Low pressure force F = 67.9 kN (~7 tonf ). we need 5 tonf max. In addition, hydraulc
cylinder shaft exposed 50kN compression force. It must not be yield.
calculation of yiled point of radius on equation 7:
, ,
r = 5.5 mm, diameter d = 11 mm. used diameter is 40 mm.
buckling calculations on equaiton 6 (compression test):
Pcr = 50 kN, Le = 0.17 m (effective length for fix-fix connection, 0.5L ), E = 207e09 Pa,
, r = 5.47 mm, diameter d = 10.9 mm.
Both radius are very close each other. Factor of safety is n = 40 / 11 = 3.6. This value is
quite adequate.

47
Fig III.13 3D view(left), real image of hydraulic clinder(middle) and hydraulic unite(right)
Fig III.14 Hydraulic Circuit Diagram
S1 and S2 in diagram are contacts of solenoid valves. This contacts are connected the
electronic card. Contacts change the position of the valve where provided +24VDC. Thus,
the hydraulic cylinder could move.

48
III.4 ELECTRIC PANEL
Electrical panel can control the machine by both computer manually. It has a set of buttons
to control it manually. Hydraulic cylinder can be controled up and down and the system
energy can be cutted with emergency button in case of emergency. There are power switch
on the cover of the panel and led shows power on. This switch provides energy to the
system as well as the engines directly. All inputs and outputs are part of the panel terminal
connections.
The signal from the computer to electronic card and with buttons to control the hydraulic
cylinders positive 24 VDC provides the energy required for the valves. There are 4 relays
on the electronic board. Two of which are used to control valves. The other two are made
because studies to be controlled by the grips added to the electro-mechanical in future.
Electronic circuit has a anti-locking cicuit after inputs itself. It will be usefull when the two
signals at the same time on, all of output could be zero to prevent unstable position of the
valve. To do this, 7404 NON-GATE and 7408 AND-GATE were used. As can be seen in
the Fig III.16 the anti-locking circuit left and the case diagram on right. Groups of inputs
are connected to computer or the buttons. The Outputs are coonnected the relay to control
them. In the case diagram stepo 2 and 3 so that there is only one step in the output indicates
that the signal from a single source. Step 4 for the circuit output signal comes from two
sources, so the outputs exit are zero. In this way, the two coils of valve are prevented
unsatable position at the same time the signals occuring on.
Electronic circuit built on Pertenax board. After the component sequenced pins connected
with thin copper wire. This method is very simple and inexpensive method by flat copper
plaque. The printed circuit and electronic circuit are drawn to the Proteus and can be found
full version circuits in the appendix.

49
Fig III.15 Electric Panel(left), Control buttons(right)
Fig III.16 Logic diagram to lock down for same two signal if on, and case diagram
50
III.5 SENSORS CONNECTIONS
As mentioned before, two types sensor are used of tensile testing machines. These are
loadcell which to measure force and other extensometry to measure deformartion or the
linear rules alternatively be used. We have chosen s-type load cells of different types are
the ones because they can be measure both tensile and compressive forces. It consist of one
piece steel material and it has a straingauges. When this straingauge become deformaed, the
resistance changes and relatively voltage differ. Hence, voltage differences can be read as a
load cell force. Connection to the machine of load cells is simple added in appendix and the
electronic circuit at the terminals of the cables and the load cell of the datasheet, technical
drawings can be found appendix.
Linear displacement transducer (linear ruler) was used to measure the deformation. The
working principle of the linear rulers, reader head slides on the strip-shaped of resistance
located inside and resistance changes when it moves relatively change voltage as loadcell.
the voltage information gives us dicplacement data. The linear ruler consist of two parts
which are chassis and slider. The connection can be done between a movable part and a
fixed part of the machine. Disadvantage of this linear rules is that measuring the total value
deformation of specimen and deformation of machine parts because of connection to
machine directly. Extensometer is installed on the specimen directly, it should not be
affected the machine deformaiton.
The sensors power are supplied by electric panel and outputs are connected the daqcard.
The daqcard is attached to computer to read the data. There is an important point the
connection about is that the ground of electric panel and ground of computer are connected
each other to equalize reference points. Otherwise, same signal seems to be different from
each other and reading wrong data.
51
III.6. DATA OF TESTING
Data generally may be grouped into ―raw data,‖ meaning the observed readings of the
measuring instruments, and ―calculated data,‖meaning the test results obtained after the
first step of analysis. In the most simple tensile test, the raw data comprise a single
measurement of peak force and the dimensional measurements taken to determine the
cross-sectional area of the test specimen. The first analysis step is to calculate the
―tensile strength,‖ defined as the force per unit area required to fracture the specimen. More
complicated tests will require more information, which typically takes the form of a graph
of force versus extension. Computer-based testing machines can display the graph without
paper, and can save the measurements associated with the graph by electronic means. A
permanent record of the raw test data is important, because it allows additional analyses to
be performed later, if desired, and because it allows errors in analysis to be found and
corrected by reference to the original data. A stress-strain diagram will help you determine:
Modulus of Elasticity, Elastic Deformation, Yield Strength, Proportional Limit, Proof
Stress, Uniform Elongation, Total Elongation, Yield Point Elongation and n-Value.
Determining Yield Strengths
There are two common methods of determining Yield Strength from a curve. Let‘s look
briefly at both of them.
1. The Offset Method: The offset is the horizontal distance between the modulus line and
any line running parallel to it. For example, the line C-D in Fig III.17is ―offset‖ from the
modulus line by 0.2% (0.002 in./in.). The value of the offset for a given material is usually
expressed this way: Yield Strength, 0.1% or 0.2% Offset. What this means is that a
certain percentage of the set equals a certain percentage of the fundamental extension units.
For example, ―0.2% Offset‖ means 0.2% of the fundamental extension units of inches per
inch, or 0.002 in./in. Starting at the origin of the curve, measure off a distance equal to
0.002 in./in. along the X-axis. Now using that as the origin, draw a line (C-D) parallel to
the modulus line. Notice that the line C-D intersects the stress-strain curve at a certain point

52
(Y in Fig III.17). The ordinate of this point (the amount of stress in psi) is the Yield
Strength at 0.2% Offset. You can use the same method to determine the yield strength at a
0.1% offset by noting the intersection of the curve and a line drawn parallel to the modulus
line with an offset of 0.001 in./in.
2. The Extension Under Load Method: This method involves drawing an ordinate line
(that is, a completely vertical line) from the point on the X-axis where the elongation equals
the specified extension, e.g. Yield Strength = 0.5% Extension. To make this determination,
locate the point on the abscissa, which is equal to 0.5% (0.005 in./in.)
of extension from the origin of the curve (E in Figure 2). Draw an ordinate line (E-F) from
this point up through the curve. Convert the load value of this point into psi. The stress
value is the Yield Strength at 0.5% (0.005 in./in.) Extension Under Load. In some cases,
the yield strength may be given in other than strain fundamental units, e.g. Yield
Strength = 0.1 in. / 2 in. Extension. In such cases, the limiting extension must first be
converted into fundamental strain units (in./in.) A limiting extension of 0.01 in with a 2 in
gauge length is equal to 0.005 in./in. extension.
Young’s Modulus of Elasticity
The modulus of elasticity (Young‘s Modulus) is the ratio of stress in pounds per square
inch (psi) to strain in inches per inch (in./in.) as computed from the modulus line (A-B).
To find the modulus, take any two points (K & L) on the modulus line (A-B), and divide
the differential between their stress values in psi from the strain differential in in./in. The
result of this division is the modulus of the material tested. For Example:
Load Strain
lbs. in./in.
Point K 17,400 0.003
Point L 5,800 0.001
Difference (Δ) 11,600 0.002
53
This load (11,600 lbs.) must be converted into psi by dividing the load in pounds by the
crosssectional area of the specimen. For example, a standard .505 in. dia. test bar has an
area of 0.200 sq. in. Therefore, a load of 11,600 lbs. would be equal 58,000 psi (11,600
divided by 0.200). Computing the Modulus of Elasticity from the above example:
To obtain better readability and greater convenience, it is recommended that you use points
near the end of the modulus line that are the intersection of easily interpreted load and
extension lines. Further, the final modulus of elasticity of a material should never be based
on the stress-strain curve from a single test. It should be the average of values calculated for
several tests with comparable specimens.
Proportional Limit and Proof Strength
As previously discussed, the proportional limit is the greatest stress that a material is
capable of sustaining without any deviation from proportionality of stress to strain
(Hooke‘s Law). This should not be confused with the elastic limit, which is the maximum
stress that can be applied without any permanent strain remaining when the stress is
released. Both of these values are extremely difficult to accurately determine because of the
problem of finding the exact point where the curve ceases to be linear. For this reason, it‘s
generally recommended that you use a yield strength measurement instead with a small
offset (0.01%) for tests on critical materials. To do this, follow the offset method previously
described, but use a small arbitrary number for the offset. The resulting yield strength is
called the Proof Strength or Proof Stress of a specimen. Using this method gives you a
straight line that intersects the curve at a load point (Point W in Fig III.17), which unlike
the proportional or elastic limit can be easily located.

54
Fig III.17 Typical Tension Stress-Strain Diagram
Calculation of Tensile Properties of Materials:
Line A-B is Modulus Line; Young‘s Modulus of
Elasticity = slope of initial straight portion of curve
expressed as ratio of stress (psi) divided by strain
(in./in.).
Line C-D is the 0.2% (0.002 in./in.) Offset Line.
Line E-F is the 0.5% (0.005 in./in.) Extension Line.
Curve A-R is a complete Stress-Strain Curve to
specimen failure.
Segment S-R can be obtained with an instrument
with the appropriate measuring capacity.
Point V = Proportional Limit.
Point W = Proof Stress, 0.01% Offset.
Point X = Yield Strength, 0.1% Offset.
Point Y = Yield Strength, 0.2% Offset.
Point Z = Yield Strength, 0.5% Extension
Under
Load (conventional Yield Point). At Point S,
the extensometer was removed.
Point T or T’=Ultimate Tensile Strength.
Fig III.18 Simple Matlab Program about recieving,calculation and showing datas

55
TROUBLESHOOTING
Troubleshooting is a form of problem solving, often applied to repair failed products or
processes. It is a logical, systematic search for the source of a problem so that it can be
solved, and so the product or process can be made operational again. We build it under
three headings which are mechanic, elektronik and sofware.
When you close switch the green LED should light up front of the electrical panel. If it
does not:
1. Check the fuse in the electrical panel. If it is open close.
2. There is no power in the socket. Check the control with the stylus.
3. Check CLIPS in the electric panel.
If LED is on then motor of hidrolik unite must be run. If not.
1. Check CLIPS of motor in the electric panel.
Hydraulic cylinder movement provided by using the manual buttons provided. If it does
not:
1. The emergency button can be pushed. Pacify it.
2. +24VDC may be not going to valves. Check with an avometer. Hydraulic
cylinder with an external source of energy if it is running it is not a mechanical
problem.Check the electronic circuit relays red led should light up after pressing
the button. Circuit power supply is off. Check it out.
3. Hydraulic cylinder seals may be able to leaked oil. Check it out.
4. The motor connections can be made as reverse. There is no pressure. Check it
out.
When the button is pressed, the barometer on the hidrolik unite value rising suddenly:
1. Throttle valve may be very bored. Check it out.
2. Disassembly hoses from the hydraulic unit to hydraulic cylinder. If flow is exist
then problem is on hydraulic unite. Repair it.
Load cell and linear ruler are absolute sensors. If the signal can not be received from the
computer:
1. Sensors and supply voltages should be checked with an avometer at idle.
2. Whether or not the output should be checked.
3. If still the computer has no signal then problem is software.
56
RESULTS AND ARGUMENTS
As a result of our studies, we found a test control machine, two different drive system as
well as advantages and disadvantages of these systems are different from each other.
For example electromechanical test machine could be more effort and cost although they
are more controllable than hydraulics test machines. This test machine can be controlled as
a strain rate. According to volume of machine, electromechanical test machine are less
occupied than hydraulic test machine. Hydraulic machines are manufactured using less
material than electromechanics, therefore, are produced with less cost. Concerned that the
pressure of hydraulic cylinders are controlled as a stress rate. They take more space because
the hydraulic cylinder is long, and needs hydraulic unit for power. There is a limit of a
hydraulic test machine stroke due to hydraulic cylinder‘s size. Despite this,
electromechanical machines are usually based on length of screw shaft and screw shaft
lenght is almost machine lenght, its stroke is more than hydrauli machines. Some designs
hydraulic cylinder was put at the top of the machine because of this problem of hydraulic
units. This is also another problem. Hydraulic hoses. It goes down from the top of the
machine to hydraulic unite. It is an unwanted situation.
When we talk about the design of mechanical grips, mechanical wedge system is the most
widely used system. The most important feature of this grips, different parts of the sample
geometry easily installed in. In addition, the threaded grips are prefered most stuations.
Some specimens are out of the standart then grips desing must be specific to the specimen.

57
CONCLUDING
As a result, we learned of a tensile testing machine is used for what purposes. Knowledge
of the mechanical properties of materials for design issues vital it realized. For this purpose
the development of materials technology improve machines capable of measuring to
describe them is obvious. We read the devolopment of tensile test machines since 16th
Century. Today, there are high tech automatic machines provided sofware and included
robot control in order to installitiaiton a specimen. In this way, more than one test machine
run at the same time.
We examined would be looking for a tensile test machine when design. Alignment, and
sample load is causing the unwanted part and we saw that we pay attention to avoid them.
We touched on the design of the grips and found that the designs are different grips for
different specimens. Machine stiffness touched on the topic. Deformation of the specimen
during testing machine parts while the machine is also seen on the deformations. We saw
the value of stiffness is important in the knowledge of the results of this machines. We
have considered the other affecting the speed of tensile tests. Stress and strain rate issues
examined values by the standards. How many types of sensors types and these sensor what
purpose used and studied. There are sensor as alternatively of avoid sensors have touched
on that. Obtained datas by the sensors read by the computer automatically calculated by
special software.
Finally, we desing a tensile testing machine capacity of 5tonf (50kN), and thanks to a
company that sponsors have produced this machine. We desinged and produced the grips.
Eletronik card is put into making the electrical panel. This card is provided to control his
computer to the machine.

58
ACKNOWLEDGEMENT
I owe a great many thanks to a great many people who helped me and supported me during
this project.
My deepest thanks to Supervisor Doç.Dr. Bülent Ekici the Guide of the project for guiding
and correcting various documents of mine with attention and care.
My deep sense of gratitude to Halidun Mumcu and Abdulmuttalib Tezcan, Merkon Makina
support and guidance. Thanks and appreciation to helpful people at Merkon Makina, for
their support.
I would also thank my faculty members without whom this project would have been a
distant reality. I also extend my heartfelt thanks to my family and wall wishers.
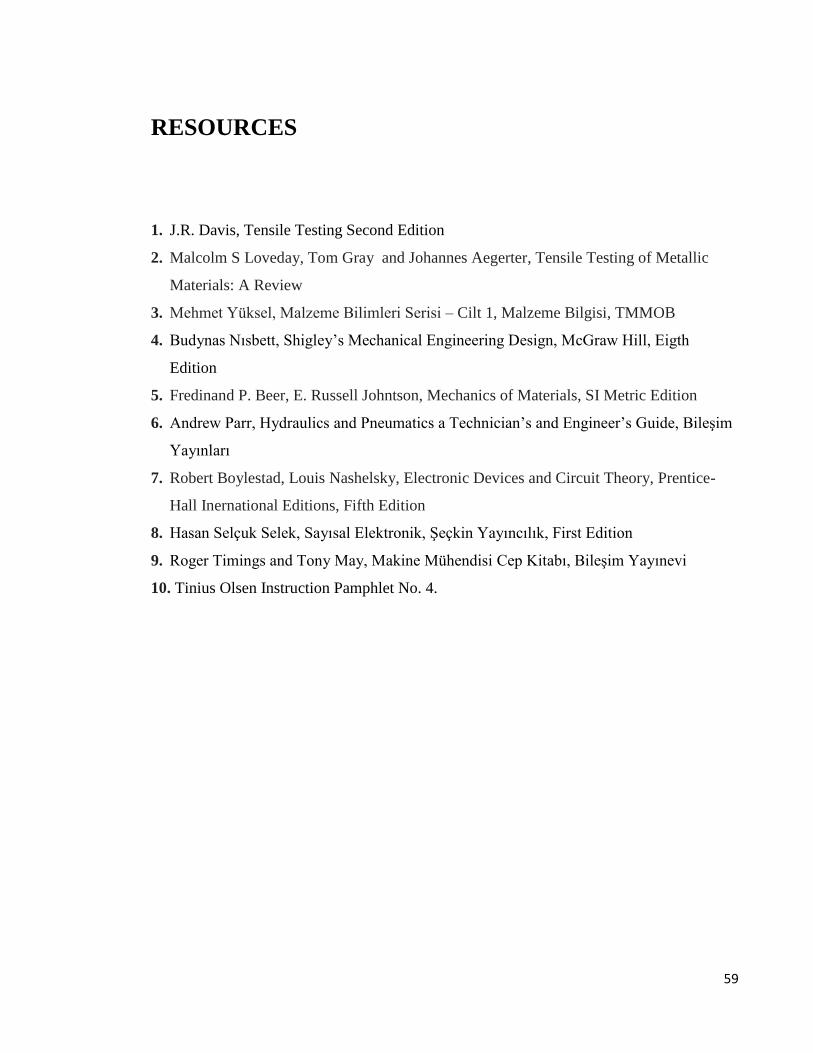
59
RESOURCES
1. J.R. Davis, Tensile Testing Second Edition
2. Malcolm S Loveday, Tom Gray and Johannes Aegerter, Tensile Testing of Metallic
Materials: A Review
3. Mehmet Yüksel, Malzeme Bilimleri Serisi – Cilt 1, Malzeme Bilgisi, TMMOB
4. Budynas Nısbett, Shigley‘s Mechanical Engineering Design, McGraw Hill, Eigth
Edition
5. Fredinand P. Beer, E. Russell Johntson, Mechanics of Materials, SI Metric Edition
6. Andrew Parr, Hydraulics and Pneumatics a Technician‘s and Engineer‘s Guide, Bileşim
Yayınları
7. Robert Boylestad, Louis Nashelsky, Electronic Devices and Circuit Theory, Prentice-
Hall Inernational Editions, Fifth Edition
8. Hasan Selçuk Selek, Sayısal Elektronik, Şeçkin Yayıncılık, First Edition
9. Roger Timings and Tony May, Makine Mühendisi Cep Kitabı, Bileşim Yayınevi
10. Tinius Olsen Instruction Pamphlet No. 4.

60
APPENDIX
APP.1: TECHNICAL DRAWINGS OF THE MACHINE
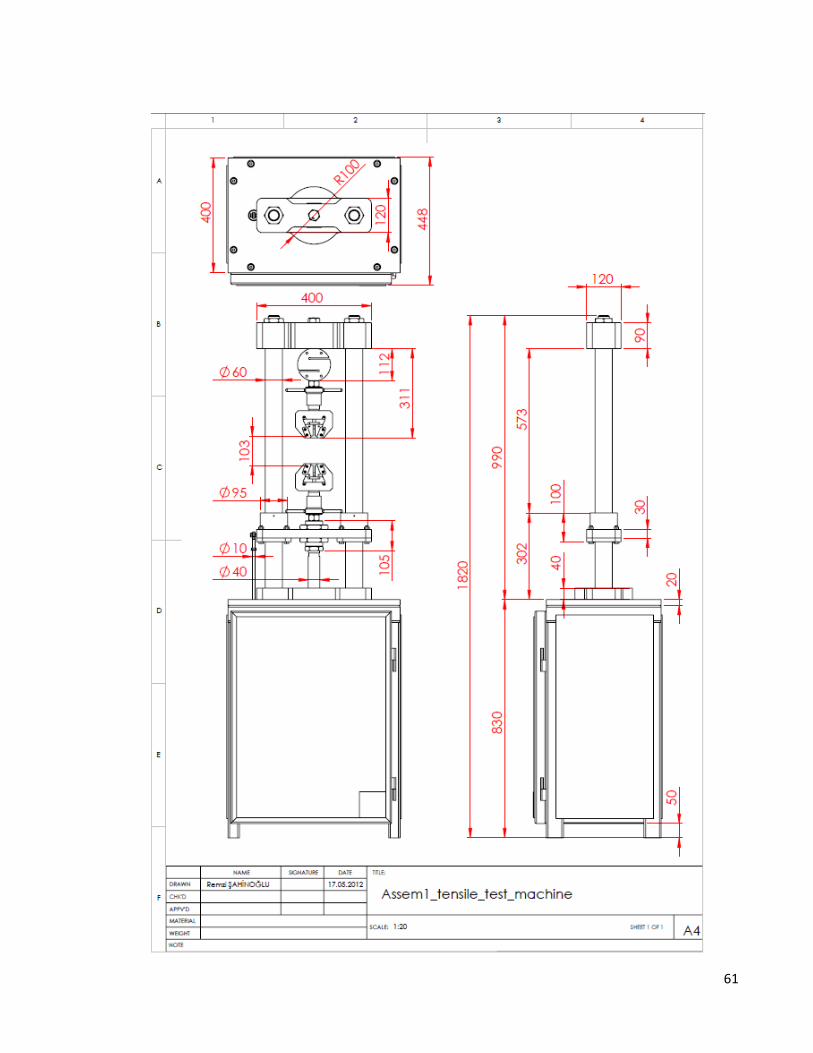
61
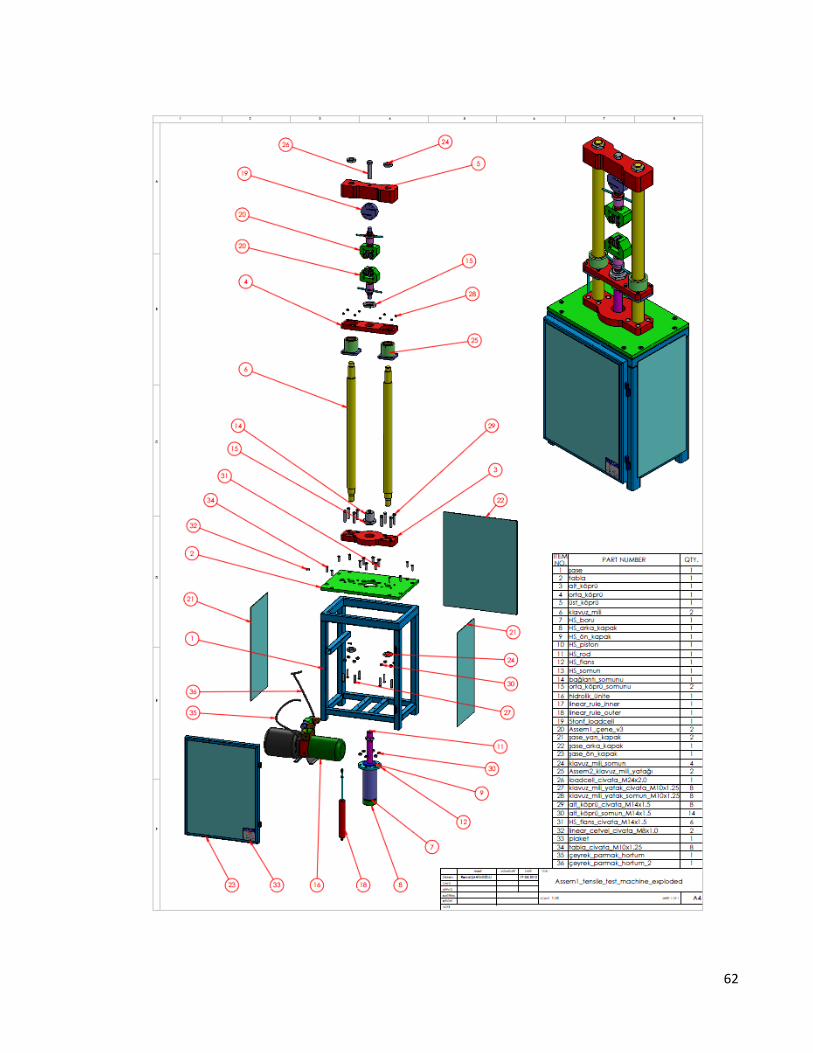
62

63
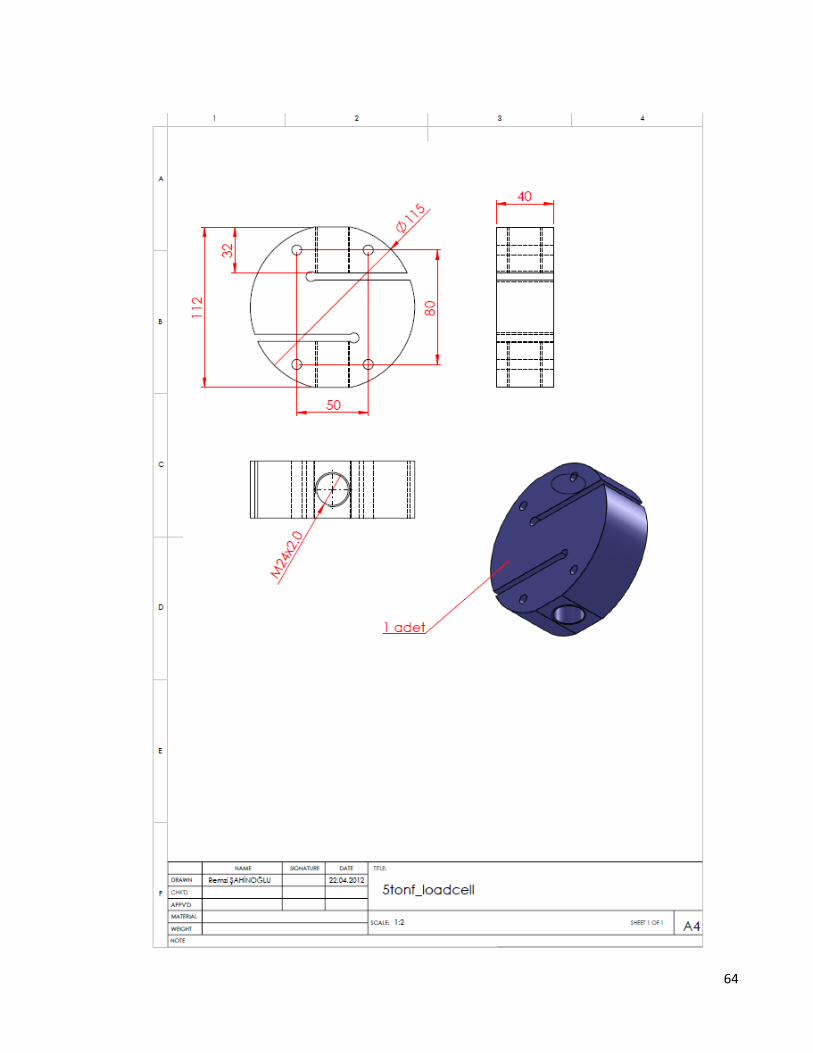
64

65

66
APP.2: TECHNICAL DRAWINGS OF THE CHASSIS
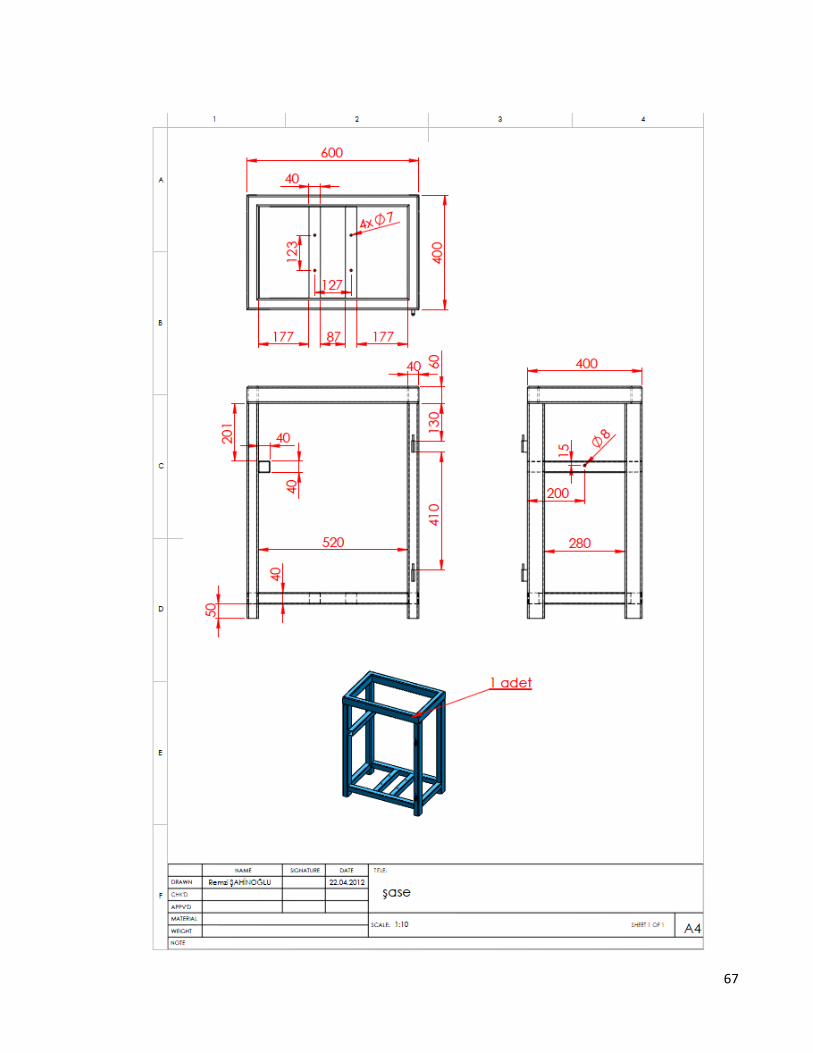
67
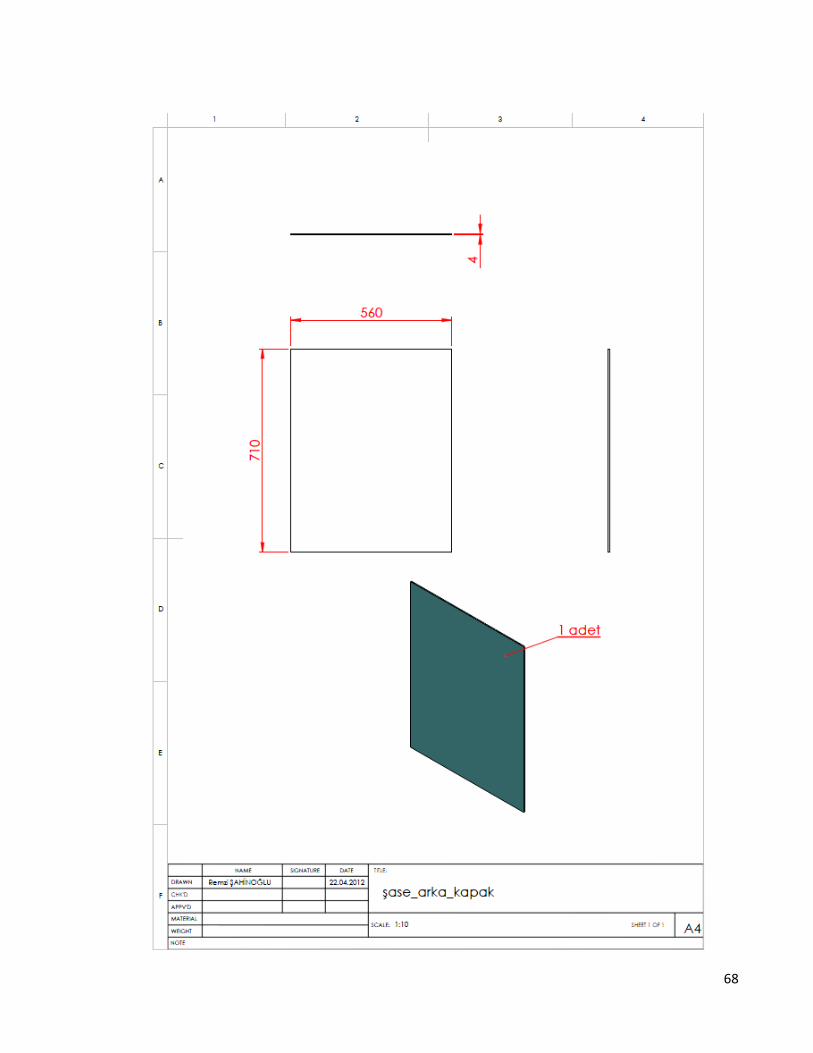
68

69

70

71
APP.3: TECHNICAL DRAWINGS OF THE GUIDE SHAFT
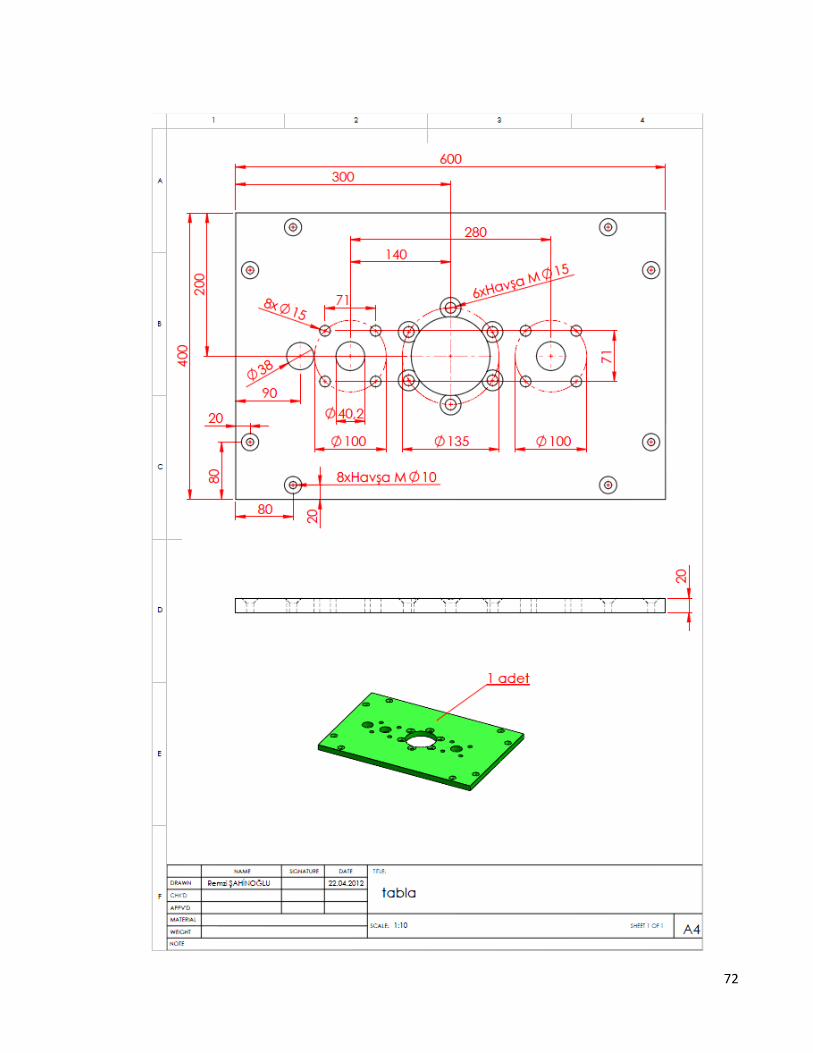
72

73

74

75

76

77
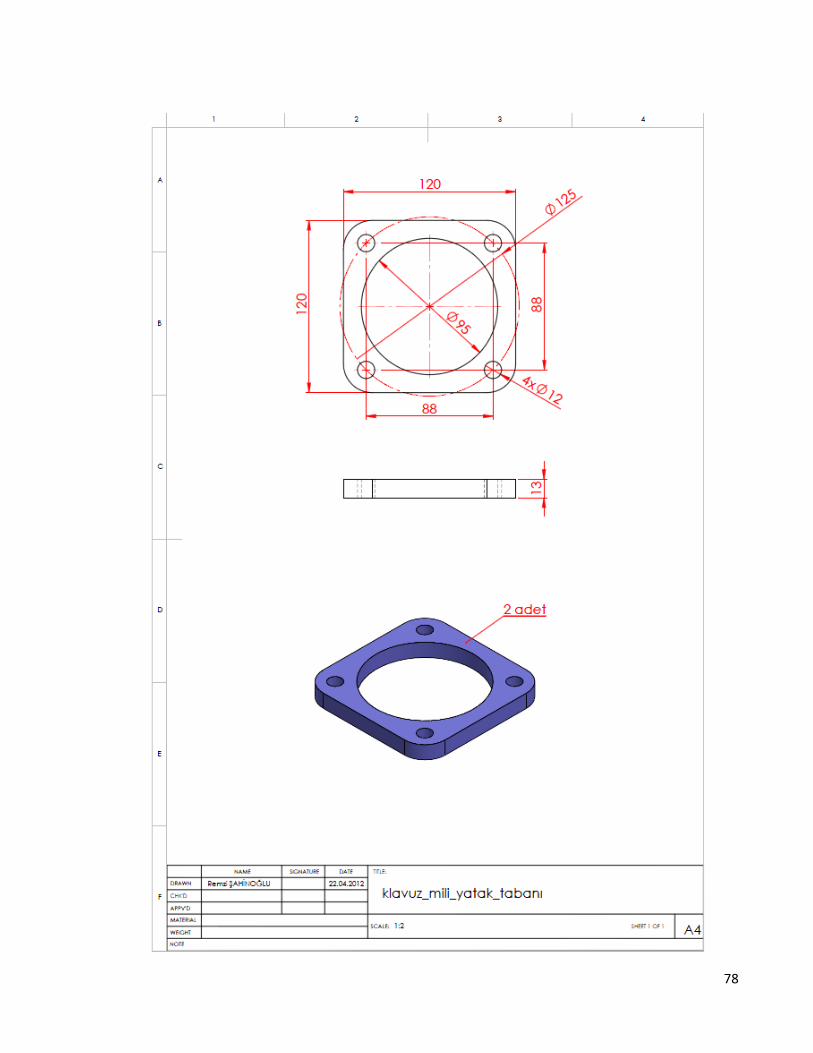
78
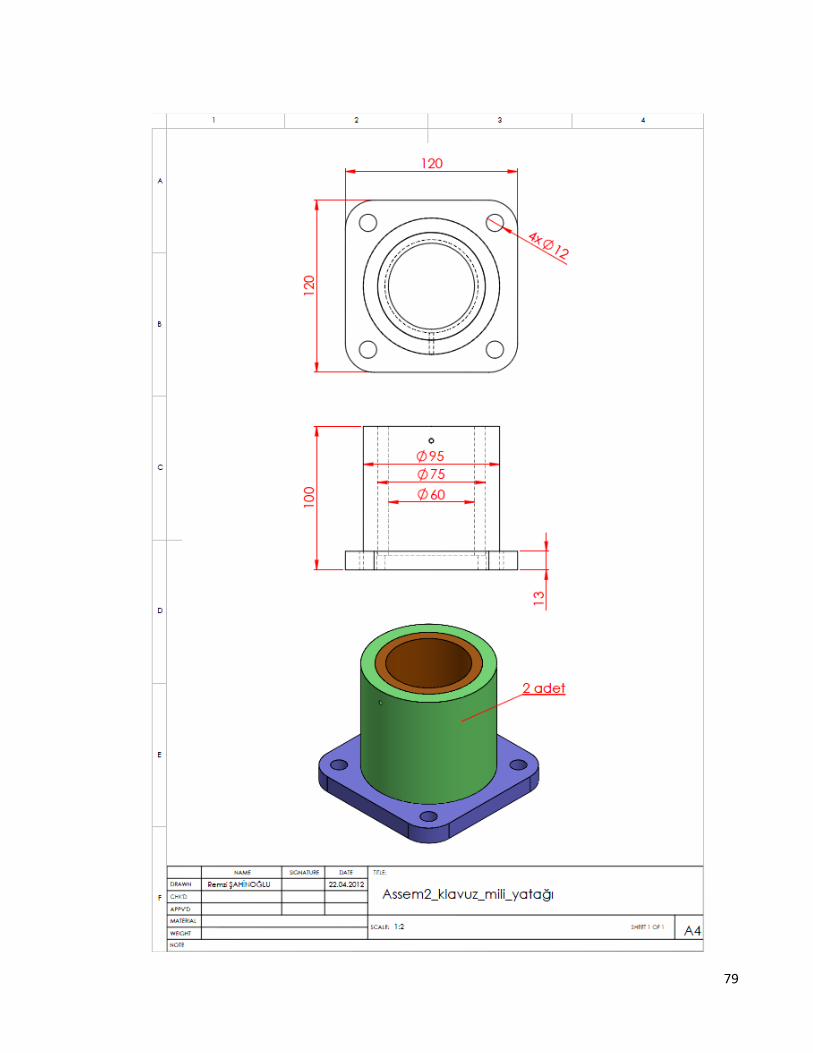
79

80
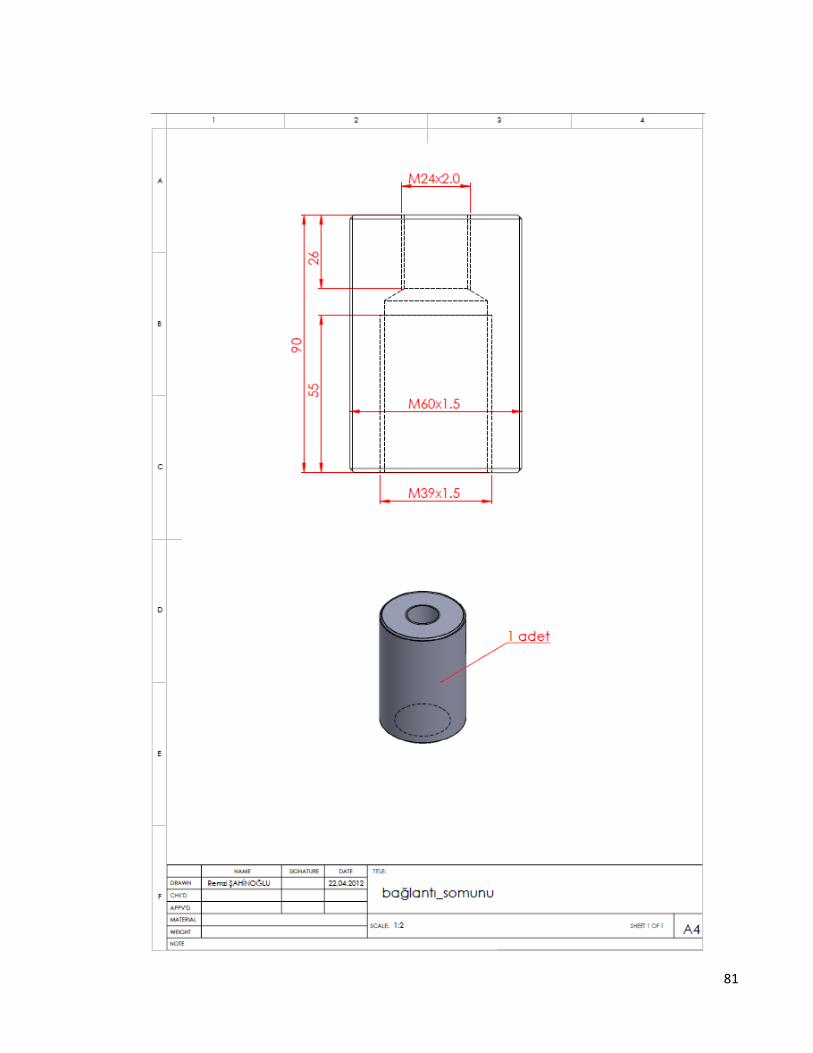
81
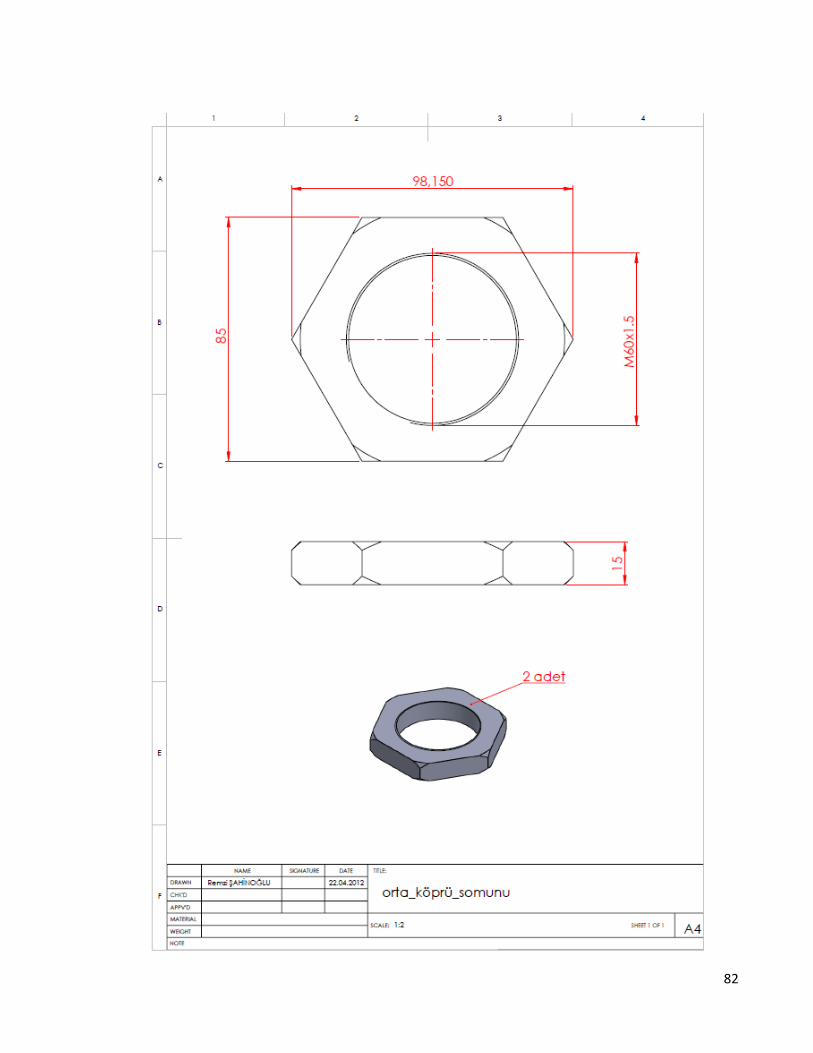
82

83
APP.4: TECHNICAL DRAWINGS OF THE WEDGE GRIP
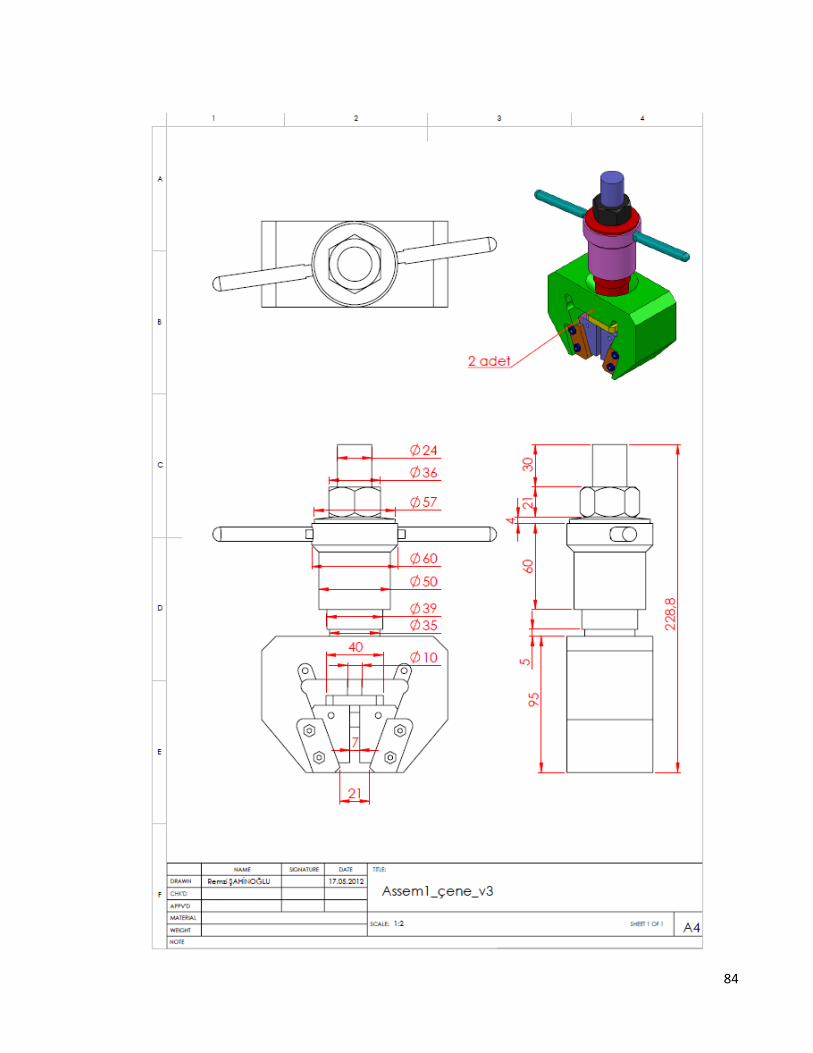
84
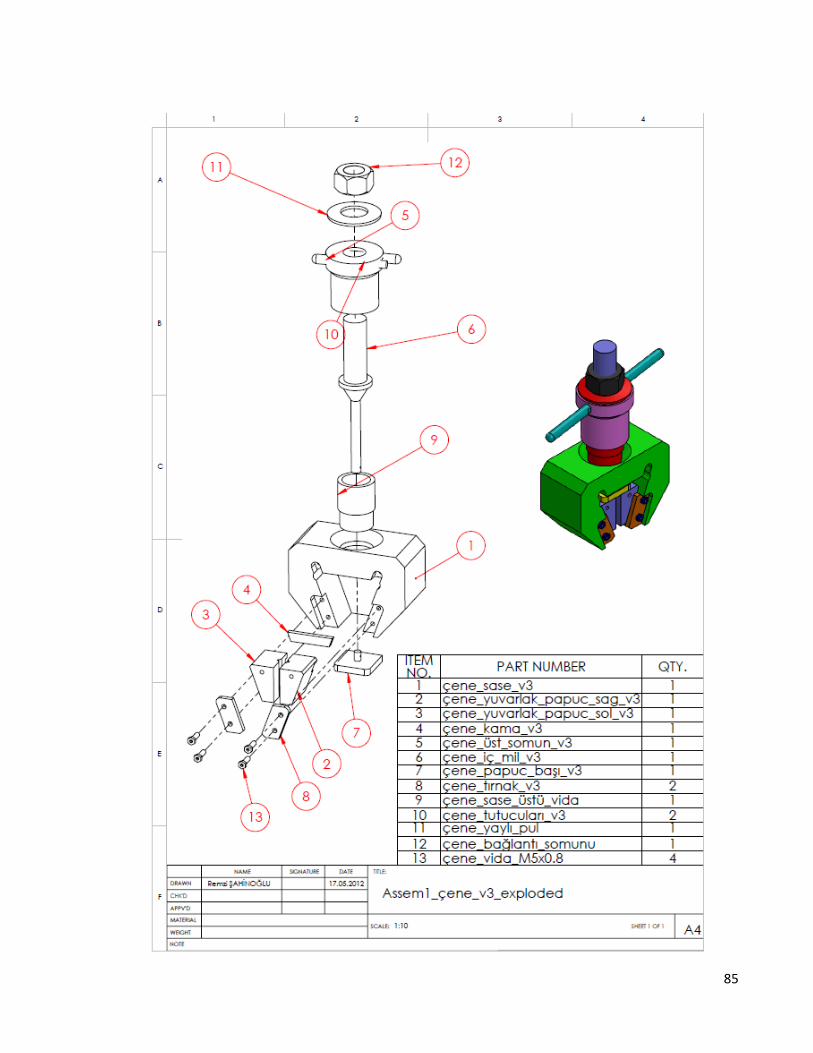
85

86

87

88

89

90
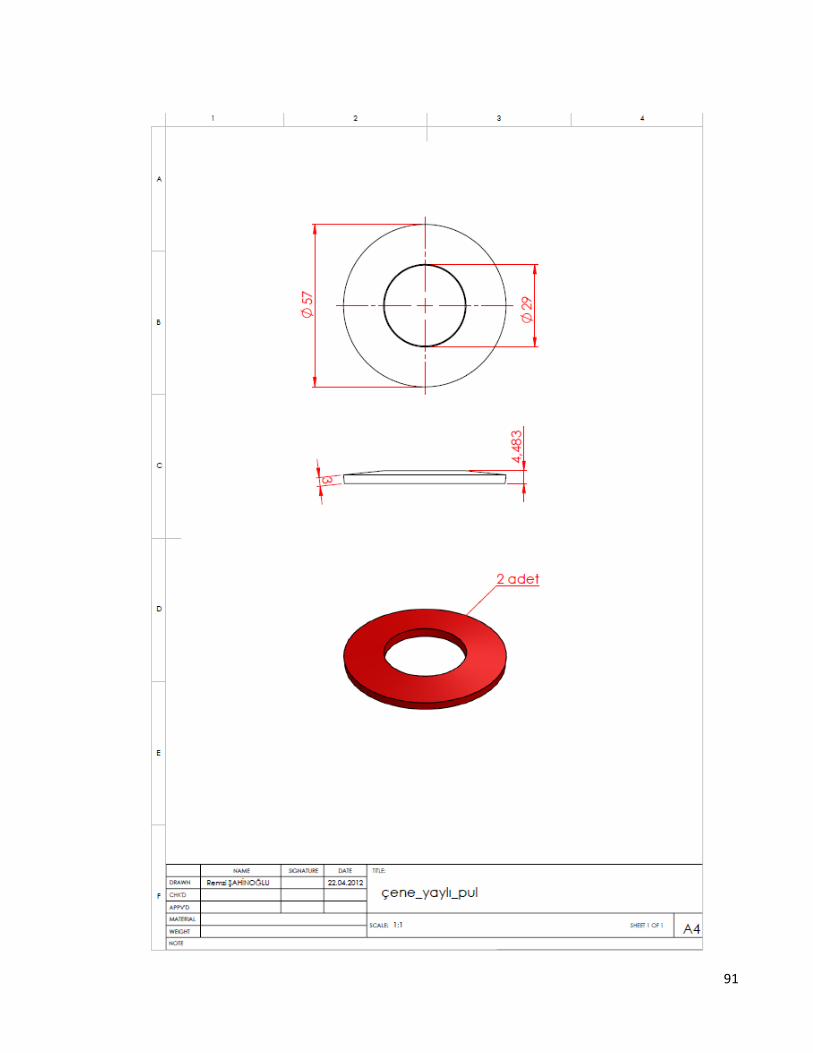
91

92

93
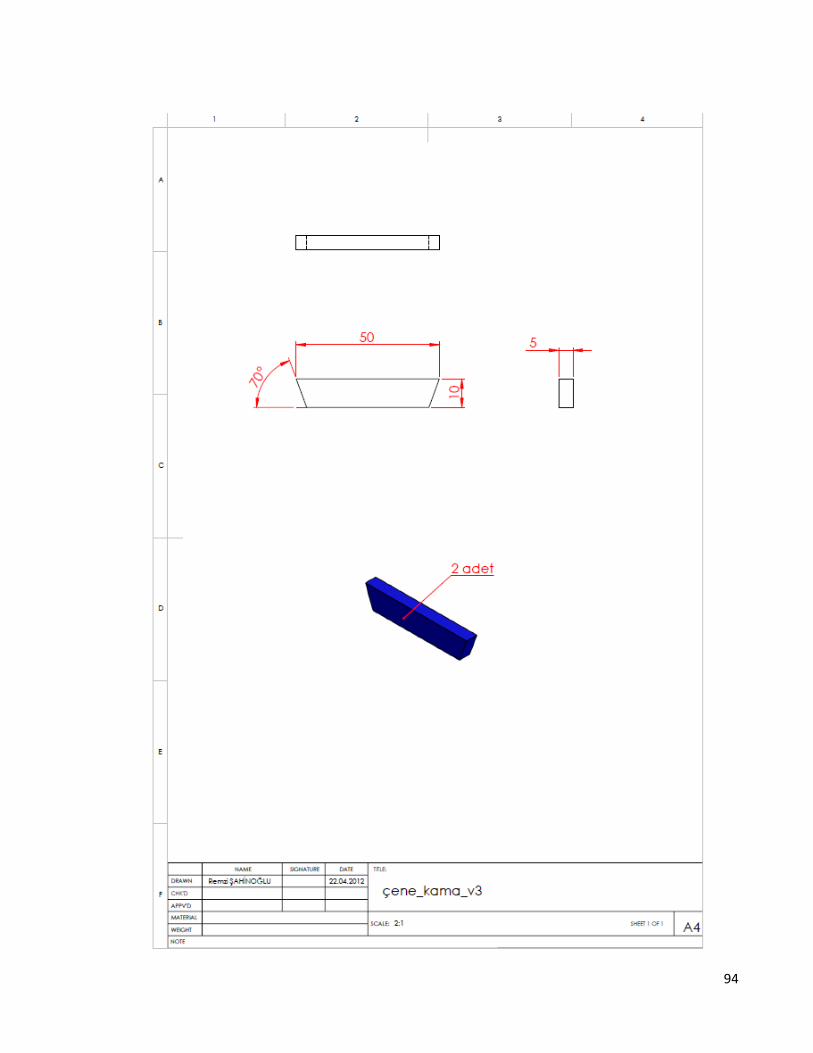
94

95
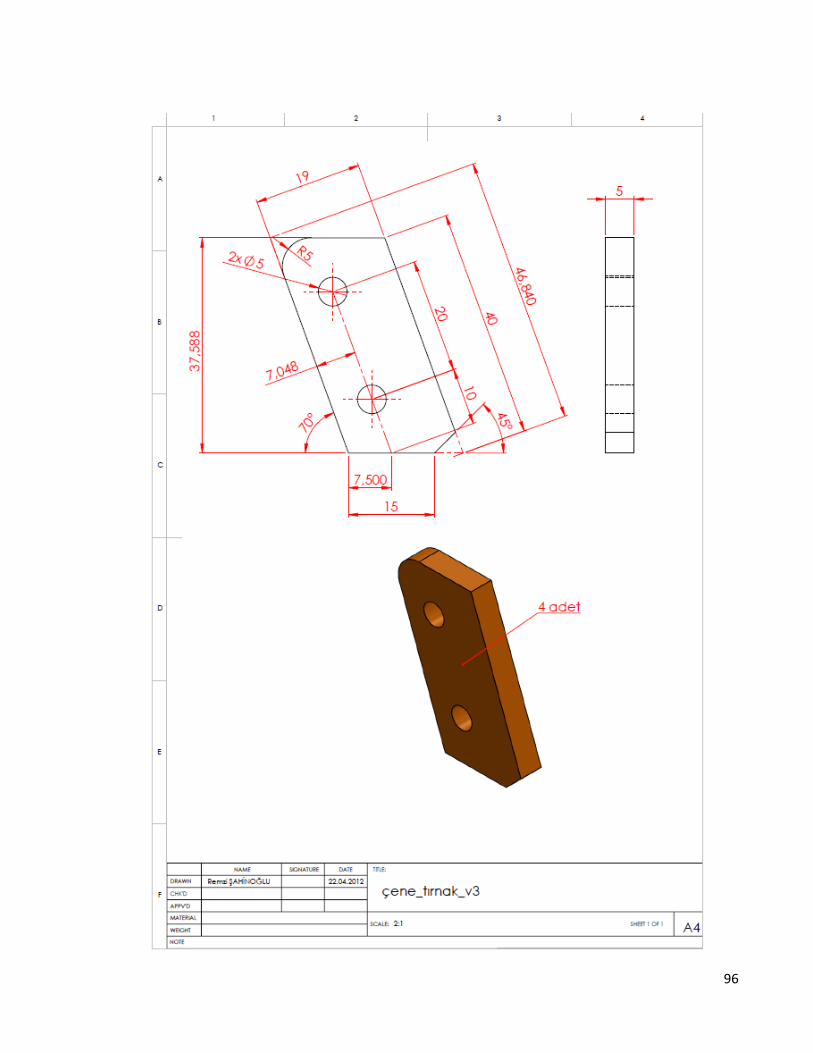
96

97

98
APP.5: TECHNICAL DRAWINGS OF THE HYDRAULIC CYLINDER

99
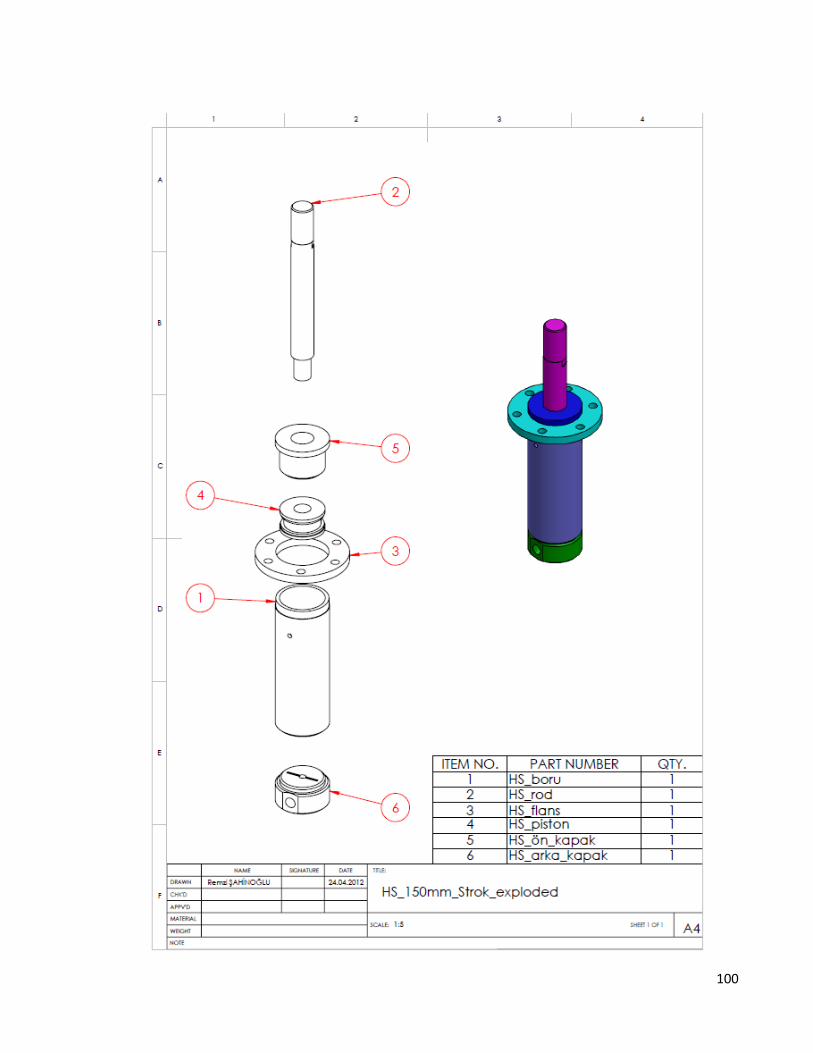
100

101

102
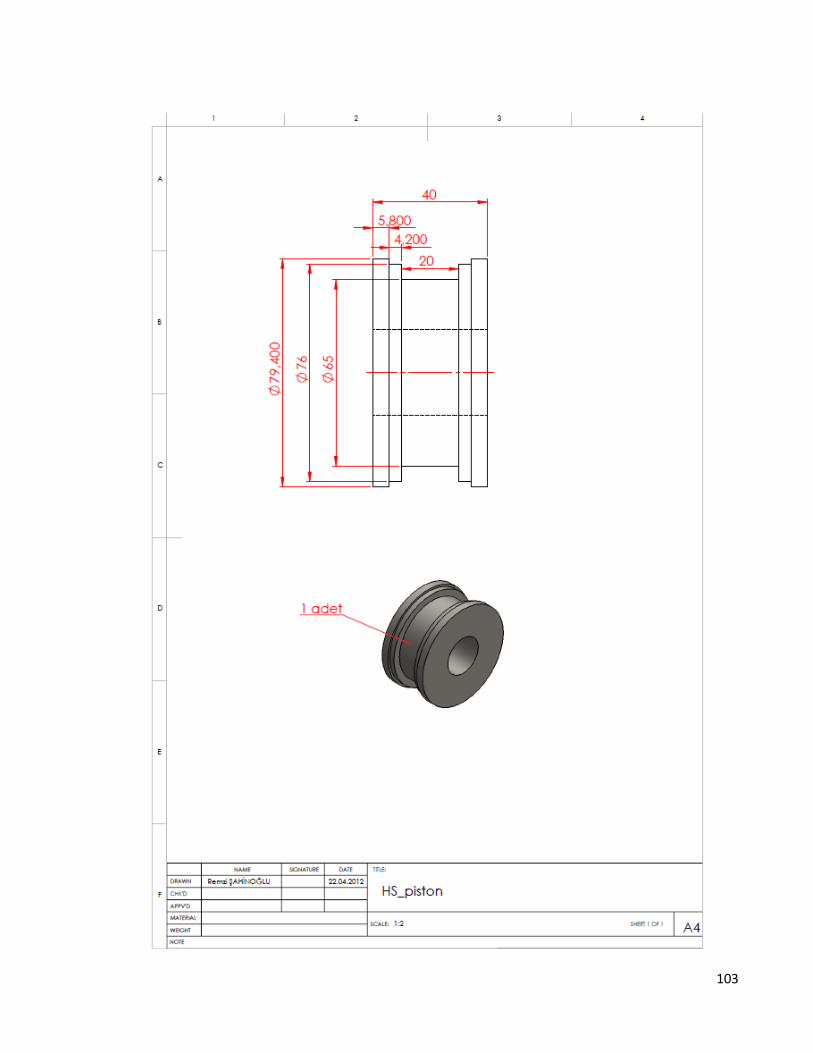
103
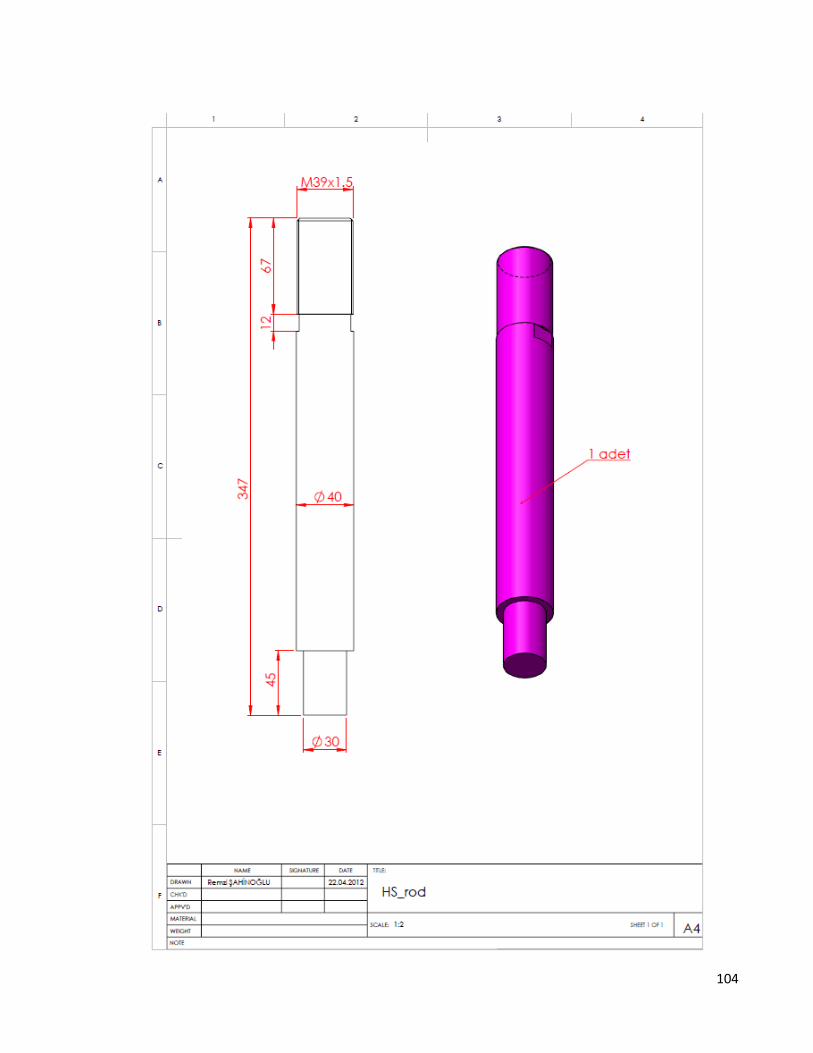
104

105
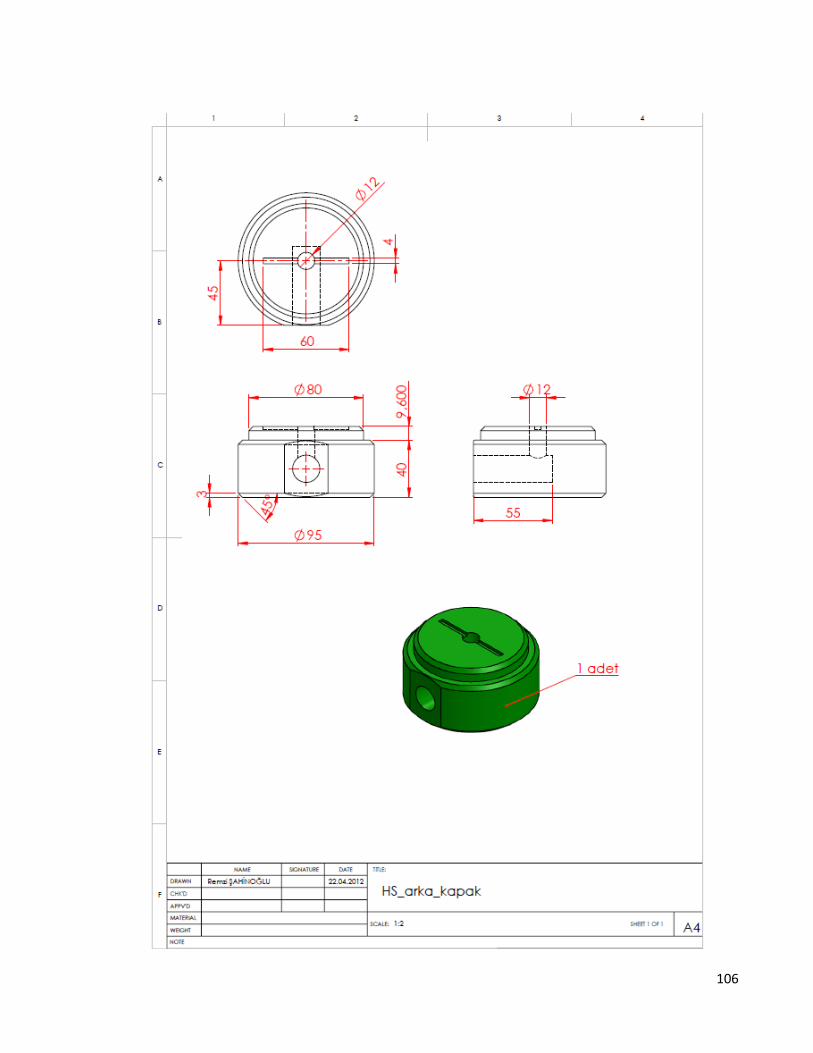
106
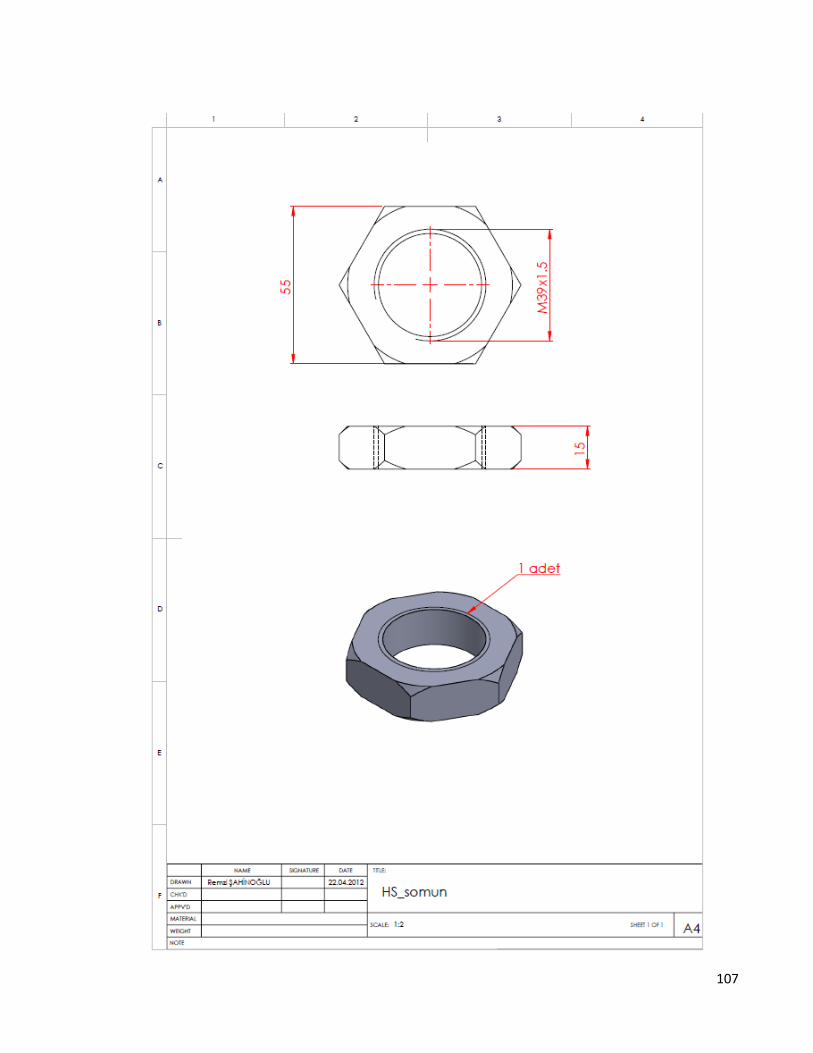
107

108
APP.6: G-CODES OF THE GRIP PARTS
G-CODES OF THE BLOCK of TWO:
This code is very long about 6658 line. It is added just as cycle codes. It have three cycle.
First layer is down from 0 to -10mm. Second layer is -50mm and Third layer is -62mm.
Block width is 60mm. Margin is 2mm for revers operation of the block. If you use this
code, you will first determine your cutting height which is I used 0.25mm, then copy past
the current cycle untill reach next layer, then do it same thing for other layer. Ignore the
number of N codes.
First cycle:
%12 G71
N10 G00 G17 G90 G40
N11 G99 T01 L00 R0
N12 S1000 M03
N13 M08 Z0.0
N14 X0.00 Y0.00
N14 X-33.668 F200
N16 X0 Y40.124
N17 Y92.071
N18 X-12.929 Y105
N19 X-127.071
N20 X-140 Y92.071
N21 Y40.124
N22 X-106.332 Y0
N23 X-91.859
N24 X-105.540 Y37.588
N25 X-97.027
N25 X-83.346 Y0
N25 X-74.823
N25 X-88.513 Y37.588
N25 X-90.540
N25 X-104.545 Y76.067
N25 X-100.517 Y65
N25 X-102.517
N25 X-37.483
N25 X-39.483
N25 X-35.455 Y76.067
N25 X-49.460 Y37.588
N25 X-51.487
N25 X-65.168 Y0
N25 X-66.319
N25 X-82.912 Y45.588
N25 X-84.938
N25 X-89.092 Y57
N25 X-92.156 Y59.571
N25 X-89.092 Y57
N25 X-50.908
N25 X-47.844 Y59.571
N25 X-50.908 Y57
N25 X-55.062 Y45.588
N25 X-57.088
N25 X-65.743 Y21.809
N25 X-75.640 Y49
N25 X-78.238 Y50.50
N25 X-75.640 Y49
N25 X-64.360
N25 X-61.762 Y50.50
N25 X-64.360 Y49
N25 X-66.754 Y42.422
N25 X-56.654 Y0
N25 X-42.973 Y37.588
N25 X-34.460
N25 X-48.141 Y0
N49 X0
N52 Z-0.25
... (copy the 1st cycle)
N52 Z-0.50
... (copy the 1st cycle)
...
...
...
N52 Z-10.0
... (copy the 1st cycle)
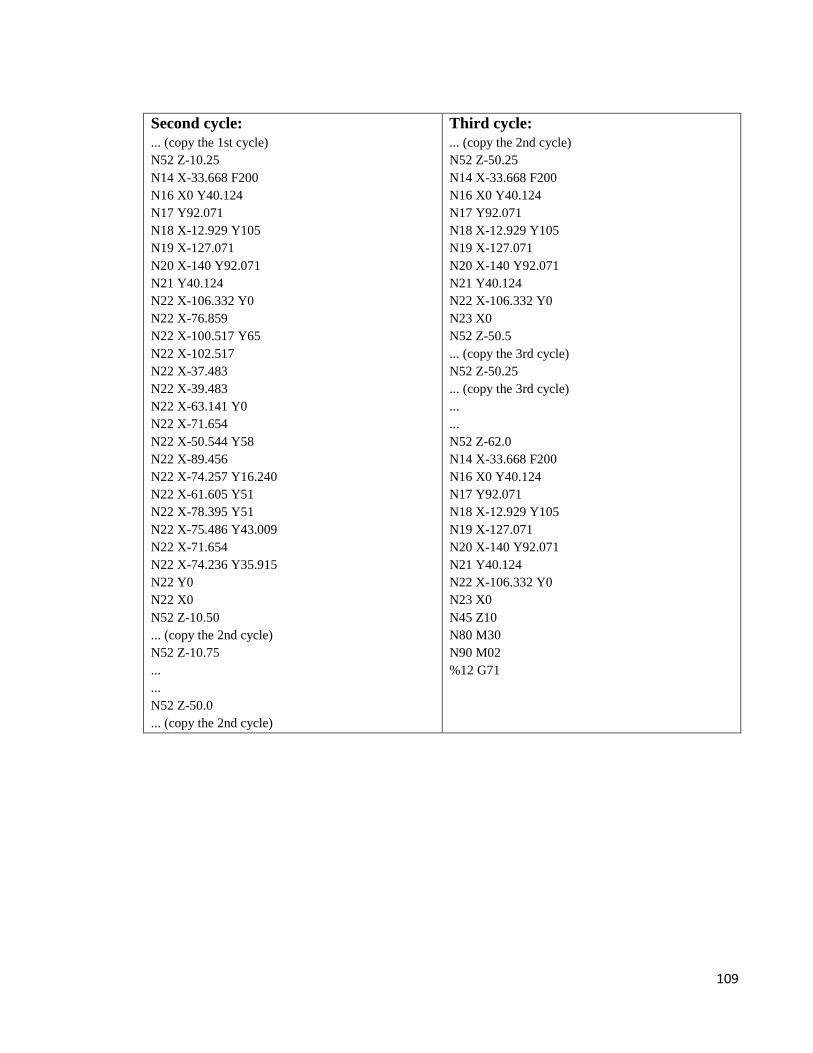
109
Second cycle:
... (copy the 1st cycle)
N52 Z-10.25
N14 X-33.668 F200
N16 X0 Y40.124
N17 Y92.071
N18 X-12.929 Y105
N19 X-127.071
N20 X-140 Y92.071
N21 Y40.124
N22 X-106.332 Y0
N22 X-76.859
N22 X-100.517 Y65
N22 X-102.517
N22 X-37.483
N22 X-39.483
N22 X-63.141 Y0
N22 X-71.654
N22 X-50.544 Y58
N22 X-89.456
N22 X-74.257 Y16.240
N22 X-61.605 Y51
N22 X-78.395 Y51
N22 X-75.486 Y43.009
N22 X-71.654
N22 X-74.236 Y35.915
N22 Y0
N22 X0
N52 Z-10.50
... (copy the 2nd cycle)
N52 Z-10.75
...
...
N52 Z-50.0
... (copy the 2nd cycle)
Third cycle:
... (copy the 2nd cycle)
N52 Z-50.25
N14 X-33.668 F200
N16 X0 Y40.124
N17 Y92.071
N18 X-12.929 Y105
N19 X-127.071
N20 X-140 Y92.071
N21 Y40.124
N22 X-106.332 Y0
N23 X0
N52 Z-50.5
... (copy the 3rd cycle)
N52 Z-50.25
... (copy the 3rd cycle)
...
...
N52 Z-62.0
N14 X-33.668 F200
N16 X0 Y40.124
N17 Y92.071
N18 X-12.929 Y105
N19 X-127.071
N20 X-140 Y92.071
N21 Y40.124
N22 X-106.332 Y0
N23 X0
N45 Z10
N80 M30
N90 M02
%12 G71

110
G-CODES OF THE WEDGE of FOUR:
This code also very long about 2136 line. It have 2 layer. Same operation should be do like
previous code operation. First layer is down to -10mm. Seconde layer is down to -42mm.
The wedge width is 40mm. Margin is 2mm for revers operation of the wedge.
First cycle:
%14 G71
N10 G00 G17 G90 G40
N11 G99 T01 L00 R0
N12 S1000 M03
N13 M08 Z0.0
N14 X0 Y0
N14 Y50 F200
N15 X-39.700
N16 X-21.501 Y0
N17 X-61.201
N18 Y50
N19 X-82.702
N20 X-100.900 Y0
N21 X-122.401
N22 Y50
N23 X0
N24 Y35
N25 X-34.24
N26 X-26.960 Y15
N27 X-95.441
N28 X-88.161 Y35
N30 X-122.401
N31 Y0
N32 X0
N33 Z-0.25
... (copy the 1st cycle)
N33 Z-0.50
... (copy the 1st cycle)
Second cycle:
... (copy the 1st cycle)
N33 Z-10.5
N14 Y50 F200
N15 X-122.401
N16 Y0
N17 X-61.201
N18 Y50
N19 X-82.702
N20 X-100.900 Y0
N21 X-21.501
N22 X-39.700 Y50
N22 X-21.501 Y0
N22 X0
N33 Z-10.75
... (copy the 2nd cycle)
N33 Z-11.00
...
...
N33 Z-42.0
N14 Y50 F200
N15 X-122.401
N16 Y0
N17 X-61.201
N18 Y50
N19 X-82.702
N20 X-100.900 Y0
N21 X-21.501
N22 X-39.700 Y50
N22 X-21.501 Y0
N22 X0
N23 Z10
N80 M30
N90 M02
%14 G71
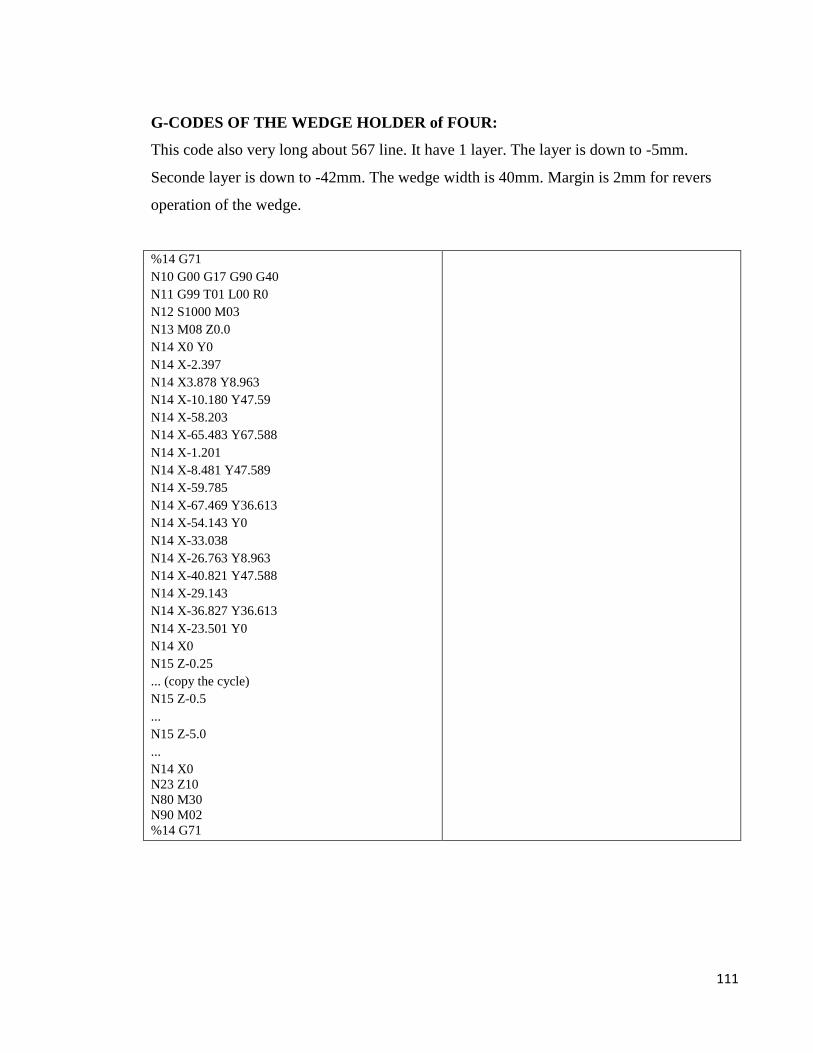
111
G-CODES OF THE WEDGE HOLDER of FOUR:
This code also very long about 567 line. It have 1 layer. The layer is down to -5mm.
Seconde layer is down to -42mm. The wedge width is 40mm. Margin is 2mm for revers
operation of the wedge.
%14 G71
N10 G00 G17 G90 G40
N11 G99 T01 L00 R0
N12 S1000 M03
N13 M08 Z0.0
N14 X0 Y0
N14 X-2.397
N14 X3.878 Y8.963
N14 X-10.180 Y47.59
N14 X-58.203
N14 X-65.483 Y67.588
N14 X-1.201
N14 X-8.481 Y47.589
N14 X-59.785
N14 X-67.469 Y36.613
N14 X-54.143 Y0
N14 X-33.038
N14 X-26.763 Y8.963
N14 X-40.821 Y47.588
N14 X-29.143
N14 X-36.827 Y36.613
N14 X-23.501 Y0
N14 X0
N15 Z-0.25
... (copy the cycle)
N15 Z-0.5
...
N15 Z-5.0
...
N14 X0
N23 Z10
N80 M30
N90 M02
%14 G71

112
APP.7: ELECTRONIC CIRCUIT DIAGRAMS
ELECTRONIC CIRCUIT DIAGRAM
PRINTED CIRCUIT DIAGRAM

113
APP.8: ELECTRIC TERMINAL CONNECTION
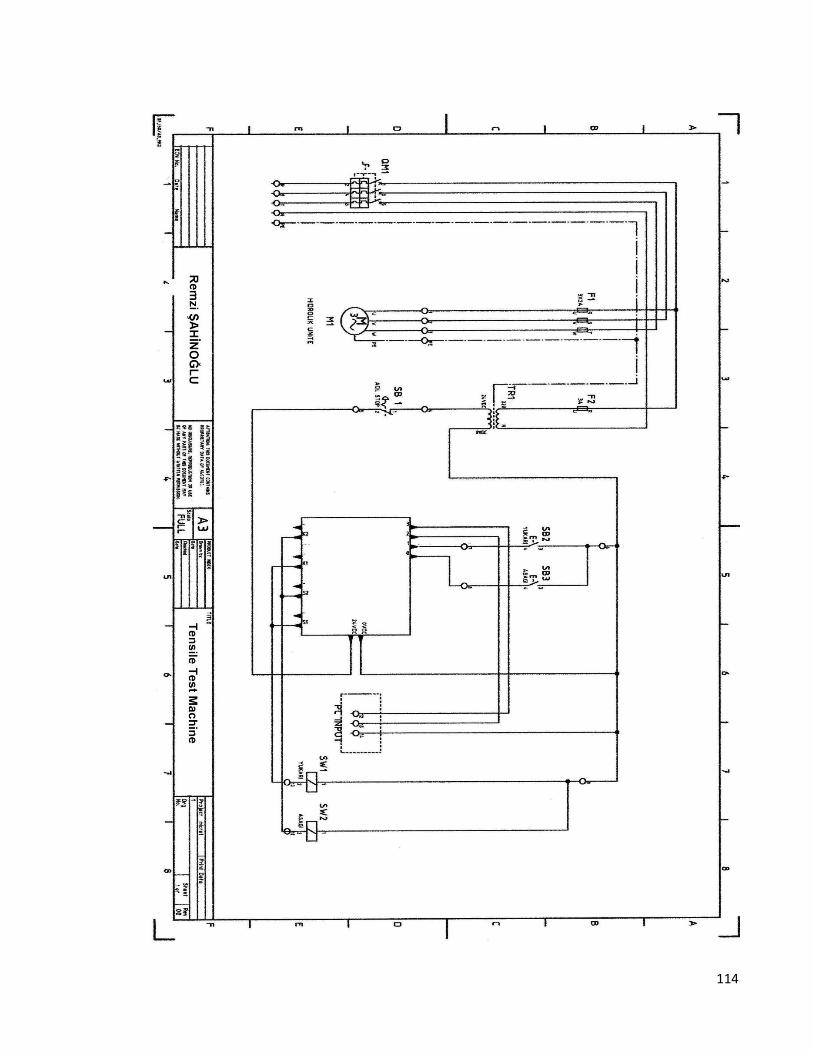
114
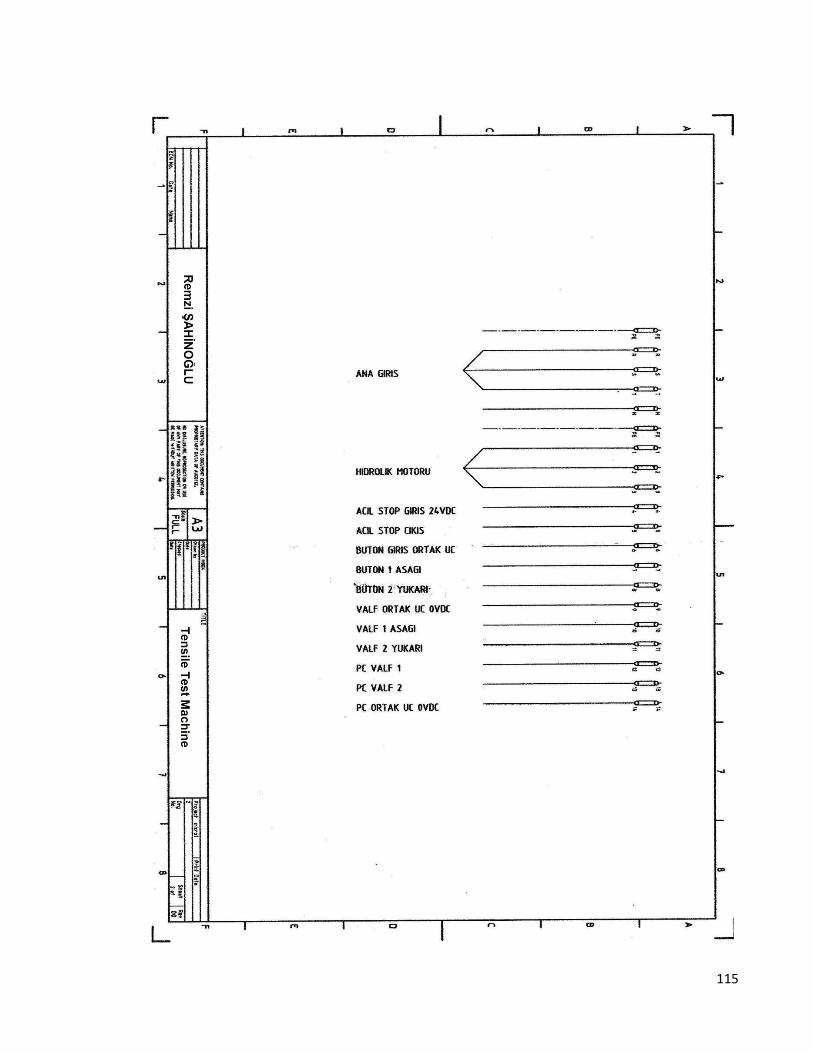
115


![DESIGNING A MANUFACTURING STRATEGY - [email protected]](https://static.fdocuments.us/doc/165x107/62064d0c8c2f7b173006693d/designing-a-manufacturing-strategy-emailprotected.jpg)


