Designing an effective Chart of Accounts structure using ... · PDF fileDesigning an effective...
19
Designing an effective Chart of Accounts structure using Oracle Applications Author: Richard Byrom Organisation: RPC Data Ltd Position: Oracle Applications Consultant Conference: South African Oracle User Group 2003 Presentation Date: Wednesday 8 th October, 2003 Presentation Location & Time: Royal Ballroom North 11h50 – 12h40 E-mail [email protected] [email protected] Web Site http://www.rpcdata.com http://www.richardbyrom.com
Transcript of Designing an effective Chart of Accounts structure using ... · PDF fileDesigning an effective...
Designing an effective Chart of Accounts structure using Oracle Applications
Author: Richard Byrom Organisation: RPC Data Ltd
Position: Oracle Applications Consultant Conference: South African Oracle User Group 2003
Presentation Date: Wednesday 8th October, 2003 Presentation Location & Time: Royal Ballroom North 11h50 – 12h40
E-mail [email protected] [email protected]
Web Site http://www.rpcdata.com http://www.richardbyrom.com
Abstract An effective chart of accounts design can have a significant impact on the success of any system implementation. This paper covers why an effective Chart of Accounts should be designed and looks at how the unique capabilities of the Oracle Applications system can enable organisations to achieve an effective chart of accounts design. Introduction The building blocks or foundation for an effective financial system implementation is the Chart of Accounts. This paper will cover why an effective Chart of Accounts should be designed and then looks at how the unique capabilities of the Oracle Applications system enable the organisation to achieve an effective Chart of Accounts design. The author will propose that a 3-step process be used to design your Chart of Accounts. Firstly, generic design issues should be considered. These are issues that would normally be considered when designing Charts of Account irrespective of the system type. The main idea presented here will be that the reporting requirements of the organisation should drive the design of the Chart of Accounts and not the other way around. Secondly, specific organisation, industry and country factors should be considered when designing the chart of accounts. Different types of organisations will all use different Chart of Accounts structures as a result of varying reporting requirements. There may also be within certain industries standards that are generally accepted and practised. Government regulations within certain countries can also dictate how accounts are to be structured. Thirdly, we will focus on the functionality that Oracle Applications offers to users and how this meets the business requirements. Topics of discussion will be the set of books and segment structure, security rules cross validation and statistical accounts. Advice and examples will be disseminated to readers throughout the paper based on implementation experiences. In closing the need for continuous improvement will be emphasised and various tools and utilities that can assist in the Chart of Accounts design will be examined. Empowering the Enterprise These days there’s a lot of talk about empowerment. I believe that your organisation can only become powerful or competitive by effectively combining the elements of people, processes and technology to achieve and sustain a competitive advantage within the relevant industry. Technology is an important part of an organisations success. However, organisations will only be successful if their technology is implemented in alignment with the business processes for a particular industry and is appropriately adopted by the people within an organisation. Figure 1 provides a simplistic view of how technology can be utilised to empower an organisation. Most organisations have a database in which they store their transactions. In order for such data to become useful it will have to be structured in a manner that ensures users understand it. Hence, we have to apply the human element of knowledge to data to ensure it becomes information. Information, as such, is data that has been structured in such a way that it provides value to the person analysing it. A typical example of the application of knowledge to turn data into information is the Chart of Accounts, it allows for organisational data to be structured in such a way that it becomes valuable. “Information at your fingertips” is a phrase coined by many proponents of the benefits of information systems. However, information on it’s own does not create value unless action is taken on it. It is imperative that users make timely decisions on the information that they are provided with in order to ensure that organisations realise their Return on Investment in Information Technology. An effective Chart of Accounts design will certainly SAOUG 2003 Copyright © 2003 by Richard Byrom Page 1

provide an entity with accurate, relevant, useful and timely information but this can only add value if appropriate decisions are taken.
Data Information
Timely DecisionsKnowledge
PowerData InformationInformation
Timely DecisionsTimely DecisionsKnowledgeKnowledge
Power
Figure 1: How to Empower your Organisation Another means of ensuring an organisation is empowered and attains and sustains a competitive position in it’s industry is by having a strategy that ensures it positions itself for success. Ordinarily an organisation will have a strategy at each level illustrated in Figure 2. What is important is to ensure the strategies and goals set at these levels align and are integrated with each other. Too often information fragmentation makes strategic alignment impossible. This problem can be resolved by designing your Chart of Accounts in such a way that it incorporates information appropriate to each level of the organisation. In order to set strategies at each level of the organisation there is a need for information which meets the needs of managers for each area of the business. A well designed Chart of Accounts will easily enable this requirement by building hierarchical relationships in to the Chart of Accounts that reflect the entities structure.
Corporate Head Office
Division A Division B
CorporateStrategy
BusinessStrategy
Functional/Tactical
Strategies
Finance
HR
IT
Procurement
Finance
HR
IT
Procurement
Figure 2: Levels of Strategy and Organisational Structure
SAOUG 2003 Copyright © 2003 by Richard Byrom Page 2
Why the need for an effective Chart of Accounts design? At a strategic level the case for an effective Chart of Accounts has been identified. I will now outline a number of additional reasons as to why an effective Chart of Accounts design is vital for a business: - It is the heart of the system. The Chart of Accounts is normally designed in the General Ledger module of any system. The General Ledger is the central repository for most of the financial and operational data that exists in organisation. Data flows in to the General Ledger from transactional systems and subsequently flows out of it in the form of printed reports and on line inquiries. In many ways it is like the human heart which has blood pumping in to it and then flowing out of it. The General Ledger is the heart of a system in the same way that the human heart is the heart of our bodily system. Just as the bodily system shuts down in the case of heart failure, so I believe the organisational system will collapse or run ineffectively if the Chart of Accounts fails to meet organisational requirements. Ease of use. A well designed Chart of Account facilitates data entry in to the system whether it is manually captured through human effort or automatically loaded via interfaces. Flexibility. Systems should be designed in such a way that they provide for organisational growth and change. A typical example might be acquisition of new business or disposal of existing business - here a chart of accounts should be flexible enough to enable these types of changes to be incorporated quickly and easily. Provides a foundation for further expansion. The expression “you have to learn to walk before you can run” is very appropriate here. Many organisations have illusions of grandeur and expect to be able to solve complex business problems overnight. I believe it is essential to put basic systems in place which once working can be enhanced or built upon to achieve long term goals. Storage and retrieval of organisational information. The way the Chart of Accounts is structured affects the way organisational transaction data is stored and retrieved. Information can only be appropriately retrieved if it is stored in such a manner that it can be found. An analogy is that of the office filing cabinet. If an employee responsible for filing merely opens the draw and throws files inside, the chances are that subsequent retrieval of required information may be difficult and time consuming. However, should the information be stored in a structured format such as in alphabetical order, the likelihood of easy and timeous retrieval would be much higher. Provides the basis for timeous management reports and financial statements. A good health check on your Chart of Accounts is to take a look at the state of your management reports and financial statements as well as the processes involved at arriving at these reports. If the process of arriving at management reports and financial statements is time consuming and requires significant reorganisation of information, then it is likely that the Chart of Accounts is poorly designed. Organisations often fall into the “spreadsheet factory” trap when it comes to reporting. This happens as a result of information fragmentation which essentially means that data is not stored in one central source where it can easily be accessed. This can be resolved by SAOUG 2003 Copyright © 2003 by Richard Byrom Page 3

ensuring that all organisational data resides in the General Ledger and that it is structured according to management requirements through efficient Chart of Accounts design. There are a multitude of systems in which management reports can be designed – Oracle Financial Analyzer (OFA), Financial Statement Generator (FSG) and third party systems. My experience is that these can only be effectively utilised if the General Ledger has all the appropriate information required and this can to a large extent be influenced by Chart of Accounts design. To ensure implementation success and continued use of the system. I personally believe that the Chart of Accounts design will have a significant impact on implementation success. An appropriate design will ensure that the implementation succeeds and that it stays successful in the long term. Some common mistakes Mistakes that you make during the implementation have a tendency to come back and burn you later. Since prevention is better than cure it’s a good idea to try and get things right the first time. I have highlighted these mistakes as we can always learn from them and I hope that in mentioning them you will be able to prevent yourselves from falling in to the same trap. Modify existing Chart of Accounts Perhaps one of the most common mistakes I come across when implementing new systems is the tendency for users to merely take the old Chart of Accounts, make a few modifications and then upload it into the new system. The reason why this is not an appropriate approach is that new systems now enable much greater analysis capability on business activities and this functionality should be utilised. Essentially, new Chart of Accounts structures give us a three-dimensional or “cubed” view of our data as opposed to a two dimensional view. ONLY the Finance Department designs and understands the chart of accounts. I have often found that there is a tendency during implementation for the Finance Department to be the only owners of the Chart of Accounts design and structure during its development. Either the finance department refuses to allow other departments to become involved in the Chart of Accounts design exercise or other departments do not see it as their role. In order to ensure an effective Chart of Accounts design I believe it is essential to get people out of working in “silo” mode so that they take a more cross functional view of the business. Implementation partner made responsible for designing Chart of Accounts. Quite often the Chart of Accounts design exercise is left up to the implementation partners. Either the implementation partners feel that they are the only ones experienced enough to configure the system or organisational users do not feel that they are up to the task because they lack the appropriate skills. This can certainly be avoided by ensuring that teams are built which have representation from all parties involved in the implementation. No consideration of impact of country, industry and organisational factors on reporting requirements and Chart of Accounts Structure. On many occasions I see organisations become some inwardly focused during design exercises that they do not take a look outside the business borders at what other people are doing. Enterprises should always take a look at what other implementers of the same or similar systems are doing at a global, country or industry level in order to ensure the organisation is aligning itself with trends at each of these levels. SAOUG 2003 Copyright © 2003 by Richard Byrom Page 4
Past, present and future views When designing a Chart of Accounts it is always useful to know where the organisation has come from and where it is going. This will ensure that organisational growth and diversification plans as well as any other factors pertaining to organisational change, can be taken into account when designing the structure of a Chart of Accounts. Inadequate summarisation of data in the General Ledger The General Ledger is essentially a repository of data that comes from all other sub modules such as Payables, Receivables, Fixed Assets and Payroll. In setting up the Chart of Accounts, one should always consider how these modules are going to be appropriately interfaced to General Ledger. It is quite important to ensure that the data sitting in the General Ledger pertaining to other sub ledgers is a summary of what is happening in these ledgers and does not merely replicate the same data. This will ensure that information is being stored efficiently and will allow optimal system performance. The eternal paradigm We seem to develop a mindset during implementation which blames the system for all our mistakes and problems. We need to bear in mind that the system is only operating in the way it was programmed to. The age-old adage of garbage in, garbage out is particularly true here. The only way to achieve real implementation success is to ensure that the elements of people, processes and technology are effectively combined. How to design an effective Chart of Accounts In determining the best way to design a chart of accounts I will take a top down approach. This means that we will begin by looking at generic or global issues that affect chart of accounts design. Secondly, issues relating to your country, industry and modular set-ups will be examined. Lastly we will examine Oracle Specific functionality that may be useful in the Chart of Accounts design process. My purpose in taking this approach is to emphasise my belief that the functionality provided by the system is the least important step in ensuring effective design. The most important factor is the process that one goes through and much of this happens outside of the system. I will also underscore the importance of ensuring that the organisation pursues a continuous improvement strategy. Generic Design Issues Begin with the end in mind. “To begin with the end in mind means to start with a clear understanding of your destination. It means you know where you are going so that you better understand where you are now and so that the steps you take are always in the right direction” – Stephen Covey. I believe this is the most important approach to take if you want to get your Chart of Accounts right. Persons designing the Chart of Accounts should gather management reports and financial statements and then work backwards to determine how the Chart of Accounts should be laid out. This will ensure that nothing is left out of the Chart of Accounts and will also simplify the production of management reports. If you are implementing a new system you should not work backwards from existing reports, but rather have designed new reports based on your expectations of what the system will produce and then work backwards from these. SAOUG 2003 Copyright © 2003 by Richard Byrom Page 5
It is also good to ask management what pain they are experiencing in their organisation relating to reporting and systems structures to get an indication of what specific areas could need your attention. If you manage to resolve these issues, your chances of obtaining executive and management buy will be significantly increased. My first experience of designing financial statements in an Enterprise Resource Planning (ERP) system provides a very good example of the importance of the beginning with the end in mind. At the client in question I was tasked with designing the financial statements and management reports. The organisation had already agreed on reporting layouts they wanted to produce. However, I found that my efforts to produce the financial statements in accordance with management’s requirements were hampered by the fact that the consultants responsible for implementing the system had implemented a Chart of Accounts which made it very difficult to arrive at the final result. This meant I had to do re-organise the Chart of Accounts so that it could provide me with the levels of analysis required for the finished product. The experience wasn’t particularly pleasant, however, it provided me with valuable insights in to what steps should be followed to ensure an appropriate design. Consider organisational growth and diversification plans –be proactive, not reactive. It is important to ensure that all parties involved in the Chart of Accounts design know what is happening when it comes to the organisational infrastructure. The design team should be aware of any changes that may occur or at the very least ask the necessary people whether there are any changes in the pipeline. I have worked in organisations where only after completing the Chart of Accounts and system design were we made aware of ongoing restructuring efforts within the organisation that had a significant impact on the Chart of Accounts design. Start with a basic structure and then enhance. ERP systems provide users with a vast array of options when it comes to setting up and using the system. Often organisations can get bogged down by trying to incorporate too much complexity in to the system design. I always try to emphasise the importance of putting the basis building blocks in place to ensure the system works and then going back later to make enhancements. There are several factors to consider when deciding on the level of complexity to be implemented for a particular system. One of the first questions organisations should ask is, “do we have ability to maintain this level of complexity once is has been put in place?” A client whose ERP system I once audited had designed a fantastic Chart of Accounts structure but had difficulty maintaining it as there were only two employees assigned to perform this task. Ensure that you work well with your implementation partner. A typical implementation would initially have a significant level of involvement of consultants or implementation partners at the outset, which should gradually decline as the implementation moves towards a go live situation. The organisation implementing would need to continually increase their levels of ownership from the beginning of the implementation to arrive at a situation where they have full ownership before moving over to a production environment. To be in a position where implementation partners decide the structure of the Chart of Accounts and are subsequently maintaining it is by no means ideal and could certainly lead to the collapse of the project. Use all the tools Oracle Provides you with to manage the process – ADI, Workflow, Tutor, Alert. Take a look at the CD pack that you get from Oracle when you install the software, you will find that there is an assortment of software available that you were more than likely not aware existed. Should you decide to use some of the software you will need to check out the licensing
SAOUG 2003 Copyright © 2003 by Richard Byrom Page 6
requirements for each particular programme. The software which I believe would be most useful in assisting with Chart of Accounts design is as follows: - Oracle Applications Desktop Integrator (ADI) – contains an account hierarchy editor which enables users to perform mass edits on the Chart of Accounts Structure. Oracle Tutor - useful tool for designing user manuals and training material that will assist users in their understanding of the Oracle system. Oracle Workflow – can be used to design process flows which will assist users in following a predefined set of steps when creating and modifying Chart of Accounts structures. Oracle Alert – can be used to monitor activity in the database for particular tables. This is useful in that it will alert users of amendments to particular tables, such as those that contain the Chart of Accounts structures and values. Develop a set of standards and conventions. It is important to ensure that your Chart of Accounts operates in accordance with a documented set of rules, standards and conventions. When travelling on the road you have to drive in accordance with the rules of the road – if you decide not to obey certain rules, like driving on the correct side of the road, this would more than likely result in an accident. The same is true of the Chart of Accounts design in that standards and conventions implemented by the organisation should help to prevent users from operating outside defined guidelines. This will tend to raise the standard and quality of the overall Chart of Accounts design as well as enhance the understanding of the Chart. What you also need to ensure is that for a global or multi national type rollouts you find out whether there are any standards or design conventions that need to be adhered to. Team work within the organisation. This is particularly important for Multi-Site or Multi-Org implementations where there is a rollout across the organisation or group. Management should take steps to ensure that all departments and lines of business (Finance, Operations and Human Resources) are involved. It seems like common sense but it is surprising how many times this does not happen. Hold workshops. This is what I consider to be one of the most important ways that an organisation can design an effective Chart of Accounts and it will assist in achieving many of the steps already mentioned. This exercise should be cross-functional nature in that it should involve members from all areas of the business. The specific purpose of the workshops should be to: - Ensure users understand the importance of an appropriate design infrastructure. Establish procedures for maintenance and update - Centralised or decentralised approach. Agree on standards and conventions. Ensure that a Chart of Accounts is designed that caters for all areas of the business.
At the end of this exercise the finalised Chart of Accounts should be signed by all the parties involved. My experiences have proved that this is one of the most effective ways to ensure accountability and ownership by all the participants in the design. Third party review. Ensure that you obtain an independent review of your Chart of Accounts setup as well as any other system configurations. No implementation is perfect and its always useful to get a different view since persons involved in the Chart of Accounts design exercise might have missed something. Often I have found that during implementations people develop certain mindsets. SAOUG 2003 Copyright © 2003 by Richard Byrom Page 7

These mindsets need to be altered or broken by bringing in parties that have a different view or perspective on a situation. Country, Industry, Organisation and Module Specific considerations In analysing these particular issues I have once more taken a top down approach. I will begin by determining the issues at country level and move down various levels until we are examining aspects that apply to analysis at modular level. Country. In designing a Chart of Accounts, implementers should always consider whether the country they are designing for has any specific statutory and legislative requirements that dictate how the Chart should be structured. Italy, for example, is one country that has various statutory requirements as to how your Chart of Accounts should be designed. Germany and Norway also require a distinct VAT segment in the Chart of Accounts. Industry Type The industry you are operating in should have a significant impact on the analysis or segment structure in the Chart of Accounts. A segment is essentially an area of analysis that you require on your business and each industry should have requirements that are unique to them. The example in Figure 3 below illustrates how different types of segments of analysis would be required for different types of industries. Manufacturing/Services:
XX XXX XXXX XXX XXX XXX Company Cost Centre Account Product Product Line Sub account
News Distribution:
XX XXXXXX XX XXX XXXX Division Account Region Story Distribution
Project Oriented:
XXX XXXXX XXX XXXX XX Company Account Department Project Project Type
Government:
XX XXX XXXXXXXXX XXXX XXXX XXXXXX XXXXXX
Fund Funding Source
Vote/Cost Centre
Project/Sub Project
Function of Government
Medium Term Expenditure Framework
Account
Figure 3: Examples of Segment of analysis by Industry
SAOUG 2003 Copyright © 2003 by Richard Byrom Page 8
As can be seen, each industry has segments which are unique to their own type of business. Examples are Product for Manufacturing, Region for a Distribution Company, Project Type for Projects and Funding Source for Government. However, the majority of segments will be similar
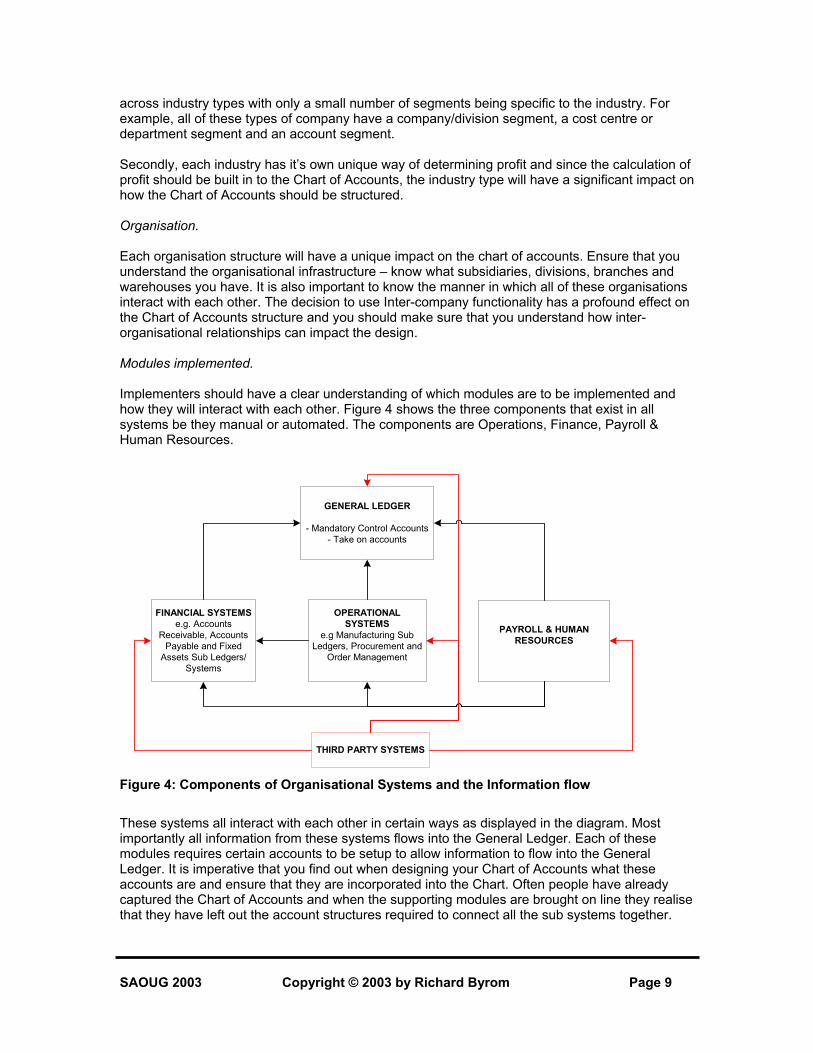
across industry types with only a small number of segments being specific to the industry. For example, all of these types of company have a company/division segment, a cost centre or department segment and an account segment. Secondly, each industry has it’s own unique way of determining profit and since the calculation of profit should be built in to the Chart of Accounts, the industry type will have a significant impact on how the Chart of Accounts should be structured. Organisation. Each organisation structure will have a unique impact on the chart of accounts. Ensure that you understand the organisational infrastructure – know what subsidiaries, divisions, branches and warehouses you have. It is also important to know the manner in which all of these organisations interact with each other. The decision to use Inter-company functionality has a profound effect on the Chart of Accounts structure and you should make sure that you understand how inter-organisational relationships can impact the design. Modules implemented. Implementers should have a clear understanding of which modules are to be implemented and how they will interact with each other. Figure 4 shows the three components that exist in all systems be they manual or automated. The components are Operations, Finance, Payroll & Human Resources.
OPERATIONALSYSTEMS
e.g Manufacturing SubLedgers, Procurement and
Order Management
GENERAL LEDGER
- Mandatory Control Accounts- Take on accounts
FINANCIAL SYSTEMSe.g. Accounts
Receivable, AccountsPayable and Fixed
Assets Sub Ledgers/Systems
PAYROLL & HUMANRESOURCES
THIRD PARTY SYSTEMS
Figure 4: Components of Organisational Systems and the Information flow These systems all interact with each other in certain ways as displayed in the diagram. Most importantly all information from these systems flows into the General Ledger. Each of these modules requires certain accounts to be setup to allow information to flow into the General Ledger. It is imperative that you find out when designing your Chart of Accounts what these accounts are and ensure that they are incorporated into the Chart. Often people have already captured the Chart of Accounts and when the supporting modules are brought on line they realise that they have left out the account structures required to connect all the sub systems together. SAOUG 2003 Copyright © 2003 by Richard Byrom Page 9
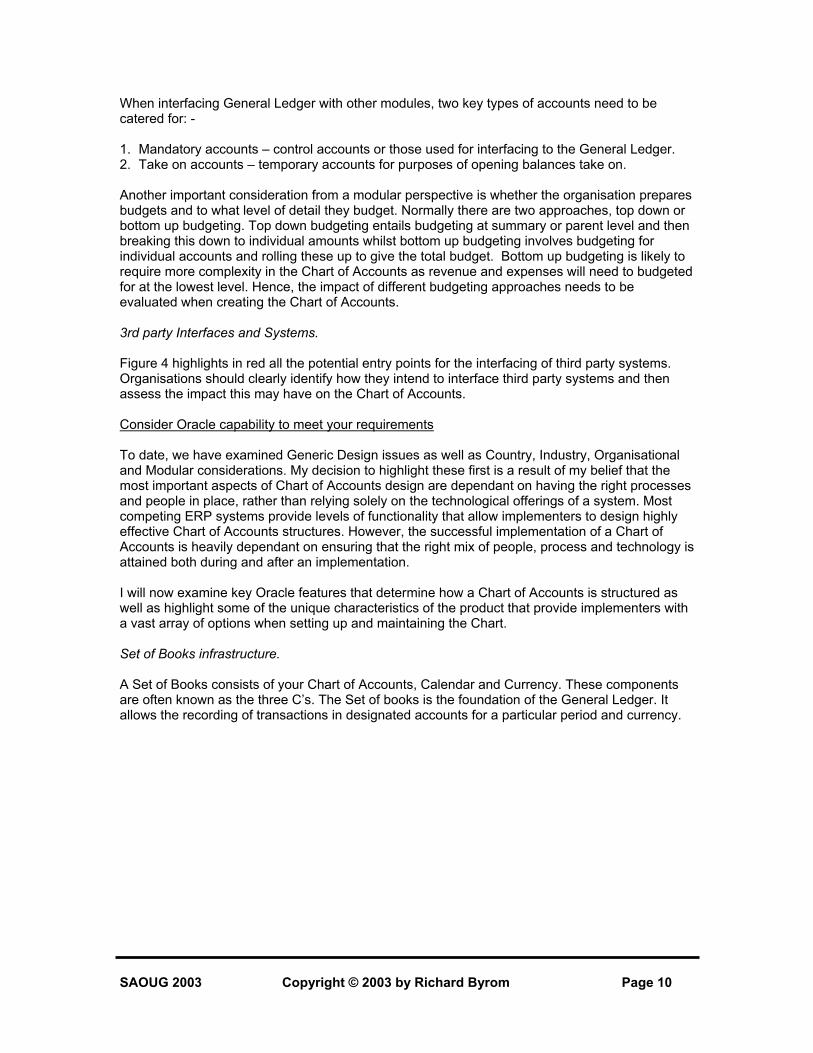
When interfacing General Ledger with other modules, two key types of accounts need to be catered for: - 1. Mandatory accounts – control accounts or those used for interfacing to the General Ledger. 2. Take on accounts – temporary accounts for purposes of opening balances take on. Another important consideration from a modular perspective is whether the organisation prepares budgets and to what level of detail they budget. Normally there are two approaches, top down or bottom up budgeting. Top down budgeting entails budgeting at summary or parent level and then breaking this down to individual amounts whilst bottom up budgeting involves budgeting for individual accounts and rolling these up to give the total budget. Bottom up budgeting is likely to require more complexity in the Chart of Accounts as revenue and expenses will need to budgeted for at the lowest level. Hence, the impact of different budgeting approaches needs to be evaluated when creating the Chart of Accounts. 3rd party Interfaces and Systems. Figure 4 highlights in red all the potential entry points for the interfacing of third party systems. Organisations should clearly identify how they intend to interface third party systems and then assess the impact this may have on the Chart of Accounts. Consider Oracle capability to meet your requirements To date, we have examined Generic Design issues as well as Country, Industry, Organisational and Modular considerations. My decision to highlight these first is a result of my belief that the most important aspects of Chart of Accounts design are dependant on having the right processes and people in place, rather than relying solely on the technological offerings of a system. Most competing ERP systems provide levels of functionality that allow implementers to design highly effective Chart of Accounts structures. However, the successful implementation of a Chart of Accounts is heavily dependant on ensuring that the right mix of people, process and technology is attained both during and after an implementation. I will now examine key Oracle features that determine how a Chart of Accounts is structured as well as highlight some of the unique characteristics of the product that provide implementers with a vast array of options when setting up and maintaining the Chart. Set of Books infrastructure. A Set of Books consists of your Chart of Accounts, Calendar and Currency. These components are often known as the three C’s. The Set of books is the foundation of the General Ledger. It allows the recording of transactions in designated accounts for a particular period and currency.
SAOUG 2003 Copyright © 2003 by Richard Byrom Page 10

Accounting calendar
Set ofSet ofbooksbooks
Chart of accounts structure
Functionalcurrency
Figure 5: The components of a Set of Books (the 3 C’s) Where a business is comprised of many different companies or divisions the organisation should seriously consider combining all the transactions in to one Set of Books. This decision will be based on whether the 3 C’s are the same for each of the companies involved. If they are, the company should combine all transactions in to one Set of Books which can be done by creating a segment for company or division that lists all the entities in the group. Whenever any one of the 3 C’s differs between companies or divisions, the organisation should ensure transactions are recorded in separate Sets of Books. In the case where your companies or divisions have different Chart of Accounts structures and are hence set up in different Sets of Books, the organisation should still make an effort to ensure that there is some commonality in the Chart of Accounts structures. This would be done in order to facilitate any potential consolidation. For example, even if different divisions have different values at item level for Sales and Expenses, they should still endeavour to ensure that summary or parents accounts such as Total Sales and Cost of Sales are similar between the entities. Segments Oracle E-Business Suite uses segments to provide organisations with analysis capability on different areas of the business. Examples of different types of segment structure can be seen in Figure 3. Although Oracle provides the capability to have as many as 25 different segments it is recommended that an organisation uses 5 to 7 segments with a spare segment for future growth. This will ensure that the Chart of Accounts structure is simplified and avoids unnecessary complexity. Each segment name and the order in which it appears should be defined in such a way that data capture is facilitated. Value Sets A value set basically defines the format of your segment. An example of this is the formats that you can apply to a number in an Excel spreadsheet that give you the capability to display the number either using thousands separators or with a varying number of decimal points. The three most important decisions I believe you are faced with when defining value sets are: - 1. Length Decide on what length you want each value set and ensure that they are not too long – you need to consider the cumulative effect of number of segments and the length of value sets. If, for example, you have decided to have 5 segments in your Chart of Accounts and each value set is 5 characters long, your total Chart of Accounts code will be 25 characters in length. The more
SAOUG 2003 Copyright © 2003 by Richard Byrom Page 11
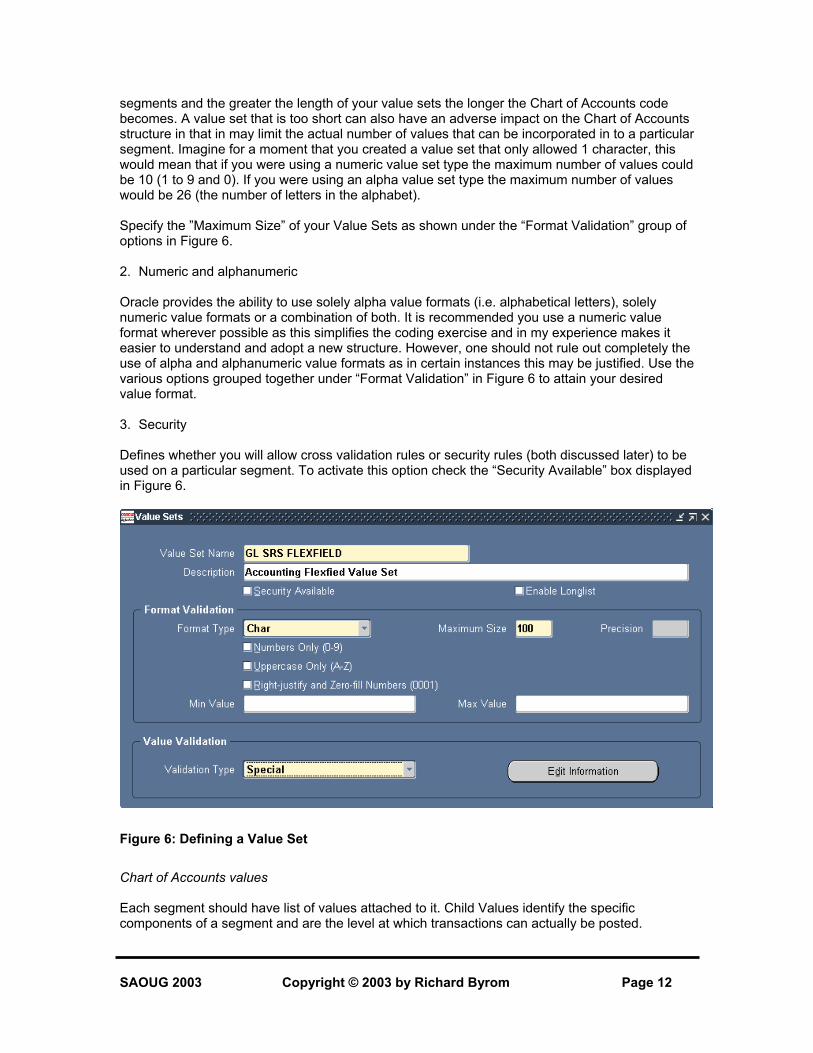
segments and the greater the length of your value sets the longer the Chart of Accounts code becomes. A value set that is too short can also have an adverse impact on the Chart of Accounts structure in that in may limit the actual number of values that can be incorporated in to a particular segment. Imagine for a moment that you created a value set that only allowed 1 character, this would mean that if you were using a numeric value set type the maximum number of values could be 10 (1 to 9 and 0). If you were using an alpha value set type the maximum number of values would be 26 (the number of letters in the alphabet). Specify the ”Maximum Size” of your Value Sets as shown under the “Format Validation” group of options in Figure 6. 2. Numeric and alphanumeric Oracle provides the ability to use solely alpha value formats (i.e. alphabetical letters), solely numeric value formats or a combination of both. It is recommended you use a numeric value format wherever possible as this simplifies the coding exercise and in my experience makes it easier to understand and adopt a new structure. However, one should not rule out completely the use of alpha and alphanumeric value formats as in certain instances this may be justified. Use the various options grouped together under “Format Validation” in Figure 6 to attain your desired value format. 3. Security Defines whether you will allow cross validation rules or security rules (both discussed later) to be used on a particular segment. To activate this option check the “Security Available” box displayed in Figure 6.
Figure 6: Defining a Value Set Chart of Accounts values Each segment should have list of values attached to it. Child Values identify the specific components of a segment and are the level at which transactions can actually be posted.
SAOUG 2003 Copyright © 2003 by Richard Byrom Page 12

Examples would be individual expense or revenue accounts. Parent Values define a hierarchy or summarisation of child values, examples might include Total Sales or Cost of Sales. Hierarchies within the Chart of Accounts values set can be built to include numerous levels of summarisation. However it is recommended to have a maximum of around 5 different levels of summarisation of data in order to reduce complexity and maintenance effort of the Chart. See Figure 9 for a hierarchical view of the Chart of Accounts.
Each value within a segment should be categorised where there is such a requirement. For example, in the account segment it is a requirement that each account be categorised as either an Asset, Liability, Revenue, Expense or Owners Equity Account. This should be done so that information flows correctly into your reporting system, be it Financial Statement Generator (FSG), Oracle Financial Analyzer (OFA) or another 3rd party system. Cross Validation Cross-validation rules let you control the combinations of accounts entered for particular segments. Two typical examples can be used to illustrate this concept: - 1. If you would like to ensure that for all income statement accounts a department is specified
whilst for balance sheet no department is specified, you would use a cross validation rule to enforce this and provide users with appropriate warning messages if they entered data outside the defined rules.
2. If you would like to ensure that for all revenue accounts a product code is captured in the product segment cross validation rules can once again be used to enforce this type of requirement.
The benefit of Cross Validation is that posting errors can be reduced and you can force users to provide levels of analysis that previously might not have been give but are now required. However, if the rules are too restrictive they can actually paralyse any efforts to capture data. I recommend that Cross Validation rules are only defined once users are familiar with the Chart of Accounts structure and are in a position to determine what types of errors have been made in the past and should be avoided in the future. Security rules. This allows you to restrict the amount of information a user can view for a particular segment. For example, should you have a requirement that a certain responsibility should not be able to view or query any information relating to Payroll Costs, you would create a Security Rule to meet this need. Not only do these types of rules prevent users from viewing certain information when they are capturing it, they also prevent users from performing any on line inquiry or preparing reports which include the restricted information. Aliases Aliases provide a way to speed up entry of frequently used value combinations. They do this by creating a friendly name for value combinations. If it is found that a particular account code combination is being used on a frequent basis when capturing data, then an alias can be created. I recommend that Aliases are only defined once users are familiar with the Chart of Accounts structure and are in a position to determine what types of value combinations are being used on a frequent basis. Examples of different types of Alias and account code combinations are displayed in Figure 7.
SAOUG 2003 Copyright © 2003 by Richard Byrom Page 13

Figure 7: Examples of different types of Alias Statistical Accounts This is rarely used feature but I believe it can be particularly helpful in organisations which have the requirement to report on statistical information in their financial statements or management accounts. This information can be manually captured or automatically interfaced into the General Ledger from third party or supporting systems. There are two ways in which statistical accounts can be managed in the Chart of Accounts structure: - 1. Dedicated Statistical Accounts. Create a separate range in the Chart of Accounts solely for statistical accounts. This may be useful in a situation where an account type can only be measured in statistical rather than monetary values. 2. Shared accounts which contain statistical and monetary information. You may want to look at assigning a statistical currency to accounts like sales which will enable the recording of monetary and physical values in the same account code. If you decide that you would like to record your sales statistics in a separate account to the one where the monetary values are maintained then Option 1 should be utilised. Constant Renewal “There will come a time when believe everything is finished. That will be the beginning”. - Louis L’amour – Best selling Author. In all the implementations of ERP systems I have performed it has become evident to me that the work is never really finished. I believe that organisations should create a culture of continuous improvement so that enhancements, new functionality and modules are progressively introduced.
SAOUG 2003 Copyright © 2003 by Richard Byrom Page 14
ERP systems have such depth in terms of their functionality that it is almost impossible to implement everything in one go. Businesses should adopt the approach of implementing the basis functionality and then focusing on continuously improving their use of the system. Many organisations do this by taking a phased approach whereby they clearly define a number of phases or cycles to go through and identify what components of the system will be implemented in each phase. The Chart of Accounts should also undergo constant renewal and improvement. Although certain designs are permanent the organisation should always be looking for areas in which improvements can be made. This applies particularly to large organisations where enhancements can always be made on cross validation, security rules and aliases. However, it is important to maintain balance and one should avoid a situation where modifications are being made so frequently that it makes it difficult for users to keep up with the changes. Chart of Accounts Maintenance Often no procedures are established for maintaining a Chart of accounts. In many implementations one of the weak points that I often encounter is that there is often no control over who changes what and how to go about it. A maintenance procedure should be agreed in your initial Chart of Accounts workshops. You can use workflow to automate the procedure which will ensure integration with Oracle Applications and other electronic utilities such as E-mail. Oracle Alert can also be used to inform users of any changes made at database level.
Identify RequiredChange
Obtain AuthorisationObtain Authorisation Significant?Significant?
Notify UsersNotify UsersDocumentChanges
DocumentChanges
Make changes on production system
Make changes on production system
Notify UsersNotify UsersTest Changes in test system
HighHigh LowLow
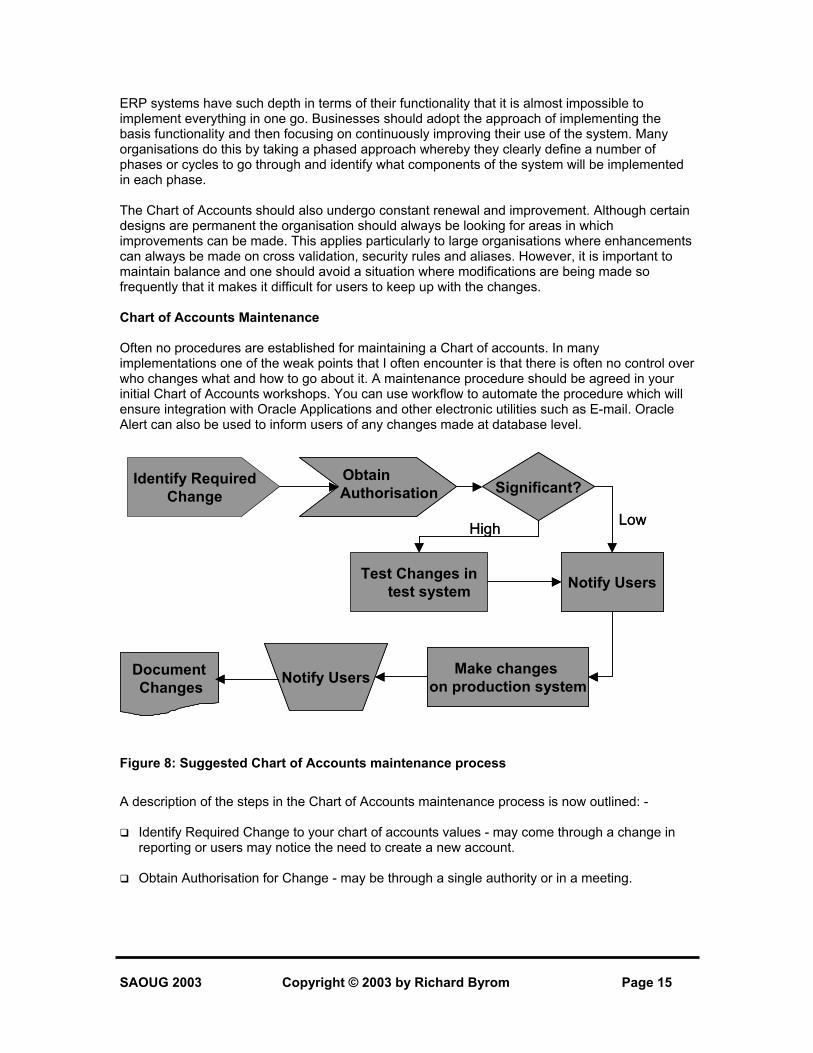
Figure 8: Suggested Chart of Accounts maintenance process A description of the steps in the Chart of Accounts maintenance process is now outlined: - Identify Required Change to your chart of accounts values - may come through a change in
reporting or users may notice the need to create a new account. Obtain Authorisation for Change - may be through a single authority or in a meeting.
SAOUG 2003 Copyright © 2003 by Richard Byrom Page 15

Determine the significance of the change – this is done in order to establish whether the change needs to be tested or whether it is so minor that it can simply be added in the production instance.
Notify Users – ensure that all parties that may be affected by the change are notified of it
before it is actually made so that any objections can be raised. Make the change – implement the change in the production instance.
Notify users – ensure that users are notified that the proposed change has been implemented
Update documentation – ensure that records of the Chart of Accounts details such as
supporting documents, spreadsheets and manuals are updated. Additional Tips Some useful tips and tricks I have which may help you with your implementation are as follows: - Develop a Spreadsheet template I always find it useful to utilise a spreadsheet template when performing the initial Chart of Accounts design work. This tends to help in ensuring that the Chart of Accounts follows predefined standards and conventions and also means that the Chart is in an electronic format. An example of such a template will be highlighted in the presentation and can also be found under the “Downloads” section of http://www.richardbyrom.com Use Data Loader for electronic upload Several utilities exist that will assist users with the upload of data into Oracle. The most useful product I have personally encountered is Data Loader which is available at http://www.comstar.co.uk. This tool is very valuable tool for functionally rather than technically orientated persons. One of the more useful features of this tool is that it allows the copying of data directly from spreadsheets in to the Data Load application itself. This underscores the need for the spreadsheet template I highlighted earlier. Speaking from an implementation consultant’s perspective it is important to mention at this stage that the client should always be made responsible for loading their data. Hence, the proposed master data to be input should be signed off and the exercise should be monitored by printing and signing off reports which display the input data results. Coding tips. There are a vast array of alternatives available related to coding and I will highlight briefly here some of the most important considerations. Utilise Ranges Ensure that you group accounts in to representative ranges. For example all Income Accounts can be grouped in the 10000 – 19999 account range, whilst all expense accounts can be grouped in the 20000 – 29999 range. Normally I create a large range for each of the five account groupings – namely Revenue, Expenses, Assets, Liabilities and Owners Equity.
SAOUG 2003 Copyright © 2003 by Richard Byrom Page 16

Make sure you provide for growth and change Leave appropriate spacing between individual Chart of Accounts values and ranges of values so as to ensure you provide for growth and change. If in the initial design you can foresee a space shortage, increase the number of characters used to define the segment value. Create meaningful patterns within the coding structure. Create patterns that are unique to your country, industry and organisation and most of all ensure that these patterns are documented and understood by all users. Use the Oracle ADI Account Hierarchy editor for mass edits and Big Picture View Use the account hierarchy editor within Oracle ADI to provide you with a hierarchical view of your Chart of Accounts and also to perform mass edits using drag and drop capability. The key features of the hierarchy editor are as follows: - 1. Allows you to graphically create, maintain, and review account structure hierarchies. 2. Enables you to define new parent and child segment values, as well as change parent/child
dependencies. 3. Allows creation of new rollup groups and have your changes reflected automatically in both
the Key Segment Values and Rollup Groups windows.
Figure 9: The Account Hierarchy Editor
SAOUG 2003 Copyright © 2003 by Richard Byrom Page 17
As fancy and useful as this tool is, I strongly recommend that access to it only be give to super users and that the flexfield structure within Oracle Applications itself is frozen. My reasoning for
this is simply that the account hierarchy editor allows you to make mass changes to your Chart of Accounts Structure and hence could be potentially damaging if not properly controlled. Use auditing tools to establish whether your setup is correct A useful tool I have encountered which can perform checks on your set up for each and every module is the CRM analysis toolkit. Although the tool name suggests it is for Customer Relationships Management it runs checks on several modules including each of the Financials modules. The setup and use of this tool is documented in note 167000.1 on Metalink and the results it generates will be demonstrated in the presentation. As an example, the following types of checks can be run on the General Ledger module: Verification of Setup of Set of Books, Chart of Accounts, Flexfield Structure, Calendar and Currency. Errors encountered are clearly highlighted in red text and references to documents on Metalink that can assist in correction of errors are displayed. The address for the log in to the CRM analysis tool is http://<hostname>:<port number>/OA_HTML/jtfqalgn.htm A sample screen dump of the CRM analysis tool results for General Ledger can be found under the “Downloads” section on http://www.richardbyrom.com Conclusion The Chart of Accounts provides the foundation for an effective and robust system architecture and implementation success is highly dependant on creating a Chart that appropriately serves the needs of the organisation. A successfully designed Chart of Accounts entails obtaining a mix of people, process and technology that ensures the organisation is empowered by the dissemination of useful and relevant information. Oracle E-business suite certainly has all the technology in place to provide management with a functional design that supports their business needs. However, having a clear picture of organisational information and reporting requirements is half the battle and a victory in this area should be followed up by effective implementation that uses appropriate Oracle Technologies. About the Author Richard Byrom is an Oracle Applications Consultant with RPC Data, an Oracle Certified Advantage Partner located in Botswana. He has spent the last 8 years consulting with various professional firms within the Southern Africa Region. He has also presented papers at numerous national and international conferences and contributes to leading journals around the globe. Richard can be contacted at [email protected] or you can visit his web site at http://www.richardbyrom.com
SAOUG 2003 Copyright © 2003 by Richard Byrom Page 18