Designing a Graphic Configuration of University ...
6
Designing a Graphic Configuration of University Cartography to Enhance Wayfinding Performance on Campus Ratanachote Thienmongkol Department of New Media, Mahasarakham University, Maha Sarakham, Thailand. Email: [email protected] Abstract—In public spaces, an appropriate wayfinding design and implementation can enable people to reach their destination correctly and safely. This article aims to design a wayfinding map of Mahasarakham University (Khamriang campus). In the first stage, a qualitative method was applied to inquire a key finding before being summarized as a concept of design agreement. This agreement was employed to guide the development of a prototype map. Meanwhile, a quantitative method was applied to test the prototype in order to evaluate the wayfinding behavior and map-reading skills of the sampling groups. They include two majors: an internal and external group (total 60 participants). The key findings from the evaluative process showed that the walking speeds from the starting point to the destination (distance: 300 m) between the internal and external groups averaged at 2.96 minutes and 6.84 minutes. Another key finding indicated that the average score under map- reading skills from all the participants remained at ( ) 4.41 points from 5 points. In the meantime, the result for the design satisfaction from the survey averaged at ( ) 4.40 points from 5 points. Index terms—Wayfinding behavior, readability, graphic design, cartography, communication design. I. BACKROUND OF THE STUDY Mahasarakham University (MSU) is the setting for this case study. MSU is one of the public universities in Thailand. It also has two campuses referred to as; “City Campus” and “Khamriang Campus.” Presently Khamriang campus is the center of MSU headquarters, which contains 18 faculties, two colleges, five institutions, two banks, and 15 head-offices of the Thai government. The area of the campus is 516 acres with 1,210 lecturers, 2,198 staff, and 45,681 students. However, MSU has one of the highest student populations in in Thailand. To serve this large population of students, faculty, and staff, MSU carries out an abundance of educational activities and services within the campus. In the main part of campus, MSU has more than 40 buildings and a main traffic system, which separates the campus into four sections. With the complex structure in the campus it is understandable that many people can become confused when navigating from point A to B. Conversely, from our observations, we found the campus Manuscript received November 1, 2017; revised January 16, 2018. is lacking enough signage and wayfinding to guide people. Wayfinding boards were installed in the campus in only 4 points. Moreover, the two of them were hidden behind a tree. This situation shows that the number of wayfinding boards is not sufficent enough to guide people who are unfamiliar with the campus. In addition, the design of the wayfinding boards lack the empowerment to make the reader build-up a mental map of the campus layout. This is because the materials on the boards have a poor quality lettering, which is hard for people to read. Passini described the lack of wayfinding system within a new environment can make people lose their skills in part of 1) cognitive map, 2) decision making, and 3) decision execution [1]. On the other hand, without a wayfinding system, a visitor may not feel welcome on the campus. The above reasons lead to the aim of this research to develop a graphical wayfinding system to assist internal/external people who visit the campus. We hope that this project will make it more convenient for people to find their way around the University. The key objectives are the following: 1) study the key human factor that affects the design contribution of the MSU wayfinding map, 2) analysis of the wayfinding behavior, and map-reading skills from representatives after using the prototype map, and 3) evaluation of the usability of prototype map in terms of graphical legibility, design suitability, and design satisfaction II. SIGNIFICANCE OF WAYFINDING A study of wayfinding in public areas is a significant issue for people. This is because the areas that provide multiple services could make the user become lost and confused with complex layouts such as shopping malls, hospitals, airports, and universities. Carpman and Myron described a complex layout where the users deal with a lot of buildings, intersections, and routes and may incur problems during their journey [2]. This problem is confirmed by the research of Bitgood [3]. He found most complex areas and buildings will make a confusing situation for users to identify their destination. It can also make a serious problem in more ways. For example, when people are not able to easily navigate in an area, they will have disoriented feelings at times and an Journal of Communications Vol. 13, No. 1, January 2018 15 ©2018 Journal of Communications doi:10.12720/jcm.13.1.15-20
Transcript of Designing a Graphic Configuration of University ...
Designing a Graphic Configuration of University
Cartography to Enhance Wayfinding
Performance on Campus
Ratanachote Thienmongkol Department of New Media, Mahasarakham University, Maha Sarakham, Thailand.
Email: [email protected]
Abstract—In public spaces, an appropriate wayfinding design
and implementation can enable people to reach their destination
correctly and safely. This article aims to design a wayfinding
map of Mahasarakham University (Khamriang campus). In the
first stage, a qualitative method was applied to inquire a key
finding before being summarized as a concept of design
agreement. This agreement was employed to guide the
development of a prototype map. Meanwhile, a quantitative
method was applied to test the prototype in order to evaluate the
wayfinding behavior and map-reading skills of the sampling
groups. They include two majors: an internal and external group
(total 60 participants). The key findings from the evaluative
process showed that the walking speeds from the starting point
to the destination (distance: 300 m) between the internal and
external groups averaged at 2.96 minutes and 6.84 minutes.
Another key finding indicated that the average score under map-
reading skills from all the participants remained at ( ) 4.41
points from 5 points. In the meantime, the result for the design
satisfaction from the survey averaged at ( ) 4.40 points from 5
points.
Index terms—Wayfinding behavior, readability, graphic design,
cartography, communication design.
I. BACKROUND OF THE STUDY
Mahasarakham University (MSU) is the setting for this
case study. MSU is one of the public universities in
Thailand. It also has two campuses referred to as; “City
Campus” and “Khamriang Campus.” Presently
Khamriang campus is the center of MSU headquarters,
which contains 18 faculties, two colleges, five institutions,
two banks, and 15 head-offices of the Thai government.
The area of the campus is 516 acres with 1,210 lecturers,
2,198 staff, and 45,681 students. However, MSU has one
of the highest student populations in in Thailand. To
serve this large population of students, faculty, and staff,
MSU carries out an abundance of educational activities
and services within the campus.
In the main part of campus, MSU has more than 40
buildings and a main traffic system, which separates the
campus into four sections. With the complex structure in
the campus it is understandable that many people can
become confused when navigating from point A to B.
Conversely, from our observations, we found the campus
Manuscript received November 1, 2017; revised January 16, 2018.
is lacking enough signage and wayfinding to guide
people. Wayfinding boards were installed in the campus
in only 4 points. Moreover, the two of them were hidden
behind a tree.
This situation shows that the number of wayfinding
boards is not sufficent enough to guide people who are
unfamiliar with the campus. In addition, the design of the
wayfinding boards lack the empowerment to make the
reader build-up a mental map of the campus layout. This
is because the materials on the boards have a poor quality
lettering, which is hard for people to read. Passini
described the lack of wayfinding system within a new
environment can make people lose their skills in part of 1)
cognitive map, 2) decision making, and 3) decision
execution [1]. On the other hand, without a wayfinding
system, a visitor may not feel welcome on the campus.
The above reasons lead to the aim of this research to
develop a graphical wayfinding system to assist
internal/external people who visit the campus. We hope
that this project will make it more convenient for people
to find their way around the University. The key
objectives are the following: 1) study the key human
factor that affects the design contribution of the MSU
wayfinding map, 2) analysis of the wayfinding behavior,
and map-reading skills from representatives after using
the prototype map, and 3) evaluation of the usability of
prototype map in terms of graphical legibility, design
suitability, and design satisfaction
II. SIGNIFICANCE OF WAYFINDING
A study of wayfinding in public areas is a significant
issue for people. This is because the areas that provide
multiple services could make the user become lost and
confused with complex layouts such as shopping malls,
hospitals, airports, and universities. Carpman and Myron
described a complex layout where the users deal with a
lot of buildings, intersections, and routes and may incur
problems during their journey [2]. This problem is
confirmed by the research of Bitgood [3]. He found most
complex areas and buildings will make a confusing
situation for users to identify their destination. It can also
make a serious problem in more ways. For example,
when people are not able to easily navigate in an area,
they will have disoriented feelings at times and an
Journal of Communications Vol. 13, No. 1, January 2018
15©2018 Journal of Communications
doi:10.12720/jcm.13.1.15-20
uncomfortable and unsettling experience of being
unfamiliar with their surroundings [4]. When people lose
their way, they are likely to miss their appointment or
waste their time. In an extreme case, people may perish if
they cannot find their way to a hospital in an emergency
situation [5].
There are some proven ways to alleviate this situation.
Cartography and signage are the graphical materials in a
wayfinding system, which has the role as the medium
instrument to bridge the gap between people and place.
The definition of wayfinding is defined from several
perpectives. Peponis et.al. described wayfinding as the
decision making process of human behavior when they
want to move themselves from one place to another [6].
Meanwhile, Passini defined the elements of decision
making in a wayfinding processes as cognitive mapping,
decision making and decision execution [7]. Therefore, it
can be justified that the wayfinding process includes
internal behavior (cognition, mental picture and decision
making) and external behavior (manner and performance).
Nevertheless, the evaluation on internal behavior is
difficult because it is an intangible observation.
Conversely, the consideration of external behavior is
uncomplicated. Therefore, the success of wayfinding in
this paper is when the finder can locate themselves and
realize how to get to their destination along with a
recognitive way to return back to their initial point.
Darken and Peterson explained that the navigation
system is a primary task, which is essential to guide
people to meet their objectives in any complex
environment with very large spaces [4]. With respect to
usability, the wayfinding concept focuses on the
cognitive element of navigation. Its sole focus is the
strategic and tactical sections that guide movement [4].
The “cognitive map” is an essential part of wayfinding
that focuses on use and develops a guideline conceptual
framework, also referred to as a mental map [8].
Moreover, it includes the development of knowledge on
the cognition and comprehension of users based on their
visual literacy of the interpretative information that is
presented in a pattern of symbolic and graphical
representations [9]-[11].
As part of his wayfinding measurements, O’Neill
demonstrated a new model for investigating the target
wayfinding behavior with an emphasis on the external
behavior, which consists of (1) finding the walking speed,
(2) discontinuity, (3) walking with turning errors, and (4)
walking with returning [12]. However, the walking speed
was tested from the same walking distance per person and
divided with all the walking speeds, in order to find the
average time of the wayfinding per person. While, the
diccontinuity was evaluated from the number of stops
during walking when a representative hesitates on their
journey and looks at the wayfinding board. The walking
with turning error and returning are measured from the
number of walking mistakes by the representative.
O’Neill employed 5 levels of the likert scale to define the
number of mistakes followed by the number 1
representing one mistake and the number 5 representing
five mistakes. However, this measurable method was
applied to evaluate a wayfinding behavior of the
sampling. The next section will justify the representative
groups, key principles and variables used to create a
successful wayfinding system.
III. PARTICIPANTS
The research participants in this project were divided
into two main groups: The first group consists of internal
people, which was collected using an accidental sampling
technique.
First year student in the campus (30 respondents)
Meanwhile, the second group are external people
(visitor) who come to visit the campus. Accidental
sampling was employed to conduct this stage.
Visitors (30 respondents, i.e., parents, relatives and
guests)
IV. METHODOLOGY
A mixed method was applied to design the methods
used for the data collection and data analysis strategies.
Both qualitative (inductive) and quantitative (deductive)
concepts were employed to investigate the key factors
from the documentaries and participants (stakeholders).
The strategies of data collection and analysis were
defined as two major stages;
A. Stage 1: Pre-production
Data collection–In this stage, we applied a qualitative
approach to review a documentary and theoretical studies
were collected. It also included observation on the field at
Khamriang campus. The theme of this observation was to
look at the natural wayfinding behavior, the road system
on campus and the campus buildings and environment.
Data analysis–We used content analysis to classify the
type of key information, themes, terminologies, principles,
and literature we read. A typological analysis was applied
to identify a group of keywords, ideas, information, and
themes from the interview processes. The key interview
data were arranged and set as a group of finding domains.
Finally, a triangulation of sources was applied to
triangulate the findings from the content and typological
analysis in order to create credibility and internal validity
before summarizing into the key findings. These findings
were defined as a key concept of the design agreement
such geographic design, building style, color, landmark,
and symbol on a prototype map.
B. Stage 2: Post-production
Data collection–This stage was performed after
finishing the design protocol of the MSU wayfinding
prototype. An evaluative survey was applied as the
instrument to rate the design satisfaction, assessment of
wayfinding behavior and map-reading skills from a
visitor who are the respondents on campus (a total of 60
people). The likert scales were used as the answer items
Journal of Communications Vol. 13, No. 1, January 2018
16©2018 Journal of Communications

by starting from 1 (= strongly disagree) to 5 (= strongly
agree) [13].
Data analysis–A frequency and descriptive analysis
was applied to indicate the empirical results, which
include the mean score ( ), percentage (%), the value of
number (N), and the standard of deviation (SD). However,
key feedback from the survey was summarized in order to
adjust the design protocol into the complete version.
V. FINGDINGS AND DESIGN OUTCOMES
The key findings from the field work were divided into
two stages. The first stage describes the key findings
from the observation site and documentary studies.
Meanwhile, the second stage presents the evaluative
results from the respondents. The design outputs will also
display and augment in both stages.
A. Key findings–Stage 1
Finding A–From the observations it was found that the
wayfinding behavior on campus had to be separated into
two major groups. The first group contains internal
people. In the field, the first year students were not
familiar with the campus buildings and environment.
Meanwhile, lecturers, and staff have more familiarity
with the campus because some of them live on campus or
have been working on campus for a long time. In this
case, the first year students are the main target who came
to assess the prototype map. The second group contains
external people who come to visit the campus
infrequently. For example, a parent, a relative or guest.
Finding B–From our observations we found a lack of
wayfinding is an obstacle for new students and visitors to
find their desired destination. In fact, the wayfinding
boards are not efficient to provide clear information and
direction. This is because, the detail on the boards only
show a text and arrow to give directions without any map
images.
Finding C–The traffic system found on campus has
three one-way roads and 12 intersections, while the
wayfinding boards were installed at only 4 points on
campus.
B. Design outputs–Stage 1
A design prototype was developed using three major
processes. The first stage conducted a pre-production by
studying the geographic information system (see Fig. 4).
The detailed map layers were categorized into 10 data
sets, which consists of 1) The geographic information
system (GIS) view, 2) mapping-areas, 3) sub-areas, 4)
water resource, 5) roads system, 6) car parks, 7) buildings,
8) service information, 9) map legends, and 10) building
and place services. Next, all buildings and environments
were drafted in the design software. All the categories of
the data sets were combined into the prototype map (See
Fig. 1).
Fig. 1. Designing the GIS data sets and graphical layers.
C. Key findings–Stage 2
Finding D–The demographic of the respondents who
came to assess the design prototype showed that the
internal group consists of first year students (30 people;
15 male and 15 female). Meanwhile, the external group
consists of 20 parents and 10 relatives and friends. The
total number was 60 respondents. The age of the
respondents illustrates that the large group was 15–19
years old (50%) and the second largest group was 41–50
years old (25%).
TABLE I. THE STATISTIC RESULTS FOR THE WALKING SPEED.
Topic of wayfinding
behavior
N Walking speed
(Minutes/seconds)
Internal group
1. Male students (aged 15–
19)
15 2.80
2. Female students (aged
15–19)
15 3.12
Total 30 2.96
External group (aged 20–25)
1. Male 3 3.93
2. Female 4 4.47
Total 7 4.20
External group (aged 26–
30)
1. Male 2 4.65
2. Female 1 4.90
Total 3 4.77
External group (aged 41–50)
1. Male 10 6.69
2. Female 5 8.04
Total 15 7.36
External group (aged up to 61)
1. Male 3 10.43
2. Female 2 11.65
Total 5 11.04
Total 60 6.06
Journal of Communications Vol. 13, No. 1, January 2018
17©2018 Journal of Communications
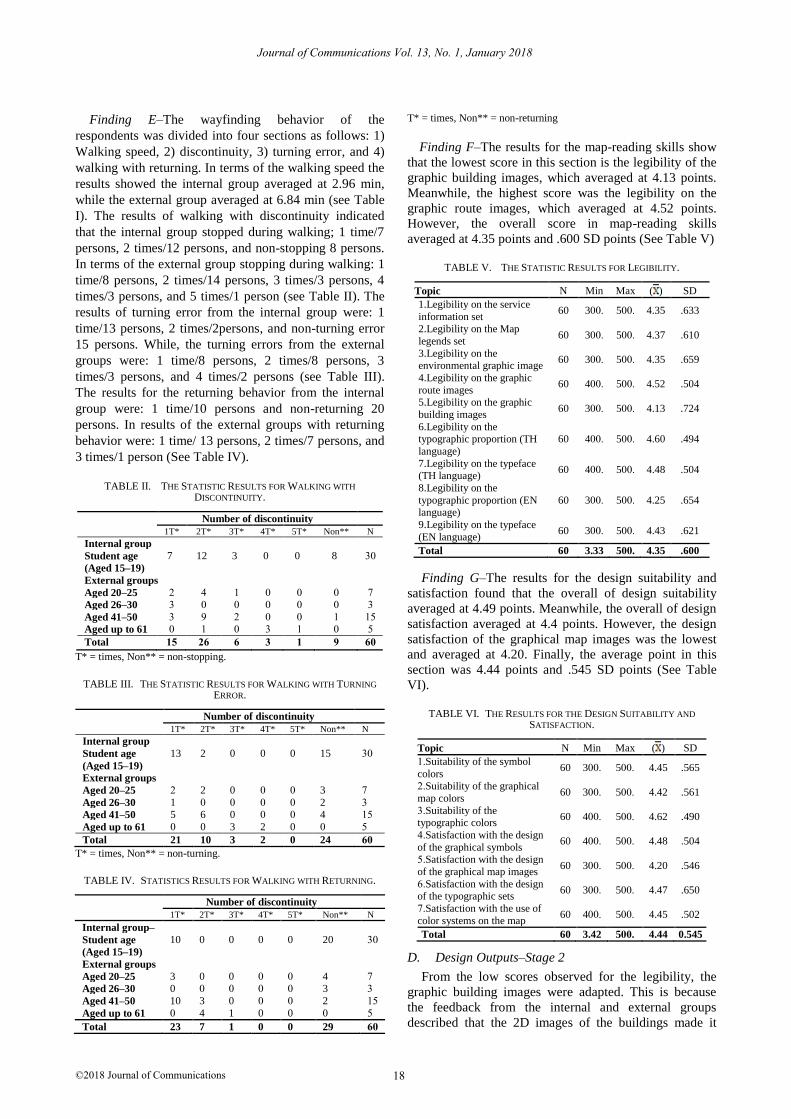
Finding E–The wayfinding behavior of the
respondents was divided into four sections as follows: 1)
Walking speed, 2) discontinuity, 3) turning error, and 4)
walking with returning. In terms of the walking speed the
results showed the internal group averaged at 2.96 min,
while the external group averaged at 6.84 min (see Table
I). The results of walking with discontinuity indicated
that the internal group stopped during walking; 1 time/7
persons, 2 times/12 persons, and non-stopping 8 persons.
In terms of the external group stopping during walking: 1
time/8 persons, 2 times/14 persons, 3 times/3 persons, 4
times/3 persons, and 5 times/1 person (see Table II). The
results of turning error from the internal group were: 1
time/13 persons, 2 times/2persons, and non-turning error
15 persons. While, the turning errors from the external
groups were: 1 time/8 persons, 2 times/8 persons, 3
times/3 persons, and 4 times/2 persons (see Table III).
The results for the returning behavior from the internal
group were: 1 time/10 persons and non-returning 20
persons. In results of the external groups with returning
behavior were: 1 time/ 13 persons, 2 times/7 persons, and
3 times/1 person (See Table IV).
TABLE II. THE STATISTIC RESULTS FOR WALKING WITH
DISCONTINUITY.
Number of discontinuity
1T* 2T* 3T* 4T* 5T* Non** N
Internal group
Student age
(Aged 15–19)
7 12 3 0 0 8 30
External groups
Aged 20–25 2 4 1 0 0 0 7
Aged 26–30 3 0 0 0 0 0 3
Aged 41–50 3 9 2 0 0 1 15
Aged up to 61 0 1 0 3 1 0 5
Total 15 26 6 3 1 9 60
T* = times, Non** = non-stopping.
TABLE III. THE STATISTIC RESULTS FOR WALKING WITH TURNING
ERROR.
Number of discontinuity
1T* 2T* 3T* 4T* 5T* Non** N
Internal group
Student age
(Aged 15–19)
13 2 0 0 0 15 30
External groups
Aged 20–25 2 2 0 0 0 3 7
Aged 26–30 1 0 0 0 0 2 3
Aged 41–50 5 6 0 0 0 4 15
Aged up to 61 0 0 3 2 0 0 5
Total 21 10 3 2 0 24 60
T* = times, Non** = non-turning.
TABLE IV. STATISTICS RESULTS FOR WALKING WITH RETURNING.
Number of discontinuity
1T* 2T* 3T* 4T* 5T* Non** N
Internal group–
Student age
(Aged 15–19)
10 0 0 0 0 20 30
External groups
Aged 20–25 3 0 0 0 0 4 7
Aged 26–30 0 0 0 0 0 3 3
Aged 41–50 10 3 0 0 0 2 15
Aged up to 61 0 4 1 0 0 0 5
Total 23 7 1 0 0 29 60
T* = times, Non** = non-returning
Finding F–The results for the map-reading skills show
that the lowest score in this section is the legibility of the
graphic building images, which averaged at 4.13 points.
Meanwhile, the highest score was the legibility on the
graphic route images, which averaged at 4.52 points.
However, the overall score in map-reading skills
averaged at 4.35 points and .600 SD points (See Table V)
TABLE V. THE STATISTIC RESULTS FOR LEGIBILITY.
Topic N Min Max ( ) SD
1.Legibility on the service
information set 60 3 .00 5 .00 4.35 .633
2.Legibility on the Map
legends set 60 3 .00 5 .00 4.37 .610
3.Legibility on the environmental graphic image
60 3 .00 5 .00 4.35 .659
4.Legibility on the graphic
route images 60 4 .00 5 .00 4.52 .504
5.Legibility on the graphic
building images 60 3 .00 5 .00 4.13 .724
6.Legibility on the typographic proportion (TH
language)
60 4 .00 5 .00 4.60 .494
7.Legibility on the typeface (TH language)
60 4 .00 5 .00 4.48 .504
8.Legibility on the
typographic proportion (EN language)
60 3 .00 5 .00 4.25 .654
9.Legibility on the typeface
(EN language) 60 3 .00 5 .00 4.43 .621
Total 60 3.33 5 .00 4.35 .600
Finding G–The results for the design suitability and
satisfaction found that the overall of design suitability
averaged at 4.49 points. Meanwhile, the overall of design
satisfaction averaged at 4.4 points. However, the design
satisfaction of the graphical map images was the lowest
and averaged at 4.20. Finally, the average point in this
section was 4.44 points and .545 SD points (See Table
VI).
TABLE VI. THE RESULTS FOR THE DESIGN SUITABILITY AND
SATISFACTION.
Topic N Min Max ( ) SD
1.Suitability of the symbol
colors 60 3 .00 5 .00 4.45 .565
2.Suitability of the graphical
map colors 60 3 .00 5 .00 4.42 .561
3.Suitability of the typographic colors
60 4 .00 5 .00 4.62 .490
4.Satisfaction with the design
of the graphical symbols 60 4 .00 5 .00 4.48 .504
5.Satisfaction with the design
of the graphical map images 60 3 .00 5 .00 4.20 .546
6.Satisfaction with the design of the typographic sets
60 3 .00 5 .00 4.47 .650
7.Satisfaction with the use of
color systems on the map 60 4 .00 5 .00 4.45 .502
Total 60 3.42 5 .00 4.44 0.545
D. Design Outputs–Stage 2
From the low scores observed for the legibility, the
graphic building images were adapted. This is because
the feedback from the internal and external groups
described that the 2D images of the buildings made it
Journal of Communications Vol. 13, No. 1, January 2018
18©2018 Journal of Communications
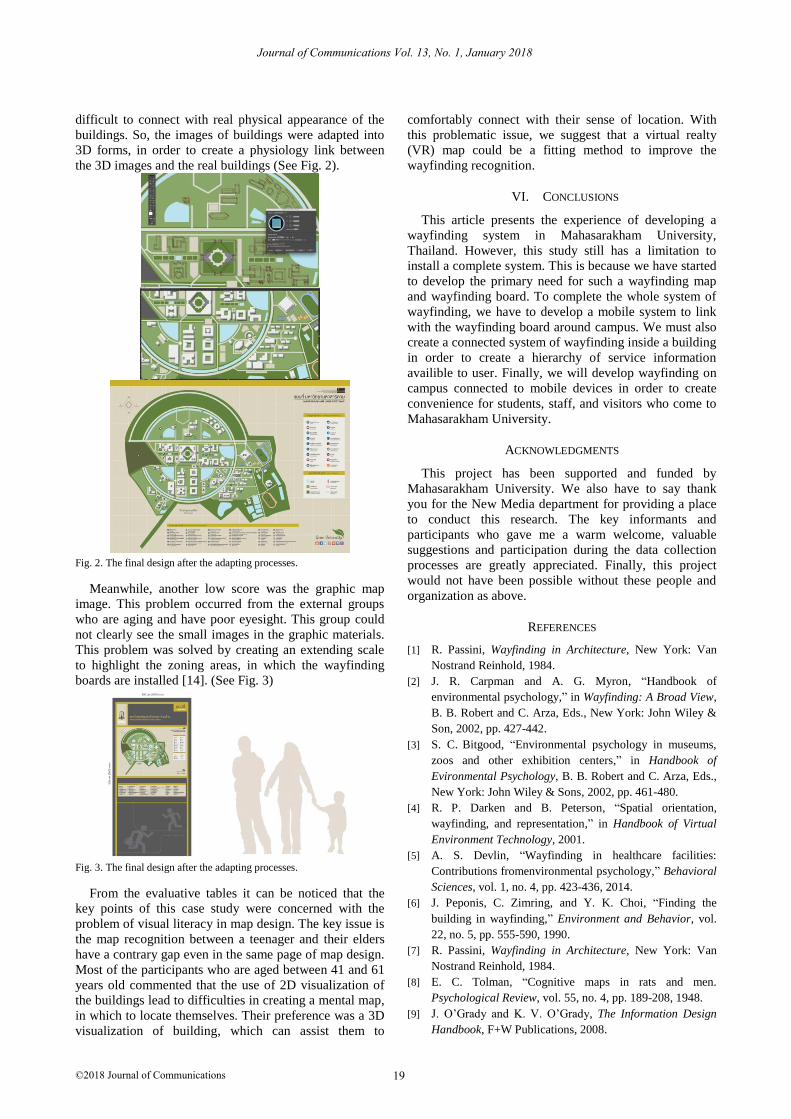
difficult to connect with real physical appearance of the
buildings. So, the images of buildings were adapted into
3D forms, in order to create a physiology link between
the 3D images and the real buildings (See Fig. 2).
Fig. 2. The final design after the adapting processes.
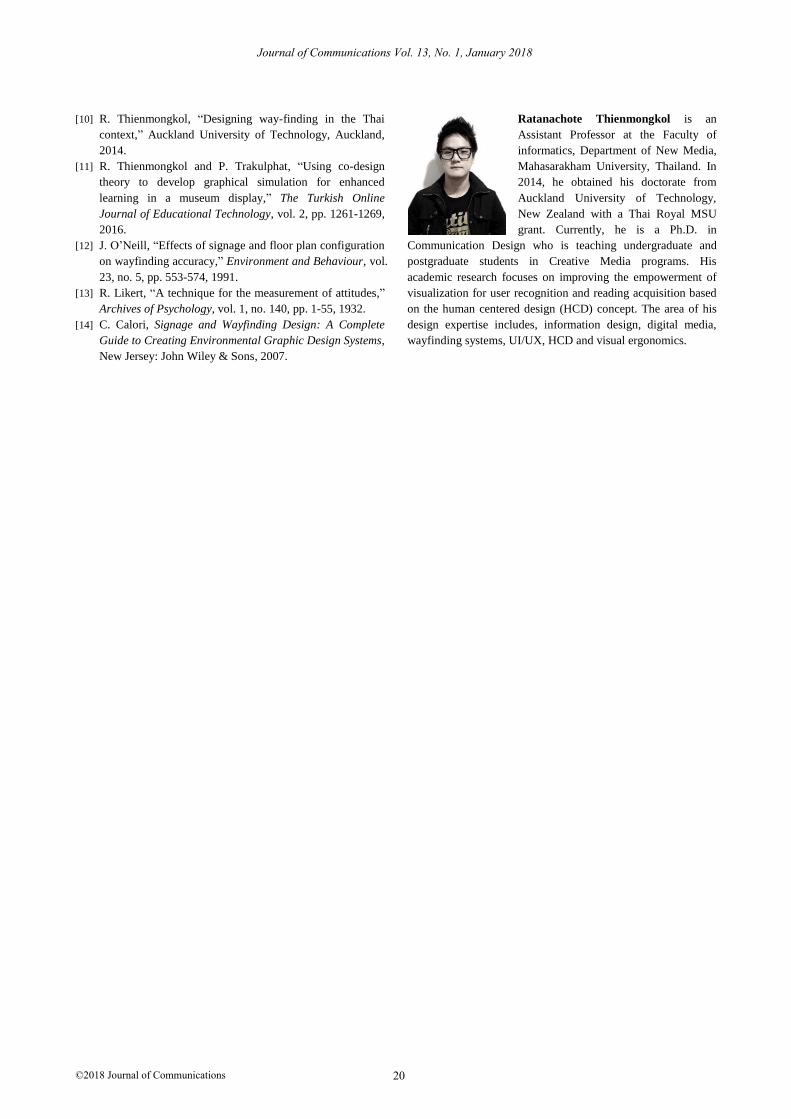
Meanwhile, another low score was the graphic map
image. This problem occurred from the external groups
who are aging and have poor eyesight. This group could
not clearly see the small images in the graphic materials.
This problem was solved by creating an extending scale
to highlight the zoning areas, in which the wayfinding
boards are installed [14]. (See Fig. 3)
Fig. 3. The final design after the adapting processes.
From the evaluative tables it can be noticed that the
key points of this case study were concerned with the
problem of visual literacy in map design. The key issue is
the map recognition between a teenager and their elders
have a contrary gap even in the same page of map design.
Most of the participants who are aged between 41 and 61
years old commented that the use of 2D visualization of
the buildings lead to difficulties in creating a mental map,
in which to locate themselves. Their preference was a 3D
visualization of building, which can assist them to
comfortably connect with their sense of location. With
this problematic issue, we suggest that a virtual realty
(VR) map could be a fitting method to improve the
wayfinding recognition.
VI. CONCLUSIONS
This article presents the experience of developing a
wayfinding system in Mahasarakham University,
Thailand. However, this study still has a limitation to
install a complete system. This is because we have started
to develop the primary need for such a wayfinding map
and wayfinding board. To complete the whole system of
wayfinding, we have to develop a mobile system to link
with the wayfinding board around campus. We must also
create a connected system of wayfinding inside a building
in order to create a hierarchy of service information
availible to user. Finally, we will develop wayfinding on
campus connected to mobile devices in order to create
convenience for students, staff, and visitors who come to
Mahasarakham University.
ACKNOWLEDGMENTS
This project has been supported and funded by
Mahasarakham University. We also have to say thank
you for the New Media department for providing a place
to conduct this research. The key informants and
participants who gave me a warm welcome, valuable
suggestions and participation during the data collection
processes are greatly appreciated. Finally, this project
would not have been possible without these people and
organization as above.
REFERENCES
[1] R. Passini, Wayfinding in Architecture, New York: Van
Nostrand Reinhold, 1984.
[2] J. R. Carpman and A. G. Myron, “Handbook of
environmental psychology,” in Wayfinding: A Broad View,
B. B. Robert and C. Arza, Eds., New York: John Wiley &
Son, 2002, pp. 427-442.
[3] S. C. Bitgood, “Environmental psychology in museums,
zoos and other exhibition centers,” in Handbook of
Evironmental Psychology, B. B. Robert and C. Arza, Eds.,
New York: John Wiley & Sons, 2002, pp. 461-480.
[4] R. P. Darken and B. Peterson, “Spatial orientation,
wayfinding, and representation,” in Handbook of Virtual
Environment Technology, 2001.
[5] A. S. Devlin, “Wayfinding in healthcare facilities:
Contributions fromenvironmental psychology,” Behavioral
Sciences, vol. 1, no. 4, pp. 423-436, 2014.
[6] J. Peponis, C. Zimring, and Y. K. Choi, “Finding the
building in wayfinding,” Environment and Behavior, vol.
22, no. 5, pp. 555-590, 1990.
[7] R. Passini, Wayfinding in Architecture, New York: Van
Nostrand Reinhold, 1984.
[8] E. C. Tolman, “Cognitive maps in rats and men.
Psychological Review, vol. 55, no. 4, pp. 189-208, 1948.
[9] J. O’Grady and K. V. O’Grady, The Information Design
Handbook, F+W Publications, 2008.
Journal of Communications Vol. 13, No. 1, January 2018
19©2018 Journal of Communications
[10] R. Thienmongkol, “Designing way-finding in the Thai
context,” Auckland University of Technology, Auckland,
2014.
[11] R. Thienmongkol and P. Trakulphat, “Using co-design
theory to develop graphical simulation for enhanced
learning in a museum display,” The Turkish Online
Journal of Educational Technology, vol. 2, pp. 1261-1269,
2016.
[12] J. O’Neill, “Effects of signage and floor plan configuration
on wayfinding accuracy,” Environment and Behaviour, vol.
23, no. 5, pp. 553-574, 1991.
[13] R. Likert, “A technique for the measurement of attitudes,”
Archives of Psychology, vol. 1, no. 140, pp. 1-55, 1932.
[14] C. Calori, Signage and Wayfinding Design: A Complete
Guide to Creating Environmental Graphic Design Systems,
New Jersey: John Wiley & Sons, 2007.
Ratanachote Thienmongkol is an
Assistant Professor at the Faculty of
informatics, Department of New Media,
Mahasarakham University, Thailand. In
2014, he obtained his doctorate from
Auckland University of Technology,
New Zealand with a Thai Royal MSU
grant. Currently, he is a Ph.D. in
Communication Design who is teaching undergraduate and
postgraduate students in Creative Media programs. His
academic research focuses on improving the empowerment of
visualization for user recognition and reading acquisition based
on the human centered design (HCD) concept. The area of his
design expertise includes, information design, digital media,
wayfinding systems, UI/UX, HCD and visual ergonomics.
Journal of Communications Vol. 13, No. 1, January 2018
20©2018 Journal of Communications