Design Toward Integration of CO Capture and Fuel Conversion Technologies for...
116
Design Toward Integration of CO 2 Capture and Fuel Conversion Technologies for a 500 MWe Coal-Based Power Plant Final Report by CO 2 Capture Group EGEE 580 Lu-Ming Chen Vasudha Dhar Jiahua Guo Meredith Hill Hyun Jae Kim Onur Mustafaoglu Nari Soundarrajan Ram Sundararaman May 1, 2006
Transcript of Design Toward Integration of CO Capture and Fuel Conversion Technologies for...

Design Toward Integration of CO2 Capture and
Fuel Conversion Technologies
for a 500 MWe Coal-Based Power Plant
Final Report by CO2 Capture Group
EGEE 580
Lu-Ming Chen Vasudha Dhar
Jiahua Guo Meredith Hill Hyun Jae Kim
Onur Mustafaoglu Nari Soundarrajan
Ram Sundararaman
May 1, 2006

Executive Summary Background Fossil fuel-fired power plants are among the biggest stationary sources of anthropogenic carbon dioxide (CO2) emissions. Excess levels of CO2 in the atmosphere could contribute to an increase in the average global temperature and lead to unfavorable climatic changes (Steinberg, 1984). Research in the area of CO2 recovery (prior to its storage or utilization) from large power plants is considered the first step in tackling the ever-growing CO2 problem. The amount of CO2 generated from a power plant depends on the fuel conversion technology employed in the power generation process. Generally, incorporating CO2 capture technologies into power plants introduces energy penalties. This project addresses the integration of CO2 capture in a 500 MWe power plant without incurring major efficiency losses. Methodology Various CO2 capture methods and power generation technologies were examined with respect to net power generation efficiency, amount of CO2 captured, and scale-up considerations. The capture methods investigated include membrane technologies for both pre- and post-combustion separation of CO2 and adsorption/absorption technologies. Advanced power generation technologies evaluated were oxy-combustion, chemical-looping combustion (CLC), natural gas reforming combined cycle (NGRCC), and integrated gasification combined cycle (IGCC). Conventional means of power generation without CO2 capture (e.g., air-fired pulverized coal combustion and fluidized bed combustion) formed base cases to evaluate advanced combustion technologies with CO2 capture. IGCC and CLC emerged as efficient options for future coal-based power plants, but only IGCC fit the design objective of achieving 500 MWe generation. Cases Considered Coal-based IGCC Bituminous coal was chosen as the feedstock for the IGCC system (Table 2-2). An oxygen-blown, E-gas gasifier produced the syngas (composition after cleanup: 0.468 mol CO, 0.333 mol H2 and 0.148 mol CO2). A water-gas-shift reactor converted the syngas to a concentrated stream of H2 and CO2. A palladium-based membrane system was used to separate the H2 that was then sent to the gas turbines. The required gross power output is ~799 MWe at a 35.4% thermal-to-electric efficiency (HHV-based) (Table 2-3). All CO2 produced (~10.733 106 kg CO2/day) is captured. This current design introduces a 14% energy penalty for the CO2 capture compared to IGCC without capture. The exit gas composition of the current system is 68.3% CO2, 12.5% CO, 12.5% H2O, 6.8% N2 and others. Coal-based CLC CLC was investigated as a supplementary power generation source (~150 MWe) using some syngas produced from the gasification unit. The chosen CLC system comprises interconnected fluidized bed reactors with a steam cycle for power generation. A nickel-based oxygen carrier with NiAl2O4 as the binder was chosen as the bed material for the reactors. CLC is considered as a conceptual clean combustion technology.
ii

Technical Conclusions and Recommendations The efficiency of power generation of the proposed IGCC system with palladium membranes is approximately 35.4%. Integration of CLC with IGCC can slightly improve system efficiency by approximately 0.3%.
Technology Efficiency, % IGCC without CO2 capture 48.5 IGCC with palladium membrane 35.4 IGCC (500 MWe @ 35.4%) integrated with CLC (150 MWe @ ~40%)
35.7
It is also noted that there is a considerable amount of recoverable energy in the form of CO in the exit gas, which needs to be addressed. The current design considering 100% CO2 capture can also be modified to improve electricity generation efficiency.
iii

TABLE OF CONTENTS
EXECUTIVE SUMMARY ........................................................................................................................................II TABLE OF CONTENTS......................................................................................................................................iv LIST OF TABLES...............................................................................................................................................vii LIST OF FIGURES ...........................................................................................................................................viii
CHAPTER 1: INTRODUCTION..............................................................................................................................1 1.1 EVALUATION OF CO2 CAPTURE OPTIONS............................................................................................................2
1.1.1 Membranes.................................................................................................................................................2 1.1.2 Solid Adsorption.........................................................................................................................................2 1.1.3 Solvent Absorption .....................................................................................................................................2 1.1.4 Biomass Utilization ....................................................................................................................................3
1.2 EVALUATION OF ADVANCED POWER GENERATION METHODS............................................................................3 1.2.1 Oxy-Combustion.........................................................................................................................................3 1.2.2 Chemical-Looping Combustion..................................................................................................................4 1.2.3 Natural Gas Reforming Combined Cycle...................................................................................................5 1.2.4 Integrated Gasification Combined Cycle (IGCC)......................................................................................5
1.3 DESIGN METHODOLOGY .....................................................................................................................................5 CHAPTER 2: PROPOSED DESIGN .......................................................................................................................7
2.1 WHY COAL-BASED IGCC? .................................................................................................................................7 2.2 COAL SELECTION ................................................................................................................................................8 2.3 IGCC COMPONENTS ...........................................................................................................................................9
2.3.1 Air Separation Unit ..................................................................................................................................10 2.3.2 Gasifier .....................................................................................................................................................10 2.3.3 Gas Cleanup.............................................................................................................................................11 2.3.4 Water-Gas-Shifter (CO conversion).........................................................................................................12 2.3.5 Palladium Membrane Hydrogen Purifier ................................................................................................13 2.3.6 Heat Exchanger........................................................................................................................................13 2.3.7 Flue Gas Treatment..................................................................................................................................14 2.3.8 Power Generation Unit ............................................................................................................................14 2.3.7 Calculation Results ...................................................................................................................................15 2.3.8 Environmental Benefit..............................................................................................................................16
CHAPTER 3: IMPLEMENTING CLC .................................................................................................................18 3.1 FUNDAMENTAL CONCEPT OF CLC....................................................................................................................18 3.2 SELECTION OF FUEL..........................................................................................................................................18 3.3 SELECTION OF LOOPING MATERIAL ..................................................................................................................19
3.3.1 Thermodynamics ......................................................................................................................................21 3.3.2 Kinetics ....................................................................................................................................................22
3.4 REACTOR DESIGN .............................................................................................................................................24 3.4.1 Design Methodology ................................................................................................................................24 3.4.2. Other Assumptions in the Design .............................................................................................................26
3.5 DESIGN SUMMARY.............................................................................................................................................28 3.6 ENVIRONMENTAL ISSUES ..................................................................................................................................28
CHAPTER 4: CO2 TRANSPORTATION, SAFETY AND PUBLIC PERCEPTION .......................................29 4.1 TRANSPORTATION AND SAFETY ISSUES ............................................................................................................29 4.2 PUBLIC PERCEPTION .........................................................................................................................................29
CHAPTER 5: PROJECT SUMMARY...................................................................................................................31 5.1 CONCLUSIONS...................................................................................................................................................31
iv

5.2 RECOMMENDATIONS FOR FUTURE WORK .........................................................................................................31 APPENDICES............................................................................................................................................................32 APPENDIX A: MEMBRANES USED IN PRE-COMBUSTION TO CAPTURE CO2 .....................................33
A.1 INTRODUCTION.................................................................................................................................................33 A.1.1 Classification of Membranes ...................................................................................................................33 A.1.2 Permeability and Selectivity ....................................................................................................................33 A.1.3 Principle of Membranes ..........................................................................................................................34
A.2 DETAILS ABOUT DIFFERENT MEMBRANES .......................................................................................................35 A.2.1 Dense Pd-Based Membranes ...................................................................................................................35 A.2.2 Microporous Inorganic Membranes ........................................................................................................35 A.2.3 High-Performance Polymeric Membranes ..............................................................................................36
A.3 PD-BASED MEMBRANE IN IGCC......................................................................................................................38 APPENDIX B: POST-COMBUSTION MEMBRANE SEPARATION ..............................................................41
B.1 MEMBRANE TYPES ...........................................................................................................................................41 B.1.1 Gas Separation Membranes.....................................................................................................................41 B.1.2 Gas Absorption Membranes ....................................................................................................................42 B.1.3 Inorganic Membranes..............................................................................................................................43 B.1.4 Composite Membranes ............................................................................................................................43
B.2 LIMITATIONS WITH MEMBRANE SYSTEMS FOR FLUE GAS TREATMENT ...........................................................46 B.3 GAS TREATMENT OF THE FLUE GAS FROM IGCC.............................................................................................46
B.3.1 Assumptions made for the Separation Process ........................................................................................47 APPENDIX C: SOLID ADSORPTION .................................................................................................................49
C.1 CONCEPT ..........................................................................................................................................................49 C.2 ADSORBENTS....................................................................................................................................................50
C.2.1 Carbon-Based Adsorbents.......................................................................................................................50 C.2.2 Hydrotalcite-like Compounds..................................................................................................................52 C.2.3 Zeolites ....................................................................................................................................................54 C.2.4 Metal Oxides............................................................................................................................................58
C.3 COST AND SCALE-UP .......................................................................................................................................60 C.4 DECISIONS........................................................................................................................................................62
APPENDIX D: SOLVENT ABSORPTION ...........................................................................................................63 D.1 REACTION MECHANISM ...................................................................................................................................63 D.2 IMPURITIES IN THE PROCESS STREAMS.............................................................................................................64 D.3 DESIGN ISSUES .................................................................................................................................................65 D.4 EFFICIENCY LOSS CALCULATIONS ...................................................................................................................66 D.5 ENERGY CONSUMPTION ...................................................................................................................................68 D.6 OPERATIONAL ISSUES ......................................................................................................................................69 D.7 SUMMARY........................................................................................................................................................69
APPENDIX E: BIOMASS GASIFICATION.........................................................................................................71 E.1 REVIEW OF BIOMASS GASIFICATION .................................................................................................................71 E.2 BIODIESEL IN EXTERNAL COMBUSTION APPLICATIONS....................................................................................73 E.3 BIOMASS CO-FIRING .........................................................................................................................................73 E.4 SUMMARY .........................................................................................................................................................73
APPENDIX F: OXY-FUEL COMBUSTION TECHNOLOGIES .......................................................................75 F.1 APPLICATIONS ..................................................................................................................................................76 F.2 OPERATIONAL ISSUES OF OXYGEN GENERATION..............................................................................................76 F.3 COMBUSTION IN THE O2/CO2 ENVIRONMENT ...................................................................................................76 F.4 ENVIRONMENTAL/SAFETY ISSUES ....................................................................................................................77 F.5 CURRENT TECHNOLOGICAL STATUS AND ECONOMICS......................................................................................77
v

F.6 SUMMARY AND SCOPE......................................................................................................................................81 APPENDIX G: GAS REFORMING COMBINED CYCLE.................................................................................82
G.1 TECHNICAL ISSUE ............................................................................................................................................82 G.2 CURRENT TECHNOLOGICAL DEMONSTRATIONS AND ECONOMICS ...................................................................83 G.3 SUMMARY........................................................................................................................................................85
APPENDIX H: CALCULATIONS FOR IGCC ....................................................................................................86 H.1 MASS BALANCE ...............................................................................................................................................86 H.2 AIR SEPARATION UNIT (ASU) ..........................................................................................................................87 H.3 GAS COOLER (RANKINE CYCLE) ......................................................................................................................87 H.4 COMPRESSOR AND GAS TURBINE (BRAYTON CYCLE) ......................................................................................89
H.4.1 Combustion with Syngas .........................................................................................................................89 H.4.2 Combustion with Hydrogen.....................................................................................................................90
H.5 HEAT EXCHANGER REQUIREMENTS .................................................................................................................91 H.6 SYSTEM EFFICIENCY .........................................................................................................................................91
APPENDIX I: GAS TRANSPORTATION............................................................................................................93 I.1 CURRENT STATUS..............................................................................................................................................93 I.2 PRESENT SCENARIO............................................................................................................................................93 I.3 CALCULATIONS .................................................................................................................................................93 I.4 OPERATIONAL ISSUES IN TRANSPORTATION ......................................................................................................94
REFERENCES ..........................................................................................................................................................95
vi
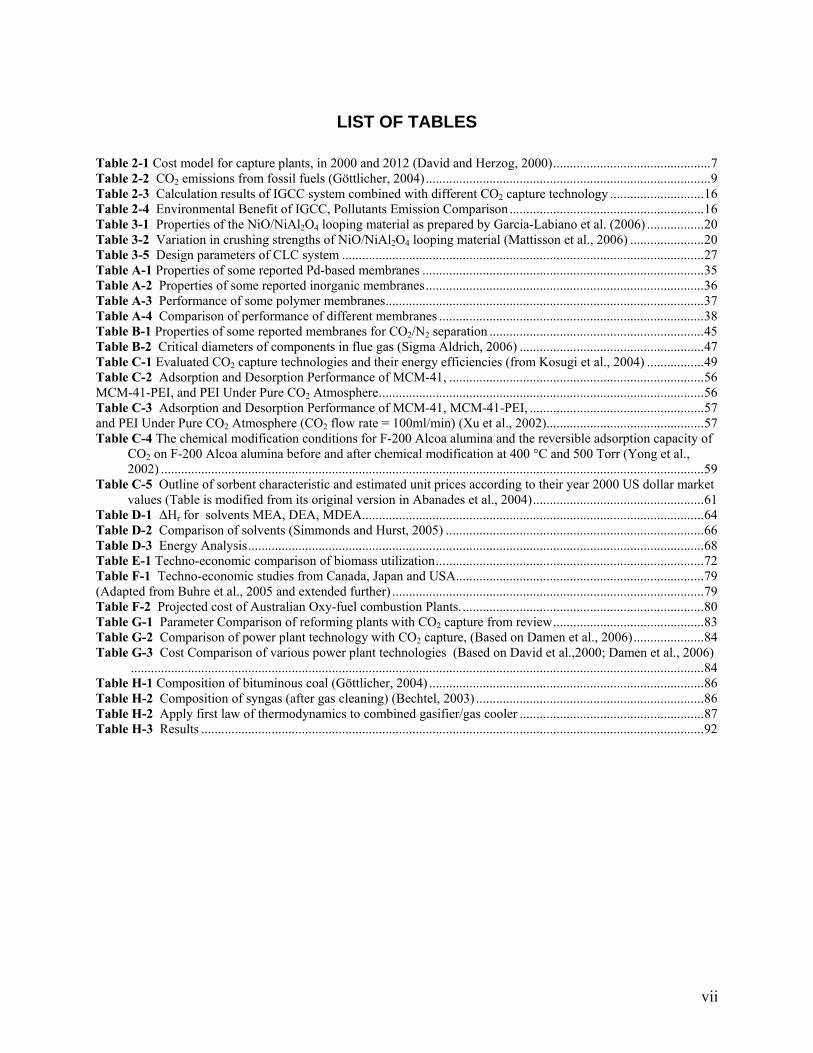
LIST OF TABLES
Table 2-1 Cost model for capture plants, in 2000 and 2012 (David and Herzog, 2000)...............................................7 Table 2-2 CO2 emissions from fossil fuels (Göttlicher, 2004).....................................................................................9 Table 2-3 Calculation results of IGCC system combined with different CO2 capture technology ............................16 Table 2-4 Environmental Benefit of IGCC, Pollutants Emission Comparison ..........................................................16 Table 3-1 Properties of the NiO/NiAl2O4 looping material as prepared by Garcia-Labiano et al. (2006) .................20 Table 3-2 Variation in crushing strengths of NiO/NiAl2O4 looping material (Mattisson et al., 2006) ......................20 Table 3-5 Design parameters of CLC system ............................................................................................................27 Table A-1 Properties of some reported Pd-based membranes ....................................................................................35 Table A-2 Properties of some reported inorganic membranes...................................................................................36 Table A-3 Performance of some polymer membranes...............................................................................................37 Table A-4 Comparison of performance of different membranes ...............................................................................38 Table B-1 Properties of some reported membranes for CO2/N2 separation ................................................................45 Table B-2 Critical diameters of components in flue gas (Sigma Aldrich, 2006) .......................................................47 Table C-1 Evaluated CO2 capture technologies and their energy efficiencies (from Kosugi et al., 2004) .................49 Table C-2 Adsorption and Desorption Performance of MCM-41, ............................................................................56 MCM-41-PEI, and PEI Under Pure CO2 Atmosphere.................................................................................................56 Table C-3 Adsorption and Desorption Performance of MCM-41, MCM-41-PEI, ....................................................57 and PEI Under Pure CO2 Atmosphere (CO2 flow rate = 100ml/min) (Xu et al., 2002)...............................................57 Table C-4 The chemical modification conditions for F-200 Alcoa alumina and the reversible adsorption capacity of
CO2 on F-200 Alcoa alumina before and after chemical modification at 400 °C and 500 Torr (Yong et al., 2002) ..................................................................................................................................................................59
Table C-5 Outline of sorbent characteristic and estimated unit prices according to their year 2000 US dollar market values (Table is modified from its original version in Abanades et al., 2004)...................................................61
Table D-1 ΔHr for solvents MEA, DEA, MDEA......................................................................................................64 Table D-2 Comparison of solvents (Simmonds and Hurst, 2005) .............................................................................66 Table D-3 Energy Analysis........................................................................................................................................68 Table E-1 Techno-economic comparison of biomass utilization................................................................................72 Table F-1 Techno-economic studies from Canada, Japan and USA..........................................................................79 (Adapted from Buhre et al., 2005 and extended further) .............................................................................................79 Table F-2 Projected cost of Australian Oxy-fuel combustion Plants.........................................................................80 Table G-1 Parameter Comparison of reforming plants with CO2 capture from review.............................................83 Table G-2 Comparison of power plant technology with CO2 capture, (Based on Damen et al., 2006).....................84 Table G-3 Cost Comparison of various power plant technologies (Based on David et al.,2000; Damen et al., 2006)
...........................................................................................................................................................................84 Table H-1 Composition of bituminous coal (Göttlicher, 2004) ..................................................................................86 Table H-2 Composition of syngas (after gas cleaning) (Bechtel, 2003) ....................................................................86 Table H-2 Apply first law of thermodynamics to combined gasifier/gas cooler .......................................................87 Table H-3 Results ......................................................................................................................................................92
vii
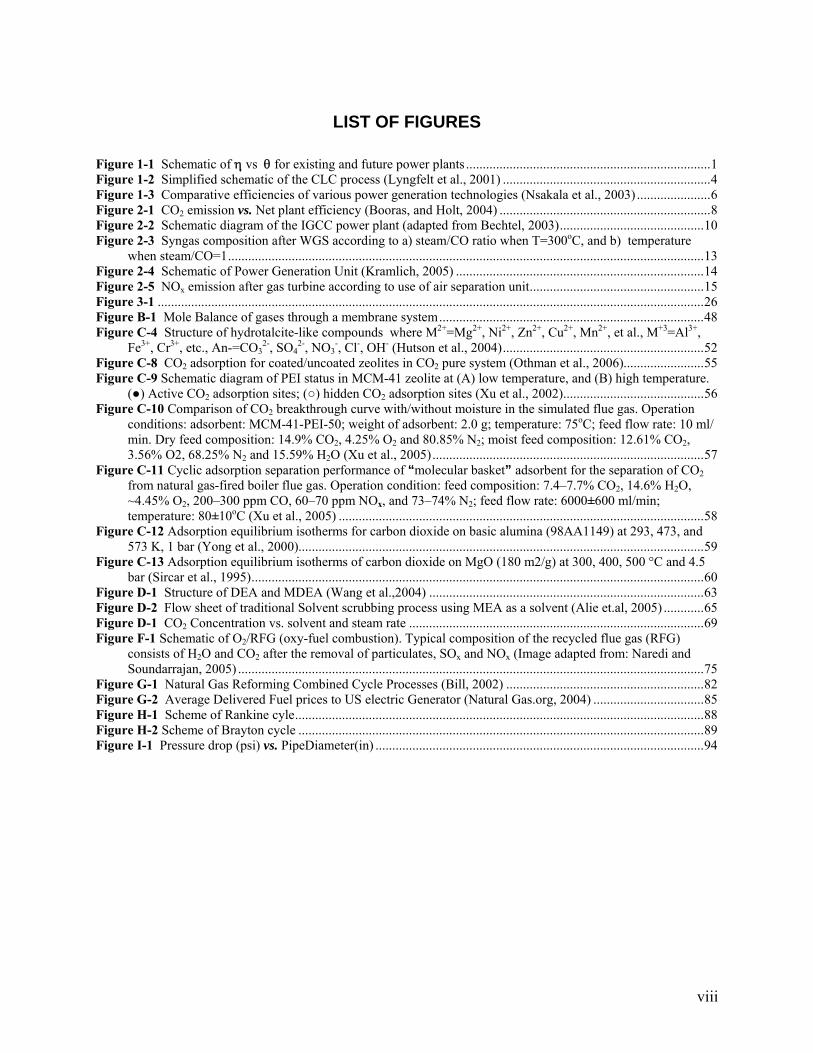
LIST OF FIGURES
Figure 1-1 Schematic of η vs θ for existing and future power plants .........................................................................1 Figure 1-2 Simplified schematic of the CLC process (Lyngfelt et al., 2001) ..............................................................4 Figure 1-3 Comparative efficiencies of various power generation technologies (Nsakala et al., 2003) ......................6 Figure 2-1 CO2 emission vs. Net plant efficiency (Booras, and Holt, 2004) ...............................................................8 Figure 2-2 Schematic diagram of the IGCC power plant (adapted from Bechtel, 2003)...........................................10 Figure 2-3 Syngas composition after WGS according to a) steam/CO ratio when T=300oC, and b) temperature
when steam/CO=1..............................................................................................................................................13 Figure 2-4 Schematic of Power Generation Unit (Kramlich, 2005) ..........................................................................14 Figure 2-5 NOx emission after gas turbine according to use of air separation unit....................................................15 Figure 3-1 ...................................................................................................................................................................26 Figure B-1 Mole Balance of gases through a membrane system...............................................................................48 Figure C-4 Structure of hydrotalcite-like compounds where M2+=Mg2+, Ni2+, Zn2+, Cu2+, Mn2+, et al., M+3=Al3+,
Fe3+, Cr3+, etc., An-=CO32-, SO4
2-, NO3-, Cl-, OH- (Hutson et al., 2004)............................................................52
Figure C-8 CO2 adsorption for coated/uncoated zeolites in CO2 pure system (Othman et al., 2006)........................55 Figure C-9 Schematic diagram of PEI status in MCM-41 zeolite at (A) low temperature, and (B) high temperature.
(●) Active CO2 adsorption sites; (○) hidden CO2 adsorption sites (Xu et al., 2002)..........................................56 Figure C-10 Comparison of CO2 breakthrough curve with/without moisture in the simulated flue gas. Operation
conditions: adsorbent: MCM-41-PEI-50; weight of adsorbent: 2.0 g; temperature: 75oC; feed flow rate: 10 ml/ min. Dry feed composition: 14.9% CO2, 4.25% O2 and 80.85% N2; moist feed composition: 12.61% CO2, 3.56% O2, 68.25% N2 and 15.59% H2O (Xu et al., 2005).................................................................................57
Figure C-11 Cyclic adsorption separation performance of “molecular basket” adsorbent for the separation of CO2 from natural gas-fired boiler flue gas. Operation condition: feed composition: 7.4–7.7% CO2, 14.6% H2O, ~4.45% O2, 200–300 ppm CO, 60–70 ppm NOx, and 73–74% N2; feed flow rate: 6000±600 ml/min; temperature: 80±10oC (Xu et al., 2005) .............................................................................................................58
Figure C-12 Adsorption equilibrium isotherms for carbon dioxide on basic alumina (98AA1149) at 293, 473, and 573 K, 1 bar (Yong et al., 2000).........................................................................................................................59
Figure C-13 Adsorption equilibrium isotherms of carbon dioxide on MgO (180 m2/g) at 300, 400, 500 °C and 4.5 bar (Sircar et al., 1995).......................................................................................................................................60
Figure D-1 Structure of DEA and MDEA (Wang et al.,2004) ..................................................................................63 Figure D-2 Flow sheet of traditional Solvent scrubbing process using MEA as a solvent (Alie et.al, 2005) ............65 Figure D-1 CO2 Concentration vs. solvent and steam rate ........................................................................................69 Figure F-1 Schematic of O2/RFG (oxy-fuel combustion). Typical composition of the recycled flue gas (RFG)
consists of H2O and CO2 after the removal of particulates, SOx and NOx (Image adapted from: Naredi and Soundarrajan, 2005) ...........................................................................................................................................75
Figure G-1 Natural Gas Reforming Combined Cycle Processes (Bill, 2002) ...........................................................82 Figure G-2 Average Delivered Fuel prices to US electric Generator (Natural Gas.org, 2004) .................................85 Figure H-1 Scheme of Rankine cyle..........................................................................................................................88 Figure H-2 Scheme of Brayton cycle .........................................................................................................................89 Figure I-1 Pressure drop (psi) vs. PipeDiameter(in) ..................................................................................................94
viii

Chapter 1: Introduction The world’s consumption of energy has increased rapidly in the past century, with a large portion of the usage coming from the combustion of carbon-based fossil fuels such as coal, petroleum and natural gas. Carbon dioxide (CO2) is a greenhouse gas typically formed via the combustion of fossil fuels. In 2002, it was estimated that over 82% of the United States’ anthropogenic greenhouse gas emissions can be attributed to the CO2 released from fossil fuel-based power plants (EIA report, 2002). Excess levels of CO2 in the atmosphere could lead to an increase in the average global temperature and lead to adverse climatic changes (Steinberg, 1984). World CO2 emissions are expected to double by the year 2030 if no specific policy initiatives and/or measures are taken (WETO, 2003). The capture and sequestration, or secure storage, of CO2 released from power plants and steel/cement factories can be perceived as a long term strategy towards significant reduction in CO2 emissions (Herzog 1999, 2001). The project goal was to design a feasible technological solution for mitigating CO2 emissions from a stationary fossil-fuel based power plant while reducing trade-offs in energy efficiency. Several methods of CO2 capture were investigated toward achieving maximum CO2 emission reduction from electric power plants of 500 MWe scale without significant losses in electricity generation efficiency (η). The percentage of CO2 emission avoided from the total plant emission was defined as CO2 capture effectiveness (θ). Figure 1-1 demonstrates the project goal graphically. It shows η vs. θ for existing power plants and the projections for future power plants with CO2 capture.
η
θ
25 %
0
50 %
80 % 100 %
Future Plant w/ CO2 Capture
Existing Plant w/ CO2 Capture
Figure 1-1 Schematic of η vs θ for existing and future power plants
Existing power plants with post-combustion CO2 capture tend to have low efficiency (lower-right of Figure 1-1) whereas future power plants with CO2 capture are projected to have higher efficiencies (upper-right corner).
1
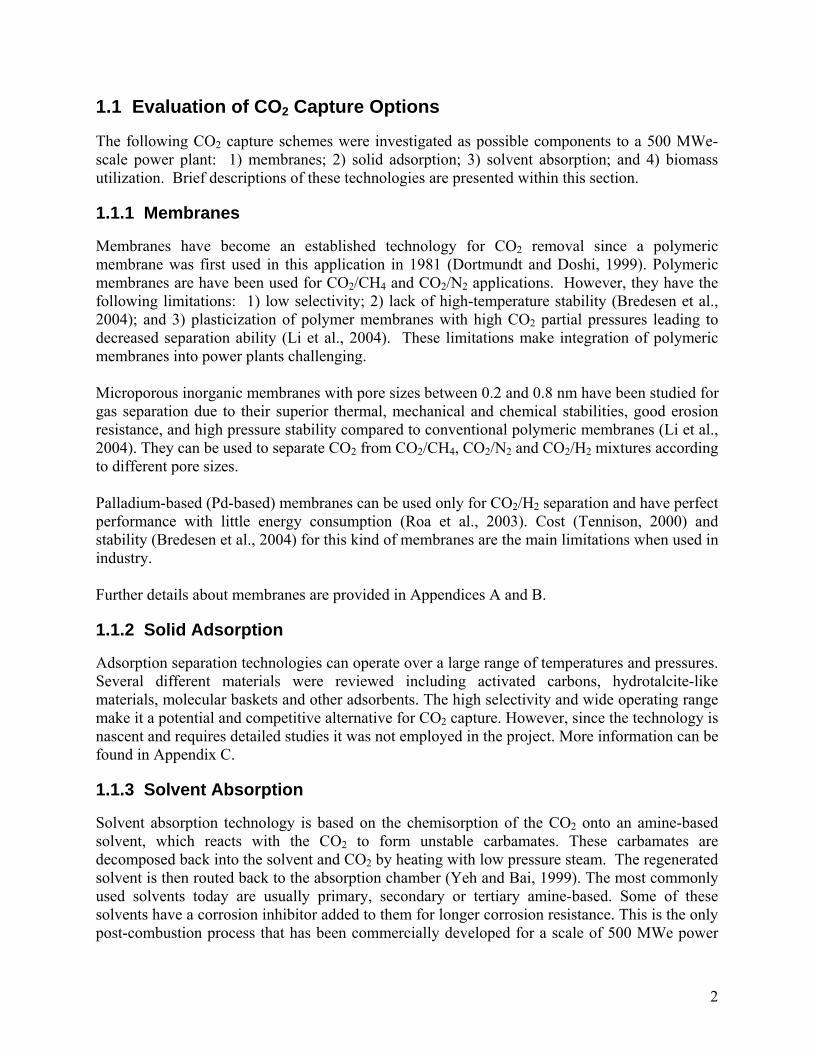
1.1 Evaluation of CO2 Capture Options
The following CO2 capture schemes were investigated as possible components to a 500 MWe-scale power plant: 1) membranes; 2) solid adsorption; 3) solvent absorption; and 4) biomass utilization. Brief descriptions of these technologies are presented within this section.
1.1.1 Membranes
Membranes have become an established technology for CO2 removal since a polymeric membrane was first used in this application in 1981 (Dortmundt and Doshi, 1999). Polymeric membranes are have been used for CO2/CH4 and CO2/N2 applications. However, they have the following limitations: 1) low selectivity; 2) lack of high-temperature stability (Bredesen et al., 2004); and 3) plasticization of polymer membranes with high CO2 partial pressures leading to decreased separation ability (Li et al., 2004). These limitations make integration of polymeric membranes into power plants challenging. Microporous inorganic membranes with pore sizes between 0.2 and 0.8 nm have been studied for gas separation due to their superior thermal, mechanical and chemical stabilities, good erosion resistance, and high pressure stability compared to conventional polymeric membranes (Li et al., 2004). They can be used to separate CO2 from CO2/CH4, CO2/N2 and CO2/H2 mixtures according to different pore sizes. Palladium-based (Pd-based) membranes can be used only for CO2/H2 separation and have perfect performance with little energy consumption (Roa et al., 2003). Cost (Tennison, 2000) and stability (Bredesen et al., 2004) for this kind of membranes are the main limitations when used in industry. Further details about membranes are provided in Appendices A and B.
1.1.2 Solid Adsorption
Adsorption separation technologies can operate over a large range of temperatures and pressures. Several different materials were reviewed including activated carbons, hydrotalcite-like materials, molecular baskets and other adsorbents. The high selectivity and wide operating range make it a potential and competitive alternative for CO2 capture. However, since the technology is nascent and requires detailed studies it was not employed in the project. More information can be found in Appendix C.
1.1.3 Solvent Absorption
Solvent absorption technology is based on the chemisorption of the CO2 onto an amine-based solvent, which reacts with the CO2 to form unstable carbamates. These carbamates are decomposed back into the solvent and CO2 by heating with low pressure steam. The regenerated solvent is then routed back to the absorption chamber (Yeh and Bai, 1999). The most commonly used solvents today are usually primary, secondary or tertiary amine-based. Some of these solvents have a corrosion inhibitor added to them for longer corrosion resistance. This is the only post-combustion process that has been commercially developed for a scale of 500 MWe power
2

plants, which is its main attractive feature. This process is mainly suitable for flue gas streams with low CO2 concentrations. Therefore, it is incompatible with inherent combustion techniques (e.g., oxy-combustion and chemical-looping combustion) that produce concentrated CO2 streams. Another major disadvantage of this process is that it is very energy intensive as the flue gas has to be cooled down to 40°C before being sent to the absorber because the solvent degrades above 50°C. Again the stripping part is to be conducted at a temperature of 105°C which needs a high energy requirement. Solvent absorption may be used as an alternative technology for CO2 capture in place of the proposed capture design methodology for CO2 with some tradeoffs for energy consumption. Since absorption is a commercialized technology, the availability of the solvents is abundant. Thus with future design modifications of using membrane contactors in place of the traditional contactors , this process may emerge as one of the most feasible post combustion technologies for CO2 capture. Appendix D contains further information on solvent absorption.
1.1.4 Biomass Utilization
Biomass usage for electricity generation and process heat has a good potential to come up again mainly because of the fact a lot of biomass comes from agricultural and municipal wastes in today’s world (Audus and Freund, 2004). Furthermore, biomass offers a passive route to CO2 capture because trees and plants are natural CO2 removers of the environment over short periods of time. The key issue for biomass utilization for providing energy needs with simultaneous CO2 mitigation strategy depends on two factors: 1) a feasible method of collection of unwanted solid and liquid organic wastes and delivery to a processing or combustion site; and 2) the sustainable growth of energy crops in a manner such as to provide net energy (i.e., energy obtained from the crops should exceed overall energy in planting and growing the crops.). When these two broad issues are addressed successfully, biomass can be used to provide a net reduction in overall CO2 emissions from power plants and other energy delivery locations. It was decided not to pursue biomass usage options further mainly because of the diverse supply stream of biomass which makes it hard to characterize it as one fuel into a narrow calorific value range. However, if biomass usage were to be considered as a serious option for power generation, then further research on co-firing options and gasification processes would perhaps yield the best results towards electricity generation. More details can be found in Appendix E.
1.2 Evaluation of Advanced Power Generation Methods
The following advanced power generation methods were investigated as possible suppliers of 500 MWe: 1) oxy-combusion; 2) chemical-looping combustion; 3) natural gas reforming combined cycle; and 4) integrated gasification combined cycle. Brief descriptions of these technologies are presented within this section.
1.2.1 Oxy-Combustion
The combustion of fuels in pure oxygen holds the promise of inherently providing a concentrated and capture-ready stream of CO2 which substantially reduces separation costs (Singh et al., 2003). This is because there is no dilution of the combustion air and hence the flue gas volume is
3

substantially reduced. CO2 concentrations in the flue gas are also higher than 80% by volume compared to air-based combustion with flue gas CO2 concentrations in the range of 12-15%. From a detailed investigation of available literature, there appears to be a substantial promise in oxy-fuel combustion as a near term to medium term CO2 capture strategy especially if development of advanced oxygen transport membranes achieves success (Acharya et al., 2005). However, currently the cost of air separation using cryogenic procedures puts oxy-combustion at a slight disadvantage compared to other technologies such as IGCC when it comes to the issue of CO2 capture with power generation. Because of this reason, oxy-combustion was not incorporated in the design. More information about oxy-combustion is contained in Appendix F.
1.2.2 Chemical-Looping Combustion
Chemical-looping combustion (CLC) is based on the principles of oxy-combustion and can inherently separate CO2 while burning the fuel necessary to generate power. Oxygen is needed for combustion and is provided by regenerable solid metal oxides that are circulated between two separate reactors: a fuel reactor and an air reactor (Ishida and Jin, 1994). Reduction of the metal oxide particle occurs in the fuel reactor allowing the oxygen from the metal oxide to react with the fuel. The reaction between the oxygen and the fuel produces high temperature and high velocity gases, which can then be passed through a turbine for power generation or heating process material (Anheden and Svedberg, 1998; Ishida and Jin, 1994; Ishida and Jin, 1997). Next the reduced metal oxide particle is routed, or looped, to the air reactor where oxidation of the reduced metal particle occurs from an incoming stream of air. The oxidized metal particle is then looped back to the fuel reactor where it again reacts with the fuel to repeat the aforementioned cycle of reduction and oxidation. Figure 1-2 demonstrates the basic concepts of CLC.
air
N2, O2
fuel
H2O, CO2
reduced metal oxide
or metal
metal oxide
fuel reactor
air reactor
Figure 1-2 Simplified schematic of the CLC process (Lyngfelt et al., 2001) CLC is presently limited by a lack of industrial-scale research including advanced development in the metal oxide particles needed to carry oxygen from the air reactor to the fuel reactor. However, CLC can potentially capture over 90% of CO2 produced within the fuel reactor without decreasing the efficiency of the overall looping process. CLC also offers fuel flexibility
4

as both gaseous and solid fuels can conceptually be used (Griffin, 2003). CLC shows promise as an imminent efficient power generation technology while capturing CO2, and thus is chosen to be incorporated into the overall design (further discussed in Chapter 3).
1.2.3 Natural Gas Reforming Combined Cycle
Natural gas reforming combined cycle is the integrated power plant of hydrogen production and hydrogen combustion turbine cycle. The carbon is removed from natural gas prior to hydrogen combustion so that no CO2 is discharged during combustion. It is one of the cleanest and efficient technologies for electric generation and CO2 capture. However, from the comparison of various power plant technologies with CO2 capture, the efficiency of natural gas reforming combined cycle is not as high as natural gas combined cycle and the total capital cost is around 40% higher than that of NGCC. Moreover, the natural gas price is expected to increase steadily until the year 2030. Since natural gas is not cost-competitive, the cost of electricity of steam reforming combined cycle is higher than those of other coal power plant. Appendix G has further information about natural gas reforming with combined cycle and also on the abovementioned comparisons.
1.2.4 Integrated Gasification Combined Cycle (IGCC)
IGCC combines gasification technology with combined cycle technology. The first step in the IGCC process is gasification. Gasification converts any hydrocarbon into a synthesis gas comprised mainly of hydrogen (H2) and carbon monoxide (CO) at high temperature and pressure. The gasification process allows the separation of the pollutants from the synthetic gas. With CO2 capture option, syngas passes through a Water Gas Shifter (WGS) and converts the syngas to primarily CO2 and H2. Next the syngas is “cleaned-up” by removing the acid gases (such as hydrogen sulfide), particulate matter, Hg and other pollutants. After the CO2 separation unit, CO2 can be stored and hydrogen is combusted in a combined cycle gas turbine that produces electricity. Both the syngas production process and the gas turbine combustion processes generate steam that is utilized to produce electricity. Advantages of IGCC include the reduction of CO2 emissions, increased efficiency, and flexible fuel supply. IGCC technology with CO2 capture also results in superior environmental performance by reducing emission of pollutants (e.g., SO2, NOx, particulate matter, and mercury). The collection of sulfur and gasification slag obtained from the process has byproduct value, which avoids the cost of byproduct disposal, and easier CO2 removal. The energy consumption for CO2 capture is lowest in comparison with conventional power plant and NGCC plant. The main disadvantage of IGCC is the capital cost. In addition, IGCC is a complex process that requires a high degree of component integration.
1.3 Design Methodology
Based on the literature survey, both the methods of CO2 capture and the technology of energy conversion were found to influence the overall plant efficiency and the amount of CO2 that can be captured. The problem was to design a 500 MWe power plant that incorporated a CO2 capture
5

system. Available systems exist at a wide range of scales from small-scale gas turbines (~5 MW) to large-scale commercial PC units (1000 MW). Several technologies were evaluated on a thermodynamic basis to find mass and energy inputs and outputs involved in the respective method. Next the kinetic limitations to scaling-up from a given size to 500 MWe were determined. Based on some of these preliminary calculations, gasification-based processes (e.g., IGCC) and CLC emerged as efficient options for future coal-based power plants. These power generation technologies were integrated with selected CO2 capture technologies to recover a high percentage of the CO2 produced (> 90%) while maintaining reasonable power generation efficiency (> 30%). Figure 1-3 shows the comparative efficiencies of the power generation technologies considered.
η vs. θ
CLC
IGCC w ith Post Combustion
removal
Air f ired CFB no removal
20
30
40
50
-20% 20% 60% 100%θ %
η %
Figure 1-3 Comparative efficiencies of various power generation technologies (Nsakala et al., 2003)
6

Chapter 2: Proposed Design This chapter describes the proposed design for the capture of CO2 produced from a 500 MWe power plant. The various sections cover the choice of fuel, the fuel conversion technology and its components, the specific CO2 separation technology adopted, auxiliary power plant components, environmental concerns and CO2 handling issues.
2.1 Why Coal-Based IGCC?
According to the World Energy Technology and Climate Policy Outlook 2003, coal represents 25.5% of total global energy usage and generates 38.7% of global electricity. By 2030, global coal use is expected to have doubled from today’s consuming levels. Moreover, coal reserves are last longer than other resources such as oil and gas, with a confirmed global reserves-to-production ratio of over 230 years. Thus, coal is expected to generate 45% of global electricity. Many countries all over the world will be heavily dependent on coal for electricity production because of its abundance and world wide distribution (WETO, 2003). In addition, coal is regarded as the potential feedstock for future power plants because the price of natural gas is rising and unpredictable (refer to Figure G-2 in Appendix G). Based on these considerations, coal is a good fuel feedstock for the team’s proposed power plant. The only problem to be considered is the inevitable emission of CO2. Assuming all the coal is completely oxidized during the process of electricity generation, a 500 MWe power plant with 40% thermal-to-electricity efficiency produces about 9.5 million kilograms of CO2 (David and Herzog, 2000). Technology is available to reduce CO2 emissions by employing a CO2 capture system to prevent most CO2 from being directly vented to the atmosphere. Pre-combustion decarbonization is a potential technology to remove CO2 before burning the fuel. However, the overall efficiency can decrease when a new device is added since additional energy is required to operate for the same efficiency, or in other word, the cost of electricity is comparably high. Studies indicate that coal-based IGCC has the capability for combined reduction of CO2 emissions and increased efficiency compared to conventional power plants (David and Herzog, 2000). Cost model comparisons by David and Herzog (2000) for different technologies are shown in Table 2-1.
Table 2-1 Cost model for capture plants, in 2000 and 2012 (David and Herzog, 2000)
Power Plant Type IGCC 2000
IGCC 2012
PC 2000
PC 2012
NGCC 2000
NGCC 2012
Net Power Output 500MWe 500MWe 500MWe 500MWe 500MWe 500MWe Ref. Plant (WITHOUT Capture)
Thermal Efficiency (LHV), % 42.2 47.8 41.2 42.4 52.4 57.2CO2 Capture
Thermal Efficiency (LHV), % 36.1 43.5 30.9 36.1 45.5 51.5Comparison
Energy Penalty, % 14.6 9.0 25.0 15.0 14.7 10.5Energy Req., kWh/kg CO2
kWh/mole CO2
0.194 0.008
0.135 0.006
0.317 0.014
0.196 0.009
0.337 0.015
0.2830.012
$/kg of CO2 avoided 0.026 0.018 0.049 0.032 0.048 0.040
7

NGCC and PC power plants with CO2 capture incur the highest additional costs compared to IGCC. IGCC has the lowest extra energy requirements at the rate of 0.194 kWh/kg of CO2 avoided (David and Herzog, 2000). In addition to its relatively low energy consumption with CO2 capture, IGCC technology is also environmentally friendly by reducing SO2, NOx, mercury and particulate matter emissions (Bechtel, 2003).
2.2 Coal Selection The rank of coal to be used as fuel plays a vital role in plant emissions. There is a tradeoff between lower CO2 emissions and greater overall efficiency. Increasing the unit’s efficiency is another way to reduce CO2 emission, because less coal is burned per unit electricity generated (Figure 2-1) (Booras, and Holt, 2004).
Figure 2-1 CO emission 2 vs. Net plant efficiency (Booras, and Holt, 2004)
Table 2-2 provides a comparison of different kinds of fuels used for power generation. It shows the heating values of the fuels, amount of fuel required for a 500 MWe power plant, total CO2 emissions and relative emissions with bituminous coal forming the base case.
8

Table 2-2 CO2 emissions from fossil fuels with bituminous coal as the base case (Göttlicher, 2004)
Fuel Heating
Value LHV
in MJ/kg
106 kg
fuel/day
t CO2/t coal
equivalent
kg CO2/MWh
(LHV)
Relative CO2 emissions
Coke 29.3 3.67 3.13 385 119%
Anthracite 31.0 3.47 2.87 354 110%
Bituminous 31.0 3.47 2.62 323 100%
Lignite 16.7 6.44 3.18 392 121%
Natural gas 50.0 2.15 1.55 191 59%
Bituminous coal is widely used in gasification. In comparison with other types of coals, its heating value and relatively low CO2 production make it an appropriate choice as the feedstock for the IGCC process (Table 2-2) (Göttlicher, 2004).
2.3 IGCC Components
The costs of CO2 removal vary significantly between the various coal gasification technologies and is related to feedstock choice (i.e., different coals, biomass and coal co-gasification) (Booras, and Holt, 2004). The current procedure in IGCC technology is gasification of coal, biomass, or petroleum coke in a gasifier to produce raw synthesis gas (syngas), which is mainly composed of CO and H2. The raw syngas is then cleaned and sent to a water-gas shift reactor to convert the CO to CO2, which can be separated to produce high purity of CO2 and H2. In order to achieve the highest possible percentage of CO2 capture, the Pd-membrane will be used as the CO2 capture method. Figure 2-2 shows the scheme of proposed 500 MWe IGCC power plant.
9

Scheme of IGCC
Pd-based Membrane
WT3
Q2
Air
N2
O2
Coal
Water
Slurry Mixer
Gasifier
Slag
Gas Clean
WGS
Combustor
Air
CompressorGas Turbine
WT2 HRSG
Steam Turbine
WP3
Gas Cooler
Gasifier Rankine Cycle
WP1WT1
Q1
Scheme of IGCC
Pd-based Membrane
WT3
Q2
Air
N2
O2
Coal
Water
Slurry Mixer
Gasifier
Slag
Gas Clean
WGS
Combustor
Air
CompressorGas Turbine
WT2 HRSG
Steam Turbine
WP3
Gas Cooler
Gasifier Rankine Cycle
WP1WT1
Q1
Pd-based Membrane
WT3
Q2
Air
N2
O2
Coal
Water
Slurry Mixer
Gasifier
Slag
Gas Clean
WGS
Combustor
Air
CompressorGas Turbine
WT2 HRSG
Steam Turbine
WP3
Gas Cooler
Gasifier Rankine Cycle
WP1WT1
Q1
Figure 2-2 Schematic diagram of the IGCC power plant (adapted from Bechtel, 2003) The following sections introduce IGCC components separately.
2.3.1 Air Separation Unit
A key issue in gasification systems is whether the gasifying agent is oxygen or air (i.e., will an air-blown or oxygen-blown gasifier be employed). Oxygen-blown gasifier produces syngas with a higher calorific value, because it is not diluted by nitrogen in the air. Oxygen of 95% purity by volume can be supplied from cryogenic air separation units (ASU). Without the presence of nitrogen, the size of downstream components would be smaller in the design. The only drawback of oxygen-blown gasification currently is that the ASU is costly and a complex piece of equipment.
2.3.2 Gasifier
Several types of gasifiers are available on commercial scale. The available types are fixed-bed gasifiers (operated in counter-current, co-current or cross-current mode), fluidized bed gasifiers, and entrained flow gasifiers. These gasifiers have different hydrodynamics, which stem from the way in which the solid fuel and the gasification agent (e.g., air, oxygen and/or steam) are contacted and different operating conditions such as temperature and pressure (Bergman, 2004). The fixed bed gasifier has long residence times, which imply a low throughput and hence have limited application in large scale IGCC plants (Simento, 2005). Fluidized bed gasifiers have a uniform temperature distribution. Their advantages include the high heat transfer rates of coal on entry and the gasifier can operate at variable load. However, the relatively low temperature operation limits the use of fluidized bed gasifiers to reactive and predominantly low rank coals. Entrained Flow Gasification is specifically designed for low reactivity coals and can handle high
10

coal throughput. The advantage is the high reaction intensity because of high pressure (2-6 MPa) and high temperature (>1300°C) environment in the entrained flow gasifier. Single pass carbon conversions are in the range of 95-99% (Simento, 2005). Entrained flow gasifiers can process all ranks of coal, but have disadvantages of increased cost and reduced performance when using low rank/high ash coals. For slurry-fed gasifiers (Texaco, E-Gas) the energy density of high moisture and/or high ash coal slurries is markedly reduced, which increases the oxygen consumption and reduces the gasification efficiency. For dry coal-fed gasifiers (Shell) there is an energy penalty (and therefore reduced steam turbine output). The high partial pressure of CO2 could allow for the use of more efficient capture technologies (i.e., physical absorption). The higher concentration of CO2 at a higher pressure means the volume of gas being treated is lower. This makes CO2 capture with IGCC more efficient and potentially reduces the costs (Eide and Bailey, 2005). Due to these reasons, the gasifier employed is the E-Gas technology from Conoco Phillips. It is an oxygen-blown coal gasification technology featuring a slurry-fed, two-stage gasifier. The syngas produced is at 1038°C, contains entrained solids from the second stage and is cooled in a fire-tube boiler to produce saturated high-pressure steam (ConocoPhillips, 2006). Since the feed capacity of an E-Gas gasifier is 2,750 TPD, two gasifiers are needed for the current design (ConocoPhillips, 2006).
2.3.3 Gas Cleanup
Syngas has to be free of particulates, tars, sulfur, and alkali metals to prevent corrosion of the IGCC components (Bechtel, 2003). Particulate removal to protect the turbine blades from erosion requires filtration technology. Alkali metal removal (e.g., Na, K) is needed to avoid deposition and corrosion of the turbine blade materialse (Booras and Holt, 2004). Gas cleanup processes and components vary with different designs and deals with particulate, mercury, and acid gas removal (AGR). For particulate removal, the syngas from gasification process is scrubbed and filtered using bag filters (EPA Report, 1998). A coal gasifier may emit mercury in several different forms, primarily as elemental mercury (Hg0), mercuric chloride (HgCl2) and mercuric sulfide (HgS) (Alptekin et al., 2003). Depending upon the conditions, these compounds may exist as gaseous or in the form of micro-particles (i.e., aerosols) at concentrations in low ppb levels. Mercury removal can be achieved via activated carbon beds. The cost of more than 90% volatile mercury removal from a coal gasification-based plant would be only one-tenth of that from a pulverized coal combustion-based plant of comparable capacity (Klett et al., 2002). Because the gasifier operates under high pressure, the syngas stream is compressed to a volume that is approximately 1-2% that of the post-combustion flue gas from a similar-sized pulverized coal plant (Klett et al., 2002). Conventional AGR systems are based on methyldiethanolamine solvent, which removes the main sulfur compound H2S in the gas. An acid gas stream is produced to a sulfur recovery unit. The sulfur recovery unit converts H2S to elemental sulfur, which is greater than 99.99% pure. The sulfur can be sold for agricultural applications (Grasa et al., 2004). However, the
11

disadvantage of these absorption-based techniques for the purification of syngas is that hot syngas must be cooled to ambient temperature and then preheated to a high temperature before can be used for Palladium-based membrane. The raw syngas exiting the syngas cooler is filtered to remove the unreacted entrained solids, which are recycled to the gasifier. The filtered “sour” gas consists mainly of hydrogen, carbon monoxide, carbon dioxide, water, and smaller quantities of nitrogen, methane, hydrogen sulfide, and carbonyl sulfide (COS) (Booras and Holt, 2004). A better alternative is to treat the syngas in a hot gas cleanup device. It can avoid heat loss and save energy. Hot gas cleaning units (HGCUs) has been developed and appears to be the major technique for removal of hydrogen sulfide from hot raw syngas. The basic high temperature sulfidation reaction is shown as follows: MO + H2S → MS + H2O (sulfidation) [2-1] where MO and MS are the metal oxide and metal sulfide, respectively. The sulfide sorbent can be regenerated through reaction with diluted air (Ko et al., 2006). The main difference between hot gas cleaning units (HGCUs) and conventional acid gas removal technologies is that HGCUs operate at higher temperatures and pressures, which eliminates the need for gas cooling (Grasa et al., 2004).
2.3.4 Water-Gas-Shifter (CO conversion) Water-gas-shift reaction (WGS) is an important reaction in hydrogen production from syngas from coal gasifier. This process is the step in which CO in the syngas to be converted into hydrogen and CO2 through WGS. The major difference between different schemes is the number of units and the temperature levels, high temperature (HT) shift at 350°C, medium temperature (MT) shift at 250-300°C, and low temperature (LT) shift at 190°C -210°C. The choice is between HT and LT, or a MT shift reactor. The larger amount of CO2 converted from CO is better because it guarantees high CO2 capture and reduces poisoning of the Pd-based membrane (Section 2.3.5). State-of-the-art WGS can have over 95% CO conversion at specific ratios of steam/CO and at specific temperature (Gottlicher, 2004). Figure 2-3 shows the syngas composition according to steam/CO ratio and temperature.
12

1.0 1.5 2.00
10
20
30
40
50
60
Con
cent
raio
n (%
)
Ratio H2O/CO
CO CO2
H242.06 41.39 38.96 CO2
55.18 54.66 52.78 H2
1.62 2.81 7.07 CO
21.51H2O/CO
42.06 41.39 38.96 CO2
55.18 54.66 52.78 H2
1.62 2.81 7.07 CO
21.51H2O/CO
200 250 300
0
10
20
30
40
50
60
Con
cent
ratio
n (%
)
Temperature(o C)
COH2
CO2
200 250 3000
10
20
30
40
50
60
Con
cent
ratio
n (%
)
Temperature(o C)
COH2
CO238.96 40.2041.24 CO2
52.78 53.7454.55 H2
7.07 4.883.07 CO
300250200T (oC)
38.96 40.2041.24 CO2
52.78 53.7454.55 H2
7.07 4.883.07 CO
300250200T (oC)
a b
Figure 2-3 Syngas composition after WGS according to a) steam/CO ratio when T=300 C, o
and b) temperature when steam/CO=1 As the syngas has low hydrogen concentration (~33%) after gasification and gas cleanup processes, we tried to increase hydrogen concentration by using WGS. The reaction is exothermic, but the energy produced is not high enough to convert water to steam. If the steam amount is increased to steam/CO=2, H2 concentration will increase and CO will get lowered than that when steam/CO=1. However, higher steam ratios require higher energy consumption. Likewise, if WGS reactor is operated at low temperature, we can get high hydrogen concentration. However, the palladium membrane needs to operate around 300°C. With these reasons, we focused on MT shift reaction and steam/CO ratio is 1.
2.3.5 Palladium Membrane Hydrogen Purifier
Pd-based membrane, which follows the diffusion-splitting mechanism, is theoretically capable of completely separating hydrogen from other gas (Bredesen et al., 2004). Pd-based membrane hydrogen purifier operates via pressure driven diffusion across palladium membranes. Only hydrogen can diffuse through the palladium membrane, which is typically a metallic tube composed of palladium and silver alloy material. It has the unique property of allowing only monatomic hydrogen to pass through its crystal lattice when it is heated above nominally 300°C. The hydrogen molecule contacted with the palladium membrane surface dissociates into monatomic hydrogen and passes through the membrane. On the other surface, the monatomic hydrogen recombines to form molecular hydrogen. Compared to the capture technologies like pressure swing adsorption (PSA) system considered by Eide and Bailey (2005), this technology has higher potential to separate CO2/H2. Further details of this technology can be seen in Appendix Section A.3.
2.3.6 Heat Exchanger
The reject gas coming out from the Pd-based membrane is cooled to 100°C in a heat exchanger with water as a coolant. The steam produced in this case is recycled back to the WGS reactor which meets 25% of the steam requirements for the reaction. This calculation can be found in Appendix Section H.5.
13

2.3.7 Flue Gas Treatment
Possible ways of obtaining pure CO2 with less energy penalties were considered. The reject gas coming out of the Pd membrane has the composition: 68.3% CO2, 12.5% CO, 12.5% H2O, and 6.7% N2 (mole basis). Simple membrane systems were evaluated as an option to obtain pure CO2 streams. However, based on certain calculations of energy penalty and mass balance, this proved unsuitable. Further information on the types of membranes considered for this can be seen in Appendix B, with the specific explanation of calculations regarding gas treatment seen in Appendix Section B.2.
2.3.8 Power Generation Unit
The power generation unit is composed of gas turbine generator (GTG), steam turbine generator (STG) and heat recovery steam generator (HRSG) (Figure 2-4). Combustion exhaust gases are routed from the GTGs to the HRSGs and stacks.
Figure 2-4 Schematic of Power Generation Unit (Kramlich, 2005)
A hydrogen combustion turbine can be powered by steam generated from the internal combustion of hydrogen as a fuel mixed with pure oxygen. As it is possible to use a closed cycle system, it benefits in cycle efficiency and reduction of environmental pollution comparing with other fuel gas turbine (Sugisita, 1998; Gambini, 2005). The HRSG receives the gas turbine exhaust gases and generate steam at the main steam and reheat steam energy levels. It generates high pressure steam and provides condensate heating for both the combined cycle and the gasification facilities. Heat transfer surface is of the extended surface type, with a serrated fin design. The main problem with combusting hydrogen in current turbines is that it will result in increased NOx emissions due to an increased flame temperature. Applying hydrogen at a fuel to a conventional air breathing gas turbine cycle would not generate CO2, but NOx would be generated because N2 is present in the air (Sugisita, 1998). In the current gas turbine technology, fuel dilution with nitrogen is the most feasible option. However, the dilution with nitrogen cannot reduce NOx emission amount, but moderately decreases the concentration of it.
14

Another way to reduce NOx emission is to apply high oxygen concentration to gas turbine using ASU unit. Figure 2-5 shows the comparison of NOx emission after gas turbine. When 95% oxygen is introduced from air separation unit, the NOx emission from gas turbine can be reduced by 80%. However, using an ASU decreases total energy efficiency of power plant (Sugisita, 1998).
1400 1500 1600 1700 18000.000
0.005
0.010
0.015
0.020
0.025
NO
x fro
m 1
mol
H2
Temperature (oC)
Without ASU With ASU
Figure 2-5 NO emission after gas turbine according to use of air separation unitx
2.3.7 Calculation Results
The purpose of doing some calculations based on assumptions is to have some general ideas about the energy penalty when using different CO2 capture technology combined with IGCC system. The details of the calculations and the related assumptions are shown in Appendix H. Table 2-3 shows the condensed results.
15

Table 2-3 Calculation results of IGCC system combined with different CO2 capture technology
Feeds IGCC without
CO2 capture
IGCC with post-combustion
CO2 capture
IGCC with pre-combustion
CO2 capture
Coal, 103 kg per day 3017 3843 4128
95% O2, 103 kg per day 3620 4612 4953
Performance
Gross Power, MWe 875 1115 799
Auxiliary Power, MWe 375 615 279
CO2 produced, 103 kg per day 9292 11838 10733
CO2 emission, 103 kg per day 9292 2368 ~0
Thermal-to-Electric Efficiency based on HHV 48.5% 38.1% 35.4%
From Table 2-3, we can see that the IGCC systems with less amount of CO2 emission has higher energy penalty and is less efficiency. Although the consumption of coal in pre-combustion system is higher and the efficiency of the system is lower than post-combustion system, the efficiency drop when using Pd-based membranes can be justified if near zero CO2 emissions are sought. Therefore, our IGCC design is going to use Pd-based membrane after WGS as the pre-combustion CO2 capture technology, due to its high selectivity and potential for the future.
2.3.8 Environmental Benefit
IGCC is the cleanest solid fuel technology (see Table 2-4). Unlike the direct combustion process in conventional PC power plants, pollution prevention in IGCC is achieved through removal of source pollutants before combustion. The gas cleaning process in IGCC lowers the emission of acid gases (i.e., SOx, NOx) and trace metals (i.e., Hg). Air emissions from an IGCC power plant are far below current U.S. Clean Air Act standards (Herzog, 2001). Specifically, sulfur removal efficiencies of more than 99% are achievable (Booras and Holt, 2004). IGCC systems are able to achieve exceptional levels of environmental performance, availability, and efficiency.
Table 2-4 Environmental Benefit of IGCC, Pollutants Emission Comparison
Pollutant (lb/MMBTU) PC unit [1] IGCC unit [2]
SO2 0.06-0.2 < 0.04 NOx 0.04-0.1 < 0.025 Particulate Matter 0.018-0.03 < 0.01 Mercury Removal (%) 30-80 > 90
[1] Western (2005) [2] Rosengerg (2005)
16

From the calculation result, we can see that our modified IGCC system with less amount of CO2 emission has higher energy penalty and is less efficient. This system can be further optimized to improve the power generation efficiency if trade offs in CO2 capture percentage are considered.
17

Chapter 3: Implementing CLC
As previously mentioned, CLC is presently limited by a lack of industrial-scale research (Lyngfelt and Thunman, 2005; Johansson et al., 2006). Metal oxide particle development has also not reached advanced stages as research in this specific area is ongoing. Therefore, allowing CLC to account for a smaller portion (~150 MWe) of the overall power required for a 500 MWe scale power plant is being considered. Specifically, a fraction of the auxiliary power required to run the IGCC system described above (~211 MWe) can potentially be supplied by CLC. In this chapter, a brief overview of the fundamental concepts surrounding CLC is presented followed by a discussion of the fuel, looping material, and reactor design chosen for CLC to potentially complement the aforementioned IGCC and gas handling processes.
3.1 Fundamental Concept of CLC
The fundamental chemical reactions occurring within the two reactors of a CLC system are as follows (Ishida and Jin, 1997):
fuel reactor: MexOy + fuel MexOy-1 + H2O + CO2 [3-1]
air reactor: MexOy-1 + 21 O2 MexOy [3-2]
where MexOy denotes a metal oxide and MexOy-1 is its reduced compound. These reactions indicate that the fuel and air input for combustion are never mixed, which is the primary advantage of CLC over conventional combustion systems (Anheden and Svedberg, 1998; Lyngfelt et al., 2001). Both reactions also demonstrate how CO2 is inherently separated from the fuel during combustion in the fuel reactor because the outlet gas from the air reactor is N2 and any unreacted O2, while the outlet gas from the fuel reactor is H2O and CO2. This is quite different from conventional combustion in which the CO2 can be diluted by N2, which would require more energy to recover similar amounts of CO2 (Ishida and Jin, 1996).
3.2 Selection of Fuel
The chemical composition of the fuel ultimately contributes to the formation of CO2 based on the theorized reactions occurring within the fuel and air reactors seen in Reactions [3-1] and [3-2], respectively. Gaseous fuels (e.g., CH4, coal-based syngas, biomass-based syngas, and H2) are generally preferred in CLC since solid fuels will likely inadvertently loop, or travel, with the metal oxide particle from the fuel reactor to the air reactor where it will be burned up (Lyngfelt et al., 2001). However, research involving the indirect gasification of solid fuels (e.g., coal, biomass) within CLC designs has recently been proposed (Griffin, 2003) and may be viable in the near future. Coal-based syngas produced from the IGCC unit previously described in Chapter 2 will be utilized in the CLC design described herein. This decision is two-fold: 1) ease of implementation based on availability and cost of coal, and 2) aid in future research. Firstly, the
18

abundance and cheap cost of coal is favorable compared to CH4 and H2 (Naturalgas.org, 2004; NAE and BEES, 2004), and the convenience of the coal-based syngas being producing from the IGCC process eases integration in the proposed CLC system. Secondly, the integration of this CLC system with the IGCC and gas handling systems proposed above can serve as a small-scale demonstration unit that can augment current and future research into the large-scale implementation of CLC using coal-based syngas. The syngas used for the proposed design integration is thus comprised of ~ 47 wt.% CO, ~33 wt.% H2, ~15 wt.% CO2, and ~5 wt.% inert gases (e.g., Ar, N2) with a calculated HHV of 11,295 kJ/kg (or 285 BTU/scf) (Bechtel, 2003).
3.3 Selection of Looping Material
Choosing a metal oxide that can thermally withstand multiple reduction-oxidation cycles necessary for CLC is a major technical issue. The most studied looping materials in the literature are Ni-, Mn-, Cu- and Fe-based. Particles instead of powdered forms, are preferred for CLC because powdered forms can introduce dust into the reactors, which may disrupt the reactions (Ishida and Jin, 1997). Particle forms also show enhanced reactivities and regenerability when used in such a cyclical process as CLC (Ishida and Jin, 1996). Furthermore, pure metal oxides can be damaged (e.g., develop cracks on their surfaces, shrinkage of particles) or have poor reactivity (e.g., low reduction-oxidation conversion) (Ishida and Jin, 1996). Therefore, inert “binders” are mixed with the pure metal oxides to combat the poor reactivity and mechanical qualities often associated with pure metal oxides. The most studied binders include yttria-stabilized zirconia (YSZ), NiAl2O4, ZrO2, TiO2, and SiO2. The binder does not participate in any reactions but can increase the reaction rate and particle durability of metal oxides within the two reactors at elevated temperatures (Ishida and Jin, 1994). From the available literature on the reaction of coal-based syngas with various metal oxide particles (Garcia-Labiano et al., 2006; Jin and Ishida, 2004; Mattisson et al., 2006), NiO mixed with the NiAl2O4 binder (NiO/NiAl2O4) has emerged as a favorable looping material for this CLC system. The particles were prepared via freeze granulation method (Garcia-Labiano et al., 2006) according to a similar study by Cho et al. (2005). This process generally involves spraying a slurry of the metal oxide and binder mixture (i.e., NiO powder, aluminum oxide powder, distilled water, and a dispersion agent called Duramas D-3021) into liquid nitrogen to form frozen spherical particles (Cho et al., 2005). Water is removed via freeze-drying and then the particles are pyrolyzed to remove organic material and were sintered at 1300°C for 4 hours. The NiO metal oxide forms metal aluminate compounds (e.g., NiAl2O4) via reaction with the Al2O3. Physical and chemical properties of the particular NiO/NiAl2O4 particle considered for this study can be seen in Table 3-1.
19

Table 3-1 Properties of the NiO/NiAl2O4 looping material as prepared by Garcia-Labiano et al. (2006)
Active NiO Content (wt. %) 40 Sintering Temperature (oC)a 1300 Sintering Time (h)a 4 Particle Size (mm) 0.2 Porosity 0.36 Specific Surface Area (m2/g) 0.8 Apparent Density (kg/m3) 3446 Oxygen Transport Capacity (Ro) 0.084 Melting Point of pure NiO (oC)b 1955 Melting Point of pure Al2O3 (oC)b 2017 Cost of pure NiOc
<44 μm sized particles; 99.8% purity $30.02/45.4 kg Cost of pure Al2O3
c
1-2 mm sized particles; 99.9% purity $18.26/45.4 kg aCho et al. (2005), bGarcia-Labiano et al. (2005), cAtlantic Equipment Engineers (2006)
From Table 3-1, the oxygen transport capacity is the theoretical maximum amount of the metal oxide that can be used in oxygen transfer (Mattisson et al., 2006) and is dependent on the percentage of active metal oxide in the looping material (Garcia-Labiano et al., 2006). The oxygen transport capacity of NiO/NiOAl2O4 can be calculated from the following equation
ox
redoxo m
mmR
−= [3-3]
where mox represents the mass of the fully oxidized metal particle and mred represents the mass of the fully reduced metal particle (Adanez et al., 2004; Cho et al., 2005). Crushing strengths are important in determining whether the structural or mechanical integrity of the looping material has decreased prior to input in a CLC process. The crushing strength associated with this specific particle was not determined by Garcia-Labiano et al. (2006) and cannot be inferred from the study by Cho et al. (2005). However, Mattisson et al. (2006) did study how crushing strengths of 0.180-0.250 mm sized NiO/NiAl2O4 particles (with 40% active NiO content) can be affected by the sintering temperatures during preparation. These results are summarized in Table 3-2. This table shows that there is no general trend regarding crushing strengths associated with increasing sintering temperatures for this particular metal oxide particle.
Table 3-2 Variation in crushing strengths of NiO/NiAl2O4 looping material (Mattisson et al., 2006)
Sintering Temperature
(oC)
Crushing Strength
(N) 1300 0.8 1400 0.5 1500 1.1
The associated thermodynamic and kinetic reactivities of this looping material will now be presented.
20
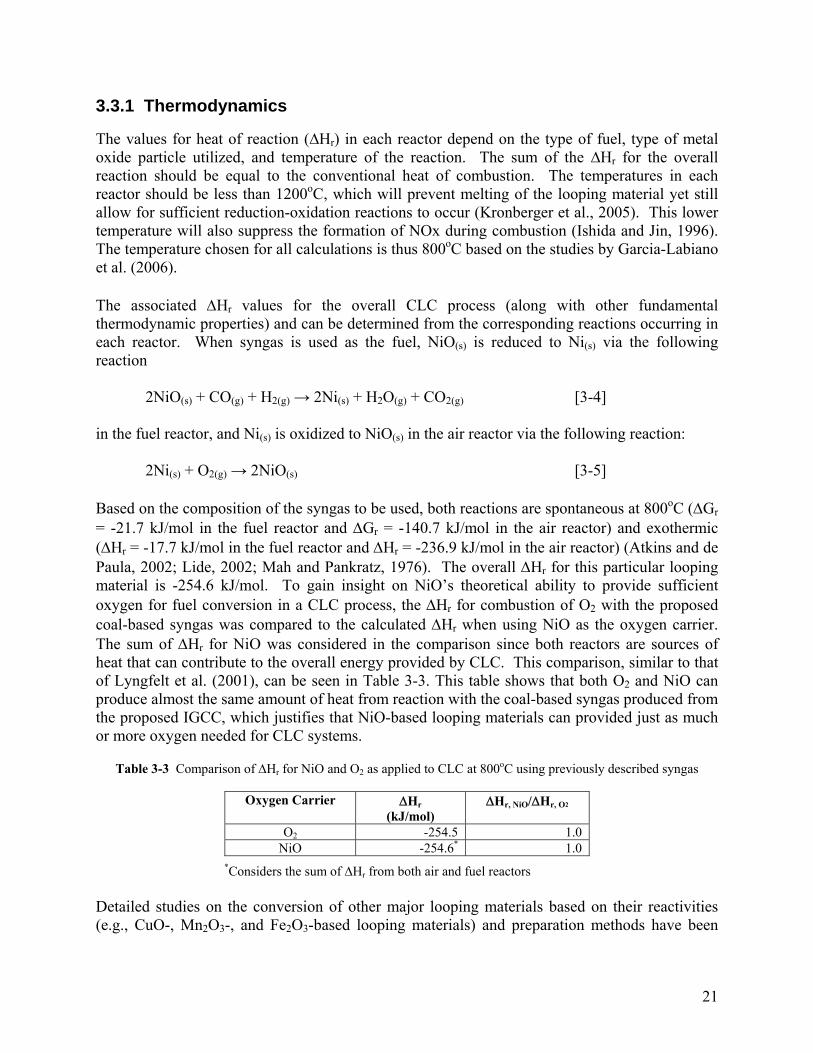
3.3.1 Thermodynamics
The values for heat of reaction (∆Hr) in each reactor depend on the type of fuel, type of metal oxide particle utilized, and temperature of the reaction. The sum of the ∆Hr for the overall reaction should be equal to the conventional heat of combustion. The temperatures in each reactor should be less than 1200oC, which will prevent melting of the looping material yet still allow for sufficient reduction-oxidation reactions to occur (Kronberger et al., 2005). This lower temperature will also suppress the formation of NOx during combustion (Ishida and Jin, 1996). The temperature chosen for all calculations is thus 800oC based on the studies by Garcia-Labiano et al. (2006). The associated ΔHr values for the overall CLC process (along with other fundamental thermodynamic properties) and can be determined from the corresponding reactions occurring in each reactor. When syngas is used as the fuel, NiO(s) is reduced to Ni(s) via the following reaction
2NiO(s) + CO(g) + H2(g) → 2Ni(s) + H2O(g) + CO2(g) [3-4] in the fuel reactor, and Ni(s) is oxidized to NiO(s) in the air reactor via the following reaction:
2Ni(s) + O2(g) → 2NiO(s) [3-5]
Based on the composition of the syngas to be used, both reactions are spontaneous at 800oC (ΔGr = -21.7 kJ/mol in the fuel reactor and ΔGr = -140.7 kJ/mol in the air reactor) and exothermic (ΔHr = -17.7 kJ/mol in the fuel reactor and ΔHr = -236.9 kJ/mol in the air reactor) (Atkins and de Paula, 2002; Lide, 2002; Mah and Pankratz, 1976). The overall ΔHr for this particular looping material is -254.6 kJ/mol. To gain insight on NiO’s theoretical ability to provide sufficient oxygen for fuel conversion in a CLC process, the ΔHr for combustion of O2 with the proposed coal-based syngas was compared to the calculated ΔHr when using NiO as the oxygen carrier. The sum of ΔHr for NiO was considered in the comparison since both reactors are sources of heat that can contribute to the overall energy provided by CLC. This comparison, similar to that of Lyngfelt et al. (2001), can be seen in Table 3-3. This table shows that both O2 and NiO can produce almost the same amount of heat from reaction with the coal-based syngas produced from the proposed IGCC, which justifies that NiO-based looping materials can provided just as much or more oxygen needed for CLC systems.
Table 3-3 Comparison of ΔHr for NiO and O2 as applied to CLC at 800oC using previously described syngas
Oxygen Carrier ΔHr
(kJ/mol) ΔHr, NiO/ΔHr, O2
O2 -254.5 1.0 NiO -254.6* 1.0
*Considers the sum of ΔHr from both air and fuel reactors Detailed studies on the conversion of other major looping materials based on their reactivities (e.g., CuO-, Mn2O3-, and Fe2O3-based looping materials) and preparation methods have been
21

performed by several authors (Ishida et al. 1998; Mattisson et al., 2001, 2004, 2005) in the literature. The occurrence of unwanted side reactions has been considered. The side-reactions theorized to occur within a CLC system include (Ishida et al., 1998; Jin and Ishida, 2004): CO + H2O → CO2 + H2 [3-6] CO + 3H2 → CH4 + H2O [3-7] CH4 + 4NiO → CO2 + 2H2O + 4Ni [3-8] CH4 → C + 2H2 [3-9] 2CO → C + CO2 [3-10] Reactions [3-6] and [3-7] are shift and methanation reactions, respectively. Jin and Ishida (2004) have actually confirmed the presence of CH4 in the flue gas of a simulated CLC reactor in which only coal-based syngas was introduced, which justifies the possibility of Reaction [3-7] occurring. The methane produced via Reaction [3-7] can then either react with the metal oxide to form more H2O and CO2 (Reaction [3-8]) or dissociate into C (coke) and H2 (Reaction [3-9]). Furthermore, the CO could potentially dissociate into C and CO2 (Reaction [3-10]). These last two reactions ([3-9] and [3-10]) represent carbon deposition, which is the deposit of carbon onto the looping material. This carbon deposition trend has been confirmed through similar experiments by Ishida et al. (1998) using a thermogravimetric analyzer (TGA) in which a weight gain of the looping material was observed. The deposited carbon is problematic when it is looped to the air reactor where it can react with incoming O2 to form CO2 and consequently decrease reactivity. Jin and Ishida (2004) have confirmed the presence of CO2 during oxidation as a consequence of carbon deposition even though CO2 was not an original input gas. Thermodynamic analysis of the CH4/NiO system over 700-1200oC predicts carbon deposition to be inhibited as long as over 25% excess oxygen needed for complete oxidation of CH4 is supplied via the metal oxide carrier (Mattisson et al., 2006). Ishida et al. (1998) and Jin and Ishida (2004) also found that carbon deposition was avoided when H2O was added to the fuel reactor so that the ratio of H2O to CO is above 0.5. Ultimately the rate of solids circulation must allow the metal oxide particle sufficient time to react with the fuel yet keep it from lingering in the fuel reactor too long to prevent these side reactions from occurring.
3.3.2 Kinetics
Ultimately the kinetics associated with the metal oxide particle when reacted with the fuel affects the oxidation-reduction reaction times. The residence time needed for the metal oxide particles within the proposed reactors can also be affected by the kinetics (discussed in Section 3.4). Therefore, a brief look into the parameters (e.g., metal oxide particle size, temperature within the reactors, and pressure within the reactors) that can affect the kinetics of CLC is presented.
22

3.3.2.1 Particle Size Influence
The size of the particles used in the reactor has effect on the conversion achieved and also on practical issues of dust formation and material replenishment. It can be intuitively predicted that smaller, powder forms of material offer the highest conversion (higher surface/volume) but have a higher tendency to be swept out of the fluidized reactor. This was confirmed by comparing the studies of Garcia-Labiano et al. (2006) who reported times for complete conversion an order of magnitude less than the conversion times of Jin and Ishida (2004) for CO oxidation using NiO (active oxide) particles 0.7 mm diameter and 1.5 mm size respectively. These experiments were conducted at similar pressure, temperature conditions in thermogravimetric analyzers. Hence, the particle sizes reported to have good conversions and optimum fluidization are in the range of 0.2-0.7 mm (Kronberger et al., 2005).
3.3.2.2 Temperature Influence
An increase in the reactor temperatures leads to an increase in the oxidation-reduction rates. Cho et al. (2006) have investigated the onset defluidization conditions in fluidized bed reactors (fluidized bed reactors are further explained in Section 3.4) due to agglomeration of the oxygen carrier particles. Based on laboratory scale fluidization testing, they report that agglomeration of Ni-based carriers can be linked to high temperature sintering. Particles sintered above 1600oC during their preparation show quick agglomeration in fluidized beds at approximately 950oC. However, the NiO/NiAl2O4 particle used in this study should not show signs of agglomeration because its sintering temperature during preparation is only 1300oC. Particle preparation methods and operating temperature can be modified to reduce agglomeration.
3.3.2.3 Pressure Influence
Pressurized reactors have been proposed recently as a strategy to reduce reactor sizes for CLC-based power generation systems (Garcia-Labiano et al., 2006; Jin and Ishida, 2004; Wolf et al., 2005). The pressurized TGA studies by Garcia-Labiano et al. (2006) considered the effect of total system pressure on the reaction kinetics in reduction-oxidation conditions. Their findings show a consistent small decrease in reactivity with increasing pressure for both reduction-oxidation reactions when using the NiO/NiAl2O3 particle. Reasoning behind this trend may be attributed to a change in the internal structure (e.g., grain size) of the looping material with varying operating pressures. However, previous studies by Jin and Ishida (2004) using an elevated pressure fixed-bed reactor to compare reactivities of coal-based syngas and CH4 essentially conflict the findings of Garcia-Labiano et al. (2006) and actually claim higher pressures increased reactivity for the oxidation reactions. Thus further studies on the effect of varying pressures on reaction kinetics in the two reactors are needed. Nevertheless, both research groups found that carbon deposition is enhanced at higher pressures (Garcia-Labiano et al., 2006; Jin and Ishida, 2004), which can be further understood on a fundamental level using Le Chatelier’s Principle. In general, based on the side-reactions occurring, the higher pressure would shift Reaction [3-7] to the right towards formation of CH4. Higher pressures would also promote the formation of coke in Reaction [3-10]. A kinetic consequence of these side-reactions occurring is the theoretical reduction in overall oxygen capacity because of the formation of CO2 in the air reactor, which would inevitably increase the time needed for conversion. Garcia-Labiano et al. (2006) also make certain predictions for sulfur containing streams of fuel gas
23

regarding competitive formation of nickel sulfides. Sulfide formation shows high dependence on the pressure of the system.
3.3.2.4 Kinetics Associated with NiO/NiAl2O4
Experimental data taken from Garcia-Labiano et al. (2006) will be used to describe the kinetics associated with the NiO/NiAl2O4 particle to be used for this study. Data was collected using a pressurized TGA at varying pressures (1, 5, 10, 20, and 30 bars) and 800oC with gas streams of either H2, CO, or O2. Although this study did not formally conduct experiments using a combination of the H2 and CO gas streams (representative of a coal-based syngas), relationships between the NiO/NiAl2O4 and the syngas components are still relevant to use for this study. For instance, the reaction rate of the NiO/NiAl2O3 with H2 was always higher than the reaction rate with CO regardless of pressure (Garcia-Labiano et al., 2006). Therefore, the reaction rate for this particular looping material is limited by the reaction rate achieved when using CO. The pressures considered for this CLC system will be 1 bar for simplicity. At these conditions, the estimated times for nearly 100% solid conversion are approximately 0.25 minutes when 5-70% volume H2 is the reducing gas, 0.5 minutes when 5-70% volume CO is the reducing gas, and 0.5 minutes when 5-21% volume O2 is the oxidizing gas.
3.4 Reactor Design
The CLC process remained a theoretical concept for several years since it was first proposed and many studies were merely testing the reactivity and characteristics of oxide carriers using fixed bed and TGA studies (see Jin and Ishida, 2004, Lyngfelt et al., 2001 and references therein). Recently, the CLC process has been successfully demonstrated on a 10 kW scale as part of a project by a European consortium in the GRACE project (Lyngfelt and Thunman, 2005). Johansson et al. (2006) also designed and built a continuous operating laboratory-scale CLC system, which produces up to 300 Wth. Also as part of the GRACE project, conceptual costing studies have been performed in a circulating fluidized bed boiler of a 200 MWe scale (Adanez et al., 2005). Based on the several issues addressed in the previous sections the proposed CLC power generation system is formed of fluidized bed reactors and a steam cycle combination. Both the air reactor and the fuel reactor are chosen to be cylindrical reactors for simplicity. The air reactor usually has slighly faster conversion rates than the fuel reactor (Lyngfelt et al., 2001). This implies that the reactor height in the air reactor can be higher and faster velocities can be employed in the air reactor to achieve good throughput. The auxiliary power requirement of the IGCC is about 61 MWe and additional gas handling systems require about 40-50 MWe typically so it was planned to generate about 150 MWe of electrical power using the CLC system. The CLC system is also incorporated in the plant design to serve as technology demonstration unit that can be easily integrated with the existing IGCC gasifier output feeds.
3.4.1 Design Methodology
A full schematic of the system is shown in Figure 3-1 at the end of this section. In designing the system a conservative conversion efficiency of 40% (thermal-to-electric) was chosen as a starting point. This fixes thermal load required from the reactors. Based on reaction enthalpies of
24

the primary reactions occurring in the air and fuel reactors it was seen that the heat output per mole of the active looping material. The reactor dimensions and hydrodynamic conditions were then determined based on the chemical and physical properties of the chosen looping material and the thermal load required from the reactor (Kronberger et al., 2005). The thermal load and the heat of the reaction in the air reactor are used to determine the bed mass and amount of active NiO required in the reactor. The rate at which the thermal energy is produced to raise steam can be derived from the reaction kinetics. The kinetics of the slower reaction (among air and fuel reactors) determines the required minimum residence time to achieve full conversion of the oxide particle. It was determined from the studies of Garcia-Labiano et al (2006) that a minimum of about 30 seconds of residence time is required by 0.2 mm NiO-based particles in the fuel reactor. This time is the limiting rate determined by the CO-NiO reaction kinetics at pressures of up to 5 bar. Beyond a system pressure of 5 bars, the kinetics is slowed down further so those scenarios are not explored here. As explained previously (see section 3.2) the oxidizer material is chosen as NiO on an alumina support. The issue of defluidization due to particle agglomeration in the air reactor (Cho et al., 2006) is not expected to be of big concern as the operating temperature (800 ˚C) is expected to be lower than the onset of agglomeration at 950 ˚C. The steps followed in undertaking the design calculations are as following:
1) Find the electrical power to be generated using CLC power plant. This can depend on the end user need or the auxiliary power need of a larger power plant if the CLC plant were to supply the auxiliary power.
2) Find thermal power required using an approximate efficiency of thermal to electric
conversion. (~ 40% ?)
3) Using thermal power, decide how much each reactor can individually contribute to this required thermal power.
4) Also find out much bed material is needed for the amount of fuel that flows into the fuel
reactor Number of moles of metal oxide needed (per sec) = # of moles of fuel/2 (for syngas) Necessary heat transfer rate (in kW), ΔHred (kJ/mol of fuel) x # of moles of metal oxide needed per second (mol/s).
25

Figure 3-1 Schematic process diagram for the NiO/NiAl O4 chemical-looping power generation system2
3.4.2. Other Assumptions in the Design
Complete solids conversion is assumed to occur in both reactors within the residence time of the solids inside the reactor. The minimum residence time is determined using reaction kinetics in the fuel reactor. The difference in residence times between reactors (i.e., AR has shorted residence time than FR) could lead to a problem in the solids flow balance. However, if the air reactor is greater in height the residence time can be adjusted to obtain a uniform flow rate of solids between the two reactors. Since the heat load from the two reactors is substantially different the rate of solids entering and leaving the reactor are determined based on the thermodynamics (heat produced per mole oxide) and the minimum necessary residence time of the solids inside the reactor (100% conversion) The difference in conversion rates calls for optimum design to handle fluctuations of power demand using a minimum circulation rate of about 0.005 kg/m2.s-1 MW-1 (Kronberger et al., 2005). Based on these considerations, a residence time of approximately 30 seconds is chosen to be the optimum time for the conversion reactions of CO on NiAl2O4 (Kronberger et al., 2005). Since the reaction kinetics of CO oxidation are the limiting reactions for a syngas mixture in the CLC process (Jin and Ishida, 2004) this time should ensure near total conversion of the fuel. Some of the key issues involve solids movement and oxygen transport in CLC. The rate of solids recirculation is governed by 1) amount of oxygen that needs to be transferred from the air reactor, and 2) the amount of heat that needs to be transferred to keep the fuel reactor at a constant temperature. The very important kinetic issue to be considered for the NiO system is that of prevention of carbon formation (Mattisson et al., 2006) which depends on the oxygen availability in the fuel reactor.
26

The rate of solids circulation and the oxygen availability will play a key role in the prevention of solids deposition on the spent metal particles in the fuel reactor. Hence a 25% excess of metal oxide particles in the reaction zones of the fuel reactor will be used to limit carbon formation in the fuel reactor. This consideration adds a large bulk to the bed mass. However, this seems to be the most viable solution at present. Figure 3.1 shows a schematic of the CLC system along with some process conditions and illustrated flow rates for a system running to produce 375 MWth power. Table 3-5 shows the preliminary design parameters of the CLC power generation system. These are preliminary design parameters to plan a conceptual system to provide the thermal load.
Table 3-5 Design parameters of CLC system
Parameter Value
Power Output 150 MWe
Thermal Input 375 MWth
Carrier particle size 0.2 mm
Bulk density 2400 kg/m3
Oxygen Carrier NiO/NiAl2O4 (active oxide 40% wt)
Bed inventory (AR) 8700 kg
Bed inventory (FR) 11400 kg
Circulation rate of solids 4.2 kg/s
Fuel gas flow rate ~ 1kg/s in FR
Reactor Dimensions AR FR
4 m (diameter) x 25 m 3 m (diameter) x 8 m
AR: Air reactor; FR: Fuel reactor The bed inventory shown in Table 3-5 reflects the mass of the composite looping material particles based on a 40:60 ratio of active to binder particles. Another consideration not addressed in detail currently include those of particle life (i..e., attrition and subsequent elutriation). Based on 300 hour batch studies of Adanez et al. (2005) it has been shown that the particles could have a life of about 4000 h prior to being blown away from the system. Furthermore steam cycle calculations and heat exchanger calculations would be based on Rankine cycle calculations provided (Similar to that in Appendix H for IGCC). The particle transport from fuel reactor to the air reactor is by pneumatic conveyance. However the particle transport from AR to FR is gravity driven.
27
3.5 Design Summary
In summary, the CLC reactor design is proposed as a conceptual design to evaluate indirect combustion technology which achieves higher efficiency (than conventional combustion). However, several issues need to be analyzed in detail especially with respect to the scaling-up process and the mechanical ageing of the looping materials before successful implementation can be achieved. Since chemical-looping shows promise for the future especially with respect to inherent CO2 separation it has been included in the project design scenario.
3.6 Environmental Issues
A major issue with all power generating sources is the concern over the release of harmful emissions and/or solid chemicals to the atmosphere. Both environmental issues as applied to CLC systems will be discussed in this section. While the focus of this research is primarily on the capture of CO2, the potential for other emissions (e.g., NOx, SOx) from a CLC process must be established. It is often the incomplete conversion of fuels that leads to the release of combustible matter into the atmosphere, which must be environmentally regulated. Higher reactor temperatures (>1200oC) can also increase the production of these harmful emissions (Ishida et al., 2005; Lyngfelt et al., 2001). Even with incomplete conversion of fuel in a CLC process, the generalized results using circulating fluidized bed reactors in the Lyngfelt et al. (2001) study indicate that there is no threat of releasing combustible matter to the atmosphere. This is based on the fact that the air input for the air reactor does not contain combustibles, and there is no gas being emitted from the fuel reactor because after the H2O and CO2 have been condensed any remaining combustible gases will be recirculated back into the fuel reactor. The formation of NOx is also nil since reaction temperatures are less than 1200oC (Ishida and Jin, 1996). However, the looping materials may contribute to harmful emissions during a CLC process. Regarding this study, Ni-based compounds are listed as hazardous air pollutants by the EPA and are considered one of the greatest chemical threats to public health (EPA, 2005). Therefore, any disposal of the looping materials must be environmentally regulated. Installing filters to reduce any metal particle fragments from unintentionally exiting with the outlet gases of either reactor is encouraged. It is more of an environmental concern when the looping materials are eventually replaced to maintain good reactivity within each reactor that they may be introduced to the environmental surroundings (Lyngfelt et al., 2001). Therefore, using environmentally sound, or non-toxic, looping materials will be important when proposing large-scale CLC systems. The question of releasing the exhausted looping materials into the environment or treating them has not been considered in the literature but must be considered since there are some potential environmental concerns associated with the Ni-based looping materials. Research associated with this area is suggested.
28

Chapter 4: CO2 Transportation, Safety and Public Perception Commercialization of CO2 capture from power plants and its subsequent storage or utilization calls for an infrastructure for the transportation, legal frame work and acceptance by the public. Most of the research on CO2 capture and storage deals with capture technologies and their storage possibilities in Enhanced Oil Recovery (EOR) applications (Svensson et al., 2005). The CO2 captured from a power plant represents a large volume, low value byproduct that cannot be disposed as most coal utilization wastes are disposed.
4.1 Transportation and Safety Issues
CO2 is a non toxic gas but can be fatal at concentrations exceeding 10 Vol% as it is heavier than air and tends to accumulate in depressions thus posing a threat of asphyxiation. The public, especially local people where source of CO2 or CO2 storages are located at, become anxious regardless of situation. The statistics from the EOR industry indicate that the risks for leakage in CO2 pipelines are lower than that of natural gas pipelines but nevertheless should be route away from large centers of population (Gale and Davidson, 2002). Further details concerning gas transportation can be found in Appendix I. Risky facilities bother people around it with explosion, pollution, waste transfer and storage risks. Power plants are one of those facilities with their dangerous fuels, pollutant flue gases and high pressured storages. For a coal-fired IGCC as in our specific situation coal as a fuel source bears pollution risk for the environment and captured CO2 becomes another problem with its storage in facility and its highly pressurized transfer pipelines.
4.2 Public Perception
The public perception concerning the storage of CO2 is another major issue which can indirectly affect the transportation. The onshore storage is believed to face difficulties with acceptance from the public who may be open to the idea of onshore storage but not anywhere near their neighborhoods. The public may support the offshore storage on the basis of leakage. The only advantage of having an onshore site is the location near the emission source. Also, economically, offshore disposal requires a complex and costly logistic infrastructure with more expensive disposal facilities (Svensson et al., 2004). Public gets sensitive due to lack of information and education in such cases. Protests, boycotts and rejections are getting solid defense of people and receive significant attention. Consequently some power plants can end up with getting closed. Even though there are not enough studies that have been done on these issues, some of them give significant information about how people consider the problem and what the solution could be. According to previous studies and questionnaires; answers those are given by public pointed that people do know the necessity of power plants, global warming issue, and accept them with risks but not in their back yard. Reason is usually so clear; risks those power plant bear. On the other hand they do not know how those risks are eliminated or can be eliminated technically. Education is in the heart of problem. Informative meetings to acquaint people with general and technical issues and precautions those are already maintained must be the starting point. Maintained safety in every step of power plant
29

is a proof of guarantee that company provides and makes people confident about what the risks are and how they are eliminated. Especially for such a power plant where CO2 captured, it would be good to talk about how this can help with daily life and especially about global warming. If people do not have sufficient information about some thing, then they believe trusted agencies and their reports. This way can be another solution for public education since it is not easy to explain all technical aspects to people on the street. Associating with a trusted company and having a report saying that power plant meets all safety regulations can help to negotiate with public.
30

Chapter 5: Project Summary
5.1 Conclusions
The overall synthesis of this project resulted in the recommendation of a CO2 capture enabled power plant that is directed towards a futuristic hydrogen based power generation system. The primary power generation source was an integrated combined gasification plant. Coal was used as the gasification feedstock for producing a hydrogen-rich fuel stream that is fired in a gas turbine. The current design operates on combined cycle technology (components: gasifiers, gas turbines, HRSG’s and steam turbines) and incorporates advanced H2/CO2 separation systems (i.e., Pd-based separation membranes), which can recover nearly 100% of the CO2 generated from the 500 MWe IGCC power plant. The efficiency of power generation of the proposed system with CO2 capture is approximately 35%, which is comparable to existing plants without CO2 capture (~34%). The preliminary findings however do not take into account the full penalties or benefits of particle cleanup and heat exchanger operations. It is also noted that the large amount of CO (~12.5% v/v) present in the flue gas is a problem. This CO is a valuable energy source that can be recovered and is also a toxic gas. Evaluation of new technologies complementary to gasification-based technologies seems to be the direction of coal utilization in the future. In this respect CLC technology to complement IGCC was considered. CLC systems have been projected to have higher efficiencies than IGCC with CO2 capture (Nsakala et al., 2001). Hence an integration of CLC with IGCC can slightly improve system efficiency by approximately 0.3%.
5.2 Recommendations for Future Work
There is a lot of scope for improvement on the present design that considered 100% CO2 capture. However, more efficient power generation can be achieved by modifying the design for a lower percentage of CO2 capture. Different scenarios could include reduction in clean-up penalties by direct combustion the syngas in oxy-fired gas turbines. Use of syngas in advanced fuel cell technologies such as SOFC systems also show promise for efficiency improvements. The hydrogen-rich streams obtained with Pd-based membranes can also be used in the emerging marketplace for fuel cell applications, which adds to the flexibility of the IGCC plant. It is also noted that preliminary calculations predict an IGCC system with post-combustion absorption systems might yield better efficiencies than pre-combustion separations. The unused CO in the flue gas stream presents a valuable energy resource that is currently being lost. The energy from CO can either be recovered in a catalytic burner or the initial CO production can be lowered. Possible ways to reduce CO amounts from the WGS include: 1) increasing steam ratios; or 2) reducing the reaction temperature. Another possible approach is to use a water-gas-shift membrane reactor (Huang et al., 2005), which can replace the Pd-based membrane considered for our design.
31

APPENDICES
32

Appendix A: Membranes used in Pre-Combustion to Capture CO2
Membranes have become an established technology for CO2 removal since their first use in this application in 1981 (Dortmundt and Doshi, 1999). It has some advantages and is becoming a preference of industries especially when the users have large flows, large CO2 content and are in remote distance.
A.1 Introduction
Polymers, like cellulose acetate, were first used as membranes for gas separation (Li et al., 2004), but have so far not been an alternative for facilitating CO2 capture in large-scale power production. The main problems that limit the use of cellulose acetate are:1) insufficient performance in terms of selectivity and flux; 2) they cannot be integrated very well into the power generation process due to a lack of high-temperature stability (Bredesen et al., 2004), and 3) in some cases, high CO2 partial pressures plasticize polymer membranes and thus decrease their separation ability (Li et al., 2004). At present, most focus is either on the development of inorganic membranes for CO2 separation, or on the high-performance CO2-selectivity polymeric membranes (Bredesen et al., 2004).
A.1.1 Classification of Membranes
Although the first commercial membrane was made by polymer, many people are currently working on inorganic membranes due to the instability of most polymers in high temperature and high pressure. There are two main kinds of inorganic membranes: dense Palladium-based (Pd-based) membranes and microporous inorganic membranes. Dense Pd-based membrane can only be used to purify H2, while microporous inorganic membranes can be used in different kinds of gas separation by adjusting the pore size (Armor, 1998).
A.1.2 Permeability and Selectivity
Permeability and selectivity are both important parameters for evaluating membrane performance. Permeability is defined as the amount of flux passing though the unit area in unit time under unit pressure. The typical unit of permeability is barrer, which is defined as (Gugliuzza and Drioli, 2005):
1023 10)]/()([1 −×⋅⋅= cmHgscmSTPcmbarrer [A-1]
The ratio of the permeability of two kinds of gases in the stream is defined as selectivity. For CO2 separation, the selectivity is usually calculated as the ratio of the permeability of CO2 to other compounds. Therefore, the higher the permeability, the less membrane area is required. The higher the selectivity, the lower the losses of hydrocarbons or hydrogen will be when removing CO2. The selectivity ijα between two different gases ( and i j ) should be expressed as ration between the respective permeability:
33

j
iij P
P=α [A-2]
A.1.3 Principle of Membranes
The principles of those three kinds of membranes (i.e., polymer, Pd-based and microporous) are discriminating. The details for the principles of each system follow.
A.1.3.1 Solution-Diffusion
The removal of CO2 with polymer membranes operates on the principle of solution-diffusion. The CO2 first dissolves into the membrane and then diffuses through it. As different gases permeate in different velocities (Corti et al., 2004), they will be separated. Due to Fick’s Law, the product of the solubility coefficient and a diffusion coefficient determines the rate of permeation. Based on these statements, the permeability for gas i on polymer membrane is:
, where stands for diffusivity and stands for solubility. Then the selectivity, DSP = D S ijα , should be expressed as:
⎟⎟⎠
⎞⎜⎜⎝
⎛⎟⎟⎠
⎞⎜⎜⎝
⎛=
j
i
j
iij S
SDD
α [A-3]
A.1.3.2 Diffusion-Splitting
The H2 separating capability of Pd alloy membranes is well known for such applications as hydrogenation and dehydrogenation reactions and recovery of H2 from petrochemical plant streams. Recently, there has been interest in utilization of Pd membranes to separate H2 produced from both hydrocarbon reforming and coal gasification for power generation in fuel cells (Roa et al., 2003). The transport of H2 through Pd-based membranes may be divided into a series of different stages (Bredesen et al., 2004): 1. Diffusion of hydrogen to the metal surface on the feed side of the membrane. 2. Adsorption of hydrogen on the surface. 3. Split of hydrogen molecules and incorporation into the metal. 4. Diffusion of protons in the lattice and of electrons in the electron bands. 5. Regeneration of hydrogen molecules on the permeate side surface. 6. Desorption of the hydrogen molecule. 7. Diffusion of the H2 molecule from the surface, assuming a porous support.
A.1.3.3 Diffusion
The principle of inorganic membranes is governed by gas diffusion. The details of the related theories can be found in the membrane part of post-combustion.
34

A.2 Details about Different Membranes
In this part, some important data and results of people’s work on the three different membranes shown above are going to be shown and compared. Also the effects of some parameters, like temperature and pressure, will be discussed.
A.2.1 Dense Pd-Based Membranes
Based on the principle introduced before, Pd is well known for dissociation of H2, but in practice, Pd-based alloys are preferred choices over pure Pd. Several metals, particularly the refractory group V metals (Buxbaum and Kinney, 1996), have higher permeability for hydrogen than Pd, but they are unstable in most atmospheres since they can be easily oxidized or carburized (Bredesen et al., 2004). The refractory metals also have a tendency to become brittle on hydrogen dissolution (Buxbaum and Kinney, 1996). Due to these problems, currently a rather thick Pd alloy layer (~ 40μm) is used in commercially available composite membranes with refractory metal support. Moreover, adding some metal like copper to pure Pd can not only help eliminate warping and cracking, but also make the alloy cheaper, resistant to H2S and stable in dimension (Ishteiwy, 2005). Flux values of some reported Pd-based membranes are shown in Table A-1 (Bredesen et al., 2004).
Table A-1 Properties of some reported Pd-based membranes
Membrane Support Thickness (µm)
ΔP (bar)
T (oC)
H2 Permeability (barrer) Reference
Pd/Ag None 1000 3.4 500 1.20E+7 Bredesen et al., 2004 Pd/Y None 1000 3.4 500 1.97E+7 Bredesen et al., 2004
Pd None 40 0.775 300 2.54E+7 Moss et al., 1998 Pd Al2O3 anodic 4 ~0 200 2.75E+7 Itoh et al., 2000 Pd Glass tube 13 2 500 2.78E+7 Bredesen et al., 2004 Pd Al2O3 11.4 6.9 550 2.99E+7 Collins and Way, 1993 Pd Al2O3 anodic 4 ~0 350 5.97E+7 Itoh et al., 2000 Pd Al2O3 1.3 1.45 600 6.87E+7 Bredesen et al., 2004
Pd+V+Pd V 0.5/40/0.5 0.53 300 4.18E+8 Moss et al., 1998 Pd Stainless steel 0.5 N/A 450 5.23E+8 Jun and Lee, 1999
Pd/Ni Stainless steel 1 N/A 550 5.88E+8 Nam et al., 1999 Although the performance of Pd-based membrane is very good, the cost of it is high. It was found that a cost of US$ 10,000/m2 was acceptable (Bredesen et al., 2004), but the price is still hundreds of times compared to other kinds of membranes.
A.2.2 Microporous Inorganic Membranes
Microporous inorganic membranes with pore size between 0.2 and 0.8nm have been studied for gas separation due to their superior thermal, mechanical and chemical stability, good erosion resistance, and high pressure stability compared to conventional polymeric membranes (Li et al.,
35

2004). Microporous silica (Tsai et al., 1999), carbon molecular sieves (Vu et al., 2002), and zeolite membranes (Kusakabe et al., 1997), have been shown to separate CO2 from CH4. Some performance data of inorganic membranes are shown in Table A-2.
Table A-2 Properties of some reported inorganic membranes
Membrane material and preparation Membrane performance
Support material Membrane Preparation
method
Preparation temperature
(oC)
Pore diameter
(A) T
(oC) P
(bar) Permeability
(barrer) Selectivity
α/γ-Al2O3
a SiO2 Sol-gel 400 300 P(H2)=4.03E+7 P(CO2)=3.25E+6
S(H2/CO2)=12.4 S(CH4/CO2)=12.8
γ-Al2O3 b SiO2 Sol-gel 500 50/10/3 500 6.5 P(CO2)=3.0E+6 S(CO2/CH4)=200-600
Al2O3 c PI/PVP pyrolysis 550-700 <5 25 1.01 P(O2)=630/230 S(O2/N2)=10/14
Product from Carbon Membrane Ltd. d 3-5 50 5 P(CO2)=2.0E+4 P(N2)=1.33E+4
S(CO2/N2)=15 S(O2/N2)=3.0
Stainless steel/α- Al2O3
eSAPO-34 crystallization 2.8-4.4 25 7 P(CO2)=4.78E+6 S(CO2/CH4)=67
a: Bredesen et al., 2004; b: Tsai et al., 1999; c: Kim et al., 2004; d: Lagorsse et al., 2004; e: Li et al., 2004 PI: polyimide PVP: polyvinylpyrrolidone The microporous inorganic membranes are attractive because they offer very high selectivity and productivity and have advantage in high-temperature, high-pressure and erosive-environment applications.
A.2.3 High-Performance Polymeric Membranes
To obtain membranes that combine high permeability and high selectivity together with thermal stability, new polymers (i.e., high-performance polymers) were developed. These include polyimide (PI), poly(phenyl oxide) (PPO), poly(trimethylsilylpropyne) (PTMSP), and polytriazole (Barsema et al., 2004). Table A-3 shows some performance data of high-performance polymeric membranes.
36

Table A-3 Performance of some polymer membranes
Membrane material
Temperature (oC)
Feed Pressure
(bar)
Permeability (barrer) Selectivity Reference
Pebax® 2533 25 0.92 P(H2O)=20.33 S(H2O/CO2)=6.8 Gugliuzza and Drioli, 2005
PDMS 40 10.13 P(CH4)=940
P(CO2)=3200 P(H2)=500
S(CO2/CH4)=3.4 S(CO2/H2)=6.4 Corti et al., 2004
PEBAX N/A N/A P(CH4)=7.2 P(CO2)=117
P(H2)=13
S(CO2/CH4)=16.25 S(CO2/H2)=9.0 Corti et al., 2004
Matrimid/PES 25 3.5-17.2 P(O2)=2.2E+4
P(CO2)=1.0E+5 P(CH4)=2.2E+3
S(O2/N2)=4 S(`CO2/CH4)=45 Jiang et al., 2004
PPOP 30 2.1 P(O2)=2.1
P(CO2)=4.8 P(CH4)=1.2
S(O2/N2)=1.6 S(`CO2/CH4)=4 Orme et al., 2004
PTBP 30 2.1 P(O2)=8.2 P(CO2)=17 P(CH4)=1.7
S(O2/N2)=3.4 S(`CO2/CH4)=10 Orme et al., 2004
PDTBP 30 2.1 P(O2)=11
P(CO2)=27 P(CH4)=5
S(O2/N2)=3.7 S(`CO2/CH4)=5.4 Orme et al., 2004
Heat-treated matrimid 20 2
P(O2)=1.6-40.2 P(CO2)=7.37-190 P(N2)=0.20-8.74
S(O2/N2)=8.20-4.60
S(CO2/N2)=39.93-21.75
Barsema et al., 2004
PDMS: polydimethylsiloxane PEBAX: poly(ethylene oxide-b-amide6) PES: polyethersulfone PPOP: poly[bis-(phenoxy)phosphazene] PTBP: poly[bis-(tert-butylphenoxy)phosphazene]
37

A.3 Pd-Based Membrane in IGCC
After critical literature analyses that compared reforming and gasification technologies, gasification to produce hydrogen for expansion in a gas turbine was chosen as the primary source of power generation. The benefit of gasification compared to reforming is that coal is less expensive and more abundant than natural gas as recourse of fuel. Moreover, the energy efficiency is almost the same for these two processes. Incorporating the Pd-based membrane in IGCC should be outstanding in CO2/H2 separation. Based on the discussions in the previous paragraphs, Table A-4 compares the performance of the three mentioned membranes when used for CO2/H2 separation.
Table A-4 Comparison of performance of different membranes
Membrane Application Permeability Selectivity Issues
Pd-based H2 purification High (107) Very high Cost, Stability
Microporous inorganic
Any separation with different pore sizes
Reasonable (104~106)
Reasonable (101~102)
Desorption
Polymeric Most separation with different solubility & diffusion
Low (102~104)
Low (100~101)
Stability, Performance
Regardless of the cost issue, Pd-based membranes will be used in the IGCC system due to its high permeability and selectivity.
A.3.1 Energy consumption The energy consumption of the membrane can be calculated based on the previous determinations. The main energy consuming component is the compressor used to increase feed pressure. Since the power consumed provided for compressor can be calculated as (Larminie and Dicks, 2002):
mppT
cPin
out
c
inp &⋅
⎟⎟⎟
⎠
⎞
⎜⎜⎜
⎝
⎛−⎟⎟
⎠
⎞⎜⎜⎝
⎛=
−
1
1γ
γ
η [A-4]
where is the temperature of feed gas; and are pressures of feed gas and outlet gas, respectively;
inT outp inp
Vp cc /=γ ; is flow rate; and m& cη is the efficiency of the compressor. The following assumptions are made for the calculation:
1. A single stage configuration will be used where the compressor is the only part consuming energy
38

2. The V+Pd+V membrane shown in Table A-1 is going to be used, so: ,
, . KTout 573=
barPout 53.1= barPin 1=
3. 6.0=cη (Larminie and Dicks, 2002), 3.1=γ (assume that the gas is CO2/H2 mixture with the ratio of 1:2)
Then we can first get the relationship between and such that . Therefore,
, then the power consumed by compressor can be calculated: 159kJ/kg COinT outT inout TT 17.1=
KTin 490≈ 2. However, the reaction pressure of WGS is much higher than the ambient pressure, which means after WGS the compressor is not necessary for the Pd-based membrane, and therefore the energy consumption by the membrane will not be considered when combined in IGCC system.
A.3.2 Cost of Pd-Based Membrane
The membrane cost and performance that can be tolerated depends on the actual process, however, it has been suggested that a cost of about €500-1000/m2 installed surface area would open for broad use of membrane reactors (Tennison, 2000). It may be noticed that compared to such a price, the materials cost of Pd-40%Cu is about $0.71 for a 25cm long, 2μm thick film (Ishteiwy, 2005). Furthermore, Pd-based composite membranes have material characteristics that facilitate recycling (both Pd material and support) which could give a cost reduction (Bredesen et al., 2004).
A.3.3 Stability of Pd-based membrane
The need for a thin Pd alloy layer on a support structure has created a membrane instability problem. This complex problem usually involves:
1. Instability of the membrane layer-support interface: Stress generated due to the badly matching thermal expansion coefficients, as well as the volume change of the membrane in contact with hydrogen, may cause stability problems as loss of attachment, flaking-off and cracking (Bredesen et al., 2004).
2. Instability of the Pd alloy membrane microstructure: Microstructure related effects on the
performance of very thin membranes appear not to be well understood currently. It is suggested that further investigations of the microstructural stability with respect to several factors as alloy composition, thermal history, preparation method, in addition to the effects of support and ambient pressure are needed (Bredesen et al., 2004).
3. Reactions with the ambient atmosphere: Pd alloys may react with components of the ambient gas atmosphere resulting in reduced permeability or even lead to complete
39

deterioration of the membrane. Membrane properties can usually be regained by thermal and gas treatments (Ali et al., 1994).
40

Appendix B: Post-Combustion Membrane Separation In the last 20 years, great progress has been made in the separation of gases by membrane technology. Although still at an early stage, this technology has been successfully tested in various industrial processes (eg., air separation, hydrogen recycling and natural gas purification, hydrogen recycling and natural gas purification). Membranes offer several advantages such as small size, simplicity of operation and maintenance and compatibility. The application of polymer membranes for the recovery of CO2 from flue gas of a power plant has been examined by Van Der Sluijs et al. (1992) and Feron et al. (1992). Their results showed that considerable CO2 removal (up to 76%) could be achieved, and the economical competitiveness of the process depends on the selectivity of the polymer materials. In recent studies (Langeland and Wilhelmsen 1993; Gottlicher and Pruschek, 1997), various CO2 capture technologies have been examined, showing that present state of the art polymer membranes are less expensive and energy demanding than MEA absorption, cryogenics and TSA processes. On the other hand, they are less competitive to selexol absorption and PSA, especially in terms of final CO2 purity. However, membrane technology has significant environmental benefits, since its application does not result in pollutant by-products, such as spent solutions and solids, requiring further treatment and disposal. Adsorption and solvent absorption will be discussed in detail in Appendix F and G.
B.1 Membrane Types
Membrane types can be classified into four types that have been used for gas separation: organic membranes, inorganic membranes, polymer membranes and composite membranes. Each of them has its own advantages and the selectivity of the membrane depend upon the kind of material that is used. They all follow the concept of difference in pressure as the driving force for separation and the temperature dependence will vary with the kind of membrane that is been used.
B.1.1 Gas Separation Membranes
Gas separation membranes use partial pressure as the driving force for separation, so they will be most effective at high CO2 concentrations and pressure. Differences in physical and chemical interaction between the components present in the gas mixture with the membrane material causes one component to permeate through the membrane faster than the other component. The gas component will diffuse into the membrane material and diffuse through the other side. So the membrane will divide the stream into permeate and a feed side. So ideally little recompression of the permeate side will be needed for utilization. The quality of separation is determined by membrane selectivity and by two process parameters the ratio of the permeate flow to the feed flow and the permeate pressure to the feed pressure. Depending upon the membrane selectivity and the purity of the CO2 product, large number of stages will be required. As discussed before the most attractive feature of a membrane separation process is the simplicity of the process; there is no need for the addition of chemicals or for the regeneration of any absorbent. The governing flux equation for the gas permeation is based on Fick’s Law, and
41

as can be seen, the driving force is then the difference in partial pressures over the membrane. In a simple way, the flux, J (m3(STP)/m2-h), may be expressed as qpyA = JA = PA(phxA – plyA) [B-1] where qp is volume of the permeating gas (m3(STP)/h), PA is permeability of gas component A (m3(STP)m/m2-h-bar), l is thickness of the membrane (m), ph and pl is pressure on the feed and permeate sides [bar], xA and yA are fractions of component A on the feed and permeate sides, respectively, and A (m2) is the required membrane permeation area. The permeability, P, is also expressed as the product of diffusion, D (m2/s), and solubility, S (m3(STP)/m3-bar), coefficients for the gas in the membrane material. P = DS [B-2] Both coefficients are temperature-dependent and may be expressed by Arrhenius types of equations [Equations E-3 and E-4]. In general, the diffusion will increase with temperature and the solubility will decrease. D = Do e(-Ed/RT) [B-3] S = So e(ΔHs/RT) [B-4] where D0 and S0 are temperature-independent constants, Ed is the activation energy for diffusion (J/mol), ΔHs is the heat of solution (J/mol), R is the gas constant, and T is the temperature (K). Depending on the type of membrane material and type of gas component, the relative effect of the temperature will vary; details about this may be found in the literature on transport mechanisms. Separation factor, α, of a membrane is defined as the ratio between the pure gas permeabilities, P α = PA/PB [B-5] Different gas transport mechanisms govern membrane separation. Most of the commercial membranes for gas separation are based on the solution diffusion mechanism through a dense polymeric membrane. As can be seen from the flux will greatly depend on the thickness of the membrane and the difference in partial pressures. The required membrane area for permeation is inversely proportional to the flux and directly proportional to the volume of the gas; hence, in order to be an economically viable choice in combination with the power plant, the driving force, the flux, and the selectivity of CO2 need to be enhanced by optimizing these factors
B.1.2 Gas Absorption Membranes Gas absorption membranes are used as contacting devices between a gas flow and a liquid flow. The presence of an absorption liquid on one side of the membrane selectively removes certain components from a gas stream on the other side of the membrane. In effect the absorption liquid increases the driving force across the membrane because the partial pressure of the absorbed
42

gases on the liquid side is essentially zero. It is not necessary that the membrane should have a high selectivity here as the purpose of the membrane is solely to provide a contacting area without mixing the gas and the absorption liquid. The selectivity of the process is derived from the liquid.
B.1.3 Inorganic Membranes
Inorganic membranes have been widely studied for separation of gases at higher temperatures for the past couple of years and they have been investigated for CO2 and N2 separation also. The transport of gases through these membranes can occur by laminar diffusion, Knudsen diffusion and surface diffusion. The permeability of the membrane taking into account all three mechanisms is
⎟⎠⎞
⎜⎝⎛+⎟
⎠⎞
⎜⎝⎛+=
dPdx
NrADs
MRT
RTLrP
RTrF s
avoo
εμπ
εμηεμ 28
38
5.02
[B-6]
where ε is porosity, μ is shape factor, r is mean pore radius, R is the gas constant, T is temperature, L is thickness of membrane, P is mean pressure, η is viscosity of gas, M is molar mass of gas, Ao is surface area occupied by an adsorbed molecule, Nav is Avagadro’s number, xs is percentage of occupied surface compared with a monolayer If the pores in a membrane are small and defects are less then the first term, the laminar term can be considered negligible. The second term represents the Knudsen diffusion which occurs when the free path of the molecule is much larger than the mean pore radius of the medium. Gases can be separated by Knudsen diffusion due to the differences in molecular weight, so this separation might be valid for separating light gases like He and H2 from heavier ones. However in the case of gases whose molecular weights are nearly equal, another separation mechanism should be employed to obtain high separation factors. Separation factor can be improved by introducing an interaction between one component of the gas mixture and the pore wall by chemical modification. If the adsorbed gases are mobile on the pore surface, it will diffuse along the surface concentration gradient. This flow is called the surface diffusion flow and is represented sby the surface concentration gradient which is the third term in the above equation. When the pore size decreases the surface diffusion term becomes more important. But in some cases higher separation factor was not obtained by surface diffusion at higher temperatures.
B.1.4 Composite Membranes
Asymmetric and/or composite membranes comprising a thin skin layer supported on a microporous substrate are often used in order to achieve a high permeation flux. In addition, among the various designs of membrane modules, hollow fibers are preferred because of their high packing density and self-supporting characteristics. These are especially useful for treating a large volume of gas streams. A few hollow fiber membranes have been studied that involved the separation of CO2 from a gas stream. Kim and Hagg investigated the feasibility of separating CO2 from N2 using integral asymmetric cellulose acetate-based hollow fiber membranes for nitrogen generation from combustion exhaust gas (Kim and Hagg, 2004) and a full-scale module comprised of several hundred thousand hollow fibers was also tested using simulated flue gas.
43

44
Sada et al. (Geankoplis, 2003) evaluated the performance of CO2 separation from air with asymmetric cellulose triacetate hollow fiber membranes that had an ideal separation factor of 21-24 for CO2/N2 at 30 °C. The separation of ternary gas mixtures (CO2, O2, and N2) by polysulfone hollow fiber membranes was studied with single and multiple membrane modules. Molecular sieves have been used for separating gas mixtures in various industrial applications. But for CO2 and N2 separation molecular sieves without chemical modification won’t work as the molecular diameters are close as explained before. So chemical modification of the membrane has been done, in one case molecular sieve modified polyethylenimine has been used to separate CO2 from the flue gas of natural gas fired power plant. Surface functionalization of the pore wall using aminosilane has been employed by RITE, Japan, although they have obtained a good selectivity, the conditions of the separation process weren’t disclosed. Cardo polyimide having zwitterions was modified in the chemical structure for good CO2 separation properties. The asymmetric hollow fiber membrane of the cardo polyimide shows the largest CO2 permeance among existing asymmetric membranes and the top level of CO₂ selectivity in various polymeric membranes. A module of the membrane can recover CO2 from an exhausted gas of 25% CO2 concentration at a comparable expense to amine solution by a system involving CO2 liquefaction. The following table summarizes the membranes that have been developed for separating a mixture of CO2 and N2, one point to be kept in mind is that the gases treated here are not from power plants and they just represent a flue gas composition. The composition of flue gas from a power plant will have several other components which might be detrimental to the membranes.

45
Table B-1 Properties of some reported membranes for CO2/N2 separation
Membrane Temp (K)
Pressure (atm)
Comp. of gas Permeability (107 mol/Pa-s-m2)
Selectivity Remarks References
CaO-γ-Al2O3 298 1.5 15% CO2, 85% N2 21.9 0.98 Knudsen diffusion Cho et al., 1995 Silica-γ-Al2O3 298 1.5 15% CO2, 85% N2 8.2 1.4 Knudsen diffusion* Cho et al., 1995 MgO-γ-Al2O3 293 1.5 15% CO2, 85% N2 41.7 1.04 Knudsen diffusion* Uhlhorn et al.,
1988 Γ-Al2O3 293 1.5 15% CO2, 85% N2 72 0.7 Knudsen diffusion Ma et al., 1991 FeO-Al2O3 293 1.5 15% CO2, 85% N2 47 1.68 Knudsen diffusion* Ma et al., 1991 Zeolite composite 293 1.5 15% CO2, 85% N2 3.6 1.23 Knudsen diffusion* Jia et al., 1993 BaTiO3 373 0.98 10% CO2, 90% N2 2.5 Kusakabe et al.,
1995 NaY-type zeolite 313 NM 20 40 Knudsen diffusion* Kusakabe et al.,
1998 NaY-type zeolite 303 1 Equimolar mixture 21 31.2 H2O vapor decreased
permeance Gu et al., 2005
Na2CO3-glycerol 303 0.98 2% CO2 in air 25 3440 – 100 Higher selectivites at reduced feed RH, for space walk applications
Chen et al., 1999
Glycine-Na-Glycerol 303 0.98 2% CO2 in air 9710 5140 Glycine enhanced CO2 removal with moisture in feed
Chen et al., 2000
Polyelectrolyte salt blend 323 1.3 0.7 629 Faciliated transport membrane
Quinn and Laciak, 1997
plasma-grafted membrane containing ethylenediamine
323 0.98 5% 10 4700 Faciliated transport membrane
Matsuyama et al., 1994
Thin film poly(ether block amide)
NM NM 15.3% 23 Faciliated transport membrane
Liu et al., 2005
Polyethylene oxide containing and cross linked polymers
50 NM NM 510 36 Faciliated transport membrane
Hirayama et al., 1999
Cardiopolyimide polymers Around 250o C NM NM NM 1000
Faciliated transport membrane –CO2 Molecular Gate Membrane
Research Institute of Technology for Earth, Japan

B.2 Limitations with Membrane Systems for Flue Gas Treatment
1. Gases tested for separation are just a typical flue gas composition. 2. Stability of the membrane when treating flue gas will be an issue.
3. Scaling up will be another big factor as the amount of flue gas to be treated in a power
plant will be of much larger magnitude. To increase the partial pressure of CO2 in flue gas, pressurization of flue gas will be necessary which will require inter – stage cooling as to reduce the temperature because of the adiabatic compression. To increase the efficiency of the membrane system and to obtain a high purity of CO2 in the gas mixture membrane system in series will be required and for each membrane system in it inter stage compression and cooling will be required which increase the cost of processing. Membrane technology at the current stage for flue gas treatment is not as matured as the adsorption and solvent absorption process and is still in the stage of development for CO2/N2 separation. Although it’s easier to handle, at this stage it has eliminated the energy penalty needed for cooling the flue gas from the stack to 40o C, then pressurizing it again to higher pressures to increase the driving force required for CO2 separation. Membranes with CO2/N2 selectivity of 1000 will be needed, which is also stable at the conditions of the flue gas for it to become competitive with the solvent absorption process.
B.3 Gas Treatment of the Flue Gas from IGCC
The IGCC plant considered here (from Chapter 2 with calculations discussed in Appendix H) uses a Pd-based membrane to separate H2 from the gases coming out of the water gas shift reactor. The reject gas coming out from the Pd membrane is of composition CO2 – 68.3%, CO – 12.5%, H2O – 12.5%, N2 – 6.7% at 300o C and 10 Bar. The critical molecular diameter is defined as the diameter of the cylinder which can circumscribe the molecule in its most favorable equilibrium conformation. The critical diameters of the components in the above gas are seen in Table B-2.
46

Table B-2 Critical diameters of components in flue gas (Sigma Aldrich, 2006)
Molecule Critical
Diameter(Å)
CO2 2.8
CO 2.8
H20 3.2
N2 3.0
To separate CO2 from such a flue gas mixture will be more complex. For CO2/N2 separation one of the major issues is that the critical diameter are so close that a simple inorganic membrane with a definite pore size won’t be suitable for separation because of the low selectivity. This is the reason that has lead to the development of solution diffusion coefficient membranes so as to enhance the selectivity to CO2. The aim was to treat the flue gas coming out as the reject to separate CO2 completely from the flue gas using a simple membrane.
B.3.1 Assumptions made for the Separation Process
Gas was cooled to 40o C using water as a coolant with a heat exchanger. Then it was assumed that the water present in the flue gas was removed using a natural zeolite. CO is assumed to be converted in to CO2 either by changing the residence time in the water gas shift reactor or by suitable treatments to combust it completely (Oxidation in a catalytic converter or by combusting it at higher temperatures) So the condition and composition of gas after pre-treatments and cooling is CO2 – 92.3%, N2 – 7.7% by mole with a flow rate of 3666 mol/s at 45o C and at 10 Bar. The membrane used for the design calculations was an alumina based membrane with no chemical modification, permeability of CO2 and N2 are 72 *107 mol/Pa s m2 and 103 *107 mol/Pa s m2 with a selectivity of N2/CO2 of 1.4. The material balance of the flue gas entering the membrane system used is shown below
47

Figure B-1 Mole Balance of gases through a membrane system As it can be seen from the balance, flue gas mixture is split in the ratio of 60:50. The purity of the CO2 coming as the reject is not that high when compared to flue gas entering the membrane system. To obtain high purity CO2 further, membranes in series will be needed, which increases the capital cost and also requires further pressurization and cooling for further treatments. So further treatment of the flue gas was not considered to obtain high purity CO2 was not considered since it was not a suitable option. Also the calculations was done on many assumptions which when taken in to consideration will cause further issues. So processing of flue gas with membrane system was not considered in the design.
48

Appendix C: Solid Adsorption Post-combustion capture technologies are the ones most popular today in power plants. While solvent scrubbing might be one of the mature technologies employed commercially in power plants, it still suffers from energy penalty issues. On the other hand, some other technologies which could be competitive with currently available solvent absorption have been studied to investigate the scope for improving efficiency and reducing energy penalties and cost of process.
Table C-1 Evaluated CO2 capture technologies and their energy efficiencies (from Kosugi et al., 2004)
For each type of chemical absorption, physical adsorption, membrane separation and O2/CO2 recirculation boiler technologies, the indicated energy efficiency is calculated from a decrease in net power output which is caused by the application of the CO2 capture technology to the reference coal-fired thermal plant, expressed in kWhe per kilogram of liquefied CO2 captured. The reference plant is assumed to have desulfurization and de-NOx equipment. Figures in parentheses are the efficiencies of CO2 separation without liquefaction For integrated hydrogen separation gas turbine technologies, the indicated are net power generation efficiencies on higher heating value basis. Figures in brackets indicate CO2 recovery factors. All the technologies are presumed to be used for commercial plants which have a unit capacity of 1x10⁵ Nm3-CO2-captured/h (equivalent to about 5 kt-CO2/day), a practically sufficient durability and an economically acceptable cost. a Assuming an integrated chemical absorption system where the heat energy for regenerating a chemical absorbent is supplied by low pressure steam extracted from steam turbine. b Assuming CO2 liquefaction after one-stage membrane separation.
Adsorption separation technology has a large operating range over relatively high temperature and pressure. Its lower cost, less energy requirement, applicability and high selectivity makes it competitive with other options and a favorable alternative for recent studies on CO2 capture (Table C-1).
C.1 Concept
Solid adsorption for post combustion capture is a concept where CO2 is targeted by surface of base material via chemical and physical attraction. These attractions can occur at the same time as well as they can dominate to each other. After CO2 molecules are removed from gas stream, simple temperature (temperature swing adsorption, TSA) and/or pressure (pressure swing adsorption, PSA) changes are used to release wrapped molecules which is also knows as desorption. Problem becomes the selection of adsorbent depending on target molecule, CO2 in this case, its performance at realistic operational conditions with technical analysis; capacity, selectivity, and thermal and mechanical stability. Economical feasibility is another issue that needs to be
49
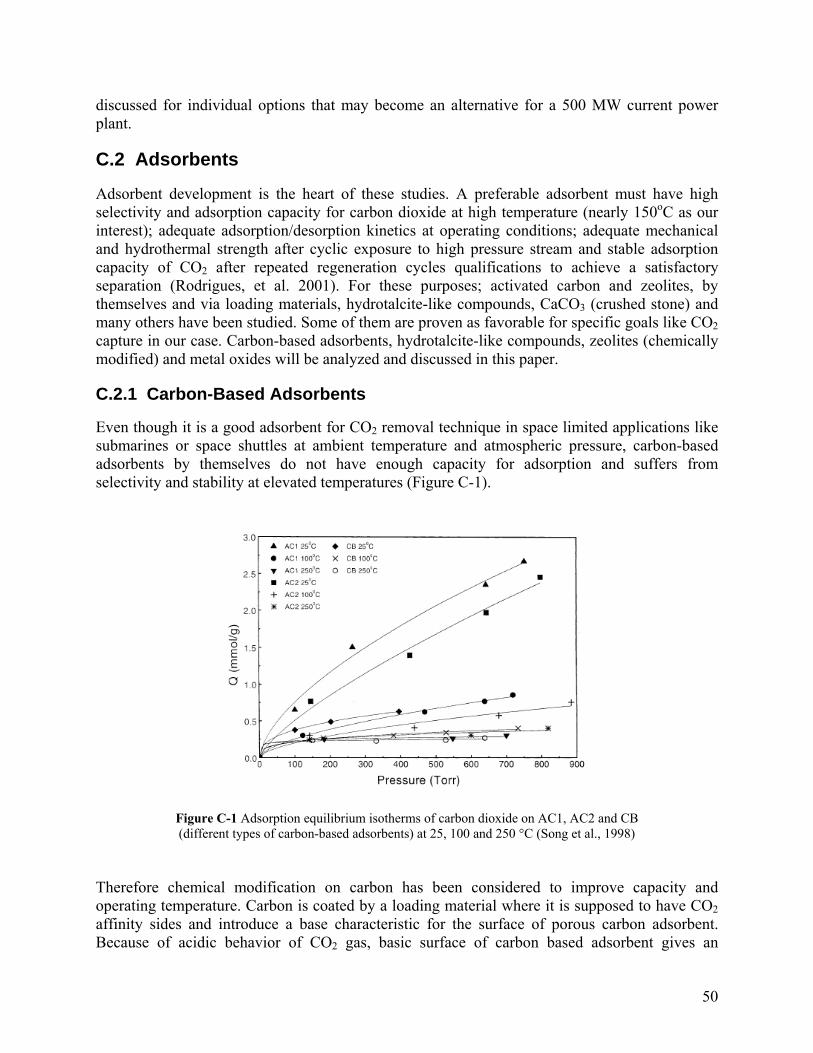
discussed for individual options that may become an alternative for a 500 MW current power plant.
C.2 Adsorbents
Adsorbent development is the heart of these studies. A preferable adsorbent must have high selectivity and adsorption capacity for carbon dioxide at high temperature (nearly 150oC as our interest); adequate adsorption/desorption kinetics at operating conditions; adequate mechanical and hydrothermal strength after cyclic exposure to high pressure stream and stable adsorption capacity of CO2 after repeated regeneration cycles qualifications to achieve a satisfactory separation (Rodrigues, et al. 2001). For these purposes; activated carbon and zeolites, by themselves and via loading materials, hydrotalcite-like compounds, CaCO3 (crushed stone) and many others have been studied. Some of them are proven as favorable for specific goals like CO2 capture in our case. Carbon-based adsorbents, hydrotalcite-like compounds, zeolites (chemically modified) and metal oxides will be analyzed and discussed in this paper.
C.2.1 Carbon-Based Adsorbents
Even though it is a good adsorbent for CO2 removal technique in space limited applications like submarines or space shuttles at ambient temperature and atmospheric pressure, carbon-based adsorbents by themselves do not have enough capacity for adsorption and suffers from selectivity and stability at elevated temperatures (Figure C-1).
Figure C-1 Adsorption equilibrium isotherms of carbon dioxide on AC1, AC2 and CB (different types of carbon-based adsorbents) at 25, 100 and 250 °C (Song et al., 1998)
Therefore chemical modification on carbon has been considered to improve capacity and operating temperature. Carbon is coated by a loading material where it is supposed to have CO2 affinity sides and introduce a base characteristic for the surface of porous carbon adsorbent. Because of acidic behavior of CO2 gas, basic surface of carbon based adsorbent gives an
50

advantage and can attract CO2 molecules better. At that point selection of loading material gains significance. Yong et al. (2001) used MSC-30, commercial MAXSORB, with its relatively high capacity and BET surface in comparison with conventional activated carbon and analyzed before and after modification results at 300oC and 1 bar pressure (Figure C-2). Carbon fiber composite molecular sieve (CFCMS) was also studied as another alternative with its high BET surface and CO2 affinity sites (Figure C-3).
Figure C-2 Adsorption equilibrium isotherms of CO2 on MSC-30 before and after chemical modification at 300 °C, 1 bar. (Yong et al., 2001)
Figure C-3 Adsorption equilibrium isotherms of carbon dioxide on two CFCMS samples at 30, 60 and 100 °C (Burchell et al., 1997)
Clogging micro pore entries by N-containing groups is consideration for lowered capacity of carbon-based adsorbents and perhaps change in pore sizes at elevated temperature can be another explanation.
51

These results can be concluded as carbon-based adsorbents cannot be regarded as an option to use in solid adsorption at post combustion CO2 removal step of a power plant. Its capacity gets significantly lowered at elevated temperatures. Although chemically modified samples showed enhanced capture capacity over conventional alternatives, they are still far from being a feasible option for solid adsorption. At first place mechanism of adsorption on the surface of carbon-based material and loading material with CO2 affinity sites, and at the second place commercialization of experimental specimens are limitations in front of possible consideration.
C.2.2 Hydrotalcite-like Compounds
Hydrotalcite-like compounds have attracted significant attention recently because of their CO2 capture ability at elevated temperatures. Hydrotalcite-like compounds (HTlcs), also known as layered double hydroxides (LDHs) are bidimensional basic solids. The structure consists of positively charged brucite (magnesium hydroxide)-like layers with interlayer space containing charge compensating anions and water molecules (Ulibarri et al., 2001) (Figure C-4) with a general formula:
−−++−
+ RnRRR OmHAnROHMM ])/[(])([ 22
31
2 (Yamamoto et al., 1995)
Figure C-4 Structure of hydrotalcite-like compounds where M =Mg , Ni , Zn , Cu , Mn , et al.,
M =Al , Fe , Cr , etc., An-=CO , SO , NO , Cl , OH (Hutson et al., 2004)2+ 2+ 2+ 2+ 2+ 2+
+3 3+ 3+ 3+32-
42-
3- - -
Hydrotalcite-like compounds have been reported as having high adsorption capacity at elevated temperatures (Hutson et al, 2004; Ding and Alpay, 2000; Yong et al., 2002; Yamamoto et al., 1995). On the other hand, surprisingly it has abnormal an adsorption behavior by change in temperature which follows Q300>Q20>Q200 trend (where QT is the adsorption capacity at 1 atm pressure and temperature, T) (Hutson et al, 2004). The possible reason for this unexpected behavior is suggested as decrease of the interlayer spacing between room temperature and 200oC, resulting in less available spacing for target molecule that inhibits carbon dioxide adsorption. On the other hand, at 300oC, dehydroxylation and decarbonization of the HTlcs result in structural modification ands increased porosity; consequently enhance adsorption capacity of carbon dioxide (Hutson et al., 2004)
52

Figure C-5 Effect of partial pressure of water on the adsorption capacity of carbon dioxide at Pcarbon dioxide = 0.12 – 0.126 bar, T=400oC (Yong et al., 2002)
Even though HTlcs have been studied with respect to each variable; effect of type of M2+ and M3+ cation content, type of anion, water (stream) (Figure C-5), operation temperature, cycle number for stability (Figure C-6), chemical modification (Figure C-7) which may affect performance directly, it has been found that all those individual parameter has significant effect on capacity, selectivity and stability.
Figure C-6 Effect of cycle number on adsorption capacity of carbon dioxide
at 400oC under dry and wet conditions (Yong et al., 2002)
53

Figure C-7 The effect of K2CO3 loading on adsorption capacity of CO2 for promoted HTlcs at 400oC, 10 atm steam/0.3 atm carbon dioxide (Yong et al., 2002)
For each parameter, process is entirely open for manipulation and has significant differences. Adsorption mechanism of CO2 and adsorption/desorption kinetics should be completely clarified, loading material must be chosen carefully for maximum capture ability enhancement, and technical conditions must be well defined for optimum operational conditions to consider HTlcs as industrially usable alternative CO2 removal adsorbent.
C.2.3 Zeolites
Because of high surface area and variety of pore sizes, zeolites are also considered as good adsorbents. Many studies have been done on zeolites as adsorbent in space-limited conditions like space shuttles. On the other hand again thermal destruction affects its stability at elevated temperatures and makes it useless for high temperature CO2 capture operations. In order to improve capture capacity and selectivity, chemically modified zeolites are considered as an option by using the advantage of high BET surface area and various pore sizes. Many chemicals are subject to be regarded as modification material on zeolites. Two of them, hydrotalcite-like compounds and polymers are favorable ones with significant benefits.
C.2.3.1 Zeolites modified by hydrotalcite-like compounds
The fact that its relatively higher adsorption capacity at elevated temperature makes HTlcs desirable alternatives for chemical modification of commercial zeolites. Even though it has been many years that HTlcs have being studied, considering them as loading material on zeolites is a hot topic. Othman et al., showed that hydrotalcite modification has significant improvement on adsorption ability of zeolites (Figure C-8). It is a good indication for both low capture abilities of commercially available zeolites and enhancement that HTlcs added. Although significant improvement in capture capacity of modified zeolites is obvious, temperature range for operations is still very low. Even for modified zeolites, 30oC is the temperature where they can operate effectively.
54

Figure C-8 CO adsorption for coated/uncoated zeolites in CO pure system (Othman et al., 2006)2 2
Alongside the capture capacity, being commercially available and scaling up issues are major limitations in front of zeolites coated with HTlcs. Feasibility and technical adequacy requires more studies to be done to solve complexity of processes involved in every step for consideration of zeolites coated by HTlcs.
C.2.3.2 Zeolites Modified by Polymers: “Molecular Basket” Concept
Another hot topic as alternative to improve capture ability of zeolites is modifying with polymers. Some recent studies indicate that chemically modified zeolites that some polymer introduced have enhanced capacity and selectivity for carbon dioxide capture. Xu et al. (2002 and 2005) studied with mesoporous and nanoporous molecular sieves or in other words “molecular baskets”. In order to obtain a molecular baskets; a chemical which has high numerous carbon dioxide-affinity sites should be loaded into pores of zeolite, thus carbon dioxide capture capacity and selectivity will be significantly increased (Table C-2). The main reaction that indicates interaction (chemical adsorption) between amine and carbon dioxide is believed to be carbamate formation (Xu et al., 2002): CO2 + 2R2NH R2NH2
+ + R2NCOO -. In Table C-2, zeolite itself (MCM-41 as support) and modified with polyethylenimine (PEI) are listed according to their adsorption/desorption capacities at different temperatures. MCM-41-PEI-75 has more than ten times higher adsorption capacity than MCM-41 only adsorbent at 75oC. Capacity is reported as 45 ml (STP)/g-adsorbent in Xu et al. (2002). The adsorption of carbon dioxide on PEI or MCM-41 is an exothermic reaction therefore adsorption capacity decreases by increasing temperature on those polymers or zeolites by themselves. However when PEI is loaded into pores of MCM-41 increased temperature has positive effect and increases the capacity. Xu et al. (2002) purposed a hypothesis about that unusual change (Figure C-9).
55

Table C-2 Adsorption and Desorption Performance of MCM-41, MCM-41-PEI, and PEI Under Pure CO2 Atmosphere
CO2 flow rate=100ml/min and two digits after PEI indicates percentage of PEI loaded into MCM-41 (Xu et al., 2002) At low temperature PEI in the channels of MCM-41 acts like nanosized particles so affinity parts of PEI that are on the surface only can interact with carbon dioxide, other affinity parts in the bulk of PEI cannot interact and stay hidden (Figure C-9A), while at higher temperatures structure of PEI extends and has more carbon dioxide affinity sites (Figure C-9B). As Xu et al. studies indicates, this is a kinetically controlled diffusion process and most important issue about in this process is time. If adsorption time is sufficient enough, capacity of MCM-41-PEI can have higher adsorption capacity at lower temperature than it has at elevated temperatures.
Figure C-9 Schematic diagram of PEI status in MCM-41 zeolite at (A) low temperature, and (B) high
temperature. (●) Active CO adsorption sites; (○) hidden CO adsorption sites (Xu et al., 2002)2 2
After choosing optimum loading ratio which is MCM-41-PEI-75 according to Table C-2, modified zeolite becomes very advantageous over other adsorbent options with its high capture capacity at relatively high temperature (Table C-3).
56

Table C-3 Adsorption and Desorption Performance of MCM-41, MCM-41-PEI, and PEI Under Pure CO2 Atmosphere (CO2 flow rate = 100ml/min) (Xu et al., 2002)
Beside its high adsorption capacity, another advantage for MCM-41-PEI is effect of moister that flue gas includes. In general, moister reduces adsorption capacity and destruct ability of adsorbent to adsorb CO2. Contrarily moister promotes adsorption capability of MCM-41-PEI. Moist flue gas adsorption time is longer than dry flue gas adsorption which means adequate adsorption time is being provided for a satisfactory separation (Figure C-10).
Figure C-10 Comparison of CO breakthrough curve with/without moisture in the simulated flue gas. Operation conditions: adsorbent: MCM-41-PEI-50; weight of adsorbent: 2.0 g; temperature: 75 C;
feed flow rate: 10 ml/ min. Dry feed composition: 14.9% CO , 4.25% O and 80.85% N ; moist feed composition: 12.61% CO , 3.56% O2, 68.25% N and 15.59% H O (Xu et al., 2005)
2o
2 2 2
2 2 2
Not only capacity but also selectivity and mechanical strength of MCM-41-PEI adsorbent are very high with respect to other alternative adsorbents. They are reported as selectivity of MCM-41-PEI is 180 for CO2/O2 and >1000 for CO2/N2 at 75oC.
57

Mechanical stability is also very feasible for adsorption/desorption cycles during operations (Figure C-11). There is small amount adsorption of NOx (7.1x10⁻³ ml (STP/g-adsorbent) and desorption is incomplete. For long term stability NOx adsorption is harmful where pre-removal of nitrogen may be required (Xu et al., 2002 and 2005).
Figure C-11 Cyclic adsorption separation performance of “molecular basket” adsorbent for the separation
of CO from natural gas-fired boiler flue gas. Operation condition: feed composition: 7.4–7.7% CO , 14.6% H O, ~4.45% O , 200–300 ppm CO, 60–70 ppm NO
2 2
2 2 x, and 73–74% N ; feed flow rate: 6000
2±600 ml/min; temperature: 80±10 C (Xu et al., 2005)o
After all analysis, although zeolites modified with polymers seem very suitable and favorable over other alternatives, some limitations block its commercial use. Scaling up is significant problem which can affect mechanical and thermal strength, and efficiency of progress. Loading polymer is also complex process and needs to be clarified to develop a pathway for commercial production. Chemically modified zeolites are also not available in market to be used as option in a currently building 500 MW power plant. Those issues above can be solved by further studies and consideration of new loading material may help for improved operational abilities.
C.2.4 Metal Oxides
Metal oxides are being considered as an alternative adsorbent with their basic characteristic for CO2 removal which has acidic gas. A metal oxide with a low value of the charge/radius ratio is more ionic in nature and will present more basic sites. Carbon dioxide molecules can be adsorbed on positive and negative surface sites of metal oxides. When carbon dioxide is adsorbed in some particular types of metal oxides (such as, CaO, unidentate species, MgO, bidentate), this adsorption capacity of carbon dioxide can be reversibly removed (Yong et al., 2002). Although many metal oxides were studied for CO2 adsorption, alumina and magnesium oxide (MgO) have been received significant attention. Lower adsorbent cost, vessel design which does not need screens to separate the two different adsorbents, high adsorption capacity and resistance to steam, mechanical and thermal stability are major advantages of alumina systems (Yong et al., 2002). Adsorption isotherms of alumina at various temperatures are shown in Figure C-12. Capture capacity follows same trend like other
58

adsorbents do with respect to temperature changes. Capacity lowers significantly above ambient temperature.
Figure C-12 Adsorption equilibrium isotherms for carbon dioxide on basic alumina (98AA1149) at 293, 473, and 573 K, 1 bar (Yong et al., 2000)
In order to improve capacity chemical modification is been studied for basic alumina systems as well as most of other adsorbent alternatives. Metal oxides (such as Li2O, K2O, Na2O) or alkaline metal carbonate (such as Li2CO3, K2CO3, Na2CO3) are favorable alternatives as loading materials and it has been proven that they enhance the capture capacity greatly (Table C-4). However alumina systems are still not sufficient for high temperature CO2 separation even with chemical modification. Even though very low cost highlights its consideration as a feasible alternative, its capacity needs to be enhanced significantly for high temperature CO2 removal.
Table C-4 The chemical modification conditions for F-200 Alcoa alumina and the reversible adsorption capacity of CO2 on F-200 Alcoa alumina before and after chemical modification at 400 °C and 500 Torr
(Yong et al., 2002)
59
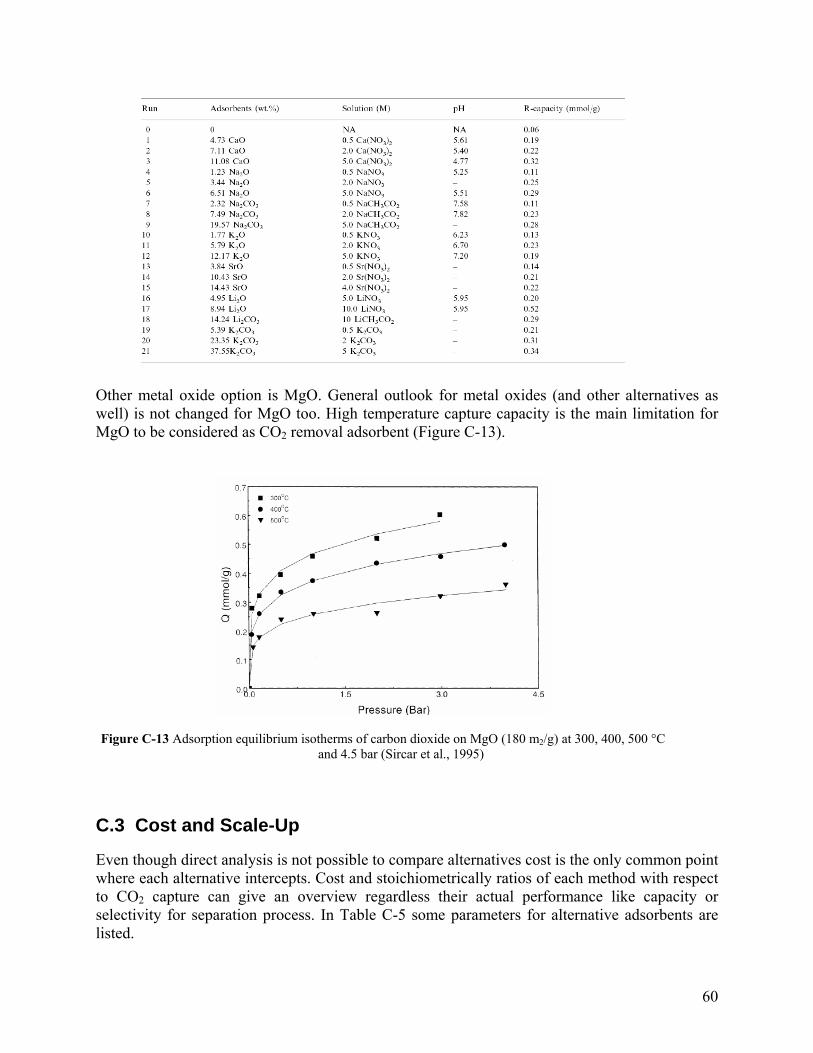
Other metal oxide option is MgO. General outlook for metal oxides (and other alternatives as well) is not changed for MgO too. High temperature capture capacity is the main limitation for MgO to be considered as CO2 removal adsorbent (Figure C-13).
Figure C-13 Adsorption equilibrium isotherms of carbon dioxide on MgO (180 m /g) at 300, 400, 500 °C and 4.5 bar (Sircar et al., 1995)
2
C.3 Cost and Scale-Up
Even though direct analysis is not possible to compare alternatives cost is the only common point where each alternative intercepts. Cost and stoichiometrically ratios of each method with respect to CO2 capture can give an overview regardless their actual performance like capacity or selectivity for separation process. In Table C-5 some parameters for alternative adsorbents are listed.
60

Table C-5 Outline of sorbent characteristic and estimated unit prices according to their year 2000 US dollar market values (Table is modified from its original version in Abanades et al., 2004)
a Assuming 2 mol of CO2 adsorbed/kg of active carbon, 5 mol of CO2/kg of zeolite, and 0.5 mol of CO2/kg of hydrotalcite. b The definition of Ms for these sorbents already gives the mass of sorbent required to absorb 1 mol of CO2. c This is per mole of O2 transported, assuming 2Fe2O3 4FeO + O2, 2Me + O2 2MeO (for Me = Co, Cu, Ni), and 6MnO + O2 2Mn3O4. Economic aspects are always subject to be affected by any progress and change. Demand/supply cycle determines prices most of the time. New improvement like discovery of new resources is another scenario which significantly hits prices. As explained above chemical modification is in the heart of studies and loading chemicals are being changed and improved. Although commercially available adsorbents by themselves have low prices which may considerable, loading materials and in addition to this, process which coating requires have majority of overall cost. Improved efficiency of loading process may reduce the cost. Scaling up which is also complementary with cost and technical aspects is another important issue for feasibility of solid adsorption. All studies those have been done are in laboratory scale experimental studies and do not include any larger scale estimation. Mechanical and thermal stability can be impacts for large scale facilities as well as design problems. However since any
61

of considered alternatives provide enough performance to be applied on larger scale facilities, no study has been done on issues those may come up for industrial scale solid adsorption systems.
C.4 Decisions
As all alternatives discussed for solid adsorption in post combustion step of a power plant above, options have some different limitations according to their characteristics and there are some common limitations as well, like scale up problems or being commercially available. When we consider building a 500 MW power plant today, even though some alternatives are very promising for future applications; like molecular basket technology with its higher operational temperature, thermal and mechanical stability and promotional effect of moister on molecular basket, none of the above alternatives can be suggested as an option because of; lower capacity then current systems, uncertainties in processes and progresses that solid adsorption includes, and the most importantly being commercially unavailable. Consequently, solid adsorption option is rejected to be applied in the power plant that capture team tries to design.
62

Appendix D: Solvent Absorption The flue gas streams from the traditional coal fired power plants usually have a low concentration of CO2 (13 – 15% wet basis) (Singh et.al., 2003). In this process, the flue gases are cooled and then passed through a solvent containing a chemical absorbent. The CO2 being acidic reacts with the solvent which is basic in nature and is thus removed from the flue gas stream. This CO2-rich solvent is heated and sent to a regenerating column where the CO2 is stripped from the solvent and is recycled to the absorber. The released CO2 is then cooled and compressed and stored based on the use of the CO2 in the industry relevant to the area (Wong and Bioletti, 2002). Most of the studies done on amine absorption discuss the use of primary amines like Mono Ethanol Amine (MEA), because it is the least expensive of the alkanol amines and has a high theoretical absorption capacity (0.4kg CO2/kgMEA) due to its low molecular weight (Yeh and Bai, 1999).
D.1 Reaction Mechanism
The amine scrubbing technology for the removal of CO2 from flue gas has been adopted from the gas processing industry. The amine scrubbing process is commercially used for the removal of acid gas impurities from process gas streams. The solvents that are being used for the traditional amine scrubbing process are alkanol amines. Figure D-1 shows the structure of amines (Wang et.al, 2004)
Figure D-1 Structure of DEA and MDEA (Wang et al.,2004)
Amines are weak, basic compounds that react with CO2 to form weak chemical bonds. These chemical bonds are easily broken upon mild heating, leading to regeneration of the solvent (Wang et al., 2004). The reaction of primary or secondary amines (R1R2NH) with dissolved CO2 is generally described by the zwitterions mechanism in a two-step sequence, i.e. the fist step is the formation of an intermediate �witterions (Wang et al., 2004):
−+
−
⇔+ 221212
2
1
CONHRRNHRRCOk
k [D-1]
63

Then, the �witterions is deprotonated by the bases present in the solution, forming a carbamate ion and a protonated base:
[D-2] +−−+ +⇔+ bHNCORRbCONHRRbk
221221
where b denotes H2O, OH− and R1R2NH in an aqueous amine solution, respectively. A tertiary amine cannot undergo the above reactions since no hydrogen bonding with nitrogen atom is available. The reaction of a tertiary amine with CO2 proceeds by the formation of a protonated amine and a bicarbonate anion:
[D-3] −+ +→++ 332122321
2
HCONHRRRCOOHNRRRk
The absorption capacity of the solvent can be greatly improved if one of the intermediate reactions (carbamate formation) can be slowed down by providing steric hinderance to the reacting CO2.This can be achieved if a bulky substitute is attached to the nitrogen atom of the amine molecule. These bulkier substitutes give rise to less stable carbamates in addition to slowing down the reaction. MEA is the most preffered solvent due to its low cost, high theoretical absorption capacity for CO2, and high rate of absorption and desorption. The problems encountered in practice are corrosion problems, high solvent carryover, high sensitivity to impurities such as COS and CS2 in the flue gas stream resulting in solvent degradation and foaming due to impurities build up. Mariz (1998) suggested the use of corrosion inhibitors in commercial scale plants to strengthen the solution and get a recovery efficiency of 80% using 30 wt % MEA solution. A lower heat of reaction implies that the regeneration step requires less heat for secondary amines than tertiary amines.
Table D-1 ΔHr for solvents MEA, DEA, MDEA Solvent MEA DEA
(Diethanolamine)MDEA (Methyl
Diethanol Amine) ΔHr in cal/gm for CO2 455 360 320
This, in terms of energy consumption point of view, is very crucial when the primary objective is the isolation of CO2 from flue gas. Though tertiary amines relatively react slower with CO2 compared to the other amines, their main advantage as a solvent is the low heat requirements for the regeneration step. The tertiary amines show a tendency to degrade in use when compared to the other two and are easily regenerated easily. These amines also have low corrosion rates compared to primary and secondary amines (Wong and Bioletti, 2002). The heat of reaction (ΔHr) of CO2 with secondary amines is lower than that of the primary amines.
D.2 Impurities in the Process Streams
One of the main problems of solvent absorption is the impurities in the flue gases. Most of the flue gas streams have impurities such as particulates, SO2, NOx and oxygen. The SO2 and NOx form heat stable salts. Assuming that the fuel source of a power plant is coal, the non-
64

desulfurized flue gases contain about 700 ppm sulfur if the coal contains 1% sulfur. Several authors proposed that the flue gases should not contain more than 10ppm SO2 if solvent losses are to be reduced to an acceptable level. The solvent degrades due to the presence of oxygen in the flue gas stream. (Sander and Mariz, 1992).
D.3 Design issues
Absorption based on amine solvents is the only post combustion technologies available at anything approaching the scale required for capture from power plants (Hendricks, 1994). This technology is well suited with the addition of some process design modifications needed to overcome the particular problems faced by some chemical species in power plants (Alie et.al, 2005). The conventional MEA flow sheet is shown in Figure D-2.
Figure D-2 Flow sheet of traditional Solvent scrubbing process using MEA as a solvent (Alie et.al, 2005) The flue gas containing CO2 enters the absorber and contacts an aqueous solution of MEA flowing counter-currently to the flue gas stream. CO2, a weak base, reacts exothermically with MEA, a weak acid, to form a water soluble salt. The MEA-rich stream exits the absorber at the bottom of the column. It is then preheated in a heat exchanger by the ‘lean’ MEA stream leaving the stripper and enters the stripper where, with the further addition of heat, the reaction is reversed. The CO2, having been liberated from the MEA, leaves through the top of the stripper column. The lean MEA is then recycled back to the absorber (Alie et al., 2005). Hong-Yan Zhang et al. (2006) have discussed a process simulation of using a membrane contactor integrated with the process of chemical absorption. A membrane contactor is a device that achieves gas/liquid or liquid/liquid mass transfer without dispersion of one phase within another. This is accomplished by passing the fluids on opposite sides of a micro porous membrane. By careful control of the pressure difference between the fluids, one of the fluids is immobilized in the pores of the membrane so that the fluid/fluid interface is located at the mouth of each pore. This approach offers a number of important advantages over conventional dispersed phase contactors like no flooding at high flow rates, no unloading at low flow rates, no density difference between fluids required, and surprisingly high interfacial area. Membrane contactors typically offer 30 times more area than what is achievable in gas absorbers and 500 times the
65

area obtainable in liquid/liquid extraction columns, leading to remarkably low energy usage (Gabelman and Wang, 1999). Unlike most membrane operations, the membrane imparts no selectivity to the separation (i.e., it has no impact on the partition coefficients.). This is different to the conventional membrane applications such as micro-filtration, ultra filtration and reverse osmosis in the sense that the driving force for separation is a concentration rather than a pressure gradient; indeed only a very small pressure drop across the membrane is required to ensure that the fluid/fluid interface remains immobilized at the mouth of the pore (Wang et al,2004). The Fluor Econamine FGSM technology uses a 30 wt % MEA with chemical inhibitors to counter the effects of corrosion caused by the presence of oxygen in the flue gas stream. This process is best found to be operated at low levels of SO2 (< 10 ppmv) and NOx(< 20 ppmv) to avoid excessive solvent degeneration. The process has been reported to be well developed and widely used at a small scale to produce high purity CO2 for the food industry (Simmonds and Hurst, 2005). Other solvent that is being developed is the Mitsubishi Heavy Industries (MHI) process that uses the KS1 solvent, which is reported to have less solvent degradation issues. It is reported that both the processes have nearly identical solvent replacement costs and steam stripping costs but the cost of the KS1 solvent is about four times that of the Econamine solvent (MEA plus inhibitor solvent) A comparison of the costs and steam usage is made for the traditional MEA process, the Fluor Econamine process and the MHI solvent process in table below.
Table D-2 Comparison of solvents (Simmonds and Hurst, 2005)
Process Solvent used
Solvent loss (Kg/tonne of CO2)
Solvent Cost ($/kg)
Solvent cost ($/ tonne of CO2 recovered)
SteamUse (tonne/tonne CO2)
Traditional MEA 1 to 3 1.30 1.3 to 1.9 2.0 Econamine MEA +
inhibitors 1.6 1.53 2.45 2.3
MHI Hindered Amines
0.35 5.00 1.75 1.5
From the above table, it can be seen that though the cost for the MHI solvents is high, its steam usage is relatively low compared to the econamine process but the cost of solvent per tonne of CO2 recovered is more for the Econamine process. Thus the effort for the reduction of costs involved in the capture of CO2 using solvent absorption would need to integrate the use of high performance solvents with process system modifications such as using membrane contactors in place of the traditional contact towers.
D.4 Efficiency Loss Calculations
The preliminary calculations involved the calculation of the efficiency losses based on the solvent being used. The efficiency losses incurred due to the extraction of steam from the main steam cycle and other energy demands for the recovery process have been calculated assuming that the process is being integrated to a power plant. The other losses that are to be taken into consideration are the compression of the flue gas, energy used in pumping the solvent and also
66

the energy used in compressing the product CO2 have to be done. The reference plant is a coal fired power plant with a capacity of 600 Mwe (Hendricks,1994). The steam used in the recovery unit is extracted from the steam cycle of the power plant. The water in the reboiler is taken to be at 105oC. The low pressure steam is extracted from the steam cycle is at 120oC. The steam in the reboiler is at 110oC. The energy consumed per kg CO2 recovered is given by Eloss = Eextr + Escrub+ EComp [D-4] where Eextr = Energy loss during extraction of steam from the steam cycle of the power plant.(kJ/kg CO2), Escrub = Energy consumed in the scrubber. (kJ/kg CO2), EComp= Energy loss by compression of the recovered CO2. (kJ/kg CO2), and Eextr = Mst * ( H sLP – H sc) * η gen, where Mst = Amount of steam per kg CO2 recovered, H s
c = enthalpy of the steam entering the condenser, and η gen = The generator efficiency.
)(
2
rebw
LPs
COst HH
QM
−= [D-5]
where Hs
LP = enthalpy of the low pressure steam extracted from the steam cycle.(kJ/kg steam), Hw
reb = enthalpy of the water leaving the reboiler. (kJ/kg water), and QCO2 = Heat requirement per kg CO2 recovered. The energy consumed in the scrubber is given as 4.9 MJ for MEA, 4.1 MJ for DEA and 3.4 MJ for MDEA.(Hendriks 1994 and Miramura et al.,1999). Thus the total plant efficiency losses can be calculated by the following equation:
fuel
lossCOloss Q
E*2
αη = [D-6]
where Qfuel = the lower heating value of fuel per kg of produced CO2 and αCO2 = Absorption efficiency of CO2 recovery (assumed to be 90%). The energy usage, steam usage and efficiency losses are calculated based on the above equations for the following three solvents.
67

Table D-3 Energy Analysis
Solvent Steam Usage (per kg CO2)
Efficiency losses Energy Usage (kJ/kg CO2)
Mono ethanol Amine( MEA)
111.93 12% 1413
Diethanol Amine (DEA)
71.56 7% 824
Methyl Diethanol Amine (MDEA)
60.83 6% 630
Out of the three solvents, the primary amines (MEA) has the highest efficiency losses and energy usage followed by secondary (DEA) and tertiary (MDEA). This is because the primary amines have a high heat of reaction with CO2 (455 cal/gm).The secondary amines have a relatively lower heat of reaction with CO2 (360 cal/gm) and the tertiary amines have the lowest with 320cal/gm.This is very crucial as a lower heat of reaction means lower energy consumption in the regeneration step.
D.5 Energy Consumption
The feasibility of the process with the new generation technologies has been examined. The new generation technologies like CLC and Oxy combustion give a concentrated stream of CO2. The rate of the solvent required in the absorption step for the chemisorption of the CO2 on the solvent was calculated by the mass transfer calculations for increasing CO2 streams. Similarly the rate of steam required for the regeneration of the solvent was calculated using the stripper mass balances. The assumptions in the calculations are:
1. Absorption is carried out at 25˚C 2. Stripping is carried out at 75˚C
3. 85% removal of CO2
4. Flue gas inlet flow rate is 250 m3/s
5. The flue gas is pre treated for SOX
Solvent consumption (kg/hr): [D-6] ( )
21
21
XXYYGL s
s −−
=
68

Steam Consumption (kg/hr): [D-7]
( )12
12
YYXXLG s
s −−
=
where X = Concentration of CO2 in the solvent (mol/mol) and X = x/(1-x) where x is the concentration in the liquid(mole fraction); Y = Concentration of CO2 in the flue gas (mol/mol) and Y = y/(1-y) where y is the concentration in the gas (mole fraction).
Figure D-1 CO Concentration vs. solvent and steam rate 2
The above graph discusses the solvent and steam consumption for different concentrations of CO2 in the flue gas streams. The rate of steam consumption for 75% concentration of flue gas is 2200kg/hr and the rate of solvent for the same concentration of CO2 is 3400kg/hr.
D.6 Operational Issues
One of the main operational issues in alkanol amine plants is corrosion. It mainly occurs due to the presence of contaminants in the solution and also with the solution loading with acid gas. Increase in acid gas concentration increases corrosion (Singh et al., 2003). Free CO2 in presence of water forms carbonic acid and causes severe corrosion. This carbonic acid reacts with metal forming metal bicarbonates. Amines form stable carbamates with CO2 thus reducing the capacity of the solution for CO2 2RNH2 + CO2 RNHCOONH3R [D-8]
D.7 Summary
Solvent absorption may be used as an alternative technology for CO2 capture in place of the proposed capture design methodology for CO2 with some tradeoffs for energy consumption. Since absorption is a commercialized technology, the availability of the solvents is abundant. Thus with future design modifications of using membrane contactors in place of the traditional
69

contactors , this process may emerge as one of the most feasible post combustion technologies for CO2 capture.
70

Appendix E: Biomass Gasification Biomass can commonly be classified as any biologically derived material. It can consist of a diverse list of resources such as wood products, farm wastes, municipal solid wastes containing organic matter and dedicated plant matter grown as energy crops. Biomass can also include algae/seaweed, food processing plant wastes, paper products, etc. Since biomass contains chemical energy that can be released via combustion it makes most forms of biomass an attractive fuel feedstock that can be obtained at relatively low costs. Biomass had occupied a prime role as wood based fuel for hundreds of years before coal and oil displaced it from the society’s energy portfolio. In today’s world, biomass usage for energy generation is catching on again because of the concept of “CO2 neutrality” associated with biomass. The principle of CO2 neutrality is dependent on the assumption that plants are grown in a sustainable manner to meet the consumption in the energy conversion processes. Large scale biomass usage is considered in several different forms in this study. Direct combustion of biomass in boilers, co-firing of biomass with coal (Laux et al., 2000), use of biomass to create processed liquid fuels such as biodiesel (Krishna et al., 2001) and biomass gasification (Audus & Freund, 2004) are some of the main options that are commonly employed and considered under this study.
E.1 Review of Biomass Gasification
Various biomass gasification technologies (from current commercial and pilot scale studies) were compared in the following section. Energy based comparisons as well as current and projected cost comparisons are discussed. Available power values were converted from the available scales (typically 20 kWe to 100 MWe), to scale up to a power generation scale of 500 MWe as established in the project. Both industrial and academic researchers are carrying out a wide range of testing and development on the use of biomass for producing electricity or for heating needs. Table E-1 provides a comparison of these biomass energy projects.
71
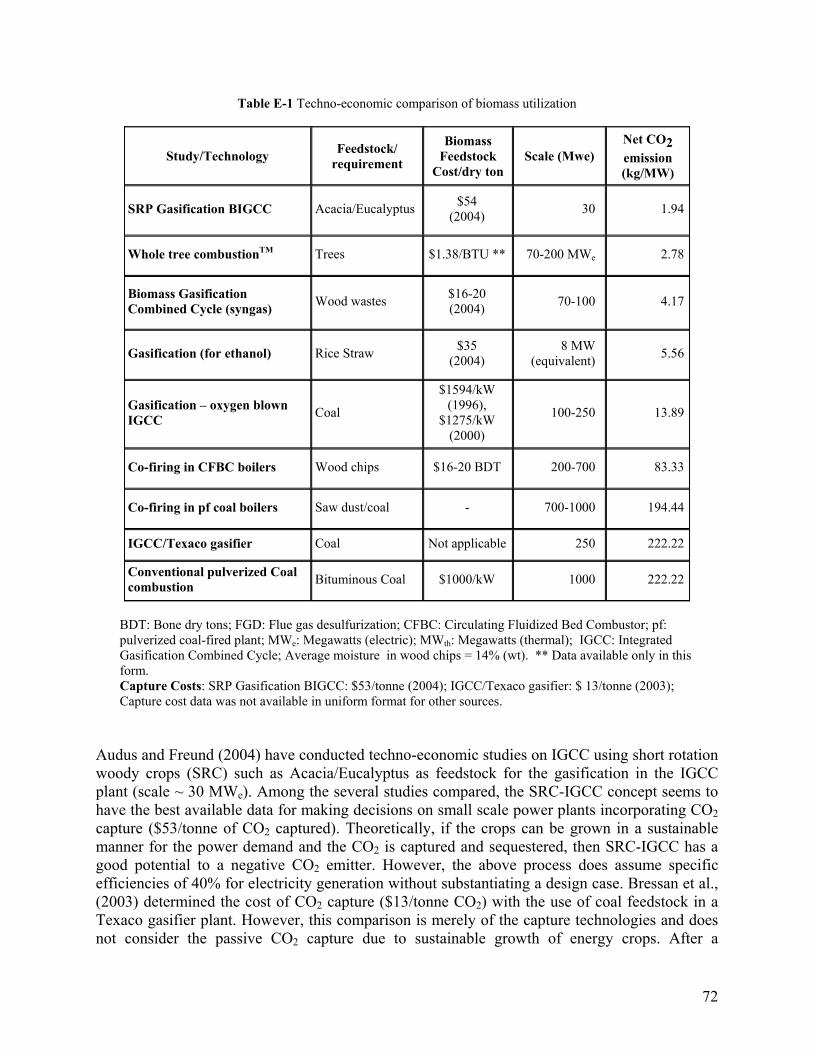
Table E-1 Techno-economic comparison of biomass utilization
Study/Technology Feedstock/ requirement
Biomass Feedstock
Cost/dry ton Scale (Mwe)
Net CO2 emission (kg/MW)
SRP Gasification BIGCC Acacia/Eucalyptus $54 (2004) 30 1.94
Whole tree combustionTM Trees $1.38/BTU ** 70-200 MWe 2.78
Biomass Gasification Combined Cycle (syngas) Wood wastes $16-20
(2004) 70-100 4.17
Gasification (for ethanol) Rice Straw $35 (2004)
8 MW (equivalent) 5.56
Gasification – oxygen blown IGCC Coal
$1594/kW (1996),
$1275/kW (2000)
100-250 13.89
Co-firing in CFBC boilers Wood chips $16-20 BDT 200-700 83.33
Co-firing in pf coal boilers Saw dust/coal - 700-1000 194.44
IGCC/Texaco gasifier Coal Not applicable 250 222.22
Conventional pulverized Coal combustion Bituminous Coal $1000/kW 1000 222.22
BDT: Bone dry tons; FGD: Flue gas desulfurization; CFBC: Circulating Fluidized Bed Combustor; pf: pulverized coal-fired plant; MWe: Megawatts (electric); MWth: Megawatts (thermal); IGCC: Integrated Gasification Combined Cycle; Average moisture in wood chips = 14% (wt). ** Data available only in this form. Capture Costs: SRP Gasification BIGCC: $53/tonne (2004); IGCC/Texaco gasifier: $ 13/tonne (2003); Capture cost data was not available in uniform format for other sources.
Audus and Freund (2004) have conducted techno-economic studies on IGCC using short rotation woody crops (SRC) such as Acacia/Eucalyptus as feedstock for the gasification in the IGCC plant (scale ~ 30 MWe). Among the several studies compared, the SRC-IGCC concept seems to have the best available data for making decisions on small scale power plants incorporating CO2 capture ($53/tonne of CO2 captured). Theoretically, if the crops can be grown in a sustainable manner for the power demand and the CO2 is captured and sequestered, then SRC-IGCC has a good potential to a negative CO2 emitter. However, the above process does assume specific efficiencies of 40% for electricity generation without substantiating a design case. Bressan et al., (2003) determined the cost of CO2 capture ($13/tonne CO2) with the use of coal feedstock in a Texaco gasifier plant. However, this comparison is merely of the capture technologies and does not consider the passive CO2 capture due to sustainable growth of energy crops. After a
72

preliminary review of available data and projections based on these, it appears that biomass usage as a gasification feedstock holds reasonable potential for small to medium scale (20-150 MWe) power plants. However, biomass gasification cannot be combined with coal gasification because several differences in process temperature and process conditions (see section on IGCC in Chapter 2). Next, some aspects of processed biomass usage, i.e. bio-derived fuels such as vegetable oils, animal fats and biodiesel utilization will be covered.
E.2 Biodiesel in External Combustion Applications
In this paper, the discussion is on the use of biodiesel and used cooking oils (vegetable oils and animal fats) in external combustion applications where the chemical energy of the vegetable oil is converted to thermal energy by burning the oil in a combustor. The thermal energy obtained can either be used for space heating applications (Krishna et al., 2004) or for power generation applications using Stirling engines (Demirbas and Meydan, 2004). Currently most residential heaters for space heating and water heating applications use No. 2 fuel oil, petroleum derived fuel oil. Hence its price and availability are subject to the volatility of the international oil markets and import dependence. Hence, there is a push to evaluate biodiesel or other vegetable oils as an alternative to fuel oil in external combustion/boiler applications. For instance, Krishna et al. (2004) reported biodiesel to have a heating value of about 123,000 BTU/gallon which is comparable to the 140,000 BTU/gallon of #2 fuel oil. Biodiesel/bio-fuel oils are low sulfur fuels (0.05% wt sulfur) compared to conventional fuel oils (0.25% wt sulfur) which helps in increasing equipment life. Since biodiesels are more oxygenated than fuel oils, biodiesel blend combustions produce lower smoke emissions (Monyem et al., 2001). Biodiesel usage for boiler heat applications is extensively reported in Italy (Carraretto et al., 2004) and reported with a positive outlook towards use in boilers of about 500 kW scale. Such boilers have potential to be employed as heat providers for reformers in process plants. The emission of NOx is a key issue that definitely requires further studies if the biodiesel use in industrial boilers is to be implemented in the future.
E.3 Biomass Co-Firing
Biomass co-firing is already well practiced in the industry where cheap and reliable dry biomass feedstock (Laux et al., 2000). However, biomass co-firing places large restrictions on the type and preparation of the biomass. It also causes minor changes it the heat rate of the boiler. Since biomass heating value is typically half that of coal (ibid.) it necessitates the feeding of double the mass of biomass as coal if it were to substitute a portion of the coal feed. Such restrictions place limits on the maximum amount of biomass that can be co-fired in utility boilers to about 10-15% of the coal feed (wt%) (Laux et al., 2000).
E.4 Summary
In summary, the key issue to use biomass utilization for energy needs as a CO2 mitigation strategy depends on two factors: a) a feasible method of collection of unwanted solid and liquid organic wastes and delivery to a processing or combustion site; b) the sustainable growth of
73

energy crops in a manner such as to provide net energy (i.e. energy obtained from the crops should exceed overall energy in planting and growing the crops.). When these two broad issues are addressed successfully, biomass can be used to provide a net reduction in overall CO2 emission from power plants and other energy delivery locations. Regards biodiesel, although considerable research has been carried out in the transportation sector, the use of biodiesel and waste cooking oils is still nascent in the heating/industrial sector. Based on available information it appears that biodiesel blends can easily be used in auxiliary oil-fired boilers without many major modifications to existing systems (Carraretto et al., 2004). Keeping overall project constraints of power generation from fossil-fuel based process in mind, it was decided not to pursue biomass usage options further. However, if biomass usage were to be considered as a serious option for power generation, then further research on co-firing options and gasification processes would perhaps yield the best results towards electricity generation. Once suitable feedstocks and availability issues are narrowed down, then analysis on actual plant operation and engineering issues of biomass usage would need to be considered. An additional option could be to evaluate the integration of biomass gasifiers with chemical-looping combustion systems.
74

Appendix F: Oxy-Fuel Combustion Technologies The combustion of fuels in pure oxygen holds the promise of inherently providing a concentrated and capture-ready stream of CO2 which substantially reduces separation costs (Singh et al., 2003). This is because there is no dilution of the combustion air and hence the flue gas volume is substantially reduced and also CO2 concentration in the flue gas is higher than 80% by volume compared to air-based combustion where flue gas CO2 concentrations are in the range of 12-15%. In this section we investigate oxy-fuel combustion technologies and their current technological status.
Oxy-fuel combustion started out as the firing of the fuel in pure oxygen in order to simplify the capture of CO2 by providing a highly enriched stream of carbon dioxide in the flue gas stream (Abraham et al., 1982). However, pure oxygen-fired flames reach very high temperatures (>2500 °C) which can cause material failures in heat transfer equipment, and ash slagging in the furnace (Shao and Golomb, 1996).To avoid these issues, a combination of oxygen and recycled flue gas (O2/RFG) is used in the combustor, to control the flame temperatures and also achieve a highly concentrated stream of CO2 in the flue gas stream that is easy to capture and sequester. A schematic of O2/RFG combustion is shown in Figure F-1.
Figure F-1 Schematic of O /RFG (oxy-fuel combustion). Typical composition of the recycled flue gas (RFG)
consists of H O and CO after the removal of particulates, SO and NO (Image adapted from: Naredi and Soundarrajan, 2005)
2
2 2 x x
Oxy-fuel combustion is fundamentally the same set of chemical reactions that occur in air as far as the primary purpose of combustion reactions. However, when combined with recycled flue gas, a higher proportion of O2 (about 30%) is needed to achieve the same adiabatic flame temperature as in air combustion (O2 proportion in air ~ 21%) (Croiset et al., 2001). In air-firing of fossil fuels, firing is usually done in “excess air” with about 20% extra oxygen in the reaction mixture over the stoichiometric requirements. This leaves about 3-5% oxygen in the flue gas stream (Buhre et al., 2005). In oxy-fuel combustion also “excess O2” is supplied in a proportion to achieve a similar O2 concentration (3-5%) at the flue gas stream. The volume of gases flowing through the furnace is typically reduced compared to air combustion. Hence, a fairly large portion (about 60%) of the flue gas stream is recycled back into the combustor. The CO2
75

obtained in the flue gas can be separated to obtain a high purity stream that can be used for enhanced oil recovery (EOR) (Abraham et al., 1982) or enhanced gas recovery (EGR) (Anderson et al., 2004) or enhanced coal bed methane extraction (ECBM) (Gale and Freund, 2001) or otherwise sequestered (Herzog, 2001).
F.1 Applications
Oxy-fuel combustion technology can be applied to mainly three different types of power plants: 1) pulverized coal-fired (pf) combustion power plants (Buhre et al, 2005 and references therein); 2) circulating fluidized bed power plants (CFB) (Nsakala, et al. 2001); and 3) gas turbine technology (GT) based power plant (Anderson et al., 2004). Oxy-fuel combustion technology is also used in the steel and glass industries, but the reason for use has not been primarily CO2 capture. In this review, oxy-fuel combustion applied to pf plants and of CFB plants would be covered. Bulk of the power generation load in most parts of the world is handled by pf plants. However, CFB based plants are catching on primarily due to substantial savings and ease in sulfur emission reduction for coal-fired combustors (Nsakala et al., 2001). It should be noted that the scale of pf systems is in the range of 500-1000 MWe whereas CFB and GT technologies are still under development and typically limited to scales under 300 MWe for a modular unit. The existence of modular units for CFB and GT technologies makes them an attractive option to scale-up easily for next generation of power plants. Oxy-fuel combustion technologies in pf systems have been reviewed extensively in the recent years. (Kiga et al. 2001, Buhre et al. 2005). Oxy-combustion studies on oil-fired combustion have been conducted with an idea to optimize refinery station boilers (Wilkinson et al., 2002). Few other studies have also been performed on firing of natural gas in nearly pure oxygen environments (Tan et al. 2001; Anderson et al., 2004).
F.2 Operational Issues of Oxygen Generation
Oxygen for oxy-fuel combustion is supplied using an on-site integrated air-separation unit (ASU) or in particular cases can be supplied via pipelines from an off-site ASU. The ASU operation accounts for the bulk of additional cost of electricity generation in oxy-fuel combustion, when compared to conventional air-fired combustion (Okawa et al., 1997). However, when authors have considered the cost of downstream CO2 capture by amine scrubbing as an addition to the pf combustion plant they have found that the overall electricity generation costs are comparable for both oxy- and air-combustion systems (Singh et al., 2003, Liljedahl et al., 2001). Details on efficiencies and cost comparisons are provided later in Table F-1.
F.3 Combustion in the O2/CO2 Environment
Kiga and others have shown that CO2 has a prohibiting effect on flame stability (Kiga et al., 1997). They found that the flame propagation speed in O2/CO2 environment was lower than that in O2/N2. They attributed the instability to the higher heat capacity of CO2 compared to that of N2. The higher heat capacity has also been attributed to delayed flame ignition in oxy-fuel combustion (Kimura et al., 1995). Hence flame ignition and the flame stability are affected in O2/RFG combustion but if the oxygen concentration is maintained above 28-30% the effects are not significantly detrimental (Croiset et al., 2000).
76
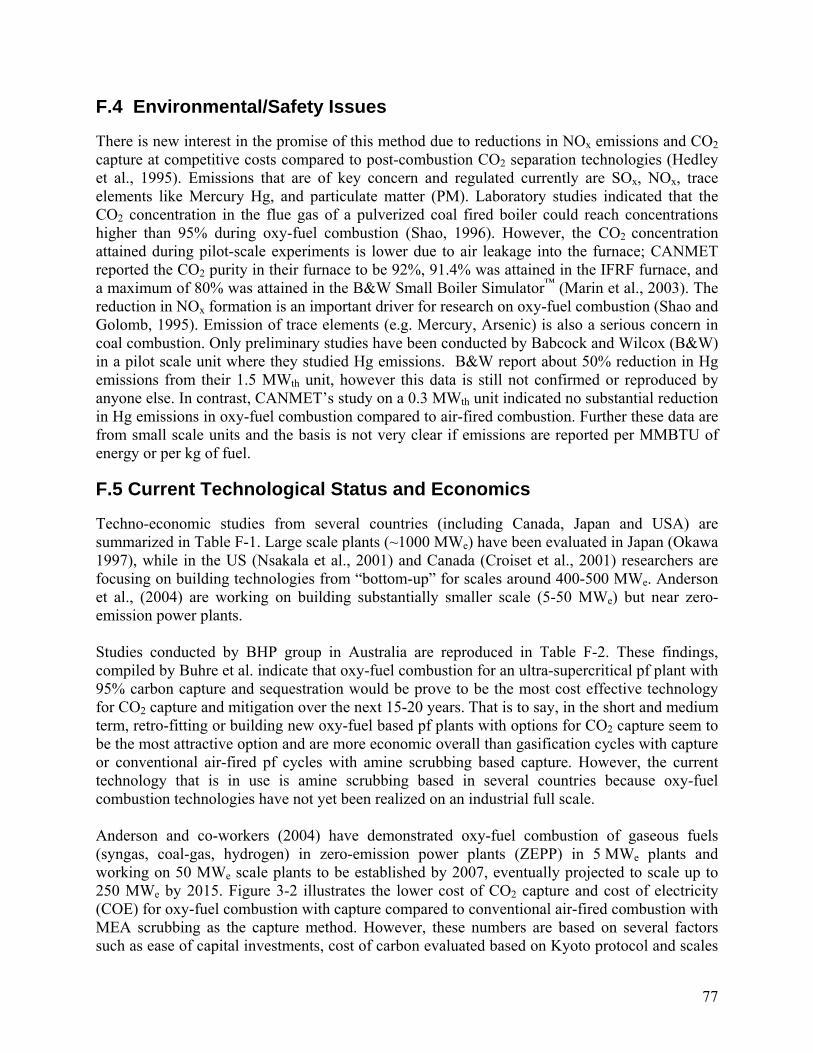
F.4 Environmental/Safety Issues
There is new interest in the promise of this method due to reductions in NOx emissions and CO2 capture at competitive costs compared to post-combustion CO2 separation technologies (Hedley et al., 1995). Emissions that are of key concern and regulated currently are SOx, NOx, trace elements like Mercury Hg, and particulate matter (PM). Laboratory studies indicated that the CO2 concentration in the flue gas of a pulverized coal fired boiler could reach concentrations higher than 95% during oxy-fuel combustion (Shao, 1996). However, the CO2 concentration attained during pilot-scale experiments is lower due to air leakage into the furnace; CANMET reported the CO2 purity in their furnace to be 92%, 91.4% was attained in the IFRF furnace, and a maximum of 80% was attained in the B&W Small Boiler Simulator™ (Marin et al., 2003). The reduction in NOx formation is an important driver for research on oxy-fuel combustion (Shao and Golomb, 1995). Emission of trace elements (e.g. Mercury, Arsenic) is also a serious concern in coal combustion. Only preliminary studies have been conducted by Babcock and Wilcox (B&W) in a pilot scale unit where they studied Hg emissions. B&W report about 50% reduction in Hg emissions from their 1.5 MWth unit, however this data is still not confirmed or reproduced by anyone else. In contrast, CANMET’s study on a 0.3 MWth unit indicated no substantial reduction in Hg emissions in oxy-fuel combustion compared to air-fired combustion. Further these data are from small scale units and the basis is not very clear if emissions are reported per MMBTU of energy or per kg of fuel.
F.5 Current Technological Status and Economics
Techno-economic studies from several countries (including Canada, Japan and USA) are summarized in Table F-1. Large scale plants (~1000 MWe) have been evaluated in Japan (Okawa 1997), while in the US (Nsakala et al., 2001) and Canada (Croiset et al., 2001) researchers are focusing on building technologies from “bottom-up” for scales around 400-500 MWe. Anderson et al., (2004) are working on building substantially smaller scale (5-50 MWe) but near zero-emission power plants. Studies conducted by BHP group in Australia are reproduced in Table F-2. These findings, compiled by Buhre et al. indicate that oxy-fuel combustion for an ultra-supercritical pf plant with 95% carbon capture and sequestration would be prove to be the most cost effective technology for CO2 capture and mitigation over the next 15-20 years. That is to say, in the short and medium term, retro-fitting or building new oxy-fuel based pf plants with options for CO2 capture seem to be the most attractive option and are more economic overall than gasification cycles with capture or conventional air-fired pf cycles with amine scrubbing based capture. However, the current technology that is in use is amine scrubbing based in several countries because oxy-fuel combustion technologies have not yet been realized on an industrial full scale. Anderson and co-workers (2004) have demonstrated oxy-fuel combustion of gaseous fuels (syngas, coal-gas, hydrogen) in zero-emission power plants (ZEPP) in 5 MWe plants and working on 50 MWe scale plants to be established by 2007, eventually projected to scale up to 250 MWe by 2015. Figure 3-2 illustrates the lower cost of CO2 capture and cost of electricity (COE) for oxy-fuel combustion with capture compared to conventional air-fired combustion with MEA scrubbing as the capture method. However, these numbers are based on several factors such as ease of capital investments, cost of carbon evaluated based on Kyoto protocol and scales
77

of power plants in the 300-500 MWe range. It is noted that extension of the costs to larger 1000 MWe scale plants may not be a prudent method without considerable analysis in the newer scale.
Figure F-2 a) Capital cost for CO2 capture, and b) Capital cost of Electricity generation (US$/kW)
(Image adapted from Buhre et al. 2005)
78
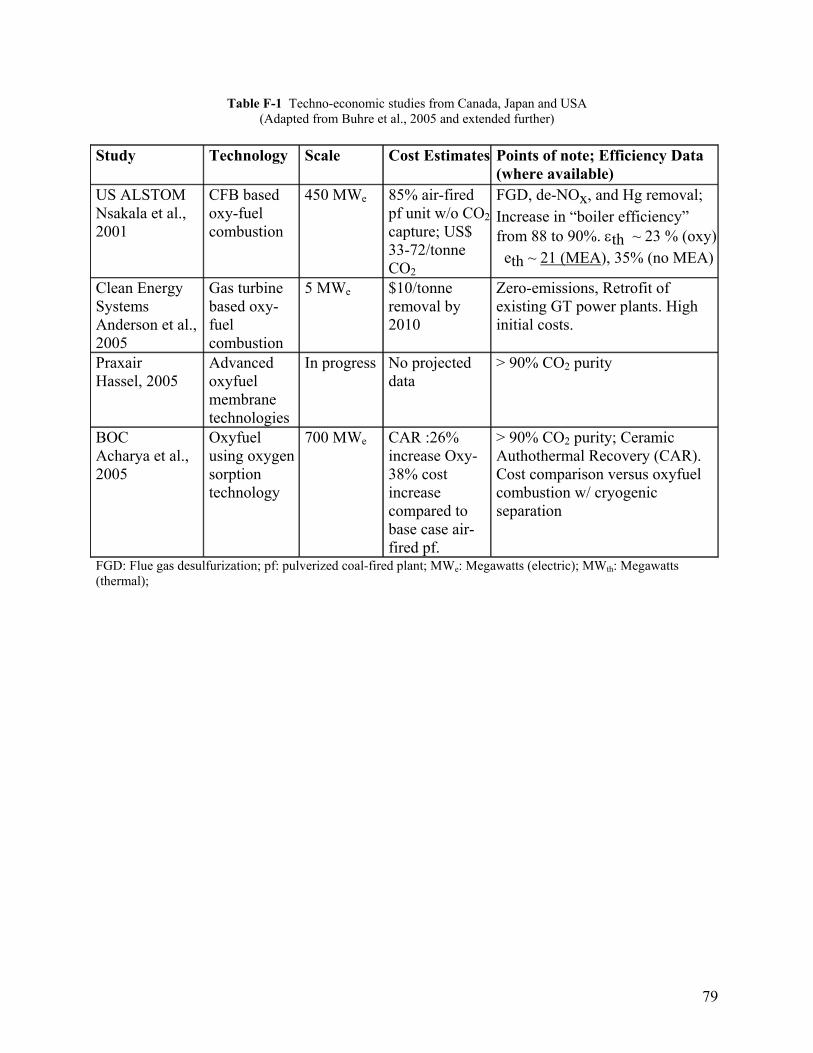
79
Table F-1 Techno-economic studies from Canada, Japan and USA (Adapted from Buhre et al., 2005 and extended further)
Study Technology Scale Cost Estimates Points of note; Efficiency Data
(where available) US ALSTOM Nsakala et al., 2001
CFB based oxy-fuel combustion
450 MWe 85% air-fired pf unit w/o CO2capture; US$ 33-72/tonne CO2
FGD, de-NOx, and Hg removal; Increase in “boiler efficiency” from 88 to 90%. εth ~ 23 % (oxy) eth ~ 21 (MEA), 35% (no MEA)
Clean Energy Systems Anderson et al., 2005
Gas turbine based oxy-fuel combustion
5 MWe $10/tonne removal by 2010
Zero-emissions, Retrofit of existing GT power plants. High initial costs.
Praxair Hassel, 2005
Advanced oxyfuel membrane technologies
In progress No projected data
> 90% CO2 purity
BOC Acharya et al., 2005
Oxyfuel using oxygen sorption technology
700 MWe CAR :26% increase Oxy- 38% cost increase compared to base case air-fired pf.
> 90% CO2 purity; Ceramic Authothermal Recovery (CAR). Cost comparison versus oxyfuel combustion w/ cryogenic separation
FGD: Flue gas desulfurization; pf: pulverized coal-fired plant; MWe: Megawatts (electric); MWth: Megawatts (thermal);

80
Table F-2 Projected cost of Australian Oxy-fuel combustion Plants.
Image reproduced from Buhre et al., 2005

F.6 Summary and Scope
Careful evaluatation of oxy-fuel combustion shows it to be the technologies for the integrated capture of CO2 by facilitating a more concentrated stream of CO2 while achieving higher carbon conversion efficiency (in fossil-fuel-fired combustors). Oxy-fuel combustion technologies were primarily evaluated on the basis of overall thermodynamic efficiency for a 500 MWe scale power plant. Since other technologies considered (e.g., IGCC, CLC, etc.) proved to be of greater efficiency, discussion on the kinetic and mechanistic details of oxy-combustion were not carried out. A preliminary survey of the economics of the overall process does indicate that oxy-combustion might be the choice for retrofitting existing low efficiency pf plants (DOE Vision 21 Report, 2000). Overall, there appears to be a substantial promise in oxy-fuel combustion as a near term to medium term CO2 capture strategy especially if development of advanced oxygen transport membranes achieves success (Acharya et al., 2005). The current costs of cryogenic air separation puts oxy-combustion at a slight disadvantage compared to technologies such as IGCC (with capture) when it comes to implementation of (future) power generation plants with CO2 capture. Several key issues would still need to be addressed to make both retro-fitting and also purpose built plants possible in the near future. However, in order for oxy-combustion to really “catch fire” it is surmised that high temperature O2-separation membrane technologies need to be developed successfully. Additional improvements in the steam cycle of pulverized coal-fired plants by using supercritical steam cycles are also envisaged to improve overall electric generation efficiency (Buhre et al., 2005).
81

Appendix G: Gas Reforming Combined Cycle Natural gas reforming combined cycle is the integrated power plant of hydrogen production and hydrogen combustion turbine cycle. The carbon removal from natural gas prior to hydrogen combustion so that no CO2 is discharged during combustion. There are two parts in a broad range, natural gas reforming for hydrogen production and combined cycle for electric generation. Natural gas reforming encompasses syngas production by partial oxidation or steam reforming of natural gas, subsequent water gas shift (WGS), separation of CO2 and hydrogen by physical or chemical process. (Vielstich, 2003) Combined cycle is mainly composed of gas turbine and steam turbine.
CO2Separation
H2
CO2Reforming *
Natural gas +steam or O2
Shift Reactor Storage
Hydrogen Combustion Turbine Cycle
* Partial Oxidationor Autothermal reformeror Steam reformer
CO2Separation
CO2Separation
H2
CO2Reforming *Reforming *
Natural gas +steam or O2
Shift Reactor
Shift Reactor StorageStorage
Hydrogen Combustion Turbine Cycle
* Partial Oxidationor Autothermal reformeror Steam reformer
Figure G-1 Natural Gas Reforming Combined Cycle Processes (Bill, 2002)
G.1 Technical Issue
The main objective of natural gas reforming is to convert natural gas into a hydrogen-rich reformate gas. Effective reforming must produce relatively pure hydrogen efficiently while generating minimal pollution. If hydrogen is made from natural gas and used as fuel, it would be easier to capture and sequester CO2 than direct combustion of natural gas (Ogden, 2001). There are three main types of natural gas reforming technology: steam reforming(SMR), partial oxidation reforming(POX) and autothermal reforming(ATR) (Vielstich, 2003). The large scale plants are typically based on steam reforming (SR) (Rostrup-Nielsen, 2002; Aasberg-Petersen, 1998). SR processes use a mixture of natural gas fuel and steam taking heat from an external source to drive the reforming reaction. The heat for the endothermic SR reaction is obtained from burning the CH4-based feedstock or recycling the waste gas purged from the hydrogen purification process (Ogden, 2001). ; Δ = (Steam Reforming) 4 2 23CH H O CO H+ → + 298 206 /oH kJ mol
82

ATR combines intrinsic heat characteristics of SR and POX by balancing their respective endothermic and exothermic reactions. The reaction is the summation of the steam reforming and oxidation reactions. Half of the fuel is oxidized to provide heat for the endothermic reforming reaction. (Auto Thermal Reforming) 4 2 2(2 2 ) (3 2 )CH xO x H O CO x H+ + − → + − 2
Under ideal conditions with the appropriate mixture of fuel, air and steam, the reaction can be heat balanced by regulating oxygen/fuel ratio, negating external heat inputs and allowing higher theoretical efficiency than SR (93.9% vs. 91.7%). Although ATR has higher theoretical efficiency than SR, actual results show efficiencies below SR. ATR and POX systems require bringing the combustion air to the pressure of the process stream; therefore, they are energy inefficient in the high pressure environment needed for pure hydrogen separation (Vielstich, 2003). In contrast, the burner in a SR system can operate at atmospheric pressure, requiring no air compression (Ogden, 2001). For this reason, SR is the preferred hydrogen generation technology used for large scale conversion of natural gas into synthesis gas. After reforming, the syngas should be converted to hydrogen-rich gas via WGS reactor. This reaction is exothermic and it takes place when the temperature is in the range 200-600oC. The hydrogen-rich gas should be separated and purified. After the separation process, hydrogen is applied as a fuel to hydrogen combustion turbine cycle. The flue gas after separation is mainly CO2 and can be easily stored or sequestered. The hydrogen combustion turbine is powered by steam generated from the internal combustion of hydrogen as a fuel mixed with stoichiometric oxygen. Since the processes after reforming are almost identical with those after gasification in IGCC, the detailed explanations are omitted in this part.
G.2 Current Technological Demonstrations and Economics
The following tables are summaries of steam methane reforming combined cycle, autothermal reforming combined cycle and membrane reforming combined cycle, which is another type of steam reforming combined cycle, respectively. In order to find out the applicability and compatibility of systems, the necessary values are gathered or calculated based on the results of the published papers. From the comparison of reforming power plant, we recognized that all of natural gas reforming combined cycles with different separation units have 43-51% of electric efficiencies and 40-60kg CO2 emission per MWh (Table B-1).
Table G-1 Parameter Comparison of reforming plants with CO2 capture from review
Conversion Technology Separation Conversion
(%) Scale CO2 emission kgCO2/MWh Reference
SMR-CC Absorption 47.4 400 Mwe 60.4 Kvamsdal, H.M
SMR-CC Absorption 42.9 413 Mwe 56.4 Parsons, E.L
SMR-CC Adsorption 43 20 Kwe N/A Davis, G..
SMR-CC Adsorption 45 30Kwe 36 Clemens, T.G
ATR-CC Absorption 47.9 422 Mwe 57 Bolland, O.
MR-CC membrane 51 1.7 Mwe N/A Damen, K.
83

Steam reforming combined cycle consists of WGS separation of CO2 and hydrogen by physical or chemical absorption and combustion of hydrogen in a gas turbine. In membrane reformer combined cycle (MR-CC), steam methane reforming is integrated with a hydrogen separation membrane. The membrane, placed inside the reforming tube, continuously withdraws hydrogen. In NGCC plants, natural gas is combusted and the hot flue gas is expanded in the turbine, driving the air compressor and a generator. CO2 capture in NGCC is performed by using chemical absorption using amines (MEA). However, from the comparison of various power plant technologies with CO2 capture, the efficiency of natural gas reforming combined cycle is not as high as natural gas combined cycle and the total capital cost is around 40% higher than that of NGCC. Even though membrane reforming combined cycle is comparable in net electric efficiency, the capital cost is also expensive (Table G-2).
Table G-2 Comparison of power plant technology with CO2 capture, (Based on Damen et al., 2006)
Conversion Technology
Net electric Efficiency (%) Efficiency penalty* CO2 capture
Efficiency (%) TCR
(US$/kWH2)
SMR-CC 43-45 8-13 85-90 720-1180
NGCC 43-53 10-13 85-90 560-750
MR-CC 51 5-6 100 750-800*the efficiency penalty refers to the difference with a standard NGCC
Table G-3 shows the comparison of fuel cost, capital cost and cost of electricity in various power plants. Since natural gas is not price-competitive, the cost of electricity of steam reforming combined cycle is higher than those of other coal power plant. Table G-3 Cost Comparison of various power plant technologies (Based on David et al.,2000; Damen et al., 2006)
Type IGCC PC NGCC SMRCC MRCC
Overall Power Plant output(Mwe) 500 500 500 500 500
Fuel Cost (LHV), $/MMBtu 1.24 1.24 4.5 4.5 4.5
Capture Efficiency, % 90 90 90 90 100
Capital Cost ($/kWh) 1,100-1,400 1,100 520-540 750-1180 800
Cost of Electricity, $/MWh 41-46 41-44 41-42 46-51 47
Moreover, natural gas price is expected to increase steadily until the year 2030. The natural gas crisis is typically described by the increasing price of natural gas in the U.S. over the last few years due to the decline in indigenous supply and the increase in demand for electricity generation (EIA, 2006). Since 2000, 23453 MW of new electric capacity was added in the U.S,
84

and 96% of them are natural gas used power plants, which cause rapid demand growth (Naturalgas.org, 2004). As a result, current high natural gas prices discourage the construction of new electricity generation plant using natural gas. Even though high prices of natural gas limit consumption for electric power generation plant, the other technologies of transportation like natural gas vehicle or domestic electricity generator like fuel cell will expedite natural gas demand in the near future.
Figure G-2 Average Delivered Fuel prices to US electric Generator (Natural Gas.org, 2004)
G.3 Summary
Natural gas reforming combined cycle is carefully evaluated as a new 500MW electric generation power plant with CO2 capture. It is evident that natural gas reforming and hydrogen combustion turbine is one of the clean and efficient technologies for electric generation and CO2 capture. However, due to the continuing growth in demand of natural gas and the high capital cost, the realization of the plant construction in U.S. or many other natural gas import countries is not a good option in the economic aspect.
85
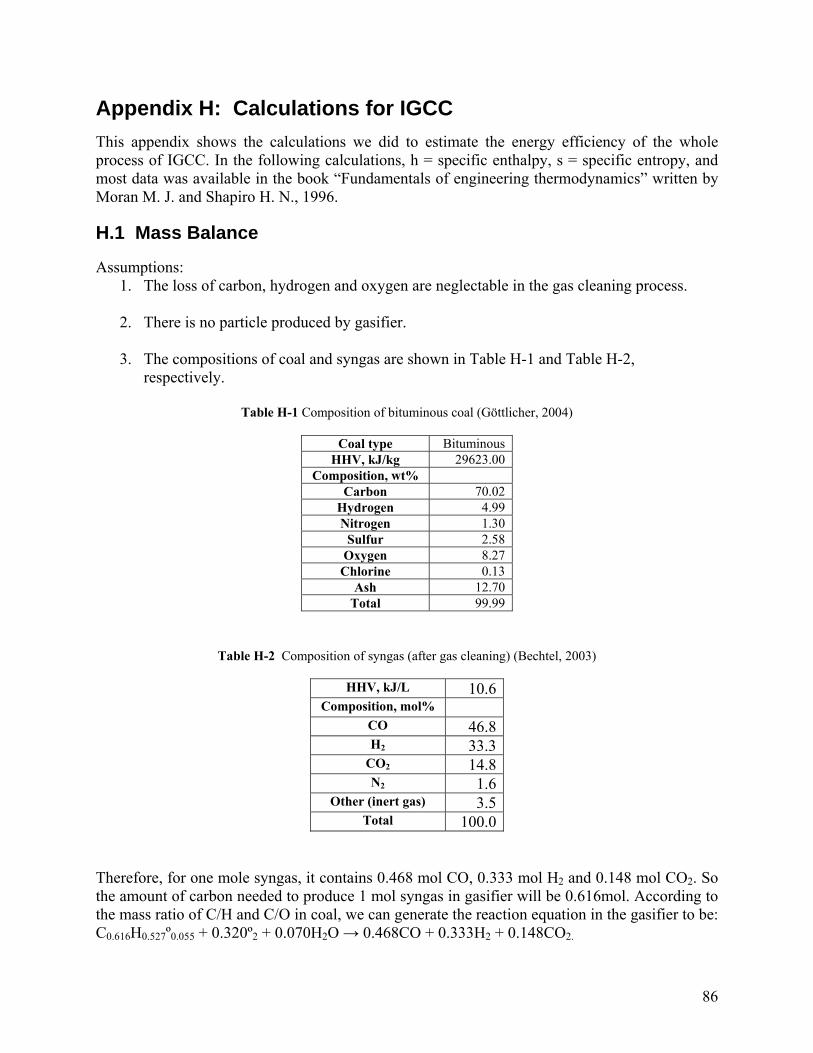
Appendix H: Calculations for IGCC This appendix shows the calculations we did to estimate the energy efficiency of the whole process of IGCC. In the following calculations, h = specific enthalpy, s = specific entropy, and most data was available in the book “Fundamentals of engineering thermodynamics” written by Moran M. J. and Shapiro H. N., 1996.
H.1 Mass Balance
Assumptions: 1. The loss of carbon, hydrogen and oxygen are neglectable in the gas cleaning process. 2. There is no particle produced by gasifier.
3. The compositions of coal and syngas are shown in Table H-1 and Table H-2,
respectively.
Table H-1 Composition of bituminous coal (Göttlicher, 2004)
Coal type Bituminous HHV, kJ/kg 29623.00
Composition, wt% Carbon 70.02
Hydrogen 4.99 Nitrogen 1.30
Sulfur 2.58 Oxygen 8.27
Chlorine 0.13 Ash 12.70
Total 99.99
Table H-2 Composition of syngas (after gas cleaning) (Bechtel, 2003)
HHV, kJ/L 10.6Composition, mol%
CO 46.8H2 33.3
CO2 14.8N2 1.6
Other (inert gas) 3.5Total 100.0
Therefore, for one mole syngas, it contains 0.468 mol CO, 0.333 mol H2 and 0.148 mol CO2. So the amount of carbon needed to produce 1 mol syngas in gasifier will be 0.616mol. According to the mass ratio of C/H and C/O in coal, we can generate the reaction equation in the gasifier to be: C0.616H0.527º0.055 + 0.320º2 + 0.070H2O → 0.468CO + 0.333H2 + 0.148CO2.
86

H.2 Air Separation Unit (ASU)
Assumption:
1. Energy consumption of ASU is 940kJ/kg O2 (Chiesa et al., 2005).
H.3 Gas Cooler (Rankine cycle)
Assumptions:
1. The energy extracted from the gas is due to the gas cooler. 2. Adsorption technology is used to remove H2S in the syngas, the energy consumption can
be neglectable.
3. The syngas coming out of the gas cooler is at 300oC.
4. The properties of Rankine cycle shown in Figure H-1 are as follows: condenser pressure: 5kPa, boiler pressure: 10Mpa, pump is isentropic, turbine efficiency: 75%, steam superheat temperature: 550oC, the minimum temperature difference for heat transfer: 10K.
Table H-2 Apply first law of thermodynamics to combined gasifier/gas cooler
n, mol hf
0, kJ/mol h-h298K, kJ/mol n(hf0+h-h298K), kJ
C0.616H0.527°0.055 1 -58.5 0.0 -58.5O2 0.320 0.0 0.0 -17.1
H2O 0.070 -285.8 0.0 -48.2CO 0.468 -110.5 8.0 -57.2H2 0.333 0.0 12.0 2.6
CO2 0.148 -393.5 8.0 -102.8 Therefore, for 1 mol syngas, the energy extracted from the flue gas in gas cooler is: Q=Hp–HR=-27.2kJ.
87

Condenser
Wp
1 4
WT
2 3
5
6 7
8
9 10
Figure H-1 Scheme of Rankine cyle
At point 7: saturated liquid, 5kPa: h7=137.75kJ/kg, s7=0.4762kJ/kg·K, T7=306K. At point 8: kg/04kJ.10)510000(001005.0)pp(W 787p =−×=−= υ
h8=h7+Wp=147.79kJ/kg, s8=s7, T8=T7. At point 9: saturated liquid, 10Mpa: h9=1407.6kJ/kg, s9=3.3596kJ/kg·K, T9=584K At point 10: saturated vapor, 10Mpa: h10=2724.7kJ/kg, s10=5.6141kJ/kg·K, T10=584K At point 5: 10Mpa, 550oC: h5=3502.0kJ/kg, s5=6.7585kJ/kg·K At point 6: Expand to 5kPa isentropically: the quality at point 6 (f stands for saturated liquid and g stands for saturated vapor):
7935.09176.7
0.47627585.6s
ssx
fg
f56 =
−=
−=
4kJ/kg.20600.24237935.035.137hxhh fg6f6 =×+=+=′
kg/8kJ.2420h4.20600.3502
h0.350275.0
hh
hh6
6
65
65 =⇒−
−=⇒′−
−=η
Therefore,
00811kg.0m)hh(mQ water85water =⇒−=
69kJ.8)]hh()hh[(mWWW 7865pTnet =−−−=−=
88

H.4 Compressor and Gas Turbine (Brayton cycle)
compressor, the air enters the system at 1 atm pressure and 298K, leaves at 20 atm. The compressor has an adiabatic efficiency of 85% and it is adiabatic.
ischarges at 1 atm.
s ware nam combustion. The ftware is available at the website: http://courses.washington.edu/mengr430/
Assumptions:
1. For the
2. The fuel (syngas or hydrogen) arrives at 300oC and 20 atm.
3. The outlet temperature of the combustor is 1600K.
4. The turbine has an adiabatic efficiency of 90% and d A oft ed “EQLBRM” is used to determine the equilibrium state ofso (Kramlich, 2005)
Because the calculation will be a little different brane is combined in IGCC or not, so we will show both calculations as follows. Both calculations are based for 1 mol
kg, s =1.6953kJ/kg·K, P =1.3543.
kg/01kJ.701h20PP =
Figure H-2 Scheme of Brayton cycle
WGS and Pd-based memif
of syngas so that the previous calculations work well with these two parts.
H.4.1 Combustion with Syngas
At point 1: air, 1atm, 298K: h1=298.18kJ/
At point 2: since the pressure ratio is 20, 1 r1
2r1r2′⇒= ,
kg/10kJ.772h18.29h
01.70185.0hh
12C −
=⇒−
=η8 2
212
=⇒
Therefore, T2=481oC, the energy provided for the air compressor is:
18.298hh −−′
kg/92kJ.473hhW 12C =−=&
Fuel 3 4
Flue gas
2 Combustor
WC WT
Compressor Gas turbine Air 1
89

1 mol syngas contains: 0.468mol CO, 0.333mol H2, 0.148mol CO2, 0.016mol N2, with the help f the software, we can find out that when the mass ratio between air and syngas is 8.65, the o
outlet temperature can be 1600K. And at this time, h3=-80.159kJ/kg, s3=7.9229kJ/kg·K.
31g.179m20.73g28016.044148.02333.028468.0m airfuel =⇒=×+×+×+×= So the energy consumed by air compressor is:
98kJ.84WC =
With the software, can be found by changing the outlet temperature of gas turbine until
=
′4h
′
4h =-1065.3kJ/kg 34 ss =′ : when 05KT4′ , ′
4s =7.9223kJ/ kg·K, 8
kg/76kJ,966hh159.h 443 ⇒−−
⇒−
)27.1065(159.80
809.0hh
h4
43
T −−−−
=′−=η
With the software, find out s4 by changing the outlet temperature of gas turbine until get h4. The
sult is: T4=890K, s4=8.039kJ/ kg·K.
re Then the work produced by gas turbine can be found out:
)hh)(mm(W 43fuelairT 177kJ=−+= The flue gas from gas turbine will go through the Rankine cycle in order that the exergy can be onverted to work in steam turbine. The details of the calculation, which is similar with the
the composition will be: O2 14.5%, CO2 2 2
n, the syngas should first go through water-gas shift o that pure hydrogen can be introduced into the
.
embrane consumes no energy.
ccontent before, will not be shown again. The work produced by Rankine cycle can be 34.9kJ. The temperature of the flue gas will be 374K, and3.5%, N 69.0%, H O 3.0%. 1
H.4.2 Combustion with Hydrogen
According our design, before the combustio(WGS) reactor and Pd-based membrane, scombustor. Therefore, some calculations about mass balance in WGS and Pd-based membrane will be done before the Brayton cycle. Besides the assumptions made in the beginning for Brayton cycle, we assume that:
1. Energy loss will be neglectable in the WGS reaction, so all the energy produced by WGS will be used to convert water to steam
2. Since the pressure inside WGS is fairly high (20atm), the compressor before the Pd-based
membrane is not necessary in this case. So the m
90

3.
The l combustion quilibrium mentioned before, we use another software to find out WGS equilibrium state. The ftware is available at the website: http://navier.engr.colostate.edu/tools/equil.html
All the H2 will be separated from the gas mixer completely after membrane.
fo lowing calculations are still based on 1 mol syngas. Besides the software foreso After the reaction in WGS, the composition of gas will be: 0.095mol CO; 0.704mol H2; 0.52mol CO2; 0.016mol N2; 0.095mol H2O; 0.035mol other gas. So 0.372mol CO is converted in WGS, nd net energy (including the energy released by WGS and the energy provided to convert water
unt about 4.93kJ energy, which is almost qual to the amount needed for WGS. Since the difference is pretty small compared to the energy
hen the energy consumed by e compressor for one kilogram of air will be: =& , T =570K.
ato high temperature steam) for this reaction is: 5.52kJ After going through the Pd-based membrane, only the 0.704mol H2 will be left. The flue gas, if used for heating the steam, can provide energy amoeproduced by turbines, it will be neglected in the calculations later. Since the 0.704mol H2 should be around 10atm and 300oC before going into the combustor, so the compressor of air will have a compress ratio of 10 this time. Tth air kg/36kJ.326WC 2
With the help of the software, we can find out the equilibrium after combustion: 91m/m
2Hair = , =1599K, h =319.4kJ/kg, s =8.679kJ/kg·K. So 128g2704.091mari =××= , W =41.8kJ. T3 3 3 C
2.6kJ; the energy produced by Rankine cycle fter gas turbine will be 32.2kJ.
The flue gas composition from the Pd membrane after H2 separation is CO2 – 68.3%, CO – 0 Bar. Flow rate of the flue gas is 4132 mol/s.
o C from 300o C is 36.8 MWt. The heat to
The IGCC system efficiency is calculated as:
Same process of calculations is going to be conducted and details will not be shown here. The energy produced by gas turbine will be: WT=10a
H.5 Heat Exchanger Requirements
12.5%, H2O – 12.5%, N2 – 6.7% at 300o C and 1Heat to be extracted from the flue gas to cool it to 100be lost by the flue gas will be equal to the heat gained by the coolant which is water here. Water is supplied to the heat exchanger at 745 mol/s at 35o C and the steam comes out at 210o C. The steam produced here is recycled to the water gas shift reactor which meets 25% of the steam requirements. Heat exchanger area required for such a cooling is 533 m2.
H.6 System Efficiency
)coal(HHVWW inout∑ ∑−
=η
91

Therefore, based on the previou
s calculations, we can get the following results:
H-3 Results
Efficiency, %
Table
IGCC without CO2 capture 48.5IGCC with post-combustion CO2 capture (absorption) 38.1IGCC with pre-combustion CO2 capture 35.4IGCC (500 MWe @ 35.4%) integrated with CLC (150 MWe @ ~40%) 35.7
92

Appendix I: Gas Transportation Svensson et al. (2005) have identified two main ways of CO2 transportation by pipelines and by shipping. The transportation of CO2 by ships was mainly limited to the applications in the food and brewery industry with the amounts transported in the range of some 100,000 tons of CO2 annually Present day CO2 captured is exponentially higher than the above cited amount. CO2 transportation by pipelines first started in the early 1970’s for transport of the CO2 to the EOR Sites. The first CO2 pipeline construction was completed in 1972 by CRC (canyon reef carriers) to SCAROC oilfield in Texas, USA. The largest existing pipeline is the 808 km long Cortez pipeline from Cortez, Colorado to Denver City in Texas laid in 1984. The CO2 emissions constitute 3 million normal m3 per day of gas volume. To transport all this CO2 to a sequestration site, the construction of a new pipeline or the sharing of an existing pipeline has to be employed.
I.1 Current Status Every year, millions of tons of CO2 are transported in onshore pipelines over long distances for use in The EOR industry. Utilization of CO2 in the EOR industry has an added advantage of the price of the end of the pipe CO2 ranging around ($9-$18)/ton of CO2 (Doctor et. al., 2000). Technologies are being developed for offshore transportation of CO2 using pipe lines but are yet to be commercialized. The ideal physical conditions for the transportation of CO2 using pipelines are that the CO2 should be a liquid or supercritical/dense phases. One of the main advantages of CO2 transportation by pipelines is that there is no need for intermediate storage, i.e. the pipelines provide a steady state flow from the emission source to the final sequestration/ utilization site.
I.2 Present Scenario The present scenario comprises of the problem of the disposal of the CO2 captured from a 500 MWe output coal fired IGCC power plant (Refer to Chapter 2) .The given plant gives out a high concentration CO2 stream along with certain impurities like H2O, Nitrogen and other inert gases.
I.3 Calculations The concentration of CO2 in the stream is 68.5%. The gas is entering the pipeline at 100°C and at a pressure of 10.13 bar. The gas flow rate is 155.9 kg./s and the steady state isothermal behavior of gas in the pipeline is assumed. Another critical assumption made is that the pipeline is laid on a flat stretch of land without any gradient. The pressure drop required for the gas to flow through the length of the pipeline, which is assumed to be at 160.9 km, is calculated by the Pan Handle A equation given in the GPSA Engineering Data Book (Vol. 2) (1998) for natural gas pipelines. The equation is:
[I-1]
6182.25392.0
853.0
22
21
0788.1
87.435 dTZLSP ⎦⎣⎠⎝
PPETQmb
b⎥⎤
⎢⎡ −
⎟⎟⎞
⎜⎜⎛
=
where Q is the flow rate in Cu.ft/s; Tb is the base absolute temperature equal to 520°R; Pb is the pressure (psi) equal to 14.73 psi; E is the pipeline efficiency factor equal to 0.92; P1 is the inlet pressure equal to 10.1325 bar (or ~146.95 psi); P2 is the outlet pressure; S is the specific gravity
93

of gas equal to 22.64; Lm is the length of the pipeline equal to 100 miles (~160.93 km); T is the gas temperature equal to 100°C; Z is the compressibility factor; and D is the diameter of the pipe in ft. Using all the above specified parameters, the pressure drop was determined. The following graph shows the variation of pressure drop as a function of the pipe diameter in inches. DeltaP Vs D(in)
0
5
10
15
20
25
30
35
40
45
0 2 4 6 8 10 12 14 16 18 20 22 24
Pipe diameter (in)
Del
ta P
(psi
)
Figure I-1 Pressure drop (psi) vs. PipeDiameter(in) From the graph, it may be inferred that the smaller the diameter of the pipe, the more pressure drop to compress the gas has to be applied. Based on the pressure drop, the power required to pump the gas through the pipe can be calculated by
Power required to pump the flue gas through the 160.93km pipeline = ΔP x Volumetric flow rate = 232753 Pa x 92.555m3/s = 21.5 MW
I.4 Operational Issues in Transportation
CO2 is a relatively inert gas but becomes mildly acidic in the presence of water. This can lead to corrosion of the pipes and can incur leaks in the pipeline. For this, care should be taken that the gas to be transported in a dry state. Also,CO2 in a dense phase is an excellent solvent and can attack the valve seals thus causing leaks. For this purpose, the right of the way should be carefully monitored for leaks periodically.CO2 in the flue gas stream should not contain any CO for the risk of CO poisoning.
94

References Aasberg-Petersen, K., 1998. Membrane reforming for hydrogen, Catalysis Today: p.193-201. Abanades J.C., Rubin E.S., Anthony E.J., 2004. Sorbent cost and performance in CO2 capture systems. Ind. Eng. Chem. Res. 43: p. 3462-3466. Abraham, B.M., Asbury, J.G., Lynch, E.P. and Teotia, A.P.S., 1982. Coal-oxygen process
provides carbon dioxide for enhanced recovery, Oil Gas J 80 (11): p. 68–70. Acharya, D., Krishnamurthy, K.R., Leison, M., MacAdam, S., Sethi, V., Anheden, M., Jordal, K.
and Yan, J. 2005. Development of a High Temperature Oxygen Generation Process and its Application to Oxycombustion Power Plants with Carbon Dioxide Capture. Proc. 22nd Annual International Pittsburgh Coal Conference, Sep 2005. Paper 19-4.
Adanez, J., Deigo, L.F.d., Garcia-Labiano, F., Gayan, P., Abad, A. and Palacios, J.M., 2004.
Selection of Oxygen Carriers for Chemical-Looping Combustion. Energy & Fuels, 18: p. 371-377.
Adanez, J., Garcia-Labiano, F., de Diego, L., Gayan, P., Abad, A., and Celaya, J., 2005.
Development of Oxygen Carriers for Chemical-Looping Combustion, in Carbon dioxide Capture for Storage in Deep Geologic Formations: Results from the CO2 Capture Project, Thomas, D.C., Editor. Elsevier Science: London. p. 587-604.
Ali J. K., Newson E. J., Rippin D. W. T., 1994. Deactivation and regeneration of Pd=Ag
membranes for dehydrogenation reactions. Journal of Membrane Science, 89: 171-184. Alie,C., Backham,L., Croiset,E., Douglas,P.L., 2005, Energy Conversion and management,46,
p. 475-487. Alpay E., Ding Y., 2000. Equilibria and kinetics of CO2 adsorption on hydrotalcite adsorbent.
Chem. Eng. Sci. 55: p. 3461-3474. Alptekin, G., Lind, J., Amalfitano, R., and Copeland, R., 2003: Sorbents for Mercury Removal from Coal-Derived Synthesis Gas. TDA Research, Inc. Available at http://www.tda.com/Library/docs/Alptekin_NETL_Mercury%20Removal.pdf.
Amick, P., Geosits, R., Herbanek, R., Kramer, S., and Tam, S, 2002: A Large Coal IGCC Power Plant. Nineteenth Annual International Pittsburgh Coal Conference
Anderson, R.E., Doyle, S.E., Pronske, K.L., 2004. Demonstration and Commercialization of Zero-Emission Power Plants, 29th International Technical Conference on Coal Utilization & Fuel Systems, 2004, Clearwater, FL, USA URL access date: Jan 15th 2006. available: http://www.cleanenergysystems.com/2005/mediakit/CES_Clearwater_Paper_2004.pdf.
95

Anheden, M. and Svedberg, G., 1998. Exergy analysis of chemical-looping combustion systems. Energy Conversion and Management, 39(16-18): p. 1967-1980.
Armor J. N., 1998. Applications of catalytic inorganic membrane reactors to refinery products. Journal of Membrane Science, 147: p.217-233. Atkins, P. and de Paula, J., 2002. Physical Chemistry. Oxford University Press, New York, 1150 p. Audus, H. and Freund, P., 2004. Climate change mitigation by biomass gasification combined with CO2 capture and storage. Proc.7th Intl. Conf. Greenhouse Gas Control Tech., (1): Peer-Reviewed Papers and Plenary Presentations, Cheltenham, UK.
Barsema J. N., Klijnstra S. D., Balster J. H., van der Vegt N. F. A., Koops G. H., Wessling M., 2004. Intermediate polymer to carbon gas separation membranes based on Matrimid PI. Journal of Membrane Science, 238: p. 93-102. Bechtel, 2003. Gasification Plant Cost and Performance Optimization. Accessed: 3/24/2006.
Available: http://www.fischer-tropsch.org/DOE/DOE_reports/AC26-99FT40342/AC26-99FT40342_toc.htm.
Bergman, P., Boersma A., Kiel., J, Prins, M., Ptasinski, K., Janssen, F., 2004: Torrefaction for Entrained-Flow Gasification of Biomass. Presented at “The 2nd World Conference and Technology Exhibition on Biomass for Energy, Industry and Climate Protection”
Bill, A., Overview of Techniques and Approaches to CO2 Capture, [access 2006 February, 21st]; available from www.natural-resources.org/minerals/CD/docs/regional/unece/ workshop/Bill_Alstom_IEAGHG.ppt.
Bolland, O., 2000. Exergy analysis of gas turbine combined cycle with CO2 capture using auto thermal reforming of natural gas, , Norwegian University of science and technology, proceeding of ESCAPE 10 conference. Booras, G.. and Holt, N., 2004: Pulverized Coal and IGCC Plant Cost and Performance Estimates. Gasification Technologies, 2004 Bredesen R., Jordal K., Bolland O., 2004. High-temperature membranes in power generation with CO2 capture. Chemical Engineering and Processing, 43: p. 1129-1158. Bressan, L., Domenichini, R.M. and Davison, J., 2003. Coal Power Plants with CO2 Capture: the IGCC option, Proc. Gasification Technologies 2003, San Francisco, California
Buhre, B.J.P., Elliott, L.K., Sheng, C.D., Gupta, R.P. and Wall, T.F., 2005. Oxy-fuel combustion technology for coal-fired power generation, Prog. Ener. Comb. Sci., 31(4): p. 283-307.
96

Burchell, T.D., Judkins, R.R., Rogers, M.R., Williams, A.M., 1997. A novel process and material for the separation of carbon dioxide and hydrogen sulfide gas mixtures. Carbon. 35 (9):p. 1279–1294. Buxbaum R. E., Kinney A. B., 1996. HydrogenTransport through Tubular Membranes of Palladium-Coated Tantalum and Niobium. Industrial & Engineering Chemistry Research, 35: p. 530-537. Carraretto, A. Macor, A. Mirandola, A. Stoppato and S. Tonon, 2004. Biodiesel as alternative
fuel: Experimental analysis and energetic evaluations, Energy, 29(12-15): p. 2195-2211. Chen H., Kovvali A.S., Majumdar S., Sirkar K.K., 1999. Selective CO2 Separation from CO2- N2 Mixtures by Immobilized Carbonate-Glycerol Membranes Ind. Eng. Chem. Res., 38,p: 3489-3498. Chen H., Kovvali A.S., Sirkar K.K., 2000. Selective CO2 Separation from CO2-N2 Mixtures by Immobilized Glycine-Na-Glycerol Membranes Ind. Eng. Chem. Res., 39, p: 2447-2458. Chiesa P., Consonni S., Kreutz T., Williams R., 2005. Co-production of hydrogen, electricity and
CO2 from coal with commercially ready technology. Part A: Performance and emissions. International Journal of Hydrogen Energy, 30: p.747-767.
Cho, P., Mattisson, T. and Lyngfelt, A., 2005. Carbon formation on nickel and iron oxide-
containing oxygen carriers for chemical-looping combustion. Industrial & Engineering Chemistry Research, 44(4): p. 668-676.
Cho, P., Mattisson, T. and Lyngfelt, A., 2006. Defluidization conditions for a fluidized bed of iron oxide-, nickel oxide-, and manganese oxide-containing oxygen carriers for chemical-looping combustion. Industrial & Engineering Chemistry Research, 45(3): p. 968-977.
Clemens, T.G., Wit, K., 2001. Zero emission power generation-power plant concepts and CO2 injection into gas fields, Shell Technology EP, [access 2006 February,21nd]; available from:www.seqnederland.nl/documenten/011201_zepp_novem_shell_ report.pdf.
Collins J. P., Way J. D., 1993. Preparation and characterization of a composite palladium- ceramic membrane. Industry & Engineering Chemistry Research, 32: p. 3006-3013. ConocoPhillips Technology, 2006. [Acessed 2006 March 30]. Available from: http://www.coptechnologysolutions.com. Corti A., Fiaschi D., Lombardi L., 2004. Carbon dioxide removal in power generation using membrane technology. Energy, 29: p.2025-2043. Croiset, E., Thambimuthu K.V., and Palmer A. 2000. Coal combustion in O2/CO2 Mixtures Compared with Air. Can J. Chem Eng ;78: p. 402–7.
97

Cynara membrane CO2 separation system–NATCO group. [cited 2005 January 13th]; available: http://www.natcogroup.com/Content.asp?t=ProductPage&ProductID=23. Damen, K., 2006. Comparison of electricity and hydrogen production systems with CO2 capture and storage Part A: Review and selection of promising conversion and capture technologies, Progress in energy and combustion: p. 1-32. Damen, K., An integral comparison of hydrogen and electricity production system with CO2 capture and storage by means of a chain analysis, Copernicus Institute, Dept. STS, Utrecht University, [accessed 2006 February, 15th]; available: http://uregina.ca/ghgt7/PDF/papers/nonpeer/138.pdf. David, J. and Herzog, H., 2000. The cost of carbon capture, the Fifth International Conference on Greenhouse Gas Control Technologies, Cairns, Australia. Davis, G.., 2002. A novel steam reforming reactor for fuel cell distributed power generation, California energy commission, public interest energy research California energy commission consultant report, [accessed 2006 February,12nd]; available from: www.energy.ca.gov/reports/2002-01-11_600-00-041.pdf. Demirbas, A. and Meydan, F., 2004. Utilization of Biomass as Alternative Fuel for External
Combustion Engines, Energy Sources, 26(13): p. 1219-1226. Doctor, R.D., 2000. Transporting CO2 recovered from fossil energy cycles.In: Fifth International
Conference on Green House Gas Control Technologies, Cairns, August 13 -16. pp 567 – 571
Dortmundt D. and Doshi K., 1999. Recent developments in CO2 removal membrane technology. [cited 2006 January 15th]; available from http://www.Uop.com/objects/84CO2RemvbyMembrn.pdf EIA, 2002. Energy Information Administration, Emissions of Greenhouse Gases in the United States 2001, Washington D.C. 2002. [Accessed 2006 Jan. 18] Available: http://www.eia.doe.gov/oiaf/1605/ggccebro/chapter1.html. EIA, 2006, Oil and Natural Gas Projections, Annual energy outlook 2006 with projections to 2030, Energy Information Administration, [accessed 2006 February, 15nd]; available from: http://www.eia.doe.gov/oiaf/aeo/pdf/trend4.pdf. Eide, L., and Bailey, D., 2005: Precombustion Decarbonisation Processes. Oil & Gas Science and Technology-Rev. IFP, 60 (3), p 475-484. Elwell, L., and Grant, W., 2005: Technical Overview of Carbon Dioxide Capture Technologies for Coal-Fired Power Plants, MPR Associates, Inc
98

EPA Report, 1998. Stationary Source Control for Fine Particulate Matter. [Accessed 2006 April 10]. Available from: http://www.epa.gov/ttn/catc/dir1/finepmtech.pdf EPA, 2005. Health affects notebook for hazardous air pollutants. Accessed: Feb. 12, 2006. Available from: http://www.epa.gov/ttnatw01/hlthef/hapindex.html. Feron P., Jansen A., Klaassen, R., 1992. Membrane technology in carbon dioxide removal Energy Convers. Management, 33:p. 421 – 428. Gabelman A., Hwang S.T 1999. Hollow fiber membrane contactors, Journal of Membrane Science, 159: p. 61-106. Gale J., and Davidson J. 2002. Transmission of CO2 – safety and economic considerations.In:
Sixth International Conference on Green House Gas Control Technologies, Kyoto, September1 - 4 pp. 578 – 584
Gale, J. and Freund, P., 2001. Coal-Bed Methane Enhancement with CO2 Sequestration
Worldwide Potential, Environmental Geosciences, 8(3): p. 210
Gambini, M., 2005, Comparative analysis of H2/O2 cycle power plants based on different hydrogen production systems from fossil fuels, International Journal of hydrogen Energy 30 (2005) p. 593-604. Garcia-Labiano, F., Adanez, J., de Diego, L.F., Gayan, P. and Abad, A., 2006. Effect of pressure
on the behavior of copper-, iron-, and nickel-based oxygen carriers for chemical-looping combustion. Energy & Fuels, 20(1): p. 26-33.
Garcia-Labiano, F., de Diego, L.F., Adanez, J., Abad, A. and Gayan, P., 2005. Temperature variations in the oxygen carrier particles during, their reduction and oxidation in a chemical-looping combustion system. Chemical Engineering Science, 60(3): p. 851-862.
Gasification plant cost and performance optimization, United States Department of Energy National Energy Technology Laboratory, 2002.
Geankoplis, J. C. Transport processes and separation process principles, 4th ed.; Prentice Hall: Englewood Cliffs, NJ, 2003; Chapter 13. Gottlicher G., Pruschek R., 1997. Comparison of CO2 removal systems for fossil-fuelled power plant processes Energy Conversion and Management, 38: p. S173 – S178. Göttlicher, G., 2004: The Energetics of Carbon Dioxide Capture in Power Plants, Translated by APEX Translations, Inc. GPSA Engineering Data Book, 1998. FPS Version, Vol. 2, Section 17, 11th edition, Grasa, G., Wellman, R., Kilgallon, P., Simms N., and Oakey, J., 2004: Novel Hot Gas Cleaning/Heat Recovery System, Cranfield University.
99

Griffin, T.A.M., J.L. and Nsakala, N., 2003. CO2 Control Technologies. Alstom Power Approach. In: J.a.K. Gale, Y., eds., (Editor), Greenhouse Gas Control Technologies. Elsevier, Amsterdam, Kyoto, Japan Gu X., Dong J., Tina M.N. 2005 Synthesis of Defect-Free FAU-Type Zeolite Membranes and Separation for Dry and Moist CO2/N2 Mixtures. Industrial Engineering and Chemical Research, 44:p. 937-944. Gugliuzza A., Drioli E., 2005. Evaluation of CO2 permeation through functional assembled mono-layers: relationships between structure and transport. Polymer, 46: p. 9994-10003. Hagg M.B., Lindbrathen A., 2005. CO2 Capture from Natural Gas Fired Power Plants by Using Membrane Technology. Ind. Eng. Chem. Res, 44: p. 7668-7675 Hassel, B.V. 2005. Advanced Oxyfuel Boilers and Process Heaters for Cost Effective CO2 Capture and Sequestration – Annual Technical Progress Report, DOE Technical Report DE-FC26-01NT41147. Accessed on Feb 1, 2006. Available: http://www.osti.gov. Hedley, JT; Pourkashanian, M; Williams, A., 1995. NOx formation in large-scale oxy-fuel flames, Combustion Science and Technology, 108 (4-6): p. 311-322. Hendriks, C. 1994. Carbon Dioxide Removal from Coal Fired Power Plants, Kluwer Academic Publishers. Herzog, H., 1999: An Introduction to CO2 Separation and Capture Technologies, MIT Energy Laboratory, MIT, Cambridge, MA. Available at http://sequestration.mit.edu/pdf/introduction_to_capture.pdf. Herzog, H.J., 2001. What future for carbon capture and sequestration? Environmental science & technology, 35(7): p. 148A -153A. Hong-Yan,Z., Wang,R., David T. L., Joo Hwa, Tay,J.H., 2006. Modeling and experimental study of CO2 absorption in a hollow fiber membrane contactor, Journal of Membrane Science (article in press). Huang, J., El-Azzami, L., and Winston Ho, W.S., 2005. Modeling of CO2-selective water gas shift membrane reactor for fuel cell. Journal of Membrane Science, 261: p.67-75. Hutson N.D., Speakman S.A., Payzant E.A., 2004. Structural effect on the high temperature adsorption of CO2 on a synthetic hydrotalcite. Chem. Mater. 16: p. 4135-4143. Inui Y, Matsumae T, Koga H, Nishiura K, 2005. High performance SOFC/GT combined power generation system with CO2 recovery by oxygen combustion method, Energy Conversion and Management, 46 (11-12):p. 1837-1847.
100

Ishida, M. and Jin, H., 1994. A novel combustor based on chemical-looping reactions and its reaction kinetics. Journal of Chemical Engineering of Japan, 27(3): p. 296-301. Ishida, M. and Jin, H., 1996. A Novel Chemical-Looping Combustor without NOx Formation. Ind. Eng. Chem. Res., 35: p. 2469-2472. Ishida, M. and Jin, H., 1997. CO2 recovery in a power plant with chemical looping combustion. Energy Conversion and Management, 38(Supplemental): p. S187-S192. Ishida, M., Jin, H.G. and Okamoto, T., 1998. Kinetic behavior of solid particle in chemical- looping combustion: Suppressing carbon deposition in reduction. Energy & Fuels, 12(2): p. 223-229. Ishida, M., Takeshita, K., Suzuki, K. and Ohba, T., 2005. Application of Fe2O3-Al2O3 Composite particles as solid looping material of the chemical-loop combustor. Energy & Fuels, in publication. Ishteiwy O., Thoen P. M., Roa F., Way J. D., 2005. Pd-Cu alloy composite membranes for high temperature hydrogen separation. DOE University Coal Research Contractor’s Review, Meeting June 7, 2005. Itoh N., Tomura N., Tsuji T., Hongo M., 2000. Deposition of palladium inside straight mesopores of anodic alumina tube and hydrogen permeability. Microporous and Mesoporous Materials, 39: p. 103-111. Jiang L., Chung T., Li D. F., Cao C., Kulprathipanja S., 2004. Fabrication of Matrimid/polyethersulfone dual-layer hollow fiber membranes for gas separation. Journal of Membrane Science, 240: p. 91-103. Jin, H.G. and Ishida, M., 2004. A new type of coal gas fueled chemical-looping combustion. Fuel, 83(17-18): p. 2411-2417. Johansson, E., Mattisson, T., Lyngfelt, A., and Thunman, H., 2006. A 300 W laboratory reactor system for chemical-looping combustion with particle circulation. Fuel, 85: p. 1428- 1438. Jun C., Lee K., 1999. Preparation of palladium membranes from the reaction of Pd(C3H3)(C5H5)
with H2: wet-impregnated deposition. Journal of Membrane Science, 157:p. 107-115. Kiga T, Takano S, Kimura N, Omata K, Okawa M, Mori T, et al., 1997. Characteristics of pulverised-coal combustion in the system of oxygen/recycled flue gas combustion. Energy Conversion and Management; 38: p. S129-S34. Kim Y. K., Park H. B., Lee Y. M., 2004. Carbon molecular sieve membranes derived from thermally labile polymer containing blend polymers and their gas separation properties. Journal of Membrane Science, 243: p. 9-17.
101

Kim, T.-J.; Li, B.; Hagg, M.-B., 2004. Novel fixed-site-carrier polyvinylamine membrane for CO2 capture. J. Polym. Sci., Part B: Polym. Phys., 42: p. 426-4336. Kimura K, Omata K, Kiga T, Takano S, Shikisima S., 1995. Characteristics of pulverized coal combustion in O2/CO2 mixtures for CO2 recovery. Energy Conversion and Management, 36: p. 805-808. Klett, M., Maxwell, R., and Rutkowski, M., 2002: The Cost of Mercury Removal in an IGCC Plant, DOE Report. Available at: http://www.gasification.org/Docs/DOE_Parsons_Mercury_Final_Report.pdf. Ko, T-H., Chu, H., Lin, H-P, and Peng, C-Y., 2006. Red soil as a regenerable sorbent for high temperature removal of hydrogen sulfide from coal gas. Journal of Hazardous Materials, In Press. Kramlich, J.: 2005, Advanced energy system, [accessed 2006 March, 20th]; available: http://courses.washington.edu/mengr430/au05. Krishna, C.R., Tyson, S.K. (monitor), 2004. Biodiesel Blends in Space Heating Equipment,
NREL Technical Report No: NREL/SR-510-33579, URL: www.nrel.gov/docs/fy04osti/33579.pdf. [accessed 2006 Jan 15].
Kronberger, B., Johansson, E., Loffler, G., Mattisson, T., Lyngfelt, A. and Hofbauer, H., 2004. A
Two-Compartment Fluidized Bed Reactor for Co2 Capture by Chemical-Looping Combustion. Chemical Engineering & Technology, 27(12): p. 1318-1326.
Kronberger, B., Loffler, G. and Hofbauer, H., 2005. Simulation of mass and energy balances of a
chemical-looping combustion system. Clean Air, 6: p. 1-14. Kusakabe K., Kuroda T., Morooka S., 1998. Separation of carbon dioxide from nitrogen using ion-exchanged faujasite-type zeolite membranes formed on porous support tubes. Journal of Membrane Science, 148: p. 13-23. Kusakabe K., Kuroda T., Murata A., Morooka S., 1997. Formation of a Y-type Zeolit membrane on a porous α-alumina tube for gas separation. Industrial & Engineering Chemistry Research, 36: p. 649-655. Kvamsdal, H.M., 2000. Natural gas fired power plant with CO2 capture-process integration for high fuel to electricity conversion efficiency, proceeding of ESCAPE 10 conference. Lagorsse S., Magalhaes F. D., Mendes A., 2004. Carbon molecular sieve membranes sorption, kinetic and structural characterization. Journal of Membrane Science, 241: p. 275-287. Lamarre, L. 1994. Electricity From Whole Trees, EPRI Journal, p. 16-24, Jan/Feb.
102

Langeland K., Wilhelmsen K., 1993. A study of the costs and energy requirement for carbon dioxide disposal. Energy Conversion and Management, 34: p.807 - 803. Larminie J. and Dicks A., 2004. Fuel cell systems Explained. John Wiley & Sons: New York Laux, S., Grusha, J. and Tillman, D.A. 2000. Co-firing of Biomass and Opportunity Fuels in
Low NOx Burners, 25th Intl. Tech. Conf. on Coal Utilization & Fuel Systems, Clearwater, FL., March 6 - 9, 2000.
Li S., Falconer J. L., Noble R. D., 2004. SAPO-34 membranes for CO2/CH4 separation. Journal
of Membrane Science, 241: p. 121-135. Lide, D.R., 2002. CRC Handbook of Chemistry and Physics. CRC Press, p. 2656 . Liljedahl, G., Marion, J., Nsakala, N.Y., Bozzuto, C., Palkes, M. and Vogel, D. et al., 2001.
Technical and economical feasibility of CO2 capture on an existing us coal-fired power plant, International Joint Power Generation Conference, New Orleans, LA.
Lyngfelt, A., Leckner, B. and Mattisson, T., 2001. A Fluidized-Bed Combustion Process with
Inherent CO2 Separation; Application of Chemical-Looping Combustion. Chemical Engineering Science, 56(10): p. 3101-3113.
Lyngfelt, A., and Thunman, H., 2005. Construction and 100h of operational experience of a 10-
kW chemical-looping combustor. In: Carbon dioxide capture for storage in deep geologic formations, volume 1. Elsevier Ltd.: p. 625-646.
Mah, A.D. and Pankratz, L.B., 1976. Contributions to the data on theoretical metallurgy:
Thermodynamic properties of nickel and its inorganic compounds. In: U.S.D.O.T. Interior (Editor). Bureau of Mines, p. 125.
Marin O, Chaˆtel-Pe´lage F, Perrin N, Chen S, Lu Q, Rostam- Abadi M, et al.2003 Economic analysis of oxygen-fired coal boiler. 28th international conference on coal utilisation & fuel systems, Clearwater, FL, March. Mariz C.L., 1998. Carbon Dioxide Recovery: large scale Design Trends, Journal of Canadian petroleum Technology, vol 37.p. 556 – 567 Mattisson, T., Johansson, M. and Lyngfelt, A., 2006. The Use of Nio as an Oxygen Carrier in Chemical-Looping Combustion. Fuel, 85(5-6): p. 736-747. Mattisson, T., Lyngfelt, A. and Cho, P., 2001. The use of iron oxide as an oxygen carrier in chemical-looping combustion of methane with inherent separation of CO2. Fuel, 80: p. 1953-1962.
103

Metz, B., Davidson, O., Coninck, H., Loos, M., and Meyer, L., 2005: IPCC Special Report Carbon Dioxide Capture and Storage Summary for Policymakers, United Nations Framework Convention on Climate Change. Mimura, T., Satsumi, S., Iijima, M. and S. Mitsuoka., 1999. Developments on energy saving Technology for flue gas carbon dioxide recovery by the chemical absorption method andsteam system in power plant”, in Greenhouse Gas Control Technologies (ed. by Eliasson B.,Riemer P. and A. Wokaun), Proceedings of the 4th International Conference on Greenhouse Gas Control Technologies, 30 August – 2 September 1998, Interlaken, Switzerland, ElsevierScience Ltd. Moran, M.J. and H.N. Shapiro, 1996. Fundamentals of engineering thermodynamics. Moss T. S., Peachey N. M., Snow R. C. Dye R. C., 1998. Multilayer metal membranes for hydrogen separation. International Journal of Hydrogen Energy, 23: p. 99-106. NAE and BEES, 2004: National Academy of Engineering and Board of Energy and Environmental Systems. The Hydrogen Economy: Opportunities, Costs, Barriers, and R&D Needs. Accessed Feb. 11, 2006. Available: http://www.nap.edu/books/0309091632/html/240.html. Nam S., Lee S., Lee K., 1999. Preparation of palladium alloy composite membrane supported in a porous stainless steel by vacuum electrodeposition. Journal of Membrane Science, 153: p. 163-173. Naredi, P. and Soundarrajan, N. 2005, Oxy-Fuel Combustion for CO2 Recovery from Power Plants, Poster presentation – Sponsor Days 2005, Pennsylvania State University. NaturalGas.org, 2004, Electric Generation Using Natural Gas, [accessed 2006 March, 20th]; available from: http://www.naturalgas.org/overview/uses_eletrical.asp.
Nsakala N.Y, Marion J., Bozzuto C., Liljedahl G., Palkes M., Vogel D. and Gupta, J.C. 2001. Engineering feasibility of CO2 capture on an existing us coal-fired power plant. First National Conference on Carbon Sequestration, Washington D.C. Ogden, J.M, 2001. Review of small stationary reformers for hydrogen production, a report for the international energy agency , Agreement on the production and utilization of hydrogen, Task 16, Hydrogen from carbon-containing material, IEA/H2/TR-02/002. Okawa M, Kimura N, Kiga T, Takano S, Arai K. and Kato M., 1997. Trial design for a CO2 recovery power plant by burning pulverized coal in O2/CO2. Energy Convers. Mgmt. 38 (Suppl.):p. S123–S7. Orme C. J., Klaehn J. R., Stewart F. F., 2004. Gas permeability and ideal selectivity of poly[bis- (phenoxy)-phosphazene], poly[bis-(4-tert-butylphenoxy)phosphazene], and poly[bis-(3,5- di-tert-butylphenoxy)1.2(chloro)0.8phosphazene]. Journal of Membrane Science, 238: p. 47-55.
104
Othman, M.R., Rasid, N.M., Fernando, W.J.N., 2006. Mg–Al hydrotalcite coating on zeolites for improved carbon dioxide adsorption. Chemical Engineering Science. 1: p.1556-1560. Parsons, E.L, 2002. Advanced Fossil Power systems Comparison Study, National Energy Technology Laboratory, Final Report, [accessed 2006 February, 20th]; available from: http://www.netl.doe.gov/publications/others/techrpts/AdvFossilPowerSysCompStudy.pdf . Prins, M., 2005: Thermodynamic analysis of biomass gasification and torrefaction, Technische Universiteit Eindhoven. Roa F., Way J. D., McCormick R. L., Paglieri S. N., 2003. Preparation and characterization of Pd-Cu composite membranes for hydrogen separation. Chemical Engineering Jouranl, 93: p. 11-22. Rosen, M.A., 1996. Thermodynamic comparison of hydrogen production processes, International Journal of hydrogen energy, Vol. 21, No. 5: p. 349-365. Rosen, M.A., 1998.Comparative efficiency assessments for a range of hydrogen production processes, International Journal of hydrogen energy, Vol. 23, No. 8:p. 653-659. Rosengerg, W., 2005. Financing IGCC for Near Term Deployment. Rostrup-Nielsen, J.R., 2002 Syngas in perspective, Catalysis Today 71: p. 243–247. Sander M.T and Mariz C.L, 1992. The Fluor Daniel Econamine Energy Process: past experience and present day focus, Energy Conversion and Management, 33(5-8), p. 341-349 Shao, YL; Golomb, D, Brown, G., 1995.Natural gas-fired combined-cycle power-plant with CO2 capture, Energy Conversion and Management, 37 (12): p. 1115-1128. Shao, YL; Golomb, D., 1996. Power plants with CO2 capture using integrated air separation and flue gas recycling, Energy Conversion and Management, 37 (6-8): p. 903-908. Shilling, N. and Lee, D., 2003: IGCC – Clean Power Generation Alternative For Solid Fuels, PowerGen Asia. Sigma Aldrich, 2006. Critical diameter information. Accessed: 3/17/2006. Available: http://www.sigmaaldrich.com/Brands/Aldrich/Tech_Bulletins/AL_143/Molecular_Sieves .html. Simento, N., 2005: IGCC Power Generation, Manager Technology. Available at http://www.ccsd.biz/factsheets/igcc.cfm
105

Simmonds,M. and Hurst,P. 2005. Post Combustion Technologies for CO2 Capture: A Techno- economic overview of selected options. Accessed 25th January 2006. Available: http://uregina.ca/ghgt7/PDF/papers/nonpeer/471.pdf. Singh, D., Croiset, E., Douglas, P.L. and Douglas, M.A., 2003. Techno-economic study of CO2 capture from an existing coal-fired power plant: MEA scrubbing Vs. O2/CO2 recycle combustion, Energy Convers. Manage. 44: p. 3073-3091. Sircar, S., Anand, M., Carvill, B.T., Hufton, J., Mayorga, S., Miller, B., 1995. Sorption enhanced reaction process (SERP). Proc. 1995 USDOE Hydrogen Program Rev. 1: p. 815–832. Song, H.K., Lee, K.H., 1998. Adsorption of carbon dioxide on chemically modified carbon adsorbents, Separ. Sci. Technol. 33 (13): p. 2039–2057. Steinberg M., 1985. A Systems Study for the Removal, Recovery and Disposal of the Carbon Dioxide from Fossil Fuel Power Plants in the US. Proc., Annu. Meet., Air Pollut. Control Assoc.; Vol 3; Air Pollution Control Association annual meeting and exhibition; Detroit, MI. Sugisita, 1998. A study of thermodynamic cycle and system configurations of hydrogen combustion turbines, 1998, International Journal of Hydrogen Energy, Volume 23, Issue 8, p. 705-712. Svensson R., Odenberger M., Johnson F., Stromberg L., 2004. Transportation systems for CO2 – Application to Carbon Capture and Storage. Energy Conversion and Management. Vol.45. pp.2343 – 2353 Svensson R., Odenberger M., Johnson F., Stromberg L., 2005.Transportation Infrastructure for CCS – Experiences And Expected Development. Accessed: 15th April, 2006. Available: http://uregina.ca/ghgt7/PDF/papers/poster/350.pdf. Tan Y., Douglas, M.A. and Thambimuthu K.V. 2002. CO2 capture using oxygen enhanced combustion strategies for natural gas power plants. Fuel;81:p .1007–1016. Tennison S., 2000. Current hurdles in the commercial development of inorganic membrane reactors. Membrane Technology, 128: p. 4-9. Tsai C., Tam S., Lu Y., Brinker C. J., 1999. Dual-layer asymmetric microporous silica membranes. Journal of Membrane Science, 169: p. 255-268. TSS consultants, 2004. Gridley Ethanol Demonstration Project Utilizing Gasification Technology: Feedstock Supply Plant. NREL Contract No. DE-AC36-99-GO10337 Accessed: Feb 14, 2006. Available at: http://www.nrel.gov/docs/fy04osti/36403.pdf.
106

Van Der Sluijs J., Hendriks C., Blok K., 1992. Feasibility of polymer membranes for carbon dioxide recovery from flue gases. Energy Conversion and Management, 33: p. 429 – 436. Vielstich, W., Handbook of Fuel Cells- Fundamentals, Technology and Application, volume 3: p.159-242. Vision 21 - Department of Energy Report: Vision 21 : fossil fuel options for the future, National Research Council (U.S.). Committee on R&D Opportunities for Advanced Fossil-Fueled Energy Complexes, National Academic Press (publishers) Washington, D.C. 2000. Internet URL: http://www.nap.edu/books/0309069793/html/index.html. Vu D. Q., Koros W. J., Miller S. J., 2002. High pressure CO2/CH4 separation using carbon
molecular sieve hollow fiber membranes. Industrial & Engineering Chemistry Research, 41: p. 367-380.
Wang, R., Li, D.F., Liang, D.T., 2004. Modeling of CO2 capture by three typical amine solutions in hollow fiber membrane contactors, Chemical Engineering and Processing, 43: p. 849–856. Wilkinson M.B., Coden J.C., Panesar, R.S. and Allam, R.J. 2001. CO2 capture via oxyfuel firing: Optimisation of a Retrofit Design Concept for a Refinery Power Station Boiler. First national conference on carbon sequestration, Washington DC, May 14–17. Wolf, J., Anheden, M. and Yan, J.Y., 2005. Comparison of nickel- and iron-based oxygen
carriers in chemical looping combustion for CO2 capture in power generation. Fuel, 84(7-8): p. 993-1006.
Wong,S. and Bioletti,R., 2002. Carbon Dioxide Separation Technologies; Carbon and Energy Management. Alberta Research Council. Report. WETO, 2003. World energy, technology and climate policy outlook 2030. Available at: http://europa.eu.int/comm/research/energy/gp/gp_pu/article_1257_en.htm. Xu X., Song C., Andresen J.M., Miller B.G, Scaroni, A.W., 2002. Novel Polyethylenimine- modified mesoporous molecular sieve of MCM-41 type as high-capacity adsorbent for CO2 capture. Energy & Fuel. 16: p. 1463-1469. Xu X., Song C., Andresen J.M., Miller B.G, Scaroni, A.W., 2005. Adsorption separation of carbon dioxide from flues gas of natural gas-fired boiler by a novel nanoporous “molecular basket” adsorbent. Fuel Processing Technology. 86: p. 1457-1472. Yamamoto T., Kodama T., Hasegawa N., Tsuji M., Tamaura Y., 1995. Synthesis of hydrotalcite with high layer charge for CO2 adsorbent. Energy Convers. Mgmt. 36: p. 637-640.
107

Yeh, A.C. and Bai, H., 1999. Comparison of ammonia and monoethanolamine solvents to reduce CO2 greenhouse gas emission, Science of the Total Environment. Vol. 228, no. 2, p. 121-133. Yong Z., Mata V., Rodrigues A.E., 2000. Adsorption of carbon dioxide on basic alumina at high temperatures. J. Chem. Eng. Data. 45: p. 1093–1095. Yong, Z., Mata, V., Rodrigues, A.E., 2001. Adsorption of carbon dioxide on chemically modified high surface area carbon-based adsorbents at high temperatures. Adsorption. 7 (1): p. 41–50. Yong, Z., Mata, V., Rodrigues, A.E., 2002. Adsorption of carbon dioxide at high temperature—a review. Sep. and Pur. Tech. 26: p.195 – 205.
108


![C:Documents and Settings si%20Design%20Guidelines[1]](https://static.fdocuments.us/doc/165x107/61bd0bc361276e740b0ecccb/cdocuments-and-settings-si20design20guidelines1.jpg)