Design, test, and calibration of an electrostatic beam position...
13
Design, test, and calibration of an electrostatic beam position monitor Maurice Cohen-Solal Laboratory of the Linear Accelerator (LAL), CNRS/University, F-91406 Orsay, France (Received 1 October 2008; published 16 March 2010) The low beta of proton or ion beams favors an electrostatic pickup to measure the transverse beam centroid position. Often papers on beam position monitors (BPM) are focused on a particular aspect of the problem; however, it is important to consider all various issues of a position measurement system. Based on our experience at the IPHI (high intensity injector proton) facility at CEA-Saclay, this paper will address all aspects to design, test, and calibrate a BPM for proton linear accelerators, while emphasizing the determination of the absolute beam position. We present details of the readout electronics, and describe the calibration of the BPM using a test station. For calculation and simulation of the electrical signals we developed a MATHEMATICA script. The error analysis presented, on the basis of six BPMs installed in the high energy section of IPHI, demonstrates the expected accuracy of the position measurement. These studies also identify the parameters that could improve the performance of the beam position control. The experience from these developments is currently being used for the BPM design and test stand dedicated to the Spiral2 accelerator at Ganil-Caen which will deliver heavy ion beams. DOI: 10.1103/PhysRevSTAB.13.032801 PACS numbers: 29.90.+r I. INTRODUCTION For a low beta velocity beam (< 0:1), the capacitive beam position monitor (BPM) pickup is more efficient in terms of output signal power, than an inductive one of the same physical size [1]. The presented BPM uses four capacitive-coupling electrodes, called ‘‘buttons.’’ The high energy beam line of the high intensity injector (IPHI) [2] is equipped with BPMs of two different sizes: five fit into the vacuum chamber of 33 mm radius, and one is located in the large aperture chamber of 75 mm radius, just in front of the beam stopper. The IPHI aims to produce a continuous wave (CW) high intensity proton beam of 100 mA at 3 MeV, at a bunching frequencyof 352.2 MHz. The design and implementation of the BPM diagnostic needs many considerations: signal processing and compu- tation, mechanics, signal transmission and cables, elec- tronics, noise issues, sensitivity, calibration, and numerous tests. This paper discusses all of these points in a single report. While for storage rings and synchrotron light sources a high resolution and control of the beam orbit is achieved—typically 1 "m, or better—a linear accelerator needs a high accuracy of the absolute values reported by the transverse beam position measurement system. One of the major reasons regarding the design issues lies in the fact of a poor transfer sensitivity of the BPM pickup itself. A large BPM chamber radius has intrinsically a low sensitivity. The IPHI BPM sensitivity is 2%=100 "m, which compares to a required 100 "m total accuracy. Based on the recent experience, this paper discusses all the considerations required to deliver accurate results from the beam position measurement of low beta, high intensity beams. II. ELECTRODE SIGNAL A. Theory The current signal of the pickup electrode can be ex- pressed versus the line charge density !ðz; tÞ or the beam current i b ðtÞ: i button ðtÞ¼ d dz !ðz; tÞc area button circum pipe (1a) i button ðtÞ¼ d dt i b ðtÞ 1 c area button circum pipe : (1b) These expressions can be derived from the electrostatic field [1,3] or more classically from the image charge of the beam. Often a cos 2 or a Gaussian longitudinal particle distribution is used. These two expressions are equivalent, and are obtained by applying the electrostatic case: bunch length (seen by the electrode) electrode length. The first equation expresses the electrode current signal in terms of the charge density ! and beam velocity c. The second form is used more, as it applies the beam current as a control parameter. The frequency domain voltage signal of the button elec- trode v button ð!Þ is expressed by the product of the button current signal i button ð!Þ and the load impedance seen by the electrode, i.e., the parallel network of Z c ¼ 50 trans- mission line (cable impedance) and the electrode capaci- tance C b [4]: v button ð!Þ¼ Z c 1 þ Z c C b j! i button ð!Þ; (2) Z c is the cable impedance. The convolution of this product PHYSICAL REVIEW SPECIAL TOPICS - ACCELERATORS AND BEAMS 13, 032801 (2010) 1098-4402= 10=13(3)=032801(13) 032801-1 Ó 2010 The American Physical Society
Transcript of Design, test, and calibration of an electrostatic beam position...

Design, test, and calibration of an electrostatic beam position monitor
Maurice Cohen-Solal
Laboratory of the Linear Accelerator (LAL), CNRS/University, F-91406 Orsay, France(Received 1 October 2008; published 16 March 2010)
The low beta of proton or ion beams favors an electrostatic pickup to measure the transverse beam
centroid position. Often papers on beam position monitors (BPM) are focused on a particular aspect of the
problem; however, it is important to consider all various issues of a position measurement system. Based
on our experience at the IPHI (high intensity injector proton) facility at CEA-Saclay, this paper will
address all aspects to design, test, and calibrate a BPM for proton linear accelerators, while emphasizing
the determination of the absolute beam position. We present details of the readout electronics, and
describe the calibration of the BPM using a test station. For calculation and simulation of the electrical
signals we developed a MATHEMATICA script. The error analysis presented, on the basis of six BPMs
installed in the high energy section of IPHI, demonstrates the expected accuracy of the position
measurement. These studies also identify the parameters that could improve the performance of the
beam position control. The experience from these developments is currently being used for the BPM
design and test stand dedicated to the Spiral2 accelerator at Ganil-Caen which will deliver heavy ion
beams.
DOI: 10.1103/PhysRevSTAB.13.032801 PACS numbers: 29.90.+r
I. INTRODUCTION
For a low beta velocity beam (< 0:1), the capacitivebeam position monitor (BPM) pickup is more efficient interms of output signal power, than an inductive one of thesame physical size [1]. The presented BPM uses fourcapacitive-coupling electrodes, called ‘‘buttons.’’ Thehigh energy beam line of the high intensity injector(IPHI) [2] is equipped with BPMs of two different sizes:five fit into the vacuum chamber of 33 mm radius, and oneis located in the large aperture chamber of 75 mm radius,just in front of the beam stopper. The IPHI aims to producea continuous wave (CW) high intensity proton beam of100 mA at 3 MeV, at a bunching frequency of 352.2 MHz.The design and implementation of the BPM diagnosticneeds many considerations: signal processing and compu-tation, mechanics, signal transmission and cables, elec-tronics, noise issues, sensitivity, calibration, andnumerous tests. This paper discusses all of these pointsin a single report. While for storage rings and synchrotronlight sources a high resolution and control of the beamorbit is achieved—typically 1 m, or better—a linearaccelerator needs a high accuracy of the absolute valuesreported by the transverse beam position measurementsystem. One of the major reasons regarding the designissues lies in the fact of a poor transfer sensitivity of theBPM pickup itself. A large BPM chamber radius hasintrinsically a low sensitivity. The IPHI BPM sensitivityis 2%=100 m, which compares to a required 100 mtotal accuracy. Based on the recent experience, this paperdiscusses all the considerations required to deliver accurateresults from the beam position measurement of low beta,high intensity beams.
II. ELECTRODE SIGNAL
A. Theory
The current signal of the pickup electrode can be ex-pressed versus the line charge density ðz; tÞ or the beamcurrent ibðtÞ:
ibuttonðtÞ ¼ d
dzðz; tÞc areabutton
circumpipe
(1a)
ibuttonðtÞ ¼ d
dtibðtÞ 1
c
areabuttoncircumpipe
: (1b)
These expressions can be derived from the electrostaticfield [1,3] or more classically from the image charge of thebeam. Often a cos2 or a Gaussian longitudinal particledistribution is used. These two expressions are equivalent,and are obtained by applying the electrostatic case: bunchlength (seen by the electrode) electrode length. Thefirst equation expresses the electrode current signal interms of the charge density and beam velocity c. Thesecond form is used more, as it applies the beam current asa control parameter.The frequency domain voltage signal of the button elec-
trode vbuttonð!Þ is expressed by the product of the buttoncurrent signal ibuttonð!Þ and the load impedance seen by theelectrode, i.e., the parallel network of Zc ¼ 50 trans-mission line (cable impedance) and the electrode capaci-tance Cb [4]:
vbuttonð!Þ ¼ Zc
1þ ZcCbj!ibuttonð!Þ; (2)
Zc is the cable impedance. The convolution of this product
PHYSICAL REVIEW SPECIAL TOPICS - ACCELERATORS AND BEAMS 13, 032801 (2010)
1098-4402=10=13(3)=032801(13) 032801-1 2010 The American Physical Society

gives the button voltage signal in the time domain, refer-ring to [3].
The button pickup has a high-pass-like characteristic,with different behavior of the two regions separated by thecutoff frequency fc ¼ 1=ð2ZcCbÞ (Fig. 2). At low fre-quencies f fc, vbutton is independent of the button ca-pacitance Cb (and therefore of the distance h), but dependsonly on the electrode surface areabutton [Eqs. (1a) and (1b)].It is important to notice the dependence to the load imped-ance Zc, which results in a change of the transfer character-istics if the cable/electronics input impedances vary. Thetime structure of the button voltage signal appears as aderivative of the longitudinal bunch shape (particle distri-bution), seen at the surface of the vacuum chamber wall ifthe electrostatic condition applies: bunch rms length button electrode length [Eq. (1)].
At high frequencies f fc, with Eq. (1) inserted intoEq. (2), the button voltage signal is independent of the loadimpedance Zc:
vbuttonð!Þ ¼ 1
Cb!!ibuttonð!Þ areabutton
circumpipe
: (3)
In this case, the time structure of the button voltagesignal is identical to the longitudinal particle distribution
of the bunch seen at the vacuum chamber wall. For Cp ¼ 0
and Cb ¼ "0areabutton
h in Eq. (3), we observe that vbutton is
independent of the button capacitance Cb, but is onlyproportional to the distance h [3,4]. Figure 2 summarizesthese results and Fig. 3 shows the measured frequencydomain characteristic of the button electrode.Transfer function measurements of a button BPM in a
coaxial-line test arrangement are in good agreement withthe theory [Fig. 3(a)]. The sensitivity of the IPHI BPM is10:7 mV=mA beam current at 352 MHz. The two regions[Fig. 3(a)] are separated by the low cutoff frequency707 MHz corresponding to the time constant 4:5 pF50 .A modification of Cs has a direct effect on fc and an
indirect effect on the gain via the variations of areabuttonand/or h. Cp is a parasitic capacitance that reduces the
cutoff frequency and the gain at high frequencies (Fig. 2).High frequency information from the BPM is sometimes
required to estimate bunch length or shape characteristics,or for the monitoring of the beam phase/time-of-flight. Thetransfer response of the button electrode in Fig. 3(a) doesnot clearly indicate a high frequency roll-off; however,there are irregularities and resonant effects at very highfrequencies due to mismatching between beam pipe andBPM block, as well as beam pipe waveguide resonances.Moreover, mismatches between the characteristic imped-ance of the cables and electronics inputs also affect theresponse at high frequencies. On the BPM side, the cable isterminated by the feedthrough-button electrode transmis-sion line system. The electrode impedance should bepurely capacitive. The mechanical connection betweenthe 50 feedthrough and the electrode is equivalent to aserial inductance, which can introduce some ringing of thesignal. The feedthrough and its termination can be ana-
ω
h(Cp = 0)
)(
1
psc CCZ +
Areabutton
buttonv
(Cp 0)
FIG. 2. (Color) Asymptotes of the button transfer function. Thegain is proportional to the distance h at high frequencies and tothe electrode surface at low frequencies. The cutoff frequency isa function of the total capacitance. A modification of the areaand/or h changes also the capacitance and therefore the cutofffrequency.
-70
-60
-50
-40
-30
-20
-10
0.01 0.1 1 10
frequency (GHz)
Ga
in (
dB
)
(b)
(a)
FIG. 3. (Color) (a) The measured transfer function of an IPHIBPM button. The gain is the ratio of the button voltage to thevoltage injected into the 50 adapted pipe. (b) The cutofffrequency 707 MHz corresponds to the time constant 4:5 pF50 . The ripples around 4 GHz are due to the bad mechanicaladaptation between the tube and the BPM block. The character-istic impedance along the line is not suitable for high frequen-cies. Nevertheless, we do not see a frequency limitation up to6 GHz and never have reached the high cutoff frequency of theBPM itself.
buttonv
h
Zc
Cs
Cp
FIG. 1. (Color) Electrical button model, Cs is the capacitanceformed by the surface of the electrode and the grounded wall,and Cp is the button radial capacitance. Cb ¼ Cs þ Cp is the
total electrode capacitance. h is the distance between the elec-trode surface and the wall.
MAURICE COHEN-SOLAL Phys. Rev. ST Accel. Beams 13, 032801 (2010)
032801-2

lyzed with a time-domain reflectometer (TDR) [5]. TheTDR sends a step pulse down the feedthrough and returns atime-domain S11 impedance measurement. The terminalcapacitance is deducted from the rise time, the disconti-nuities spot the physical location of impedance mis-matches, and the eventual ringing indicates parasiticinductance [6].
Instead of the typical 50 electronics load impedance,a high impedance termination of the button electrode re-sults in a higher gain at low frequencies [7]. High imped-ance electronics of this kind may be used for capacitiveprobe signal processing, for BPM signal processing it addsa substantial noise floor and cannot used at high frequen-cies. Moreover, it is difficult to match four electronicschannels in gain and high impedance. A mismatch ofonly 2% corresponds to a 100 m position error, whichcannot be tolerated because of the requirements.
B. Simulation
An extended MATHEMATICA model has been assembledand can be used when the electrostatic case is not alwaysrespected. This is often in the case of ions and protons
accelerators where the bunch length is not much longerthan the longitudinal length L of the electrode, e.g., at theIPHI radio frequency quadrupole (RFQ) output, the bunchlongitudinal extension is 24 mm for L ¼ 22 mm.In the model developed, the longitudinal bunch shape is
a cos2 or a Gauss particle distribution. The current signal ofthe button is found by integrating the mirror charges on theelectrode length L, Eq. (1) is replace by Eq. (4),
ibuttonðtÞ ¼Z ðþL=2Þ=c
ðL=2Þ=cd
dtibðtÞdt arcbutton
circumpipe
; (4)
where arcbutton is the radial aperture of the electrode ex-pressed in units of length. Equation (4) allows an estima-tion of the signal characteristics for any combination ofbutton and bunch length, and bunch shape (Fig. 4).In the case of electrode length L < bunch length, only a
fraction of the image charge is integrated in the electrode,and the peak-to-peak electrode signal decreases when fur-ther reducing the electrode length L. The deviceoperates below the cutoff frequency fc; the signal is thena perfect time derivation of the bunch image charge distri-bution [Fig. 4(b)]. On the other hand, at electrode length
-200
-100
0
100
200
-3 -1 1 3-400
-200
0
200
400
-3 -1 1 3L/βc
(a) (b) (c)
time
)(tbidtd
time (nsec)
vbutton(mV)
time (nsec)
vbutton(mV)
FIG. 4. (Color) (a) Simulation principle of the button current ibuttonðtÞ with respect to Eq. (4). (b) and (c) The response function,computed with a MATHEMATICA routine, of two different button lengths, L ¼ 10 and 120 mm for a typical bunch of seen ¼ 17 mm ofthe superconducting linac of Spiral2. The (b) response (electrostatic case) appears as derivative of the bunch seen. The (c) response isidentical to the longitudinal bunch shape. The pulse is positive when the bunch is entering inside the electrode and negative when thebunch is leaving the electrode. The simulation allows the optimization of the electrode dimensions for any mode.
FIG. 5. (Color) Averaged sum of the four electrode signals obtained in the high energy section of SARAF. The dashed trace shows theresponse of a MATHEMATICA simulation using the same parameters as experimental conditions: a proton beam current of 4 mA at ¼ 0:06, the bunch base length is 22, the acceleration frequency is 176 MHz, and the inner pipe radius is 15 mm.
DESIGN, TEST, AND CALIBRATION OF AN . . . Phys. Rev. ST Accel. Beams 13, 032801 (2010)
032801-3

L > bunch length the temporal signal length increases[Fig. 4(c)], and even may mix signals of consecutivebunches. Concerning the Spiral2 project, the electrodelength is dimensioned to have a separation between signalscoming from consecutive bunches.
Figure 5 compares the electrode signals obtained at theSoreq Applied Research Accelerator Facility (SARAF)installed in Israel and the corresponding MATHEMATICA
computation.
C. Image charge
The electromagnetic wave associated with a low beamdoes not propagate in a pure transverse mode; the electro-magnetic field has longitudinal components [8]. Therefore,the image charge distribution (opposite sign) [8] is widerthan the physical length of the bunch charge distribution(Fig. 6).
The length of the image charge of the bunch is given by
the quadratic sum im ¼ffiffiffiffiffiffiffiffiffiffiffiffiffiffiffiffiffiffiffiffiffiffiffiffiffiffiffiffis
2 þ beam2
q(Fig. 6), where
s is the rms length of the image charge on the wallinduced by a single particle and beam is the rms bunchlength of the beam. This formula was experimentally testedon a capacitive probe at Ganil-Caen. Table I resumes theresults obtained with a 13CðQ=A ¼ 3þ=6Þ beam of 1:5 Ato 2:3 A at 12 MHz. The lengths of the image chargecalculated are close to experimental observations except inthe last case where the electronics bandwidth is limited.
With the MATHEMATICA model, it is possible to expandthe electrode voltage signal in its Fourier trigonometricseries and, moreover, to pick a set of frequency harmonicsfor the signal evaluation (Fig. 7). The electrode length Lcould be chosen to optimize the signal amplitude at theprocessing frequency.In the case of IPHI, ¼ 1:0032, s ¼ 23 mm, and
beam ¼ 68 mm, the induced charges in the wall haveonly little AC components, thus the resultant wall currentis almost a coasting DC current (Fig. 8).At ¼ 1:003 there is no relativistic effect, and the
electric field in the electrode is like an electrostatic field( ¼ 1). In the case of IPHI, the 2nd and upper harmonicsof the wall current are quasinull. Consequently, the elec-tronics front end must operate at 352 MHz with the inter-ference risk from the rf power. Table II shows the effect ofthe particle distribution of the bunch—cos2 or Gaussian—for the IPHI beam at the location of the first four BPMpickups. It will result in different levels of the first har-monic of the wall current, up to a factor 2 (second line inTable II). This is not a real problem because the electronicsthat we use has a large dynamic range, typically 70 dB ormore.When the FWHM of the bunch distribution is much
higher than the period beam, a pure mathematical calcu-lation shows that the levels of harmonics become verydependent on the distribution. This is the case at the endof the high energy beam transport line, where the chamberradius is 75 mm, im ¼ 55 mm for beam ¼ 68 mm(fourth line in Table II). IPHI is a demonstrator project,the calculation of the dynamic range due to the longitudi-nal beam profile is not well understood for a high intensityproton beam. However, an uncertainty of the absolutebeam position of2 mm of BPM #4 is tolerable to deliverthe beam to the beam stopper. The real amplitude of thesignals will be measured during the commissioning.
TABLE I. The measured values are the temporal length of abase bunch seen by the capacitive probe. The base length isdivided by 5.5 to obtain the rms value. The measurement wasdone by the Lecroy 7300A scope connected to the high imped-ance preamplifier output. It is known to have a limited band-width; therefore a measurement of bunch length <5 nsec(equivalent to 0.9 nsec) cannot be performed.
in mm
beam
in mm
im
calculated
im
measured
0.041 1.0 22 32 mm, 2.7 nsec 2.7 nsec
0.15 3.8 26 34 mm, 0.8 nsec 0.9 nsec
0.38 9.4 43.5 48 mm, 0.5 nsec 0.9 nsec
(m
V)
-400
-300
-200
-100
0
100
200
300
400
0 5 10 15 20 25 30
time (nsec)
FIG. 7. (Color) The simulated temporal signal from the pickupdesigned for Spiral2 linac. The aperture is 60 and L ¼ 39 mm.This periodical signal can be decomposed in Fourier series. Thefirst (88.04 MHz) to the fifth coefficients are 127, 133, 41, 45,and 63 mV.
σbeam
sσ
Button
cv ⋅= βa
FIG. 6. (Color) A single charged particle moving at c createsan electrical field at the chamber wall of a longitudinal distri-bution S ¼ a
ffiffi2
p , where is the relativist factor and a is the
radius chamber [9].
MAURICE COHEN-SOLAL Phys. Rev. ST Accel. Beams 13, 032801 (2010)
032801-4

A more complete calculus of the wall current on theelectrode is given by Shafer’s paper [9], where a Fourierdecomposition of the current beam is required. Aweaknessof the Shafer formula is that it is only valid in the electro-static case. A new MATHEMATICA program developed in-tegrates all harmonics of the wall current along the buttonelectrode, based on the formula given by Shafer.
Kowina has developed a numerical code based on finiteelement methods for the design of BPM and for the simu-lation of its characteristics [10].
III. CHARACTERIZATION
A. Beam position monitor
Figure 9 shows an IPHI BPM picture; the electrodedimensions are L ¼ 22 mm and arcbutton ¼ 22 mm, corre-sponding to the maximum dimensions which can be sup-ported by the 0.92 mm diameter molybdenum central rodof the Metaceram standard feedthrough. The electrodecapacitances at low frequency were measured with a LC
TABLE II. The wall current amplitude of the first Fourier harmonic (352.2 MHz) simulated for each BPM and for two bunchdistributions. The BPM are designed for a 33 mm chamber radius and the last one for a 75 mm chamber radius.
Cosine2 distribution Gaussian distribution
BPM number beam in mm im in mm A1 (i wall) in mA vbutton (dBm) A1 (i wall) in mA vbutton (dBm)
1st 6 24 16.5 5 17.0 52nd 14 27 4.5 16 8.8 113rd 15 28 4.9 16 7.8 124th 17 55 0.7 38 0.0 103
0
100
200
300
400
500(mA)
(a)
100
200
300
400
500(b)
(mA)
FIG. 8. (Color) (a) The MATHEMATICA simulation of the IPHI beam current versus time, the beam is bunched, the mean current is100 mA. (b) In the dashed curve, the corresponding image signal parts of the bunched beam, seen at the wall, lead to a superposition,while the mean value (DC component) is still 100 mA. The AC components are reduced, the red trace looks like a sine function, andtherefore the current out of the button has very few harmonics.
FIG. 9. (Color) An IPHI BPM (core, feedthrough, and assem-blies) has been built by the French company PMB. The spacebetween electrode and core is 2 mm with a tolerance of0:05 mm. The four standard Metaceram 50 feedthroughsare terminated by SMA connectors. During the brazing processthe four electrodes have been positioned by using a template toalign the axial symmetry.
TABLE III. Measured capacitances of the electrodes. Themeasurement was performed from the SMA connector with aLC meter, 1.4 pF capacitance of the feedthrough itself has beendeduced. Only small differences of the capacitance values mea-sured at the same BPM block were observed.
BPM
number
Capacitance of the
four electrodes in PF
Difference
in %
Prototype 10:5 10:8 10:7 10:8 0:30# 4:9 4:9 4:8 4:8 1:6#1 4:8 4:8 4:8 4:8 0:5#2 4:8 4:8 4:8 4:8 0:5#3 5:0 4:9 4:9 4:9 1:6#4 4:9 4:9 4:8 4:9 1:6#5 4.7 4.6 4.9 4.9 4.8
DESIGN, TEST, AND CALIBRATION OF AN . . . Phys. Rev. ST Accel. Beams 13, 032801 (2010)
032801-5

meter and are listed in Table III. The capacitance of thefeedthrough itself has been subtracted. The electrode ca-pacitance deduced from the frequency measurement withthe adapted tube is 4.5 pF (Fig. 3).
The weak difference of the measured button capacitan-ces in a BPM block (Table III) was obtained by thetechnique of the industrial PMB Company. A template isused to guarantee the symmetrical positions of the fourelectrodes during the brazing procedure.
B. Read-out electronics
The voltage signals from the button electrodes are pro-cessed by the commercial Bergoz log-ratio beam positionmonitor (LR-BPM) electronics module. The LR-BPMgives the transverse centroid position of the beam fromthe logarithm of opposite button signals [11]. The signalprocessing of these modules, operating in track-continuousmode, is compatible with a low duty cycle pulse operationduring commissioning of the machine. The duration of theIPHI beam pulse can be as short as 300 sec . The fastanalogue processing of the LR-BPMmodules reports in allconditions the actual beam position, which is more conve-nient during these initial tests, than using the multiplexedMX Bergoz module [11]. After this period, a compatibleMX-BPM could be used in CW mode to reach a higherspatial position resolution. The input bandpass filter fre-quency is specified for 352.2 MHz. The rf input dynamicrange is 70 dBm (or less) to þ5 dBm, nevertheless, thestrong dependence of the position resolution with the rfinput level will be discussed in III B 1. The LR-BPMprovides two continuous analogue voltages, correspondingto X and Y, with a bandwidth of 5 MHz in the range10 V.
1. Resolution
The position resolution is deduced from the noise of thefront-end electronics described Fig. 10.
The voltage noise generator en2 (V2=Hz) is transformed
to an equivalent current noise generator ins2 (A2=Hz),
ins2 ¼ e2n
jR0 þ Zsourcej2:
For the parallel noise in2 (A2=Hz), the noise current flow-
ing in the preamplifier is
inp2 ¼ i2n
Zsource
R0 þ Zsource
2
:
The total rms noise at the output of the amplifier is given by
v2out ¼ ðins2 þ inp
2ÞR02jHðj!Þj2:
If the transmission line (cable) is ideal, the impedancesource at the end is given by
Zsource ¼1
jCd!þ jR0tgð!tdÞ1þ tgð!tdÞ
R0Cd!
:
References [12,13] presented in more detail the calculatednoise depending on the transmission line terminated by acapacitive detector. Figure 11 shows the dependence ofZsource with the transmission line length. At a given fre-quency, the source impedance can take any values for ashort cable; for a long one the impedance observed goes to50 .
0.1
1
10
100
1000
10000
frequency (Hz)
0.1
1
10
100
1000
10000
frequency (Hz)
(Ω)(Ω)(Ω)(Ω)
106 109
(Ω)(Ω)(Ω)(Ω)
106 109
(a)
(b)
FIG. 11. (Color) SPICE AC analysis of the source impedanceZsource versus frequency for (a) 30 m and (b) 30 cm lengths of theRG-58 cable. For a capacitive BPM pickup, it is better toimplement long transmission lines to match the impedances.
Zsourc e
ibutton Cb
td
R0=50Ω
in2
en2
R0
iin
Cable5 pF
H(ω)
FIG. 10. (Color) Equivalent front-end electronics circuit fornoise analysis. in and en are parallel and series sources of thenoise. Hð!Þ is the transfer function of the amplifier.
MAURICE COHEN-SOLAL Phys. Rev. ST Accel. Beams 13, 032801 (2010)
032801-6
The cable is also used as a parasitic filter, by choosing itsequivalent bandwidth close (a little larger) to the process-ing frequency of the readout electronics.
The normalized positions x and y are obtained by acentroid of the buttons voltages vi. For a symmetric pickupwith circular cross section, rotated by 45,
x ¼ ðvA þ vDÞ ðvB þ vCÞPDi¼A vi
;
y ¼ ðvA þ vBÞ ðvC þ vDÞPDi¼A vi
:
The spatial resolution is given by the variances VðxÞ andVðyÞ which are the quadratic derivation of the centroid:
VðxÞ ¼ 1þ x2
ðPDi¼A viÞ2
vi2;
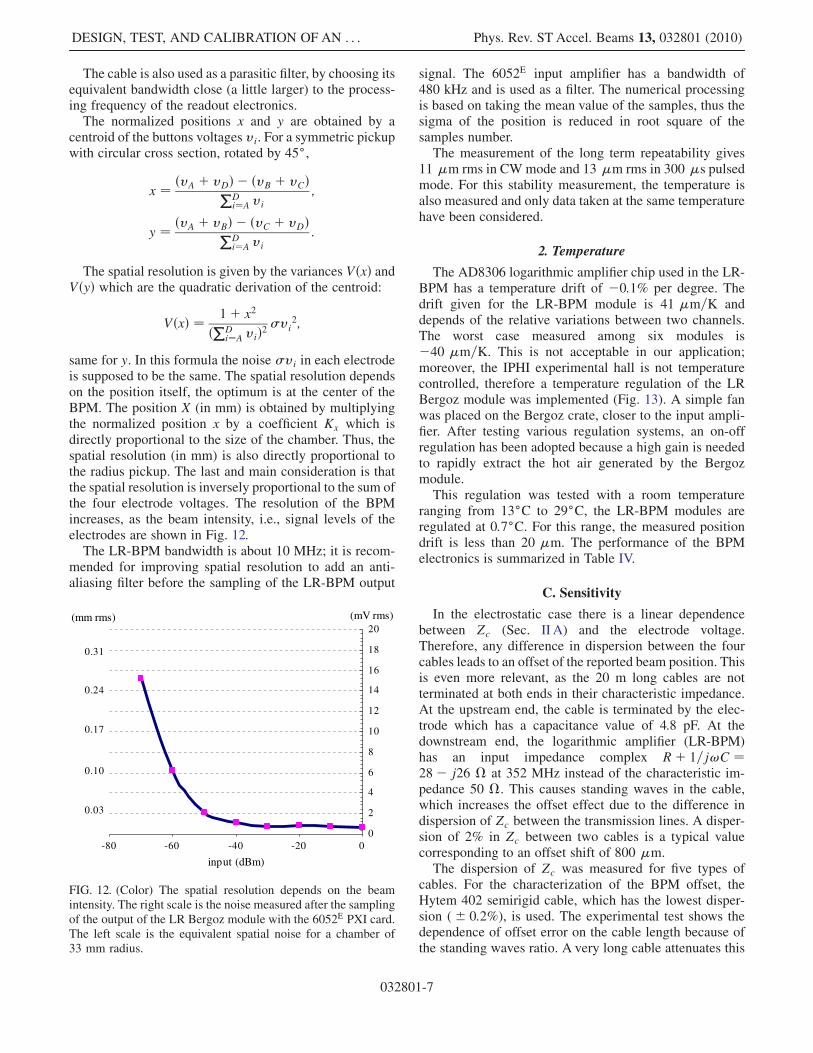
same for y. In this formula the noise vi in each electrodeis supposed to be the same. The spatial resolution dependson the position itself, the optimum is at the center of theBPM. The position X (in mm) is obtained by multiplyingthe normalized position x by a coefficient Kx which isdirectly proportional to the size of the chamber. Thus, thespatial resolution (in mm) is also directly proportional tothe radius pickup. The last and main consideration is thatthe spatial resolution is inversely proportional to the sum ofthe four electrode voltages. The resolution of the BPMincreases, as the beam intensity, i.e., signal levels of theelectrodes are shown in Fig. 12.
The LR-BPM bandwidth is about 10 MHz; it is recom-mended for improving spatial resolution to add an anti-aliasing filter before the sampling of the LR-BPM output
signal. The 6052E input amplifier has a bandwidth of480 kHz and is used as a filter. The numerical processingis based on taking the mean value of the samples, thus thesigma of the position is reduced in root square of thesamples number.The measurement of the long term repeatability gives
11 m rms in CWmode and 13 m rms in 300 s pulsedmode. For this stability measurement, the temperature isalso measured and only data taken at the same temperaturehave been considered.
2. Temperature
The AD8306 logarithmic amplifier chip used in the LR-BPM has a temperature drift of 0:1% per degree. Thedrift given for the LR-BPM module is 41 m=K anddepends of the relative variations between two channels.The worst case measured among six modules is40 m=K. This is not acceptable in our application;moreover, the IPHI experimental hall is not temperaturecontrolled, therefore a temperature regulation of the LRBergoz module was implemented (Fig. 13). A simple fanwas placed on the Bergoz crate, closer to the input ampli-fier. After testing various regulation systems, an on-offregulation has been adopted because a high gain is neededto rapidly extract the hot air generated by the Bergozmodule.This regulation was tested with a room temperature
ranging from 13C to 29C, the LR-BPM modules areregulated at 0:7C. For this range, the measured positiondrift is less than 20 m. The performance of the BPMelectronics is summarized in Table IV.
C. Sensitivity
In the electrostatic case there is a linear dependencebetween Zc (Sec. II A) and the electrode voltage.Therefore, any difference in dispersion between the fourcables leads to an offset of the reported beam position. Thisis even more relevant, as the 20 m long cables are notterminated at both ends in their characteristic impedance.At the upstream end, the cable is terminated by the elec-trode which has a capacitance value of 4.8 pF. At thedownstream end, the logarithmic amplifier (LR-BPM)has an input impedance complex Rþ 1=j!C ¼28 j26 at 352 MHz instead of the characteristic im-pedance 50 . This causes standing waves in the cable,which increases the offset effect due to the difference indispersion of Zc between the transmission lines. A disper-sion of 2% in Zc between two cables is a typical valuecorresponding to an offset shift of 800 m.The dispersion of Zc was measured for five types of
cables. For the characterization of the BPM offset, theHytem 402 semirigid cable, which has the lowest disper-sion ( 0:2%), is used. The experimental test shows thedependence of offset error on the cable length because ofthe standing waves ratio. A very long cable attenuates this
0
2
4
6
8
10
12
14
16
18
20
-80 -60 -40 -20 0
(mV rms)
input (dBm)
(mm rms)
0.03
0.10
0.17
0.24
0.31
FIG. 12. (Color) The spatial resolution depends on the beamintensity. The right scale is the noise measured after the samplingof the output of the LR Bergoz module with the 6052E PXI card.The left scale is the equivalent spatial noise for a chamber of33 mm radius.
DESIGN, TEST, AND CALIBRATION OF AN . . . Phys. Rev. ST Accel. Beams 13, 032801 (2010)
032801-7

effect. The offset effect can also be minimized by matchingthe electric length of the four cables. As the electricallength depends on cable bends, temperature, etc., anin situ calibration is required.
The determination of the position sensitivity is essential,as it determines some requirements of the subsystems, e.g.,electric length match of the cables, accuracy of the readoutelectronics, tolerances of the BPM pickup mechanics, etc.,to ensure the expected performance of the complete BPMsystem.
The intrinsic chamber sensitivity is the variation inpercent or in dB between two signals of opposite electrodesfor 1 mm of beam transverse displacement. For low betabeam, the sensitivity could not be measured with a wire
displacement in the laboratory because ¼ 1. The sensi-tivity is determined by a field simulation or by followingthe Shafer formula [9] based on the Cuperus paper [14].The formula was computed with MATHEMATICA. An ap-proximation for small displacement is also given in [9] andcan be calculated by hand. For IPHI BPM the sensitivitymeasurement on the bench test (0:98 dB=mm) is in goodagreement with the calculation (1:03 dB=mm). This mea-surement obtained with a scope can be improved by using apower meter. For ¼ 0:04 the calculation gives1:93 dB=mm corresponding to a signal variation of1:25 =mm. On the other side this also means a gain differ-ence (error) in the signal processing of 2.5% corresponds toa position error of 100 m. The characterization andcalibration with a test stand introduces several errorsources (see Sec. IVand [15]). Each error should be smallerthan the total accuracy requirement. In IPHI we aim anaccuracy of about 0:25% for each error source.The test stand measurements are valid for ¼ 1. For
low velocity beam (low ), the positions measured atfrequency f of a chamber of radius a are multiplied by(1þG), where [9]
G ¼ 0:139
2fa
c
2 0:0145
2fa
c
3:
IV. TEST STAND
The test stand is used to characterize the BPM andcalibrate the complete electronics chain. The stand consistsof a coaxial line of 189 characteristic impedance. AnAgilent 8648C generator drives a rod (center conductor) of2.05 mm diameter at a frequency of 352.2 MHz. The66 mm diameter pipe is fixed on an X-Y positioning tabledriven by stepper motors, as we can see on Fig. 14. The rodis fixed and tensioned with nuts through the drilled printedcircuits. The printed circuit boards match the impedances
FIG. 13. (Color) (a) The Bergoz crate with the six LR moduleswith black front panels. (b) The schematic of the temperatureregulation that is implemented in the module on the left positionof the crate. The LM335 temperature sensor is located in the LRmodule, close to the amplifier input. A film covers the top of theBergoz crate isolating it thermically. The two fans extract the hotair produced by the electronics.
FIG. 14. (Color) Photo of the test stand, dedicated for mapping,characterization, and calibration.
MAURICE COHEN-SOLAL Phys. Rev. ST Accel. Beams 13, 032801 (2010)
032801-8

with resistor networks at both ends. The signal is returnedto the flanges via two HF joints which slide without con-straint on the other side of the boards. The joints also serveto protect the interior of the tube from rf interference. Thehysteresis error of the mechanical system is 15 m.
The rod is easily removed by unscrewing nuts on eachside causing the rod to drop through the hole of the printedcircuit.
The determination of the absolute rod position is per-formed by an electrical contact (accuracy2:5 m) with atemplate, shown in Fig. 15, inserted onto the BPM andcentered with pawns. The mechanical dimensions of thetemplate are controlled to 5 m by the measuring sys-tem Mitutoyo EURO-M574. After alignment of the rod tothe center of the BPM under test, the template is removedand the upper flange is carefully screwed on the BPM.
The positioning error of the two flanges results in a
measurement error of ffiffiffi2
p 25 m, this error is dividedstatistically by the square root of the number of performedcalibration procedures. A mechanical deformation wasmeasured after the BPM screwing on the flanges corre-sponding to a coaxiality error of 35 m between the rodand the BPM.
The error sources of the mechanical system includingthe calibration are summarized in Table VI in Sec. V.The acquisition system is based on the peripheral com-
ponent interconnect extensions for instrumentation (PXI)hardware standard. The stepper motors are driven by aNational Instruments stepper driver unit type NI MID-7604, which is controlled by a PXI stepper motion con-troller (type NI PXI-7334) from the same company. ALABVIEW program developed in-house controls the hard-
ware and perform the data acquisition.To characterize spatial linearity, the rod is positioned at
the mechanical center and, for different radial positions thecorresponding electrical positions are measured directlywith the LR Bergoz module. Figure 16 shows the mappingcorresponding to this measurement realized with the tem-perature regulation described previously.Figure 17 shows the dynamic range of the LR-BPM
module with respect to beam displacement and intensity
FIG. 15. (Color) Photo of the template positioned with pawnsabove the BPM block. The rod is positioned at the center of theBPM in X and Y by electric contacts with the template.Afterwards, the template is removed and the upper flange isdelicately screwed on the BPM. Two half crown pieces areinserted under the rf joint to maintain an equal height.
TABLE IV. Performance of the BPM readout electronics.
Electronics Error in m for different input power Remarks
> 33 dBm 60 dBm 70 dBm
Noise 15.8 rms 124 rms 1674 rms Centroid is intensity dependant
of the mean value 3.2 rms 25.3 rms 342 rms 12 points in 300 s pulsed mode
Stability 12.6 rms Not tested Not tested Long term repeatability
Temperature 15.5 max Not tested Not tested Temperature regulated
-2-1
.5-1
-0.5
00.
51
1.5
2
-2 -1.5 -1 -0.5 0 0.5 1 1.5 2
X(V)
Y(V)
FIG. 16. (Color) Mapping of the BPM position characteristicsmoving the stimulus (rod center conductor, irod ¼ 0:3 mA) alongpolar coordinates. The radius was incremented by 1 mm. X andY are directly the measured positions by the log-ratio Bergozmodule.
DESIGN, TEST, AND CALIBRATION OF AN . . . Phys. Rev. ST Accel. Beams 13, 032801 (2010)
032801-9
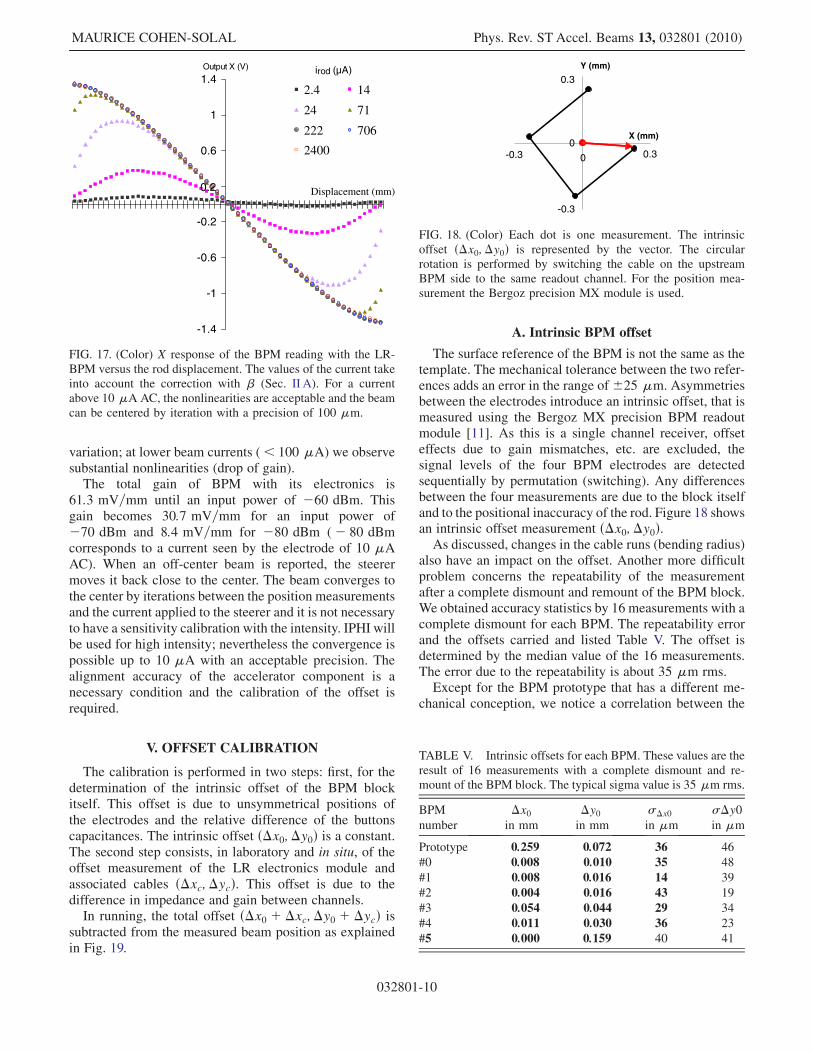
variation; at lower beam currents (< 100 A) we observesubstantial nonlinearities (drop of gain).
The total gain of BPM with its electronics is61:3 mV=mm until an input power of 60 dBm. Thisgain becomes 30:7 mV=mm for an input power of70 dBm and 8:4 mV=mm for 80 dBm ( 80 dBmcorresponds to a current seen by the electrode of 10 AAC). When an off-center beam is reported, the steerermoves it back close to the center. The beam converges tothe center by iterations between the position measurementsand the current applied to the steerer and it is not necessaryto have a sensitivity calibration with the intensity. IPHI willbe used for high intensity; nevertheless the convergence ispossible up to 10 A with an acceptable precision. Thealignment accuracy of the accelerator component is anecessary condition and the calibration of the offset isrequired.
V. OFFSET CALIBRATION
The calibration is performed in two steps: first, for thedetermination of the intrinsic offset of the BPM blockitself. This offset is due to unsymmetrical positions ofthe electrodes and the relative difference of the buttonscapacitances. The intrinsic offset ðx0;y0Þ is a constant.The second step consists, in laboratory and in situ, of theoffset measurement of the LR electronics module andassociated cables ðxc;ycÞ. This offset is due to thedifference in impedance and gain between channels.
In running, the total offset ðx0 þ xc;y0 þ ycÞ issubtracted from the measured beam position as explainedin Fig. 19.
A. Intrinsic BPM offset
The surface reference of the BPM is not the same as thetemplate. The mechanical tolerance between the two refer-ences adds an error in the range of25 m. Asymmetriesbetween the electrodes introduce an intrinsic offset, that ismeasured using the Bergoz MX precision BPM readoutmodule [11]. As this is a single channel receiver, offseteffects due to gain mismatches, etc. are excluded, thesignal levels of the four BPM electrodes are detectedsequentially by permutation (switching). Any differencesbetween the four measurements are due to the block itselfand to the positional inaccuracy of the rod. Figure 18 showsan intrinsic offset measurement ðx0;y0Þ.As discussed, changes in the cable runs (bending radius)
also have an impact on the offset. Another more difficultproblem concerns the repeatability of the measurementafter a complete dismount and remount of the BPM block.We obtained accuracy statistics by 16 measurements with acomplete dismount for each BPM. The repeatability errorand the offsets carried and listed Table V. The offset isdetermined by the median value of the 16 measurements.The error due to the repeatability is about 35 m rms.Except for the BPM prototype that has a different me-
chanical conception, we notice a correlation between the
-0.3
0
0.3
-0.3 0 0.3
X (mm)
Y (mm)
FIG. 18. (Color) Each dot is one measurement. The intrinsicoffset ðx0;y0Þ is represented by the vector. The circularrotation is performed by switching the cable on the upstreamBPM side to the same readout channel. For the position mea-surement the Bergoz precision MX module is used.
TABLE V. Intrinsic offsets for each BPM. These values are theresult of 16 measurements with a complete dismount and re-mount of the BPM block. The typical sigma value is 35 m rms.
BPM
number
x0in mm
y0in mm
x0
in my0in m
Prototype 0:259 0:072 36 46
#0 0:008 0:010 35 48
#1 0:008 0:016 14 39
#2 0:004 0:016 43 19
#3 0:054 0:044 29 34
#4 0:011 0:030 36 23
#5 0:000 0:159 40 41
-1.4
-1
-0.6
-0.2
0.2
0.6
1
1.4Output X (V)
2.4 14
24 71
222 706
2400
irod (µA)
Displacement (mm)
FIG. 17. (Color) X response of the BPM reading with the LR-BPM versus the rod displacement. The values of the current takeinto account the correction with (Sec. II A). For a currentabove 10 A AC, the nonlinearities are acceptable and the beamcan be centered by iteration with a precision of 100 m.
MAURICE COHEN-SOLAL Phys. Rev. ST Accel. Beams 13, 032801 (2010)
032801-10

offset and the dispersion of the four capacitances given inTable III. The BPM #5 has the largest offset and the largestrelative capacitance difference.
B. Cable and electronics offset
A coaxial cable type LMR 240 is installed to connect theBPM electrodes to the Bergoz readout electronics. Theoffset due to the LR-BPM electronics and its associatedcables is determined with the precedent principle, thepermutation of the input cables on the BPM side.‘‘Rotating’’ the cable connections of the four inputs is‘‘equivalent’’ to a mechanical rotation of the BPM block.The results of ðxc;ycÞ are given in Fig. 19. The highdispersion values of the electronics offset are caused by thelogarithmic amplifier and the dispersion of the input im-pedance of the LR-BPM. The total offset is the sum ofðx0;y0Þ and ðxc;ycÞ as shown Fig. 19.
The cables and the electronic offset ðxc;ycÞ, as theinput electronics is a logarithmic amplifier, are alsostrongly dependent on the input power and also on thebeam intensity. For each channel, ten values of ðxc;ycÞare stored as a look-up table for the entire dynamic range.The offset applied is given by the signal measured fromthe LR-BPM [11]. The analogue signal is a continuousvalue proportional to the sum of the signals from the fourbuttons which are proportional to the beam intensity.
Between two recorded points a linear interpolation is ap-plied with a maximum error of 32 m.(xc;yc) depends on the cable bends and therefore on
their installation on the accelerator site. Cables and elec-tronics calibration was performed before and after theinstallation on site without the beam. This calibration isbased on the ðxc;ycÞ measurement by replacing theBPM block by a ‘‘fake block.’’ The fake block is a printedcircuit board (Fig. 20) with four matched capacitors ofvalue Cb. The signal from a generator 352 MHz drives astrip line which is coupled to the four capacitances. Thisfake block simulates the response of a BPM to a centeredbeam.Six strands of four cables LM 240 are installed on site.
Their length range is from 15 to 20 meters.
C. Embedding
The difference of the response of the fake block and thereal BPM block mounted on the test stand was character-ized in the laboratory. A typical measurement result isplotted in Fig. 21.
-1 -0.8 -0.6 -0.4 -0.2 0
BPM X F.B. X BPM Y F.B. Y
-16
-8
0
8
16
X, Y (mm)
-24Σ signal (V)
FIG. 21. (Color) Comparison of X and Y position measurementsfor the fake block (F.B.) and the BPM block mounted on the teststand. The responses are given versus the sum from the fourelectrodes. We observe an intensity dependence for the X and Ydisplacement values due to the limitations of the logarithmicamplifier in the readout electronics.
FIG. 20. (Color) The fake block simulates a BPM block re-sponse to a centered beam. The fake block is driven by a rfgenerator to allow cable and electronics calibration after instal-lation in site without the beam.
-1.4
-1.2
-1
-0.8
-0.6
-0.4
-0.2
0
0.2
0.4
0.6
-0.6 -0.4 -0.2 0 0.2 0.4 0.6 0.8 1
X (mm)
Y (mm)
FIG. 19. (Color) Total offset measured with eight different LR-BPM electronics channels. Each dot corresponds to one mea-surement. The cable ends at the side of the BPM are permuted 4times. The red vector corresponds to the intrinsic offset and theblue vector corresponds to the offset ðxc;ycÞ associated to thecables and the electronics.
DESIGN, TEST, AND CALIBRATION OF AN . . . Phys. Rev. ST Accel. Beams 13, 032801 (2010)
032801-11
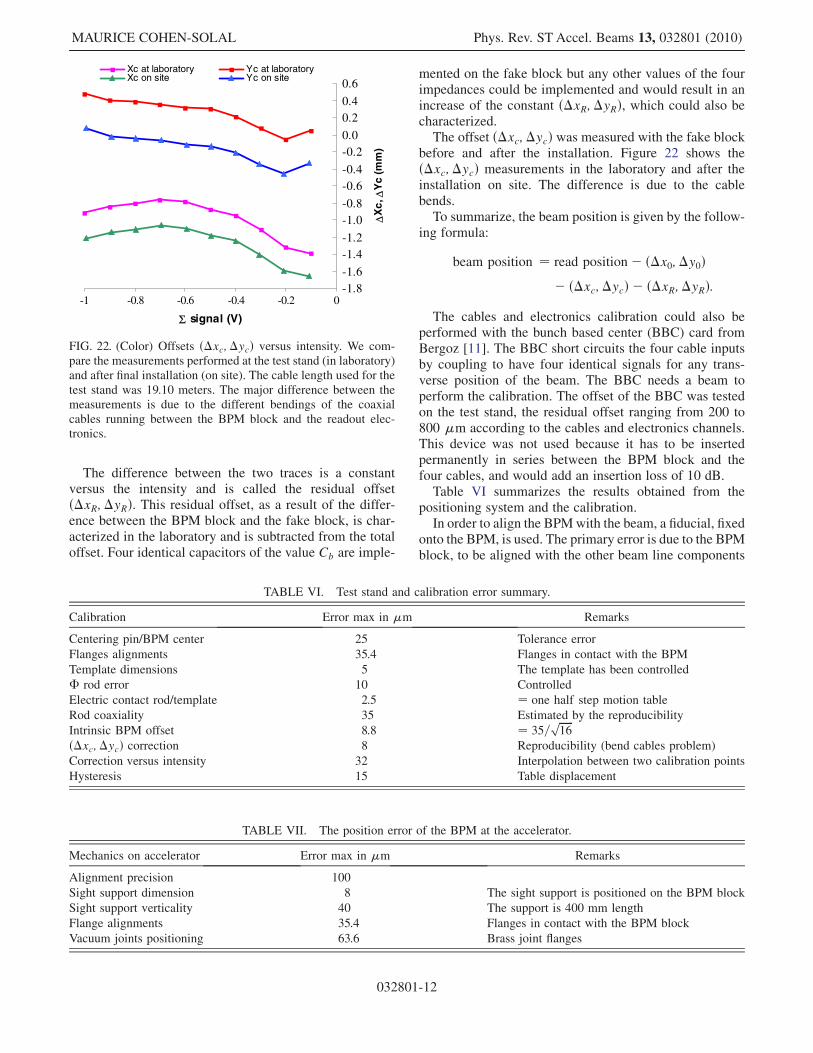
The difference between the two traces is a constantversus the intensity and is called the residual offsetðxR;yRÞ. This residual offset, as a result of the differ-ence between the BPM block and the fake block, is char-acterized in the laboratory and is subtracted from the totaloffset. Four identical capacitors of the value Cb are imple-
mented on the fake block but any other values of the fourimpedances could be implemented and would result in anincrease of the constant ðxR;yRÞ, which could also becharacterized.The offset ðxc;ycÞ was measured with the fake block
before and after the installation. Figure 22 shows theðxc;ycÞ measurements in the laboratory and after theinstallation on site. The difference is due to the cablebends.To summarize, the beam position is given by the follow-
ing formula:
beam position ¼ read position ðx0;y0Þ ðxc;ycÞ ðxR;yRÞ:
The cables and electronics calibration could also beperformed with the bunch based center (BBC) card fromBergoz [11]. The BBC short circuits the four cable inputsby coupling to have four identical signals for any trans-verse position of the beam. The BBC needs a beam toperform the calibration. The offset of the BBC was testedon the test stand, the residual offset ranging from 200 to800 m according to the cables and electronics channels.This device was not used because it has to be insertedpermanently in series between the BPM block and thefour cables, and would add an insertion loss of 10 dB.Table VI summarizes the results obtained from the
positioning system and the calibration.In order to align the BPMwith the beam, a fiducial, fixed
onto the BPM, is used. The primary error is due to the BPMblock, to be aligned with the other beam line components
-1.8-1.6
-1.4-1.2
-1.0-0.8
-0.6-0.4
-0.20.0
0.20.4
0.6
-1 -0.8 -0.6 -0.4 -0.2 0
Σ signal (V)
∆X
c, ∆
Yc
(mm
)
Xc at laboratory Yc at laboratoryXc on site Yc on site
FIG. 22. (Color) Offsets ðxc;ycÞ versus intensity. We com-pare the measurements performed at the test stand (in laboratory)and after final installation (on site). The cable length used for thetest stand was 19.10 meters. The major difference between themeasurements is due to the different bendings of the coaxialcables running between the BPM block and the readout elec-tronics.
TABLE VII. The position error of the BPM at the accelerator.
Mechanics on accelerator Error max in m Remarks
Alignment precision 100
Sight support dimension 8 The sight support is positioned on the BPM block
Sight support verticality 40 The support is 400 mm length
Flange alignments 35.4 Flanges in contact with the BPM block
Vacuum joints positioning 63.6 Brass joint flanges
TABLE VI. Test stand and calibration error summary.
Calibration Error max in m Remarks
Centering pin/BPM center 25 Tolerance error
Flanges alignments 35.4 Flanges in contact with the BPM
Template dimensions 5 The template has been controlled
rod error 10 Controlled
Electric contact rod/template 2.5 ¼ one half step motion table
Rod coaxiality 35 Estimated by the reproducibility
Intrinsic BPM offset 8.8 ¼ 35=ffiffiffiffiffiffi16
pðxc;ycÞ correction 8 Reproducibility (bend cables problem)
Correction versus intensity 32 Interpolation between two calibration points
Hysteresis 15 Table displacement
MAURICE COHEN-SOLAL Phys. Rev. ST Accel. Beams 13, 032801 (2010)
032801-12
of the accelerator (Table VII). The second error term is dueto the joints positioning on the knives (Table VII). Figure 9shows the vacuum knife close to the electrodes. The mea-sured error on the test stand is 63:6 m for a joint positionasymmetry of 0.1 mm.
It is recommended to design and characterize the com-plete BPM pickup, including all joints, flanges, etc. Thedrawback is the need of a vertical wire in the beam pipe,and to center it with enough precision and verify its co-axiality [15]. Another important problem concerns thebending of the cables, they should not be touched and theirmanipulation must be done via switches. The offset intro-duced by the switches must be taken into account. It is alsoimportant to verify offset measurement by repeating sev-eral complete mount/demount procedures of the BPMhardware.
Lambertson suggested a calibration method withoutwire based on an electric measurement of the differenceof the gains between the channels [16]. The results ofthis method compared with the wire method are shown in[17].
VI. CONCLUSION
The new designed and calibrated BPM pickups and theirelectronics are installed on the IPHI accelerator, waitingfor the completion of the RFQ. All precautions were takento reduce parasitic effects from the rf power throughgrounding elements to the accelerator support structures.A dedicated BPM test stand was developed, allowing amanual characterization of the BPM with very high preci-sion. The expected precision of the alignment of the BPMblock on the accelerator is less than 100 m. Assumingthat errors are independent of each other, they can be addedquadratically. The beam position can be measured with anabsolute accuracy of 180 m. With this first experience,the main accuracy improvement for the Spiral2 project willbe the manufacturing of complete BPMs, including theirmounted flanges. The test stand described will be auto-mated to characterize a large number of Spiral2 BPMs. Thenew test setup is under development and uses remotecontrolled switches for all signal multiplexing. The maindifficulty will be the wire alignment at the mechanicalcenter and to verify its symmetry.
ACKNOWLEDGMENTS
The author wishes to acknowledge J. N. Maymon (nowretired) for his efforts to develop the test stand.
[1] P. Strehl, CERN Report No. 87-10, 1986, p. 99.[2] P. Ausset, J. N. Maymon, N. Rouviere, M. Solal, and L.
Vatrinet, in Proceedings of DIPAC 2005 (CERN, Lyon,France, 2005), POT013, p. 172.
[3] J. C. Denard, Rubrique: Electronique Mesures ReportNo. Super-ACO /83-69, 1983.
[4] S. R. Smith, Beam Position Monitor Engineering (AIP,New York, 1997), p. 50.
[5] Tektronix, TDR Impedance Measurements: A Foundationfor Signal Integrity, http://www.tek.com/applications/design_analysis/tdr.html.
[6] L. Cassinari, J.-C. Denard, C. Herbeaux, E. Cenni, M.Canetti, F. Gangini, and J.-L. Billaud, in Proceedings ofthe 11th European Particle Accelerator Conference,Genoa, 2008 (EPS-AG, Genoa, Italy, 2008), MOPD019.
[7] F. Loyer, TATIHOU-98-talk2-PC, internal GANIL presen-tation, 14076 Caen.
[8] J. Bosser, CERN Report No. CERN-PE-ED 001-92, 1994,p. 106.
[9] Robert E. Shafer, AIP Conf. Proc. 319, 303 (1994).[10] P. Kowina, P. Forck, W. Kaufmann, T. Weiland, and F.
Wolfheimer, in Proceedings of DIPAC09 (CERN, Basel,Switzerland, 2009), MOOC03.
[11] Bergoz Instrumentation, http://www.bergoz.com.[12] R. L. Chase, C. de La Taille, S. Rescia, and N. Seguin,
Nucl. Instrum. Methods Phys. Res., Sect. A 330, 228(1993).
[13] M. Akopyan, M. Chen, R. Krasnokutsky, R. Shuvalov, andV. Sushkov, Nucl. Instrum. Methods Phys. Res., Sect. A330, 465 (1993).
[14] J. H. Cuperus, Nucl. Instrum. Methods Phys. Res., Sect. A145, 219 (1977).
[15] R. B. Shurter, J. D Gilpatrick, J. Ledford, J. O’Hara, and J.Power, CP451, Beam Instrumentation Workshop 1998(AIP, New York, 1998).
[16] G. R. Lambertson, Lawrence Berkeley Laboratory LSAPNote-5, 1987.
[17] Y. Chung and G. Decker, Offset Calibration of the BeamPosition Monitor Using External Means (AIP, New York,1992), p. 217.
DESIGN, TEST, AND CALIBRATION OF AN . . . Phys. Rev. ST Accel. Beams 13, 032801 (2010)
032801-13