Design Technology Innovations
31
Comprehensive and Dependable Design Technology Innovations 1
Transcript of Design Technology Innovations

Comprehensive and Dependable
Design Technology Innovations
1

ABOUT USWhat We Do and Who We Serve
EN Engineering is a leading national engineering services
firm providing comprehensive design, engineering, and
consulting services to gas and electric utilities as well as
other energy and industrial end-markets. With over 1,800
professionals in over 35 offices nationwide and Canada,
EN Engineering offers customers an unparalleled spectrum
of services with expertise in natural gas and oil pipeline
infrastructure, gas distribution, electric power transmission,
distribution and generation, automation systems, integrity
management, and industrial and refinery solutions.
2

1. Brief Intro/About Us
2. Value of a Design Package
3. Standard or “Simple” Design Steps/Tools
4. Complex Design Steps/Tools
5. Scanning & 3-D Modeling
6. Data Driven Design
7. Data Systems
8. Risk Modeling
9. Machine Learning
OUR AGENDA FOR TODAY
Excellence…
from start to finish
3
Value of Drawing Packages
4
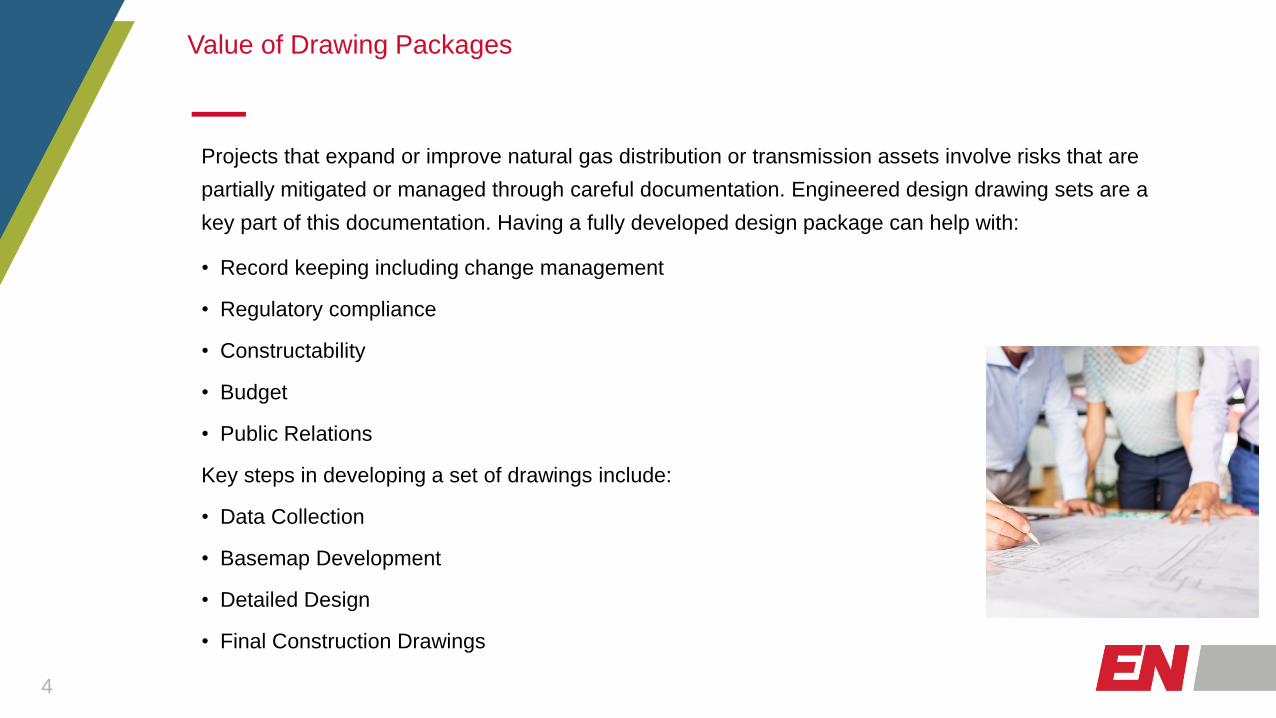
Projects that expand or improve natural gas distribution or transmission assets involve risks that are
partially mitigated or managed through careful documentation. Engineered design drawing sets are a
key part of this documentation. Having a fully developed design package can help with:
• Record keeping including change management
• Regulatory compliance
• Constructability
• Budget
• Public Relations
Key steps in developing a set of drawings include:
• Data Collection
• Basemap Development
• Detailed Design
• Final Construction Drawings
Standard “Simple” Design - Data Collection
5
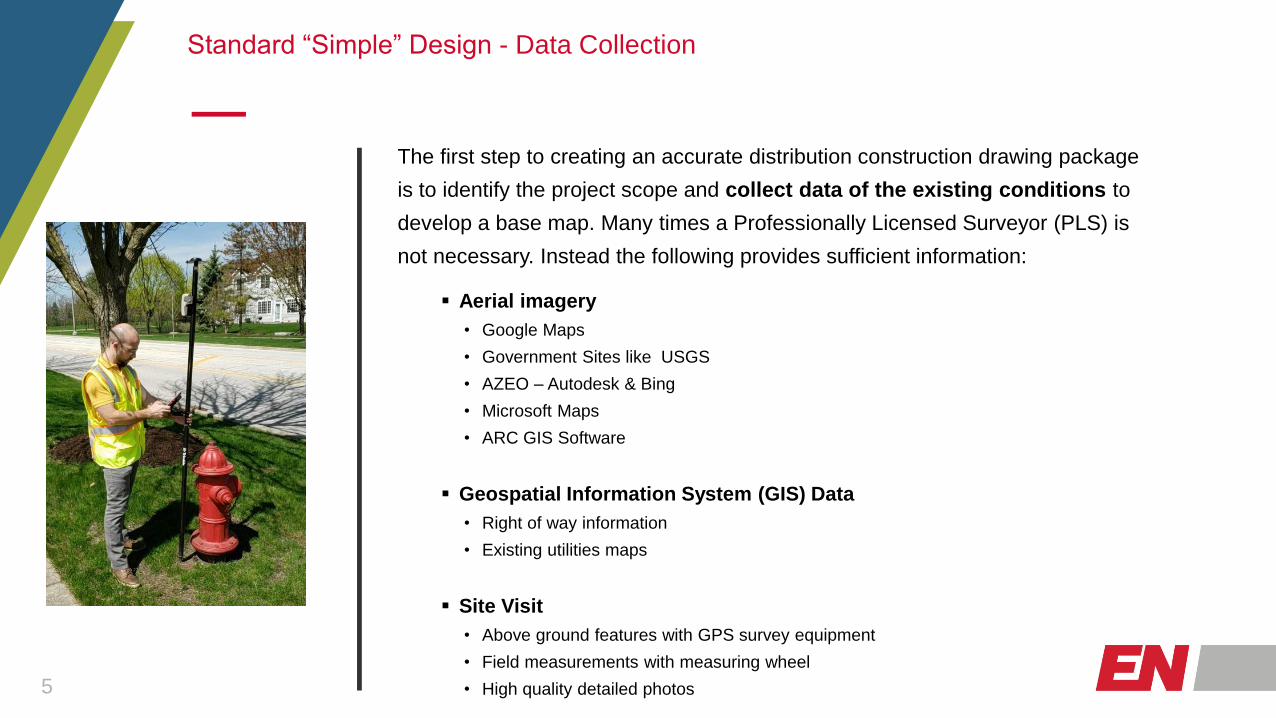
The first step to creating an accurate distribution construction drawing package
is to identify the project scope and collect data of the existing conditions to
develop a base map. Many times a Professionally Licensed Surveyor (PLS) is
not necessary. Instead the following provides sufficient information:
▪ Aerial imagery
• Google Maps
• Government Sites like USGS
• AZEO – Autodesk & Bing
• Microsoft Maps
• ARC GIS Software
▪ Geospatial Information System (GIS) Data
• Right of way information
• Existing utilities maps
▪ Site Visit
• Above ground features with GPS survey equipment
• Field measurements with measuring wheel
• High quality detailed photos

Standard “Simple” Design - Base Map Development & Detailed Design
COMPUTER AIDED
DESIGN SOFTWARE:
6
The next step is to geo-reference and combine all of the collected data
into a CAD software to develop a base map of the existing conditions
which will ensure an accurate and reliable design. The CAD software
used is typically dependent the customer preference and the
Customer’s CAD standards if the have any.
▪ Base Map Development
• Modify line types to correct CAD standard
• Label & Dimension existing utilities
• Label roadways and addresses
▪ Detailed Design
• Add proposed utility design
• Label & Dimension proposed utility
• Generate bill of material
• Create tie-in and retirement details
MicroStation

Standard “Simple” Design - Base Map Progression
7
Base MapAerial, GIS & Field Data

Complex Design - Large Pipeline & Facility Design
8
Large diameter pipeline networks and facilities transport oil & gas from
producing areas to market areas. Often times these projects involve
additional steps to ensure project scope is further defined and sufficient
detail is provided to manage risks as previously outlined:
Pipeline
▪ Route selection & PLS survey
▪ Construction Drawing Package
▪ Alignment sheets of the piping route
Facility
▪ Data Capture
▪ 3D Modeling & Design
▪ Construction Drawing Package

Complex Design - Pipeline Route Selection & Survey
9
The first step to a successful pipeline project is to select the optimum
route with consideration of public safety, environmental impact,
constructability, land ownership and cost. Once the pipeline
corridor is identified then land & subsurface surveys are conducted to
obtain data of the existing conditions to develop alignment sheets.
▪ Land Survey
• Location of all above ground features
• Ground elevations
• Parcel boundaries
▪ Subsurface Survey
• Soil conditions
• Existing underground utility depths

Pipeline Alignment Sheets
10
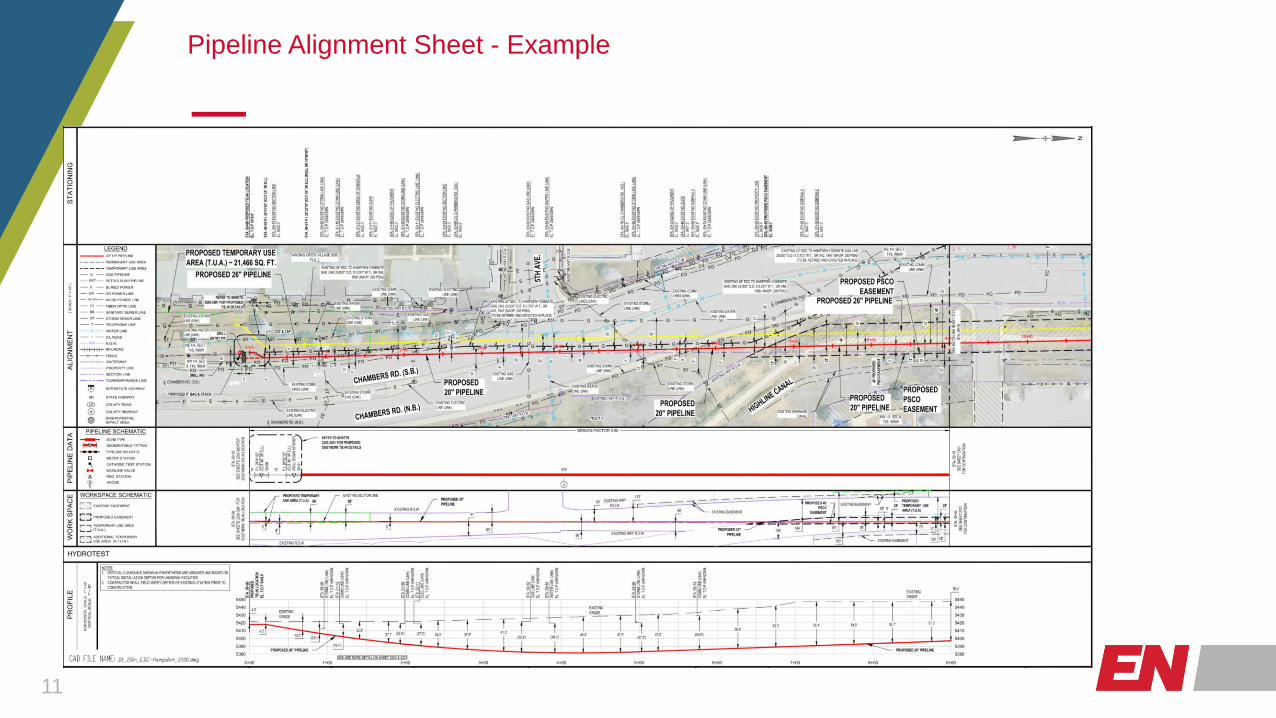
Alignment sheets graphically show the exact route and depth of the
pipeline and fittings. These construction drawings illustrate the
following information to allow the contractor to install the pipeline
suitably for the client:
▪ Construction installation method
▪ Subsurface conditions
▪ Top of pipe elevations
▪ Pipeline utility crossing information
▪ Pipeline stationing
▪ Pipe specifications and bill of material
▪ Staging areas
▪ Environmental extents
▪ Land ownership data
COMPUTER AIDED
DESIGN SOFTWARE:
Civil 3D
Civil 3D
Piping Networks
Pipeline Alignment Sheet - Example
11

Facility Data Capture
12
The first step to creating an accurate facility construction drawing
package is to outline the project objectives and capture data of the
existing conditions to develop a 3D model.
▪ 3D Laser Scanning Equipment
▪ Unmanned Aerial Vehicles (UAV)
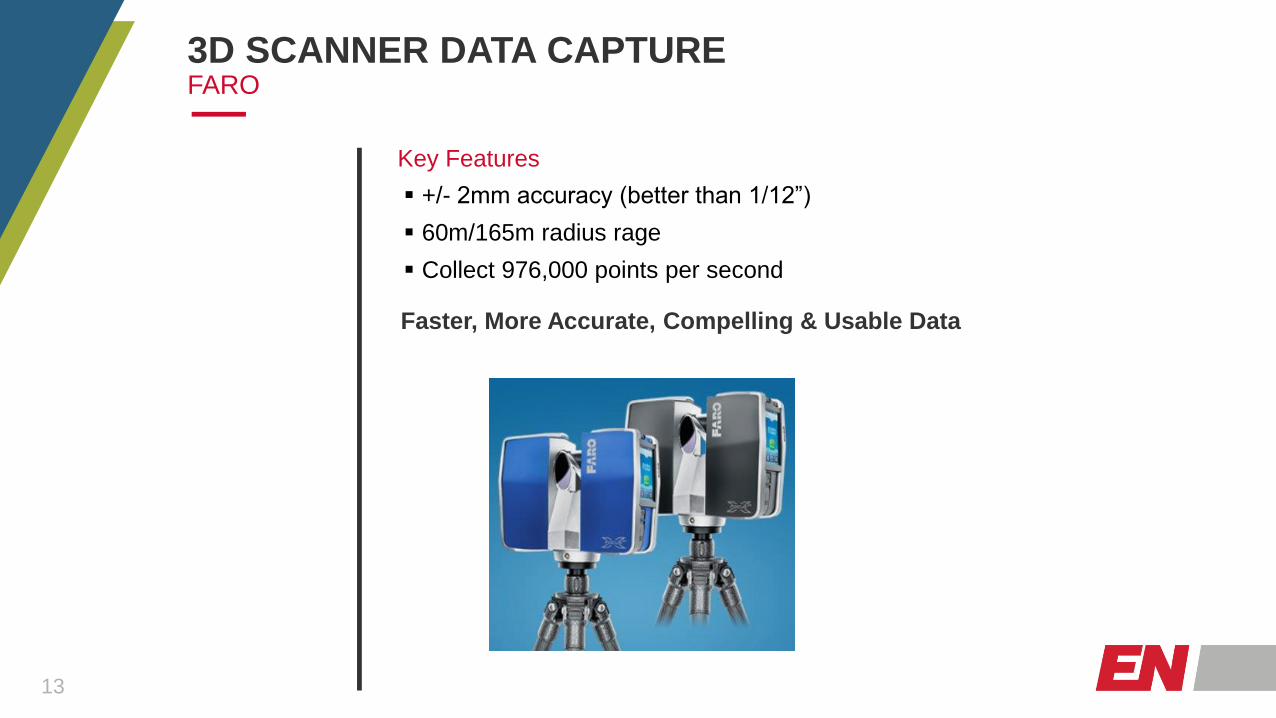
3D SCANNER DATA CAPTUREFARO
13
Key Features
▪ +/- 2mm accuracy (better than 1/12”)
▪ 60m/165m radius rage
▪ Collect 976,000 points per second
Faster, More Accurate, Compelling & Usable Data
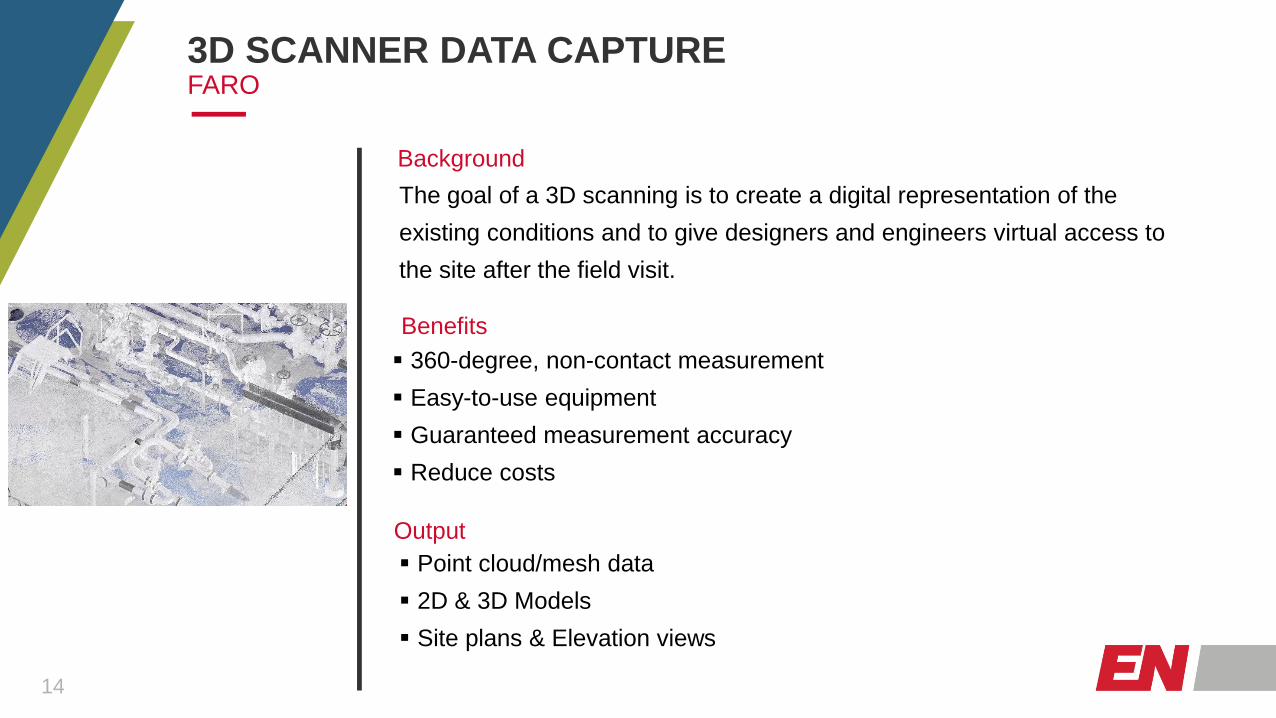
3D SCANNER DATA CAPTUREFARO
14
Background
The goal of a 3D scanning is to create a digital representation of the
existing conditions and to give designers and engineers virtual access to
the site after the field visit.
Benefits
▪ 360-degree, non-contact measurement
▪ Easy-to-use equipment
▪ Guaranteed measurement accuracy
▪ Reduce costs
▪ Point cloud/mesh data
▪ 2D & 3D Models
▪ Site plans & Elevation views
Output

UAV DATA CAPTUREPhotogrammetric Mapping & Modeling
15
Background
UAV to capture aerial data at low altitude with downward facing sensors.
During flight the ground is photographed several times from different
angles and each image is tagged with coordinates. From this data, the
photogrammetry combines images to create geo-referenced maps &
models.
Benefits
▪ Provide high resolution & accurate data
▪ Reduce field time and overall surveying time
▪ Quick deliverable turn-around time
▪ 2D & 3D Orthomosaic Maps
▪ 3D Models
Output

Facility Data Capture
16
The next step is to process images & laser scans by using ReCAP, a
scanning software with an output of a point cloud or mesh. A designer
will then create a 3D model for further analysis and design.
DESIGN SOFTWARE:
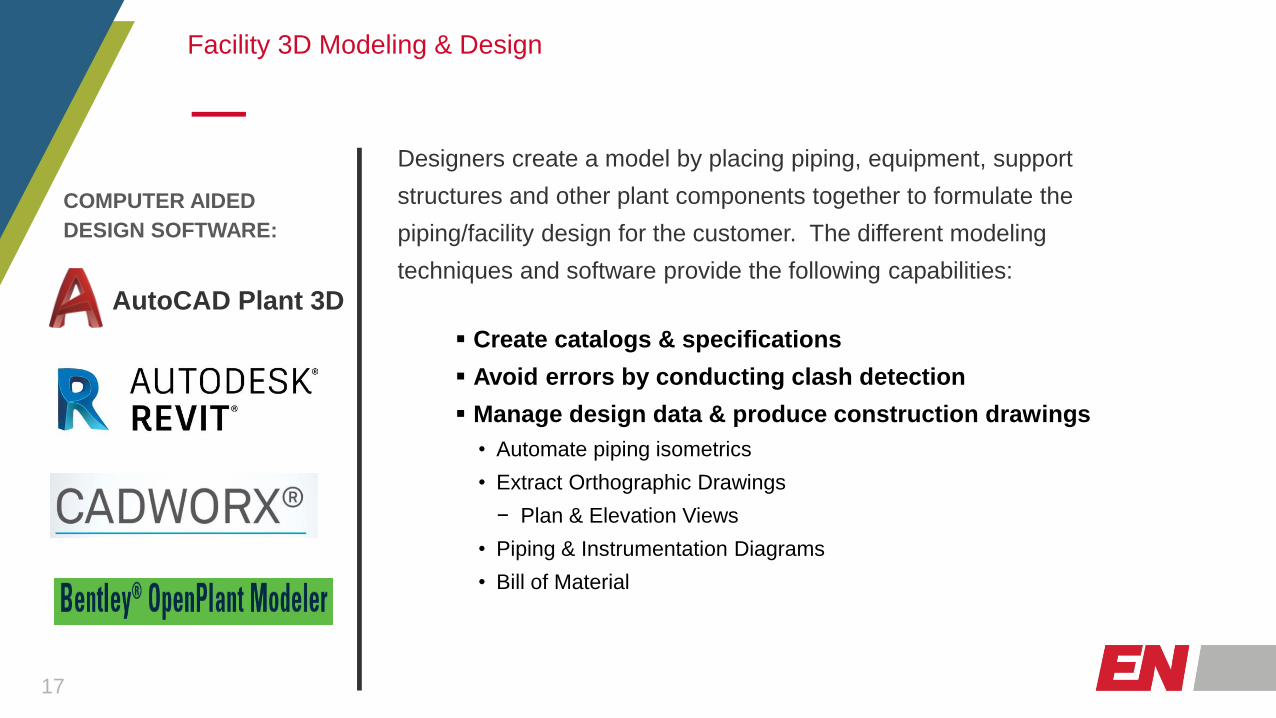
Facility 3D Modeling & Design
17
Designers create a model by placing piping, equipment, support
structures and other plant components together to formulate the
piping/facility design for the customer. The different modeling
techniques and software provide the following capabilities:
▪ Create catalogs & specifications
▪ Avoid errors by conducting clash detection
▪ Manage design data & produce construction drawings
• Automate piping isometrics
• Extract Orthographic Drawings
− Plan & Elevation Views
• Piping & Instrumentation Diagrams
• Bill of Material
COMPUTER AIDED
DESIGN SOFTWARE:
AutoCAD Plant 3D

Facility 3D Model - Example
18
ReCAP Software – Point Cloud
The project scope included a design of a new platform to have access to an existing tank
which is located over an existing compressor engine. The new platform included a railing for
workers to clip on with a safety harness.
AutoCAD Plant 3D - Model
GIS & Data Analytics
➢What is GIS?
➢How can we use GIS and Data to immediately aid in
Engineering Design?
➢What is the value of Data Analytics, and how can we use it to
help make informative Engineering Decisions?
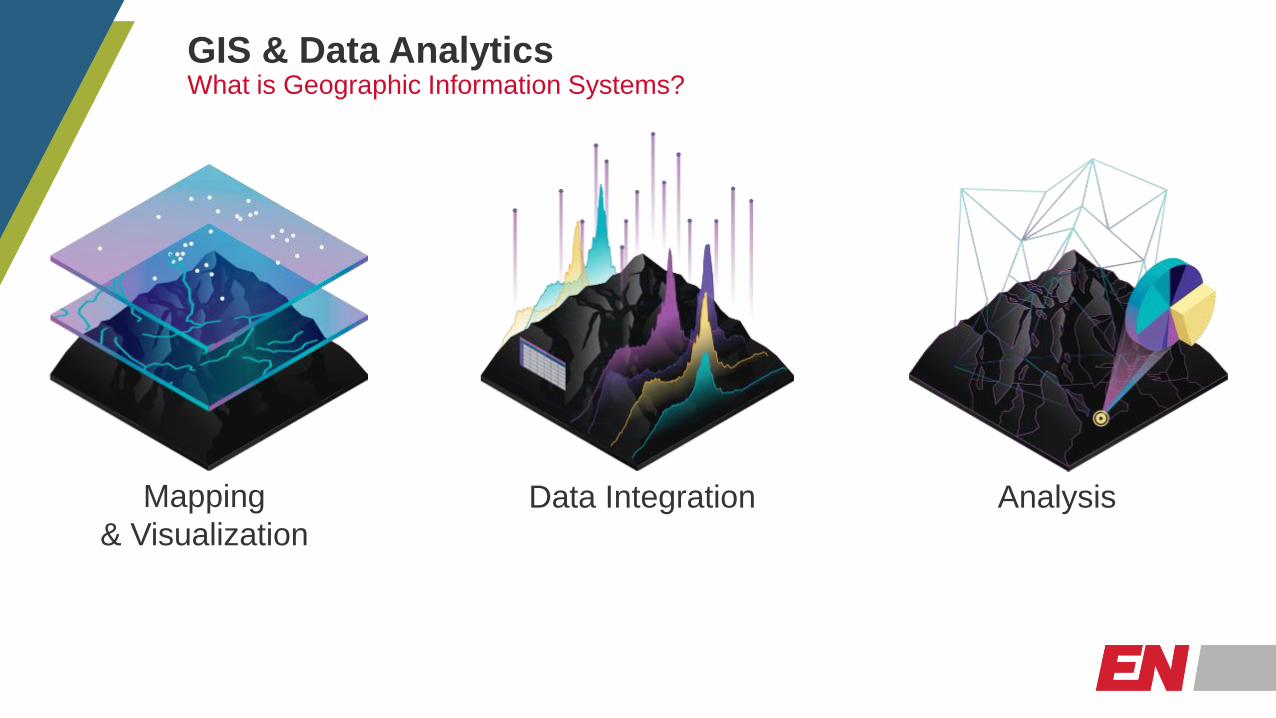
GIS & Data AnalyticsWhat is Geographic Information Systems?
Mapping
& Visualization
Data Integration Analysis
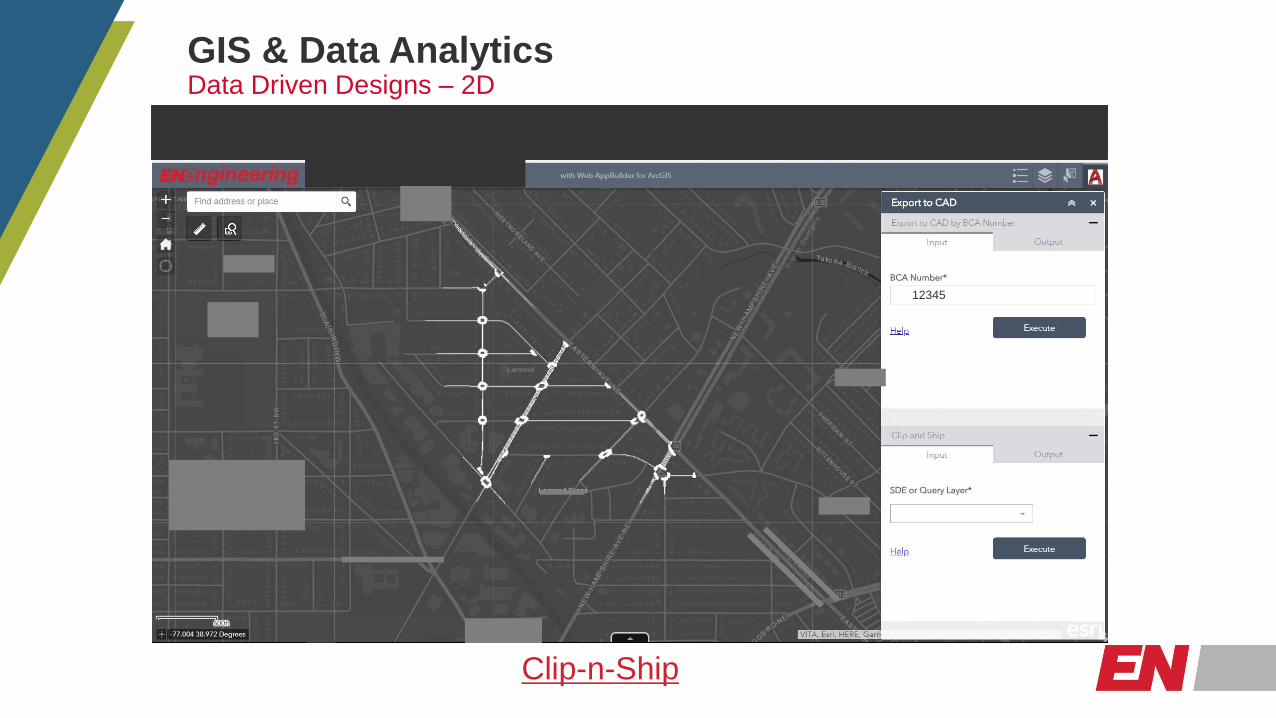
GIS & Data AnalyticsData Driven Designs – 2D
Clip-n-Ship
12345
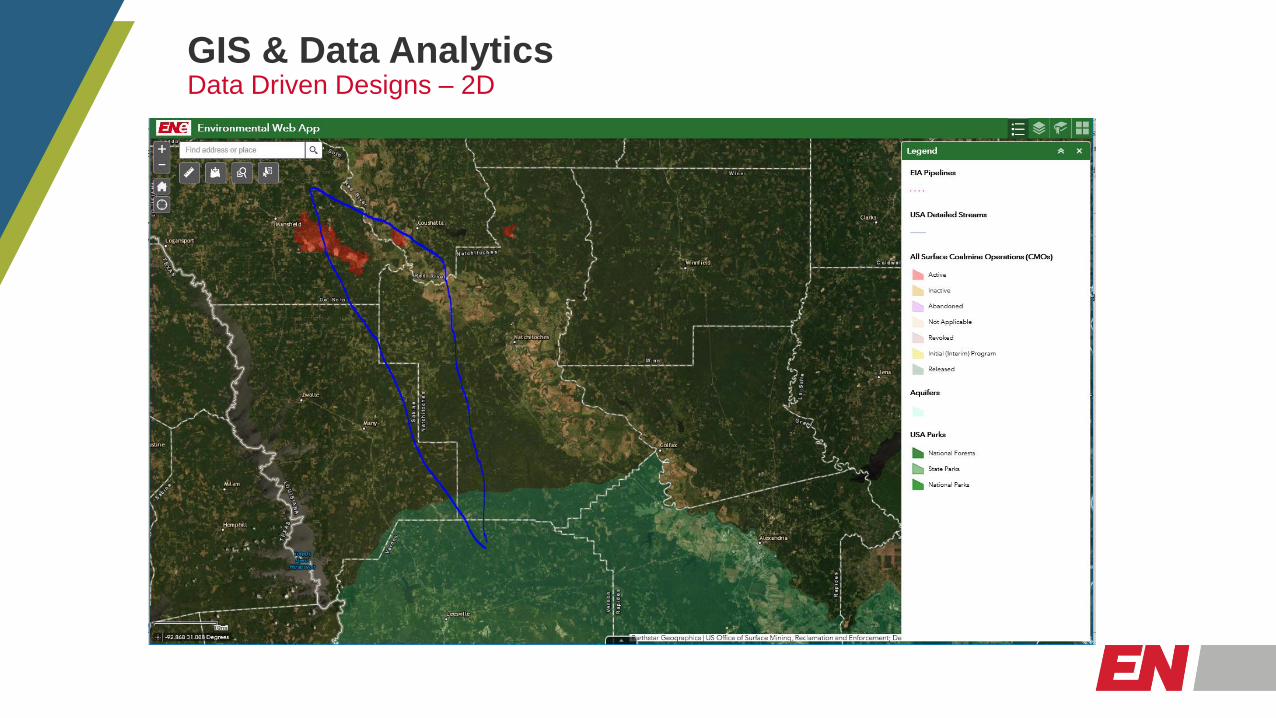
GIS & Data AnalyticsData Driven Designs – 2D

GIS & Data AnalyticsData Driven Designs – Raster Processing and Aerial Imagery Analysis
Original Raster
After Classification Before ClassificationSegmented Raster
Impervious Surface Analysis
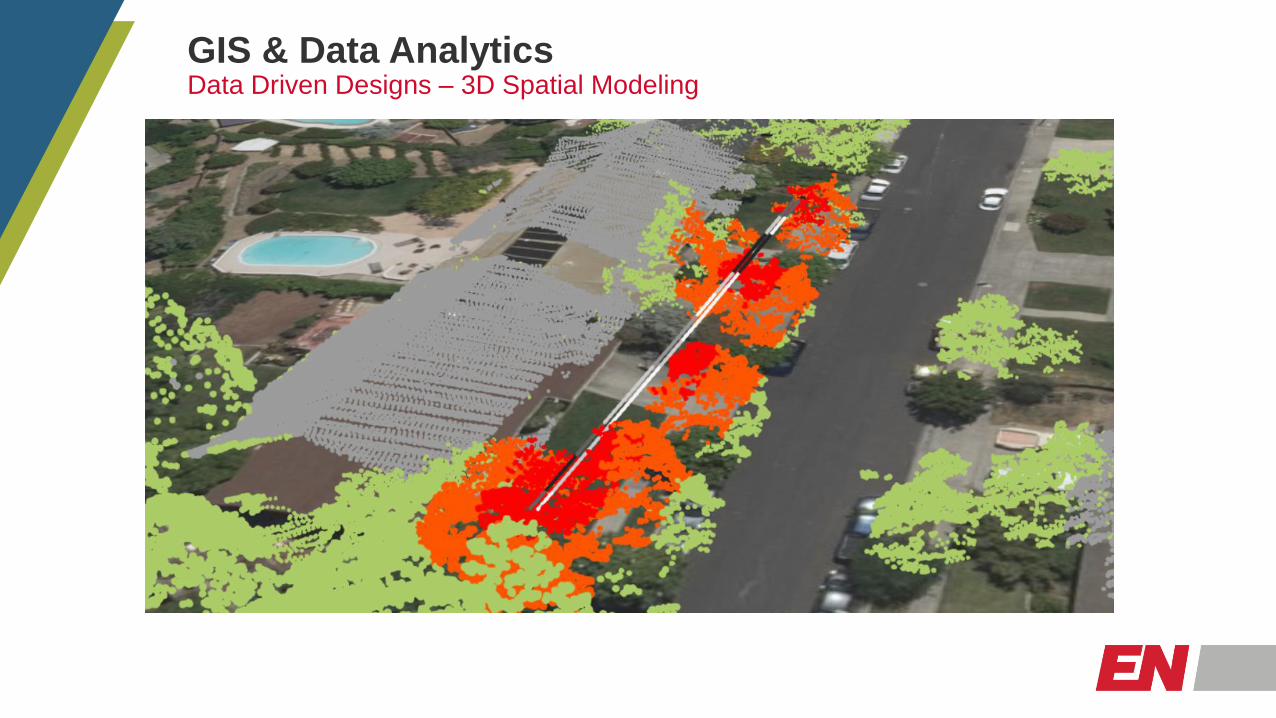
GIS & Data AnalyticsData Driven Designs – 3D Spatial Modeling
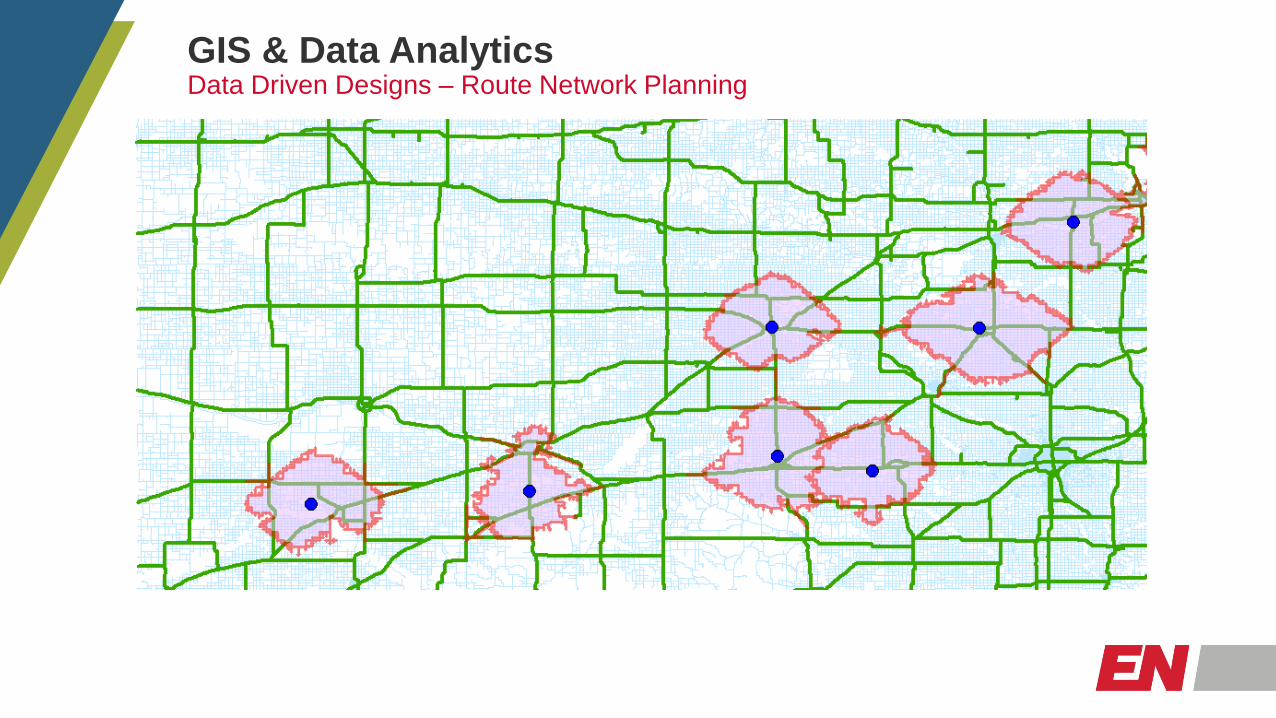
GIS & Data AnalyticsData Driven Designs – Route Network Planning

GIS & Data AnalyticsValue of Data
26
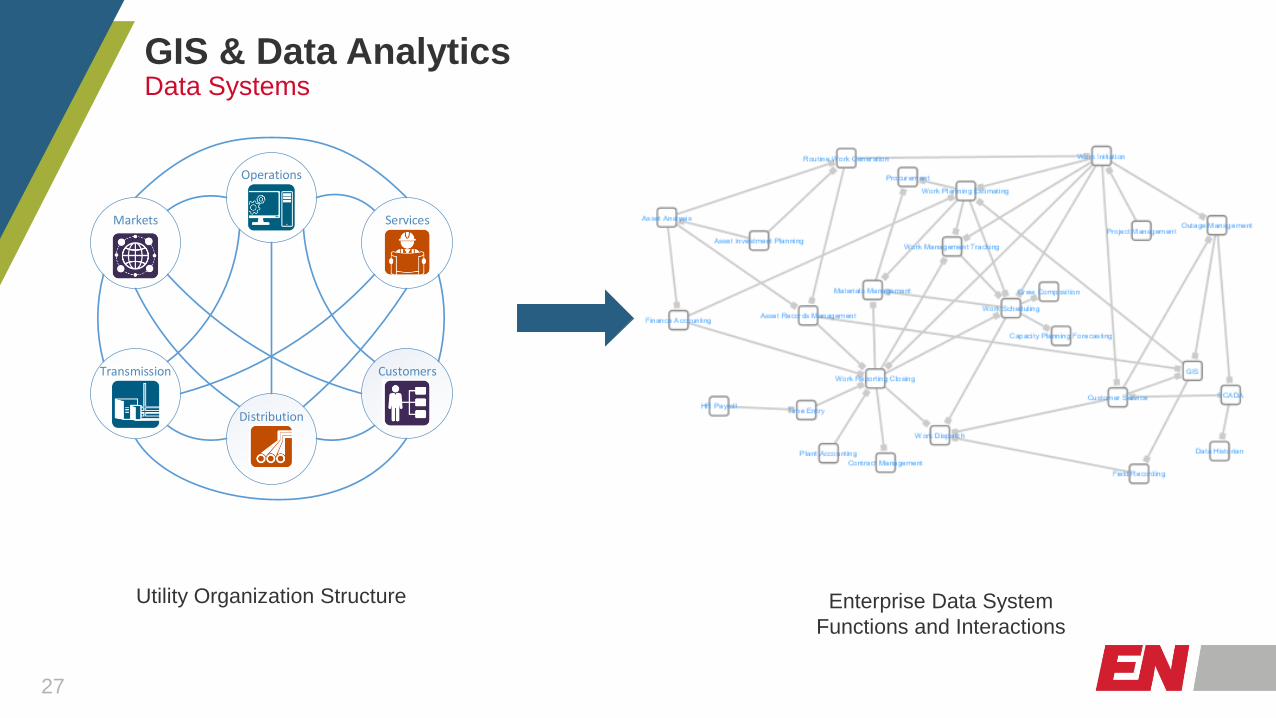
GIS & Data AnalyticsData Systems
27
Utility Organization Structure Enterprise Data System
Functions and Interactions
Services
CustomersTransmission
Markets
Distribution
Operations

GIS & Data AnalyticsAdvanced Analytics – System Risk Modeling
Risk Assessment Modules:
• Gas
Transmission/Distribution/Sto
rage Integrity Risk
Assessments
• Hazardous Liquid Integrity
Risk Assessment
• Internal Corrosion Threat
Assessment and
Prioritization
• AC Corrosion Threat
screening and Risk Model
• Atmospheric Corrosion Risk
Model
• Population expansion and
consequence of failure

GIS & Data AnalyticsAdvanced Analytics - Machine Learning
Gradient
Descent
Neural Network
“Deep Learning” Decision TreesLinear & Logistic Regression
Random Forests
Clustering Analysis
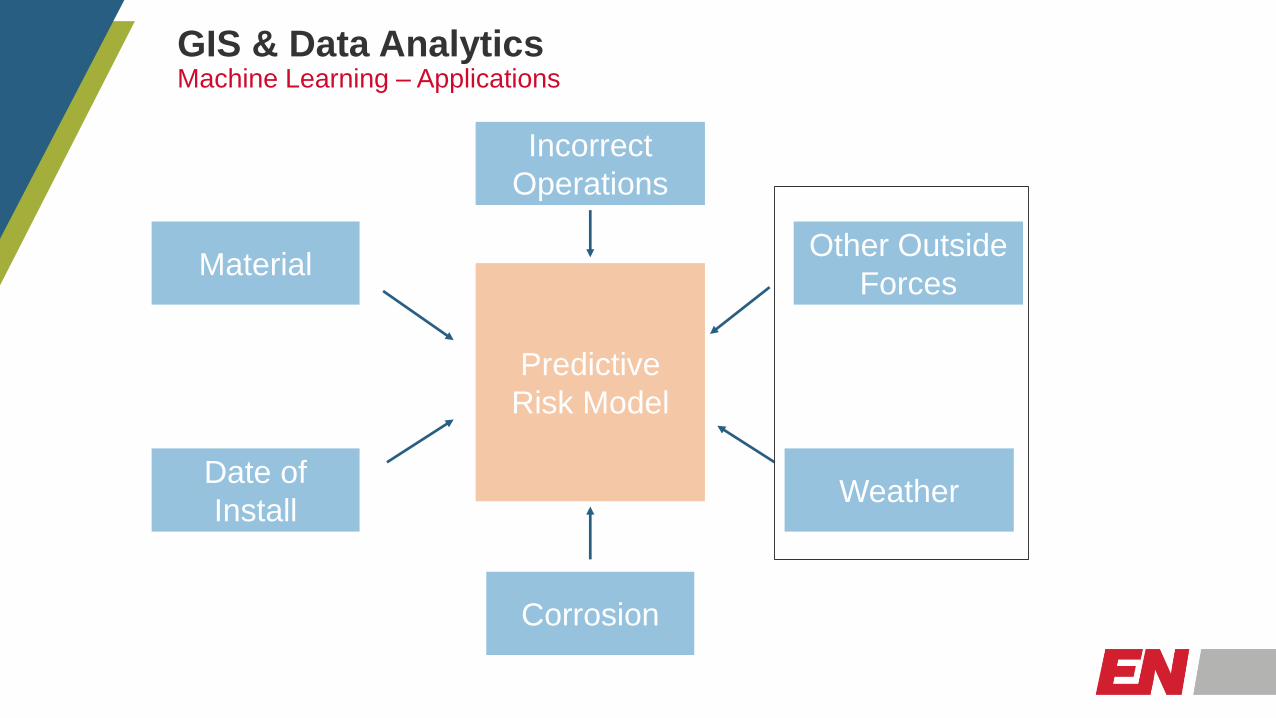
GIS & Data AnalyticsMachine Learning – Applications
Predictive
Risk Model
Material
Date of
Install
Corrosion
Weather
Other Outside
Forces
Incorrect
Operations

Thank You!31
EN Engineering, LLC
28100 Torch Parkway, Suite 400
Warrenville, Illinois 60555, USA
T: 630.353.4000 F: 630.353.7777
www.enengineering.com