Design, synthesis and evaluation of photoaffinity chemical ...
35
Design, synthesis and evaluation of photoaffinity chemical probe to study Lipoprotein lipase – small molecule interactions Tommy Orre Tommy Orre Master Thesis 45 ECTS Report passed: 28 June, 2016 Supervisors: Mikael Elofsson, Rémi Caraballo Examiner: Bertil Eliasson
Transcript of Design, synthesis and evaluation of photoaffinity chemical ...

Design, synthesis and evaluation of photoaffinity chemical probe to study Lipoprotein lipase – small molecule interactions
Tommy Orre
Tommy Orre Master Thesis 45 ECTS
Report passed: 28 June, 2016
Supervisors: Mikael Elofsson, Rémi Caraballo
Examiner: Bertil Eliasson

I
Abstract
Hypertriglyceridemia is a common disorder caused by highly elevated amount of triglycerides in the blood plasma. Hypertriglyceridemia can be caused by genetic defects or by high fat diet, excess consumption of alcohol, certain medications or medical conditions such as diabetes.1 Triglycerides are mostly present in the blood in large lipoproteins.2 The lipoproteins that contain triglycerides are processed by lipoprotein lipase (LPL) which is an enzyme that specifically target triglycerides and catalyzes their hydrolysis. The resulting free fatty acids and monoglycerides are stored for later use or consumed for energy production, thus removing triglycerides from the bloodstream.3 The LPL enzyme is only active as an unstable homodimer and is regulated by angiopoietin-like proteins such as ANGPTL3 which inhibits LPL and ANGPTL4 which promotes dissociation of the homodimer.3 A recent study performed by our group investigated the structure–activity relationships (SAR) of a small molecule that stabilizes LPL in the presence of ANGPTL4 thus preventing the dissociation of the homodimer.3 The aim of the present study was to synthesize an analogue of the lead compound that contains a photoaffinity substituent. Thus, we aim to determine the mode of action of this class of molecules on LPL. We chose to use aryl azide as the photoaffinity substituent in this study. When aryl azides degrade, it forms a highly reactive nitrene. To form a covalent bond between the molecule and LPL, the molecule can be allowed to interact with LPL. The photoaffinity substituent can then be activated using irradiation, the reactive nitrene that is produced forms a covalent bond with the target protein. The binding site of LPL can then be identified by digesting the protein and by analyzing the fragments using mass spectrometry to identify where the molecule is bound and the stoichiometry of the interaction.4

II
III
List of abbreviations
ANGPTL Angiopoietin-like Da Dalton DCM Dichloromethane DIPEA N,N-Diisopropylethylamine DMF Dimethylformamide DMSO Dimethyl sulphoxide EC50 Half maximal effective concentration HDL High-density lipoprotein HPLC High-performance liquid chromatography IDL Intermediate-density lipoprotein LC-MS Liquid chromatography-mass spectrometry LC-MS/MS Liquid chromatography-tandem mass spectrometry LDL Low-density lipoprotein LPL Lipoprotein lipase NMR Nuclear Magnetic Resonance T3P Propylphosphonic anhydride TBTU O-(Benzotriazol-1-yl)-N,N,N′,N′-tetramethyluronium
tetrafluoroborate TEA Triethylamine TLC Thin layer chromatography TMEDA Tetramethylethylenediamine VLDL Very low-density lipoprotein

IV
V
Table of Contents Abstract .......................................................................................................................... I List of abbreviations ....................................................................................................III 1. Introduction ............................................................................................................... 1
1.1 Hypertriglyceridemia and LPL ............................................................................. 1 1.2 Small molecule stabilizing LPL ............................................................................ 2 1.3 Photoaffinity labeling ........................................................................................... 2 1.4 Aim of the diploma work ...................................................................................... 4
2. Popular scientific summary including social and ethical aspects .............................. 5 2.1 Popular scientific summary .................................................................................. 5 2.2 Social and ethical aspects .................................................................................... 5
3. Results and Discussion .............................................................................................. 6 3.1 Synthetic pathway. ............................................................................................... 6 3.2 Synthesis of compound 4 ..................................................................................... 7 3.3 Nitro reduction .................................................................................................... 8 3.4 Coupling compound 5 to methyl 3-bromo-4-formylbenzoate by indazole formation. ............................................................................................................ 8 3.5 Amide coupling on compound 6. ......................................................................... 9 3.6 Ester hydrolysis of compound 7. .......................................................................... 9 3.7 Photolysis of compound 8. ................................................................................. 10 3.8 Activity assay with compound 8 and reference compound. .............................. 12
4. Experimental ............................................................................................................ 15 5. Conclusions and Outlook .........................................................................................20 6. Appendix .................................................................................................................. 21 7. References ................................................................................................................ 27

VI

1
1. Introduction
1.1 Hypertriglyceridemia and LPL Hypertriglyceridemia is a common disorder caused by highly elevated amount of triglycerides in the blood plasma. Normal triglycerides concentration in the blood is less than 150 mg/dL and anything above this level is classified as hypertriglyceridemia.1,5 There are two different types of hypertriglyceridemia that is caused by different factors. Primary hypertriglyceridemia is caused by genetic defects that effects lipid transport.6 Secondary hypertriglyceridemia is caused by high fat diet, excess consumption of alcohol, certain medications or medical conditions such as diabetes.1,7 However, life-style changes such as exercise, diets and lower alcohol consumption can often lower the triglyceride levels.3 If the levels of triglycerides becomes too elevated (above 500 mg/dL),1 treatment is crucial since it can cause pancreatitis1 and cardiovascular disease5 among other complications.1 Cardiovascular disease is the leading cause of death in the world, therefore the treatment of Hypertriglyceridemia is very important. Triglycerides are molecules that consist of a glycerol unit and three fatty acid esters with hydrocarbon chains of various lengths (Figure 1).2 Triglycerides are the most abundant components of the fat stored in the body as well as dietary fats. Triglycerides are mostly present in the blood in large lipoproteins such as Chylomicron, very low-density lipoprotein (VLDL), intermediate-density lipoprotein (IDL), low-density lipoprtotein (LDL), and high-density lipoprotein (HDL).2
Figure 1: Structure of a triglyceride, the left part of the structure is a glycerol connected by an ester to three fatty acids to the right. Triglycerides are the most common component of fat storage in animals.
These lipoproteins are processed by lipoprotein lipase (LPL). LPL is a 55 kDa glycoprotein that is mostly produced in parenchymal cells and released into the bloodstream from adipocytes and muscle cells.8 In the bloodstream, LPL functions as an enzyme that specifically targets triglycerides within the lipoproteins and catalyzes their hydrolysis. The resulting free fatty acids and monoglycerides are stored for later use or consumed for energy production, thus removing triglycerides from the bloodstream.6 Other than the hydrolysis of triglycerides, LPL have additional functionalities in the bloodstream such as interaction with lipoproteins and act as an anchor to the vessel wall and promote lipoprotein particles uptake.6 LPL also facilitates the exchange of lipids between different lipoproteins.6 The active form of LPL consist of two non-covalently bound monomers forming an unstable homodimer.8,9 LPL is only active in the blood as the unstable homodimer and it is regulated by angiopoietin-like proteins such as ANGPTL3 and ANGPTL4.3 ANGPTL3 and ANGPTL4 inhibit LPL by different mechanisms. ANGPTL3 inhibits LPL by reducing the catalytic activity while not reducing the self-deactivation rate of LPL.6 ANGPTL4 however, inhibits LPL by binding to the active dimer and destabilize the dimer and promotes dissociation into the inactive monomers.6
2
1.2 Small molecule stabilizing LPL A recent study performed at Umeå University, investigated the structure–activity relationships (SAR) of a small molecule that stabilizes LPL in vitro in the presence of ANGPTL4 thus preventing the dissociation of the homodimer.3 It has also been shown to lower the triglyceride levels in animal testing.3 Thus, the lead compound (figure 2) that was found to efficiently stabilize LPL could be further developed into a drug to treat patients with hypertriglyceridemia. In this study, this molecule was used as a reference molecule when determining the activity of the final compound. This is an important finding since LPL destabilizes in the body naturally and due to the presence of co-factors such as ANGPTL4. In the case of hypertriglyceridemia, as it can cause severe harm to the body, it is important to have treatment options available that can reduce the level of triglycerides in the bloodstream. One method of achieving this is to stabilize LPL to allow the protein to continuously hydrolyze triglycerides. As a result, the triglyceride concentration in the blood is reducted3 and thus, the risk for cardiovascular disease, pancreatitis, and other disorders caused by elevated triglyceride concentrations decreases.7
The starting point for the small molecule was found through screening 17 340 compounds3 and the screening hit chosen as a starting point was a substituted N-phenylphthalimide.3 This molecule was very similar to the final structure found to be most efficient with the only difference being the substitution of the phthalimide to an indazole heterocycle (figure 2).3 The reaction to form the indazole ring functions by first forming an imine between a 2-bromobenzaldehyde moiety and an aniline moiety. By utilizing a copper catalyst and azide, the imine and azide can react to form the indazole ring. The reaction is heavily dependent on a copper catalyst to first allow azide to perform a nucleophilic aromatic substitution at the bromine. The copper then further activate the azide to allow for the ring formation.10
Figure 2: Hit compound found in the screening (left). Small molecule found to stabilize LPL in the presence of ANGPTL4 (middle). Target compound with photoaffinity substituent (right).
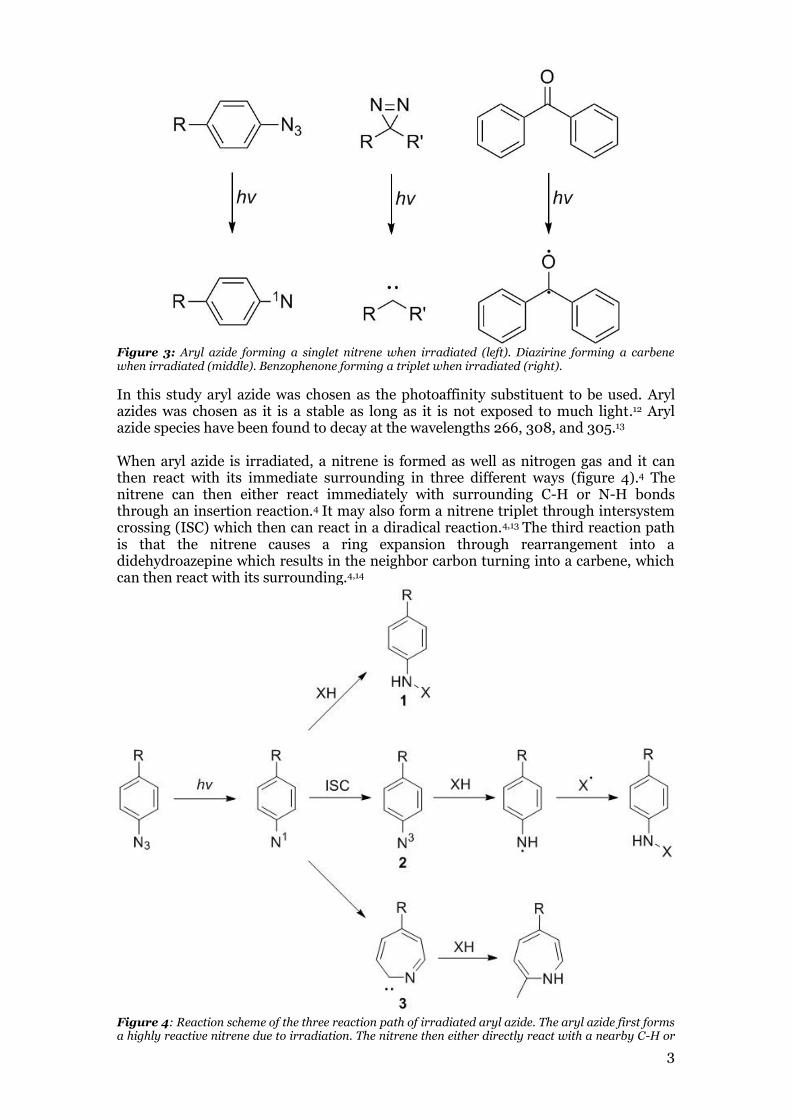
1.3 Photoaffinity labeling The mode of action of this small molecule, however, is unknown and future modifications of the molecule or other potential drugs to treat hypertriglyceridemia could benefit greatly from this information. There are several different methods of investigating the mode of action of ligand. Some methods include, NMR analysis of the ligand-protein complex, X-ray chrystallography of the ligand-protein complex, and photoaffinity labeling. Photoaffinity labeling was chosen in this study due to the instability of LPL making it difficult to analyze using the two former methods.4 Photoaffinity labeling is a method that utilizes stable photoactivatable chemical ligands that during irradiation decomposes to a highly reactive species.4 These reactive species can rapidly bind to nearby molecules and form covalent bonds.4 The most commonly used photoaffinity substituents are diazirines, aryl azides and benzophenones (figure 3).11 When irradiated, these three substituents form different reactive species. The diazirines forms a carbene, the aryl azide forms a nitrenes and the benzophenones forms a diradical species.11 Each of these are highly reactive and will generally react with the closest molecule and form an irreversible covalent bond.4,11
3
Figure 3: Aryl azide forming a singlet nitrene when irradiated (left). Diazirine forming a carbene when irradiated (middle). Benzophenone forming a triplet when irradiated (right).
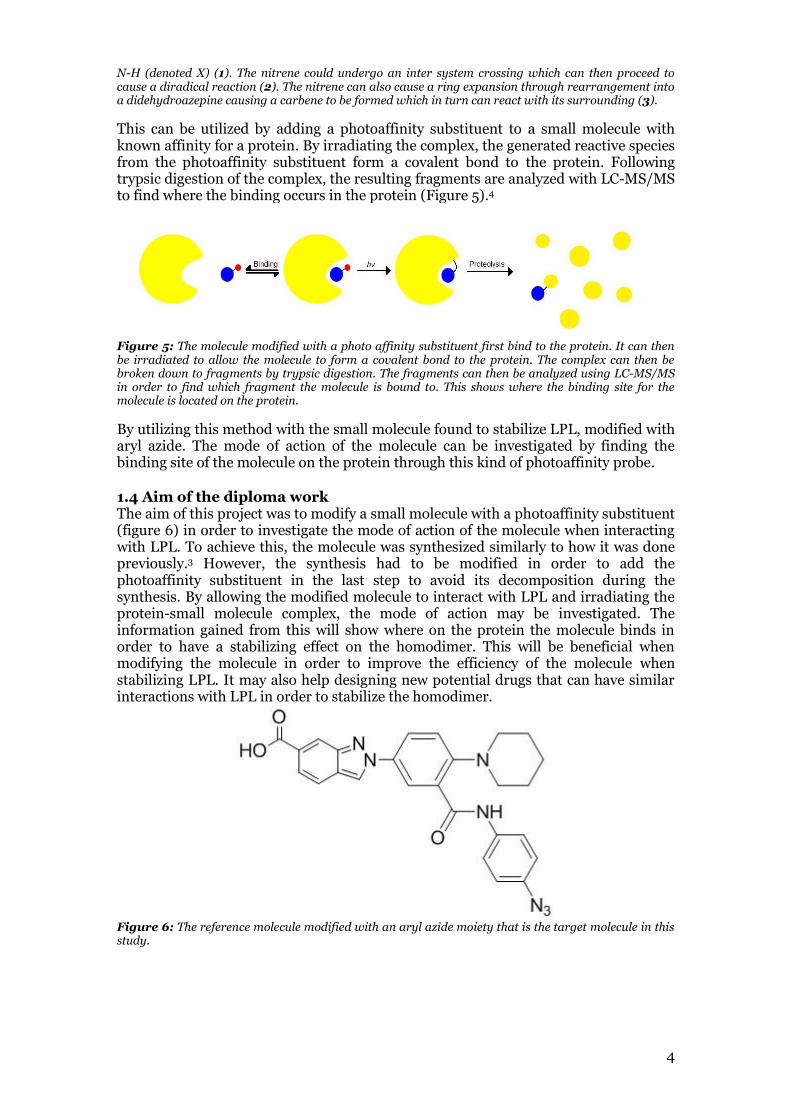
In this study aryl azide was chosen as the photoaffinity substituent to be used. Aryl azides was chosen as it is a stable as long as it is not exposed to much light.12 Aryl azide species have been found to decay at the wavelengths 266, 308, and 305.13 When aryl azide is irradiated, a nitrene is formed as well as nitrogen gas and it can then react with its immediate surrounding in three different ways (figure 4).4 The nitrene can then either react immediately with surrounding C-H or N-H bonds through an insertion reaction.4 It may also form a nitrene triplet through intersystem crossing (ISC) which then can react in a diradical reaction.4,13 The third reaction path is that the nitrene causes a ring expansion through rearrangement into a didehydroazepine which results in the neighbor carbon turning into a carbene, which can then react with its surrounding.4,14
Figure 4: Reaction scheme of the three reaction path of irradiated aryl azide. The aryl azide first forms a highly reactive nitrene due to irradiation. The nitrene then either directly react with a nearby C-H or
4
N-H (denoted X) (1). The nitrene could undergo an inter system crossing which can then proceed to cause a diradical reaction (2). The nitrene can also cause a ring expansion through rearrangement into a didehydroazepine causing a carbene to be formed which in turn can react with its surrounding (3).
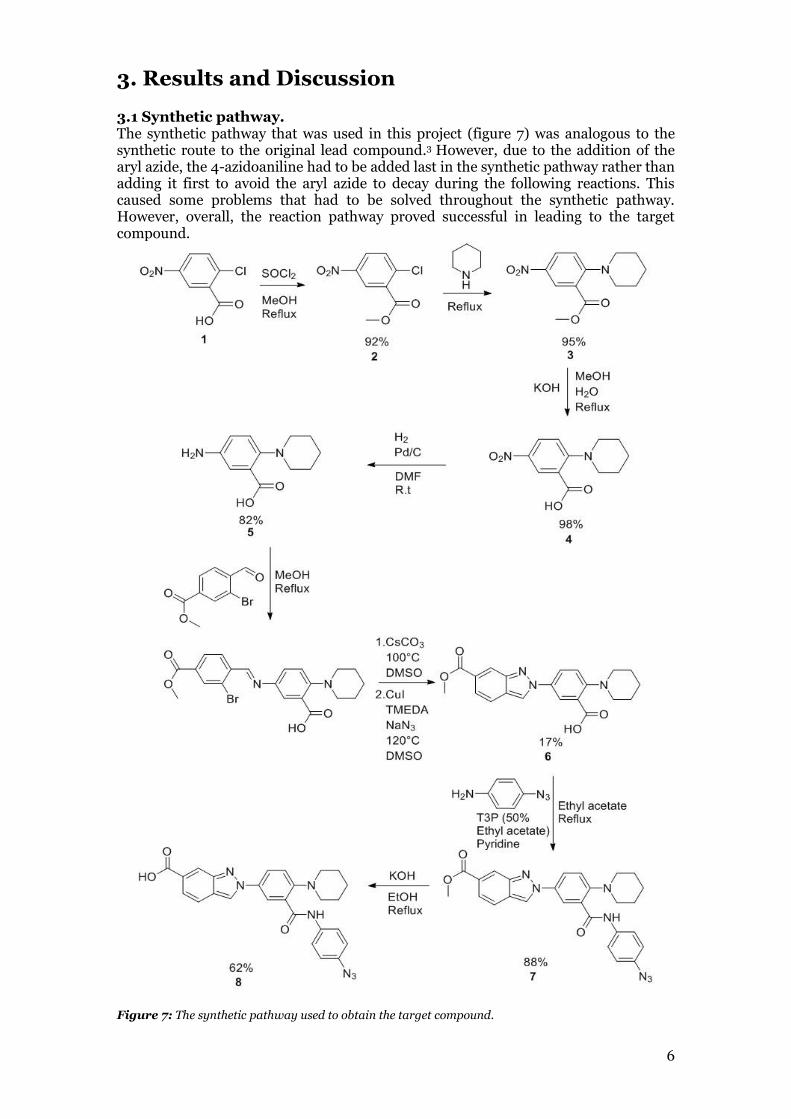
This can be utilized by adding a photoaffinity substituent to a small molecule with known affinity for a protein. By irradiating the complex, the generated reactive species from the photoaffinity substituent form a covalent bond to the protein. Following trypsic digestion of the complex, the resulting fragments are analyzed with LC-MS/MS to find where the binding occurs in the protein (Figure 5).4
Figure 5: The molecule modified with a photo affinity substituent first bind to the protein. It can then be irradiated to allow the molecule to form a covalent bond to the protein. The complex can then be broken down to fragments by trypsic digestion. The fragments can then be analyzed using LC-MS/MS in order to find which fragment the molecule is bound to. This shows where the binding site for the molecule is located on the protein.
By utilizing this method with the small molecule found to stabilize LPL, modified with aryl azide. The mode of action of the molecule can be investigated by finding the binding site of the molecule on the protein through this kind of photoaffinity probe.
1.4 Aim of the diploma work The aim of this project was to modify a small molecule with a photoaffinity substituent (figure 6) in order to investigate the mode of action of the molecule when interacting with LPL. To achieve this, the molecule was synthesized similarly to how it was done previously.3 However, the synthesis had to be modified in order to add the photoaffinity substituent in the last step to avoid its decomposition during the synthesis. By allowing the modified molecule to interact with LPL and irradiating the protein-small molecule complex, the mode of action may be investigated. The information gained from this will show where on the protein the molecule binds in order to have a stabilizing effect on the homodimer. This will be beneficial when modifying the molecule in order to improve the efficiency of the molecule when stabilizing LPL. It may also help designing new potential drugs that can have similar interactions with LPL in order to stabilize the homodimer.
Figure 6: The reference molecule modified with an aryl azide moiety that is the target molecule in this study.

5
2. Popular scientific summary including social and ethical aspects
2.1 Popular scientific summary Hypertriglyceridemia is a common disorder where the concentration of fat in the blood is elevated. This can cause a number of health problems such as cardiovascular disease. Hypertriglyceridemia can either be caused by genetic factors or by a high fat diet and a lack of physical exercise. The concentration of fat in the blood is regulated by a protein called LPL. However, in the case of hypertriglyceridemia, there is more fat in the blood than LPL can remove. This can be due to LPL being unstable in the blood due to the protein ANGPTL4 which causes LPL to deactivate. Another cause can be due to a deficiency of LPL. As cardiovascular disease is the leading cause of death in the world, it is important to have methods to treat hypertriglyceridemia. One method to treat hypertriglyceridemia is to prevent ANGPTL4 from deactivating the protein. A recent study performed at Umeå University found a molecule that could stabilize LPL in the presence of ANGPTL4. However, it is unknown how the molecule stabilizes the homodimer. In this study a method to determine how the lead molecule stabilizes LPL has been investigated. This was done by modifying the lead molecule with a functional group that is sensitive to a certain light. When the molecule is then exposed to this light it decays and becomes highly reactive. By allowing the modified molecule to first interact with LPL in solution and then exposing the solution to the specific light, the modified molecule will form a bond to the protein. The protein can then be analyzed to identify where the molecule bound to the protein. This information indicate how the molecule manages to stabilize LPL.
2.2 Social and ethical aspects This project aimed to further investigate a molecule that could potentially be developed as a drug to treat hypertriglyceridemia. These results might assist in the understanding of the interaction between protein and molecule. Thus, this project is of importance to the public health. As this project is mostly centered around the synthesis of the target molecule, the synthetic procedures might assist in the future chemistry projects that aim to perform similar methods.
6
3. Results and Discussion
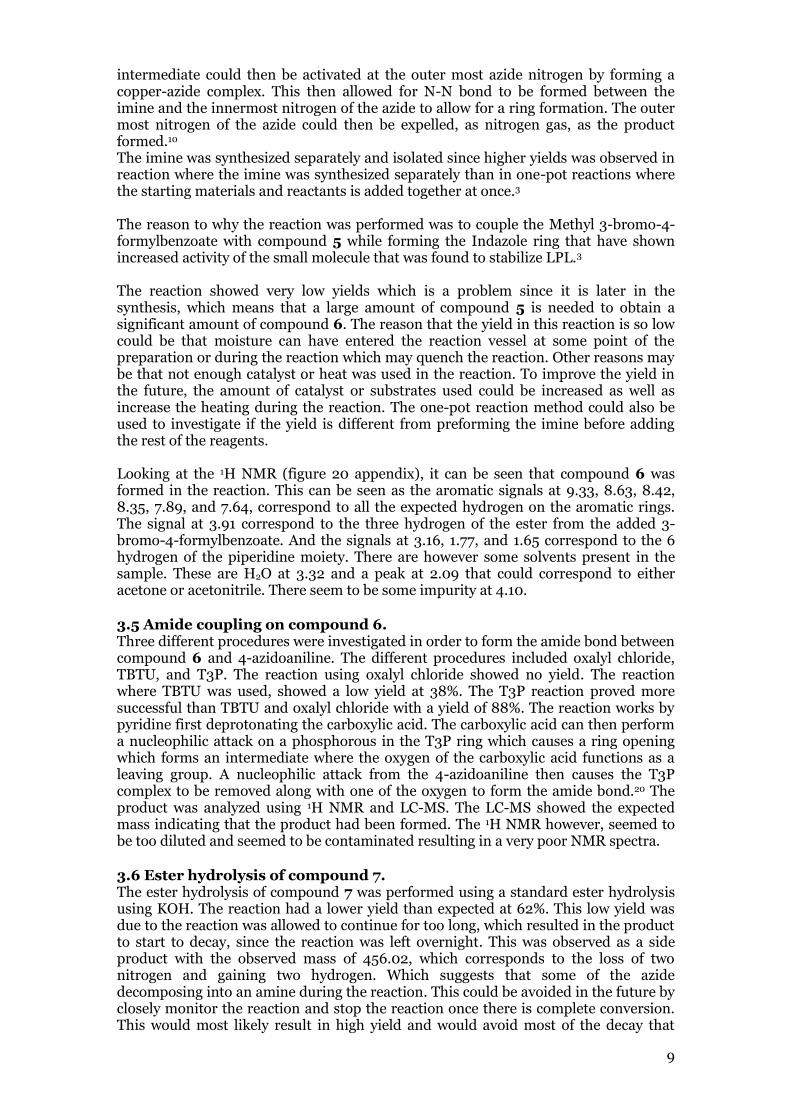
3.1 Synthetic pathway. The synthetic pathway that was used in this project (figure 7) was analogous to the synthetic route to the original lead compound.3 However, due to the addition of the aryl azide, the 4-azidoaniline had to be added last in the synthetic pathway rather than adding it first to avoid the aryl azide to decay during the following reactions. This caused some problems that had to be solved throughout the synthetic pathway. However, overall, the reaction pathway proved successful in leading to the target compound.
Figure 7: The synthetic pathway used to obtain the target compound.

7
3.2 Synthesis of compound 4 The first step in the synthesis was to perform the nucleophilic aromatic substitution with piperidine on 2-chloro-5-benzoic acid. This was important to start with since it had to be performed before the nitro reduction reaction. Otherwise the compound could react with each other since the substitution reaction would occur between the formed amine and the chloride on the starting material. This is avoided by first allowing piperidine to react with the 2-chloro-5-benzoic acid. The synthesis of compound 4 was first attempted using methanol as a solvent with 3 equivalents of piperidine and 2 equivalents of TEA.3 By monitoring the reaction using LC-MS, the conversion was found to be ~100%, however, the excess piperidine and TEA were problematic to remove from the product after work up and purification. Thus, multiple purification steps were necessary to obtain a pure product which caused a loss of much of the product and resulted in a 14% and 30% yield for the first two attempts. The reaction was then modified in order to simplify the purification process by not using TEA and methanol but instead by using piperidine as base and solvent.15 This procedure simplified the purification slightly and the yield for this method was 53% which is an improvement from the earlier methods. The main problem with the synthesis of compound 4 was the hydrophilicity of the compound, and the reason to the low yield was likely due to most of the product being located in the aqueous phase. This caused the purification to require multiple washes to extract the product as much as possible from the aqueous phase while removing most of the piperidine (and TEA used in lower yield procedures). Further purification was also necessary through column chromatography due to piperidine in the organic phase where additional product was lost due to heavy tailing and overlap with piperidine. The fractions containing piperidine were run through a second column chromatography where an additional small amount of product was obtained, though most product still overlapped with piperidine elution. To prevent this low yield, a work around was attempted with procedure 3 to convert the carboxylic acid into an ester to reduce the hydrophilicity. This was done using thionyl chloride to first convert the carboxylic acid into an acid chloride16 which is very susceptible to nucleophilic acyl substitution. Since the compound was soluble in methanol, it could be used as solvent, which is convenient since it can then act as both solvent and as a reactant in very high excess allowing the reaction to occur efficiently. Procedure 3 showed very good yields at 92% with a simple work-up. Piperidine could then be allowed to react to compound 2 with a similar procedure as procedure 1. Procedure 4 showed a very good yield at 95% with a simple work-up compared to procedure 1. Due to the lower hydrophilicity, a majority of the product was found in the organic phase, the piperidine and TEA was then easily removed with the basic and acidic aqueous phase wash as the solubility of compound 3 was unaffected by the pH of the aqueous solution due to the carboxylic acid being converted to an ester. The ester was then hydrolyzed in procedure 5 which showed a very good yield at 98%. The ester was hydrolyzed using KOH as a base as well as a nucleophile and a small amount of water to increase the solubility of KOH and also function as an additional nucleophile. The solution was then neutralized using HCl in order to form KCl and H2O which could be evaporated along with the solvent. The product was then purified by trituration using DCM and ethyl acetate to solubilize the compound as the KCl formed is insoluble in both DCM and ethyl acetate. The impurities were then filtered of and the solvent was evaporated to yield to compound. This series of synthesis steps proved to be a more yield efficient method of obtaining compound 4 where this method gave an overall yield of 85.6% while the method where piperidine reacted directly with 2-chloro-5-benzoic acid gave a yield of 53% as the highest yield obtained from the different attempts.

8
Compound 4 was analyzed using 1H NMR to confirm that the product was obtained and to see that it was pure (figure 16 appendix). The NMR shows that the product was obtained. The peaks between 9.13 and 7.59 correspond to the hydrogen located on the aromatic ring. The peak at 3.05 corresponds to the four hydrogen closest to the nitrogen in the piperidine ring as the chemical shift is higher due to the proximity of nitrogen, it is also a triplet indicating two hydrogen on neighboring carbon. The peak at 1.91 corresponds to the four hydrogen two bonds away from the nitrogen as it is a quintuplet indicating 4 neighboring hydrogen. The peak at 1.73 corresponds to the two hydrogen furthest away from the nitrogen due to the low chemical shift and only representing two hydrogen. The remaining peaks correspond to either solvent or some impurities.
3.3 Nitro reduction The nitro reduction was first attempted on compound 4 using sodium borohydride.3 However, no product was observed when monitoring the reaction with TLC and LC-MS. The nitro reduction was then attempted on compound 3 before the ester hydrolysis in order to investigate this synthetic path. Four different procedures were used to reduce the nitro substituent on compound 3, which included, hydrogen atmosphere, Ammonium formate,17 Tin(II) chloride,3 and 1,4-Cyclohexadiene.18 However, none of the procedures was successful. The ester was then hydrolyzed and further reduction method of the nitro substituent on compound 4 was investigated. The nitro group reduction was done by using hydrogen atmosphere with palladium on charcoal used as a catalyst. This method was successful with a high yield with an average of 82%. The reason why the reduction of compound 3 was unsuccessful could have been due to the electron donating properties of the amine in the piperidine ring, and the electron withdrawing properties of the nitro substituent.19 This results in the nitro substituent having a higher than normal electron density due to the combination of electron donating properties of the amine in the piperidine ring and the electron withdrawing properties of the nitro substituent. This causes the reduction to be highly inefficient due to the highly negative charge on the nitro substituent. The reduction of the nitro substituent after the hydrolysis of the ester into the carboxylic acid, however, proved much more successful. This could be due to the carboxylic acid being able to protonate the amine in the piperidine ring disrupting the electron donating properties of the amine, effectively lowering the electron density of the nitro substituent. Furthermore, the carboxylic acid substituent is also an electron withdrawing group. This could cause the nitro substituent and the carboxylic acid competes for the electrons in the system causing a lower electron density at the nitro substituent compared to compound 3. The combination of these two phenomena could be the cause of the nitro substituent on compound 4 being more easily reduced compared to the nitro substituent on compound 3. Looking at the 1H NMR (figure 18 appendix), the chemical shift of the aromatic signals of compound 5 is much lower than aromatic signals of compound 4. This is due to the reduction of the nitro group into an amino group as the amino group is an electron donating group rather than an electron withdrawing group like the nitro substituent.19 This will cause a lower chemical shift of the hydrogen on the aromatic ring. This indicates that the nitro reduction was successful.
3.4 Coupling compound 5 to methyl 3-bromo-4-formylbenzoate by indazole formation. In this reaction, the imine was first formed using compound 5 and 3-bromo-4-formylbenzoate by a nucleophilic attack of the amine on the ketone and expelling water. The imine was then dried under vacuum to remove the solvent and water resulting from the reaction. The imine was dissolved in DMSO. CuI and TMEDA was then added to the solution as well as sodium azide. The azide could then substitute the bromine by means of the copper catalyst to form an azidobenzyl intermediate. The
9
intermediate could then be activated at the outer most azide nitrogen by forming a copper-azide complex. This then allowed for N-N bond to be formed between the imine and the innermost nitrogen of the azide to allow for a ring formation. The outer most nitrogen of the azide could then be expelled, as nitrogen gas, as the product formed.10
The imine was synthesized separately and isolated since higher yields was observed in reaction where the imine was synthesized separately than in one-pot reactions where the starting materials and reactants is added together at once.3 The reason to why the reaction was performed was to couple the Methyl 3-bromo-4-formylbenzoate with compound 5 while forming the Indazole ring that have shown increased activity of the small molecule that was found to stabilize LPL.3 The reaction showed very low yields which is a problem since it is later in the synthesis, which means that a large amount of compound 5 is needed to obtain a significant amount of compound 6. The reason that the yield in this reaction is so low could be that moisture can have entered the reaction vessel at some point of the preparation or during the reaction which may quench the reaction. Other reasons may be that not enough catalyst or heat was used in the reaction. To improve the yield in the future, the amount of catalyst or substrates used could be increased as well as increase the heating during the reaction. The one-pot reaction method could also be used to investigate if the yield is different from preforming the imine before adding the rest of the reagents. Looking at the 1H NMR (figure 20 appendix), it can be seen that compound 6 was formed in the reaction. This can be seen as the aromatic signals at 9.33, 8.63, 8.42, 8.35, 7.89, and 7.64, correspond to all the expected hydrogen on the aromatic rings. The signal at 3.91 correspond to the three hydrogen of the ester from the added 3-bromo-4-formylbenzoate. And the signals at 3.16, 1.77, and 1.65 correspond to the 6 hydrogen of the piperidine moiety. There are however some solvents present in the sample. These are H2O at 3.32 and a peak at 2.09 that could correspond to either acetone or acetonitrile. There seem to be some impurity at 4.10.
3.5 Amide coupling on compound 6. Three different procedures were investigated in order to form the amide bond between compound 6 and 4-azidoaniline. The different procedures included oxalyl chloride, TBTU, and T3P. The reaction using oxalyl chloride showed no yield. The reaction where TBTU was used, showed a low yield at 38%. The T3P reaction proved more successful than TBTU and oxalyl chloride with a yield of 88%. The reaction works by pyridine first deprotonating the carboxylic acid. The carboxylic acid can then perform a nucleophilic attack on a phosphorous in the T3P ring which causes a ring opening which forms an intermediate where the oxygen of the carboxylic acid functions as a leaving group. A nucleophilic attack from the 4-azidoaniline then causes the T3P complex to be removed along with one of the oxygen to form the amide bond.20 The product was analyzed using 1H NMR and LC-MS. The LC-MS showed the expected mass indicating that the product had been formed. The 1H NMR however, seemed to be too diluted and seemed to be contaminated resulting in a very poor NMR spectra.
3.6 Ester hydrolysis of compound 7. The ester hydrolysis of compound 7 was performed using a standard ester hydrolysis using KOH. The reaction had a lower yield than expected at 62%. This low yield was due to the reaction was allowed to continue for too long, which resulted in the product to start to decay, since the reaction was left overnight. This was observed as a side product with the observed mass of 456.02, which corresponds to the loss of two nitrogen and gaining two hydrogen. Which suggests that some of the azide decomposing into an amine during the reaction. This could be avoided in the future by closely monitor the reaction and stop the reaction once there is complete conversion. This would most likely result in high yield and would avoid most of the decay that
10
occurred in this reaction. This reaction resulted in the final product that was planned to be used in the biological experiment. The product was analyzed using LC-MS, 1H NMR, and 13C NMR. Both the LC-Ms indicates that compound 8 have been formed as the expected mass was found and both the 1H NMR (figure 23 appendix) and 13C NMR (figure 24 appendix) shows the expected peaks for the compound. Both of the NMR spectrum showed some decay of the compound as small peaks at the aromatic region that correspond to anilinic hydrogen of the decayed compound. This is likely due to the NMR requiring to run at 60°C causing some of the compound to decay. The analysis of the product indicates that compound 8 was obtained.
3.7 Photolysis of compound 8. The photolysis experiments were performed in order to investigate and verify the expected decay of the aryl azide before performing the in vitro experiments. Before the biological experiments could be performed, it was important to see that the nitrene was formed during irradiation and to ensure that it could bind to the protein once the molecule is irradiated in the presence of LPL. The rate of the photolysis was also important in order to know the time needed the compound to decay from irradiation in the presence of LPL. These factors were crucial to investigate since the biological experiments requires much time and resources to perform. The decomposition was investigated by dissolving compound 8 in 2,2,2-triflouroethanol and by irradiating the sample.21 The compound formed was then analyzed using LC-MS, 1H NMR and 19F NMR. During the experiment, three possible products (figure 8) could be formed. Two of these are when the nitrene binds to the 2,2,2-trifluoroethanol in two different sites. The third one is where the nitrene causes ring expansion through rearrangement, resulting in a carbocation in the formed 7 membered ring that can capture nucleophiles.4 However, it is problematic to identify which product formed and in what ratios since they have an identical molecular weight, thus the LC-MS does not show which of the compounds were formed. 1H NMR did not indicate which compounds was formed as the sample was not very concentrated and had a low signal to noise ratio, and the structure of the compounds being very similar. However, the experiment shows that at least one of the reactions occurs as the LC-MS shows a mass of 553.87 which is the expected mass. However, the LC-MS shows that much of the compound in the experiment had the mass of 447.90. This could indicate that the aryl azide decomposed but was quenched and did not bind to the solvent. This could be due to moisture or air in the sample while preparing the sample and not using a completely air tight container.

11
Figure 8: The three different possible compounds that could have formed during the irradiation experiment.
The 19F NMR show that the compound contains fluorine with the chemical shift of -75.3 (figure 9). 2,2,2-triflouroethanol is expected to have a chemical shift of ~-78, which means that the signal corresponds to 2,2,2-triflouroethanol with a slight change in chemical shift. This indicates that the compound has successfully bonded to the solvent. It is unlikely that the 19F NMR signal correspond to remaining solvent as the compound was placed under vacuum before analyzing it with 19F NMR.
Figure 9: 19F NMR spectra showing that the compound contains fluorine indicating a reaction between reactive species from irradiation of aryl azide and the 2,2,2-trifluoroethanol solvent. The peak is displayed as a triplet because of F-H spin-coupling to the neighbor hydrogens. The documented chemical shift of 2,2,2-triflouroethanol is ~-78 ppm.
12
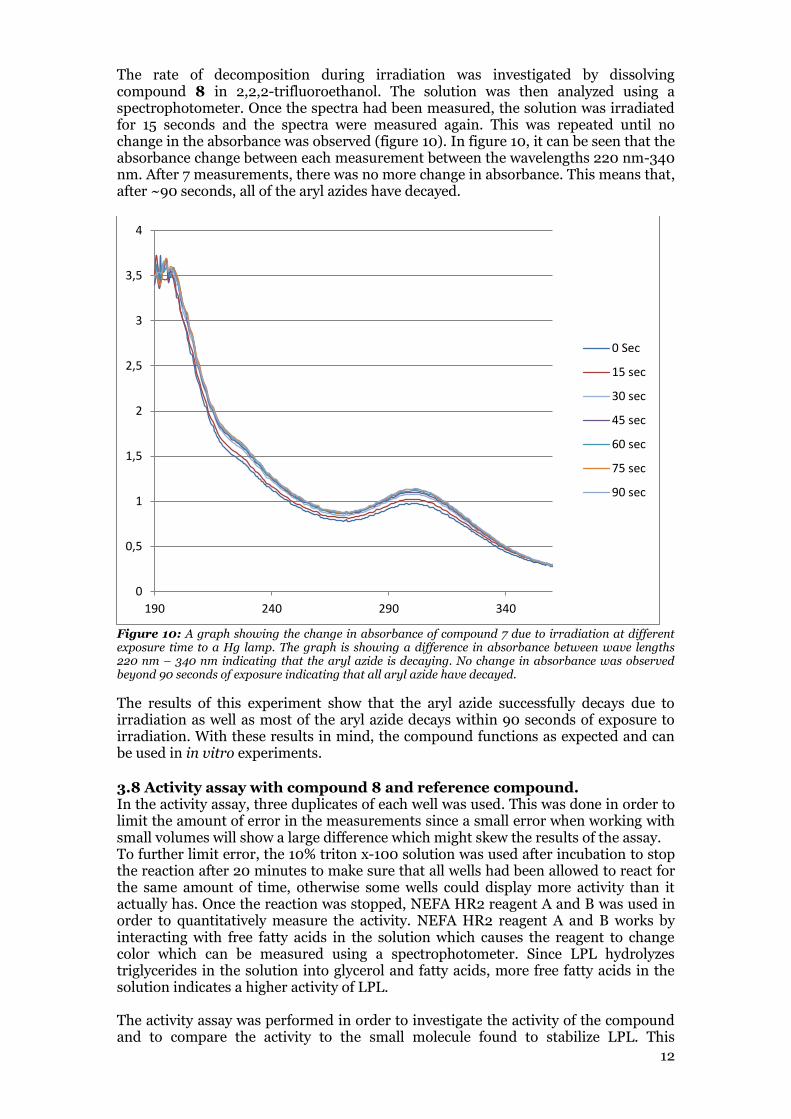
The rate of decomposition during irradiation was investigated by dissolving compound 8 in 2,2,2-trifluoroethanol. The solution was then analyzed using a spectrophotometer. Once the spectra had been measured, the solution was irradiated for 15 seconds and the spectra were measured again. This was repeated until no change in the absorbance was observed (figure 10). In figure 10, it can be seen that the absorbance change between each measurement between the wavelengths 220 nm-340 nm. After 7 measurements, there was no more change in absorbance. This means that, after ~90 seconds, all of the aryl azides have decayed.
Figure 10: A graph showing the change in absorbance of compound 7 due to irradiation at different exposure time to a Hg lamp. The graph is showing a difference in absorbance between wave lengths 220 nm – 340 nm indicating that the aryl azide is decaying. No change in absorbance was observed beyond 90 seconds of exposure indicating that all aryl azide have decayed.
The results of this experiment show that the aryl azide successfully decays due to irradiation as well as most of the aryl azide decays within 90 seconds of exposure to irradiation. With these results in mind, the compound functions as expected and can be used in in vitro experiments.
3.8 Activity assay with compound 8 and reference compound. In the activity assay, three duplicates of each well was used. This was done in order to limit the amount of error in the measurements since a small error when working with small volumes will show a large difference which might skew the results of the assay. To further limit error, the 10% triton x-100 solution was used after incubation to stop the reaction after 20 minutes to make sure that all wells had been allowed to react for the same amount of time, otherwise some wells could display more activity than it actually has. Once the reaction was stopped, NEFA HR2 reagent A and B was used in order to quantitatively measure the activity. NEFA HR2 reagent A and B works by interacting with free fatty acids in the solution which causes the reagent to change color which can be measured using a spectrophotometer. Since LPL hydrolyzes triglycerides in the solution into glycerol and fatty acids, more free fatty acids in the solution indicates a higher activity of LPL. The activity assay was performed in order to investigate the activity of the compound and to compare the activity to the small molecule found to stabilize LPL. This
0
0,5
1
1,5
2
2,5
3
3,5
4
190 240 290 340
0 Sec
15 sec
30 sec
45 sec
60 sec
75 sec
90 sec

13
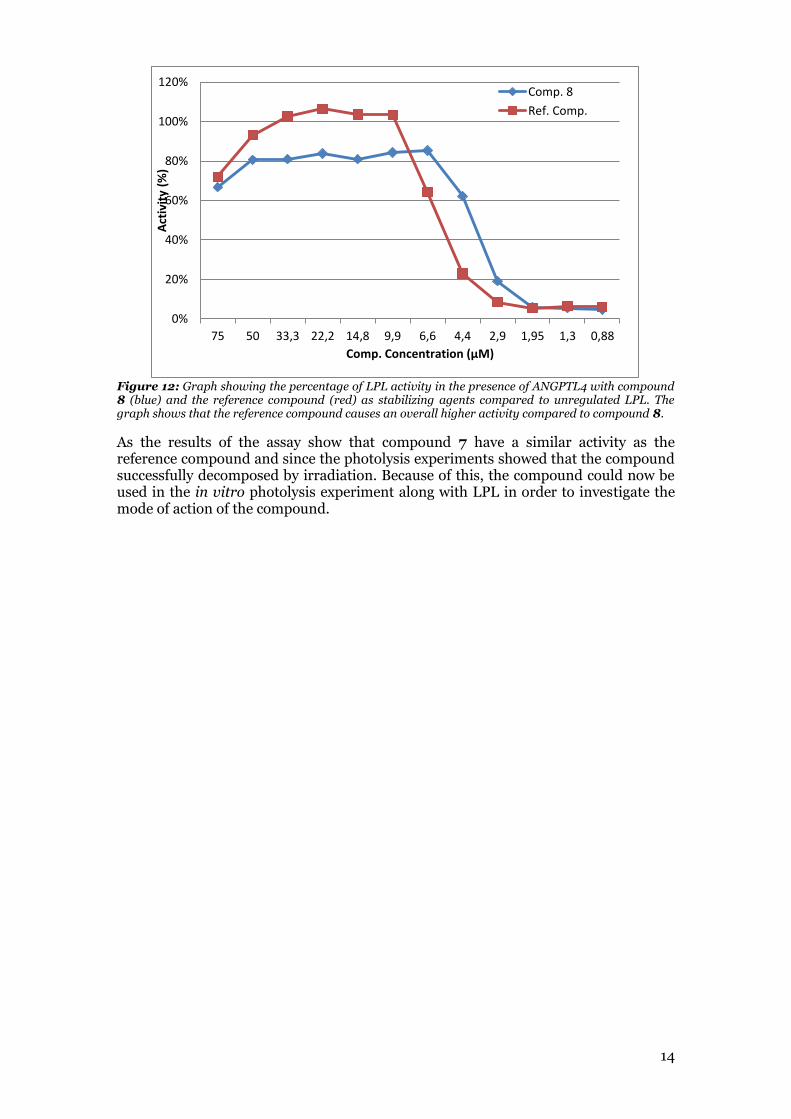
molecule was used as a reference compound during the activity assay. This was important, since in order to investigate the mode of action of the compound it had to bind to the protein before irradiating the compound. It was compared to the reference compound to see how different the activity between the compounds was. If the difference in activity was too different, the compound of interest might have bound to the protein differently and the photolysis experiment might show a different binding site than the actual binding site where the reference compound binds. However, this is not likely since the compounds are so similar. From the assay it was found that compound 8 had a similar very similar activity as the reference compound (figure 11 and 12). The activity is overall lower for compound 8 compared to the reference compound. It is however, expected that compound 8 have lower activity. This is due to the size and polarity of the azide substituent as it has been shown in the study performed by Rémi Caraballo et al.3 that a more polar substituent as well as larger substituents on the aniline moiety showed less activity than the methyl on the aniline moiety.3 However, the potency of compound 8 seems to be higher as the activity is higher for compound 8 at concentrations 6.6 µM, 4.4 µM, and 2.9 µM.
Figure 11: Graph showing the stabilizing effect of compound 8 (Blue) and the reference compound (red) on LPL in the presence of ANGPTL4. Blank is a reference as a well with no activity. LPL is a reference with unregulated LPL. LPL:Angptl4 is a reference with regulated LPL with no stabilizing agent. The graph shows that compound 7 show a lower but similar stabilizing effect as the reference compound.
0,000
0,020
0,040
0,060
0,080
0,100
0,120
0,140
0,160
0,180
0,200
Ab
sorb
ance
Comp. concentration µM
Comp. 8
Ref. Comp
14
Figure 12: Graph showing the percentage of LPL activity in the presence of ANGPTL4 with compound 8 (blue) and the reference compound (red) as stabilizing agents compared to unregulated LPL. The graph shows that the reference compound causes an overall higher activity compared to compound 8.
As the results of the assay show that compound 7 have a similar activity as the reference compound and since the photolysis experiments showed that the compound successfully decomposed by irradiation. Because of this, the compound could now be used in the in vitro photolysis experiment along with LPL in order to investigate the mode of action of the compound.
0%
20%
40%
60%
80%
100%
120%
75 50 33,3 22,2 14,8 9,9 6,6 4,4 2,9 1,95 1,3 0,88
Act
ivit
y (%
)
Comp. Concentration (µM)
Comp. 8
Ref. Comp.
15
4. Experimental
4.1 General methods used during laboratory work DMF and DCM were dried by using Glass Contour System By: SG Water, USA LLC. When necessary, other organic solvents were dried using molecular sieves 3Å and degassed by bubbling with N2 gas. Column chromatography was performed on 60 Å (0.063-0.200 mm), 70-230 mesh ASTM silica gel, from Merck KGaA. Automated column chromatography was performed using Biotage Initiator on Biotage HP-Sphere 25 μm column. Thin layer chromatography (TLC) was performed using silica gel 60 F354 on aluminium sheet, from from Merck KGaA. Detection for TLC was performed by UV-light and/or staining and heat using vanillin, ninhydrin or bromocresol green. LCMS was conducted with Waters LC system on an Xterra C18 column (50 × 19 mm, 5 µm, 125 Å), using a linear gradient of CH3CN in water, both of which contained formic acid (0.2 %). The flow rate was set at 1.5mL/min as detection carried out at 214 nm. The mass spectra were obtained on Water micromass ZQ 2000 using both negative and positive electrospray ionization. Bruker-DRX 400MHz spectrometer was used to record 1H NMR at 298K. Bruker Avance III HD 600 MHz spectrometer was used to record 1H NMR and 13C NMR spectra at 298K and 333K. NMR residual solvent peaks CDCl3 (δH = 7.26ppm) and DMSO-d6 (δH = 2.50 ppm, δC = 39.51 ppm). Cure Zone Hg 400 watt solid state power supply lamp was used during the irradiation experiments. Varian 50 Bio UV-Visible spectrophotometer was used to measure absorbance spectra. In the biological experiments, the spectrophotometer used to obtain absorbance spectra in the activity assay was SpectraMax 340 plate reader by Molecular Devices. PBS-TX buffer used contained 50 mM potassium phosphate, 0.15 M NaCl and 0.01% (v:v) Triton TX-100 in MQ solution with a pH of 7.4. LPL was obtained at Umeå University at the department of biosciences from bovine milk. ANGPTL4 was obtained at Umeå University at the department of biosciences through E-coli expression. 4.2 Experimental procedure 4.2.1 Procedure 1: Nucleophilic aromatic substitution with piperidine on 2-chloro-5-benzoic acid. 2-chloro-5-benzoic acid (1) (500 mg, 2.48 mmol) was dissolved in 5 mL of piperidine while stirring. The solution was then heated to reflux for 20h under nitrogen atmosphere. The solution was then allowed to cool to room temperature. The solution was diluted with HCl (1M) solution and extracted with DCM five times. The aqueous solution was concentrated and extracted with Ethyl acetate three times. The organic phases were washed with brine and then combined and dried using MgSO4. The organic phase was evaporated and purified using a flash column chromatography with DCM:methanol (100:3). The product was combined, evaporated and further purified using automated column chromatography with a ethyl acetate:heptane gradient starting at 65% Ethyl acetate to 100% Ethyl acetate, to produce product 4 at 53% yield. 1H NMR (400 MHz, CDCl3): 9.13 (d, J=2.8 Hz, 1H), 8.43 (dd, J=8.8 Hz, 2.8 Hz, 1H), 7.59 (d, J=8.8 Hz, 1H), 3.05 (dd, J=6.0 Hz, 5.0 Hz, 4H), 1.91 (m, J=5.7 Hz, 4H), 1.73 (m, 2H). 13C NMR (600 MHz, CDCl3): 164.9, 156.6, 146.4, 128.3, 127.8, 126.8, 123.6, 55.1, 25.9, 22.9. LC-MS m/z calculated for C12H14N2O4 251.30; found: 251.04. 4.2.2 Procedure 2: Nitro reduction of compound 4 using sodium borohydride. Compound 4 (18 mg, 0.072 mmol) was dissolved in 8mL of ethanol and 10% palladium on charcoal (7.65 mg, 0.072 mmol). The solution was cooled to 0˚C by an ice bath. Sodium borohydride (5.44 mg, 0.14 mmol) was then added portion wise to the solution while stirring. The solution was allowed to reach room temperature and left overnight under nitrogen atmosphere. The reaction was monitored using LC-MS and TLC. The reaction did not occur as there was no conversion.
16
4.2.3 Procedure 3: Esterification of 2-chloro-5-benzoic acid. 2-Chloro-5-nitrobenzoic acid (1) (500 mg, 2.48 mmol) was dissolved in 7 mL of methanol cooled to 0˚C by an ice bath. Thionyl chloride (0.5 mL, 6.89 mmol) was then added dropwise while stirring. The solution was then heated to reflux for 3 hours under nitrogen atmosphere. After 3 hours, additional thionyl chloride (0.4 mL, 5.51 mmol) was added and left to react overnight. The solution was then diluted in DCM and washed with water three times and once with brine. This yielded product 2 at a 92% yield. 1H NMR (400 MHz, CDCl3): 8.72 (d, J=2.8 Hz, 1H), 8.28 (dd, J=8.8 Hz, 2.8 Hz, 1H), 7.66 (d, J=8.8 Hz, 1H), 4.00 (s, 3H). LC-MS m/z calculated for C8H6ClNO4 216.60; found: 216.42. 4.2.4 Procedure 4: Nucleophilic aromatic substitution with piperidine on compound 2. Compound 2 (509 mg, 2.36 mmol) was dissolved in 10 mL of methanol along with TEA (1 mL, 7.09 mmol) and piperidine (0.7 mL, 7.08 mmol) and was heated to reflux overnight under nitrogen atmosphere. The solution was then allowed to cool to room temperature and was diluted in DCM, washed with 1 M NaOH aqueous solution three times. The combined organic phases were washed once more with a small volume of basic solution. The aqueous solution was acidified with HCl (1M) and extracted with DCM three times, the organic phase was then washed once more with a small amount of HCl (1M) and once with brine. The organic phase was then dried over MgSO4, filtered and evaporated using a rotravap. This yielded product 3 at 95% yield. 1H NMR (400 MHz, CDCl3): 8.60 (d, J=2.8 Hz, 1H), 8.20 (dd, J=9.5 Hz, 2.9 Hz, 1H), 6.98 (d, J=9.3 Hz, 1H), 3.95 (s, 3H), 3.27 (dd, J=5.9 Hz, 4.8 Hz, 4H) 1.75 (m, 4H), 1.70 (m, 2H). 13C NMR (600 MHz, CDCl3): 167.1, 156.3, 138.3, 128.9, 127.8, 119.6, 117.2, 52.7, 52.5, 25.7, 23.9. LC-MS m/z calculated for C13H16N2O4 265.30; found: 265.06. 4.2.5 Procedure 5: Nitro reduction of compound 3 using ammonium formate. Compound 3 (50 mg, 0.19 mmol) was dissolved in 10 mL of methanol along with 10% palladium on charcoal (5 mg, 0.047 mmol) and ammonium formate (122 mg, 1.93 mmol) while stirring. The solution was then heated to reflux for 5 hours under nitrogen atmosphere. Additional 10% palladium on charcoal (4 mg, 0.038 mmol) was then added to the solution. The solution was then allowed to reflux overnight. The solution was monitored using LC-MS and TLC. The reaction had low conversion and the starting material was isolated. No product was collected from this reaction. 4.2.6 Procedure 6: Nitro reduction of compound 3 using Tin(II) chloride. Compound 3 (50 mg, 0.19 mmol) and Tin(II) chloride (213 mg, 0.95 mmol) was dissolved in 10 mL of methanol. The solution was then heated to reflux overnight under nitrogen atmosphere. The reaction was monitored with TLC and LC-MS. The reaction was monitored using TLC and LC-MS. The reaction showed very low conversion and the starting material was isolated. No product was collected from this reaction. 4.2.7 Procedure 7: Nitro reduction of compound 3 using 1,4-Cyclohexadiene in microwave. Compound 3 (50 mg, 0.19 mmol) was placed in a microwave vial and dissolved in 2 mL of methanol along with 10% palladium on charcoal (10 mg, 0.095 mmol) and 1,4-cyclohexadiene (0.1 mL, 1.06 mmol). The solution was then heated under microwave irradiation to 120°C for 5 min. The solution was analyzed using TLC and LC-MS. The reaction showed very low conversion and showed side products with the mass 271.7 and 315.12 and no starting material remaining. No product was collected from this reaction. 4.2.8 Procedure 8: Nitro reduction of compound 3 using hydrogen atmosphere.

17
Compound 3 (50 mg, 0.19 mmol) was dissolved in 10 mL of methanol along with 10% palladium on charcoal (5 mg, 0.047 mmol). The reaction vessel was then flushed with nitrogen. The nitrogen atmosphere was then evacuated using vacuum and the reaction vessel was then put under hydrogen atmosphere and allowed to react at room temperature overnight. The solution was analyzed using TLC and LC-MS. The reaction showed low conversion and a side product with a mass of 277.02. The starting material was isolated and no product was collected from this reaction. 4.2.9 Procedure 9: Ester hydrolysis of compound 3. Compound 3 (586 mg, 2.22 mmol) was dissolved in 8 mL of methanol and 2 mL of H2O along with potassium hydroxide (244 mg, 4.43 mmol). The solution was heated to reflux for 3 hours. The solution was then neutralized using HCl and the solvent was evaporated. The product was extracted by successive trituration with DCM and ethyl acetate and the impurities was filtered off. The product was dried under vacuum. This yielded product 4 in 98% yield. 1H NMR (400 MHz, CDCl3): 9.13 (d, J=2.8 Hz, 1H), 8.43 (dd, J=8.8 Hz, 2.8 Hz, 1H), 7.59 (d, J=8.8 Hz, 1H), 3.05 (dd, J=6.0 Hz, 5.0 Hz, 4H), 1.91 (m, J=5.7 Hz, 4H), 1.73 (m, 2H). 13C NMR (600 MHz, CDCl3): 164.9, 156.6, 146.4, 128.3, 127.8, 126.8, 123.6, 55.1, 25.9, 22.9. LC-MS m/z calculated for C12H14N2O4 251.30; found: 251.04. 4.2.10 Procedure 10: Nitro reduction of compound 4 using hydrogen atmosphere. Compound 4 (300 mg, 1.20 mmol) and 10% palladium on charcoal (64 mg, 0.060 mmol) was dissolved in 10 mL of DMF. The reaction vessel was then flushed with nitrogen. The nitrogen atmosphere was evacuated using vacuum and the reaction vessel was then put under hydrogen atmosphere and allowed to react at room temperature overnight. The solution was then filtered through Celite and washed with methanol. The solvent was removed using vacuum distillation. The solid obtained was purified by filtering through silica using DCM:Methanol (95:5). This yielded product 5 at a 82% yield. 1H NMR (DMSO-d6): 7.35 (d, J=8.6 Hz, 1H), 7.23 (d, J=2.8 Hz, 1H), 6.76 (dd, J=8.6 Hz, 2.8 Hz, 1H), 2.96 (dd, J=5.1 Hz, 5.1 Hz, 4H), 1.72 (m, 4H), 1.59 (m, 2H). 13C NMR (600 MHz, DMSO-d6): 167.9, 148.6, 138.7, 125.9, 123.6, 118.4, 114.8, 54.4, 26.1, 22.5. LC-MS m/z calculated for C12H16N2O2 221.30; found: 221.17. 4.2.11 Procedure 11: coupling compound 5 to Methyl 3-bromo-4-formylbenzoate by Indazole formation. Compound 5 (200 mg, 0.91 mmol) and Methyl 3-bromo-4-formylbenzoate (231 mg, 0.95 mmol) was dissolved in 15 mL of methanol and heated to reflux for 3 hours under nitrogen atmosphere. The solution was then cooled to 0˚C by an ice bath and the imine precipitate was filtered and washed with cold methanol and then dried under vacuum. The imine and cesium carbonate (296 mg, 0.91 mmol) were dissolved in 15 mL dry degassed DMSO. The solution was then heated to 100°C and 5 mL of a solution containing Copper (I) Iodide (34.6 mg, 0.18 mmol) and TMEDA (0.027 mL, 0.18 mmol). Sodium azide (118 mg, 1.82 mmol) was then added portion wise and the solution was heated to 120°C overnight under nitrogen atmosphere. The solution was purified using HPLC with a water and acetonitrile gradient starting at 40% acetonitrile to 90% with 0.005% formic acid over 40 minutes. The solvent was then removed by freeze-drying. This yielded product 6 at 17% yield. 1H NMR (400 MHz, DMSO-d6): 9.33 (s, 1H), 8.63 (d, J=2.8 Hz, 1H), 8.42 (s, 1H), 8.35 (dd, J=8.9 Hz, 3.0 Hz, 1H), 7.89 (dd, J=10 Hz, 9.9 Hz, 2H), 7.64 (dd, J=8.8 Hz, 1.3 Hz, 1H), 3.91 (s, 3H), 3.16 (m, J=5.9 Hz, 4H), 1.77 (m, 4H), 1.65 (m, 2H). LC-MS m/z calculated for C21H21N3O4 380.40; found: 379.99. 4.2.12 Procedure 12: Amide coupling on compound 6 with 4-azidoaniline using oxalyl chloride. Compound 6 (20 mg, 0.053 mmol) was dissolved in 10 mL of DCM and a catalytic amount of DMF. The solution was cooled to 0˚C by an ice bath and oxalyl chloride (0.03 mL, 0.34 mmol) was added dropwise while stirring under nitrogen atmosphere.
18
The solution was then allowed to reach room temperature and left to react for 2 hours. The reaction mixture was then concentrated using a rotravapor, redissolved in DCM and concentrated using a rotravap resulting in a solid. The solid was then dissolved in 3 mL DCM along with 4-azidoaniline (7.8 mg, 0.058 mmol) and TEA (26.7 mg, 0.26 mmol). The solution was the allowed to stir at room temperature under nitrogen atmosphere for 5 hours. The solution was monitored using LC-MS and TLC. The reaction showed no conversion and a side product with the mass 406.22. The reaction showed no remaining starting material. 4.2.13 Procedure 13: Amide coupling on compound 6 with 4-azidoaniline using TBTU. Compound 6 (5 mg, 0.013 mmol) and TBTU (4.66 mg, 0.0145 mmol) was dissolved in 2 mL of DMF. 4-azidoanniline (2.25 mg, 0.013 mmol) and TEA (0.004 mL, 0.029 mmol) were added to the solution. The solution was then stirred at room temperature under nitrogen atmosphere overnight. The solvent was removed using high vacuum and a cold-trap and the solid obtained was purified using automated column chromatography with a Ethyl acetate:heptane gradient starting at 30% Ethyl acetate to 100% Ethyl acetate, to produce product 7 in 32% yield. LC-MS m/z calculated for C27H25N7O3 496.50; found: 496.22. 4.2.14 Procedure 14: Amide coupling on compound 6 with 4-azidoaniline using T3P. Compound 6 (39 mg, 0.103 mmol) and 4-azidoaniline (15.2 mg, 0.113 mmol) were dissolved in 5 mL of dry ethyl acetate (Ethyl acetate dried and degassed using molecular sieves and nitrogen gas) and 2.5 mL of pyridine (pyridine dried using KOH and distillation). The solution was cooled to 0˚C by an ice bath and a 1-propylphosphonic acid cyclic anhydride (0.07 mL, 0.117 mmol) 50% ethyl acetate solution was added. The solution was left in ice-bath overnight allowed to reach room temperature slowly under nitrogen atmosphere. Additional 4-azidoaniline (15.2 mg, 0.113 mmol) and 1-propylphosphonic acid cyclic anhydride (0.07 mL, 0.117 mmol) 50% ethyl acetate solution was added. The solution was then concentrated using rotavapor and purified using automated column chromatography with a ethyl acetate:n-heptane gradient starting at 30% ethyl acetate to 100% ethyl acetate, to produce product 7 in 88% yield. 1H NMR (DMSO-d6): 11.43 (s, 1H), 9.28 (s, 1H), 8.45 (d, J=2.9 Hz, 1H), 8.4 (s, 1H), 8.22 (dd, J=8.8 Hz, 2.8 Hz, 1H), 7.9 (d, J=8.8 Hz, 1H), 7.87 (d, J=8.9 Hz, 2H), 7.64 (dd, J=8.7 Hz, 1.3 Hz, 1H), 7.49 (d, J=8.8 Hz, 1H), 7.18 (d, J=8.8 Hz, 2H), 3.92 (s, 3H), 3.05 (t, J=5.0 Hz, 4H), 1.67 (m, 4H), 1.55 (m, 2H). 13C NMR (600 MHz, DMSO-d6): , 167.0, 164.8, 152.0, 148.5, 136.7, 135.1, 134.7, 130.0, 128.5, 124.9, 123.9, 122.8, 122.6, 121.6, 121.4, 121.0, 120.3, 115.5, 53.0, 52.8, 26.4, 23.8. LC-MS m/z calculated for C27H25N7O3 496.50; found: 496.22. 4.2.15 Procedure 15: Ester hydrolysis of compound 7. Compound 7 (35 mg, 0.07 mmol) was dissolved in 10 mL of ethanol and KOH (19.5 mg, 0.35 mmol) was added to the solution. The solution was then heated to reflux under nitrogen atmosphere overnight. The solution was then neutralized using HCl (1M) and diluted with water and extracted with DCM three times. The combined organic phases were dried using MgSO4 and concentrated using a rotavapor and purified using automated column chromatography with a ethyl acetate:n-heptane gradient starting at 30% ethyl acetate to 100% ethyl acetate, to produce product 8 in 62% yield. 1H NMR (600 MHz, DMSO-d6): 11.48 (s, 1H), 9.12 (s, 1H),8.46 (d, J=2.8 Hz, 1H), 8.35 (s, 1H), 8.19 (dd, J=8.8 Hz, 2.8 Hz, 1H), 7.85 (d, J=8.6 Hz, 2H), 7.79 (d, J=8.9 Hz, 1H), 7.67 (d, J=8.8 Hz, 1H), 7.49 (d, J=8.7 Hz, 1H), 7.16 (d, J=8.7 Hz, 2H), 3.05 (t, J=5.2 Hz, 4H), 1.69 (m, 4H), 1.56 (m, 2H). 13C NMR (600 MHz, DMSO-d6): 164.7, 151.8, 149.1, 136.7, 135.6, 134.9, 130.1, 124.5, 123.9, 122.8, 122.6, 122.3, 122.1, 121.6, 120.9, 120.2, 54.1, 26.4, 23.8. LC-MS m/z calculated for C26H23N7O3 482.5; found: 481.96.
19
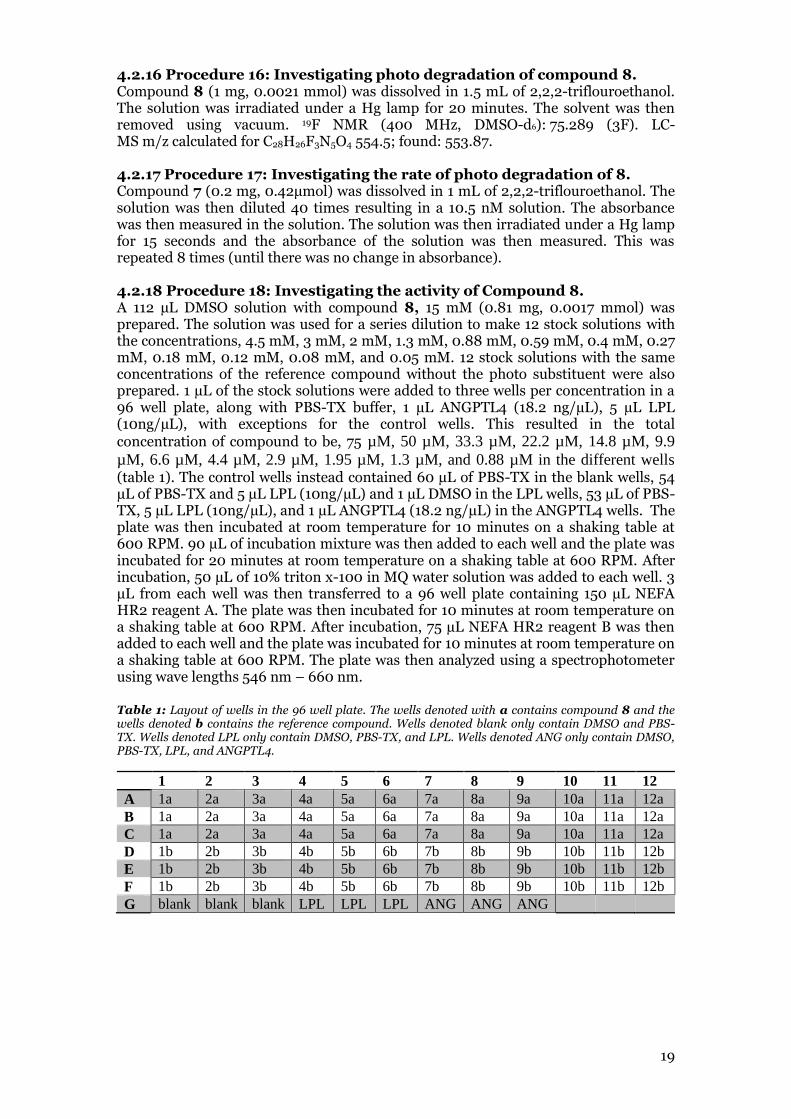
4.2.16 Procedure 16: Investigating photo degradation of compound 8. Compound 8 (1 mg, 0.0021 mmol) was dissolved in 1.5 mL of 2,2,2-triflouroethanol. The solution was irradiated under a Hg lamp for 20 minutes. The solvent was then removed using vacuum. 19F NMR (400 MHz, DMSO-d6): 75.289 (3F). LC-MS m/z calculated for C28H26F3N5O4 554.5; found: 553.87. 4.2.17 Procedure 17: Investigating the rate of photo degradation of 8. Compound 7 (0.2 mg, 0.42μmol) was dissolved in 1 mL of 2,2,2-triflouroethanol. The solution was then diluted 40 times resulting in a 10.5 nM solution. The absorbance was then measured in the solution. The solution was then irradiated under a Hg lamp for 15 seconds and the absorbance of the solution was then measured. This was repeated 8 times (until there was no change in absorbance). 4.2.18 Procedure 18: Investigating the activity of Compound 8. A 112 µL DMSO solution with compound 8, 15 mM (0.81 mg, 0.0017 mmol) was prepared. The solution was used for a series dilution to make 12 stock solutions with the concentrations, 4.5 mM, 3 mM, 2 mM, 1.3 mM, 0.88 mM, 0.59 mM, 0.4 mM, 0.27 mM, 0.18 mM, 0.12 mM, 0.08 mM, and 0.05 mM. 12 stock solutions with the same concentrations of the reference compound without the photo substituent were also prepared. 1 µL of the stock solutions were added to three wells per concentration in a 96 well plate, along with PBS-TX buffer, 1 µL ANGPTL4 (18.2 ng/µL), 5 µL LPL (10ng/µL), with exceptions for the control wells. This resulted in the total concentration of compound to be, 75 µM, 50 µM, 33.3 µM, 22.2 µM, 14.8 µM, 9.9
µM, 6.6 µM, 4.4 µM, 2.9 µM, 1.95 µM, 1.3 µM, and 0.88 µM in the different wells (table 1). The control wells instead contained 60 µL of PBS-TX in the blank wells, 54 µL of PBS-TX and 5 µL LPL (10ng/µL) and 1 µL DMSO in the LPL wells, 53 µL of PBS-TX, 5 µL LPL (10ng/µL), and 1 µL ANGPTL4 (18.2 ng/µL) in the ANGPTL4 wells. The plate was then incubated at room temperature for 10 minutes on a shaking table at 600 RPM. 90 µL of incubation mixture was then added to each well and the plate was incubated for 20 minutes at room temperature on a shaking table at 600 RPM. After incubation, 50 µL of 10% triton x-100 in MQ water solution was added to each well. 3 µL from each well was then transferred to a 96 well plate containing 150 µL NEFA HR2 reagent A. The plate was then incubated for 10 minutes at room temperature on a shaking table at 600 RPM. After incubation, 75 µL NEFA HR2 reagent B was then added to each well and the plate was incubated for 10 minutes at room temperature on a shaking table at 600 RPM. The plate was then analyzed using a spectrophotometer using wave lengths 546 nm – 660 nm. Table 1: Layout of wells in the 96 well plate. The wells denoted with a contains compound 8 and the wells denoted b contains the reference compound. Wells denoted blank only contain DMSO and PBS-TX. Wells denoted LPL only contain DMSO, PBS-TX, and LPL. Wells denoted ANG only contain DMSO, PBS-TX, LPL, and ANGPTL4.
1 2 3 4 5 6 7 8 9 10 11 12
A 1a 2a 3a 4a 5a 6a 7a 8a 9a 10a 11a 12a
B 1a 2a 3a 4a 5a 6a 7a 8a 9a 10a 11a 12a
C 1a 2a 3a 4a 5a 6a 7a 8a 9a 10a 11a 12a
D 1b 2b 3b 4b 5b 6b 7b 8b 9b 10b 11b 12b
E 1b 2b 3b 4b 5b 6b 7b 8b 9b 10b 11b 12b
F 1b 2b 3b 4b 5b 6b 7b 8b 9b 10b 11b 12b
G blank blank blank LPL LPL LPL ANG ANG ANG
20
5. Conclusions and Outlook
In this project, the target aryl azide compound was successfully synthesized. The synthetic route that was used in the project, proved successful even though some optimizations had to be done during the project. The yields of the different procedures in the synthetic pathway were generally good. However, a notable exception was the indazole formation. The indazole reaction should be optimized in the future. Some methods to do this could be to try the one-pot reaction without preforming the imine to investigate if the yield increases. The amount of catalyst could also be changed along with experimenting with different equivalents of the reactants. The ester hydrolysis in the last step could also be optimized as the reaction was possibly allowed to react for too long and the azide might have decayed due to the prolonged heating. The photolysis experiments displayed good results as the aryl azide properly decayed into nitrene the nitrene species. The time required to decay the majority of the aryl azide was also promising, as the relatively short time required means that the protein does not need to be subjected to irradiation for a prolonged time. The activity assay also showed good results as the activity of LPL in the presence of ANGPTL4 and the target molecule was similar to the activity of LPL in the presence of ANGPTL4 and the reference molecule. These results are promising since with these results in mind, the compound should function properly as a photoaffinity probe when it is allowed to decay while interacting with LPL. However, due to time constraints the photoaffinity experiments with LPL was never performed and in the future, this experiment should be performed in order to investigate the mode of action of the compound. Other photoaffinity substituents could also be tested in future experiments such as the diazirine to investigate if the compound would remain active and if the photolysis would be more efficient.
21
6. Appendix
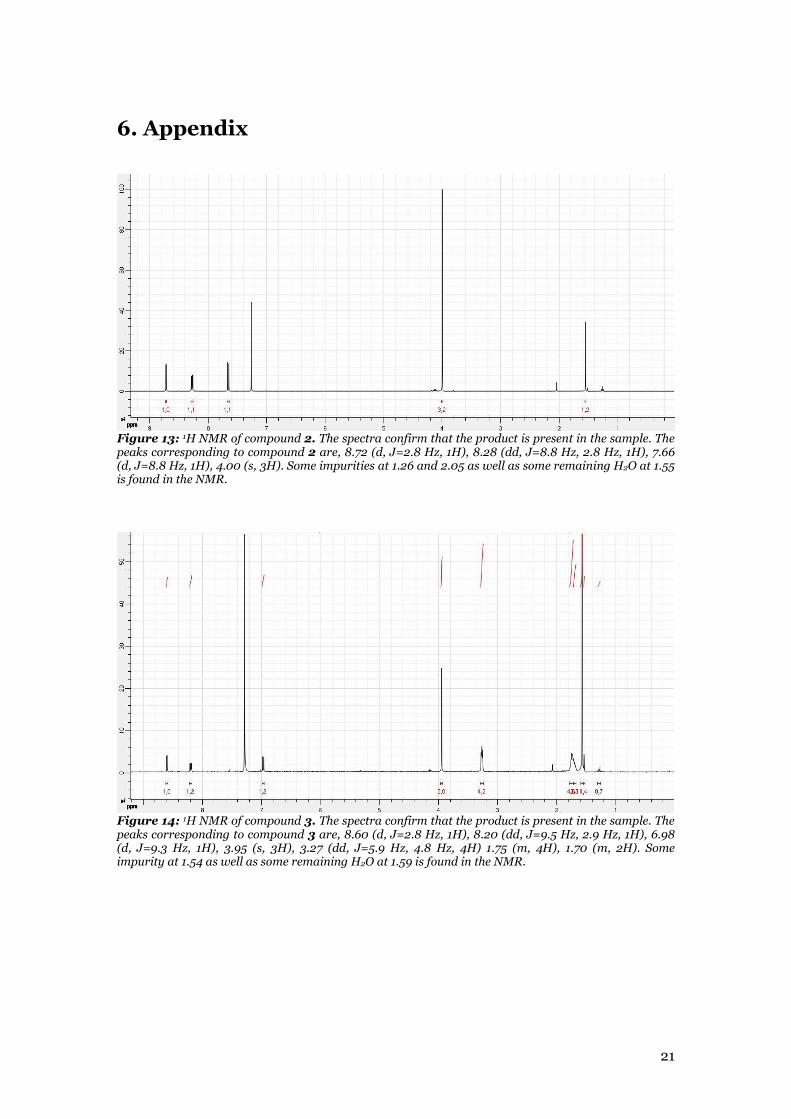
Figure 13: 1H NMR of compound 2. The spectra confirm that the product is present in the sample. The peaks corresponding to compound 2 are, 8.72 (d, J=2.8 Hz, 1H), 8.28 (dd, J=8.8 Hz, 2.8 Hz, 1H), 7.66 (d, J=8.8 Hz, 1H), 4.00 (s, 3H). Some impurities at 1.26 and 2.05 as well as some remaining H2O at 1.55 is found in the NMR.
Figure 14: 1H NMR of compound 3. The spectra confirm that the product is present in the sample. The peaks corresponding to compound 3 are, 8.60 (d, J=2.8 Hz, 1H), 8.20 (dd, J=9.5 Hz, 2.9 Hz, 1H), 6.98 (d, J=9.3 Hz, 1H), 3.95 (s, 3H), 3.27 (dd, J=5.9 Hz, 4.8 Hz, 4H) 1.75 (m, 4H), 1.70 (m, 2H). Some impurity at 1.54 as well as some remaining H2O at 1.59 is found in the NMR.
22
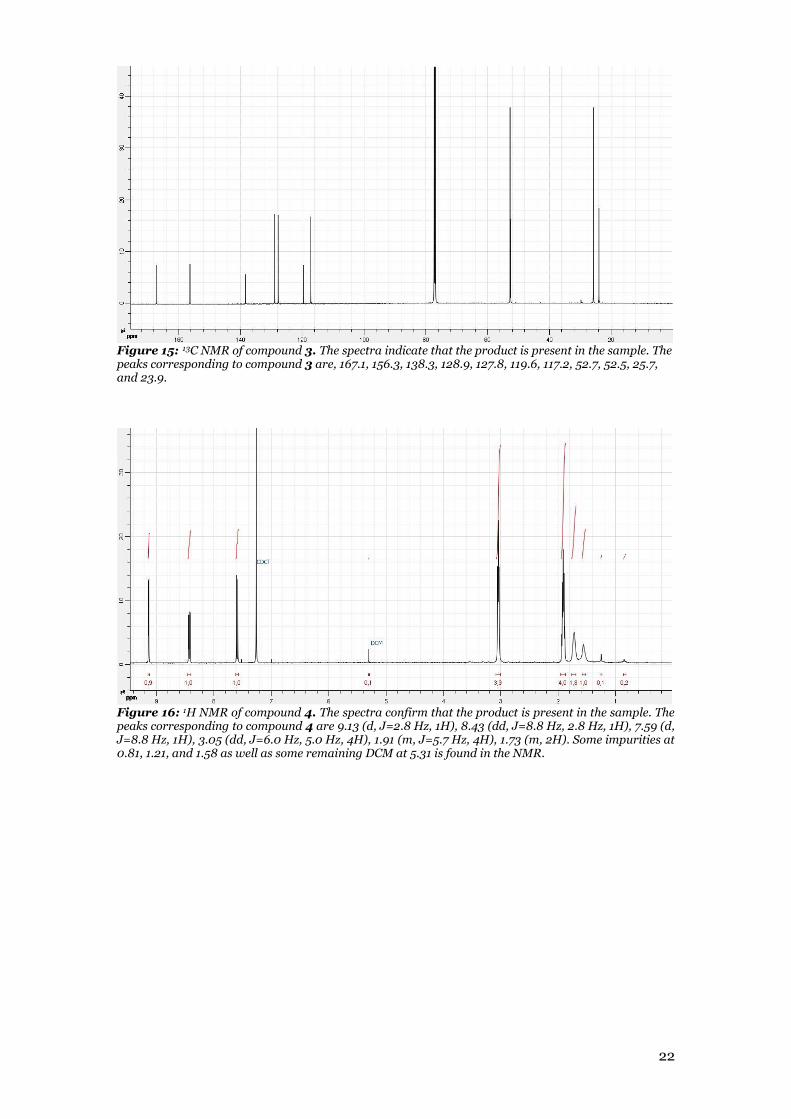
Figure 15: 13C NMR of compound 3. The spectra indicate that the product is present in the sample. The peaks corresponding to compound 3 are, 167.1, 156.3, 138.3, 128.9, 127.8, 119.6, 117.2, 52.7, 52.5, 25.7, and 23.9.
Figure 16: 1H NMR of compound 4. The spectra confirm that the product is present in the sample. The peaks corresponding to compound 4 are 9.13 (d, J=2.8 Hz, 1H), 8.43 (dd, J=8.8 Hz, 2.8 Hz, 1H), 7.59 (d, J=8.8 Hz, 1H), 3.05 (dd, J=6.0 Hz, 5.0 Hz, 4H), 1.91 (m, J=5.7 Hz, 4H), 1.73 (m, 2H). Some impurities at 0.81, 1.21, and 1.58 as well as some remaining DCM at 5.31 is found in the NMR.

23
Figure 17: 13C NMR of compound 4. The spectra indicate that the product is present in the sample. The peaks corresponding to compound 4 are, 164.9, 156.6, 146.4, 128.3, 127.8, 126.8, 123.6, 55.1, 25.9, and 22.9.
Figure 18: 1H NMR of compound 5. The spectra confirm that the product is present in the sample. The peaks corresponding to compound 5 are, 7.35 (d, J=8.6 Hz, 1H), 7.23 (d, J=2.8 Hz, 1H), 6.76 (dd, J=8.6 Hz, 2.8 Hz, 1H), 2.96 (dd, J=5.1 Hz, 5.1 Hz, 4H), 1.72 (m, 4H), 1.59 (m, 2H). Some impurities at 1.23, and around 2.75 as well as some remaining H2O at 3.32 and DCM at 5.41 is found in the NMR.

24
Figure 19: 13C NMR of compound 5. The spectra indicate that the product is present in the sample. The peaks corresponding to compound 5 are, 167.9, 148.6, 138.7, 125.9, 123.6, 118.4, 114.8, 54.4, 26.1, and 22.5.
Figure 20: 1H NMR of compound 6. The spectra confirm that the product is present in the sample. The peaks corresponding to compound 6 are, 9.33 (s, 1H), 8.63 (d, J=2.8 Hz, 1H), 8.42 (s, 1H), 8.35 (dd, J=8.9 Hz, 3.0 Hz, 1H), 7.89 (dd, J=10 Hz, 9.9 Hz, 2H), 7.64 (dd, J=8.8 Hz, 1.3 Hz, 1H), 3.91 (s, 3H), 3.16 (m, J=5.9 Hz, 4H), 1.77 (m, 4H), 1.65 (m, 2H). Some impurity at 4.10 as well as some H2O at 3.32 and either acetone or acetonitrile at 2.09 is found in the NMR.
25
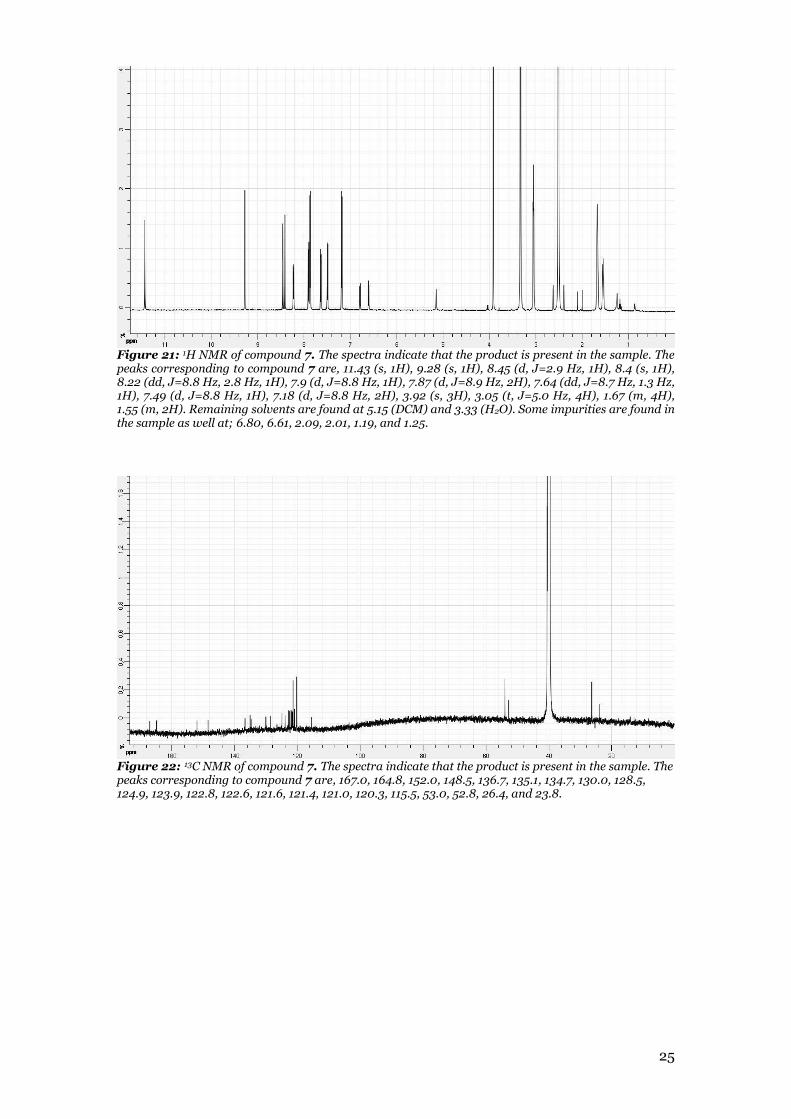
Figure 21: 1H NMR of compound 7. The spectra indicate that the product is present in the sample. The peaks corresponding to compound 7 are, 11.43 (s, 1H), 9.28 (s, 1H), 8.45 (d, J=2.9 Hz, 1H), 8.4 (s, 1H), 8.22 (dd, J=8.8 Hz, 2.8 Hz, 1H), 7.9 (d, J=8.8 Hz, 1H), 7.87 (d, J=8.9 Hz, 2H), 7.64 (dd, J=8.7 Hz, 1.3 Hz, 1H), 7.49 (d, J=8.8 Hz, 1H), 7.18 (d, J=8.8 Hz, 2H), 3.92 (s, 3H), 3.05 (t, J=5.0 Hz, 4H), 1.67 (m, 4H), 1.55 (m, 2H). Remaining solvents are found at 5.15 (DCM) and 3.33 (H2O). Some impurities are found in the sample as well at; 6.80, 6.61, 2.09, 2.01, 1.19, and 1.25.
Figure 22: 13C NMR of compound 7. The spectra indicate that the product is present in the sample. The peaks corresponding to compound 7 are, 167.0, 164.8, 152.0, 148.5, 136.7, 135.1, 134.7, 130.0, 128.5, 124.9, 123.9, 122.8, 122.6, 121.6, 121.4, 121.0, 120.3, 115.5, 53.0, 52.8, 26.4, and 23.8.
26
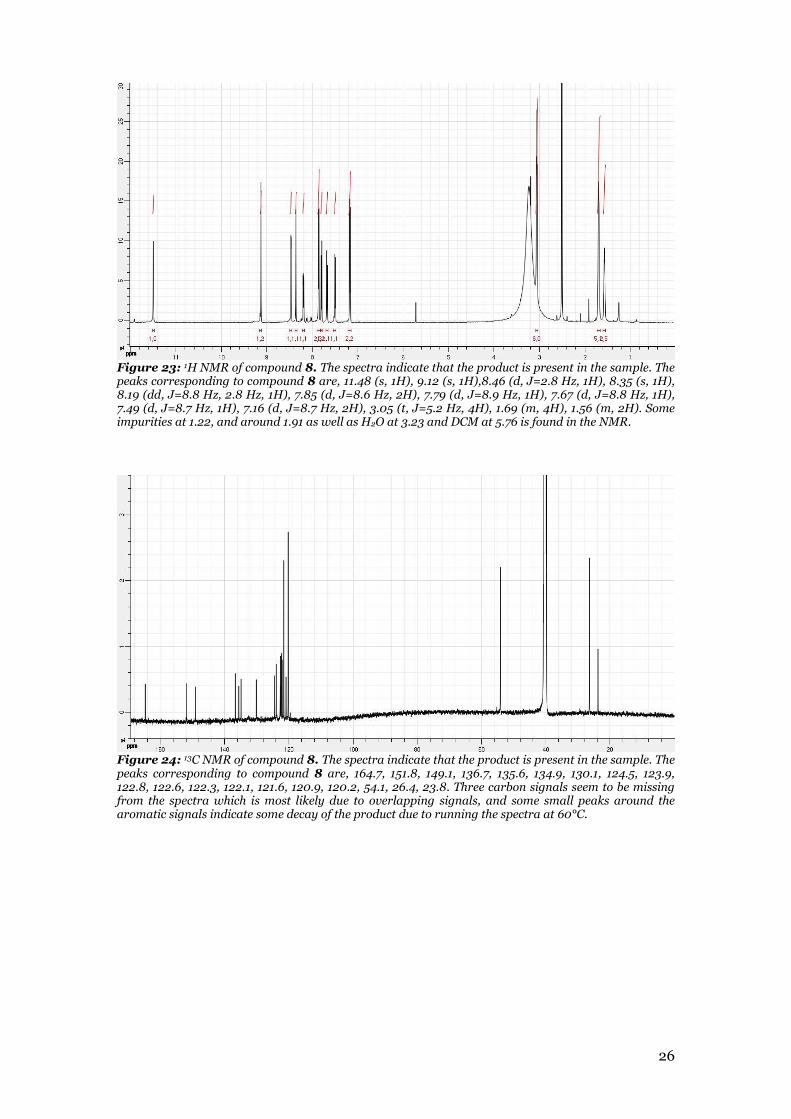
Figure 23: 1H NMR of compound 8. The spectra indicate that the product is present in the sample. The peaks corresponding to compound 8 are, 11.48 (s, 1H), 9.12 (s, 1H),8.46 (d, J=2.8 Hz, 1H), 8.35 (s, 1H), 8.19 (dd, J=8.8 Hz, 2.8 Hz, 1H), 7.85 (d, J=8.6 Hz, 2H), 7.79 (d, J=8.9 Hz, 1H), 7.67 (d, J=8.8 Hz, 1H), 7.49 (d, J=8.7 Hz, 1H), 7.16 (d, J=8.7 Hz, 2H), 3.05 (t, J=5.2 Hz, 4H), 1.69 (m, 4H), 1.56 (m, 2H). Some impurities at 1.22, and around 1.91 as well as H2O at 3.23 and DCM at 5.76 is found in the NMR.
Figure 24: 13C NMR of compound 8. The spectra indicate that the product is present in the sample. The peaks corresponding to compound 8 are, 164.7, 151.8, 149.1, 136.7, 135.6, 134.9, 130.1, 124.5, 123.9, 122.8, 122.6, 122.3, 122.1, 121.6, 120.9, 120.2, 54.1, 26.4, 23.8. Three carbon signals seem to be missing from the spectra which is most likely due to overlapping signals, and some small peaks around the aromatic signals indicate some decay of the product due to running the spectra at 60°C.

27
7. References
1R. N. Pejic, D. T. Lee. Hypertriglyceridemia, JABFM, 2006, 19(3), 310-316. 2 R. A. Cox and M. R. García-Palmieri, Clinical Methods: The History, Physical, and
Laboratory Examinations. 3rd edition. Butterworths; 1990. 3 R. Caraballo, M. Larsson, S. K. Nilsson, M. Ericsson, W. Qian, N. P. N. Tran, T.
Kindahl, R. Svensson, V. Saar, P. Artursson, G. Olivecrona, P.A. Enquist, M. Elofsson. Structure-activity relationships for lipoprotein lipase agonists that lower plasma triglycerides in vivo. Eur J Med Chem, 2015, 103, 191-209.
4 Seifert, Tina. 2014. Identification of the binding site of the chroman-4-one based SIRT2 inhibitors. PhD Thesis, University of Gothenburg.
5 M. Miller, N. J. Stone, C. Ballantyne, V. Bittner, M. H. Criqui, H. N. Ginsberg, A. C. Goldberg, W. J. Howard, M. S. Jacobson, P. M. Kris-Etherton, T. A. Lennie, M. Levi, T. Mazzone, S. Pennathur. Triglycerides and Cardiovascular Disease, Circulation, 2011, 123, 2292-2333.
6 H. Wang and R. H. Eckel, Lipoprotein lipase: from gene to obesity, Am J Physiol Endoc M, 2009, 297, 271–288.
7 G. Yuan, K. Z. Al-Shali, and R. A. Hegele, Hypertriglyceridemia: its etiology, effects and treatment, Can Med Assoc J, 2007, 176(8), 1113–1120.
8 S. Santamarina-Fojo and H. B. Brewer Jr, Lipoprotein lipase: structure, function and mechanism of action, Int J Clin Lab Res, 1994, 24, 143-147.
9 J. R. Mead, S. A. Irvine, D. P. Ramji, Lipoprotein lipase: structure, function, regulation, and role in disease, J mol Med-JMM, 2002, 80, 753–769.
10 M. R. Kumar, A. Park, N. Park, and S. Lee, Consecutive Condensation, C-N and N-N Bond Formations: A Copper- Catalyzed One-Pot Three-Component Synthesis of 2H-Indazole, Org Lett, 2011, 13(13), 3542–3545.
11 E. Smith, I. Collins, Photoaffinity labeling in target- and binding-site identification, Future Med Chem, 2015, 7(2), 159–183.
12 J. Sumranjit and S. J. Chung, Recent Advances in Target Characterization and Identification by Photoaffinity Probes, Molecules, 2013, 18, 10425-10451.
13 C. J. Shields, D. R. Chrisope, G. B. Schuster, A. J. Dixon, M. Poliakoff, and J. J. Turner, Photochemistry of Aryl Azides: Detection and Characterization of a Dehydroazepine by Time-Resolved Infrared Spectroscopy and Flash Photolysis at Room Temperature, J Am Chem SOC, 1987, 109, 4723-4726.
14 Y. Li, J. P. Kirby, M. W. George, M. Poliakoff, and G. B. Schuster, 1,2-Didehydroazepines from the Photolysis of Substituted Aryl Azides: Analysis of Their Chemical and Physical Properties by Time-Resolved Spectroscopic Methods, J Am Chem SOC, 1988, 110, 8092-8098.
15 Christophe, M.; Karine, T. Composes Derives de N-(Phenethyl)Benzamide Substitutes, Preparation et Utilisations. FR 2898894 A1, March 24, 2006.
16 B. D. Hosangadi and R. H. Dave, An Efficient General Method for Esterification of Aromatic Carboxylic Acid, Tetrahedron Lett, 1996, 37(35), 6375-6378.
17 L. E. Burgess, The Preparation of immunosuppressant SR-31747, Synthetic Commun, 1997, 27(12), 2181-2191.
18 J. F. Quinn, C. E. Bryant, K. C. Golden, B. T. Gregg, Rapid reduction of heteroaromatic nitro groups using catalytic transfer hydrogenation with microwave heating, Tetrahedron Lett, 2010, 51, 786–789.
19 J. Clayden, N. Greeves, and S. Warren, Organic chemistry, 2nd ed; Oxford: New York, 2001.
20 J. K. Augustine, V. Vairaperumal, S. Narasimhan, P. Alagarsamy, A. Radhakrishnan, Propylphosphonic anhydride (T3P): an efficient reagent for the one-pot synthesis of 1,2,4-oxadiazoles, 1,3,4-oxadiazoles, and 1,3,4-thiadiazoles, Tetrahedron, 2009, 65, 9989–9996.
21 M.O. Sydnes, I. Doi, A. Ohishi, M. Kuse, and M. Isobe, Determination of Solvent-Trapped Products Obtained by Photolysis of Aryl Azides in 2,2,2-Trifluoroethanol, Chem Asian J, 2008, 3, 102 – 112.