Design Solutions Guide - BASF Corporation - The Chemical
86
Design Solutions Guide
Transcript of Design Solutions Guide - BASF Corporation - The Chemical
Design SolutionsGuide

Topic Part/Page
Welcome! . . . . . . . . . . . . . . . . . . . . . . . . . . . . . . . . . . . . . . . . . . . . . . . . . IOverview. . . . . . . . . . . . . . . . . . . . . . . . . . . . . . . . . . . . . . . . . . . . . . . . . . . I–2BASF Product Line . . . . . . . . . . . . . . . . . . . . . . . . . . . . . . . . . . . . . . . . . . I–2Recycling . . . . . . . . . . . . . . . . . . . . . . . . . . . . . . . . . . . . . . . . . . . . . . . . . . I–3Design Assistance . . . . . . . . . . . . . . . . . . . . . . . . . . . . . . . . . . . . . . . . . . . I–3CAD/CAE Capabilities. . . . . . . . . . . . . . . . . . . . . . . . . . . . . . . . . . . . . . . . I–3Safety . . . . . . . . . . . . . . . . . . . . . . . . . . . . . . . . . . . . . . . . . . . . . . . . . . . . . I–3
Design Considerations for Injection Molded Parts. . . . . . . . . . . . IIParting Lines . . . . . . . . . . . . . . . . . . . . . . . . . . . . . . . . . . . . . . . . . . . . . . . II–2Draft Angles . . . . . . . . . . . . . . . . . . . . . . . . . . . . . . . . . . . . . . . . . . . . . . . . II–3Wall Thickness . . . . . . . . . . . . . . . . . . . . . . . . . . . . . . . . . . . . . . . . . . . . . . II–3Fillets and Radii . . . . . . . . . . . . . . . . . . . . . . . . . . . . . . . . . . . . . . . . . . . . . II–3Bosses . . . . . . . . . . . . . . . . . . . . . . . . . . . . . . . . . . . . . . . . . . . . . . . . . . . . II–4Ribs. . . . . . . . . . . . . . . . . . . . . . . . . . . . . . . . . . . . . . . . . . . . . . . . . . . . . . . II–4Openings . . . . . . . . . . . . . . . . . . . . . . . . . . . . . . . . . . . . . . . . . . . . . . . . . . II–5Shrinkage . . . . . . . . . . . . . . . . . . . . . . . . . . . . . . . . . . . . . . . . . . . . . . . . . . II–5Gating . . . . . . . . . . . . . . . . . . . . . . . . . . . . . . . . . . . . . . . . . . . . . . . . . . . . . II–5Vents. . . . . . . . . . . . . . . . . . . . . . . . . . . . . . . . . . . . . . . . . . . . . . . . . . . . . . II–6Potential Knit Lines . . . . . . . . . . . . . . . . . . . . . . . . . . . . . . . . . . . . . . . . . . II–6
Structural Design . . . . . . . . . . . . . . . . . . . . . . . . . . . . . . . . . . . . . . . . . . IIIStress . . . . . . . . . . . . . . . . . . . . . . . . . . . . . . . . . . . . . . . . . . . . . . . . . . . . . III–2Stress-Strain . . . . . . . . . . . . . . . . . . . . . . . . . . . . . . . . . . . . . . . . . . . . . . . III–2Normal Stress . . . . . . . . . . . . . . . . . . . . . . . . . . . . . . . . . . . . . . . . . . . . . . III–3Shear Stress. . . . . . . . . . . . . . . . . . . . . . . . . . . . . . . . . . . . . . . . . . . . . . . . III–3Torsional Stress . . . . . . . . . . . . . . . . . . . . . . . . . . . . . . . . . . . . . . . . . . . . . III–4Bending Stress . . . . . . . . . . . . . . . . . . . . . . . . . . . . . . . . . . . . . . . . . . . . . III–5Section Properties of Various Cross-Sections . . . . . . . . . . . . . . . . . . . . III–6Explanation of Variables . . . . . . . . . . . . . . . . . . . . . . . . . . . . . . . . . . . . . . III–6Beam Sections . . . . . . . . . . . . . . . . . . . . . . . . . . . . . . . . . . . . . . . . . . . . . III–6Formulas for Common Beams in Bending . . . . . . . . . . . . . . . . . . . . . . . III–7Formulas for Torsional Deformation and Stress . . . . . . . . . . . . . . . . . . . III–8I, T and L Sections. . . . . . . . . . . . . . . . . . . . . . . . . . . . . . . . . . . . . . . . . . . III–9Formulas for Flat Plates. . . . . . . . . . . . . . . . . . . . . . . . . . . . . . . . . . . . . . . III–10Flat Plate Equations. . . . . . . . . . . . . . . . . . . . . . . . . . . . . . . . . . . . . . . . . . III–10Pressure Vessels . . . . . . . . . . . . . . . . . . . . . . . . . . . . . . . . . . . . . . . . . . . . III–11Thermal Expansion and Stress. . . . . . . . . . . . . . . . . . . . . . . . . . . . . . . . . III–12Impact Stresses. . . . . . . . . . . . . . . . . . . . . . . . . . . . . . . . . . . . . . . . . . . . . III–13Stress Concentrations. . . . . . . . . . . . . . . . . . . . . . . . . . . . . . . . . . . . . . . . III–14Rib Design . . . . . . . . . . . . . . . . . . . . . . . . . . . . . . . . . . . . . . . . . . . . . . . . . III–15Design for Equivalent Stiffness . . . . . . . . . . . . . . . . . . . . . . . . . . . . . . . . . III–18
Table ofContents

Design Examples . . . . . . . . . . . . . . . . . . . . . . . . . . . . . . . . . . . . . . . . . .IVCruise Control Bracket . . . . . . . . . . . . . . . . . . . . . . . . . . . . . . . . . . . . . . .IV–2Cover Cap . . . . . . . . . . . . . . . . . . . . . . . . . . . . . . . . . . . . . . . . . . . . . . . . .IV–4
Assembly . . . . . . . . . . . . . . . . . . . . . . . . . . . . . . . . . . . . . . . . . . . . . . . . .VSnap-Fit Assembly . . . . . . . . . . . . . . . . . . . . . . . . . . . . . . . . . . . . . . . . . . V–2Snap-Fit Design . . . . . . . . . . . . . . . . . . . . . . . . . . . . . . . . . . . . . . . . . . . . . V–2Cantilever vs. Cylindrical . . . . . . . . . . . . . . . . . . . . . . . . . . . . . . . . . . . . . .V–2Tapered Cantilever . . . . . . . . . . . . . . . . . . . . . . . . . . . . . . . . . . . . . . . . . .V–2Short Cantilever Design . . . . . . . . . . . . . . . . . . . . . . . . . . . . . . . . . . . . . . .V–3New Formulas . . . . . . . . . . . . . . . . . . . . . . . . . . . . . . . . . . . . . . . . . . . . . .V–4Snap-Fit Design Example . . . . . . . . . . . . . . . . . . . . . . . . . . . . . . . . . . . . .V–4Press-Fit Assembly . . . . . . . . . . . . . . . . . . . . . . . . . . . . . . . . . . . . . . . . . .V–5Adhesive Bonding . . . . . . . . . . . . . . . . . . . . . . . . . . . . . . . . . . . . . . . . . . .V–6Bolts, Nuts, and Machine Screws . . . . . . . . . . . . . . . . . . . . . . . . . . . . . .V–8Molded-in Threads . . . . . . . . . . . . . . . . . . . . . . . . . . . . . . . . . . . . . . . . . .V–9Self-Tapping Screws . . . . . . . . . . . . . . . . . . . . . . . . . . . . . . . . . . . . . . . . .V–10Inserts . . . . . . . . . . . . . . . . . . . . . . . . . . . . . . . . . . . . . . . . . . . . . . . . . . . . .V–11Ultrasonic Welding . . . . . . . . . . . . . . . . . . . . . . . . . . . . . . . . . . . . . . . . . . .V–12Shear Joint . . . . . . . . . . . . . . . . . . . . . . . . . . . . . . . . . . . . . . . . . . . . . . . . .V–12Energy Director . . . . . . . . . . . . . . . . . . . . . . . . . . . . . . . . . . . . . . . . . . . . .V–13Vibration Welding . . . . . . . . . . . . . . . . . . . . . . . . . . . . . . . . . . . . . . . . . . . .V–14Other Assembly Techniques . . . . . . . . . . . . . . . . . . . . . . . . . . . . . . . . . .V–15Thermoplastic Staking . . . . . . . . . . . . . . . . . . . . . . . . . . . . . . . . . . . . . . .V–15Spin Welding . . . . . . . . . . . . . . . . . . . . . . . . . . . . . . . . . . . . . . . . . . . . . . .V–15Electromagnetic Welding . . . . . . . . . . . . . . . . . . . . . . . . . . . . . . . . . . . . .V–16
Plastic Materials . . . . . . . . . . . . . . . . . . . . . . . . . . . . . . . . . . . . . . . . . . .VIClassification of Plastic Materials . . . . . . . . . . . . . . . . . . . . . . . . . . . . . . .VI–2Molecular Weight Distribution . . . . . . . . . . . . . . . . . . . . . . . . . . . . . . . . . .VI–4Physical Properties . . . . . . . . . . . . . . . . . . . . . . . . . . . . . . . . . . . . . . . . . .VI–5Density . . . . . . . . . . . . . . . . . . . . . . . . . . . . . . . . . . . . . . . . . . . . . . . . . . . .VI–5Thermal Expansion . . . . . . . . . . . . . . . . . . . . . . . . . . . . . . . . . . . . . . . . . .VI–5Thermal Conductivity . . . . . . . . . . . . . . . . . . . . . . . . . . . . . . . . . . . . . . . . .VI–6
Physical Properties . . . . . . . . . . . . . . . . . . . . . . . . . . . . . . . . . . . . . . . .VIIThe Mechanical Properties of Plastics . . . . . . . . . . . . . . . . . . . . . . . . . . .VII–2Short-Term Properties . . . . . . . . . . . . . . . . . . . . . . . . . . . . . . . . . . . . . . .VII–2Notches . . . . . . . . . . . . . . . . . . . . . . . . . . . . . . . . . . . . . . . . . . . . . . . . . . .VII–2Rate of Loading . . . . . . . . . . . . . . . . . . . . . . . . . . . . . . . . . . . . . . . . . . . . .VII–2Temperature . . . . . . . . . . . . . . . . . . . . . . . . . . . . . . . . . . . . . . . . . . . . . . .VII–4Thermal Aging . . . . . . . . . . . . . . . . . . . . . . . . . . . . . . . . . . . . . . . . . . . . . .VII–4Moisture . . . . . . . . . . . . . . . . . . . . . . . . . . . . . . . . . . . . . . . . . . . . . . . . . . .VII–5Dimensional Considerations (Moisture Absorption) . . . . . . . . . . . . . . . .VII–6
Topic Part/Page

Effects of Moisture . . . . . . . . . . . . . . . . . . . . . . . . . . . . . . . . . . . . . . . . . . .VII–6Dimensional Changes . . . . . . . . . . . . . . . . . . . . . . . . . . . . . . . . . . . . . . . .VII–6Accelerated Moisture Conditioning . . . . . . . . . . . . . . . . . . . . . . . . . . . . .VII–6Process Induced Property Variations . . . . . . . . . . . . . . . . . . . . . . . . . . .VII–7Additives (Color) . . . . . . . . . . . . . . . . . . . . . . . . . . . . . . . . . . . . . . . . . . . . .VII–8Ultraviolet (UV) Light . . . . . . . . . . . . . . . . . . . . . . . . . . . . . . . . . . . . . . . . . .VII–8Chemicals . . . . . . . . . . . . . . . . . . . . . . . . . . . . . . . . . . . . . . . . . . . . . . . . .VII–8Long-Term Properties–Creep, Stress Relaxation and Service Life . . . .VII–9Coefficient of Friction . . . . . . . . . . . . . . . . . . . . . . . . . . . . . . . . . . . . . . . . .VII–11
Design Considerations for Gas Assist Molding . . . . . . . . . . . . . . .VIIIHollow Molding . . . . . . . . . . . . . . . . . . . . . . . . . . . . . . . . . . . . . . . . . . . . .VIII–2Short Shot Molding . . . . . . . . . . . . . . . . . . . . . . . . . . . . . . . . . . . . . . . . . .VIII–3Full Shot Molding . . . . . . . . . . . . . . . . . . . . . . . . . . . . . . . . . . . . . . . . . . . .VIII–3
Finishing . . . . . . . . . . . . . . . . . . . . . . . . . . . . . . . . . . . . . . . . . . . . . . . . . .IXElectroplating . . . . . . . . . . . . . . . . . . . . . . . . . . . . . . . . . . . . . . . . . . . . . . .IX–2Painting . . . . . . . . . . . . . . . . . . . . . . . . . . . . . . . . . . . . . . . . . . . . . . . . . . . .IX–2Printing/Hot Stamping . . . . . . . . . . . . . . . . . . . . . . . . . . . . . . . . . . . . . . .IX–2Machining . . . . . . . . . . . . . . . . . . . . . . . . . . . . . . . . . . . . . . . . . . . . . . . . . .IX–3Surface Treatment . . . . . . . . . . . . . . . . . . . . . . . . . . . . . . . . . . . . . . . . . . .IX -3
Appendix I: Physical Properties and Terminology . . . . . . . . . . . . .A1Anisotropy . . . . . . . . . . . . . . . . . . . . . . . . . . . . . . . . . . . . . . . . . . . . . . . . .A1–2Brittleness . . . . . . . . . . . . . . . . . . . . . . . . . . . . . . . . . . . . . . . . . . . . . . . . . .A1–2Density . . . . . . . . . . . . . . . . . . . . . . . . . . . . . . . . . . . . . . . . . . . . . . . . . . . .A1–2Ductility . . . . . . . . . . . . . . . . . . . . . . . . . . . . . . . . . . . . . . . . . . . . . . . . . . . .A1–2Elasticity . . . . . . . . . . . . . . . . . . . . . . . . . . . . . . . . . . . . . . . . . . . . . . . . . . .A1–2Friction and Wear . . . . . . . . . . . . . . . . . . . . . . . . . . . . . . . . . . . . . . . . . . . .A1–2Hardness . . . . . . . . . . . . . . . . . . . . . . . . . . . . . . . . . . . . . . . . . . . . . . . . . .A1–2Isotropy . . . . . . . . . . . . . . . . . . . . . . . . . . . . . . . . . . . . . . . . . . . . . . . . . . . .A1–2Lubricity . . . . . . . . . . . . . . . . . . . . . . . . . . . . . . . . . . . . . . . . . . . . . . . . . . .A1–2Mold Shrinkage . . . . . . . . . . . . . . . . . . . . . . . . . . . . . . . . . . . . . . . . . . . . .A1–3Notch Sensitivity . . . . . . . . . . . . . . . . . . . . . . . . . . . . . . . . . . . . . . . . . . . .A1–3Plasticity . . . . . . . . . . . . . . . . . . . . . . . . . . . . . . . . . . . . . . . . . . . . . . . . . . .A1–3Specific Gravity (Relative Density) . . . . . . . . . . . . . . . . . . . . . . . . . . . . . . .A1–3Toughness . . . . . . . . . . . . . . . . . . . . . . . . . . . . . . . . . . . . . . . . . . . . . . . . .A1–3Warpage . . . . . . . . . . . . . . . . . . . . . . . . . . . . . . . . . . . . . . . . . . . . . . . . . . .A1–3Water Absorption . . . . . . . . . . . . . . . . . . . . . . . . . . . . . . . . . . . . . . . . . . .A1–3
Appendix II: ISO and ASTM Test Methods . . . . . . . . . . . . . . . . . . .A2A2–2
Bibliography . . . . . . . . . . . . . . . . . . . . . . . . . . . . . . . . . . . . . . . . . . . . . .B1B1–2
Topic Part/Page

Welcome!
Overview . . . . . . . . . . . . . . . . . . . . . . . . . . . . . . . . . . . . . . . . . . I–2
BASF Product Line . . . . . . . . . . . . . . . . . . . . . . . . . . . . . . . . . . I–2
Recycling . . . . . . . . . . . . . . . . . . . . . . . . . . . . . . . . . . . . . . . . . . I–3
Design Assistance . . . . . . . . . . . . . . . . . . . . . . . . . . . . . . . . . . I–3
CAD/CAE Capabilities . . . . . . . . . . . . . . . . . . . . . . . . . . . . . . . I–3
Safety. . . . . . . . . . . . . . . . . . . . . . . . . . . . . . . . . . . . . . . . . . . . . I–3
Part I

As part of our customer-driven philosophy
of doing business, we have prepared this
guide to give you a general product design
overview with a focus on plastic part design.
It is our goal to provide all our customers with
the optimum level of technical and design
support during their product development
process.
OverviewProper design strategy includes:
a) a concern for safety and performance
b) appropriate material selection and preparationfor processing to achieve the ultimate functionaldesign goal
c) maximum functionality
d) minimum material usage
Our intent in developing this Design Solutions Guide is tosupply general information for the customer on a variety ofapplications as a precursor to the more narrowly focusedinformation which will appear in subsequent manuals.Manuals on specific applications will expand upon thisgeneral guide and address those precise topics. Yourdesign success is our primary concern.
RecyclingRecycling is part of an all-important global drive towardreducing contamination, landfill volume and saving naturalresources. Recycling is good business too, sincein many cases, it results in reduced product lifestylecosts. Recycled plastic materials can often be specified intoless-demanding applications.
There are some design implications which should beconsidered when using recycled products:
• One should use the same material in assemblyapplications where parts are permanently affixed toone another. Mixing material types is acceptablefor mechanically assembled units which can bedisassembled.
• Color availability is generally limited.
• Cadmium-free colors are available.
Part I: Welcome!
WELCOME!
I-2

SafetyWhen designing parts, a factor of safety should be used tomanage the risk of catastrophic, premature and short-termfailures. The factor is contingent upon numerousconditions, including type of application, temperature, lackof material homogeneity, unforeseen overloads,unknowns, etc.
Having predetermined load conditions, the introduction ofa factor will extend the service life of the productdepending on the value used. The value used for thefactor is based on the criticality of the function.Engineering handbooks cover this subject in more detail.
Nylon has some unique characteristics. For instance,in the presence of moisture, it changes its physicalproperties. Strength, stiffness, surface hardness andbrittleness will decrease while elongation, ductility, impactresistance, dimensions and creep will increase. Thesecharacteristics need to be tempered with the safety factorduring design. These are reasons for designing withinformation not found on data sheets which are readilyissued by material suppliers.
Data sheet information is point data only.
We trust you will find this and our other manuals ofgreat value. We are always available to assist whenneeded.
WELCOME!
I-3

Parting Lines. . . . . . . . . . . . . . . . . . . . . . . . . . . . . . . . . . . . . . . II–2
Draft Angles . . . . . . . . . . . . . . . . . . . . . . . . . . . . . . . . . . . . . . . II–3
Wall Thickness . . . . . . . . . . . . . . . . . . . . . . . . . . . . . . . . . . . . . II–3
Fillets and Radii. . . . . . . . . . . . . . . . . . . . . . . . . . . . . . . . . . . . . II–3
Bosses . . . . . . . . . . . . . . . . . . . . . . . . . . . . . . . . . . . . . . . . . . . II–4
Ribs . . . . . . . . . . . . . . . . . . . . . . . . . . . . . . . . . . . . . . . . . . . . . . II–4
Openings . . . . . . . . . . . . . . . . . . . . . . . . . . . . . . . . . . . . . . . . . II–5
Shrinkage . . . . . . . . . . . . . . . . . . . . . . . . . . . . . . . . . . . . . . . . . II–5
Gating . . . . . . . . . . . . . . . . . . . . . . . . . . . . . . . . . . . . . . . . . . . . II–5
Vents . . . . . . . . . . . . . . . . . . . . . . . . . . . . . . . . . . . . . . . . . . . . . II–6
Potential Knit Lines. . . . . . . . . . . . . . . . . . . . . . . . . . . . . . . . . . II–6
Design Considerations for InjectionMolded Parts
Part II

The injection molding process is the most commonprocess for producing economical and automatedthermoplastic parts. It commonly requires the use of steelmolds, injection molding machinery and auxiliaryequipment.
To injection mold a part, there are numerous designaspects which should be addressed. They are:
1. Parting Lines2. Draft Angles3. Wall Thickness4. Fillets and Radii5. Bosses6. Ribs7. Opening Formations8. Shrinkage9. Gating
10. Vents11. Potential Knit Lines
Figure II-1. Schematic of Reciprocating Screw Injection Molding Machine
Parting LinesParting line consideration depends upon shape and thefunction of the part. If a shaft diameter is used as a bearingsurface and is going to be injection molded, it cannottolerate a conventional parting line. In this situation,incorporating small flats on the shaft at the parting line willavoid mismatch and minimal flash conditions (see Figure II-2).
Figure II-2. Free Running Shaft
The parting line depends on the shape of the part. FigureII-3 illustrates an irregular parting line. Whena parting line involves two mating halves with closetolerances, the mold mating steel parts should beinterlocked for good positioning or take in an allowance forpossible mismatches. The allowance should be in the0.005 in to 0.010 in range relative to the finished dimension.
Figure II-3. Irregular Parting Line
Part II: Design Considerations for Injection Molded Parts
Mold Back FlowCheck Valve
Screw TravelLimit Switches
InjectionPiston
MotorScrewHopperHeater Bands
NozzleMold ClampSystem
Motors, Pumps, Valves, Oil Tank,Heat Exchangers, etc.
Controls
.005Parting Line .005
Parting line
Design Considerations for Injection Molded Parts
II-2

Draft Angles Draft is necessary for the ejection of the parts from themold. Always design with draft angles. Recommendeddraft angle is normally 1° with 1/2° on ribs. Some draftangle is better than none and more draft is desirable if thedesign permits. Where minimum draft is desired, goodpolishing is recommended and feature depth should notexceed .5in.
Wall ThicknessThe number one rule for designing plastic parts is uniformwall thickness. Uniform walls aid in material flow in themold, reduce the risk of sink marks, molded-in stressesand differential shrinkage.
For non-uniform walls, the change in thickness should notexceed 15% of the nominal wall (see Figure II-4) andshould transition gradually.
Corners should always be designed with a minimum filletradius of 50% of the wall thickness and an outer radius of150% of the wall thickness to maintain a uniform wallthickness (see Figure II-4).
Figure II-4
Figure II-4
Fillets and RadiiSharp corners should be avoided. They are the numberone cause of part failure, stress concentrations, poor flowpatterns and increased tool wear (see Figure II-5).
Indicate radii at all inside and outside corners to themaximum which a design will allow.
NOT RECOMMENDED RECOMMENDED
T
R = .5T Min.
R = 1.5T Min.
NOT RECOMMENDED RECOMMENDED
Z 3ZMin.
Design Considerations for Injection Molded Parts
II-3

BossesBosses are usually designed to accept inserts, self-tappingscrews, drive pins, etc., for use in assembling or mountingparts.
Avoid stand-alone bosses wherever possible. Bossesshould be attached to walls or ribs by means of ribs orgussets for structural stability (see Figures II-5 & 6).
Figure II-5
The O.D. of the boss should ideally be 2.5 times the screwdiameter for self-tapping screw applications. Thick-walledbosses with bases greater than 50% of the wall could formvisible sink marks. To overcome this condition, a thinner-walled boss of 2.0 times screw diameter or less can havemultiple ribs (see Figure II-6).
Figure II-6
The thickness at the base of the ribs and gussets used tostabilize bosses should not exceed 50% of the thicknessof the adjoining wall.
Boss inside and outside diameters should have 1/2° draftper side. See Part V of this guide for additional informationon bosses for press fits and self-tapping screws.
RibsRibs should be used when needed for stiffness andstrength or to assist in filling difficult areas.
In structural parts where sink marks are of no concern, ribbase thickness (t) can be 75–85% of the adjoining wallthickness (T).
For appearance parts, where sink marks are objectionable,rib base thickness (t) should not exceed 50% of theadjoining wall thickness (T) if the outside surface is texturedand 30% if not textured. Sink marks are also dependenton the material.
Rib height should be at least 2.5–3.0 times the wallthickness (T) for effective strength.
Draft should be 1/2° per side nominal.
Fillets at the base of the rib should be .020 in minimum.
Multiple ribs should be spaced at least 2 times the wallthickness apart to reduce molded in stress and problemsin cooling of the mold (See Figure II-7).
Figure II-7
1/2°Min.
2 T Min.
2.5-3.0 T Min.
T
t
R = .020in
NOT RECOMMENDED RECOMMENDED
T
.5T AT BASE
NOT RECOMMENDED RECOMMENDED
SINK MARK
T
.7 T
R = .25T.5T
Design Considerations for Injection Molded Parts
II-4

OpeningsWhen an opening is desired in a part (such as toaccommodate a snap-fit) and is to be formed withoutcore pulls, a 5° angle mating of the core and cavity isrequired (see Figure II-8).
Figure II-8
ShrinkageShrinkage is a characteristic of resin which occursduring molding. Different resins have different moldshrinkages. Crystalline and semi-crystalline materialsexhibit higher shrinkage than amorphous materials.Unreinforced plastics have higher shrinkage thanreinforced grades. It is important that the grade of materialbe selected before the mold is constructedand that the proper mold shrinkage be specified. Basicshrinkage data is obtained from ASTM tests or ISO tests.
Material shrinkage can vary with part and tool design:thick walls will have higher shrinkage rates than thin,variation in section thickness can cause differentialshrinkage and warpage; flow direction will effect shrinkage,particularly with glass fiber-reinforced grades (more whenperpendicular to flow and less when parallel to flow; seeFigure VII-14).
Shrinkage is also influenced by process conditions. As cavity pressure increases, shrinkage typicallywill decrease. The mold and melt temperature willalso influence shrinkage. Cooler molds will reduceshrinkage while hotter melt temperatures will increaseshrinkage especially with semi-crystalline materials.
Contact BASF Technical Services for shrinkagerecommendations on any of our products.
GatingThe gate connects the part to the runner system. It isusually the thinnest cross-section in the entire system. Thedesign of the gate is dependent on tool design, partgeometry and the material selection.
Gate location, size, type and number must also beaddressed.
• Gates should be located away from high stress orimpact areas.
• Gate configuration and location should minimallyaffect part appearance.
• Gate design and location should eliminate secondarydegating operations, if possible.
• The gate should be located to best fill the part;position flow for advantageous glass fiber orientation, ifpresent, and locate knit lines inlow-stress areas.
Refer to the BASF Injection Molding Processing Guide formore details.
5° Min.“Kissoff” betweentwo pieces of steel
MOLD PULL
Design Considerations for Injection Molded Parts
II-5

VentsVents are regions in the mold where clearance is used topermit trapped air and gases to escape. Lack of properventing can cause excessive injection pressure, shortshots, burn marks and splay. A cavity can be consideredadequately vented when plastic can be injected at highrates without showing signs of burn marks.
There are many ways to vent a mold. Typically, this isdone by machining numerous shallow channels at theparting line. The dimensions of the channels aredependent on the material injected. Contact BASFTechnical Services for this information. Other waysto vent a mold are ejector pins, vent pins and runners. Flow analysis can identify areas needing specific venting forbest results.
Potential Knit LinesKnit lines are areas in the molded part where two or moreflow fronts converge. This area generally has lower strengththan the other areas of the part. One should anticipate knitlines, which show up well in flow analysis programs, anddirect them away from anticipated high stress areas of thepart where possible. Knit lines generally form on theopposite side of obstacles which are in the way of thenormal flow path, such as pins that form holes in the part orbosses designed to accept inserts.
Design Considerations for Injection Molded Parts
II-6

Stress . . . . . . . . . . . . . . . . . . . . . . . . . . . . . . . . . . . . . . . . . . . III–2
Stress-Strain . . . . . . . . . . . . . . . . . . . . . . . . . . . . . . . . . . . . . III–2
Normal Stress . . . . . . . . . . . . . . . . . . . . . . . . . . . . . . . . . . . . III–3
Shear Stress. . . . . . . . . . . . . . . . . . . . . . . . . . . . . . . . . . . . . . III–3
Torsional Stress . . . . . . . . . . . . . . . . . . . . . . . . . . . . . . . . . . . III–4
Bending Stress . . . . . . . . . . . . . . . . . . . . . . . . . . . . . . . . . . . III–5
Section Properties of Various Cross-Sections. . . . . . . . . . III–6
Explanation of Variables . . . . . . . . . . . . . . . . . . . . . . . . . . . . III–6
Beam Sections . . . . . . . . . . . . . . . . . . . . . . . . . . . . . . . . . . . III–6
Formulas for Common Beams in Bending . . . . . . . . . . . . . III–7
Formulas for Torsional Deformation and Stress . . . . . . . . . III–8
I, T and L Sections. . . . . . . . . . . . . . . . . . . . . . . . . . . . . . . . . III–9
Formulas for Flat Plates. . . . . . . . . . . . . . . . . . . . . . . . . . . . . III–10
Flat Plate Equations. . . . . . . . . . . . . . . . . . . . . . . . . . . . . . . . III–10
Pressure Vessels . . . . . . . . . . . . . . . . . . . . . . . . . . . . . . . . . . III–11
Thermal Expansion and Stress. . . . . . . . . . . . . . . . . . . . . . . III–12
Impact Stresses. . . . . . . . . . . . . . . . . . . . . . . . . . . . . . . . . . . III–13
Stress Concentrations. . . . . . . . . . . . . . . . . . . . . . . . . . . . . . III–14
Rib Design . . . . . . . . . . . . . . . . . . . . . . . . . . . . . . . . . . . . . . . III–15
Design for Equivalent Stiffness . . . . . . . . . . . . . . . . . . . . . . . III–18
Structural Design
Part III

Stress
Stress-StrainWhen a force is applied to a part, the result is a deformedpart which is both stressed and strained. The stress (σ) in apart is determined by the load (F) applied per unit area.
σ = F_A
Strain (ε) is a change in the part’s length over its originallength (see Figure III-1).
ε =
Figure III-1. Strain
Hooke’s Law is the relationship between stress and strain,such that strain is proportional to stress andthe modulus of elasticity (E) or Young’s Modulus isthe constant of proportionality:
E = σ−ε
. All plastic materials have a characteristic stress-straincurve (see Figure III-2).
Figure III-2. Stress vs. Strain
In order to obtain a stress-strain curve for a resin, a tensiletest is performed at room temperature. The part is axiallyloaded with the force directed away from the part. Thestress-strain curve describes the resin’s response to aforce applied at a predetermined rate (.2–.5in/min). The yield point (deviation from the straight line) isdependent upon the temperature at which it is measured.Plastic materials do not have a distinctlinear response like that of metals. Temperature andhumidity can change these curves. Higher temperaturesand humidity generally reduce stress carrying ability andincrease strain (deflection).
When a plastic part is subjected to a high enough externalforce, it will exceed its elastic limit (the straight line portionof the curve in Figure III-2). Its original size and shape willno longer remain constant. The material behaves linearlyas long as the stress is kept well below the yield point.Once the yield point is reached, the material at that point isin its plastic (non-linear) range. Exceeding the linear rangeresults in some permanent deformation of the material. Itis only when the parthas not been stressed beyond its elastic limit thatHooke’s Law applies. There are many types of stresses:Normal, Shear, Torsional, and Bending. Each will bediscussed in detail.
Part III: Structural Design
AL
∆L
F
F
ST
RE
SS
Typical Metal
Brittle Plastic
Ductile Plastic
Structural Design
III-2
∆LL

Structural Design
Normal StressNormal stress (σ) is the ratio of the force applied over agiven cross-sectional area (A):
σ = F_A
When a load is applied perpendicular (normal) tothe plane of a surface, it results in a stress normal tothe cross-section. A normal stress is either tensile orcompressive, depending on the direction of the forceapplied. When the force is directed away from the part,the stress is tensile (see Figure III-3), and when the force isdirected toward the part, the stress is compressive (see Figure III-4).
Figure III-3. Tensile Stress
Figure III-4. Compressive Stress
Shear StressShear Stress (τ), like tensile and compressive stress, isalso expressed as the force applied over a cross-sectionalarea (A).
τ = F_A
The difference is that the result of the force being applied isa stress which is parallel to the cross-section (see FigureIII-5).
Figure III-5. Shear Stress
Illustration credit: Beer & Johnson, Mechanical Materials.
F
C
CA
F
F
F
A
F
F
A
F
F
III-3

Torsional StressWhen a part is in torsion (T), twisted along its longitudinalaxis, there is, at any point on the plane of the section, ashear stress (τ) (see Figure III-6). The maximum shearstress of a shaft in torsion is calculated by:
τ = Tc__K
Where variable c is the distance from the center of theshaft to the outer surface where the maximum stressoccurs, and K is the torsional constant.*
Figure III-6. Torsional Stress
Illustration credit: Beer & Johnson, Mechanical Materials.
Torque is calculated by:
T = KG L
Where variable θ is the angle of twist due to the torque, Gis the modulus of rigidity, and L is the length of themember. The equation can be manipulated to calculatethe angle of twist (θ):
θ = TL__KG
Example for solid circular shaft:
A 5in long solid circular shaft of .5in diameter, is subjectedto a torque of 8 in–lb. Calculate the shear stress and angleof twist.
Using Ultramid• 8267 resin (40% mineral/glass), at room
temperature and dry as molded (DAM):
The shear stress is extremely low in comparison to theresin’s tensile strength, therefore, the shaft can withstandthe 8 in–lb torque applied.
* Please reference the formula for the torsional constant ofvarious cross-sections in the Torsional Formula Section(see Figure III-8).
L
C
(b)T
U
E = Modulus of elasticity = 1,110,000 psi
υ = Poisson’s Ratio = 0.35
K = πR4 = π = 0.006136in412 2
(0.25)4
τ = = 326 psi(8in-lb)(0.25in).006136in4
= = .0158 rad(8in–lb)(5in)
(411,111psi)(.006136in4)
G = E = 1110 000psi, , = 411,111 psi2(1 + 0.35)2(1+ υ)
θ
Structural Design
III-4
θ

Bending StressWhen a simply supported structural member is in flexure,the top section will be in compression and the bottomsurface will be in tension.
The center of the member is the neutral axis (N.A.), and is aregion of zero stress. The maximum stresses will occur atthe extreme fibers (a and b). Bending stress is expressedas:
where M is the bending moment, c is the distance fromthe neutral axis to the extreme outer fiber and I is themoment of inertia (see Figure III-7).
Figure III-7. Neutral Axis in Bending
Example for cantilever beam:
The I-beam shown has applied force of 20lb (see Figure III-8). Once the moment is calculated, then the bendingstress can be calculated. The chosen material is Ultramid®8267 (40% mineral/glass), tensile strength at roomtemperature and dry as molded (DAM) is 20,000 psi.
Figure III-8.Cantilever I-Beam Cross-Section
M = Force x distance = (20lb)(2in) = 40in-lb
In comparing the bending stress with the material’s tensilestrength, the I-beam will be able to withstand the 20 lbforce applied.
* Please reference the Beam Sections that follow for themoment of inertia of various cross-sections.
σ =McI
N.A.
Tension
b
a
Compression F
Width (b)
Distance to N.A. (c)
N.A.
Height (h)
w = .15d = .2
2in
F = 20 lb
t = .1
.4
b = .3
I* = –12 = . (. (. ))33 2 2 112
(.3–.15)(.2)3
12+
– = .0015in4b(d+2t)3 (b–w)d3
12
σb =(40in-lb)(.2in)
.0015in4 = 5333 psi
Structural Design
III-5

Section Properties of Various Cross-Sections (Straight Beams)
Explanation of VariablesThe table below provides the following useful sectionproperties for Figures III-9 through III-14:
A = AreaY = Distance from centroid to extreme fiberI = Moment of Inertia about principal axisr = Radius of gyration about principal axis
Beam SectionsRectangle
A = bd I = 1__12
bd 3
y = d__2
r = 0.2887d
Figure III-9
Solid Circle
A = πR2 I = π__4
R 4
y = R r = R__2
Figure III-10
Hollow Circle
A = π(R2- Ri2) I = π__
4(R4- Ri
4)
y = R r = 1__2 √R2 + Ri
2
Figure III-11
I-Beam, C channel and Hollow Rectangle
A = 2bt + wd I =b(d + 2t)3 – (b – w)d 3
y = d__2
+ t r = (I__A)
1/2
Figure III-12
U channel, T section and L section
A = tb + wd I = b__3
(d + t)3 – d 3__3
(b - w) - 9Ad + t - y)2
y = bt2 + wd (2t + d) r = (I__A)
1/2
2(tb +wd)
Figure III-13
Side T section, cross-section and H section
A = wd I = wd3 + bt 3
y = d__2
r = ( I__A)
1/2
Figure III-14
y
b
d
��R
y
R1
R
y����d d d
y y y
w/2 w w
t
b b bb
t t
d
y
d d
y y
w w
t
bb
b
2
2w
t t
d d
w/2
t t
d
y y y
w w
t
b b b
12 12
12
Structural Design
III-6

Formulas for Common Beams in BendingThe following equations can be utilized to determine themaximum moment, Mmax; displacement at a point, y; max-imum displacement, ymax; and maximum stress, σmax, ofmany commonly used beam structures; c = distance fromcentroid of cross-section (Figures III-15 through III-22).
Cantilever Beam End Load
Mmax = WL
y = –Wx2(3L – x)
ymax = –WL3
σmax = WLc @ x = 0
Figure III-15
Cantilever Beam, Intermediate Load
Mmax = W(L–a)
ymax = –W(2L3–3L2a+a3)
σmax = W(L–a)c @ x = 0
Figure III-16
Cantilever Beam, Fully Distributed, Uniform Load
w = load/unit length
Mmax = wL2
@ x = 0
y = –wx2
(6L2–4Lx+x2)
ymax = –wL4
@ x = 0
σmax = wL2c @ x = 0
Figure III-17
Cantilever Beam, Partially Distributed, Uniform Load
Mmax = w(L–a)2
@ x = 0
ymax = –w (L–a)3 (3L+a)
σmax = w(L–a)2c @ x = 0
Figure III-18
Fixed Beam, Center Load
Mmax = WL @ x = L__2
y = –W (3Lx2–4x3)
ymax =–WL3
@ x = L__2
σmax = WLc @ x = 0, L
Figure III-19
Fixed Beam, Intermediate Load
Mmax = Wa2(L–a)
ymax =–2W(L–a)2a3
@x= 2aL
σmax = –Wa2(L–a)c
Figure III-20
Fixed Beam, Fully Distributed, Uniform Load
w = load/unit length
Mmax = wL2
@ x = 0,L
y = wx2
(2Lx–L2–x2)
ymax = –wL4
@ x = L__2
σmax = wL2c @ x = 0,L
Figure III-21
Simply Supported Beam, Center Load
Mmax = WL @ x =
y= –W(3L2x-4x3) for O
ymax = –WL3
σmax = WLc @ x = 0, L
Figure III-22
6EI
3EI
I
6EI
I
3EI(L+2a)2
L2
24EI
8EI
2
2I
48EI
192EI
8
8I
��
����W
��W ����W
����24EI
384
12
12I
W
24EI
2
2I
48EI
48EI
4
4I
��W
o
L
x
y
X
y max
Y
o
L
a
X
y max
Y
��o
L
X
y max
Y
W
y
x
o
L
a
X
y max
Y
W
X
X
X
o
L
x
y max
L/2
Y
y
o
L
a
y max
Y
L
o
xy max
Y
W
y
L
y max
L/2
Structural Design
III-7
L+2a
L2
L2
≥ x ≤
if a > L/2

Formulas for Torsional Deformation and StressBy using these formulas on beams of common cross-sections, angle of twist, U, and maximum shear stress,Tmax, can be calculated. (See Figures III-23 through III-29.)
Where: T = Twisting moment (force-length)L = Length of beamG = Modulus of rigidity (force per unit area)K = Cross-section dependent function (length4)
Reference: Roark, Raymond & Young, Warren, Formulas for Stress and Strain,McGraw Hill.
Beam in TorsionSolid Circular Section
Figure III-23
Hollow Circular Section
Figure III-24
Solid Rectangular Section
Figure III-25
Solid Square Section
Figure III-26
= TLKGθ
2R
K R
Tboundary
=
=
12
2
4
3
π
τπRmax @
Ri
R0
( )
K (Ro4 − Ri
4)
TRo
R Ro i
=
=−
12
24 4
π
τmax π@ outer boundary
−
2a
2b
K ab ba
b for a ≥ b
T(3a + 1.8b)a b
@ midpoint of each longer side
= − −
=
34
4
2 2
163
336 112a
8
.
maxτ
2a
K
a
=
=
2 25a
0.601T
4
3
.
τmax @ midpoint of each side
Structural Design
III-8

I, T and L SectionsFor sections I, T and L, the maximum shear stress occurswhere the largest inscribed circle, D, touches theboundary. A=cross-sectional area.
I Section
Figure III-27
T Section
Figure III-28
LL SSeeccttiioonn
Figure III-29
K ab ba
ba
TcK
c DDA
Dr
Dr
where D touches
radius r
c DD
A
DA
where D touches flat surface
13
4
4
2 4
2
2 4
2
2 4
2
13 021 1
12
116
1 + 0.762 0.118loge(1+2
)+ 0.2382
116
1 01516
= − −
=
=+
=+
+
. ( )
. ( )
maxτ
π
ππ
*If b < d then t = b and t1 = d
If b > d then t = d and t1 = b
K K K D
K cd
tt
rb
Db r rd
d
r b
= + +
=
= +
=+ + +
+
2 2
13
015 01
42
1 24
23
1
22
α
α ( . . )
( )
d
a
b
c
b
r
D
K K K D
K cd dc
dc
tt
rb
Db r rd
d
r bfor d b r
= + +
= − −
= +
=+ + +
+ < +
1 24
23
4
4
1
22
13
0105 1192
015 010
42
2
α
α
. ( )
( . . )
( )
( )( )
d
a
c
b
r
D
K K K D
K cd dc
dc
db
rb
= + +
= − −
= +
1 24
23
4
413
0.105 (1 )192
(0.07 0.076
α
D = 2(d + b + 3r – 2(2r + b)(2r + d)) for b < 2(d + r)
α )
D
r a
c
d
b
Structural Design
III-9
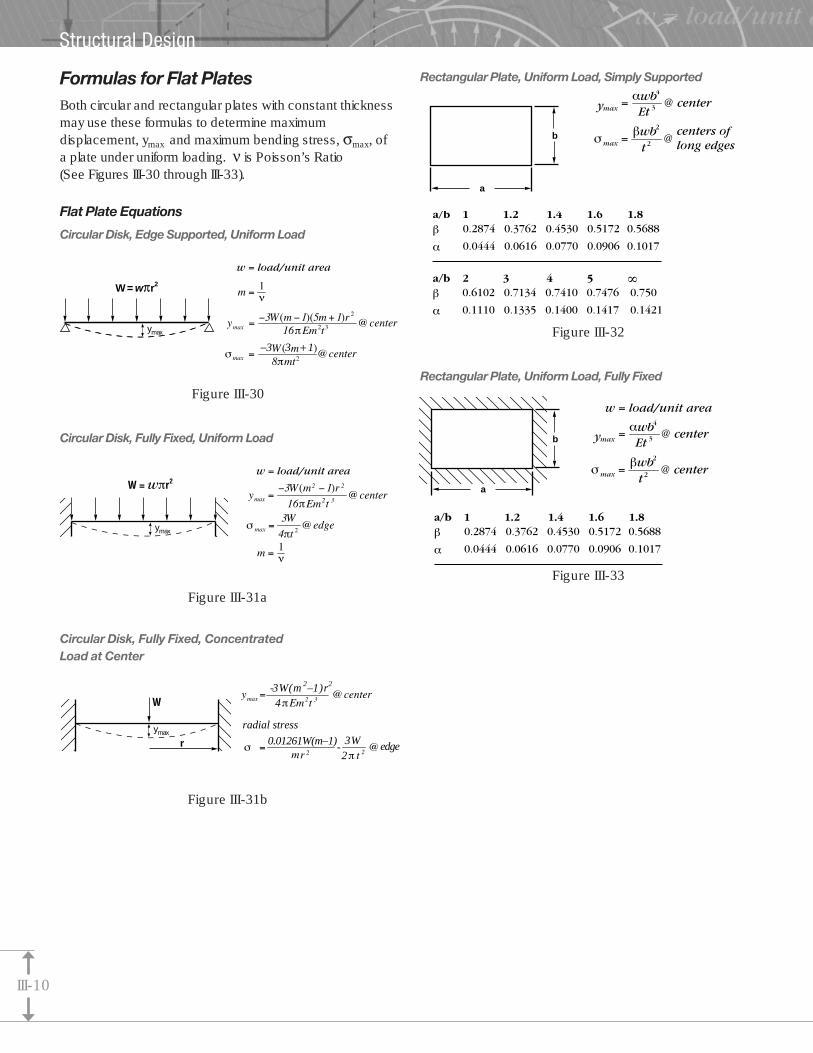
Formulas for Flat PlatesBoth circular and rectangular plates with constant thicknessmay use these formulas to determine maximumdisplacement, ymax and maximum bending stress, σmax, ofa plate under uniform loading. ν is Poisson’s Ratio (See Figures III-30 through III-33).
Flat Plate Equations
Circular Disk, Edge Supported, Uniform Load
Figure III-30
Circular Disk, Fully Fixed, Uniform Load
Figure III-31a
Circular Disk, Fully Fixed, ConcentratedLoad at Center
Figure III-31b
Rectangular Plate, Uniform Load, Simply Supported
Figure III-32
Rectangular Plate, Uniform Load, Fully Fixed
Figure III-33
− +3 3 1
ymax
W = wπr2
ymax
b
a
b
a
Structural Design
III-10
0.01261W(m–1)
4
radial stress
edge2
-3W(m2–1)r2
3W-
ymax
r

Pressure VesselsPressure vessels, containers, or tanks can be analyzed bythe use of shell theory because of their shell-like shape andsymmetrical loading. To distinguish between thick andthin wall shell or cylinders, the relationship of the wallthickness (t) to the radius (r) must be considered:
• If 10t is < r, the thin wall theory applies.• If 10t is > r, the thick wall theory applies.
In dealing with pressure vessels, only those vessels havinginternal pressure resulting in a tensile failure will beaddressed in this manual. External pressure resulting inbuckling failure is not covered here because it seldomoccurs in practice. The equations are as follows:
Internal pressure: (See Figure III-34)
Thin wallMaximum stress (hoop or circumferential) is:
where P is the internal pressure, ri is the inner radius, and tis the wall thickness.
Thick wallMaximum stress is:
where ro is the outside radius, ri is the inside radius, and Pis the internal pressure.
Shells or Curved Surfaces
• Thick Wall: Radial and Hoop (Tensile) Stresses
• Thin Wall: Hoop Stress only
`
The critical or the highest-stressed area of a pressurevessel is the knuckle or transition section, located at thejuncture between the end cover and the shell or body ofthe vessel (see Figure III-35).
Figure III-35
High localized stresses at the knuckle section are causedby stress risers. (These can be linked to the effects ofstress concentration factors. See section III-12.) Themore abrupt the change, the higher the stress will be. As a result, a spherical shaped end cover is best.
σ =+
−P r r
r ro i
o i
( )
( )
2 2
2 2,
σ =Pri
t
P
��Cover
ShellKnuckle
riro
Structural Design
III-11

Pressure Vessels (cont.)
Example:
Design a cylinder container to withstand an internalpressure of 50 psi, if the diameter is to be 12in. Materialhas been selected to be Ultramid® • 8233 (33% glassreinforced nylon 6). The wall thickness, for moldingconvenience, has been set at 0.250 in maximum.
Test for wall condition•Thin or Thick?
10t(10)(.250in) = 2.5in
r = 12/2 = 6in2.5 in < 6in
Therefore, thin wall approach is acceptable.
Since we are dealing with long-term effects, we need tocompare the 1,200 psi against the allowable tensilestrength of the material to determine if this design issatisfactory. Fortunately, this 1,200 psi is well below theallowable tensile strength of the material (18,400 psi @50% RH), therefore, the design is satisfactory for short termapplications. One must check acceptability for long termconditions, where applicable.
NOTE: for a spherical shape the stress is:
This demonstrates that spherical is a good shape forthe end cap.
Thermal Expansion and StressThermal stresses are typically not of significant concernexcept in the case of dissimilar materials in an assemblywhich sees temperature variations. This occurs when athermoplastic part is fixed to metal.
If the plastic is clamped to the metal, then the material withthe greater expansion would tend to buckle from theresultant compressive loading. To eliminate this potential,the allowable stress of the larger expanding material mustbe less then the compressive stress developed due toexpansion. Euler’s critical buckling load (Pe ) equationallows one to calculate the critical compressive stress.
Pe = 4p2 EIL2
Figure III-36
σcc = Pe /A1
σcc = critical compressive stressA1 = cross-section area of material 1
I = moment of inertia of material 1E = modulus of elasticity
The following equation calculates the thermal expansiondifference between two dissimilar materials (1 & 2).
∆L = (α1 - α2)∆TLwhere α1 = coefficient of thermal expansion of material 1
α2 = coefficient of thermal expansion of material 2∆L = change of length∆T = change in temperature
L = length between fixed points
To calculate thermal stress, use the following equation:
σc = (α1 - α2) E∆T
or increase the section modulus for the larger expandingmaterial.
If the σc > σcc , buckling will occur. To avoid this potential: 1)add additional bolts, 2) increase the section modulus (I/c)of material 1, or 3) provide clearance between bolts andholes for expected movement.
σ = Pr2 t
= ( ) ( )50 6
2(.250in)600
psi in psi=
σ = Prt
= ( ) ( )
( . )50 6
.2501200
psi inin
psi=∆L L
1Thermoplastic
2Metal
Structural Design
III-12

Impact StressesAn impact situation results when the loading of the partoccurs over a very short time frame. When designing forimpact, certain concerns should be considered. Oneimportant factor is to minimize stress concentrations.Various places in a part, such as holes, notches, grooves,depressions, sharp corners, ribs and bosses, can createhigh stress concentrations and induce impact failures.
Modify the part, where possible, to reduce and spread thestress over a larger area.
One method to predict impact stresses, deflections orstrains is to calculate the static deflection of the part. Thisinformation can then be used to calculate an amplificationfactor. By multiplying the static deflection, stress or strainby the amplification factor, an approximation of thedynamic, deflection, stress or strain can be determined.The amplification factor is as follows:
Amplification factor:
where h = height of dropy = static deflection
Example:The following simulates the impact of a 1.2 lb. load froma height of 4 feet on the center of a fully fixed 1/4 in. thick,3in circular thermoplastic disk.
ν = Poisson’s Ratio
ν = .35 E = 1,300,000νm = 1/ν
Figure III-37
First determine the static deflection and stress by using theformulas for flat plates, shown in Figure III-31b.
Next, calculate the amplification factor:
Then, the predicted dynamic deflection and stress areas follows:
Please note that this method is an approximation andgenerally will be conservative. All calculations shouldbe verified by experimental testing.
ydynamic = KD
ystatic
= (1858)(−2.7846 x 10 -5)
= −0.052in @ center
σdynamic = KDσstatic
= 1858 (−9.163)
= −17025 psi @ edge
KD= 1 + 1 + 2h
ystatic
( )2 48− = 1 + 1 +
= 1858
−2.7846x10_5
ystatic =4πEm2t 3
2πt 2
-3W(m2– 1 )r2
= ( ) ( )− −
3 12 1
0 351 15
− 1
4π1,300,000 ( )2(0.25)3
22. .
( )10 35.
10 35.
10 35.
.
= −2.7846 x 10⁻⁵ in.
0.01261W(m– 1 ) 3Wmr2σstatic =
0.01261(1.2)(1.5)2
=
= –9.163 psi
radial stress @ edge:
–
2π(0.25)2
3(1.2)–
KD = 1 + 1 2+ hystatic
1.2 lb
4 ft.
Structural Design
III-13
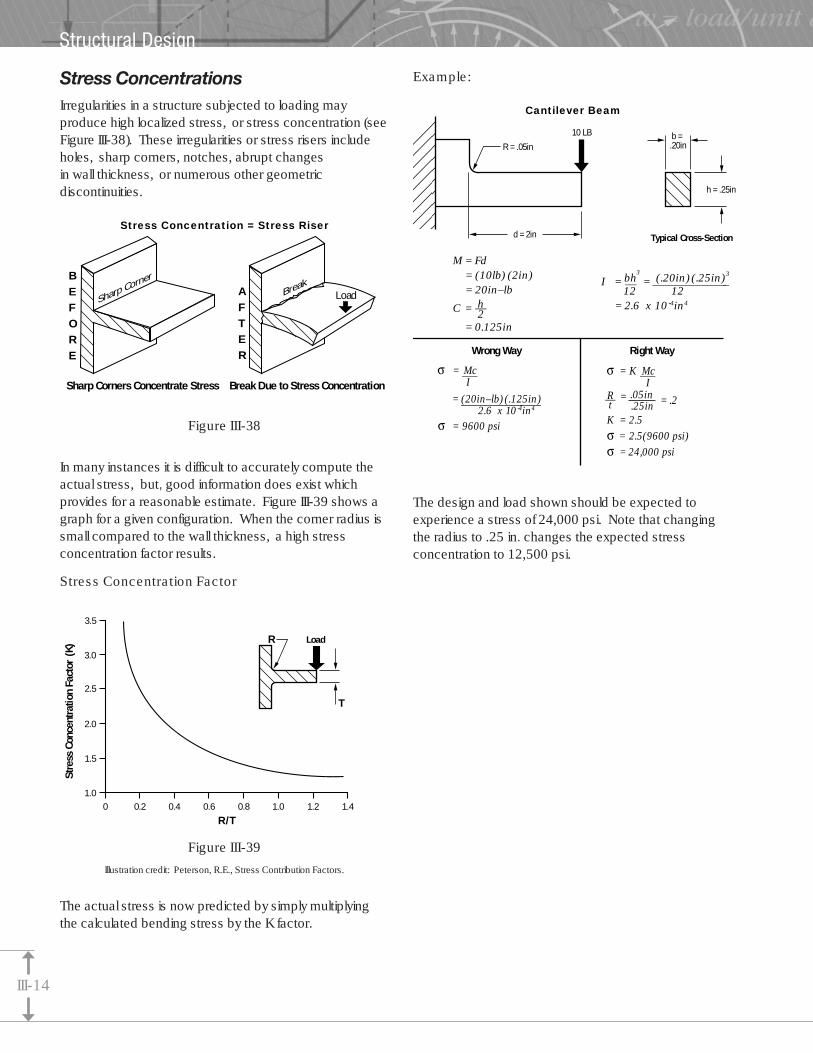
Stress ConcentrationsIrregularities in a structure subjected to loading mayproduce high localized stress, or stress concentration (seeFigure III-38). These irregularities or stress risers includeholes, sharp corners, notches, abrupt changesin wall thickness, or numerous other geometricdiscontinuities.
Figure III-38
In many instances it is difficult to accurately compute theactual stress, but, good information does exist whichprovides for a reasonable estimate. Figure III-39 shows agraph for a given configuration. When the corner radius issmall compared to the wall thickness, a high stressconcentration factor results.
Stress Concentration Factor
Figure III-39
Illustration credit: Peterson, R.E., Stress Contribution Factors.
The actual stress is now predicted by simply multiplyingthe calculated bending stress by the K factor.
Example:
The design and load shown should be expected toexperience a stress of 24,000 psi. Note that changingthe radius to .25 in. changes the expected stressconcentration to 12,500 psi.
Sharp Corners Concentrate Stress
Stress Concentration = Stress Riser
Break Due to Stress Concentration
BEFORE
Sharp CornerAFTER
BreakLoad
Load
Stre
ss C
once
ntra
tion
Fact
or (
K)
0 0.2 0.4 0.6 0.8 1.0 1.2 1.41.0
1.5
2.0
2.5
3.0
3.5
R/T
T
R
________________
Cantilever Beam�
10 LB
d = 2in
h = .25in
b = .20in
Typical Cross-Section
M = Fd = (10lb) (2in) = 20in–lb
C = h__2
= 0.125in
I = bh = (.20in)(.25in)3__
3
______________ 12 = 2.6 x 10⁻⁴in4
12
σ = Mc I
σ = 9600 psi
= (20in–lb)(.125in)2.6 x 10 -4in4
σ = K Mc ___ I
R__t
=
K = 2.5
σ = 2.5(9600 psi)
σ = 24,000 psi
Right WayWrong Way
= .2
___
.05in.25in
R = .05in
Structural Design
III-14
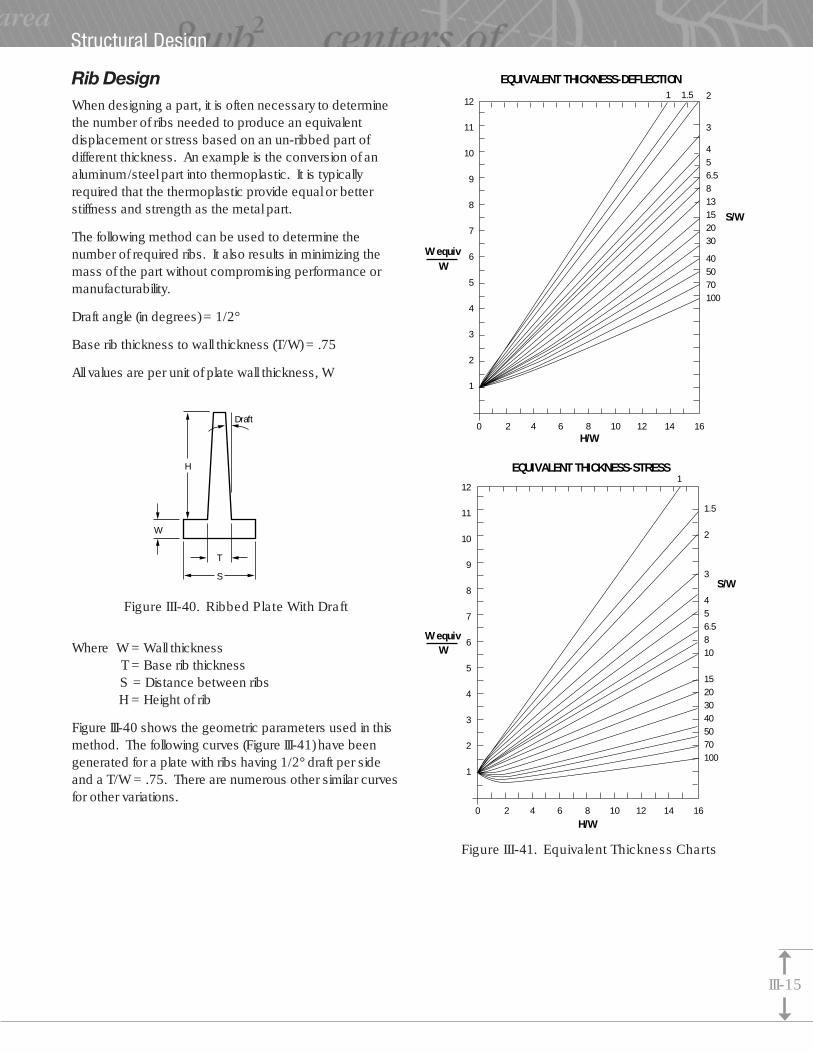
Rib DesignWhen designing a part, it is often necessary to determinethe number of ribs needed to produce an equivalentdisplacement or stress based on an un-ribbed part ofdifferent thickness. An example is the conversion of analuminum/steel part into thermoplastic. It is typicallyrequired that the thermoplastic provide equal or betterstiffness and strength as the metal part.
The following method can be used to determine thenumber of required ribs. It also results in minimizing themass of the part without compromising performance ormanufacturability.
Draft angle (in degrees) = 1/2°
Base rib thickness to wall thickness (T/W) = .75
All values are per unit of plate wall thickness, W
Figure III-40. Ribbed Plate With Draft
Where W = Wall thicknessT = Base rib thicknessS = Distance between ribsH = Height of rib
Figure III-40 shows the geometric parameters used in thismethod. The following curves (Figure III-41) have beengenerated for a plate with ribs having 1/2° draft per sideand a T/W = .75. There are numerous other similar curvesfor other variations.
Figure III-41. Equivalent Thickness Charts
H
W
T
S
Draft
EQUIVALENT THICKNESS-DEFLECTION
W equivW
2
3
456.5813152030
405070100
12
11
10
9
8
7
6
5
4
3
2
1
1 1.5
0 2 4 6 8 10 12 14 16H/W
S/W
EQUIVALENT THICKNESS-STRESS
W equivW
1.5 2 3 456.5810 152030405070100
12
11
10
9
8
7
6
5
4
3
2
1
1
0 2 4 6 8 10 12 14 16H/W
S/W
Structural Design
III-15

To use these charts a few ratios need to be calculated. To convert an aluminum part to thermoplastic of equalrigidity, it is necessary to calculate the equivalent thicknessof the plastic part without ribs. Next, a nominalthermoplastic wall thickness must be selected along witheither the rib height or number of ribs.Using the curves, the appropriate rib pattern can bedetermined. This process can be reversed as well ifthere is a desire to determine displacement or stress for aribbed member. It basically reduces the ribbed member toa simple flat plate.
Example:The following shows the conversion of a flat aluminumplate of 6 in. x 10 in. with a thickness of 0.125 in. to a typicalglass reinforced nylon plate with ribs and having equivalentstiffness. For flat plates of equal rigidity, the following ratiois valid: (see page III-15.)
This is the thickness that the thermoplastic part wouldneed to be if no ribs were present. Since this wallthickness is thicker than desirable for injection molding, theaddition of ribs is an alternative.
We must now choose a value for two of the following:nominal wall thickness (W), rib height (H), or distancebetween the ribs (S). For this exercise, let us make W = 0.125in and H = 0.725in.
Therefore:
Since we are interested in equivalent deflection, we canfind the curve that corresponds to these 2 ratios andfind that S/W = 20, therefore S = (0.125)20 = 2.5in. Thismeans that for a plate of 6 in. x 10 in. we will need 3 and 4ribs respectively. The equivalent plate would look likeFigure III-42.
Figure III-42. Equivalent Plate Using Cross-Ribbing
NOTE: To lower stresses in the plate, it is recommendedthat generous radii be placed at the base of the ribs.
Table III -1 further illustrates the weight-to-stiffnessadvantage of various rib heights.
W
Wequiv =
0=
0 339
1252712
.
..
H
W= =
0725
01255.8
.
.
TW
= 0.75∴T = (0.125)0.75
= 0.094in
knowing:
Ealuminum = 1.0x10⁷psi
Eplastic = 5.0x10⁵psi
then
E t tA A P3 3= P
E
tP Wequiv= = 0 339in.
=1.0 x 10⁷ (0.125)3
5.0x10⁵
13
tE t
EPA A
P
=3
13
6in
10in
0.725in0.125in
(see page III-18)
Structural Design
III-16

Effect of 1/8in Thick Rib of Various Heights on the Strength of a 2in x 1/4in BeamCase Rib Rib Height/Number Shape Size Wall Thickness % Increase in Weight % Increase in Stiffness
0 N/A N/A N/A N/A
1 N/A N/A 100 700
2 1/8in W x 1/8in H 1:2 3.12 23
3 1/8in W x 1/4in H 1:1 6.25 77
4 1/8in W x 1/2in H 2:1 12.5 349
5 1/8in W x 3/4in H 3:1 19.0 925
6 1/8in W x 1in H 4:1 25.0 1901
7 1/8in W x 1 1/4in H 5:1 31.0 3352
T = Thickness = 1/4in
T
2T
2 in
T
Table III-1
Structural Design
III-17

Design for Equivalent Stiffness
In order to replace metal parts with plastic, the equivalentstiffness of a plastic part can be determined. When thetwo parts are of equivalent stiffness, deflection is the same.Deflection is inversely proportional to the rigidity modulus(R):
R = EI
where E is the modulus of elasticity and I is the moment ofinertia. (The moment of inertia will vary for each geometry.See Figure III-43.) Therefore, by equating the modulus ofrigidity of the metal and plastic parts the condition ofequivalent stiffness will be satisfied.
Ealuminum Ialuminum = Eplastic Iplastic
For solid shape of equal width;
Ealuminum h3aluminum = Eplastic h3
plastic
Sections of Equivalent Stiffness in Bending:
Figure III-43
E = 2.0 x 10⁶ psi I = 0.0254in4
EI = 5.08 x 10⁴ lb–in2
A = 0.489in2
E = 10.3 x 10⁶ psi I = 0.0049in4
EI = 5.08 x 10⁴ lb–in2
A = 0.283in2
E = 1.36 x 10⁶ psi DAM I = 0.0374in4
EI = 5.08 x 10⁴ lb–in2
A = 0.270in2
E = 1.36 x 10⁶ psi DAM I = 0.0374in4
EI = 5.08 x 10⁴ lb–in2
A = 0.557in2
Aluminum
.457
.620
Zinc
.620
.789
.620
Nylon 33% GF
.898
Nylon 33% GF
1.142
.100
.620
.100
Structural Design
III-18

Cruise Control Bracket. . . . . . . . . . . . . . . . . . . . . . . . . . . . . . IV–2
Cover Cap. . . . . . . . . . . . . . . . . . . . . . . . . . . . . . . . . . . . . . . . IV–4
Design Examples
Part IV

Design Example #1
Figure IV-1. Cruise Control Bracket
Application: CRUISE CONTROL BRACKET
Problem: Plastic Bracket Bending Under Load After Conversion From Steel
Potential Reasonsfor Part Failure: a) Material
b) Processingc) Design
Analysis: Simple Cantilever Beam (Closelysimilar to the end-use condition).(Note actual outlined part.)
Figure IV-2. Rigidity Modulus, R = EI
E = Modulus of Elasticity I = Moment of InertiaR can be increased by increasing E or I
Part IV: Design Examples
A
A
Steel Part
B
B
Present Plastic Part
C
C
Redesign
FX
L
h
b
Part fixation
Section XX
X
Design Examples
IV-2

NOTE: The small section was analyzed because the leftportion of the part, which is basically clamped, has a largesection modulus and is therefore much stiffer than themiddle of the part.
Since I = bh3/12, a small change in h will result in a cubedeffect or a large increase in R, a very effective change.
Example: If h is doubled, it will increase the R by afactor of 8!!!
To make the plastic part more rigid than the steel part,EIplastic =>EIsteel (lb. in2.)
If the E for plastic is 740,000 (Ultramid • 8233) @ 50% RH,and for steel 30,000,000 psi, then the results would be asnoted:
Section AA Section BB Section CC
Plastic
Original Steel Part Present Part Redesign
I = .0002 I = .0008 I = .041EI = 6,000 EI = 592 EI = 30,340
Figure IV-3
Conclusion:a) A material change would not be effective enough; it
could increase the cost and require new approvals.
b) Processing was not determined to be the problemby lab analysis.
c) Redesign was implemented with successful results.
Design Examples
IV-3
Design Example #2Application: COVER CAP
Problem: Oversize Parts Out of Specification
Potential Reason for Part Failure:a) Material, or b) Processing
Customer Input: 1) The parts were initially inspected, approved by Q. C.
and placed into stock.
2) Five months passed, when a reorder was issued.
3) Parts were .0045in oversize and rejected by thecustomer.
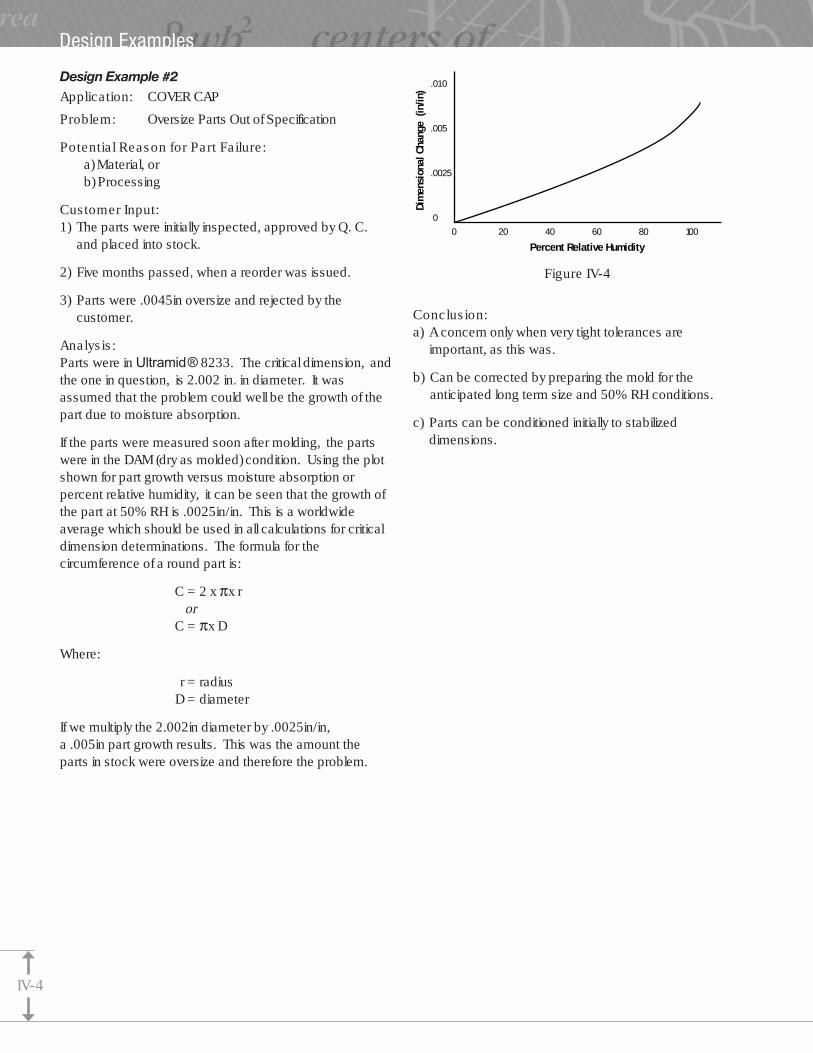
Analysis:Parts were in Ultramid ® 8233. The critical dimension, andthe one in question, is 2.002 in. in diameter. It wasassumed that the problem could well be the growth of thepart due to moisture absorption.
If the parts were measured soon after molding, the partswere in the DAM (dry as molded) condition. Using the plotshown for part growth versus moisture absorption orpercent relative humidity, it can be seen that the growth ofthe part at 50% RH is .0025in/in. This is a worldwideaverage which should be used in all calculations for criticaldimension determinations. The formula for thecircumference of a round part is:
C = 2 x πx ror
C = πx D
Where:
r = radiusD = diameter
If we multiply the 2.002in diameter by .0025in/in,a .005in part growth results. This was the amount theparts in stock were oversize and therefore the problem.
Figure IV-4
Conclusion:a) A concern only when very tight tolerances are
important, as this was.
b) Can be corrected by preparing the mold for theanticipated long term size and 50% RH conditions.
c) Parts can be conditioned initially to stabilizeddimensions.
.010
.005
.0025
00 20 40 60 80 100
Dim
ensi
onal
Cha
nge
(in/
in)
Percent Relative Humidity
Design Examples
IV-4
Part V
Snap-Fit Assembly . . . . . . . . . . . . . . . . . . . . . . . . . . . . . . . . . V–2
Snap-Fit Design. . . . . . . . . . . . . . . . . . . . . . . . . . . . . . . . . . . . V–2
Cantilever vs. Cylindrical . . . . . . . . . . . . . . . . . . . . . . . . . . . . V–2
Tapered Cantilever . . . . . . . . . . . . . . . . . . . . . . . . . . . . . . . . . V–2
Short Cantilever Design . . . . . . . . . . . . . . . . . . . . . . . . . . . . . V–3
New Formulas . . . . . . . . . . . . . . . . . . . . . . . . . . . . . . . . . . . . . V–4
Snap-Fit Design Example. . . . . . . . . . . . . . . . . . . . . . . . . . . . V–4
Press-Fit Assembly . . . . . . . . . . . . . . . . . . . . . . . . . . . . . . . . . V–5
Adhesive Bonding. . . . . . . . . . . . . . . . . . . . . . . . . . . . . . . . . . V–6
Bolts, Nuts, and Machine Screws . . . . . . . . . . . . . . . . . . . . . V–8
Mold-in Threads . . . . . . . . . . . . . . . . . . . . . . . . . . . . . . . . . . . V–9
Self-Tapping Screws . . . . . . . . . . . . . . . . . . . . . . . . . . . . . . V–10
Inserts. . . . . . . . . . . . . . . . . . . . . . . . . . . . . . . . . . . . . . . . . . . V–11
Ultrasonic Welding . . . . . . . . . . . . . . . . . . . . . . . . . . . . . . . . V–12
Vibration Welding . . . . . . . . . . . . . . . . . . . . . . . . . . . . . . . . . V–14
Other Assembly Techniques . . . . . . . . . . . . . . . . . . . . . . . . V–15
Thermoplastic Staking . . . . . . . . . . . . . . . . . . . . . . . . . . . . . V–15
Spin Welding . . . . . . . . . . . . . . . . . . . . . . . . . . . . . . . . . . . . V–15
Electromagnetic Welding . . . . . . . . . . . . . . . . . . . . . . . . . . . V–16
Assembly

Snap-Fit Assembly
Snap-Fit DesignWhen assembling two parts, snap-fits are simple, cost-effective, and a quick method of assembly. Whendesigned correctly, snap-fits can be assembled anddisassembled many times without any adverse affecton the assembly. Snap-fits are also one of the moreenvironmentally-friendly form of assembly because of their easy disassembly.
The designer should be aware that snap-fits do have somelimitations. These include a possible clearance conditiondue to the tolerance stack-up of the two mating parts, andlow pullaway forces. Snap-fits can also increase the costof an injection molding tool, if slides are needed in the mold.The designer can eliminate the need for slides by adding aslot directly underneath the snap ledge or by placing thesnap at the outside edge of the part.
Cantilever vs. CylindricalMost applications use the cantilever snap-fit design(see Figure V-1). The cylindrical design can be employedwhen an unfilled thermoplastic material is selected(a typical application is an Aspirin bottle/cap assembly).
When designing a cantilever snap, the designer mayhave to go through several iterations (changing length,thickness, deflection dimensions, etc.) to design a snap-fitwhich results in a strain lower than the allowable strain ofthe material (Figure V-6).
Figure V-1
Tapered CantileverFor most applications, the uniform section cantilever(see Figure V-2) is sufficient in designing a snap-fit. Atapered section beam is desirable, if additional deflectionis desired.
UNIFORM SECTION BBEAM
t∈= 1.50 •- YL2
TAPERED SECTION BEAM
t∈ = 0.92 •- YL2
Figure V-2.Conventional Cantilever Formulas
Part V: Assembly
���Y
CANTILEVER(FILLED & UNFILLED MATERIALS)
CYLINDRICAL(UNFILLED MATERIALS)
���Y2
B
tL
L
B
B
B
t
P
t
t/2
P
Assembly
V-2
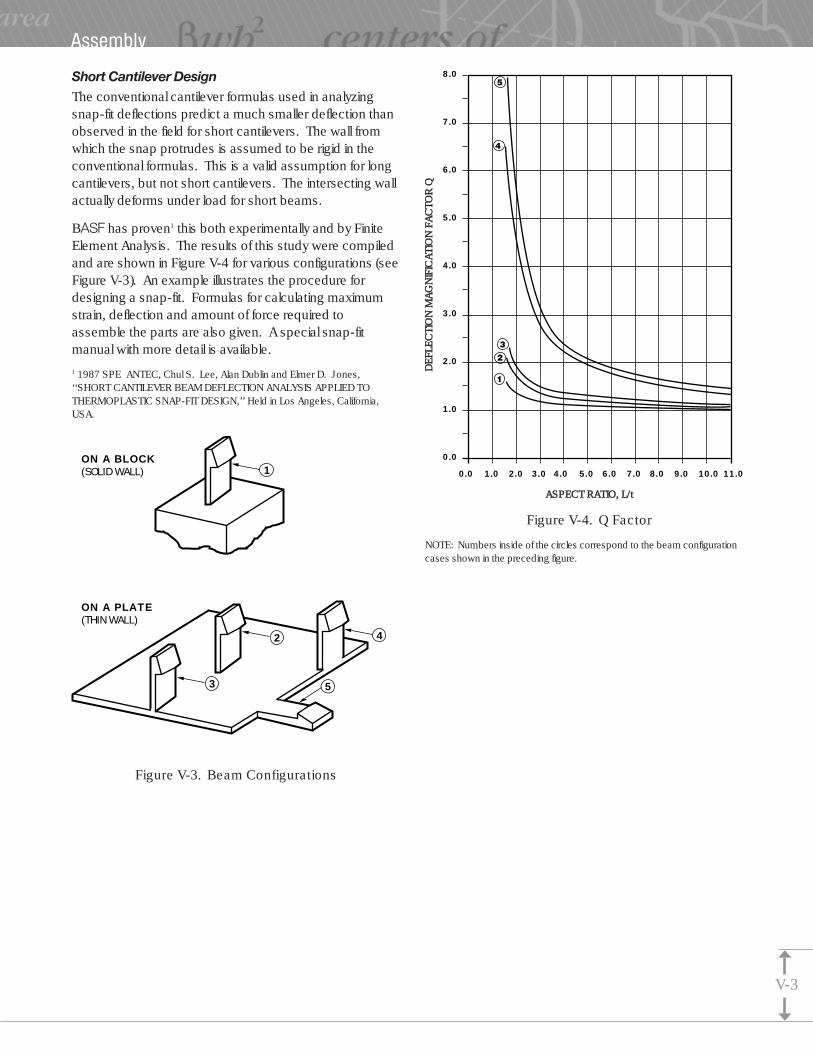
Short Cantilever DesignThe conventional cantilever formulas used in analyzingsnap-fit deflections predict a much smaller deflection thanobserved in the field for short cantilevers. The wall fromwhich the snap protrudes is assumed to be rigid in theconventional formulas. This is a valid assumption for longcantilevers, but not short cantilevers. The intersecting wallactually deforms under load for short beams.
BASF has proven1 this both experimentally and by FiniteElement Analysis. The results of this study were compiledand are shown in Figure V-4 for various configurations (seeFigure V-3). An example illustrates the procedure fordesigning a snap-fit. Formulas for calculating maximumstrain, deflection and amount of force required toassemble the parts are also given. A special snap-fitmanual with more detail is available.1 1987 SPE ANTEC, Chul S. Lee, Alan Dublin and Elmer D. Jones,‘‘SHORT CANTILEVER BEAM DEFLECTION ANALYSIS APPLIED TOTHERMOPLASTIC SNAP-FIT DESIGN,’’ Held in Los Angeles, California,USA.
Figure V-3. Beam Configurations
ASPECT RRATIO, LL/t
Figure V-4. Q Factor
NOTE: Numbers inside of the circles correspond to the beam configurationcases shown in the preceding figure.
8.0
7.0
6.0
5.0
4.0
3.0
2.0
1.0
0.0
0.0 1.0 2.0 3.0 4.0 5.0 6.0 7.0 8.0 9.0 10.0 11.0
DE
FLE
CTI
ON
MMA
GN
IFIC
ATI
ON
FFA
CTO
R QQ
ON A BLOCK(SOLID WALL)
ON A PLATE(THIN WALL)
2
1
4
53
Assembly
V-3

New Formulas
MAXIMUM STRAIN
tY∈O = 1.5 ••-L2 Q
Figure V-5
Where:∈O = Maximum strain at the base
t = Beam thicknessY = DeflectionL = Beam lengthQ = Deflection magnification factor
(refer to graph for proper Q values)
MATING FORCEµ + tan α Bt2 ∈EW = P——————— P = ————1 - µ tan α 6LQ
Where:W = Push-on force
W’ = Pull-off forceP = Perpendicular forceµ = Coefficient of frictionα = Lead angle
α’ = Return angleB = Beam widtht = Beam thickness
E = Flexural modulus∈ = StrainL = Beam lengthQ = Deflection magnification factor
(refer to graph for proper Q values)
Example:
GIVEN:Material: PETRA 130
(PET)
t = 0.10inL = 0.50inB = 0.25inE = 1,300,000 psiµ = 0.2α = 30.0°
∈O = 1.5%
Figure V-6
DETERMINE:
a) THE MAXIMUM DEFLECTION OF SNAPb) THE MATING FORCE
SOLUTION:
a) THE MAXIMUM ALLOWABLE DEFLECTION OF SNAP
tYmax ∈O L2 Q∈O = 1.5 ———- ⇒ Ymax = ———L2 Q 1.5 t
L— = 5.0 ⇒ Q = 2.0 (from Q Factor graph)t(0.015)(0.5)2 (2.0)Ymax = ——————————= 0.05in(1.5)(0.1)
Therefore, in an actual design, a smaller value for deflection(Y) would be chosen for an added factor of safety.
b) THE MATING FORCE
Bt2 E∈OP = ——————6L(0.25)(0.1)2 (1,300,000) (0.015)P = —————————————————— = 16.2lb
6(0.5) µ + tan αW = P ———————1– µ tan α
0.2 + tan30W = 8.1 ————————— = 14.2lb1 – 0.2 (tan30)
Therefore, it will take 14.2 pounds to force the snap-fit intoposition.
(More detailed information can be found in the BASFSnap-Fit Design Manual.)
tP
Y
W
B
L
α
tP
Y
W
B
L
α
Assembly
V-4

Press-Fit AssemblyTwo parts can be assembled by press-fitting themtogether (see Figure V-7). Although this is a commonassembly method in metals, a good design is morecritical for thermoplastics. Since plastics creep (or stressrelax), the designer must allow for a large reduction of theinitial press-fit clamp force. A good design will minimizethe strain on the plastic (see Figures V-8 & V-9), taketolerance stack-up into account and estimate the finalresidual clamp force due to plastic creep relaxation.
Figure V-7
RADIAL DEFORMATION
2 ∈ b3 (c2 - a2)δ = ———————————(c2 + b2)(b2 - a2)
WHERE:δ = Radial deformation∈ = Strain
WHEN a = 0
2∈bc2
δ = ————-c2 + b2
Figure V-8. Press-Fit With Two Identical Materials
NOTE:1. Radial deformation, δ, must be doubled for the total interference fit
on a diameter.2. a, b and c are radii, not diameters.3. Formula is only valid when the shaft and hub are the same material.4. Creep must be fully analyzed.
RADIAL DEFORMATION
c2 - b2 c2 + b2δ = b ∈(———)(———- +vPL)c2 + b2 c2 - b2
WHERE:δ = Radial deformation∈ = StrainvPL = Poisson’s Ratio.
Figure V-9. Press-Fit a Metal Shaft into a Plastic Hub
NOTE:1. Radial deformation, δ, must be doubled for the total interference fit
on a diameter.2. b and c are radii, not diameters.3. Formula assumes zero deformation of the metal shaft.4. Creep must be fully analyzed.
EXAMPLE:
GIVEN: A metal insert (O.D. = 0.50in) is to be press-fit intoa Ultramid 8233 boss (O.D. = 0.75in). Determine themaximum interference of the assembly using a 2%allowable strain for Ultramid 8233.
SOLUTION:
c2 - b2 c2 + b2d = b ∈ (————)(————- + vPL)c2 + b2 c2 - b2
.3752 - .2502 .3752 + .2502
= (.250)(.02)(————————) (———————- + .35).3752 + .2502 .3752 - .2502
d = .0057in
Therefore, the Capron® 8233 boss I.D. should be designedwith an .011in (2δ) maximum interference(.489in minimum diameter).
PLASTIC
PLASTIC
a
b
c
PLASTIC
b
c
METAL
Assembly
V-5

Adhesive BondingAnother method for assembling parts is by applyingan adhesive. Two similar or dissimilar materials can beassembled together in a strong leak-tight bond. Variousjoint designs are shown in Figure V-10.
The choice of the adhesive depends on the applicationand its end-use environment. Details of some adhesives,which can be used with BASF Ultramid® and Petra® products,are highlighted in Table V-1.
Polyurethanes– High strength, good impact resistance,good low temperature flexibility, two parts (usually), limitedmoisture resistance, long cure times, and usually needs tobe fixtured.
Epoxies– High strength, high temperature resistance,two parts (usually), poor impact resistance, long cure times,and usually needs to be fixtured.
Cyanoacrylates (example: Krazy Glue•)– High strength,very fast cure time, one part, limited service temperature(about 200°F), poor impact resistance, and limitedmoisture resistance.
Silicones– Low strength, very high heat resistance, twoparts (usually), good low temperature flexibility, good impactresistance, good sealing capability, very long cure times,usually needs to be fixtured, and very high material cost.
*3M, Structural Adhesive Guide for Industrial Product Design and Assembly.
Simple llap
Joggle llap
Double bbutt llap
Conventional ttongue aand ggroove
Figure V-10. Joint Design*
Assembly
V-6

ADHESIVE TYPE CURE MANUFACTURER
UR 1100 1 part urethane 30 min @ 250° F (121° C) HB Fuller 1-800-328-7307
FE 6046 (Flexible Epoxy) 2 part epoxy 60 min @ 200° F (93° C) HB Fuller 1-800-328-7307
Hysol 934 2 part epoxy 60 min @ 200° F (93° C) Hysol Aerospace Products(510) 458-8000
Scotch-Weld 2214 Regular 1 part epoxy 40 min @ 250° F (121° C) 3M Company1-800-362-3550
Scotch-Weld 2214 Hi-Temp 1 part epoxy 40 min @ 250° F (121° C) 3M Company1-800-362-3550
Scotch-Weld 2216 2 part epoxy 5 min @ 250° F (121° C) 3M Company1-800-362-3550
Tyrite 5700 A/C 2 part epoxy 15 min @ 200° F (93° C) Lord Industrial Adhesives(814) 868-3611
Superbonder 498 Cyanoacrylate 30 sec @ 73° F (23° C) Loctite Corporation1-800-562-8483
Cylok P Cyanoacrylate 10 - 30 sec @ 73° F (23° C) Lord Industrial Adhesives(814) 868-3611
Permabond 268 Cyanoacrylate 10 sec @ 73° F (23° C) Permabond Int’l 1-800-526-4741
3-0100 Silicone 24 hrs @ 73° F (23° C) Dow Corning(517) 496-6000
Plexus MA310 2 Part 15-18 min @ 73° F (23° C) ITW PlexusMethacrylate 1-800-851-6692
Table V-1. Recommended Adhesives for BASF Resins
Assembly
V-7

Bolts, Nuts, and Machine ScrewsStandard metal fasteners are also used to assemblethermoplastic components, although self-tapping screwsare more common. Bolts and screws are used to joinplastic to metal or plastic to plastic. Care must be taken toprevent excessive compressive stress on the plastic.
• Assembly must be limited to a prescribed torque leveland controlled. Rapid application of torque should beavoided since most thermoplastics are rate sensitive.
• High torques generally produce high compressivestress. A rapid initial stress reduction takes placebefore leveling off over time. The higher the stress, thegreater the stress relaxation. Elevated temperatures willfurther increase relaxation.
• A larger head screw or addition of a large diametermetal washer under the bolt head and/or nut willincrease the contact area and reduce stress. Figure V-11illustrates this concept.
• Flat head screws and rivets should be avoided in plasticapplications. These conical shaped fasteners cause awedging action which results in high hoop stress andpossible failure of the part.
• As stress relaxation occurs, the clamping force andtorque retention drop and the fastener will loosen. A spring washer can be used to maintain acceptableforce and torque levels. Figure V-12 shows variousoptions to help counteract stress relaxation. Options 1& 2 use a shoulder washer or bolt in combination withthe spring washer. The main clamping is metalto metal while a smaller force holds the plastic.
Figure V-11. Application of Stress Relaxation to Plastic Part Design
Figure V-12. Minimizing Stress Relaxation
SHAKEPROOF STEM BOLT ASSY.(STEM WASHER ATTACHED)
STEM WASHER
PLASTIC
METAL
SHOULDER BOLT
SPRING WASHER
PLASTIC
METAL
STEM (WASHER ATTACHED)
FLAT WASHER(OPTIONAL)
PLASTIC
METAL
Option 1 Option 2
Option 3
STRESS RELAXATION ON A PLASTIC PART
0.5
0.6
0.7
0.8
0.9
1.0
TIME, HOURS
S/So
So=15000
So=5000
.01 .1 1 10 100
psi
psi
So=15000 So=5000
Assembly
V-8

Molded-In ThreadsOne of the advantages of injection molded parts is theability to mold in many kinds of functional features such asthreads. These can be traditional forms or speciallymodified versions tailored to specific applications. Coarsethreads are generally preferred due to their higher strengthand torque limits. For applications requiring high pullout orsubject to high pressure loads, •Acme• or •Buttress• threadforms can be used.
The two main types of threads are external and internal.Both types should be designed with lead-in thread relief.Generally 1/32 in. is sufficient to prevent high stresses at theend of the threads. Also it is good design practice toinclude radii of .005 in.–.010 in. at the thread roots to minimizestress concentration. Examples of external and internalthreads are shown below.
Figure V-13. Molded-In Thread Relief
External threads should be located on the tool parting line,if at all possible, to avoid undercuts and the need for anunscrewing mechanism. This will lower tool cost andlower mold cycle time. Internal threads are usually formedby an unscrewing or collapsible core. If a single threadthat is slightly less than 360° around is adequate, then itcan be formed using a straight core pull. (See Figure V-14.)
Figure V-14. Single Screw Thread
Tapered Pipe ThreadsSpecial care should be taken when designing internaltapered pipe threads that will be mated with a metal pipe.These threads act as a wedge, causing high hoop stressthat may crack the plastic member, if over-tightened.Some means of providing a positive stop should beincorporated such as a shoulder at the bottom of theinternal plastic thread.1/32 in
1/32 in1/32 in
Assembly
V-9

Self-Tapping ScrewsThere are two main types of self-tapping fasteners used inplastic parts: thread cutting and thread forming.
Thread cutting screws are generally used only on brittleplastics, such as thermosets and highly filled (+50%)thermoplastics. They cut threads by means of a slottedshank. Because they actually remove material wheninserted, thread cutting screws should not be reinstalledand a chip reservoir should be added.
Thread forming screws are generally preferred for mostthermoplastic applications. These types of screws can bereinstalled a limited number of times (3-7). For repeatedassembly and disassembly, some form of metal insertsshould be used. There are several styles of thread formingscrews designed specifically for plastics. Three of themore widely used are:
Plastite™These screws have a trilobular cross-section which rollthreads by moving material out of the way as they areinstalled. After installation, the material fills back aroundthe shank lowering the residual stress in the screw boss.This feature also gives the Plastite• screws excellentresistance to loosening due to vibration. Higher hoopstress is produced with these screws.
Hi-Lo™These screws feature a dual lead with a high thread havinga 30° included angle and the low thread having a 60°angle. These screws have a high strip torque to drivetorque ratio which is important for small sizes. Lowerhoop stress is produced but higher stress concentrationsresult due to acute angle threads.
PT™This thread design has a single 30° included angle whichreduces hoop stress in the boss and also provides a highstrip torque to drive torque ratio.
Guidelines for self-tapping fasteners:1. Thread engagement length should be 2.5 times the
screw diameter.
2. Boss diameter should be at least 2 times the pilothole diameter.
3. Pilot hole diameter should be based on 50%-70%thread engagement. This can vary with the materialand the type of fastener (check with your Basf designrepresentative).
4. Cored holes should have 1/4° to 1/2° draft/side.
5. Holes should be counterbored or chamfered to a depthof .020 in. to aid alignment and reduce the chance ofboss cracking.
6. Strip to drive torque ratio should be at least 3:1, but thedifference in strip to drive torque is more important thanthe ratio.
7. Seating torque should be no more than 2/3 strip torque.
Figure V-15. Bosses for Self-Tapping Screws
D2.0 to 2.5D .020 in
D
d
Assembly
V-10

InsertsInserts of various types are used with plastics. The mostcommon are threaded metal inserts; either internallythreaded nuts or externally threaded studs.
Threaded metal inserts are used when the assemblyapplication requires repeated assembly and disassembly orthe assembly needs to resist creep and compressiverelaxation. There are several methods of installing inserts:
UltrasonicThis method uses the same equipment as ultrasonicwelding. The high frequency horn vibrations causefrictional heat between the insert and plastic, therebymelting it into the boss. This process takes under5 seconds and features low residual stress and excellentpullout strengths.
ThermalThis is similar to ultrasonics in that the insert is melted intothe boss but the insert is heated by a device like asoldering iron. This method is relatively slow and alsoyields a low stress assembly with good pull out strengths.
Self-tappingThese inserts have an external self-tapping screw threadand are driven into the hole using low cost equipment.(See Figure V-7.)
Press-fit and ExpansionThis type of insertion is not normally desirable. The insert is pressed in with an interference fit. Theexpansion insert is designed to expand into the side wallsof the boss with a tool. Both methods impart a high stressto the boss, and they have lower mechanical performance.
Molded-inThis method is often used for large or special inserts. Asthe name implies, these inserts are placed in the moldcavity and the plastic is injected, thereby encapsulatingthem. The need to place the insert in the mold increasescycle time and mold damage can occur.
Thermal IInsert Ultrasonic IInsert
Figure V-16. Typical Threaded Metal Inserts
Illustration Credit: Spirol Inserts CEM Corporation Inc. and In-X Fasteners Corp.
Expansion IInsert Self-TTapping IInsert
Assembly
V-11

Ultrasonic WeldingUltrasonic welding is a quick and reliable way to assemblethe same or very similar thermoplastic parts. Electricalenergy is converted into mechanical vibrations causingfrictional heat between mating parts, thereby melting theplastic. The parts are held in a fixture under pressure whilethe ultrasonic energy is applied. The energy is then shut offand the pressure maintained until the weld surface hassolidified. Total weld time is generally around 0.5-1.0second. Standard welder frequencies are 20 kHz,although 40 kHz units are available for small delicate parts.
The major factor determining the quality of an ultrasonicweld is the joint design. The two major types of jointdesigns are shear joints and energy director joints. Thechoice depends on the type of material to be welded andthe end use requirements.
Shear JointA shear joint is more commonly used on semi-crystallinematerials such as nylon* and polyester. Due to their sharpmelting points, semi-crystalline resins often do not achievestrong welds with energy director joints. The moltenmaterial flowing from the weld area quickly resolidifiesbefore welding to the opposite interface.
In a shear joint, a small contact area is initially melted andthen continues down the weld surface as one part isforced into the other. Due to the good material mixingbetween the welded parts, strong structural and hermeticseals can be obtained.
Typical joint designs and interference guidelines are shownin Figure V-17 (a–c). As with energy director joints, flashtraps can be included in the joint design.
* NOTE: Hygroscopic materials such as nylon should bewelded in their •dry as molded• condition to prevent brittlewelds. This can be achieved by welding partssoon after molding, or by placing parts in moisture proofbags to assure dry as molded condition.
Figure V-17 (a). Shear Joint
Illustration credit: •Vibration Welding,• Branson Ultrasonics Corp., 1980.
Figure V-17 (b). Shear Joint (Flash Trap)
Figure V-17 (c). Shear Joint Interference Guidelines
.25 in
30˚– 45˚
INTERFERENCE
Min.LEAD-IN.020 in
DEPTHOF WELD
FIXTURE
Interference
Maximum PartDimension (In)
Interference forSize (Range)
<0.750.75 to 1.50
>1.50
0.008 to 0.0120.012 to 0.0160.016 to 0.020
Part DimensionTolerance (In)
±0.001±0.002±0.003
Assembly
V-12

Energy DirectorAn energy director is a raised triangular bead moldedon one of the joint surfaces. It concentrates ultrasonicenergy causing a rapid initiation of the melt and welding ofthe material.
Energy director joints are normally used for amorphousmaterials. Typical joint designs are shown below in FigureV-18. For appearance parts, flash traps can be designedinto the joint. (Figure V-19.)
*Minimum of .024 in
Figure V-18 (a) & (b). Energy Director
Figure V-19. No Flash
Illustration Credit: Holtz, Richard, •Vibration Welding: Fast, Quiet, Efficient,• AssemblyEngineering, Hitchcock Publishing.
AFTER WELD
W
W64
BEFORE WELD
W
W8
W4
BEFORE WELD AFTER WELD
CLEARANCE
W8
3W8
W4
W
W8
*
CLEARANCE FIT(BOTH SIDES)
W4
W8
3° to 5° DRAFT ANGLEW2
W8
W
3W8
Assembly
V-13

Vibration WeldingVibration welding is a preferred method for assemblinglarge structural parts of the same or very similarthermoplastic parts. In this process, frictional heat isdeveloped by moving the two parts relative to each otherunder pressure. Strong hermetic bonds can be achievedusing this process.
Depending on the equipment (Figure V-20), weldingfrequency is either 120 Hz or 240 Hz with weld peak topeak amplitudes being .060 in.–.140 in. and .030 in.–.065 in.,respectively. Allowance for this amplitude must be builtinto the joint. Weld time is generally 2–3 seconds. Thewelding cycle is described in more detail below.
Figure V-20. Components of a Vibration Welder
Illustration credit: •Designing Parts for Ultrasonic Welding,• •Branson Ultrasonics Corp., 1980.
Standard machines can accept parts up to 16 in. x 24 in.The back and forth motion of vibration welding also helpsto remove surface contaminants such as mold releasefrom the weld area.
One of the main limitations on this welding process is thatthe weld joint must be designed so that the reciprocationmotion takes place on a single plane. However, the planeneed not be flat, it may be bowed or bent as in automotiveintake manifolds. Separate welded areas can beincorporated on parallel planes to the direction of motionon the same part. This method is used to create separatesealed integral gas and oil compartments on chain sawchassis.
A proper holding fixture is critical in achieving a good weld.Care must be taken when designing fixturing to preventunsupported part walls from flexing during welding. A newmethod called orbital vibration welding makes weldingunsupported walls easier by producing a constant circularmotion so no wall is ever perpendicular to the welddirection.
Some common joint designs are shown in Figure V-21,including flash traps to provide for a cosmetic appearance.The flash trap must accommodate the melt area (shadedareas are basically equal in volume).
Figure V-21. Vibration Weld Joints
Illustration Credit: Holtz, Richard, •Vibration Welding: Fast, Quiet, Efficient, AssemblyEngineering,• Hitchcock Publishing.
SPRINGSVIBRATING ELEMENT
ELECTRO-MAGNET
ELECTRO-MAGNET
STATIONARY ELEMENT
0.020in Min.
MELT DOWN0.015in–0.030in
WELDSURFACE
WALLTHICKNESS
Assembly
V-14

Other Assembly Techniques
Thermoplastic StakingStaking (including ultrasonic, heat and hot gas) is acommon assembly technique to join two dissimilarmaterials. A stud configuration or boss molded into one ofthe plastic parts protrudes through a hole or matchingconfiguration in the second part. A specially contouredhorn contacts and melts the top of the stud, forming ahead and locking the second part in place. Staking issimple, fast and permanent. It produces a tight assemblywith a variety of head contours to choose from (FigureV-22 shows a dome configuration).
Figure V-22. Dome Stake
Spin WeldingSpin welding is a fast and practical assembly technique forjoining circular parts or surfaces. Most thermoplastics canbe spin welded, particularly rigid resins. Welds are madeby rotating one part against the other fixed part at highspeed and under pressure. Frictional heat melts bothsurfaces. Rotation is stopped and pressure is maintaineduntil the weld solidifies. Strong, permanent and hermeticwelds can be obtained, but accurate orientation betweenthe parts is difficult. Cycle times are generally 1 to 2seconds and ordinary machinery equipment can be used.Part configuration or a keying feature is needed for rotatinga part.
The welding joint can be either flat, angled or V-shaped,usually with a flange for increased surface area and rigidity.Flash from the weld can also be hidden with special jointdesigns (see Figure V-23).
Where:
t = wall thickness of the part
a = depth of weld. Should be .5 to .8 times thewall thickness.
b = angle of stationary joint interface. Must be30 degrees or greater to avoid jamming.
c+d = weld surface. Should be up to 2.5 timesthe wall thickness.
Figure V-23
Credit: Forward Technology Industries.
Horn
Steel
Plastic
SHEAR JOINT TONGUE & GROOVE
CLEARANCE.002in
1.2 t
1.5 t
.015in – .02in
t
rib rib
rib
t •
ab
dc
a
Assembly
V-15

Electromagnetic WeldingElectromagnetic welding provides a simple, rapidand reliable assembly technique to produce a strongand hermetic joint. A specially designed strand is placedbetween the two parts to be welded. This assembly isthen exposed to an induction heat field which melts thestrand and plastic to form a strong bond at the interface.Our studies show the shear strength of the weld to beabout 5000 psi. A variety of joints can be used as in otherwelding techniques. A tongue and groove joint is shown inFigure V-24.
Figure V-24
Credit: Emabond Systems.
.085in
.040in R
.085in (Min.) .085in
(Min.)
.020in R
.097in
AFTER WELD
.325in
.218in
PROVIDESTOP
.092inEMAWELDSTRAND
.077in
BEFORE WELD
.040in .020in
.020in
.112in
.267in (Min.)
.310in.203in
Assembly
V-16
Part VI
Classification of Plastic Materials. . . . . . . . . . . . . . . . . . . . . . VI–2
Molecular Weight Distribution . . . . . . . . . . . . . . . . . . . . . . . . VI–4
Physical Properties . . . . . . . . . . . . . . . . . . . . . . . . . . . . . . . . VI–5
Density. . . . . . . . . . . . . . . . . . . . . . . . . . . . . . . . . . . . . . . . . . . VI–5
Thermal Expansion. . . . . . . . . . . . . . . . . . . . . . . . . . . . . . . . . VI–5
Thermal Conductivity . . . . . . . . . . . . . . . . . . . . . . . . . . . . . . . VI–6
Plastic Materials
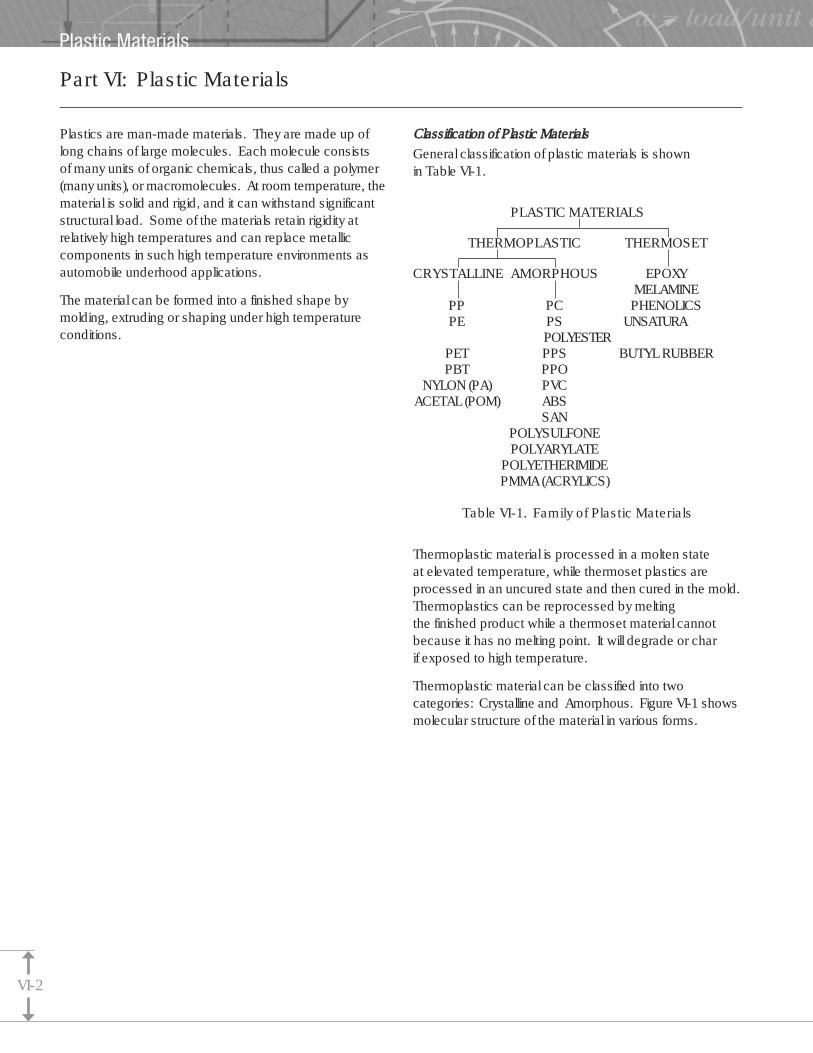
Plastics are man-made materials. They are made up oflong chains of large molecules. Each molecule consistsof many units of organic chemicals, thus called a polymer(many units), or macromolecules. At room temperature, thematerial is solid and rigid, and it can withstand significantstructural load. Some of the materials retain rigidity atrelatively high temperatures and can replace metalliccomponents in such high temperature environments asautomobile underhood applications.
The material can be formed into a finished shape bymolding, extruding or shaping under high temperatureconditions.
Classification oof PPlastic MMaterialsGeneral classification of plastic materials is shownin Table VI-1.
PLASTIC MATERIALS
THERMOPLASTIC THERMOSET
CRYSTALLINE AMORPHOUS EPOXYMELAMINE
PP PC PHENOLICSPE PS UNSATURA
POLYESTERPET PPS BUTYL RUBBERPBT PPO
NYLON (PA) PVCACETAL (POM) ABS
SANPOLYSULFONEPOLYARYLATE
POLYETHERIMIDEPMMA (ACRYLICS)
Table VI-1. Family of Plastic Materials
Thermoplastic material is processed in a molten stateat elevated temperature, while thermoset plastics areprocessed in an uncured state and then cured in the mold.Thermoplastics can be reprocessed by meltingthe finished product while a thermoset material cannotbecause it has no melting point. It will degrade or charif exposed to high temperature.
Thermoplastic material can be classified into twocategories: Crystalline and Amorphous. Figure VI-1 showsmolecular structure of the material in various forms.
Part VI: Plastic Materials
Plastic Materials
VI-2

Figure VI-1. Molecular Configuration of Crystalline Polymers and
Amorphous Polymers
a) Amorphous Polymer Solidb) Folded Chain Polymer Crystalc) Extended Chain • Drawn Polymer Fiberd) Semi-Crystalline Polymer
The molecular structure of crystalline polymers showsperiodic folding of molecules, whereas amorphous polymersconsist of randomly entangled polymer chains.
When heated, the crystalline polymers exhibit a distinct meltingpoint (Tm ) and change from rigid plastic to easy-flowing liquid.Amorphous polymers change their rigidity gradually as thetemperature rises. They start in a rigid state at roomtemperature and get softer above the glass transitiontemperature (Tg ) until they become liquid in the highertemperature regions.
Figure VI-2 shows the temperature dependence of themodulus for various classes of plastics.
Figure VI-2. Mechanical Characteristics of Various Plastics
In real molding conditions, most of the crystalline polymerscannot achieve full crystallinity. Instead, they will formsome crystalline regions and some amorphous regions.Therefore, they are sometimes called semi-crystallinepolymers. The proportion of the two phases depends onthe cooling rate during molding. Faster cooling rates willresult in higher amorphous content, as shown in Figure VI-3 for a Nylon 6 material.
Since a semi-crystalline polymer contains both crystallineand amorphous phases, it exhibits both a glass transitionbehavior and a sharp melting point.
Figure VI-3. Volume vs. Temperature Behavior of Nylon 6
32 100 200 300 400 500 572˚F
500 100 150 200 250 300˚C
1.08
1.04
1.00
0.96
0.92
0.88
0.84
0.80
Amorphous
100% Crystalline
Typical Nylon 6
Temperature
Spe
cifi
c Vo
lum
e
MODULUS
TEMPERATUREAmorphous Thermoplastic
Semi-Crystalline Thermoplastic Thermoset with Transition
Thermoset without Transition
Plastic Materials
aa..bb..
cc..
dd..
VI-3

Molecular Weight DistributionMolecular chain length in plastic materials varies from veryshort to very long, and the distribution of such chainlengths, or molecular weight, creates a form ofbell curve, as shown in Figure VI-4.
Figure VI-4. Molecular Weight Distribution of Polymers
The weight averaged value (Mw) of the molecular weightdistributions affects important physical properties, such asmelt viscosity and part strengths.
The full spectrum of molecular weight distributions can beobtained through an analytic lab technique called GelPermeation Chromatography (GPC). However, thismethod is rather time consuming and costly. A simplemethod to evaluate relative value of a given polymer is touse the Melt Index (MI) method. Molten plastic is placed ina heated capillary chamber, and it is pushed through anozzle by placing a specified weight on a plunger. Theamount of plastic collected at the bottom of the capillary ina given time is called MI, and this number is relatedto the molecular weight of the sample. The higher thenumber, the lower the molecular weight. There are similarbut a little more complicated methods of estimating themolecular weight distribution. They are Formic AcidViscosity (FAV) and Intrinsic Viscosity (IV). FAV is normallyused for Nylon materials, and IV is used for thermoplasticPET materials.
Molecular Weight of Polymers
Mn : Number Average Molecular WeightMw : Weight Average Molecular Weight
•••
Chain LengthI1
I2•••In
Populationn1
n2•••nn
Popu
latio
n N
n2
nn
Chain LengthI1 I2 InMn Mw
n1
Plastic Materials
VI-4
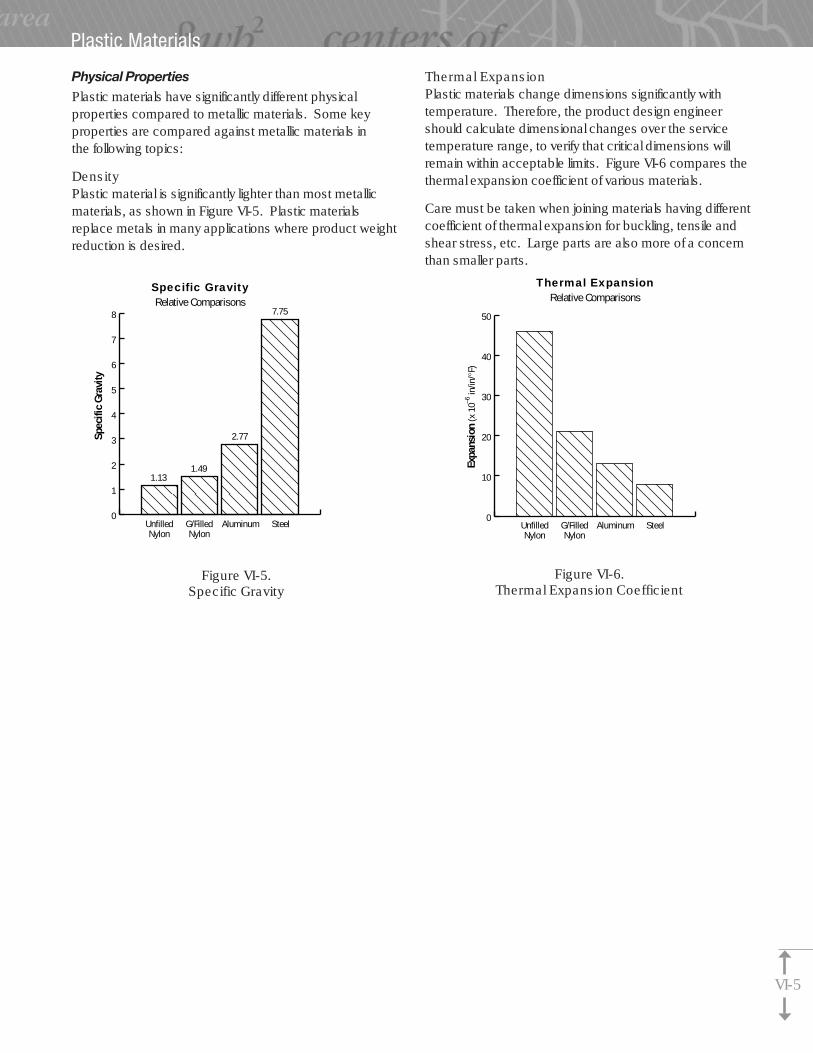
Physical PropertiesPlastic materials have significantly different physicalproperties compared to metallic materials. Some keyproperties are compared against metallic materials inthe following topics:
Density Plastic material is significantly lighter than most metallicmaterials, as shown in Figure VI-5. Plastic materialsreplace metals in many applications where product weightreduction is desired.
Figure VI-5. Specific Gravity
Thermal ExpansionPlastic materials change dimensions significantly withtemperature. Therefore, the product design engineershould calculate dimensional changes over the servicetemperature range, to verify that critical dimensions willremain within acceptable limits. Figure VI-6 compares thethermal expansion coefficient of various materials.
Care must be taken when joining materials having differentcoefficient of thermal expansion for buckling, tensile andshear stress, etc. Large parts are also more of a concernthan smaller parts.
Figure VI-6. Thermal Expansion Coefficient
Thermal ExpansionRelative Comparisons
UnfilledNylon
G/FilledNylon
Aluminum Steel0
10
20
30
40
50
Expa
nsio
n (x
10–6
in/in
/°F)
0
1
2
3
4
5
6
7
8
1.131.49
2.77
7.75
Specific GravityRelative Comparisons
Spec
ific
Grav
ity
UnfilledNylon
G/FilledNylon
Aluminum Steel
VI-5
Plastic Materials

Thermal ConductivityPlastic materials do not conduct heat well and are about twoorders of magnitude less conductive than the metals.Plastic is then a good thermal insulator. This thermalcharacteristic can be a positive or negative factor dependingon the application. Figure VI-7 shows thermal conductivitiesof various plastic materials as compared to other materials.
AluminumAluminum
CopperCopper
1.0
Absolute Temperature °R200 400 600 800 1000 2000 3000 4000
30% Glass FilledPBT
30% Glass FilledNylon
ABS Polyethylene
AcetalPolypropyleneNylon
Polycarbonate
Polystyrene
PolyvinylChloride
.9
.8
.7
.6
.5
.4
.3
.2
.1
.09
.08
.07
.06
.05
.04
Zinc (solid)Zinc (solid)
Sodium (liquid)Sodium (liquid)
Zinc (liquid)Zinc (liquid)
Alloy SteelsAlloy Steels
Potassium (liquid)Potassium (liquid)
High Alloy SteelsHigh Alloy SteelsLead (liquid)Lead (liquid)
Magnesite BrickMagnesite Brick
Silica BrickSilica Brick
Missouri FirebrickMissouri Firebrick
400
200
1008060
20
40
1086
4
2
1.00.80.6
0.4
0.2
0.10.080.06
0.04
0.02
0.010.0080.006
0.004
IceIce
WaterWater
AirAir
IronIron
PLASTICS
Diatomaceous Earth10 lb/ft3
Benzene (gaseous)
Methane Carbon Dioxide
Low Carbon Steels
Figure VI-7. Thermal Conductivities of Solids, Liquids and Gases with Temperature
Illustration credit: Arpaci, Vedal S., “Convection Heat Transfer,“ Addison-Wesley.
Ther
mal
Con
duct
ivity
Btu
hr-1
ft-1
F-1
Plastic Materials
VI-6

Part VII
The Mechanical Properties of Plastics . . . . . . . . . . . . . . . . VII–2
Short-Term Properties . . . . . . . . . . . . . . . . . . . . . . . . . . . . . VII–2
Notches . . . . . . . . . . . . . . . . . . . . . . . . . . . . . . . . . . . . . . . . . VII–2
Rate of Loading. . . . . . . . . . . . . . . . . . . . . . . . . . . . . . . . . . . VII–2
Temperature . . . . . . . . . . . . . . . . . . . . . . . . . . . . . . . . . . . . . VII–4
Thermal Aging. . . . . . . . . . . . . . . . . . . . . . . . . . . . . . . . . . . . VII–4
Moisture. . . . . . . . . . . . . . . . . . . . . . . . . . . . . . . . . . . . . . . . . VII–5
Dimensional Considerations (Moisture Absorption). . . . . . VII–6
Effects of Moisture . . . . . . . . . . . . . . . . . . . . . . . . . . . . . . . . VII–6
Dimensional Changes . . . . . . . . . . . . . . . . . . . . . . . . . . . . . VII–6
Accelerated Moisture Conditioning. . . . . . . . . . . . . . . . . . . VII–6
Process Induced Property Variations . . . . . . . . . . . . . . . . . VII–7
Additives (Color) . . . . . . . . . . . . . . . . . . . . . . . . . . . . . . . . . . VII–8
Ultraviolet (UV) Light . . . . . . . . . . . . . . . . . . . . . . . . . . . . . . . VII–8
Chemicals . . . . . . . . . . . . . . . . . . . . . . . . . . . . . . . . . . . . . . . VII–8
Long-Term Properties–Creep, Stress Relaxation
and Service Life . . . . . . . . . . . . . . . . . . . . . . . . . . . . . . . VII–9
Coefficient of Friction . . . . . . . . . . . . . . . . . . . . . . . . . . . . . . VII–11
Physical Properties

The Mechanical Properties of PlasticsThe mechanical properties of plastic materials can varydepending on the service environments, the duration ofthe service loading, types of loading, part configuration,etc. So the short-term properties cannot be applied tolong-term applications. Therefore, design engineersshould obtain property data that is applicable to theservice conditions and life expectancy of the product.
Definitions of various physical properties and terminologiesare listed in Appendix I, at the end of this guide.
Short-Term PropertiesStandard mechanical properties are normally obtained bytest methods as specified by the American StandardTesting Materials (ASTM) or by the International StandardOrganization (ISO) methods. These two standards arecross referenced in Appendix II. You can find theseproperties for individual resins listed in BASF’s product datasheets. (Product data on all our individual resins is alsoavailable via the Internet. Call BASF for details.)
Figure VII -1. Test Specimens
Test specimens used for some standard test methods areshown in Figure VII-1. The material properties, however, canbe affected significantly by the following factors:
NotchesNotches or sharp corners introduce stress concentrationsand can induce premature failures, especially duringimpact. Sudden change of cross-sections are to beavoided when designing with plastics.
Resistance of material to the combined effects of notchesand impact is measured by the Notched Izod Impact Test.The notched Izod specimen geometry is shown in FigureVII-2. The influence of the notch radius on the impactresistance is shown in Figure VII-3 and it indicates thenotch sensitivity of materials. Impact resistance ofmaterials is better measured by drop weight impactloading (see Figure VII-4 for testing method). It producessignificantly different ranking of materials compared withthose obtained by the notched Izod test method, asshown in Figure VII-5.
Rate of Loading Higher rates of loading tend to reduce elongation of aplastic material, and it can result in brittle failures. Somematerials are more resilient to such rapid loading effectsthan others.
DROP WEIGHTIMPACT
TENSILE TYPE I I
FLEX, DTUL, IZOD, FLAME
TENSILE IMPACT
Part VII: Physical Properties
Physical Properties
VII-2

Figure VII-2. Impact Specimen
Figure VII-3. Izod Impact Strength vs. Notch Radius
Figure VII-4. Drop Weight Impact Test
Figure VII-5. Drop Weight Impact Values vs. Izod ImpactValues of Various Engineering Thermoplastics
Tube(Cross - Section)
Cross SectionSpecimen/Ring
Top Weight
Detail
Specimen
Top View
Ring
OO
2
4
6
8
10
12
5 10 20 40 60 80 100
GENE
RAL
PURP
OSE
8202
(2.5
% M
.C.)
ULTRAMID COPOLYMER 8253 (DRY)
GENERAL PURPOSE 8202 (DRY)
GLASS REINFORCED NYLON (DRY)
Notch Radius, 1/1000 inch
Izo
d I
mp
ac
t ft
–lb
/inc
h o
f n
otc
h
Drop Weight(ft-lbs)
IZOD(ft-lbs/in notch)
Polycarbonate >180Nylon 6 135Modified Nylon 6/6 125Nylon 6 Copolymer 125PBT 95Nylon 6/6 75Nucleated Nylon 6 7530% GR Nylon 6 3.020% GR Polycarb 2.030% GR Nylon 6/6 1.530% GR PBT 1.0
Polycarbonate 12.0Modified Nylon 6/6 3.0Nylon 6 Copolymer 2.5Modified PPO 1.920% GR Polycarb 1.830% GR PBT 1.330% GR Nylon 6 1.3PBT 0.8Nylon 6/6 0.6Nylon 6 0.5Nucleated Nylon 6 0.4
.400
1.250
2.500
.500
45°
.010 R
Physical Properties
VII-3

Temperature Properties of plastics change significantly withtemperature. Typical property changes with temperatureare shown in Figure VII-6. Property values correspondingto the service temperature should be used for designing aplastic part. Deflection Temperature Under Load (DTUL) issometimes used for screening high temperature gradematerials. The test apparatus is illustrated in Figure VII-7.However, this test method is based on a specific deflectionduring test rather than a total time history. Results shouldbe used in combination with other inputs.
Figure VII-6. Tensile Stress-Strain Curve ofPetra 130 at Various Temperatures
Figure VII-7. DTUL Apparatus
Thermal Aging Plastic degrades under extended exposure to hightemperature environment. Figure VII-8 shows the effect ofheat aging on an Ultramid® nylon product. And Figure VII-9shows how extensive heat aging affects thermoplastics.
HEATED LIQUID MEDIA
SPECIMEN
THERMOMETER
DIALINDICATOR
LOAD
-40° C (-40°F)
23° C (73°F)
93° C (200°F)
149° C(300° F)
STRAIN (% ELONGATION )
TENS
ILE
STRE
SS (p
si)
Physical Properties
VII-4

Figure VII-8. Heat Aging Effect
Figure VII-9. Fatigue Life of Petra 130Before and After Heat Aging
MoistureNylon 6 or 6/6 absorb moisture from the air andenvironment. Mechanical properties and dimensionswill change depending on the amount of the absorbedmoisture. Figure VII-10 shows the flexural moduluschange due to temperature and moisture. (See•Dimensional Considerations • Moisture Absorption•in Part VII of this guide.)
Figure VII-10. Flexural Modulus vs. Temperature and Moisture of Ultramid ® 8202
Flex
ural
Mod
ulus
(x 1
03 ps
i)
0
100
200
300
400
100 200 300 350
Key: DAM 50% R.H.
Temperature (°F)
Stre
ss, K
psi
10
8
6
4
2
0
Number of Cycles to Failure
Key: As Molded Heat Aged 650 Hrs at 400°F
1E3 1E4 1E5 1E6 1E7 1E8
Effect of heat aging on tensile strength of ULTRAMID 8233G HS BK-102%
Rete
nsio
nTe
nsile
Stre
ngth
�
�
�
�
��
125
100
75
50
25
05000 1000 1500 2000
Time (Hours)
Key: - 250°F (121°C) - 300°F (149°C) - 350°F (177°C)
Physical Properties
VII-5

Dimensional Considerations (MoistureAbsorption)
Effects of MoistureAll nylons are hygroscopic. The amount and rate ofmoisture absorbed from the atmosphere depends upon theambient humidity and temperature. A study performed byBASF showed that the annual average relative humiditythroughout the USA varies between 40% to 60%.
Design engineers should account for moisture effectswhen designing parts with nylon. The conventionalpractice is to choose 50% relative humidity at 73°F andbase the design on property values at this condition.
Nylon will increase in impact resistance, toughness andsize, while its strength and stiffness properties willdecrease as it absorbs moisture. The time it takes fornylon to come to equilibrium depends on the thickness.The moisture absorption rate is shown in Figure VII-11 forUltramid 8233 (33% GR Nylon).
Figure VII-11
Dimensional ChangesNylon parts will expand with exposure to moisture, as canbe seen in Figure VII-12. These changes are small andneed only be considered for applications with very largedimensions or very tight tolerances.
Figure VII-12
Accelerated Moisture ConditioningSome applications having critical dimensional, property, orimpact requirements may need moisture conditioning priorto use or testing. Submerging the parts in roomtemperature water or high temperature water canaccelerate the time to achieve the design moisture content(Compare Figure VII-11 with Figure VII-13.)
Once at the new average condition, further dimensionalchanges will be minimal.
See Dimensional Considerations manual for other materials.
Figure VII-13
TIME (HRS.)
MO
ISTU
RE
CON
TEN
T
Ultramid® 8233ROOM TEMPERATURE WATER
TIME (HRS.)
MO
ISTU
RE
CON
TEN
T
Ultramid® 8233180° F WATER
10
5
2
1
0.5
0.2
2 5 10 20 50 100
10
5
2
1
0.5
0.2
0.2 0.5 1.0 2 5 10
0.060 in 0.060 in
0.125 in 0.125 in
0.250 0.250
3.0
2.5
2.0
1.5
1.0
0.5
02 4 6 8 10 12
0.060 in 0.125 in
0.250 in
TIME (MONTHS)
MO
ISTU
RE
CON
TEN
T
MOISTURE CONTENT vs. TIME50% RH & 73° F
8233 33% GLASS REINFORCED AT DIFFERENT THICKNESS
RELATIVE HUMIDITY (%)
DIM
ENSI
ONAL
CHA
NGE
(mils
/in)
EQUI
LIBRI
UM M
OIST
URE C
ONTE
NT (%
)
8233
25
20
15
10
5
0
10
8
6
4
2
020 40 60 80 100
Dimensional ChangeKey:Equilibrium Moisture Content
Physical Properties
VII-6
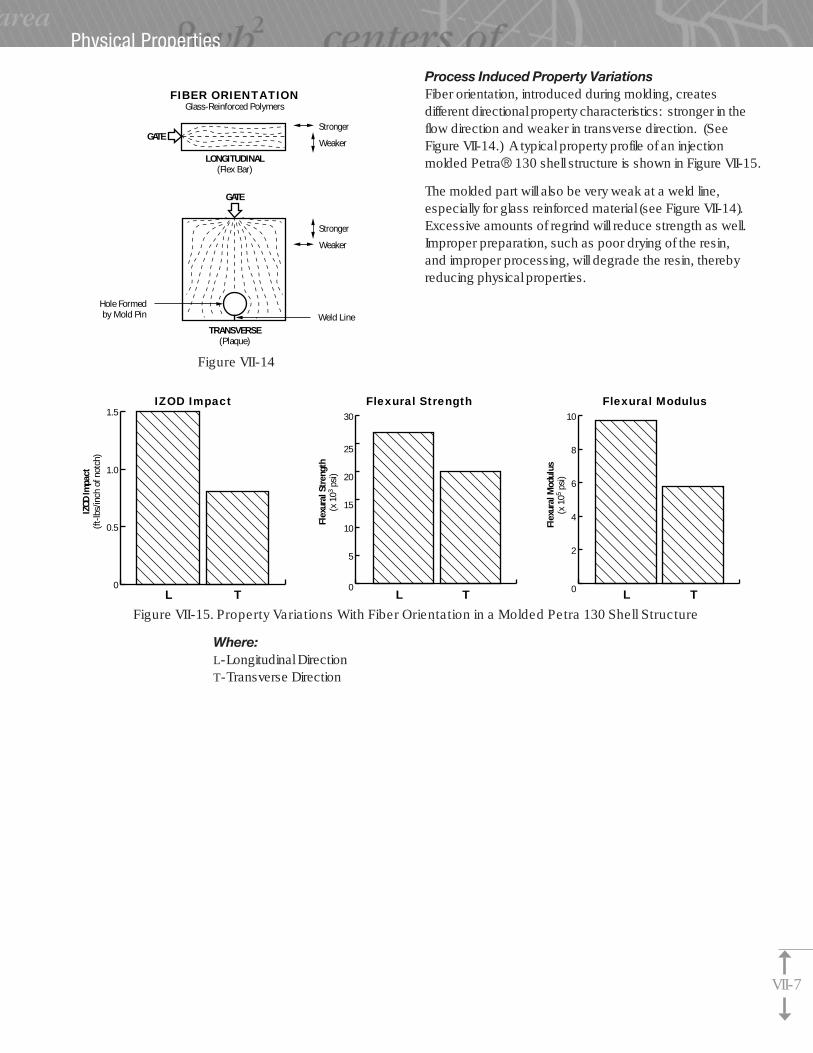
Figure VII-14
Process Induced Property VariationsFiber orientation, introduced during molding, createsdifferent directional property characteristics: stronger in theflow direction and weaker in transverse direction. (SeeFigure VII-14.) A typical property profile of an injectionmolded Petra® 130 shell structure is shown in Figure VII-15.
The molded part will also be very weak at a weld line,especially for glass reinforced material (see Figure VII-14).Excessive amounts of regrind will reduce strength as well.Improper preparation, such as poor drying of the resin,and improper processing, will degrade the resin, therebyreducing physical properties.
GATE
LONGITUDINAL(Flex Bar)
GATE
TRANSVERSE(Plaque)
FIBER ORIENTATIONGlass-Reinforced Polymers
Stronger
Weaker
Weld LineHole Formedby Mold Pin
Stronger
Weaker
L T
Flexural Strength
Flex
ural
Str
engt
h(x
103 p
si)
0
5
10
15
20
25
30
L T
Flexural Modulus
Flex
ural
Mod
ulus
(x 1
05 psi
)
0
2
4
6
8
10
0
0.5
1.0
1.5
TL
IZOD Impact
IZOD
Impa
ct(ft
-lbs/
inch
of n
otch
)
Figure VII-15. Property Variations With Fiber Orientation in a Molded Petra 130 Shell Structure
Where:L-Longitudinal DirectionT-Transverse Direction
Physical Properties
VII-7

Additives (Color)Carbon black or colorants do affect strength. The influenceof colorants varies, depending on the ingredients andquantity used to achieve a specific color.
Ultraviolet (UV) Light Ultraviolet light affects the polymer structure chain andreduces the physical properties of plastics. Most of thedegradation is localized to the outermost layer so the overallstrength decay is minimal. However, the surfaceappearance can be significantly affected. Special UVresistant grades are available from BASF. These grades areformulated to extend the surface appearance, and therefore,service life of the material.
Chemicals Certain chemicals attack plastics and reduce their physicalproperties. Each polymer behaves differently whenexposed to various chemicals. A design engineer shouldrefer to the chemical resistance table for each material (Seethe Chemical Resistance Guide) to make sure the serviceenvironment is not harmful to the plastic material beingused, and testing is recommended.
Physical Properties
VII-8

Long-Term PropertiesCreep, Stress Relaxation and Service LifeWhen a load is applied on a plastic part, the part willelongate or collapse with time. The amount of theelongation depends on the magnitude of the load,duration, and if the load is constant or diminishing withtime. Such time dependent change is called creep. Thecreep phenomenon is illustrated in Figure VII-16(a).
When a sustained load is applied Figure VII-16(a), creep willcontinue and lead to eventual failure. On the other hand, ifthe load is applied and then fixed, the stress will decreasewith time Figure VII-16(b). This last case is called stressrelaxation. One can observe this phenomenon in plastic assemblies such as mechanically fastened plastic components.
Figure VII-16. (a) & (b) Creep and Stress Relaxation Phenomena
w
w
Lo + ∆ L Lo Lo + ∆LLo + ∆LLo + ∆L + ∆c Lo
∆c = Creep
Time = 1 Min.
Time = 1 Min.
Time = T
Time = T
∆L ∆L ∆L ∆L
a) Tensile Creep(Sustained Load)
b) Stress Relaxation(Diminishing Load)
Initial Strain(short-term
creep)
Force Gage Reading
Force Gage
Reading
Physical Properties
VII-9

The creep strain is added to the initial elastic strain to arriveat a total strain. Elastic strain can be recovered immediatelyupon release of the load. Creep strain does not recoverimmediately but takes time to recover after the load isremoved. Generally, a significant portion of the creep strainis unrecoverable. The amount of the creep strain and therate of elongation depends on the applied load. The higherthe load or stress, the higher the strainand the faster the rate. See Figure VII-17.
Figure VII-17. Creep Strain ShowingStress and Time Dependency
The rate of the stress decay takes place faster with a higher initial stress level, as shown in Figure VII-18.Based on this principle, reducing stress in a mechanical fastening application reduces the clampingforce decay.
The amount of deformation and failure time depends onthe stress level. If the failure time is plotted against theapplied stress level on a log-graph, an approximatelinear relationship can be found. One can now predictthe service life of a part under sustained loading.Extrapolation of a curve for more than one decade in thetime scale is not recommended. Examples of the servicelife prediction scheme are shown in Figures VII-19 and 20.
Figure VII-18. Compressive Relaxation of 33% Glass Reinforced Nylon
S t/S
0
50 100 150 200Time (Hours)
.6
.7
.8
.9
1.0
0
- SO = 5,000 psi - SO = 10,000 psi - SO = 15,000 psi
Legend:
Increasing Stress
101 102 103 104 105
Time, Hours
Log,
Cre
ep S
train 3
2
1
3 2 1
Physical Properties
VII-10
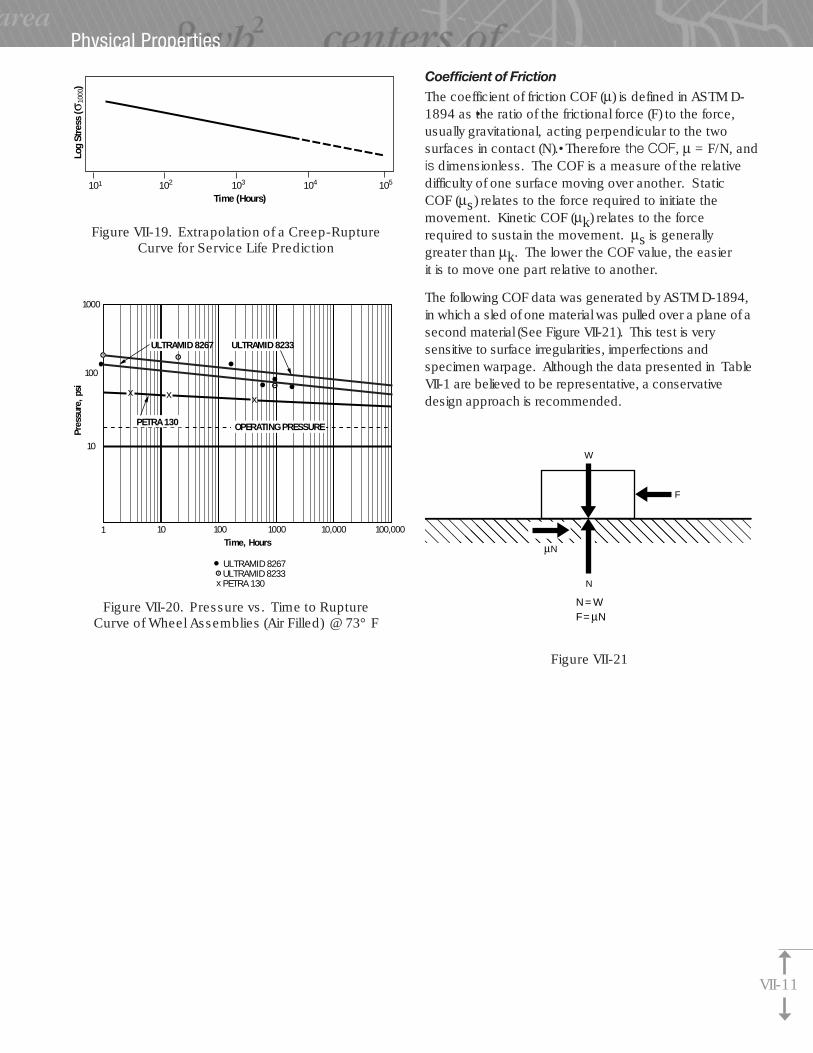
Figure VII-19. Extrapolation of a Creep-RuptureCurve for Service Life Prediction
Figure VII-20. Pressure vs. Time to RuptureCurve of Wheel Assemblies (Air Filled) @ 73° F
Coefficient of FrictionThe coefficient of friction COF (µ) is defined in ASTM D-1894 as •the ratio of the frictional force (F) to the force,usually gravitational, acting perpendicular to the twosurfaces in contact (N).• Therefore the COF, µ = F/N, and is dimensionless. The COF is a measure of the relativedifficulty of one surface moving over another. StaticCOF (µs) relates to the force required to initiate themovement. Kinetic COF (µk) relates to the forcerequired to sustain the movement. µs is generallygreater than µk. The lower the COF value, the easierit is to move one part relative to another.
The following COF data was generated by ASTM D-1894,in which a sled of one material was pulled over a plane of asecond material (See Figure VII-21). This test is verysensitive to surface irregularities, imperfections andspecimen warpage. Although the data presented in TableVII-1 are believed to be representative, a conservativedesign approach is recommended.
Figure VII-21
101 102 103 104 105
Time (Hours)
Log
Stre
ss (σ
1000
)
1000
100
10
•�•�•�•�
•�
x x x
1 10 100 1000 10,000 100,000Time, Hours
Pres
sure
, psi
ULTRAMID 8267 ULTRAMID 8233
PETRA 130 OPERATING PRESSURE
• ULTRAMID 8267�
ULTRAMID 8233 x PETRA 130
��N
µN
W
F
N = WF = µN
Physical Properties
VII-11

PRODUCT
ULTRAMID®
8200 HS 0.26 0.21 0.17 0.168202C HS 0.53 0.33 0.24 0.168224 HS 0.48 0.47 0.23 0.178253 HS 0.33 0.32 0.25 0.168254 HS BK-102 0.48 0.47 0.32 0.228350 HS 0.35 0.32 0.25 0.178351 HS BK-102 0.4 0.35 0.25 0.18D-8358 HS BK-102 0.39 0.38 0.25 0.198233G HS 0.34 0.32 0.25 0.168267G HS 0.3 0.22 0.23 0.17D-8333G HS GY5723 0.34 0.32 0.26 0.178360 HS 0.41 0.22 0.23 0.15
PETRA•
130 0.22 0.21 0.15 0.13230 0.37 0.27 0.2 0.15D-242 BK-112 0.33 0.32 0.21 0.16132 0.33 0.32 0.18 0.15
ULTRAMID and PETRA are registered trademarks of Basf Inc.
POLYMER-TO-POLYMER POLYMER-TO-STEEL
STATIC KINETIC STATIC KINETIC
Table VII-1. Coefficient of Friction
Physical Properties
VII-12
Part VIII
Hollow Molding . . . . . . . . . . . . . . . . . . . . . . . . . . . . . . . . . . . VIII–2
Short Shot Molding. . . . . . . . . . . . . . . . . . . . . . . . . . . . . . . . VIII–3
Full Shot Molding . . . . . . . . . . . . . . . . . . . . . . . . . . . . . . . . . VIII–3
Gas Assist Molding

Gas assist molding is used to partially core out thicksections. It produces large, dimensionally stable parts withgood surface and mechanical properties. The processcan also lower costs because it reduces cycle times anduses less material.
Gas assist molding is a form of injection molding in whichthe mold cavity is partially filled with molten plastic followedby injecting an inert gas, usually nitrogen, into the melt.Depending on the process, the gas can be introducedthrough the machine nozzle, into the runner, or into thepart itself. The gas pressure is maintained until it is ventedjust prior to part ejection. In this way, the gas takes up thevolume shrinkage of the plastic as it cools, packing outsink marks and greatly reducing molded-in stress that cancause the part to warp.
There are generally three ways gas assist moldingis utilized:
1. Hollow Molding2. Short Shot3. Full Shot
Hollow MoldingThis method is normally used to core out parts like chairarms and various types of handles, including those foundon chain saws, cars and large appliances. The final cross-section is determined by part geometry, gas and resinflow, material type, and filler content. Some commoncross-sections are shown in Figure VIII-1. The maximumcircular area is generally limited to 1.25in.
(A) A circular core is
produced during
Phase 2 Flow that
retains its form during
Phase 3 Packing.
(B) A rectangular form
produces thicker
sections on shorter
sides.
(C) Offset Phase 2 Flow
produces solid
sections on the
opposite side.
Phase 1. Plastic InjectionPhase 2. Gas InjectionPhase 3. Packing final channel shape
Figure VIII-1
Reference: ‘‘Application of Gas Injection Technology’’ by Matthew Sayer, Cinpress,Ltd.
��Phase 2 Flow
Largest Circular Area 1.25 in max.
Cooling Effect of Surrounding Metal��������
Part VIII: Gas Assist Molding
Gas Assist Moldings
VIII-2

Short Shot MoldingThis version is normally used for structural parts whereheavy ribs are desired for stiffness. The gas channels aregenerally positioned so the gas will flow along the base ofribs and under bosses, thus packing out sink marks. Theycan also be run along the base of the side walls to helpstiffen the part and prevent warpage. Some designexamples of these channels are given in Figure VIII-2.
A. Vertical Rib
B. Bridge Rib
C. Sidewall
D. Sidewall
E. Channels Created Using Form
Figure VIII-2Reference: ‘‘Design Tips for Gas-Assisted Injection Molding,’’ diagram of rib
designs by Indra Baxi of Sajar Plastics, Plastics Design Forum, (July/August, 1990)
Full Shot MoldingHere the mold cavity is filled completely with plastic beforethe gas is applied. The coring is limited to the volumeshrinkage of the plastic. This is primarily used for highlyaesthetic parts where elimination of sink marks is critical,especially those that will be painted or chrome-plated,such as mirror housings or door handles.
���������
�����
Gas Assist Moldings
VIII-3

Part IX
Electroplating . . . . . . . . . . . . . . . . . . . . . . . . . . . . . . . . . . . . . IX–2
Painting . . . . . . . . . . . . . . . . . . . . . . . . . . . . . . . . . . . . . . . . . . IX–2
Printing/Hot Stamping . . . . . . . . . . . . . . . . . . . . . . . . . . . . . . IX–2
Machining . . . . . . . . . . . . . . . . . . . . . . . . . . . . . . . . . . . . . . . . IX–3
Surface Treatment . . . . . . . . . . . . . . . . . . . . . . . . . . . . . . . . . IX -3
Finishing
Electroplating The mineral reinforced nylon 6 material (Ultramid® 8260),which is designed to accept plating, results in excellentplating adhesion and appearance. Plating can be used toenhance conductivity, shielding and/or aesthetics. Anelectrolytic pre-plating process of copper or nickelprepares the surface for final electroplating of copper,nickel and chrome in that sequence. Other platingmaterials can also be used where desired. Good designpractice for an effective end product includes:
a) avoiding deep cavities or sharp corners
b) application of abundant radii to avoidplating build-up.
Deep pockets can be expected to be void of plating.Special surface preparation may be needed in somecases. The total thickness of plating is in the range of.001in to .005in. Refer to BASF’s Finishing Manual for moredetailed information.
Painting Most plastics accept paint systems well, especially theamorphous resins. With special preparation of the surfacefor better adhesion (cleaning is essential), even the moredifficult plastics, i.e., PE, PP and Acetal, which have moreslippery surfaces and chemical resistance, can be painted.
BASF materials will accept paint systems well. Nylon andPET are excellent resins for paint applications, especiallywhere high-temperature curing is required. Their ability totolerate high temperatures for long periods of time withoutsoftening is a key advantage.
Printing/Hot StampingAll known printing methods are effective when using BASFmaterials. Occasional surface preparation may be neededfor improved adhesion quality. A well-cleaned surface isthe most important preparation for quality adhesions.
Part IX: Finishing
Finishing
IX-2

Machining Nylon and PET are readily machinable using conventionalmetal-cutting equipment. Cutting techniques for plasticsare different than those for metals, and specialpreparations should be taken. When cutting, you shouldremember to:
• Provide for cooling during the cutting process.
• Maintain a sharp tool with relief after the cut,especially for reinforced resins.
• Provide good support at the cutting area.
• Apply low cutter forces.
• Use carbide where possible.
• Use cutting points with a radius.
Surface TreatmentA designer can chose from a variety of surface treatmentsand plastic colors. Both can be molded into the plasticpart and require no further finishing operations. Theinjection molding process will accurately duplicate themold surface. Part function and/or aesthetics usuallydictate the surface requirements. A smooth, uniformsurface is often preferred for plating and painting, and highgloss is popular on many consumer applications.However, matte or textured surfaces are also attractive,are less slippery, provide contrast, hide sink marks, anddisguise wear and abuse.
Specifying mold finish has often been arbitrary orneglected completely. A practical guide to surface finishselection is the SPI Mold Finish Guide which is availablefrom the Society of the Plastics Industry. The finish shouldbe specified by SPE/SPI number where possible.
Uniform matte and textured mold surfaces are usually lesscostly than a high polish and can be obtained by vaporblast or glass blast, while machining or chemical etchingcan produce a variety of patterns and textures. A wideselection of textures are available from companies thatspecialize in mold engraving.
Finishing
IX-3

Part A1
Anisotropy . . . . . . . . . . . . . . . . . . . . . . . . . . . . . . . . . . . . . . . A1–2
Brittleness . . . . . . . . . . . . . . . . . . . . . . . . . . . . . . . . . . . . . . . A1–2
Density . . . . . . . . . . . . . . . . . . . . . . . . . . . . . . . . . . . . . . . . . . A1–2
Ductility. . . . . . . . . . . . . . . . . . . . . . . . . . . . . . . . . . . . . . . . . . A1–2
Elasticity . . . . . . . . . . . . . . . . . . . . . . . . . . . . . . . . . . . . . . . . . A1–2
Friction and Wear . . . . . . . . . . . . . . . . . . . . . . . . . . . . . . . . . A1–2
Hardness . . . . . . . . . . . . . . . . . . . . . . . . . . . . . . . . . . . . . . . . A1–2
Isotropy . . . . . . . . . . . . . . . . . . . . . . . . . . . . . . . . . . . . . . . . . A1–2
Lubricity . . . . . . . . . . . . . . . . . . . . . . . . . . . . . . . . . . . . . . . . . A1–2
Mold Shrinkage. . . . . . . . . . . . . . . . . . . . . . . . . . . . . . . . . . . A1–3
Notch Sensitivity . . . . . . . . . . . . . . . . . . . . . . . . . . . . . . . . . . A1–3
Plasticity. . . . . . . . . . . . . . . . . . . . . . . . . . . . . . . . . . . . . . . . . A1–3
Specific Gravity (Relative Density) . . . . . . . . . . . . . . . . . . . . A1–3
Toughness. . . . . . . . . . . . . . . . . . . . . . . . . . . . . . . . . . . . . . . A1–3
Warpage . . . . . . . . . . . . . . . . . . . . . . . . . . . . . . . . . . . . . . . . A1–3
Water Absorption . . . . . . . . . . . . . . . . . . . . . . . . . . . . . . . . . A1–3
Appendix I: Physical Propertiesand Terminology

Density, specific gravity, mold shrinkage, water absorption,elasticity, plasticity, ductility, toughness, brittleness, notchsensitivity, tribological (lubricity and abrasive resistance)properties, anisotropy and isotropy are crucial physicalproperties determining the usefulness and durability of aplastic. These terms and others are defined below.
AnisotropyAnisotropic material properties depend on the direction inwhich they are measured. Glass and mineral reinforcedthermoplastics have a high degree of propertydependence on orientation of fiber reinforcement.
BrittlenessBrittleness is the opposite of toughness. As a rule,reinforced thermoplastics show higher stiffness and lowerimpact properties, or more brittleness thanunfilled plastics.
DensityThe density of plastics is the mass in air per unit volume ofmaterial at 23° C (73° F), expressed in pounds per cubicinch or grams per cubic centimeter.
DuctilityThe ability of plastic to be stretched, pulled or rolled intoshape without destroying its integrity. Typical ductile failureof plastics occurs when molecules slide along or past eachother.
ElasticityElasticity is the ability of material to return to its original sizeand shape after being deformed. Elastic limit is thegreatest stress which a material is capable of sustainingwithout any permanent strain remaining upon completerelease of stress. It is expressed in force per unit area.The elastic region is very important for linear analysis (FEA)of thermoplastic components. Most plastic materials havelimited elasticity.
Friction and WearFriction is resistance against change in the relativepositions of two bodies touching one another. If the plasticin the area of contact is loaded beyond its strength, wearor abrasion will take place. Although plastics may not beas hard as metal, their resistanceto abrasion and wear may still be excellent.
HardnessHardness is closely related to wear resistance, scratchresistance, strength, stiffness, and brittleness. The varioushardness tests provide different behavior characteristicsfor plastics:
—the resistance of a material to indentation byan indentor;
—the resistance of a material to scratching by anothermaterial;
—the measurement rebound efficiency or resilience.
IsotropyAn isotropic material is a material that retains the samephysical properties when measured in any direction.
LubricityLubricity refers to the load-bearing characteristics of aplastic under conditions of relative motion. Those withgood lubricity tend to have a low coefficient of frictioneither with themselves or other materials and have notendency to gall.
Appendix I: Physical Properties and Terminology
Physical Properties and Terminology
AI-2

Mold ShrinkageMold shrinkage is the amount of contraction from moldcavity dimensions that a molded part exhibits after removalfrom the mold and cooling to room temperature. Moldshrinkage starts the very moment plastic is injected intothe cavity of a closed mold, so optimum mold design willchoose the best gate(s) position, runner diameter, cycletimes, and the smoothest flow path to prevent excessiveshrinkage or differential shrinkage across the whole part.
For a given material, mold shrinkage can vary with designand molding variables, such as part walls thickness, flowdirection, and injection molding conditions. Moldshrinkage is very important for concurrent design, formaterial substitution (plastic for metal; plastic for plastic)and for specific applications.
Notch SensitivityNotch sensitivity is the ability of crack propagation througha plastic from existing stress concentration areas (sharpcorners, grooves, holes, abrupt changes in the cross-sectional area). In evaluating plastics for a particularimpact or cyclic loading condition, design variables (stressconcentration areas) are quite important.
PlasticityPlasticity is the ability of material to preserve the shape andsize to which it is formed. Plasticity occurs when thestress goes beyond yield strength on the stress-straincurve for plastic. Increases in temperature affect plasticityof plastic materials.
Specific Gravity (Relative Density)The specific gravity (relative density) is the ratio of the massin air of a unit volume of the impermeable portion of thematerial at 23°C (73°F) to the mass in air of equal density ofan equal volume of gas-free water at same temperature.
ToughnessToughness refers to the ability of plastic to absorbmechanical energy without fracturing. This process isdone with both elastic and plastic deformation. Materialtoughness is often measured as the area under the stress-strain curve. As a rule, unfilled resins have excellenttoughness. Sometimes the toughness is measured by theamount of energy consumed to generate unit area of afracture surface.
WarpageComplex shapes of the finished part promote varyingcontraction rates relative to molded part dimensions andcan cause internal stress to build up during the cool-downprocess while molding. This can cause warpage.
The warpage and plastic part-distortion can be caused byinternal stresses generated by non-uniform shrinkage. Partwarpage can be significantly greater than the in-plane moldshrinkage value.
Water AbsorptionWater absorption is the percentage of increase in theweight of a plastic part during its immersion in water, orexposure to a humid air environment. Plastic parts(materials) can be either absorbent (hygroscopic) or non-absorbent (non-hygroscopic). Most engineering plasticsshow absorbent tendencies in their dry conditions(DAM–dry as molded). Plastic parts absorb water by directexposure or from airborne water vapors at a rate specific toeach material. Standard test specimens of a materialwhose physical property values would be appreciablyaffected by exposure to high temperatures in theneighborhood of 110°C (230°F) shall be dried in an ovenfor 24 hours at 50°C (122°F), cooled in a desiccator, andimmediately weighed to the nearest 0.0001g. Generally,the rate of water absorption is measured when a material isexposed to 50% relative humidity air (50% RH). Saturationis given by percentage of part dry weight. The presence ofwater (water absorption) in the plastic part influences itsphysical, mechanical and electrical properties, as well asdimensional stability. Moisture inthe resins before molding, unless removed by dryingprior to processing, can cause serious degradation ofphysical properties.
Physical Properties and Terminology
AI-3

Part A2
Appendix II: ISO and ASTMTest Methods
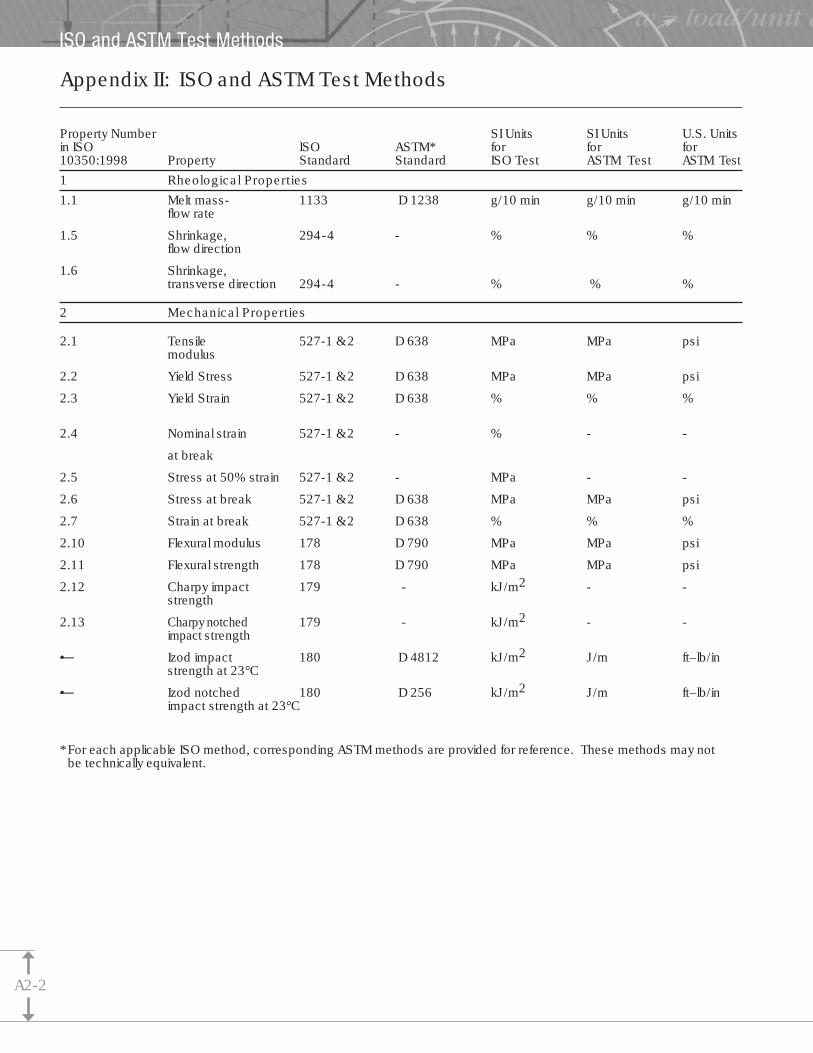
Property Number SI Units SI Units U.S. Unitsin ISO ISO ASTM* for for for10350:1998 Property Standard Standard ISO Test ASTM Test ASTM Test
1 Rheological Properties
1.1 Melt mass- 1133 D 1238 g/10 min g/10 min g/10 minflow rate
1.5 Shrinkage, 294-4 - % % %flow direction
1.6 Shrinkage,transverse direction 294-4 - % % %
2 Mechanical Properties
2.1 Tensile 527-1 & 2 D 638 MPa MPa psimodulus
2.2 Yield Stress 527-1 & 2 D 638 MPa MPa psi
2.3 Yield Strain 527-1 & 2 D 638 % % %
2.4 Nominal strain 527-1 & 2 - % - -
at break
2.5 Stress at 50% strain 527-1 & 2 - MPa - -
2.6 Stress at break 527-1 & 2 D 638 MPa MPa psi
2.7 Strain at break 527-1 & 2 D 638 % % %
2.10 Flexural modulus 178 D 790 MPa MPa psi
2.11 Flexural strength 178 D 790 MPa MPa psi
2.12 Charpy impact 179 - kJ/m2 - -strength
2.13 Charpy notched 179 - kJ/m2 - -impact strength
•— Izod impact 180 D 4812 kJ/m2 J/m ft–lb/instrength at 23°C
•— Izod notched 180 D 256 kJ/m2 J/m ft–lb/inimpact strength at 23°C
* For each applicable ISO method, corresponding ASTM methods are provided for reference. These methods may notbe technically equivalent.
Appendix II: ISO and ASTM Test Methods
ISO and ASTM Test Methods
A2-2

Property Number SI Units SI Units U.S. Unitsin ISO ISO ASTM for for for10350:1993 Property Standard Standard ISO Test ASTM Test ASTM Test
3 Thermal Properties
3.1 Melting 11357-3 D3418 C C Ftemperature
3.3 Temperature of 75-1& 2 D 648 C C Fdeflection at 1.8 MPa
3.4 Temperature of 75-1& 2 D 648 C C Fdeflection at 0.45 MPa
3.7 CLTE*, flow 11359-2 E228 or 831 E-4 1/K 1/C 1/Fdirection, 23-55°C
3.8 CLTE*, transverse 11359-2 E228 or 831 E-4 1/K 1/C 1/Fdirection, 23-55°C
3.9 Flammability at 1.6mm 1210 (UL94) class (as HB, V-2, V-1, V-0)Thickness (UL94) mm mm mm
3.11 Flammability•5V 10351 (UL94) class class classThickness (UL94) mm mm mm
3.13 Limiting Oxygen 4589 D 2863 % % %Index
4 Electrical Properties
4.1 Relative permittivity, IEC 250 D 150100Hz
4.2 Relative permittivity, IEC 250 D 1501MHz
4.3 Dissipation factor, IEC 250 D 150 E-4100 Hz
4.4 Dissipation factor, IEC 250 D 150 E-41MHz
4.5 Volume resistivity IEC 93 D 257 ohm cm ohm cm ohm cm
4.6 Surface resistivity IEC 93 D 257 ohm ohm ohm
4.7 Electric strength IEC 243-1 D 149 kV/mm kV/mm V/mil
4.9 Comparative IEC 112 -tracking index
5 Other Properties
5.1 Water absorption 2 D570 % % %24 hr immersion/23°C
5.2 Water absorption 62 D570 % % %saturation at 23°C
• Water absorption 62 - % % %at 23°C/50% RH
5.3 Density 1183 D792 g/cm3 g/cm3 lb/ft3
• Specific gravity 1183 D792
* CLTE = Coefficient of Linear Thermal Expansion** TMA = Thermo-Mechanical Analysis
Chart reference: Wigotsky, Victor, •The Road to Standardization,• Plastics Engineering.
ISO and ASTM Test Methods
A2-3

Part B1Bibliography

Design Considerations for Injection Molded PartsDym, Joseph B., Injection Molds and Molding, Second Edition, Van Nostrand Reinhold Company.
Structural ControlBeer & Johnson, Mechanical Material.
Peterson, R.E., Stress Contribution Factors.
Flat plate, torsional deformation, and stress formulas thanks to:Roark, Raymond, and Young, Warren, Formulas for Stress and Strain, McGraw Hill.
Assembly•“Designing Parts for Ultrasonic Welding,” ©Branson Utrasonics Corporation, Danbury, CT.
“•Ultrasonic Insertion,” Branson Utrasonics Corporation, Danbury, CT.
•“Vibration Welding,” Branson Utrasonics Corporation, Danbury, CT.
Holtz, Richard, “Vibration Welding: Fast, Quiet, Efficient,” Assembly Engineering, Hitchcock Publishing.
1987 SPE ANTEC, Chul S. Lee, Alan Dubin and Elmer D. Jones, ‘‘Short Cantilever Beam Deflection AnalysisApplied to Thermoplastic Snap-Fit Design,’’ Held in Los Angeles, California, USA.
3M, “Structural Adhesive Guide for Industrial Product Design and Assembly.”
Plastic MaterialsArpaci, Vedal S., “Convection Heat Transfer,” Addison-Wesley.
Forward Technology Industries, “Joint Designs.”
Emabond Systems, “•Emaweld, Electromagnetic Welding System for Assembling Thermoplastic Parts.”
Gas Assist MoldingSayer, Matthew, “•Application of Gas Injection Technology,” Cinpress, Ltd.
•“Design Tips for Gas-Assisted Injection Molding,” diagram of rib designs by Indra Baxi of Sajar Plastics, Plastics Design Forum.
Appendix II: ISO and ASTM Test MethodsWigotsky, Victor, “The Road to Standardization,” Plastics Engineering.
Selective Bibliography
Bibliography
BI-2

English/Metric Conversion ChartTo Convert To MultiplyEnglish System Metric System English Value by. . .
DISTANCEinches millimeters 25.38feet meters 0.30478
MASSounce (avdp) gram 28.3495pound gram 453.5925pound kilogram 0.4536U.S. ton metric ton 0.9072
VOLUMEinch3 centimeter3 16.3871inch3 liter 0.016387fluid ounce centimeter3 29.5735quart (liquid) decimeter3 (liter) 0.9464gallon (U.S.) decimeter3 (liter) 3.7854
TEMPERATUREdegree F degree C [(F)-32] / 1.8 = (C)
PRESSUREpsi bar 0.0689psi kPa 6.8948ksi MN/m2 6.8948psi MPa 0.00689
ENERGY AND POWERin lbf Joules 0.113ft lbf Joules 1.3558kW metric horsepower 1.3596U.S. horsepower Kw 0.7457Btu Joules 1055.1Btu in (h ft2 F) W(m K) 0.1442
VISCOSITYpoise Pa s 0.1
BENDING MOMENTOR TORQUEft lb Nm 1.356
DENSITY lb/in3 g/cm3 27.68lb/ft3 kg/m3 16.0185
NOTCHED IZODft–lb/in J/m 53.4

BASF CorporationEngineering Plastics1 (800) 527-TECH
BASF: The Chemical Company. We don't make a lot of the products you buy. We make a lot of theproducts you buy better.®
BASF Corporation, headquartered in New Jersey, is the NorthAmerican affiliate of BASF AG, Ludwigshafen, Germany. BASF isthe world's leading chemical company. Our portfolio ranges fromchemicals, plastics, performance products, agricultural productsand fine chemicals to crude oil and natural gas. As a reliable part-ner to virtually all industries, BASF's intelligent solutions and high-value products help customers to be more successful. BASFdevelops new technologies and uses them to open up additionalmarket opportunities. We combine economic success with envi-ronmental protection and social responsibility, thus contributing toa better future. Further information on BASF is available on theInternet at www.basf.com.
While the descriptions, designs, data and information containedherein are presented in good faith and believed to be accurate, it isprovided for your guidance only. Because many factors may affectprocessing or application/use, we recommend that you make teststo determine the suitability of a product for your particular purposeprior to use. NO WARRANTIES OF ANY KIND, EITHER EXPRESSOR IMPLIED, INCLUDING WARRANTIES OF MERCHANTABILITYOR FITNESS FOR A PARTICULAR PURPOSE, ARE MADEREGARDING PRODUCTS DESCRIBED OR DESIGNS, DATA ORINFORMATION SET FORTH, OR THAT THE PRODUCTS,DESIGNS, DATA OR INFORMATION MAY BE USED WITHOUTINFRINGING THE INTELLECTUAL PROPERTY RIGHTS OF OTH-ERS. IN NO CASE SHALL THE DESCRIPTIONS, INFORMATION,DATA OR DESIGNS PROVIDED BE CONSIDERED A PART OFOUR TERMS AND CONDITIONS OF SALE.
All trademarks are owned by BASF AG or BASFCorporation.© 2007 BASF Corporation