DESIGN OF NUCLEAR CERAMIC MATERIALS WITH ENHANCED …
66
VYSOKÉ UČENÍ TECHNICKÉ V BRNĚ BRNO UNIVERSITY OF TECHNOLOGY FAKULTA STROJNÍHO INŽENÝRSTVÍ ÚSTAV MATERIÁLOVÝCH VĚD A INŽENÝRSTVÍ FACULTY OF MECHANICAL ENGINEERING INSTITUTE OF MATERIALS SCIENCE AND ENGINEERING DESIGN OF NUCLEAR CERAMIC MATERIALS WITH ENHANCED THERMAL CONDUCTIVITY PŘÍPRAVA KERAMICKÝCH MATERIÁLŮ SE ZVÝŠENOU TEPELNOU VODIVOSTÍ PRO JADERNÉ APLIKACE DIPLOMOVÁ PRÁCE MASTER’S THESIS AUTOR PRÁCE Bc. JAKUB ROLEČEK AUTHOR VEDOUCÍ PRÁCE Ing. DAVID SALAMON, Ph.D. SUPERVISOR BRNO 2014
Transcript of DESIGN OF NUCLEAR CERAMIC MATERIALS WITH ENHANCED …

VYSOKÉ UČENÍ TECHNICKÉ V BRNĚ BRNO UNIVERSITY OF TECHNOLOGY
FAKULTA STROJNÍHO INŽENÝRSTVÍ ÚSTAV MATERIÁLOVÝCH VĚD A INŽENÝRSTVÍ
FACULTY OF MECHANICAL ENGINEERING INSTITUTE OF MATERIALS SCIENCE AND ENGINEERING
DESIGN OF NUCLEAR CERAMIC MATERIALS WITH ENHANCED THERMAL CONDUCTIVITY PŘÍPRAVA KERAMICKÝCH MATERIÁLŮ SE ZVÝŠENOU TEPELNOU VODIVOSTÍ PRO JADERNÉ APLIKACE
DIPLOMOVÁ PRÁCE MASTER’S THESIS
AUTOR PRÁCE Bc. JAKUB ROLEČEK AUTHOR
VEDOUCÍ PRÁCE Ing. DAVID SALAMON, Ph.D. SUPERVISOR
BRNO 2014


�
ABSTRACT
Uranium dioxide (UO2) is the most common fuel material used in commercial nuclear
reactors. The main disadvantage of UO2 is its low thermal conductivity, and large amount of heat generated during the fission in nuclear reactor creates a large temperature gradient in the
UO2 fuel pellet. This temperature gradient induces large thermal stress, which leads to fuel
pellet cracking. These cracks help to the release of fission product gases after high burnup.
The formation of cracks and increase fission gas generation leads to a considerable reduction of fuel pellet durability.
This thesis deals with the issue of increasing the thermal conductivity of the UO2
nuclear fuel on model material (CeO2). In this work are studied similarities of the CeO2 and
UO2 behavior during conventional sintering and spark plasma sintering. The concept of thermal conductivity enhancement deal with incorporation of high thermal conductivity
material – silicon carbide (SiC) into the CeO2 pellets. Silicon carbide is expected to increase
the heat flow out of the fuel pellet, and thus increasing the CeO2 thermal conductivity.
Similarities of SiC behavior in the CeO2 matrix and SiC behavior in the UO2 matrix reported in literature are also discussed in this work.
KEY WORDS: CeO2, SiC, UO2, nuclear fuel surrogate material, thermal conductivity enhancement,
spark plasma sintering
ABSTRAKT
Oxid urani�itý (UO2) je v sou�asnosti nej�ast�ji používaným materiálem jakožto palivo v
komer�ních jaderných reaktorech. Nejv�tší nevýhodou UO2 je jeho velmi nízká tepelná vodivost, a protože se p�i št�pení UO2 v jaderném reaktoru vytvá�í velké množství tepla,
vzniká v UO2 pelet� velký teplotní gradient. Tento teplotní gradient zp�sobuje vznik velkého
tepelného nap�tí uvnit� pelety, což následn� vede k tvorb� trhlin. Tyto trhliny napomáhají
k ší�ení št�pných plyn� p�i vysoké mí�e vyho�ení paliva. Tvorba trhlin a zvýšený vývin št�pného plynu posléze vede ke zna�nému snížení odolnosti jaderného paliva.
Tato práce se zabývá problematikou zvyšování tepelné vodivosti jaderného paliva na
modelu materiálu (CeO2). V této práci jsou studovány podobnosti chování CeO2 a UO2 p�i konven�ním slinováním a p�i „spark plasma sintering.“ Zp�sob jak zvýšit tepelnou vodivost použitý v této práci je v�len�ní vysoce tepeln� vodivého materiálu, karbidu k�emíku (SiC), do
struktury CeO2 pelet. Od karbidu k�emíku je o�ekáváno, že zvýší tok tepla z jádra pelety, a
tím zvýší tepelnou vodivost CeO2. V této práci je také porovnávána podobnost chování SiC v
CeO2 matrici s chováním SiC v UO2, které bylo popsáno v literatu�e.
KLÍ�OVÁ SLOVA CeO2, SiC, UO2, náhrada jaderného paliva, zvyšování tepelné vodivosti, spark plasma
sintering

�
BIBLIOGRAPHIC CITATION
ROLE�EK, J. P�íprava keramických materiál� se zvýšenou tepelnou vodivostí pro jaderné
aplikace. Brno: Vysoké u�ení technické v Brn�, Fakulta strojního inženýrství, 2014. 60 s. Vedoucí diplomové práce Ing. David Salamon, Ph.D..

�
DECLARATION
I declare that this master´s thesis was worked out on my own using mentioned literature and under the supervision of above named supervisor.
In Brno on the 29th of May 2014 .......................
Jakub Role�ek

�
ACKNOWLEDGEMENTS
I would like to thank to my supervisor Ing. David Salamon, Ph.D. for his experienced and scientific supervision and friendly approach, and for his valuable advices and fruitful
discussions. Furthermore, I would like to thank to all my colleagues from the Department of
Ceramics at the Institute of Materials Science and Engineering for their assistance in
execution of experiments. I would also like to thank my family for their consistent support through the years of my education.

�
CONTENTS
1. INTRODUCTION......................................................................................................
2. GOALS OF WORK...................................................................................................
3. LITERATURE REVIEW.........................................................................................
3.1 Ceramic materials...........................................................................................3.1.1 Bonding in ceramics.......................................................................
3.1.2 Structure of ceramics......................................................................
3.1.3 Thermal conductivity of ceramic materials....................................
3.2 Nuclear fission.................................................................................................
3.3 Principle of fission..........................................................................................3.3.1 Binding energy...............................................................................
3.3.2 Fission products, materials, and absorption...................................
3.3.3 Neutron energy spectrum...............................................................
3.3.4 Moderation of neutrons..................................................................
3.4 Production of nuclear energy........................................................................ 3.4.1 Thermal reactors.............................................................................
3.4.2 Fast reactors....................................................................................
3.3.3 Fissionable materials......................................................................
3.5 Properties of the UO2 nuclear fuel................................................................
3.6 The UO2 thermal conductivity enhancement............................................... 3.6.1 Properties of SiC.............................................................................
3.7 The UO2 replacement for the early stage research...................................... 3.7.1 Properties of CeO2..........................................................................
4. EXPERIMENTAL MATERIALS AND METHODS.............................................
4.1 Processing........................................................................................................4.1.1 Powder mixing...............................................................................
4.1.2 Cold uniaxial pressing....................................................................
4.1.3 Cold isostatic pressing....................................................................
4.1.4 Pellets sintering...............................................................................
4.2 Characterization.............................................................................................4.2.1 Density measurements....................................................................
4.2.2 Scanning electron microscopy........................................................
4.2.3 X-ray diffraction............................................................................
4.2.4 Dilatometric analysis......................................................................
4.2.5 Differential thermal analysis..........................................................
4.2.6 Thermal conductivity measurements..............................................
1
2
3
3 3
4
9
12
13 13
15
15
16
17 18
18
18
21
23 24
25 26
28
28 28
28
29
30
31 32
32
33
33
33
34

�
5. RESULTS...................................................................................................................
5.1 Powder milling................................................................................................
5.2 Characterization of green body pellets.........................................................
5.3 Influence of processing on sintering behavior (of pure CeO2 pellets)........
5.4 Characterization of conventionally sintered CeO2 + SiC pellets................
5.5 Characterization of CeO2 + SiC pellets sintered in SPS..............................
5.6 Thermal conductivity measurements............................................................
6. DISCUSSION.............................................................................................................
7. SUMMARY................................................................................................................
8. LIST OF REFFERENCES.......................................................................................
35
35
35
36
39
41
44
47
51
52

��
�
1 INTRODUCTION
Despite the availability of numerous types of fuels for nuclear fission reactors, most of commercial reactors in the world use the uranium dioxide (UO2) as fuel. This type of fuel is
used for several reasons such as high melting point, oxidation resistance, chemical
compatibility with cladding and coolant, and low operation costs. Also, UO2 behavior during
the nuclear fission has been studied much more than behavior of other fuel types, for example [1, 2] or [3].
The main disadvantage of the uranium dioxide as a nuclear fuel is its very low thermal
conductivity. Enhancing the thermal conductivity of the UO2 fuel would allow increasing the
energy output of the fuel and improving the safety of a reactor. Higher thermal conductivity also helps to remove heat from the core of the fuel pellet more effectively. This results into
smaller temperature gradient in the pellet, smaller thermal tension and thus higher durability
of the fuel pellet.
The concept of incorporating high thermal conductivity phase into the UO2 pellet has been investigated in several studies [1, 4, 5, 6, 7, 8]. Some authors [5, 7, 8] used beryllium
oxide as a high conductivity phase, but the main disadvantage of the BeO is its very high
toxicity. Other very promising additive with high thermal conductivity is silicon carbide.
Influence of the SiC incorporation in the UO2 on the thermal conductivity of the nuclear fuel was investigated in some studies [1, 4, 7, 8]. �-SiC was used as the high thermal conductivity
additive also due to its non-toxicity, low neutron absorption, chemical stability, and high
melting temperature.
The use of uranium dioxide in common laboratory environment is quite problematic due to its radioactivity. This issue can be solved by using a depleted UO2, but there are still a lot
of permissions required by local authorities. So it is convenient to replace UO2 by some non-
toxic material with similar properties for early stage research.
Such an analogue should have the same fluorite crystal structure as UO2 (FCC, space group Fm-3m). This structure occurs in CaF2, ThO2 or CeO2. The use of a cerium dioxide as a
UO2 surrogate material was investigated in several studies, such as [9, 10, 11] or [12]. In this
work a cerium dioxide was used as a surrogate material.
The aim of this work is to create the methodology to prepare CeO2 analogue ceramics for UO2 fuel, to verify the strategy of thermal conductivity enhancement by addition of SiC, and
provide a detailed characterization of the microstructures, crystallography, thermal
conductivity, and other properties of the samples. Both conventional sintering and SPS
techniques were employed to fabricate CeO2 and CeO2 – SiC composite pellets.
�

��
�
2 GOALS OF WORK
Main goal is to determine the suitability of the CeO2 as a surrogate material for UO2, during the laboratory study of thermal conductivity enhancement of the nuclear fuel.
To achieve this goal it is necessary to perform particular experimental tasks, especially:
• Describe development of microstructure of CeO2 in relation to processing of starting
powder and sintering conditions.
• Describe an influence of SiC additive inside CeO2 matrix on sintering behavior of
CeO2 + SiC composites.
• Describe in influence of SiC additive inside CeO2 matrix on thermal conductivity at high temperatures.
• Compare behavior of CeO2 + SiC composites and behavior UO2 + SiC composites
described in literature with focus on enhancement of thermal conductivity of nuclear fuel.
�

��
�
3 LITERATURE REVIEW
3.1 Ceramic materials
Ceramic materials can be defined as solid compounds that are formed by the application
of heat, or heat and pressure, comprising at least two elements provided one of them is a non-metal. The other element(s) may be a metal(s) or another non-metal(s). Ceramic materials can
be divided into two groups:
Traditional ceramics Traditional ceramics are characterized by mostly silicate-based porous microstructures
that are coarse, nonuniform and multiphase. Traditional ceramics are formed by mixing clays,
feldspars and water. The required shape is obtained by slip casting or on a potter´s wheel. The
final step is firing the product in furnace to sinter it.
Advanced/technical ceramics For the production of advanced ceramic materials are used more sophisticated materials,
such as binary oxides, carbides, perovskites or completely synthetic materials, for which there
are no natural equivalents. The microstructure of these ceramics is much more homogeneous
and less porous. Ceramics are in general very hard, brittle, wear-resistant, oxidation-resistant, prone to
thermal shock and electrically and thermally insulative materials. Although there are
exceptions, for example ceramic materials that are quite good thermal conductors, others are
superconductors and so on [13, 14].
3.1.1 Bonding in ceramics The properties of any solid are determined primarily by the bonds holding the solid
together. Broadly speaking ceramics can be classified as being either ionically or covalently bonded. However bonding in real ceramic materials is neither purely ionic or purely covalent,
but a mixture of both. The bonding forces between ions are much stronger in covalent and
ionic bonding in ceramic materials than bonding forces between atoms in metallic
compounds. This is why ceramics generally have higher hardness and lower ductility than metals [13, 15].
Ionic compounds form between very active metallic element and active non-metal. The
requirements for forming an ionic bond are that one element must be able to lose electrons
easily and the other must be able to accept these electrons without too much energy input. If the electronegativity difference between two elements is large, the electron will be attracted to
the more electronegative element, forming ions which in turn attract each other � ionic bonds
(Figure 2.1.1a).
Covalent compounds form when ionic bonding is energetically unfavorable, in other words the covalent bonds occur when bonding energies of both elements are comparable. If
two elements forming a bond have similar electronegativities, they will tend to share electrons
between them and will form covalent bonds (Figure 3.1.1b) [13].

��
�
a) b)
Figure 3.1.1 Schematic diagram of covalent and ionic bonding [16].
3.1.2 Structure of ceramics Ceramics are composed of at least two elements and their structures are, in general, more
complicated than those of metals. While most metals are face-centered cubic (FCC), body-
centered cubic (BCC), or hexagonal close-packed (HCP), ceramics exhibit a much wider
variety of structures. In contrast to metals where the structure is descriptive of the atomic
arrangement, ceramic structures are named after the mineral in which the structure was first discovered. For example, compounds where the anions and cations are arranged as in NaCl
(such as MgO or FeO) are described to have the rock salt structure. Similarly, any compound
that crystallizes in the arrangement which is typical for Al2O3 has the corundum structure.
Ceramic structures for the most part depend on the type of bonding present between anions and cations. For ionically bonded ceramics, the stoichiometry and the radius ratio of
the cations to the anions are the main determinants of structure. The structures can be best
visualized by focusing on the anion arrangement which, for the majority of ceramics, is FCC,
HCP, or simple cubic. The final structure will depend on the fractional cationic occupancy of the interstitial sites in the the anion lattice. The structures of covalent ceramics that are silica-
based are based on the SiX4 tetrahedron. These tetrahedrons are usually linked to each other at
the corners. For silicates, the building block is the SiO4 tetrahedron. The most important
parameter in determining the structure of silicates is the O/Si ratio [13]. The ceramic crystal structures can be categorized into following groups:
Binary ionic compounds
• AX-type structures which include the rock salt structure, CsCl, zinc blende, and
wurtzite structure. The rock salt structure (Figure 3.l.2a), named after NaCl, is the
most common of the binary structures. In this structure, the coordination number (the number of nearest neighbor ions) for both cations and anions is 6. In the CsCl
structure (Fig. 3.1.2b), the coordination number for both ions is 8. In the zinc blende
structure (Fig. 3.1.2c) and the wurtzite structure (Figure 3.1.2d) the coordination
number is 4. Both of these structures were discovered in ZnS, because ZnS exhibits polymorphic behavior [13, 17].

��
�
a) �Na �Cl b) �Cs �Cl
c) �Zn �S d) �Zn �S
Figure 3.1.2 Crystal structures of: a) sodium chloride; b) cesium chloride; c) zinc blende; d) wurtzite
[18].
• AX2-type structures which include the fluorite structure (CaF2 – Figure 3.1.3a) and rutile structure (TiO2 – Figure 3.1.3b). In the fluorite structure the coordination
number of cations is 8 and the coordination number of anions is 4. There also exists
an antifluorite structure which has the opposite arrangement of cations and anions.The
anions in the fcc array have coordination number 8 and cations in the tetrahedral holes have coordination number 4. Examples of the antifluorite structure are for example
Li2O, Na2O or Na2S. In the rutile structure the coordination number of the anions is 6
and the coordination number of the cations is 3 [13, 17].
a) �Ca �F b) �Ti �O
Figure 3.1.3 Crystal structures of: a) calcium fluoride; b) titanium dioxide [18, 19].
��
�
Complex crystal structures (ternary compounds)
• AmBnXp structures in which cations of A and B (or the same cation with differing
valences), are incorporated in an anion sublattice. One of the characteristics which are typical for these types of structures is ability to accommodate a large number of
cationic combinations as long as the overall crystal remains neutral. Typical
representatives of these structures are spinels (Figure 3.1.4a) and perovskites (Figure
3.1.4b) Spinel structures are named after the naturally occurring mineral MgAl2O4. The
general formula is AB2O4, where the A and B cations are in the +2 and +3 oxidation
states. When the A2+ ions occupy the tetrahedral sites and the B3+ ions occupy the
octahedral sites, the spinel is called a normal spinel. In the inverse spinel, the A2+ ions and one half of the B3+ ions occupy the octahedral sites, while the other half of the B3+
ions occupy the tetrahedral sites.
Perovskites have name after naturally occurring mineral perovskite with
composition CaTiO3, which was named after a Russian mineralogist Count Perovski. The general formula is ABX3 [13].
a) �A �B �O b) �A �B �O
Figure 3.1.4 Crystal structures of: a) spinel(AB2X4); b) perovskite(ABX3) [20, 21].
Structure of covalent ceramics
• Covalent ceramics are compounds in which the covalent bonding is dominant.
Covalent ceramics are for example GaAs, ZnO, SiC, Si3N4 and SiO2. The last three
compounds belong to the group of silicon-based covalent ceramics. This group of ceramics is very important and is widely used in different branches of industry. The
building block of silicon-based covalent ceramics, which include the silicates, SiC and
Si3N4, is in all cases the Si tetrahedron. In the case of silicates the tetrahedron is
composed of SiO4, in the case of SiC is composed of SiC4 and in the case of Si3N4 is composed of SiN4. These tetrahedrons are usually linked to each other at the corners
[13, 22].
• Si3N4 exists in two polymorphs and �, both are hexagonal. The structure of �polymorph is composed of puckered rings of alternating Si and N atoms, as it is
shown in Figure 3.1.5. These rings can be considered as layers with a stacking
sequence ABAB and forming long continuous channels in the z direction. The
predominantly silicon nitride powder used to produce dense silicon nitride ceramics

��
�
was observed to transform to the � modification during the sintering process at temperatures above 1400 ºC when the original phase is in contact with a metal-
silicon-oxynitride liquid phase [23].
�Si �N
Figure 3.1.5 Crystal structure of � - Si3N4 [24].
• The structure of SiC also exists in many polymorphs. The most common polymorph is
-SiC, which is hexagonal and has the wurtzite structure (Figure 3.1.6). The second most common polymorph is �-SiC, which is the only form of SiC with a cubic crystal
structure. The different polytypes of SiC are actually composed of different stacking
sequences of Si-C bilayers (also called Si–C double layers). Each atom within a
bilayer has three covalent chemical bonds with other atoms in the same layer, and only one bond to an atom in an adjoining bilayer [25].
�Si �C
Figure 3.1.6 Crystal structure of � - SiC [26].

�
�
Structure of silicates
• For silicates, the basic building block is the SiO4 tetrahedron. When silica
tetrahedrons share three corner ions, they produce layered silicates (talc, kaolinite clay, mica). When silica tetrahedrons share four corner ions, they produce framework
silicates (quartz (Figure 3.1.7), tridymite, crystobalite). There are two types of
oxygens that exist in silicate structures:
o Bridging oxygens. An oxygen atom that is bonded to two Si atoms is called the
bridging oxygen.
o Nonbridging oxygens. An oxygen atom that is bonded only to one Si atom is
called the nonbridging oxygen. The addition of alkali or alkali-earth metal
oxides to silica increases the number of nonbridging atoms which results in the breakdown of the silicate structure to the smaller units [13, 27].
�Si �O
Figure 3.1.7 Crystal structure of quartz [28].
• The most important parameter in determining the structure of silicates is the O/Si ratio
which is determined by the quantity of nonbridging oxygens (the higher quantity of
nonbridging oxygens leads to the lower O/Si ratio). The minimum ratio is 2 and results in a three-dimensional network. The maximum ratio is 4 and results into
isolated SiO4 tetrahedrons [13, 27].
O/Si ratio
2 quartz, tridymite, crystobalite
2.5 clays, kaolinite
2.75 asbestos
3 Na2SiO3, MgSiO3
4 island silicates, olivine

�
�
3.1.3 Thermal conductivity of ceramic materials Thermal conduction is the phenomenon by which heat is transported from high-
temperature to low-temperature regions. The property that characterizes the ability of a
material to transfer heat is called the thermal conductivity. The conduction of heat through
solids occurs as a result of temperature gradients. In analogy to Fick's first law, the relationship between the heat flux and temperature gradient is given by the equation:
� � ����
��
where q denotes the heat flux (dQ/dt). The heat flux is the heat transferred per unit time across a plane of area perpendicular to the flow of the thermal energy; and kth is a material
property (analogous to diffusivity) that describes the ability of a material to transport heat.
The units of q are are W·m-2 and units of kth are J·s-1·m-1·K-1 or equivalently W·m-1·K-1.
Approximate values of kth for some ceramic materials are listed in Table 3.1 [13, 29].
Table 3.1 Thermal conductivity of selected ceramic materials at room temperature [1, 13, 30].
��������������� ��� �����������
�� �� ����
���������������� ����
���� ����
���� �� �����
������ �����
��� �� ����������
�� � �����
���� ��������
�� � �����������
���� �����������
�� �� �����
�� ���
Mechanisms of heat conduction Heat conduction mechanisms in solids are not easy to describe. In general, thermal energy
in solids is transported by lattice vibrations, i.e. phonons, free electrons, and radiation. Since the concentration of free electrons in ceramics is very low, phonon mechanism is primarily
responsible for thermal conduction. The phonon mechanism can be described on simple
example. A small region of a solid material was heated. Atoms in that region will have large
amplitudes of vibration and will vibrate violently around their average positions. Since these atoms are bonded to other atoms, their motion must also set their neighbors into oscillation.
The result is that the disturbance, caused by the application of heat, propagates outward in a
wavelike form. These waves can be scattered by imperfections, grain boundaries, pores or
even reflected at other internal surfaces [13, 29]. The average distance that wave travels before being scattered is referred as the mean free
path �th. By assuming number of thermal energy carriers to be Nth, and their average velocity
vth, thermal conductivity can be assumed by following equation:
�� � ������� � ��� � �� � �� ��

���
�
Glass and other amorphous ceramics have lower conductivities than crystalline ceramics, since the phonon scattering is much more effective when the atomic structure is highly
disordered and irregular. In opposite, highly ordered structures made of atoms or ions of
similar size and mass, such as SiC, BeO or AlN, tend to minimize phonon scattering and
result in increased values of kth. The best example is diamond, which has one of the highest thermal conductivity values of any known material. More complex structures, such as spinels,
perovskites or compounds where is a large difference in mass between ions (UO2, ZrO2), have
lower values of kth. The thermal conductivity of ceramic will be also decreased by the
addition of a second component in solid solution, for example the addition of MgO to A12O3
[13].
The scattering of lattice vibrations becomes more intense with rising temperature. This is
the reason why the thermal conductivity of most ceramic materials normally decreases with
increasing temperature. As shown in the Figure 3.1.8 the conductivity begins to increase at higher temperatures, which is due to heat transfer by radiation. Significant quantities of
infrared radiant heat may be transported through a transparent ceramic material. The
efficiency of this process increases with temperature [29].
Figure 3.1.8 Dependence of thermal conductivity on temperature for some ceramic materials [29].
Finally the porosity in ceramic materials has a dramatic influence on thermal
conductivity. Increasing the pore volume will, under most circumstances, result in a reduction
of the thermal conductivity. In fact, many ceramics that are used for thermal insulation are
porous, with small continuous pores. Heat transfer across the pores is very slow and inefficient. Internal pores normally contain still air, which has an extremely low thermal
conductivity (approximately 0.02 W·m-1·K-1). Heat within the pores can be transferred by
radiation and convection, but both these mechanisms are comparatively ineffective [13, 29].

���
�
Measuring of thermal conductivity Several techniques are used to measure thermal conductivity. Two methods are described
below, the guarded hot plate method and laser flash method that has gained popularity
recently.
• Guarded hot plate method The principle of the guarded hot plate method is to generate a known
unidirectional heat flux through the specimen so that they appear as plate of infinite width bounded by parallel planes. To achieve this aim, it is necessary to use a heater
plate consisting of two parts. A central plate – metering area is surrounded by an
annular guard and separated from it by a small air gap, which acts as a thermal barrier.
Heat flows from the metering area of the heater plate through the specimens to cold plates (or auxiliary heaters) maintained at a stable lower temperature (few hundreds of
°C). Electrical current is supplied to the guard independently of the metering area
heater and the heat flux produced serves to maintain the heat flow perpendicular to the
hot face in the central metering region, thereby creating isothermal planes across the measured region of the specimen (Figure 3.1.9). The thermal conductivity is given by
following equation:
��� �� � �
�� � �������
where Q is the supplied power; l is the mean thickness of the specimens; A is the cross sectional area of the plates and Th-Tc is the mean difference in temperature between
the plates [31].
Figure 3.1.9 Schematic structure of the guarded hot plate measuring apparatus [32].
• Laser flash method In principle this technique measures the time evolution of the temperature on one
side of the sample, which is placed in the furnace to maintain constant temperature, as
the other side is very rapidly heated by a laser pulse. As the heat passes through the solid, the signal is altered in two ways. There will be a time lag between the time at
which the laser pulse reached the solid and the maximum in the response. This time
lag is directly proportional to the thermal diffusivity Dth of the material. The second
effect will be a reduction in the temperature peak.

���
�
Figure 3.1.10 Schematic structure of the laser flash method measuring system [33].
This time lag is directly proportional to the thermal diffusivity Dth of the material.
The second effect will be a reduction in the temperature peak. This reduction is
directly related to the heat capacity cp of the material. If density � of the material is known, the thermal conductivity can be calculated using equation:
� !����"#�$ !�
Hence kth can be calculated if the density of the solid is known and Dth and cp are
measured [13].
3.2 Nuclear fission
Nuclear fission was discovered by Enrico Fermi in 1934, but he did not recognize it. So
the nuclear fission was officially discovered four years later in 1938 by German scientists
Otto Hahn and Fritz Strassmann [34, 35].Shortly after the discovery of fission they also discovered the possibilities of the
enormous energy release during this process. In 1942 the Manhattan project was established
in Los Alamos, New Mexico in the USA. This scientific project was lead by American
theoretical physicist Julius Robert Oppenheimer and the aim of the project was to develop the first nuclear weapon in the history of mankind. Enrico Fermi also participated in the
Manhattan project and later that year he built the first controlled fission reactor. It was called
the Chicago Pile-1 (Figure 3.2.1). This first self-sustaining fission reactor was a pile of
graphite and uranium. Fermi described the apparatus as "a crude pile of black bricks and wooden timbers." Made of a large amount of graphite and uranium, with "control rods" of
cadmium, indium, and silver, unlike subsequent reactors, it had no radiation shield and no
cooling system. The Chicago Pile-1 was the first prototype of the graphite moderated gas
cooled reactor [36, 37].

���
�
Figure 3.2.1 Drawing of the Chicago pile-1[238].
3.3 Principle of fission
Fission is the process where a heavy nucleus is split into two lighter nuclei, and the
binding energy of the original nucleus is transformed into kinetic energy. The process of the
nucleus fission is described in the Figure 3.3.1. A 235U nucleus absorbs a neutron, becoming a 236U* nucleus with excess energy. This excess energy causes violent oscillations that lead to a nucleus splitting. As can be seen in Figure 3.3.1, the reaction produces two or three neutrons
and two lighter nuclei (fission fragments). The additional energy released is � rays and
neutrinos, which are not shown in the figure. The energy released appears as kinetic energy of
the fission fragments, neutrons, and � rays, as well as that from � particles, � rays, and neutrinos emitted as the fission products undergo radioactive decay. This activity of the
fission fragments will cause production of heat, but more than 80% of the energy released by
fission appears as the kinetic energy of the fission fragments [37, 39, 40].
A typical fission reaction is:
�
� + 235
%�� 236%* � 141
&'�+ 92()�+ 3 ��+ *
3.3.1 Binding energy The weight of the nucleus of 235U is less than the sum of the masses of the 92 protons and
143 neutrons that make up its core. In general, if the masses of the Z protons and N neutrons
that make up the nucleus of element X are added, it is found that the weights of these
constituent masses exceed the weight Mx of the nucleus as a whole. The total binding energy
of a nucleus is given by the mass difference:
+,#�-�.,/�0�1��2�+��
Where M(A,Z) is the mass of the nucleus as a whole. The binding energy per nucleon is: �
3�42 5� �+,# - .,/ � 1��2 +�
�
���
�
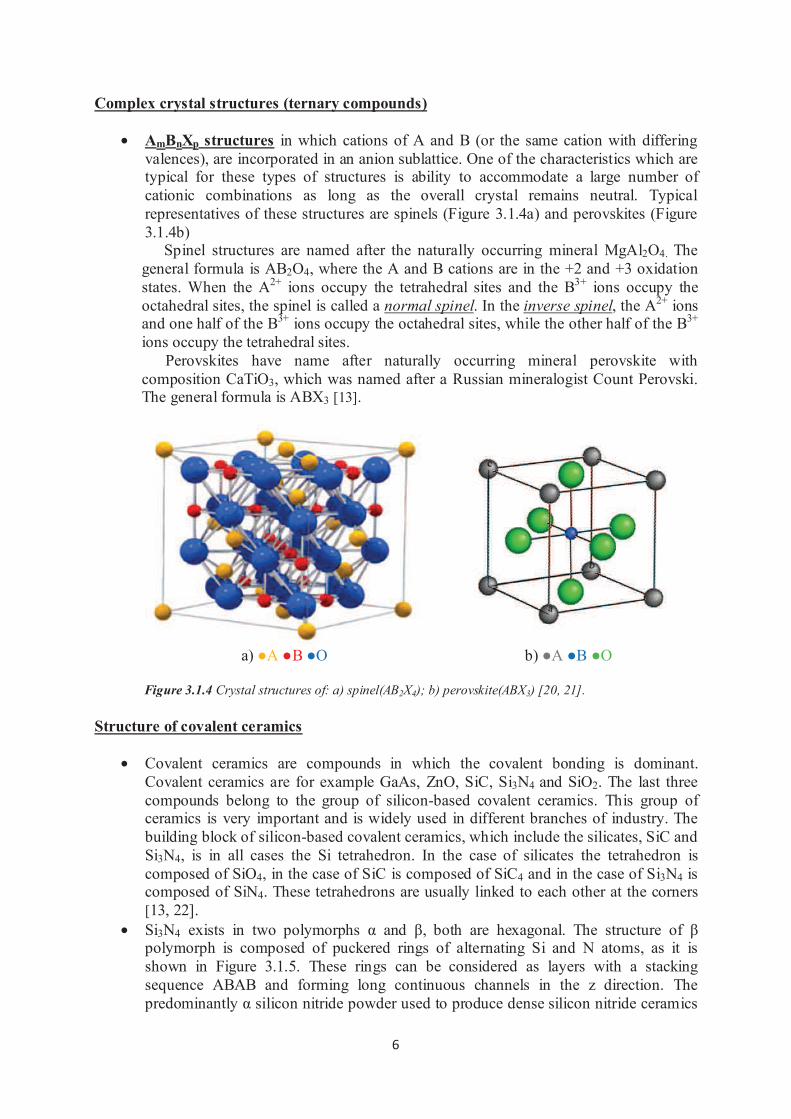
Figure 3.3.1 Schematic drawing of the fission process [41].
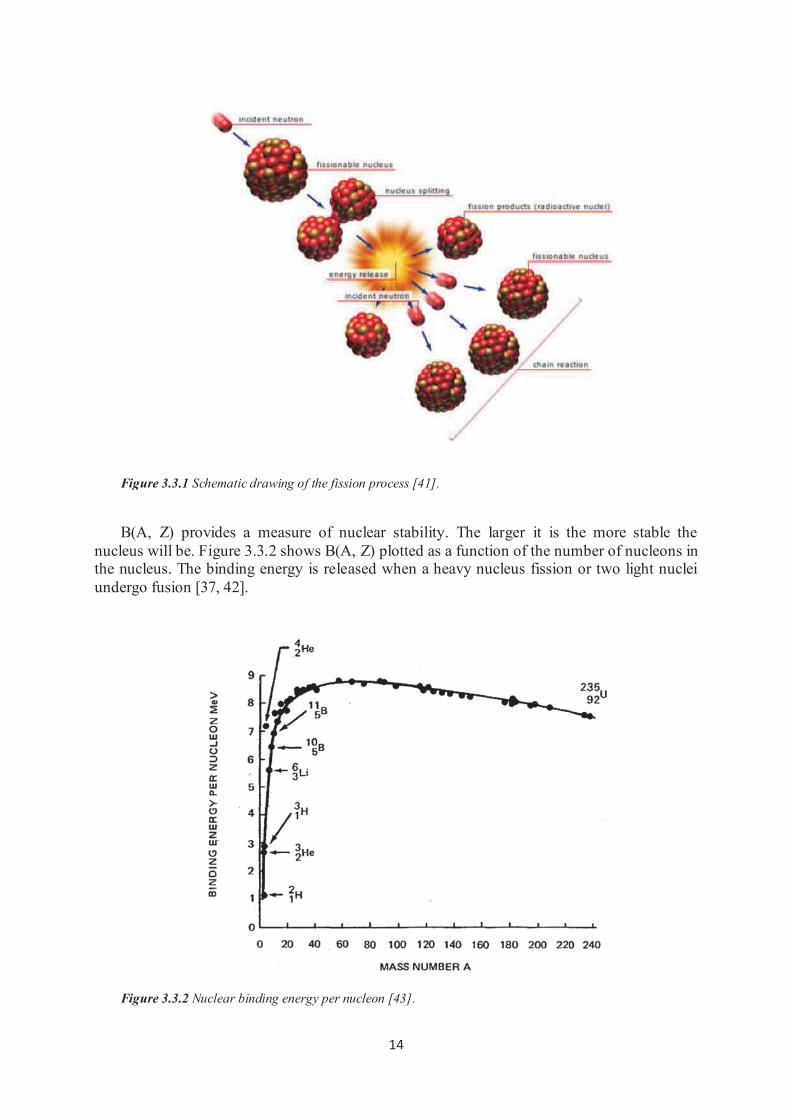
B(A, Z) provides a measure of nuclear stability. The larger it is the more stable the
nucleus will be. Figure 3.3.2 shows B(A, Z) plotted as a function of the number of nucleons in the nucleus. The binding energy is released when a heavy nucleus fission or two light nuclei
undergo fusion [37, 42].
Figure 3.3.2 Nuclear binding energy per nucleon [43].

���
�
3.3.2 Fission products, materials, and absorption The fission fragments have neutron/proton ratios that are too large, and will therefore
undergo beta minus decay. During this process they may emit neutrons. This emission is called �-delayed neutron emission. For example, 138I beta decays with a half-life of 6.5
seconds to 138Xe. Most of the beta decays produce low excited states in 138Xe, but about 5% of
the 138I decays produce states in 138Xe with energy about 6.5 MeV. This energy is sufficient
for 138Xe decay to 137Xe so another neutron is emitted. These so-called delayed neutrons are emitted seconds to minutes after the fission, and play an important role in the process of
controlling the reactor.
When a reactor is shut down, radioactive decay of the fission products will continue to produce significant amounts of heat [34, 37].
Fissionable materials The neutron is the key to the nuclear reactions; it initiates the fission, and converts fertile
nuclei to fissile. Because it is a neutral particle, it does not experience any coulomb repulsion,
and can be easily absorbed by the nucleus [37].
There are two classes of materials of interest for a nuclear reactor: fissile materials – that
fission when hit by a neutron with the correct, low energy, and fertile materials – that have the ability of capturing a neutron and then decay, one or several times, to an isotope that is fissile.
The most important fissile isotopes are 235U and 239Pu, and fertile isotopes are 238U and 232Th.
For a material to be useful as reactor fuel it must satisfy these criteria:
1) The nucleus must undergo fission with a certain cross section absorbing neutrons.
2) It must emit enough fission neutrons, so that at least one neutron will induce another
fission [34, 37].
Absorption To sustain a chain reaction, on average one of the two or more neutrons created by each
fission reaction must survive to create a subsequent fission. At the core of neutron interactions
is the concept of the cross section � which is a measure of the probability that a fission will
take place. Each nucleus has a cross-sectional area in order of 10-24 cm2. This is the area that the incoming neutron "sees", a picture of how "large" the nucleus is to the neutron
In its simplest form, the absorption reaction, where a neutron enters a nucleus, creates a
compound nucleus, which is in an excited state. The probability of the formation of a
compound nucleus is given by the absorption cross-section [37, 38].
3.3.3 Neutron energy spectrum The ability to sustain a chain reaction depends on the energy distribution of neutrons,
because neutron cross sections are strongly energy dependent, which in turn is determined by the composition of non-fissile materials in the core and their effectiveness in slowing down
the neutrons from fission toward thermal energies. The neutron energy distribution is
determined largely by the competition between scattering and absorption reactions. The
neutron energy spectrum in a thermal reactor is in range from 0.001 eV to 10 MeV, and is shown in Figure 3.3.3 [37, 44].

���
�
Figure 3.3.3 Energy dependence of fission cross-section of 235U [45].
Generally, the energy spectrum of a reactor can be divided into 3 groups:
• Fast (fission) neutrons with energy spectrum in range from 1.0 MeV to 10 MeV.
• Neutrons with energy spectrum in range from 1.0 eV to 1.0 MeV. Nearly all of these
neutrons are absorbed and no new fission neutrons are born.
• Thermal neutrons with energy lower than 1.0 eV. They have small enough energies
that the thermal motions of the surrounding atoms can significantly affect their scattering
properties [37, 38].
3.3.4 Moderation of neutrons The purpose of a moderator is to slow down fast neutrons with relatively few collisions to
the thermal energies where the fuel´s ratio of neutron production/absorption is optimal.
Neutron energy degradation caused by both inelastic a most significantly elastic scattering is referred to as neutron slowing down, since along with the reduction of energy comes a
reduction in speed. The most important moderators used in nuclear reactors are:
• Water
• Heavy water
• Beryllium
• Graphite
• Helium [37, 38].

���
�
3.4 Production of nuclear energy
A nuclear power plant is in principle a thermal power plant, where the energy is produced
by fission reactions in the fuel. Each fission will release on average release about 2.5 neutrons. To get constant energy yield from the reactor, the neutron population need to be
preserved at a constant level. Design of a reactor must also allow the thermal energy produced
from fission to be transferred out of the core without overheating any of its parts. Neutrons
that do not induce fission are mostly absorbed by reactions in the fuel, or other places in the reactor [37].
As of 2011, there were 435 nuclear reactors in operation worldwide, producing 370 GW
of electricity. Another 108 units or 108 GW are forthcoming (under construction or on order),
for a total of 543 units and 478 GW of electrical capacity. The largest producer of power from nuclear energy is the USA, with 104 commercial reactors. Different types of fission reactors
in operation are shown in the Table 3.2 [46, 47].
Table 3.2 Power reactors by type, worldwide [46].
����������� ����������������� ������
�!���"!�#���$�%�!�!��&%�!��'�()*� ���� ����������
�����+��$�%�!�!��&%�!��'�()*� �� ��������
,��-.�$�%�!�!��&%�!��'���/ *� ��� �������
0���&������!��&%�!��'0�)*� ��� ���������
0!�12�%������!�%���!��&%�!��')��3*� ��� ��������
4�5"�����%���&������!��&%�!��'4��)*� �� ������
6�%���� ���� �������
There are two main categories of reactors: thermal and fast – according to the energy of
the neutrons initiating the fission reactions. In general, most power reactors are cylindrical in shape with coolant flowing through channels extending the axial length of the core, so the
heat is removed from the core by coolant. All reactors consist of the same essential elements:
• The fuel – fissile material
• A moderator – thermalizes neutrons�'not present in a fast reactor)
• A reflector – surrounds the core to reduce neutron leakage
• A coolant – removes heat from the core
• A containment vessel – prevents an escape of radioactive fission products
• A shielding – prevents neutrons and � rays causing harm to operating personnel
• A control system – allows to control of power level (control rods)
• An emergency systems – prevents runaway of control or coolant systems in an
event of failure [37].
A large power reactor contains many thousands of fuel elements, that are grouped together to form fuel assemblies, and the assemblies are grouped together to form the reactor
core, which is "the heart" of a nuclear power plant. The assemblies also have holes and guide
tubes, where control rods can be inserted. Control rods consist of strong neutron absorbers,
��
�
such as boron, cadmium, or hafnium. Their insertion controls the reactor multiplication during power operations, and they shut down the chain reaction when fully inserted [37, 47].
3.4.1 Thermal reactors Thermal reactors use slow or thermal neutrons to maintain the fission chain reaction in
the fuel. The thermal reactors, such as PWR, BWR, CANDU, GCR, and RBMK dominate by
far the energy production by nuclear fission. Thermal reactors use a neutron moderator to
slow down fast neutrons from fission. The moderator is often also the coolant and most
commonly is used water under high pressure. The light water reactors (LWR) have become the most common reactor type. There are
two types of LWR: PWR and BWR. Both reactors have an efficiency of about 30% that
means, the thermal energy produced by nuclear fission is three times higher than the electrical
energy consequently produced in electric generator [37].
3.4.2 Fast reactors The fast reactors such as LMCR use a fast neutron spectrum, and materials used in the
reactor core must therefore be chosen so that neutrons are moderated as little as possible. Especially the coolant must be a material that is transparent to neutrons, that is why sodium is
used as a coolant. The main advantage of the fast reactor is that it can produce more fissile
material than it consumes. The primary fissile nuclide for a fast reactor is 239Pu, and the
primary fertile nuclide is 238U [36, 37]. Fast reactors have the potential to increase the energy available from the uranium.
However, they are still currently at the prototype or demonstration stage, and will become
commercially interesting only if uranium prices increase [37, 48].
3.4.3 Pressurized water reactor The predominant reactor design worldwide is the pressurized water reactor, accounting
for two-thirds of the installed capacity. This type of water-cooled reactor uses ceramic fuel
pellets consisting of UO2 or other fissile actinide oxides (MOX) to generate heat. The PWR is a thermal reactor type where neutrons are moderated by ordinary water which also serves as a
coolant. Light water´s large thermal absorption cross section precludes the possibility of
achieving criticality with natural 235U. So enrichment of the nuclear fuel is required, usually
2-5% of 238U is added. Typical pressurized water reactor is shown in the Figure 3.4.1 [37, 47].
�

��
�
Figure 3.4.1 Schematic diagram of a pressurized water reactor [49].
Structure of the reactor core A fuel element is made up by small uranium dioxide pellets, which are about 10 mm in
diameter and 10 mm high. These ceramic pellets (UO2 is an oxide ceramic) are encapsulated in 3-4 m long Zirkaloy tubes (fuel cladding) that transfer the nuclear heat to flowing water
coolant and serve as primary barrier containing the volatile radioactive fission byproducts.
The cladding also offers structural support. Zirkaloy tubes are grouped into fuel assemblies containing control rods or blades. PWRs contain approximately 200 assemblies, containing up
to 300 fuel rods. The PWR control rods are distributed throughout the square lattice and are
connected to each other to form a control rod cluster, as shown in Figure 3.4.2. Control rods
consist of stainless steel tubes filled with boron carbide for neutron absorption, and are inserted from the top of the reactor. There is no box around the assembly, so cross-flow of
water between assemblies is possible. The core is contained in a vessel pressurized to 1520
bar to prevent water boiling at operating temperatures in the range of from 290 °C to 320 °C
[37, 40, 47].
�

���
�
Figure 3.4.2 Schematic view of PWR fuel assembly [50].
Not all of the assemblies are identical, they may differ in fuel enrichment, or they may be
placed in the core during different refueling operations. The PWR core is typically operated nonstop for 18-24 months between refueling operations. During shutdown, typically lasting a
number of weeks, 20-30% of the assemblies containing fuel from which the fissile material is
most depleted are removed and replaced by fresh assemblies. The most depleted batches will
work as a neutron poison itself (they steal more neutrons than the fresh fuel). The most depleted fuel will be placed in the center of the core where neutron flux is more intense, while
the freshest fuel will be placed in the periphery of the core [37, 47].
Reactivity control Beside the short-term reactivity control, that is provided by control rods, long-term
reactivity control is also needed. It is provided by adding boric acid to the cooling water.
PWR primary water contains 1000 ppm B as boric acid (H3BO3). Boron concentration is then
reduced with fuel burn up to compensate fuel reactivity loss. PWR primary water also contains 2-4 ppm Li as LiOH added for pH control [37, 47].

���
�
3.5 Properties of the UO2 nuclear fuel
The properties of uranium dioxide have been investigated for decades. UO2 is a
crystalline oxide ceramic with a cubic fluorite type crystal structure. Some other parameters are shown in Table 3.3 [2].
Table 3.3 Physical parameters of UO2 [2, 3].
4�%%�&��1�!���%�!� ������+��
62��!�%�&�����+��%.� ������7&���
���%�+��1��+%� ����8��
����!������ ��������7����
Uranium dioxide also has very good high temperature stability, enhanced oxidation
resistance, good chemical compatibility with cladding and coolant and a resistance to irradiation [1].
As shown in the Figure 3.5.1, during the nuclear fission large amount of heat is generated
in the core of the fuel pellet. So the thermal conductivity is one of the most important
properties of UO2, because it determines the fuel temperature, thus directly affect the behavior and performance of fuel pellet in a reactor [1, 4].
Figure 3.5.1 Schematic view of the temperature gradient inside the fuel pellet.
Based on the experiment data, Fink [51] pointed out that the thermal conductivity of 95%
dense UO2 can be calculated by equation:
6 �788
9:;<8= - 79:>?�� - @:>7<��A-
><88
�BCA� DE# F�7>:@;
� G
Where t = T (K)/1000 and k is the thermal conductivity of 95% dense UO2
in W·m-1·K-1.
The temperature dependence of thermal conductivity is plotted in Figure 3.5.2 [1].

���
�
The thermal conductivity of irradiated UO2 is affected by the changes in pellet during irradiation. During irradiation, fission byproducts accumulate in the UO2 matrix, cause the
fuel swelling, and serve as phonon scattering centers, thus reduce the thermal conductivity of
the fuel. The fission product gases form small bubbles in UO2 lattice that also serve as phonon
scattering centers, thus reduce the thermal conductivity. Radiation damage from neutrons, -decay and fission products also increase the number of lattice defects and consequently
reduces the thermal conductivity of UO2 fuel [1, 52].
Figure 3.5.2 Temperature conductivity of UO2 [1].
Summary of important material properties of the UO2 for material engineering The most important material characteristic of the UO2 is capability of nuclear fission; for
use as the nuclear fuel in terms of material engineering is important:
• Low operation costs – the pellet production process must be cheap, easily
automatable and reproducible.
• Good workability – manufacturing the UO2 in the form of pellets suitable for
completation of the fuel rods must be easy.
• Good sinterability – UO2 must be able to reach desired density (95%) at relatively
low temperature and in reasonable time (to reduce operation costs).
• Mechanical resistance – UO2 must be durable enough not to crack during
completation of the fuel assembly
• Temperature stability – UO2 must be stable at elevated temperature to stand
temperatures during nuclear fission.
• Chemical compatibility with cladding and coolant – ability to prevent side reactions
that can bias the fission process.
• Thermal conductivity – ability to remove heat from the core of the pellet as fast as possible.

���
�
3.6 The UO2 thermal conductivity enhancement
Increasing the thermal conductivity of nuclear fuel would allow the output of a reactor to
be increased and enhance the safety of a reactor during normal operation and short-term
accidents. The maximum heat output from the reactor core could be increased by high thermal
conductivity of the fuel pellet enabling the reactor to produce more thermal energy while maintaining the power plant safety. Moreover, with a decrease of the temperature in the core
by increased thermal conductivity of the fuel pellet, temperature gradient in the fuel is
decreased allowing reduced fission gas release and number of cracked or broken pellets due to thermal stresses while maintaining the desired fuel and cladding temperatures. Reduction of the temperature gradient across the UO2 fuel pellet by increasing thermal its
conductivity is shown if Figure 3.6.1 [4].
The most promising way to improve the thermal conductivity of the UO2 fuel is adding
secondary highly conductive phase, in the form of fibers, whiskers or particles into UO2
matrix to retard grain growth and to increase thermal conductivity, as well as improve fracture
resistance of the fuel pellet. This secondary phase must not react with the UO2 or water, and
have a very low neutron absorption cross-section. The objective of thermal conductivity
enhancement is to improve the physical properties of the fuel using the minimum amount of
secondary material [5].
Figure. 3.6.1 Radial temperature gradient across a UO2 fuel pellet as a function of thermal conductivity [5].
As a highly conductive phase can be used different types of materials. One approach involves adding a highly conductive metal to the UO2 matrix that provides a continuous heat
conduction path, this type of composite material is commonly known as cermet. A fabrication
process creating a UO2-W composite with 6 vol.% W was manufactured with an 80% increase
in the thermal diffusivity compared to a standard UO2 fuel pellet [45]. A major problem with most cermets is that the neutronic properties of the metal are not appropriate for use in a
nuclear reactor (high neutron absorption cross-section) [5].
Other approach involves adding a highly conductive glassy phase to the UO2 matrix. For
example Ishimoto et al. [46] showed that significant improvements in thermal conductivity

���
�
could be achieved with only 3.2 vol.% of BeO as a continuous second phase at the grain boundaries of UO2. However the BeO as well as Be is highly toxic material, which makes
difficult to transfer this method to a commercial setting [5].
Last approach involves adding a highly conductive crystalline ceramic material to the
UO2 matrix. Tulenko at the University of Florida has been working on adding SiC to UO2 to increase the bulk thermal conductivity [47]. Silicon carbide is a potentially good material
because of its high thermal conductivity, low neutron absorption cross-section, good chemical
stability and good irradiation stability. The thermal conductivity of SiC single crystal is 60
times higher than that of UO2 at room temperature and 30 times higher at 800 °C. SiC can be used in form of particles or whiskers [4, 5, 54].
3.6.1 Properties of SiC Silicon carbide is a non-oxide ceramic, which was discovered by Edward Goodrich
Acheson in 1893. Several polytypes of SiC exist, like cubic, hexagonal or rhombohedral. The
most common polytypes are hexagonal -SiC (6H-SiC) with wurtzite crystal structure and
cubic �-SiC (3C-SiC) with zinc blende crystal structure. Some physical properties of both -
SiC and �-SiC are shown in Table 3.4 [2].
Table 3.4 Physical parameters of SiC [2,55].
� ������ ������
4�%%�&��1�!���%�!� ������9��������+�� ������+��
62��!�%�&�����+��%.� ������7&��� ������7&���
���%�+��1��+%� ����:��8�� ����:��8��
����!������ �������7���� �������7����
Silicon carbide has good chemical stability because of the protective silicon oxide (SiO2) layer forms on it, when exposed to oxidative atmosphere. Silicon carbide is also very hard
material with hardness 9.2-9.3 on the Mohs scale. SiC has low thermal neutron absorption
cross-section and the cubic form (�-SiC) isotropically expands when heated, both these
parameters are very favorable for use in the nuclear fuel [2, 55]��One of the most attractive properties of SiC is its high thermal conductivity. The thermal
conductivity of single crystal SiC measured by Slack at room temperature is 490 W·m-1·K-1,
which is higher than copper, 398 W·m-1·K-1. The thermal conductivity of polycrystalline �-SiC fabricated by CVD process is lower, about 70 W·m-1·K-1 at room temperature. Figure
3.6.2 shows the thermal conductivity dependence on temperature of single crystal SiC and
polycrystalline �-SiC. As shown in that Figure, thermal conductivity of SiC decreases with
increasing temperature. The thermal conductivity of SiC is mainly controlled by the lattice vibration waves (phonons). The phonon-phonon scatterings increase with increasing
temperature, which decrease the phonon mean free path and consequently decrease the
thermal conductivity. The single crystal SiC has higher purity and less defects than the
polycrystalline �-SiC, which also reflects in the thermal conductivity (the boundaries in the polycrystalline �-SiC serve as phonon scattering centers) [2, 5, 56].

���
�
Figure 3.6.2 Thermal conductivity of single crystal SiC and polycrystalline SiC compared to UO2 [2].
Silicon carbide is relatively stable when exposed to radiation and it also maintain its
properties at high temperature. Irradiation creates voids in the crystal structure of SiC that
cause expansion, but the structural integrity is not affected. The irradiation has a negligible
effect on the strength of SiC [2, 5, 56]. Silicon carbide is commonly manufactured by combining silica sand and carbon at high
temperature, from 1600 °C to 2500 °C. This manufacturing method is known as Acheson
process, but purity of the SiC crystals is relatively low compared to other methods. More
expensive, but very precise method to produce high purity SiC crystals is chemical vapor deposition (CVD) process. Pre-ceramic polymers can also be used to produce crystalline
silicon carbide. For example Allylhydridopolycarbosilane (AHPCS) was successfully
converted to crystalline �-SiC at 1600 °C by Zheng et al. [57]. Different attitude is needed to
produce SiC whiskers. There are two main methods to produce SiC whiskers, Rice Hull method and vapor-liquid-solid (VLS) method [2, 5].
3.7 The UO2 replacement for early stage research
There are lot of restrictions on use of the uranium dioxide in laboratory, because of
radioactivity of uranium which is contained in UO2, so for the first stage of the research is convenient to replace uranium dioxide by some other material. This material should be as
similar as possible to UO2 and be non radioactive. Such surrogate material should have the
same fluorite crystal structure as UO2 (FCC, space group Fm-3m). This is common in other f-
block oxides, notably the rare-earth element cerium, CeO2 and also the actinide thorium, ThO2. The fluorite structure also occurs in CaF2. The analogue must also have a
microstructure similar to the typical UO2 nuclear fuel [9, 10].
As very promising surrogate material seems to be cerium dioxide (CeO2), because of the
similarity of some material properties, such as melting temperature, crystal structure, low thermal conductivity and similar thermal diffusivity up to 700 °C. The CeO2 also has
advantages of well-established synthesis methods, good resistance to radiation damage, and
compatibility with PWR coolant (water) [11, 12].

���
�
3.7.1 Properties of CeO2
Ceria (CeO2), also known as Ceric oxide, Cerium oxide or Cerium dioxide is oxide
ceramic material. Cerium dioxide is a pale yellow-white powder (Figure 3.7.1) with cubic fluorite type crystal structure. This cubic structure is stable from room temperature up too its
melting point. Some other physical properties are shown in Table 3.5 [12, 58].
Table 3.5 Physical parameters of CeO2 [9, 59].
4�%%�&��1�!���%�!� �������+��
62��!�%�&�����+��%.� �������7&���
���%�+��1��+%� �����8��
����!������ ���������7����
Cerium dioxide has some other distinctive characteristics, such as unique UV absorbing, high refractive index or very good reactivity. It is also excellent oxygen ion conductor. At
high temperatures CeO2 can be reduced to a non-stoichiometric, anion deficient form that
retains the fluorite lattice. The non-stoichiometric form has a blue to black color, and exhibits
both ionic and electronic conduction with ionic being the most significant at temperatures above 500 °C [60, 61, 62].
The CeO2 is relatively hard material wit hardness 5-6 on the Mohs scale. It is also a very
poor thermal conductor with thermal conductivity of 12 W·m-1·K-1 at room temperature [30].
Figure 3.7.1 CeO2 powder
Ceria has been exploited to be used in extensive applications, including abrasives of
chemical mechanical planarization (CMP) slurry in semiconductor fabrication and polishing
material, especially for glass and stone polishing. It is used as an additive to glass (2-4%) to protect light sensitive materials (CeO2 acts as UV absorbent), in coating application for
protecting corrosion of metals, as a catalyst in oxidation and hydrogenation reactions and also
in electrochromic devices as a counter electrode. Cerium dioxide is widely used in automotive
industry as a catalytic support for automotive exhaust-gas conversion reaction for removal of SOx and NOx. It is also used as a gas sensor, in oxygen pumps and amperometric oxygen
monitors [12, 58].

���
�
Besides cerium dioxide is also one of the most promising electrolyte materials for solid oxide fuel cells (SOFC), because of its good oxygen ion conductivity. In the SOFC is CeO2
used in the doped form. Substitution of a fraction of the ceria by dopant element introduces
oxygen vacancies in the crystal structure without adding electronic charge carriers. This
increases the ionic conductivity and results in a better electrolyte. As dopant elements are mostly used gadolinium, samarium and yttrium [12, 30, 58, 63].
Recently, some important biomedical applications of non-stoichiometric ceria nano-
powder have been also investigated. For example a single dose of CeO2-x nanoparticles
protects the cells from free radicals to a higher extent than a single or multiple use of vitamin E, C or melatonin (Figure 3.7.2) and moreover owing to the unique ability of cerium dioxide
nanoparticles to self-regeneration, they can participate in an infinite number of reduction-
oxidation cycles (unlike conventional antioxidants). The CeO2-x nanoparticles in combination
with other antioxidants seems to be very promising to mitigate the consequences of spinal cord injury. Lately there is also a new trend of the use of cerium dioxide nanoparticles in
cancer therapy [58, 64].
Figure 3.7.2 Effect of pretreatment with a single dose of cerium dioxide nanoparticles on the cell damage by
free radicals (induced by UV radiation) as compared with a single dose of other antioxidants: 1) no
pretreatment; 2) CeO2-x (10 nmol ·l-1); 3) vitamin E (100 µmol ·l-1); 4) acetylcysteine (1 µmol ·l-1); 5) melatonin
(1 µmol ·l-1)[64].
Bulk cerium dioxide is manufactured using conventional closed stirred reactors. The
aqueous solution of rare earths salts is first neutralized, then poured into the reactor and after
the reaction completion, resultant suspension is filtered. The wet solid pulp may be then dried and/or calcined. The solid dried CeO2 may be grinded to adjust particle size. Nano-sized
cerium dioxide powder is most commonly manufactured using hydrothermal synthesis from
an aqueous solution of rare earths salts in a closed reactor. After addition of an acid, the
solution is diluted with demineralized water and neutralized with a base. All these steps are made in a closed system. Other methods to fabricate ceria nanoparticles may be used, such as
reversed micelles route, coprecipitation, forced hydrolysis, an electrochemical method,
solvothermal synthesis, sol-gel process, pyrolysis, sonochemical method and microwave
method [65, 66].

��
�
4 EXPERIMENTAL MATERIALS AND METHODS
The methodologies employed in this research are focused on the processing and characterization of pure and doped CeO2 pellets. Materials required for this research are
cerium dioxide and silicon carbide powders.
Instruments used for processing and characterization were: planetary mill, hand operated
uniaxial press, cold isostatic press, high temperature electric resistance furnace, the equipment used for preparation of samples for analysis, and analytical equipment.
4.1 Processing
The production of the doped and undoped fuel pellets entailed several steps. The first step
was to mix the silicon carbide with the cerium dioxide powder. Next, the powder mixtures were cold pressed into semi-dense compacts (green pellets). Then the green pellets were
sintered to achieve final densification.
4.1.1 Powder mixing The powders used in this research were the cerium dioxide powder (99.99% purity;
Verochem, China) and the silicon carbide powder (�-SiC GRADE 059; Superior graphite Co.,
Chicago Illinois). In the first part of the study the CeO2 powder was used in the pure form and
in the second part of the study SiC, as additive with high thermal conductivity, was added to the CeO2 powder at three different concentrations of 6 vol.%, 12 vol.%, and 18 vol.%.
Milling was performed to obtain smaller particles of CeO2 powder and homogenous
mixtures of SiC and CeO2. Powder mixtures or pure CeO2 powder were milled in planetary
mill for 2 hours with addition of isopropanol and ZrO2 balls. The zirconia milling balls were added to help break up aggregates during milling and to enhance homogenization.
One milling batch was composed of 60 g of powder (mixture); 200 g of TZP balls and
100 ml of isopropanol. The precision amount of silicon carbide and cerium dioxide powders
needed for one milling batch was computed as shown in Tables 4.1 – 4.3.
Table 4.1 6SiC-94CeO2
����� �!� "��#� $�� �����!�!�%���������� &'#� ()�*�� ������
���� ��;� �������� �����;� ��������
�� �� ��;� �������� �����;� ��������
+�&!�������*� ������*� �,+��������*� �������*�
���������-����
.�������!�
�������
�����������
/������
���� �������
0�����
!�%%�������
/���������
��������
1������
���! ��"���
���� �������

��
�
Table 4.2 12SiC-88CeO2
����� �!� "��#� $�� �����!�!�%���������� &'#� ()�*�� ������
���� ���;� ��������� �����;� ��������
�� �� �;� ������� ����;� ��������
Table 4.3 18SiC-82CeO2
����� �!� "��#� $�� �����!�!�%���������� &'#� ()�*�� ������
���� ��;� �������� ���;� �������
�� �� ��;� ������� ����;� ���������
4.1.2 Cold uniaxial pressing The cold press used in this research was the manual hydraulic press. The cold uniaxial
pressing of powders requires use of punch and die. The pressing set consists of stainless steel
die with 12 mm inner diameter and two stainless steel punches (Figure 4.1.1 a)). The process of cold pressing a pellet using this die set was as follows:
• weigh 4 g of doped or non-doped CeO2 powder
• clean each piece of the die using the ethanol and pulp
• coat the bottom punch in PEG (polyethylenglycol) solution and insert it into the die
• pour the powder mixture into the die
• coat the upper punch in PEG solution and insert it into the die
• place the whole set in the press and press and apply desired pressure for 3–5 minutes
• remove the lower punch, flip the die over and place a metal ring on top of the die
• reinsert the set in the hydraulic press to push out the pellet.
Each pellet in this study was pressed on approximately 50 MPa to obtain compact green body with mechanical properties sufficient for the next processing step of processing. Final
appearance of pellet is shown in the Figure 4.1.1 b).
a) b)
Figure 4.1.1 a) pressing die and punches; b) CeO2 pellet after pressing sequence.

���
�
4.1.3 Cold isostatic pressingThe cold isostatic press used in this research was Autoclave engineering hydraulic press
(Autoclave engineering, Inc., USA). The applied cold isostatic pressing technique requires
preformed green pellets, elastic cover (a medical probe covers for ultrasound scanning),
vacuum pump and finally the isostatic press apparatus. The process for cold pressing a pellet using this die set was as follows:
• insert the preformed green pellets into elastic cover (keep certain distance)
• evacuate the inner space of elastic cover and fasten its outlet
• place the whole assembly in the isostatic press apparatus and apply isostatic pressure
for 1 minute at preset pressure
• remove the assembly from the press, cut the elastic cover, and take out pressed pellets.
Selected pellets in this study were by 300 MPa of isostatic pressure to obtain required
green body density between 50% and 60% TD.
There are several reasons why the cold isostatic pressing was involved in this study. The main reason is, that the cold isostatic pressing, compare to uniaxial pressing, provides more
homogenous density profile of pellets. Secondary, application of isostatic pressure allows
high compaction pressures, which leads to increasing of green body density. Homogeneous
compression of green powder at high pressure after the uniaxial pressing allows to obtain higher final densities and to reduce cracking during the sintering process. The final
appearance of the CeO2 pellet after the cold isostatic pressing is shown in the Figure 4.1.2.
4.1.4 Pellet Sintering Electric resistance furnace The furnace used for heating and sintering of green pellets was HT08/17 furnace
(Nabertherm, Germany). The heating was accomplished with a super kanthal heating elements
inside the furnace chamber, which was cladded with alumina insulation. Pellets were placed on Al2O3 plate on the bottom of the furnace chamber.
Spark plasma sintering The apparatus used for the Spark Plasma Sintering (SPS) was Dr Sinter SPS
2050fabricated by SPS Syntex, Inc., Japan. SPS technique is already established sintering
technique capable of applying rapid heating, and it´s also known as plasma-activated sintering
or field-assisted sintering technique (FAST). Technically is SPS similar to conventional hot
pressing, in which a sample is loaded inside a graphite die and a uniaxial pressure is applied on it during the sintering process.
Sintering conditions
• without application of mechanical pressure The pellets were sintered at different temperatures from 1300 °C to 1700 °C with
step of 100 °C and the dwell time 1 hour. Samples were exposed to air atmosphereduring the heat treatment. Theheat up, and cool down rates were controlled
automatically with furnace heating control system. The heats up rates were 300 °C/h
and the cool down rates were 600 °C/h (Figure 4.1.2).

���
�
Figure 4.1.2 Temperature profile of sintering without mechanical pressure at temperature of 1500 °C.
• with application of mechanical pressure Pellets were sintered at 1500 °C in SPS during the first experiment, similarly with
UO2 sintering conditions in SPS, when this temperature should be optimal for
reaching relative density over 95 %. However, chemical reaction occurs at the
temperature of 1450 °C, when high amount of gas was produced. Consequently, experiments temperature had to be decreased to 1300 °C. The heats up rates were
6000 °C/h; the dwell time at 1300 °C was 5 minutes; mechanical pressure applied on
the pellet during sintering was 50 MPa; and running vacuum pump was surrounding
graphite sintering dies.
4.2 Characterization
Characterization of the sintered pellets was performed in order to compare the
microstructures, grain sizes and porosity of the doped and undoped pellets. To characterize
prepared samples following analytical methods were used: density measurements, optical microscopy, scanning electron microscopy, X-ray diffraction, differential thermal analysis
(DTA), dilatometric analysis and thermal conductivity measurements – laser flash method.
Sample preparation Cutting The sintered fuel pellets first needed to be cut into cross-sectional pieces to allow for
internal microstructural examination. Cutting was performed with a Struers Accutom-50 high
precision diamond saw. Samples were cut into halves and each part was used for various purposes.
Embedding in polystyrene After cutting the samples, one half of the sample needed to be set in polystyrene (PS) to
allow for grinding and polishing. The half of the sample was placed in the form that was made
of Al tube of desired diameter, poured with PS granules and placed in the dryer to let the PS
melt. Then the whole set was taken out from the dryer, cooled down, and the half of the pellet sealed in PS was removed from the Al tube.
�
���
���
���
��
����
����
����
����
� ��� ��� ��� ��� ���
1������ ��� 2��
1���� ���'�
1������ ����%����
!�����������
�"%���%�&�
����

���
�
Grinding and polishing The samples were ground and polished using a Struers TegraPol-25 grinder/polisher with
semi-automatic head. The grinder/polisher head attachment enabled semi-automatic operation
for six samples at a time with constant applied pneumatic pressure. Table 4.4 shows the
grinding and polishing parameters.
Table 4.4 Grinding and polishing sequence.
3��4���������-�� 1����5��� ��6� ��"� ������������ �� 7�����5�6�
���� �� ����� ���
���� ��� ����� ���
�<�� ��� ����� ���
��<�� ��� ����� ���
��<�� ��� ����� ���
Sample preparation for scanning electron microscopyThe other half of the pellet that was cut with Struers Accutom-50 was crushed with
hammer covered with pulp (to avoid contamination of the sample) to obtain fracture surface
for observation in SEM.
Investigation by SEM generally requires the sample to be electrically conductive
typically, to prevent a charging of the sample and thus image distortion. To prevent charging of nonconductive (and not-coated) samples low acceleration voltage was applied during SEM
analysis in this study.
4.2.1 Density measurements
The density of each sample was measured after sintering. Density measurements were
performed using the Archimedes method (EN 623-2). First, mass of the sample in air was
measured after heat treatment which is supposed to remove residual water. Then the sample
was placed in an exicator and the exicator was evacuated. Consequently, distilled water with addition of small amount of detergent was infused in the exicator and whole sample was
submerged. After removing from the exicator, apparent mass of the sample while submersed
in water was measured. The last step was measurement of the mass of the sample in air with
open pores filled with water. This form of the Archimedes method allows, together with knowledge of theoretical density, to determine ratio of closed and open porosity inside the
sample. The mass of the samples was measured using the Mettler AG60 analytical laboratory
scales.
4.2.2 Scanning electron microscopy Secondary and backscatter electron images were taken using the FIB/SEM Tescan Lyra3
XMH with digital image capturing system shown in Figure 4.2.1. Secondary electron images
reveal topographical information while backscatter electron images are used to show compositional contrast. Images were taken from surface of fractured samples at low voltage to
reveal micro structural characteristics and grain structures.
4.2.3 X-ray diffraction Both, surface of the sample or small amount of the sample grounded to powder can be
used for XRD analysis. The sample preparation may influence the results, for example
analysis from surface is not efficient if the surface has phase composition that doesn’t
represent whole sample.

���
�
Samples were investigated using a Rigaku(Cu K radiation) X-ray diffractometer. The XRD was operated at a voltage of 40 kV and current of 30 mA. As the source of X-rays was
used Cu anode. The resultant peaks were compared with known data for information about the
constituents and phases present. XRD spectra were taken of both the surface of the sintered
pellets and in some cases of the crushed powder.
4.2.4 Dilatometric analysis Dilatometric measurements were performed to describe sintering behavior of milled and
compacted CeO2 powder. The sample for the dilatometric analysis was pressed into the pellet with diameter of 6 mm and height of 10 mm. This pellet was prepared from pure CeO2
powder which was milled under previously described conditions and the final shape of the
green body was fabricated by the uniaxial pressing.
Dilatometric analysis was performed in L70/1700 dilatometer (Linseis, Germany). Before analysis sample was preheated at 200 °C, and exposed to air atmosphere during the thermal
dilatometric analysis. The temperature profile during the analysis is shown in the Figure 4.2.2.
Figure4.2.2 Temperature profile during thermal dilatometric analysis.
4.2.5 Thermogravimetric analysis Thermogravimetric analysis commonly known as TGA was performed on the CeO2 + SiC
sample to describe the thermal stability of the silicon carbide in the cerium dioxide matrix.
TGA analysis was performed on powder that contained CeO2 and 6% of SiC. This powder was prepared by milling under previously described conditions.
As apparatus for the thermogravimetric analysis was used 6300 TG-DTA device (Seiko
Instruments, Japan). The sample powder form was poured on the Al2O3 crucible and during
the thermogravimetric analysis was exposed to air atmosphere. The heating rate was preset on the value of 20 °C/min. and maximum temperature of the analysis was 1300 °C.
�
���
���
���
��
����
����
����
����
� �� ��� ��� ��� ��� ��� ��� ���
1������ ��� 2��
1���� ���'�

���
�
4.2.6 Thermal conductivity measurements The thermal diffusivity (Dth) of pellets was measured to determine thermal conductivity
of prepared pellets. The thermal diffusivity was measured using the laser flash method (LFA
1000; Linseis, Germany) at temperature range from 25 to 900 °C in vacuum (running pump).
Both the front and the back sides of the pellets were coated with thin layer of carbon before measurements. This coating was performed to prevent reflection of the laser beam. The
application of the carbon coating and the measuring apparatus are shown in the Figure 4.2.3.
The specific heat capacities (cp), as a function of temperature, were determined from the
chemical composition of the pellets using the Kopp-Neumann´s law. The heat capacity data of the CeO2 and SiC were obtained from the HSC chemistry 7 program (Outotec, Finland).
The thermal conductivities (kthH) of each material (pure CeO2 and CeO2 with different
ratio of SiC) was calculated using the equation � !H�����"#�$ !�[13].
a)
b)1b)1
c)
Figure 4.2.3a) Linseis LFA 1000 apparatus for measuring thermal diffusivity; b) Coating of the pellets with
carbon; c) Arrangement of pellets in the sample holder of LFA 1000.

���
�
5 RESULTS
5.1 Powder milling
The impact of milling on the particle size of the CeO2 powder is shown in the Figure
5.1.1. In the part a) are shown particles and agglomerates of unmilled powder. It can be seen that unmilled powder contains agglomerates with spiky morphology and their size is about 10
µm. After the 2 hours of milling (part b) the morphology of powder changed from spiky to
granular and agglomerates were crushed into small particles with size often about 0.2 µm.
Strong agglomerates remained, but they lost spiky character and their size was reduced below 3 µm.
a) b)
Figure 5.1.1 SEM images of the CeO2 powder: a) unmilled powder; b) milled powder
5.2 Characterization of green body pellets
Green body densities of pellets made of pure CeO2 and CeO2 with addition of different volume of SiC are shown in the Figure 5.2.1. All pellets were prepared from milled powders
and processing steps were identical for all pellet. Firstly, they were shaped in uniaxial
hydraulic press and then isostatically pressed in CIP. As can be seen in the Figure 5.2.1
relative densities of green body pellets were in the range between 61 % and 63 % and highest density was measured for pure CeO2 pellet.

���
�
Figure 5.2.1 Relative densities of the green body pellets with different volume of SiC.
5.3 Influence of processing on sintering behavior (of pure CeO2 pellets)
Sintering behavior was also significantly influenced by milling procedure. The influence
of sintering temperature and powder milling on the relative density of the CeO2 pellets is
shown in the Figure 5.3.1. Relative densities of pellets prepared from milled CeO2 powder and
sintered at 1550 °C and 1600 °C are not shown in the Figure 5.3.1, because pellets made of milled powder were not sintered at these temperatures.
The influence of processing sequence on the relative density of the CeO2 pellets is shown
in the Figure 5.3.2. All pellets were conventionally sintered in the air atmosphere at
temperature of 1500 °C for 1 hour, with the same heat up and cool down rates. We could observe significant increase of density after sintering when milling or cold isostatic pressing
were applied.
Figure 5.3.1 Comparison of relative densities of the CeO2 pellets prepared from milled and unmilled powder.
��=�;
��=�;
��=�;
��=�;
��=�;
��.8 ��.8�9�(#���� ��.8�9��8#���� ��.8�9��:#����
����"��!������ #�
��=�
��=�
��=�
��=�
�=�
�=�
�=�
�=�
���=�
���� ���� ���� ���� ���� ����
����"��!������ #�
1������ ��� 2��
+������
������
���
�
Figure 5.3.2 Comparison of relative densities of the CeO2 pellets prepared using different processing sequences
(all sintered at 1500 °C for 1 hour).
The dilatometric analysis was performed on the CeO2 pellet to ensure that cerium dioxide
remains stable during sintering in air atmosphere and to observe continuous shrinkage with increasing temperature. This analysis also helped to understand sintering process of the
cerium dioxide. The sample was heated to 1500 °C, with heating rates 10 °C/min up to 800°C
and 5 °C/min above 800 °C, and hold at this temperature for 1 hour. Results from dilatometric
analysis are shown in the Figure 5.3.3. The presented shrinkage curve shows that the highest shrinkage rate is around 1300 °C.
Figure 5.3.3 Dilatometric analysis of pure CeO2 pellet. Pellet was heated at 1500 °C in air atmosphere and hold
at this temperature for 1 hour.
��=�
��=�
��=�
��=�
�=�
�=�
�=�
�=�
���=�
��.8 ��.8����! ��.8��,+ ��.8����!�9��,+
����"��!������ #�
��
��
��
��
�
�
�
�
���
��� ��� �� ���� ���� ���� ���� ��� ����
����"��!������ #�
1������ ��� 2��
���� ������������������

��
�
Microstructure of pellets prepared from the unmilled powder is demonstrated in the Figure 5.3.4. The influence of sintering temperature on morphology of pellets sintered at 1300
°C and 1700 °C both for 1 hour can be observed.
The influence of the processing sequence on the microstructure of pellets is shown in the
Figure 5.3.5; these pellets were sintered at 1500 °C for 1 hour.
a) b)
Figure 5.3.4 Microstructure of unmilled CeO2 pellets sintered at: a) 1300 °C/1 hour; b) 1700 °C/1 hour
a) b) c)
Figure 5.3.5 Microstructure of pure CeO2 pellets sintered at 1500 °C/1 hour from; a) raw powder; b) raw
powder + CIP; c) milled powder (LTM02) + CIP

��
�
5.4 Characterization of conventionally sintered CeO2 + SiC pellets
The influence of sintering temperature and processing sequence on the relative density of
the CeO2 + 6% SiC pellets is shown in the Figure 5.4.1. Dwell time on the sintering temperature was 1 hour in all cases and heat up and cool down rates were identical. We can
observe only very small influence of sintering temperature on densification.
�Figure 5.4.1 Temperature depandance of relative densities of the CeO2 + 6% SiC pellets sintered in air
atmosphere.
Samples from selected conventionally sintered CeO2 + 6% SiC pellets were used for scanning electron microscopy to analyze microstructure and an influence of sintering in
oxidative atmosphere on the appearance and distribution of the silicon carbide in CeO2 matrix.
The microstructure of the CeO2 + 6% SiC pellet sintered at 1600 °C for 1 hour is shown in the
Figure 5.4.2. Different morphology of CeO2 was observed and second phase was identified on grain boundary of bigger CeO2 grains.
��=�
��=�
��=�
��=�
��=�
��=�
��=�
��=�
�=�
���� ���� ���� ����
����"��!������ #�
1������ ��� 2��
������
�������>��?�

���
�
Figure 5.4.2 Microstructure of the CeO2 + 6% SiC conventionally sintered in air atmosphere.
XRD analysis was performed on the CeO2 + 6% SiC pellets to analyze if the SiC remains
in the CeO2 matrix after sintering in oxidative atmosphere. The result of XRD analysis of the
CeO2 + 6% SiC pellet is shown in the Figure 5.4.3. This pellet was sintered at 1600 °C for 1
hour. It is the same pellet that’s microstructure is shown in the Figure 5.4.2. It is obvious that SiC was oxidized during sintering at high temperatures and newly form phase is mainly SiO2.
Figure 5.4.3 XRD analysis of the CeO2 + 6% SiC pellet sintered at 1600 °C/ 1 hour.
Thermogravimetric analysis was also performed on milled CeO2 + 6% SiC powder for better understanding of the silicon carbide thermal stability in air atmosphere inside the CeO2
matrix. The result of TGA analysis is shown in the Figure 5.4.4, and demonstrates thermal
stability of SiC inside the CeO2 matrix up to approximately 1050 °C.
�� �� �� �� �� �� �
8�1���� 2� �
;�
�
;�
;�
;� ;� ;�;�
;�
�
;���.8�
����.8�
�
�
���
�
Figure 5.4.4 Thermogravimetric analysis of milled CeO2 + 6% SiC powder.
5.5 Characterization of CeO2 and CeO2 + SiC pellets sintered in SPS
The relative densities of the CeO2 and CeO2 + SiC pellets sintered by spark plasma sintering are shown in the Figure 5.5.1 (note that theoretical density of CeO2 was taken into
account). All pellets were sintered at the same conditions, the temperature was set to 1300 °C,
dwell time was 5 minutes and applied mechanical pressure was 50 MPa.
Figure 5.5.1 Relative densities of the CeO2 and CeO2 + SiC pellets after sintering in SPS.
=�
=��
=
=�
=
=�
���
���=��
���=�
���=��
� ��� ��� ��� ��� ��� ��� ��� �� �� ���� ���� ���� ���� ����
13� #�
1������ ��� 2��
��=�
��=�
��=�
��=�
�=�
�=�
�=�
�=�
���=�
��.8 ��.8�9�(#���� ��.8�9��8#���� ��.8�9��:#����
����"��!������ #�

���
�
Selected samples of CeO2 and CeO2 + SiC pellets sintered in SPS were taken and studied in the scanning electron microscope to analyze the influence of spark plasma sintering on the
microstructure.
The comparison of microstructures of the conventionally sintered CeO2 pellet and the
CeO2 pellet sintered by spark plasma sintering is shown in the Figure 5.5.2. For the comparison with pellet sintered in SPS was chosen pellet that was conventionally sintered at
1500 °C for 1 hour, because of theirs similar densities. We can observe fine morphology of
SPS sintered CeO2 caused by lower sintering temperature.
The microstructure of the CeO2 + 6% SiC pellet sintered in SPS is shown in the Figure 5.5.3. We can observed SiC particles evenly distributed inside the CeO2 matrix, however the
boundary between SiC particles and CeO2 matrix wasn’t ideal and SiC particles were like
loosely inserted into the CeO2 matrix.
a) b)
Figure 5.5.2 Microstructure of pure CeO2 pellets; a) conventionally sintered at 1500 °C/1 hour (95.2% TD); b) sintered in SPS 1300/50 MPa/5 min (87.2% TD).
a) b) c)
Figure 5.5.3 Microstructure of the CeO2 + 6% SiC pellet sintered in SPS (1300 °C/50 MPa/5 min.); a)
magnitude 4000x; b) magnitude 10 000x; c) magnitude 30 000x

���
�
XRD analysis was performed on the CeO2 + 6% SiC pellets sintered in SPS to analyze presence of SiC after the sintering process to compare it with conventionally sintered pellets.
The result of the XRD analysis of the CeO2 + 6% SiC pellet is shown in the Figure 5.5.4. We
can observed that SiC remained in the structure in unchanged state, but CeO2 was reduced to
Ce2O3.
Figure 5.5.4 XRD analysis from the surface of the CeO2 + 6% SiC pellet sintered in SPS.
Because XRD analysis reveals that CeO2 was reduced to Ce2O3 during the spark plasma sintering, the CeO2 + SiC pellets were annealed at 500 °C for 3 hours in air atmosphere. The
XRD analysis was implemented again after the annealing and results from this analysis are
shown in the Figure 5.5.5. We have found that Ce2O3 was re-oxidized to CeO2 but SiC was
also largely oxidized.
Figure 5.5.5 XRD analysis from the crushed powder of the CeO2 + 6% SiC pellet sintered in SPS
and annealed in air atmosphere.
� � � � � � �
8�1���� 2� �
��=� ��=� ��=� ��=� ��=� ��=� �=�8�1���� 2� �
;�;�
;�
;� ;�
;�
��
;���.8�
�����
���8.<�
� ��8��8.=�
�
��
�� ;�;�
�
�
� ��
�
××
×
����
��
�
;�;�
;�
;� ;�
;���
;���.8�
�����
� ��8��8.>�
�� ��;� ;�
��×
���
�
Samples from the CeO2 + SiC pellets sintered in SPS and annealed in air atmosphere were studied in the scanning electron microscope to analyze the influence of annealing on the
microstructure and the appearance of the silicon carbide. The microstructure of the CeO2 +
6% SiC pellet is shown in the Figure 5.5.6. As it is obvious from this figure, annealing caused
emergence of large number of cracks in the microstructure.
a) b) c)
Figure 5.5.6 Microstructure of the CeO2 + 6% SiC sintered in SPS and annealed in air atmosphere; a) 4000x;
b)10 000x; c) 30 000x
5.6 Thermal conductivity measurements
a) Green bodies Thermal conductivity respectively thermal diffusivity measurements were implemented
on the green body CeO2 and CeO2 + SiC pellets prepared by uniaxial and cold isostatic
pressing (their relative densities are shown in the Figure 5.2.1). The thermal diffusivity of the
green body pellets were measured from laboratory temperature up to 500 °C with step of 100 °C. Thermal conductivities of the CeO2 and CeO2 + SiC pellets were then calculated and their
dependence on the temperature is shown in the Figure 5.6.1. We can observe that thermal
conductivity of green pellets gradually decreases with increasing volume of silicon carbide.
b) Sintered pellets Thermal diffusivity of conventionally sintered CeO2 and CeO2 + SiC pellets was
measured from room temperature up to 900 °C with step of 100 °C, and consequently thermal
conductivities were calculated. Changes of thermal conductivities with temperature for conventionally sintered CeO2 pellets and CeO2 and CeO2 + 6% SiC pellets sintered in SPS are
shown in the Figure 5.6.2. Thermal conductivity of conventionally sintered CeO2 pellets was
higher than thermal conductivity of CeO2 sintered in SPS and lowest thermal conductivity
was measured on CeO2 + 6% SiC pellets sintered in SPS. Thermal conductivity dependence on the temperature of the CeO2 + 6% SiC and CeO2 +
12% SiC pellets sintered in SPS and annealed in air atmosphere is shown in the Figure 5.6.3.
For comparison is there also shown the thermal conductivity of the CeO2 + 6% SiC pellets
���
�
sintered in SPS without annealing. It is obvious that annealing had negative impact on thermal conductivity of CeO2 + SiC pellets.
Figure 5.6.1 Thermal conductivities of green body CeO2 and CeO2 + SiC pellets.
Figure 5.6.2 Comparison of thermal conductivities of conventionally sintered CeO2 pellets and CeO2 and CeO2 +
6% SiC pellets sintered in SPS.
�=��
�=��
�=��
�=��
�=��
�=��
�=��
� ��� ��� ��� ��� ��� ���
1����
�����! ��"�� �
�4��4��
1������ ��� 2��
�;����
�;����
��;����
�;����
�=�
�=�
�=�
�=�
=�
��=�
��=�
��=�
��=�
� ��� ��� ��� ��� ��� ��� ��� �� �� ����
1����
�����! ��"�� �
?���?�
���
1������ ��� 2��
�;�������!
�;��������
�;��������

���
�
Figure 5.6.3 Comparison of thermal conductivities of the CeO2 + 6% SiC and CeO2 + 12% SiC pellets sintered in
SPS and annealed in air and CeO2 + 6% SiC pellets sintered in SPS without annealing.
�=�
�=�
�=�
�=�
�=�
�=�
�=�
�=�
� ��� ��� ��� ��� ��� ��� ��� �� �� ����
1����
�����! ��"�� �
?���?�
���
1������ ��� 2��
��;����������++�����
�;��������
�;����������++�����

���
�
6 DISCUSSION
The aim of this chapter is to discuss our results especially with relation to using CeO2 as surrogate material for UO2. Our experiments were designed to replicate experiments done
with UO2 and additives for increasing of the thermal conductivity.
Behavior of CeO2 vs. UO2 Relative densities of the green body pellets prepared by uniaxial and cold isostatic
pressing are in the range between 61 % and 63 %. Such high values were achieved thanks to
very good compressibility of CeO2 powder and soft aggregates inside the starting powder,
which can be easily milled down. Change of powder morphology after of raw CeO2 powder is shown in the Figure 5.1.1, relatively short milling time (2 hours) allows significant change of
powder. Further prolongation of milling time or its shortening can be used as efficient tool for
microstructure tailoring.
Firstly, an influence of powder milling on relative density of sintered CeO2 pellets was investigated. The results shown in the Figure 5.3.1 reveal, that difference in relative density
between pellets prepared from unmilled and milled powder is about 7 % at all sintering
temperatures, except for 1700 °C where the relative density of the pellets prepared from
unmilled powder is slightly higher than those prepared from milled powder. Positive impact of powder milling on relative densities of sintered CeO2 pellets can be explained by a change
in the morphology of powder, see Figure 5.1.1. However, if temperature reaches 1700 °C the
green body morphology does not play so significant role and grain growth is main force of
densification. Our target relative density was 95 % because it is density of UO2 pellets used as nuclear fuel.
Secondly, an influence of processing sequence on the relative density of sintered CeO2
pellets was investigated. The results are shown in the Figure 5.3.2 and indicate that highest
relative density was achieved using both milling and cold isostatic pressing (all pellets were sintered under the same conditions 1500 °C/1 hour). This figure also shows that single
operation of milling has on the relative density almost the same impact as cold isostatic
pressing, but there is a big difference in the microstructure of sintered pellets, see Figure
5.3.5. Grain and pore size is much more higher in the case of isostatically pressed pellets prepared from unmilled powder compared to pellets prepared from milled powder. The Figure
5.3.2 also shows that our target density (95 %) was already achieved at sintering temperature
of 1500 °C in case that both milling and cold isostatic pressing were applied. This is 200 °C
drop compared with pellets in whose preparation CIP wasn’t involved.
Sintering of CeO2 with SiC Mixture of CeO2 with SiC was sintered in air conditions to replicate experiments with
UO2 [8]. The influence of sintering temperature and CIP involving in the forming sequence on
relative density of conventionally in air atmosphere sintered CeO2 + 6% SiC pellets was
firstly investigated. The results shown in the Figure 5.4.1 reveals almost no impact of cold
isostatic pressing and sintering on the relative density of the CeO2+6% SiC pellets. Relative densities after sintering remain in the range from 75.0% to 78.4% and even 300 °C
temperature difference does not make significant difference. Such densities are very low in
comparison with relative densities of pure CeO2 pellets and presence of SiC in starting
mixture blocked densification. Samples from the pellets were taken and observed in scanning electron microscope to
explain the reasons of such low relative densities. SEM images of microstructure of CeO2 +

��
�
6% SiC pellets sintered in air atmosphere reveals that no silicon carbide was present, but there was a large amount of some glassy looking phase in the CeO2 matrix, see Figure 5.4.2.
XRD analysis (Figure 5.4.3) disclosed that SiC during conventional sintering in air
atmosphere was changed into SiO2, carbon from SiC escaped from the sample in the form of
CO2. Thermogravimetric analysis, which was also performed on the CeO2 + 6% SiC powder,
determined temperature of SiC decomposition in the CeO2 + 6% SiC powder stable during
conventional sintering in air atmosphere. The result is shown in the Figure 5.4.4 and indicates
that SiC remains stable up to 1050 °C and because all our sintering temperatures were above this temperature we can expect oxidation.
All the experiments and analysis mentioned above showed us that conventional sintering
in air atmosphere is not the right procedure to prepare CeO2 + SiC pellets in which the silicon
carbide remains in unchanged state to be able to improve thermal conductivity of pellets. However, the formation of SiO2 in CeO2 + SiC sintered in air atmosphere is similar to
behavior of UO2 + SiC reported by Solomon et al [8]. Alternative additive for enhancement of
thermal conductivity of a nuclear fuel should be used during sintering in air atmosphere.
Spark plasma sintering SPS So the next step was preparation of CeO2 and CeO2 + SiC pellets under such conditions
where no SiC degradation occurs. Successful densification of UO2 with SiC additives by
spark plasma sintering was reported in literature, when both high density and enhanced thermal conductivity were achieved [50]. Therefore our surrogate material was also sintered
in spark plasma sintering conditions. The relative densities of the CeO2 and CeO2 + SiC
pellets sintered in SPS are shown in the Figure 5.5.1. Relative densities of all pellets were in
the range between 85.4% and 92.7% (calculated for CeO2 and SiC mixture). Such densities look like below our target density, however due to simultaneous change of phase composition
its real theoretical value can be different. The main reason of relatively low density is low
sintering temperature (1300 °C), originally the temperature 1500 °C was targeted similarly
with sintering of UO2 + SiC mixture in SPS. The low temperature was necessary because of chemical reaction which occurs at temperature of 1450 °C, when high amount of gas was
produced. XRD analysis and microstructure analysis of the CeO2 + 6% SiC pellet, see Figure
5.5.3, reveals that silicon carbide is generally stable during sintering in SPS, but small part of
SiC reacted with CeO2 and formed silicate (Ce2Si2O7). The XRD analysis (Figure 5.5.4) also revealed that CeO2 was reduced to Ce2O3 during the sintering in SPS. The formation of
silicate is the biggest difference in behavior of CeO2 and UO2 during spark plasma sintering.
Behavior of UO2 in SPS was reported by Ge et al. [67].
The fact that CeO2 was reduced to Ce2O3 wasn’t satisfying for us so we decided to oxidize Ce2O3 back to CeO2 by annealing the pellets in air atmosphere at 500 °C for 3 hours. After
this annealing, SEM and XRD analyses showed reversible oxidation of Ce2O3 to CeO2.
Non annealed CeO2 pellets were compared with CeO2 pellets sintered directly in air
atmosphere at 1500 °C. This comparison of microstructures (Figure 5.5.2) reveals that pellets sintered by spark plasma sintering have smaller grain and pore size. This can easily be
explained by lower sintering temperature, shorter dwell time on this temperature and
application of mechanical pressure during sintering in SPS. SEM observations of annealed CeO2 + SiC pellets revealed that microstructure of
annealed pellets have completely changed. There were no evidence of SiC in the
microstructure an there were micro cracks all over the samples, see Figure 5.5.6, where the
microstructure of the CeO2 + 6% SiC pellet is shown. XRD analyses showed that our plan to re-oxidize Ce2O3 to CeO2 worked well, and also showed that silicon carbide is present in the
microstructure. The reason why we were not able to see the silicon carbide in SEM may be
��
�
creation of thin layer of SiO2 or Ce2Si2O5 on the surface of SiC particles, so identifiability of SiC in the microstructure was made very difficult.
The CeO2 behavior in SPS is similar to behavior of UO2 that reported Ge et al. [67]. They
used a hyper stoichiometric UO2 starting powder in their work to achieve presence of UO2 in
sintered pellets. Nevertheless, CeO2 has stronger tendency to decompose than UO2 and moreover decomposition of CeO2 starts at lower temperature.
Thermal conductivity measurements Firstly, thermal conductivities of the CeO2 and CeO2 + SiC green body pellets were
measured firstly and results from these measurements are shown in the Figure 5.6.1. These
measurements should demonstrated clear trend of SiC addition without influence of sintering
and phase changes during the heat treatment. Thermal conductivities of green body pellets
were measured up to 500 °C because at temperatures above 500 °C sintering of green pellets starts to play an important role and would affect measured thermal conductivities. Thermal
conductivity measurements revealed that thermal conductivity decreases with increasing
volume of SiC in the pellet. This is exactly the opposite result from expected, because
increasing volume of highly thermally conductive SiC inside pellets should increase thermal conductivity of cerium dioxide mixture. This discrepancy between the expectations and the
measured results can be explained by the fact that with increasing volume of SiC, number of
interphase boundaries between CeO2 and SiC is also increasing. Because these pellets weren’t
sintered the boundaries between CeO2 and SiC are not continuous. These interphase boundaries act as phonon scattering centers and this enhanced number of phonon scattering
centers result in decrease of thermal conductivity of green body CeO2 + SiC pellets [13, 29,
68].
Thermal conductivities of sintered CeO2 and CeO2 + SiC pellets were also measured. Thermal conductivities of sintered pellets were measured up to 900 °C. In the Figure 5.6.2 is
shown comparison of thermal conductivities of pure CeO2 pellet sintered in air atmosphere,
CeO2 pellet sintered in SPS and CeO2 + 6% SiC pellet sintered in SPS. The highest thermal
conductivity was measured on the CeO2 pellet sintered in air atmosphere, lower thermal conductivity had CeO2 pellet sintered in SPS and the lowest thermal conductivity had CeO2 +
6% SiC pellet sintered in SPS.
The difference between thermal conductivity of the CeO2 pellet sintered in air atmosphere
and the CeO2 pellet sintered in SPS should have several reasons. The first reason may be presence of some micro cracks in the microstructure of CeO2 pellet sintered in SPS. The
second reason can be also found in the different microstructures of these pellets. The grain
size of the CeO2 pellet sintered in SPS is smaller than CeO2 pellet sintered in air atmosphere,
see Figure 5.5.2. The third reason may be the difference in relative densities of pellets and presence of Ce2O3. The relative density of CeO2 pellet sintered in air is 95.4% and the relative
density of CeO2 pellet sintered in SPS is only 85.4%.
Outcome of all these differences is increase of boundaries in the CeO2 pellet sintered in
SPS, whether it is boundaries between grains or boundaries between solid material and pores. These boundaries act as a phonon scattering centers and therefore thermal conductivity of the
CeO2 pellet sintered in SPS must be lower than thermal conductivity of the CeO2 pellet
sintered in air. Thermal conductivity of the CeO2 pellet sintered in air reached the value of 14.1 W·m-
1·K-1 at 25 °C. Such value is slightly higher than that reported in the literature. For example
Mogensen [30] stated thermal conductivity of pure CeO2 on value of 12 W·m-1·K-1 at room
temperature, and Shackelford [69] stated that thermal conductivity of pure CeO2 is 9.58 W·m-
1·K-1 at 400 K (126.85 °C). Thermal conductivity measured by us was 10.95 W·m-1·K-1 at 100
���
�
°C and its very close to values reported in literature. Some differences are expected because of various microstructures of reported materials.
When comparing thermal conductivity of CeO2 pellet sintered in SPS and CeO2 + 6% SiC
pellet sintered in SPS, higher thermal conductivity was measured on the CeO2 pellet. This
result was again contrary to our expectations, similarly with the case of green body pellets. Microstructure is the reason why thermal conductivity of pellet with addition of high
conductive SiC was lower than thermal conductivity of pure CeO2 pellet. This microstructure
is shown in the Figure 5.5.3 and there can be seen that the boundary between SiC particles
and CeO2 matrix is not continuously connected. SiC particles are like loosely inserted into the CeO2 matrix so there isn’t good contact between SiC and CeO2. This bad contact between SiC
particles and CeO2 matrix creates once more high number of interphase boundaries and thus
high number of phonon scattering centers. This phonon scattering centers again greatly
reduces thermally conductivity of CeO2 + 6% SiC pellet. The problem of grain boundary is very similar also for UO2 + SiC system as it was reported in literature [8, 53] and we can
expect similar solutions for both systems.
In the Figure 5.6.3 is shown comparison of thermal conductivities of the CeO2 + 6% SiC
pellet sintered in SPS and CeO2 + 6% SiC and CeO2 + 12% SiC pellets sintered in SPS and annealed in air atmosphere. The highest thermal conductivity of these pellets was measured
on the CeO2 + 12% SiC annealed pellet. This result meets our expectations that sufficient
amount of SiC will increase thermal conductivity, however absolute value of thermal
conductivity of is 3.1 W·m-1·K-1 at 25 °C that is two times lower than thermal conductivity of pure CeO2 pellet sintered in SPS and almost four times lower than thermal conductivity of
pure CeO2 pellet sintered in air. Therefore, the positive effect of SiC, as highly conductive
phase, outweighed the negative effect of SiC as phonon scattering center.
Nevertheless, if we compare thermal conductivities of CeO2 + 6% SiC and CeO2 + 12% SiC pellets sintered in SPS and annealed in air atmosphere, the CeO2 + 12% SiC pellet has
higher thermal conductivity. Further increase of SiC concentration could further improve
thermal conductivity, however, nuclear fuel have to be extensively modified.
Annealing of pellets prepared in SPS also changed thermal conductivity as it is shown in the Figure 5.6.3. When we compare thermal conductivities of annealed and not annealed
CeO2 + 6% SiC pellets, it is obvious that thermal conductivity of not annealed pellet is
slightly higher. Explanation of this higher conductivity may be again found in the
microstructure of the pellets. The CeO2 + 6% SiC pellet after annealing contains a large number of micro cracks (Figure 5.5.6) that work again as phonon scattering centers. Another
reason of lower thermal conductivity of annealed pellet may be that Ce2O3 that can be found
in not annealed pellets, see XRD pattern in Figure 5.5.4, has significantly different thermal
conductivity than CeO2.

���
�
7 CONCLUSIONS
In this work we have successfully performed experiments evaluating a possibility of using CeO2 as a surrogate material for a laboratory study of thermal conductivity enhancement of
nuclear fuel.
• We have successfully prepared pure CeO2 pellets with relative density above 95%, similarly with UO2 pellets. We have verified that thermal conductivity of the CeO2
pellets depends strongly on microstructure of the pellets. Microstructure of pure CeO2
pellets as well as thermal conductivity highly depends on sintering temperature, type of sintering process (conventional, SPS), and combination of processing. Therefore
final microstructure of pellets can be easily changed to replicate microstructure of
UO2.
• We determine the sintering behavior of SiC in CeO2 matrix and we examined that is
similar to behavior of SiC in UO2 matrix. Both mixtures have disruptions on SiC-
matrix grain boundary. We also verified that composite pellets with addition of SiC can’t be conventionally sintered in air atmosphere without oxidation of SiC to SiO2.
These composites pellets can be prepared by involving spark plasma sintering instead
of conventional sintering. However, main limitation of CeO2 is its reduction to Ce2O3
during sintering in SPS, even at relatively low temperatures.
• SiC additive inside the CeO2 matrix has negative influence on thermal conductivity at high temperatures. All composite pellets had lower thermal conductivities than pure
CeO2 pellets, which was caused by phonon scattering on imperfect boundaries
between CeO2 matrix and SiC particles. In this stage of research we didn’t manage to find the way to eliminate these imperfect boundaries.
• CeO2 composites with SiC have lower thermal conductivity, than pure CeO2, whereas
UO2 composites with SiC described in literature have higher thermal conductivity. But also for UO2 composites addition of SiC increased thermal conductivity only very
slightly. The reason why the addition of SiC in the case of both these composites did
not lead to a significant increase in thermal conductivity is imperfect boundary
between SiC particles and CeO2 matrix.
In this work was approved that cerium dioxide (CeO2) is, with small limitations, suitable
surrogate material for UO2 in research of thermal conductivity enhancement of nuclear fuel
pellets.

���
�
LIST OF REFERENCES
[1] WANG, Jiwei. Developing a high thermal conductivity nuclear fuel with silicon carbide additives. Florida, 2008. Dissertation. University of Florida.
[2] KAPOOR, K., Ansar, LAKSMINARAYANA, Ahmad and RAO, G.V.S., Hemanth.
Fracture properties of sintered UO2 ceramic pellets with duplex microstructure. Journal of
Nuclear Materials. 2007, vol. 366, 1-2, p. 87-98. DOI:
http://dx.doi.org/10.1016/j.jnucmat.2006.12.044.
Available from: http://www.sciencedirect.com/science/article/pii/S0022311507000050
[3] CARBAJO, Juan, et al. A review of the thermophysical properties of MOX and UO2
fuels: Comparison of UO2 and MOX Fuels. Journal of Nuclear Materials . 2001, vol. 299,
issue 3, p. 439-464. DOI: http://dx.doi.org/10.1016/b978-0-08-056033-5.00038. Available from: http://www.sciencedirect.com/science/article/pii/S0022311501006924
[4] YEO, S., et al. Enhanced thermal conductivity of uranium dioxide–silicon carbide
composite fuel pellets prepared by Spark Plasma Sintering (SPS). Journal of Nuclear Materials. 2013, vol. 433, 1-3, p. 66-73. DOI:
http://dx.doi.org/10.1016/j.jnucmat.2012.09.015.
Available from: http://www.sciencedirect.com/science/article/pii/S0022311512004928
[5] HOLLENBACH, D.F., et al. Technical Project Plan for The Enhanced Thermal
Conductivity of Oxide Fuels Through the Addition of High Thermal Conductivity Fibers and
Microstructural Engineering. OAK RIDGE NATIONAL LABORATORY, 2010.
Available from:
http://www.researchgate.net/publication/255220534_Technical_Project_Plan_for_The_Enhan
ced_Thermal_Conductivity_of_Oxide_Fuels_Through_the_Addition_of_High_Thermal_Con
ductivity_Fibers_and_Microstructural_Engineering
[6] YANG, Jae Ho, et al. A fabrication technique for a UO2 pellet consisting of UO2
grains and a continuous W channel on the grain boundary. Journal of Nuclear Materials. 2006, vol. 353, issue 3, p. 202-208. DOI: http://dx.doi.org/10.1016/j.jnucmat.2006.01.019.
Available from: http://www.sciencedirect.com/science/article/pii/S0022311506001784
[7] ISHIMOTO, Shinji, et al. Thermal Conductivity of UO2-BeO Pellet. Journal of Nuclear Science and Technology. 1996, vol. 33, issue 2, p. 134-140. DOI:
10.1080/18811248.1996.9731875.
Available from: http://www.tandfonline.com/doi/abs/10.1080/18811248.1996.9731875
[8] U.S. DEPARTMENT OF ENERGY. Developing a High Thermal Conductivity Fuel
with Silicon Carbide Additives. University of Florida, 2012.
Available from: https://inlportal.inl.gov/portal/server.pt/document/114329/neup-project-09-
773-final-report_pdf
[9] STENNETT, Martin C., et al.. Preparation, characterization and dissolution of a CeO2
analogue for UO2 nuclear fuel. Journal of Nuclear Materials. 2013, vol. 432, 1-3, p. 182-188.
DOI: http://dx.doi.org/10.1016/j.jnucmat.2012.07.038.

���
�
Available from: http://www.researchgate.net/publication/256773977_Preparation_characterisation_and_dissol
ution_of_a_CeO2_analogue_for_UO2_nuclear_fuel
[10] GODINHO, José R.A., et al. Sintering of CaF2 pellets as nuclear fuel analog for surface stability experiments. Journal of Nuclear Materials. 2011, vol. 419, 1-3, p. 46-51.
DOI: http://dx.doi.org/10.1016/j.jnucmat.2011.08.031.
Available from: http://www.sciencedirect.com/science/article/pii/S0022311511008087
[11] SONODA, T., et al. Electronic excitation effects in CeO2 under irradiations with high-
energy ions of typical fission products. Nuclear Instruments and Methods in Physics Research
Section B: Beam Interactions with Materials and Atoms. 2006, vol. 250, 1-2, p. 254-258.
DOI: http://dx.doi.org/10.1016/j.nimb.2006.04.120.
Available from: http://www.sciencedirect.com/science/article/pii/S0168583X06006045
[12] CHOI, Kwanghoon, et al. Densification of nano-CeO2 ceramics as nuclear oxide surrogate by spark plasma sintering. Journal of Nuclear Materials. 2010, vol. 404, issue 3, p.
210-216. DOI: http://dx.doi.org/10.1016/j.jnucmat.2010.07.018.
Available from: http://www.sciencedirect.com/science/article/pii/S0022311510003168
[13] BARSOUM, Michael W. Fundamentals of ceramics. [2nd. ed.]. New York: Taylor,
c2003, xviii, 603 p. ISBN 07-503-0902-4.
[14] Advanced ceramics. EncyklopaediaBrittanica online .2014 [cit. 2014-05-17].
Available from: http://www.britannica.com/EBchecked/topic/6657/advanced-ceramics
[15] Ceramic structures. NDT Resource center . [cit. 2014-05-17].
Available from: http://www.ndt-
ed.org/EducationResources/CommunityCollege/Materials/Structure/ceramic.htm
[16] Covalent bonds. People.seas.harvard.edu .2001 [cit. 2014-05-17].
Available from:
http://people.seas.harvard.edu/~jones/es154/lectures/lecture_2/covalent_bond/covalent_bond.html
[17] A dictionary of chemistry. 5th ed. Editor John Daintith. Oxford: Oxford University
Press, 2004, 577 p. ISBN 01-986-0918-3.
[18] Openstax CNX. Crystal ctructure .2010 [cit. 2014-05-17].
Available from: http://cnx.org/content/m16927/latest/
[19] Titaniumdioxide unit cell rutile. Wikimedia Commons .2013 [cit. 2014-05-17].Available from:
http://commons.wikimedia.org/wiki/File:Titaniumdioxide_unit_cell_rutile.svg
[20] OPEL, Matthias. Spintronic oxides grown by laser-MBE. Journal of Physics D: Applied Physics . 2012, vol. 45, issue 3. DOI: http://dx.doi.org/10.1088/0022-
3727/45/3/033001.
[21] LALLART, Edited by MICKAEL. Ferroelectrics - material aspects. Rijeka: InTech, 2011. ISBN 978-953-3073-323.

���
�
[22] DE GRAEF, Marc and MCHENRY, Michael E. Structure of materials: an introduction to crystallography, diffraction, and symmetry. Second edition, fully revised and
updated. xxxii, 739 pages. ISBN 978-110-7005-877.
[23] HAMPSHIRE, S. Silicon nitride ceramics – review of structure, processing and properties. Journal of Achievements in Materials and Manufacturing Engineering. 2007, vol.
24, Issue 1, p. 43-50.
Available from:
http://www.researchgate.net/publication/40804763_Silicon_nitride_ceramics__review_of_structure_processing_and_properties
[24] Crystal structures of Si3N4. Handbook of hard ceramic materials .2004 [cit. 2014-05-
17]. Available from: http://www.hardmaterials.de/html/alpha-si3n4__beta-si3n4.html
[25] NEUDECK, Phillip. Silicon Carbide Technology.National Space and Aeronautics
Administration . 2006 [cit. 2014-05-17].
Available from: http://www.grc.nasa.gov/WWW/SiC/publications/CRCChapter2ndEd.pdf
[26] Wurtzite crystal structure. WIKIPEDIA The Free Encyklopedia . 2013 [cit. 2014-05-
17].
Available from: http://en.wikipedia.org/wiki/Wurtzite_crystal_structure
[27] Ceramic structures (continued). NDT Resource center . [cit. 2014-05-17]. Available
from: http://www.ndted.org/EducationResources/CommunityCollege/Materials/Structure/ceramic_p
rop.htm
[28] VRML Structure Type gallery. JCrystalSoft .2001 [cit. 2014-05-17]. Available from: http://www.jcrystal.com/steffenweber/gallery/StructureTypes/st3.html
[29] CALLISTER, William D and David G RETHWISCH. Materials science and
engineering: an introduction. 8th ed. Hoboken: Wiley, c2010, xxii, 885 pages, A40, G15, S4, I22. ISBN 978-0-470-41997-7.
[30] MOGENSEN, M. Physical, chemical and electrochemical properties of pure and
doped ceria. Solid State Ionics. 2000, vol. 129, 1-4, p. 63-94. DOI:
http://dx.doi.org/10.1016/s0167-2738(99)00318-5.
Available from: http://www.sciencedirect.com/science/article/pii/S0167273899003185
[31] SALMON, David, SMITH, David R. and POOLEN, Lambert J. Thermal conductivity
of insulations using guarded hot plates, including recent developments and sources of
reference materials. Measurement Science and Technology . 2001, vol. 12, issue 12, p. 237-246. DOI: http://dx.doi.org/10.1007/978-1-4684-4916-7_25.
Available from: http://iopscience.iop.org/0957-0233/12/12/201
[32] Measuring Thermal Conductivity. CERAMIC INDUSTRY . 2002 [cit. 2014-05-17]. Available from: http://www.ceramicindustry.com/articles/84495
[33] Laser flash method. Evitherm: Virtual Institute for Thermal Metrology . 2012 [cit.
2014-05-17]. Available from: http://www.evitherm.org/default.asp?lan=&ID=897&Menu1=897

���
�
[34] KRANE, Kenneth S and David HALLIDAY. Introductory nuclear physics. New York: Wiley, 1987, xiii, 845 pages. ISBN 04-718-0553-X.
[35] RHODES, Richard. The making of the atomic bomb. 1st ed. New York: Touchstone
Book, 1988, 886 pages. ISBN 06-848-1378-5.
[36] STACEY, Weston M. Nuclear reactor physics. 2nd ed., completely rev. and enlarged.
Weinheim: Wiley-VCH, 2007, xxviii, 706 pages. ISBN 978-3-527-40679-1.
[37] ROSE, Sunniva Johanne. Minimization of actinide waste by multirecycling of
thoriated fuels in an EPR. Oslo, 2009. Master Thesis. University of Oslo.
[38] Chicago pile-1. The Energy Library . 2009 [cit. 2014-05-17]. Available from: http://theenergylibrary.com/node/11916
[39] YOUNG, Hugh D. University Physics With Modern Physics Technology Update
Masteringphysics. 10 ed. San Francisco: Addison-Wesley, 2013, 1513 pages. ISBN 978-032-1897-442.
[40] LEWIS, E. Fundamentals of nuclear reactor physics. Boston: Academic Press, 2008,
xv, 293 p. ISBN 9780123706317-.
[41] Nuclear fission. Meriam-Webster: Visual Dictionary Online . 2014 [cit. 2014-05-17].
Available from: http://visual.merriam-webster.com/science/chemistry/matter/nuclear-fission.php
[42] 2. Large Stars. NASA: Goddard Space Flight Center . 2007 [cit. 2014-05-17].
Available from: http://imagine.gsfc.nasa.gov/docs/teachers/elements/imagine/05.html
[43] STANOSZEK, Paul. 85Kr signatures of different Plutonium production schemes.
Hamburg, 2008. Diploma Thesis. University of Hamburg.
[44] Energy spectrum of a nuclear reactor. TUDelft: Gas Cooled Fast Reactor . [cit. 2014-05-17].
Available from: http://iriaxp.iri.tudelft.nl/~rooijen/spectra_en.html.
[45] Nuclear data. Nuclear Data Center: Japan Atomic Energy Agency . 2014 [cit. 2014-05-17].
Available from: http://wwwndc.jaea.go.jp/
[46] Plans For New Reactors Worldwide. World Nuclear Association . 2013 [cit. 2014-05-
17]. Available from: http://www.world-nuclear.org/info/current-and-future-generation/plans-for-
new-reactors-worldwide/
[47] INKLE, S.J., WAS, G.S. and SANDERS, Thomas L.. Materials challenges in nuclear energy. ActaMaterialia. 2013, vol. 61, issue 3, p. 1-11. DOI:
http://dx.doi.org/10.1002/9781118585160.ch1.
Available from: http://www.sciencedirect.com/science/article/pii/S1359645412007987
[48] Nuclear Reactor Types. IET: The Institution of Engineering and Technology. 2008
[cit. 2014-05-17].Available from: http://www.theiet.org/factfiles/

���
�
[49] Nuclear power: schematic diagram of a nuclear power plant using a pressurized-water reactor. Encyklopaedia Britannica . 2013 [cit. 2014-05-17].
Available from: http://www.britannica.com/EBchecked/media/177423/Schematic-diagram-
of-a-nuclear-power-plant-using-a-pressurized
[50] Nuclear Fuel Fabrication. World Nuclear Association . 2014 [cit. 2014-05-
17].Available from: http://www.world-nuclear.org/info/Nuclear-Fuel-Cycle/Conversion-
Enrichment-and-Fabrication/Fuel-Fabrication/
[51] FINK, J.K. Thermophysical properties of uranium dioxide. Journal of Nuclear
Materials . 2000, vol. 279, issue 1, p. 1-18. DOI: http://dx.doi.org/10.1016/s0022-
3115(99)00273-1.
Available from: http://www.sciencedirect.com/science/article/pii/S0022311599002731
[52] LUCUTA, P.G., MATZKE, H. and HASTINGS, I.J.. A pragmatic approach to modeling thermal conductivity of irradiated UO2 fuel: Review and recommendations. Journal
of Nuclear Materials. 1996, vol. 232, 2-3, p. 166-180. DOI: http://dx.doi.org/10.1016/s0022-
3115(96)00404-7.
Available from: http://www.sciencedirect.com/science/article/pii/S0022311596004047
[53] TULENKO, James S. and BANEY, Ronald H. An Innovative High Thermal
Conductivity Fuel Design. University of Florida, 2007.
Available from: http://www.osti.gov/scitech/biblio/917989
[54] VERRALL, R.A., et al. Silicon carbide as an inert-matrix for a thermal reactor fuel.
Journal of Nuclear Materials. 1999, vol. 274, 1-2, p. 54-60. DOI:
http://dx.doi.org/10.2172/945371.
Available from: http://www.sciencedirect.com/science/article/pii/S0022311599000896
[55] HARRIS, Ed. by GARY L. Properties of silicon carbide. London [u.a.]: INSPEC,
1995. ISBN 08-529-6870-1.
[56] PRICE, R. J. Properties of Silicon Carbide for Nuclear Fuel Particle Coatings. Nuclear
Technology. 1977, vol. 35, Issue 2, p. 320-336.
Available from: http://www.ans.org/pubs/journals/nt/a_31892
[57] ZHENG, Jing and AKINC, Mufit. Green State Joining of SiC without Applied Pressure. Journal of the American Ceramic Society. 2001, vol. 84, Issue 11, p. 2479–2483.
Available from:
http://onlinelibrary.wiley.com/doi/10.1111/j.11512916.2001.tb01039.x/abstract
[58] JAHROMI, Maryam Tavafoghi. Synthesis, kinetics and sintering studies of
nano/micro CeO2 powder . Master Thesis. Nanyang Technological University. Nanyang,
2009 [cit. 2014-05-18].
Available from: http://dr.ntu.edu.sg/handle/10356/47275.
[59] SATAPATHY, Sitakanta. PEG-Assisted Synthesis and Characterization of Ceria
nanoparticles . Master Thesis. National Institute of Technology Rourkela. Rourkela, 2011.
Available from: http://ethesis.nitrkl.ac.in/2120/.
���
�
[60] SKORODUMOVA, N., et al. Electronic, bonding, and optical properties of CeO2 and Ce2O3 from first principles. In: Physical Review B. 2001. DOI:
http://dx.doi.org/10.1103/physrevb.64.115108.
Available from: http://adsabs.harvard.edu/abs/2001PhRvB..64k5108S
[61] RIEDEL, Ralf and CHEN, I-Wie. Ceramics Science and Technology, Volume 2,
Materials and Properties. Editor Ralf Riedel, I-Wei Chen. Weinheim: Wiley-VCH, c2010,
xxvi, 862 s. ISBN 978-3-527-31156-9.
[62] TAVAFOGHI JAHROMI, M. and TAN, M.J. Effects of sintering on Y2O3-doped CeO2. Journal of Achievements in Materials and Manufacturing Engineering. 2009, vol. 34,
Issue 2, p. 130-136.
Available from: http://www.journalamme.org/papers_vol34_2/3423.pdf
[63] Cerium Oxide Powder (CeO2) from READE. READE: your higher technology
specialty chemicals resource . 2014 [cit. 2014-05-18].
Available from: http://www.reade.com
[64] IVANOV, Vladimir K., SHCHERBAKOV, A. B. and USATENKO, A. V. Structure-
sensitive properties and biomedical applications of nanodispersed cerium dioxide. Russian
Chemical Reviews. 2009, vol. 78, issue 9, p. 855-871. DOI:
http://dx.doi.org/10.1070/rc2009v078n09abeh004058. Available from: http://iopscience.iop.org/0036-021X/78/9/R04
[65] RHODIA. Cerium oxide GPS Safety Summary. 2012 [cit.18.5.2014].
Available from: http://www.solvay.com/en/binaries/Cerium_dioxide_GPS_rev0_Sept12_RHD-139543.pdf
[66] GOHARSHADI, Elaheh K., SAMIEE, Sara and NANCARROW, Paul. Fabrication of
cerium oxide nanoparticles: Characterization and optical properties. Journal of Colloid and
Interface Science. 2011, vol. 356, issue 2, p. 473-480. DOI: http://dx.doi.org/10.1016/j.jcis.2011.01.063.
Available from: http://www.sciencedirect.com/science/article/pii/S0021979711000944
[67] GE, Lihao, et al. Influence of processing parameters on thermal conductivity of uranium dioxide pellets prepared by spark plasma sintering. Journal of the European Ceramic
Society. 2014, vol. 34, issue 7, p. 1791-1801. DOI:
http://dx.doi.org/10.1016/j.jeurceramsoc.2014.01.0.
Available from: http://www.sciencedirect.com.ezproxy.lib.vutbr.cz/science/article/pii/S0955221914000430
[68] ZHOU, Hongming, et al. Preparation and thermophysical properties of CeO2 doped
La2Zr2O7 ceramic for thermal barrier coatings. Journal of Alloys and Compounds. 2007, vol. 438, 1-2, p. 217-221. DOI: http://dx.doi.org/10.1016/j.jallcom.2006.08.005.
Available from:
http://www.sciencedirect.com.ezproxy.lib.vutbr.cz/science/article/pii/S092583880601005X
[69] SHACKELFORD, James F. CRC materials science and engineering handbook. 3rd ed. Editor William Alexander. Boca Raton: CRC Press, c2001, 1949 pages. ISBN 08-493-
2696-6.