Design of Hybrid Distillation-Vapor Membrane Separation Systems ...
32
Design of Hybrid Distillation-Vapor Membrane Separation Systems. Jose A. Caballero*; Ignacio E. Grossmann **; Majid Keyvani + ; Ellen S. Lenz + * Department of Chemical Engineering University of Alicante. Ap Correos 99, 03080 Alicante, Spain. ** Department of Chemical Engineering, Carnergie Mellon University.. 5000 Forbes Av. 15213 Pittsburgh, PA, USA ++ Lyondell Chemical Company, 3801 West Chester Pike. Newton Square, PA 19073 Abstract Currently the separation of olefins (ethylene, propylene) from paraffins (ethane, propane) on a commercial scale is performed almost exclusively by cryogenic distillation in petrochemical industries. Since this technology is highly energy intensive, there is a strong economic incentive to explore alternative separation technologies with lower energy consumption. In this work, using the separation of ethylene and ethane as a representative case, a mathematical programming approach is proposed to optimize and retrofit a hybrid separation system consisting of a distillation column and a parallel membrane separation unit. A two stage approach is used. First a shortcut model is introduced that allows determining whether the hybrid system could be of interest and the order of magnitude of the energy savings that can be expected. Second, a superstructure optimization approach is proposed that uses rigorous models for both the column and the membrane using a process simulator and state of the art MINLP solvers. The results obtained show that significant energy savings can be obtained with the hybrid system. 1. Introduction Distillation is the most important separation technology in the chemical process industry. More than 90% of separations are based on distillation, and this situation is not likely to change in the near future 1,2 . Although there are a number of new developments for alternative separation techniques, they tend to have important limitations that in many cases make them unattractive for practical purposes; e.g. some membrane technologies are constrained to small scale separations due to the large areas needed, or they need frequent replacement due to fouling or mechanical reasons. However, hybrid systems (i.e. distillation adsorption, distillation-membrane, etc) offer an interesting alternative in some difficult separations for distillation with either large number of theoretical trays, large heat loads or both (i.e. paraffin olefin separations). A hybrid system can be defined as a process system consisting of different unit operations that are interlinked and optimized to achieve a predefined task 3 . Therefore, if distillation is the basic separation system, a hybrid distillation system consists of a distillation column that is interlinked with another unit operation to achieve a better (cheaper, easier, enhanced) separation. Hybrid distillation systems can be used for different purposes. The best known is the use of membranes to break thermodynamic limitations like azeotropes. In this paper, however, we present a methodology that allows the design/retrofitting of hybrid-distillation systems for difficult separations involving mixtures with very close relative volatilities. The main focus will be on
Transcript of Design of Hybrid Distillation-Vapor Membrane Separation Systems ...

Design of Hybrid Distillation-Vapor Membrane Separation Systems.
Jose A. Caballero*; Ignacio E. Grossmann **; Majid Keyvani+; Ellen S. Lenz+
* Department of Chemical Engineering University of Alicante. Ap Correos 99, 03080 Alicante, Spain.
** Department of Chemical Engineering, Carnergie Mellon University.. 5000 Forbes Av. 15213 Pittsburgh, PA, USA
++ Lyondell Chemical Company, 3801 West Chester Pike. Newton Square, PA 19073
Abstract
Currently the separation of olefins (ethylene, propylene) from paraffins (ethane, propane) on a commercial scale is performed almost exclusively by cryogenic distillation in petrochemical industries. Since this technology is highly energy intensive, there is a strong economic incentive to explore alternative separation technologies with lower energy consumption. In this work, using the separation of ethylene and ethane as a representative case, a mathematical programming approach is proposed to optimize and retrofit a hybrid separation system consisting of a distillation column and a parallel membrane separation unit. A two stage approach is used. First a shortcut model is introduced that allows determining whether the hybrid system could be of interest and the order of magnitude of the energy savings that can be expected. Second, a superstructure optimization approach is proposed that uses rigorous models for both the column and the membrane using a process simulator and state of the art MINLP solvers. The results obtained show that significant energy savings can be obtained with the hybrid system.
1. Introduction
Distillation is the most important separation technology in the chemical process industry. More than 90% of separations are based on distillation, and this situation is not likely to change in the near future1,2. Although there are a number of new developments for alternative separation techniques, they tend to have important limitations that in many cases make them unattractive for practical purposes; e.g. some membrane technologies are constrained to small scale separations due to the large areas needed, or they need frequent replacement due to fouling or mechanical reasons. However, hybrid systems (i.e. distillation adsorption, distillation-membrane, etc) offer an interesting alternative in some difficult separations for distillation with either large number of theoretical trays, large heat loads or both (i.e. paraffin olefin separations).
A hybrid system can be defined as a process system consisting of different unit operations that are interlinked and optimized to achieve a predefined task3. Therefore, if distillation is the basic separation system, a hybrid distillation system consists of a distillation column that is interlinked with another unit operation to achieve a better (cheaper, easier, enhanced) separation.
Hybrid distillation systems can be used for different purposes. The best known is the use of membranes to break thermodynamic limitations like azeotropes. In this paper, however, we present a methodology that allows the design/retrofitting of hybrid-distillation systems for difficult separations involving mixtures with very close relative volatilities. The main focus will be on

binary separations. While the most difficult separation is usually performed at the end of the column sequence – a binary separation-, the separation of mixtures formed by hydrocarbons with close boiling points, such as ethane (184.5 K) – ethylene (169.4 K); propane (225.4 K) – propylene (225.4 K)and n/iso parafins (n-butane 272.7 - iso-butane 261.3 K) is commonly performed by cryogenic distillation. Cryogenic distillation requires a very large operational cost associated with cooling in the condenser that is usually an order of magnitude larger than the other costs in the distillation unit.
When retrofitting a distillation column using a vapor membrane, the number of alternatives is relatively small. In this case Pressly and Ng4 presented a list of the possible configurations, some of them involving more that a single distillation column, and other including more than a membrane module that are valid for membranes with low separation factors. In this work we will focus only on systems that include a single distillation column and a single membrane module because the separation factor is usually not a problem, but the cost of the membrane can be critical. Figure 1 shows the basic configurations considered in this work. Note that it is possible to develop a superstructure that includes all these alternatives. However, it is more efficient to consider each alternative independently. In this paper we will focus on the fourth alternative, as we will show that the other alternatives are not economically attractive. It is worth noting that if we consider the feed tray and product withdraw locations each of the configurations in Figure 1 includes a large number of alternatives.
Design methods for hybrid distillation membrane process have been proposed by a number of authors. Moganti et al5 analyzed a hybrid process to determine the optimal position of the side stream. Their model relies on simple shortcut models for both column and membrane, but important design parameters like reflux ratio of the distillation column were not considered in that work. Pettersen and Lien6 presented a design model for vapor permeation systems. Their method, based on McCabe diagrams for distillation, is also only valid for binary systems. Pressly and Ng4 presented a procedure for screening calculations that allow to calculate the break even cost of a membrane above which the hybrid process would be too high to be competitive with distillation systems. All the above mentioned short-cut procedures are restricted to binary systems with ideal vapor liquid equilibrium behavior. Bausa and Marquardt 7 presented a shortcut method based in the rectification body method (RBM), also developed by these authors8, 9, providing the minimum energy demand of a separation and the optimal sidestream composition. The membrane was evaluated using the minimum membrane area that is a lower bound to the actual membrane area and thus to the investment cost. This method can be applied to multicomponent nonideal mixtures. Kookos10 presented a model based on the simultaneous rigorous optimization of a distillation column based on the combination of the superstructure of Viswanathan and Grossmann11 for distillation, and a superstructure for gas permeation networks. The major advantage of the model is the use of rigorous models, but it also has all the drawbacks of large non-convex MINLP optimization. Szitkai et al12 developed another rigorous MINLP model and applied to the ethanol/water separation with a pervaporation unit to produce pure ethanol. In order to reduce the complexity of the membrane model these authors used quadratic and exponential regressions for approximating the integral membrane model. It is worth noting that the work by Steinigeweg and Gmehling13 that extended the hybrid systems to reactive distillation processes. They showed by using computer simulations and experimental results that the combination of reactive distillation with pervaporation is a favourable alternative.
Several authors have proposed different approaches for using process simulators in process synthesis14,15, 16,17 in combination with state of the art solvers and tailored algorithms to provide design capabilities through superstructure optimization. However, at the initial stages of design
a better approach is to use shortcut methods and select only the most promising alternatives, and then develop a superstructure with a rigorous model (i.e. in a process simulator) that allows calculating detailed designs from the shortcut method. This approach is especially adequate for the retrofit of existing distillation units. In this line Marquardt et al18 proposed a framework for the design of hybrid distillation separation processes based on three main stages: 1. Generation of flow-sheet alternatives. 2. Shortcut evaluation of the alternatives. 3. Rigorous MINLP optimization of the most promising alternatives to obtain the best flowsheet. This paper focuses on stages 2 and 3 for the particular case of vapor membrane distillation in cryogenic (olefin-paraffin) systems. The rigorous MINLP optimization will be carried out with a process simulator for the distillation column, the compressor and other auxiliary equipment, and a rigorous membrane model developed in MATLAB. Following a similar approach, Eliceche et al19 performed a rigorous optimization of the operating conditions of a hybrid distillation-pervaporation system using a process simulator (HYSYS). However, the optimal location of the feed and withdrawn streams was carried out by a trial and error procedure.
In this work we focus on the energy/cost savings in cryogenic distillation columns. First we present a very simple shortcut model considering the hybrid separator as a black box. This approach is useful because it is very simple when applied to cryogenic olefin-paraffin systems, and gives us a precise idea of the characteristics that an eventual hybrid separator should have. Once the feasibility of a hybrid system is established, a rigorous model is presented for both the membrane and the column using a superstructure developed with a process simulator (UNISIM.Design), interfaced with a state of the art optimizer that allows to check the designs obtained in previous stages or to retrofit an existing distillation unit.
2. Problem statement
The problem we address in this paper can be stated as follows. Given is a feed stream consisting of a two component mixture that are usually separated by cryogenic distillation. The objective is to design a hybrid system formed by a distillation column and a separator (usually a vapor membrane) in order to minimize the total cost. In the case of an existing distillation column the objective is to retrofit the system by adding a new separator in order to minimize the total cost.
3. Shortcut model for the fast screening of alternatives in hybrid distillation systems.
As mentioned in the introduction, and following the ideas in the framework developed by Marquardt et al18 to process design, it is of interest to use a shortcut model to discriminate between alternatives at the first stages of design. Whatever methods previously discussed can be applied. However, for the case we are dealing with (cryogenic separation of olefin – paraffin mixtures), it is possible to develop a very simple shortcut model that can be implemented in a spreadsheet, but accurately predicts the expected energy savings.
In order to introduce the model, and for the sake of simplicity, consider the design alternative presented in Figure 2 (at the end of the paper we will show that other alternatives can be discarded).
Before introducing the model it is convenient to take into account the following considerations:
1. The mixtures we are interested in (ethylene, ethane; propylene, propane; n-butane, iso-butane, etc) exhibit near ideal behavior. Therefore, the assumptions on the Underwood- Fenske equations (constant relative volatilities and constant molar overflow) are valid and there will be used in the shortcut approach.
2. Although the objective is to minimize the total cost, in cryogenic systems the energy related to the condenser usually dominates all the other costs. Therefore, we will simply consider the reduction in energy cost with respect to the system without the added separator (i.e. only distillation column).
3. The performance of a binary column like the one in Figure 2 is limited by the ‘pinch’ of concentrations. In a binary column with a single feed the pinch is placed at the feed tray. A separator placed in parallel ‘breaks’ that pinch by performing part of the separation work. The net effect is that a new pinch is established in the column, usually near the tray in which stream DX or stream BX (or both) are fed to the column. The energy savings will depend on the flow rate withdrawn from the column and introduced to the separator and on the “separator performance”: Concentrations in the DX stream, DX flow rate and FX flow rate. It is important to note that the model is not constrained to binary mixtures.
4. In order to study the energy savings that can be obtained using a ‘separator’ placed in parallel to the distillation column, (see Figure 2a) it can be divided in four pseudo-columns that can be joined by mass balances (see Figure 2b). When we calculate the minimum vapor flow in each section the mass balances ensure that the effect of the ‘more constrained region’ in the column is transferred to the rest of the column.
To develop the model we define the following index sets.
COMP = {j | j is a compound}
COL = {s | s is a pseudo-column}
Data needed in the model
iα = Relative volatility of component i respect to the heaviest one.
F = Total feed flow
iz = Mole fraction of component i in the feed.
Variables in the model
1sV = Mole vapor flow in the rectifying section of pseudo-column s.
2sV = Mole vapor flow in the stripping section of pseudo-column s.
1sL = Mole liquid flow in the rectifying section of pseudo-column s.
2sL = Mole liquid flow in the stripping section of pseudo-column s.
sφ = Underwood root in pseudo-column s
,;s s jF f = Total mole flow entering the column s and individual mole flow of component
j in stream F
, jD d = Total mole flow and individual mole flow of component j in the distillate.
, jB b = Total mole flow and individual mole flow of component j in the bottoms.
, jDX dx = Total mole flow and individual mole flow of component j in the top product
from separator (i.e. permeate in a membrane)

, jFX fx = Total mole flow and individual mole flow of component j in the feed to the
separator.
, jBX bx = Total mole flow and individual mole flow of component j in the bottom
product from separator
The energy consumption in the condenser is proportional to the vapor flow entering the condenser (that is the dominant energy cost). Therefore, the objective function can be written as follows:
1min : 1sZ V= (1)
To maintain the model as linear as possible instead of using mole fractions, we will use individual mole flow rates of each component in each stream. The first group of equations is simply the relation between individual and total flows,
jj COMP
jj COMP
jj COMP
jj COMP
jj COMP
D d
B b
FX fx
DX dx
BX bx
∈
∈
∈
∈
∈
=
=
=
=
=
∑
∑
∑
∑
∑
(2)
Mass balances in the distillation column
Global
j j j
F D BF z d b j COMP= += + ∀ ∈
(3)
In condenser and reboiler
1 1
4 4
1 12 2
s s
s s
V D LL B V
= +
= + (3)
In the feed points and side-stream points of the column. Note that in pseudo-columns 1, 3 and 4 there is a feed, but in section 2 there is stream withdrawal. It is assumed that all streams, except the main feed to the column, are saturated vapor (q is the thermal state of a stream –liquid fraction-).
2
3 3
2 2 2 2
2 1 1 2/
1 21 22 1 1 2
s s s s s
s s
s s
s s s s
F V L V Ls COLUM s s
L LL q F LV L V L FX
+ + = + ⎫∀ ∈ ≠⎬= ⎭
+ =
+ = + +
(4)

Connectivity equations (mass balances between pseudo-columns and connection with separator)
1 2 1 2
2 3 2 3
3 4 3 4
3
3,
1
1,
4
4,
2 1 ; 2 12 1 ; 2 12 1 ; 2 1
;
;
;
s s s s
s s s s
s s s s
s
j s j
s
j s j
s
j s j
V V L LV V L LV V L LF FF z f j COMP
DX Fdx f j COMP
BX Fbx f j COMP
= =
= =
= =
=
= ∀ ∈
=
= ∀ ∈
=
= ∀ ∈
(4)
Modified Underwood equations
The Underwood equations20 allow to calculate the minimum vapor flow (or reflux ratio) in a ‘infinitely’ large distillation column with a single feed distillate and bottoms streams. Nikolaides and Malone21 proposed a modification to account for multiple feed streams and multiple products. The basic idea in the modification of Nikolaides and Malone is to calculate the minimum vapor flow in each pseudo column. The most constrained section in the column (that section that requires the largest minimum vapor flow) is the dominant section. The rest of the flows can be calculated by mass balances:
, 1 2 / 2j s js s
j sj
fV V s COL s s
αα φ
= − ∀ ∈ ≠−∑ (5)
( )
( )
11
1,3
3
1, 3,4
4
1
1
1
j js
j sj
j j s j js
j sj
j j s j s j js
j sj
dV
d f fxV
d f f fxV
αα φ
α
α φ
α
α φ
≥−
− +≥
−
− − +≥
−
∑
∑
∑
(6)
( )
( )
3, 4,1
1
4,3
3
44
2
2
2
j j j s j s js
j sj
j j s js
j sj
j js
j sj
b fx f fV
b fV
bV
α
α φ
α
α φ
αα φ
+ − −≥ −
−
−≥ −
−
≥ −−
∑
∑
∑
(7)
The Underwood equation in (5) (the feed equation) is the same in each pseudo-column as in the regular Underwood method. However the second inequality (6) must take into account the
streams fed or withdrawn from the column in sections placed over the considered pseudo-column.
Model of the separator
A general separator can be modeled using two parameters (i.e. composition of a component and flow rate in one of the streams, or separation factor and flow of a given component in a stream). In that way the separator can be considered as a black box and can be eventually substituted by any unit operation capable of meeting those specifications (i.e. absorption, adsorption, membrane, etc). Therefore, it is possible to study the reduction of energy consumption in the column independently of the device used as a separator. Using the selectivity (γ ) and the ratio of a component flowrate in the DX stream respect to that component in the FX stream (η ), it is necessary to add the following equations:
Mass balance in the separator
j j j
FX DX BXfx dx bx j COMP
= += + ∀ ∈
(8)
Using the two parameters in a general separator ( ,γ η )
AA
bB
A A
B B
dxydxy
x fxx fx
γ
⎛ ⎞⎛ ⎞⎜ ⎟⎜ ⎟
⎝ ⎠ ⎝ ⎠= =⎛ ⎞ ⎛ ⎞⎜ ⎟ ⎜ ⎟⎝ ⎠ ⎝ ⎠
(9)
A Adx fxη= (10)
where y,x correspond to mole fractions in DX and FX streams respectively, and A, B are the components.
It is worth noting that the only nonlinear (and also non-convex) equations in the model are the Underwood equations and equations 9 and 10. The possibility of getting trapped in local solutions is small because the Underwood roots are constrained to take values between the relative volatilities of key components. In any case, in this simple model it is possible to guarantee the global optimum solution by using a general purpose deterministic global optimization package like BARON22 that is available in GAMS, without significantly increasing the total CPU time.
If we want to substitute the black box separation model by a membrane model, we can use different approaches. Here we consider two of them. First, an ideal perfect cross flow membrane that has the advantage of simplicity and can be used for preliminary designs, and a hollow fiber model that rigorously represents an actual membrane.
In a perfect cross flow membrane23 (Figure 3), if the selectivity is known, the permeate composition depends only on the composition of the feed that can be calculated by equation (10). For a given selectivity, the membrane area depends on the permeability of a given component A (i.e. A would be ethylene in a ethylene-ethane mixture), pressure in the feed side, pressure in the permeate side and difference of concentrations:

outA o
o
Pdx Perm Area P x yP
⎛ ⎞= −⎜ ⎟
⎝ ⎠ (11)
where dxAe is the mole flow rate of component A, P0 is the pressure in the feed side of the membrane, Pout the pressure in the permeate side, y is the A mole fraction in the permeate and x the A mole fraction in the feed. Perm is the permeability. Note that permeability in equation (11) includes the membrane thickness.
In a perfect cross flow membrane, if the selectivity is known, the permeate composition depends only on the composition of the feed that can be calculated by equation (6). However, experience shows that permeability and selectivity are not independent. According to Fuertes and Menendez24 for the mixture ethylene-ethane the selectivity ranges between 2 and 11 depending on the membrane characteristics. The selectivity and permeability can be correlated with the following equation:
0.214 Permγ −= (12)
In equation (12) the permeability is given in Barrer units. According to Fuertes and Menendez24 the permeability for ethylene ranges between 10 and 1000 Barrer. But the Barrer units do not
include the thickness of the membrane ( 1221 1.119·10 kmol mBarrer
m h kPa−= ). A typical value for
the membrane thickness is 2 μm. Therefore, we can use the following correlation,
( ) 0.20.7865 Permγ −= 2kmolPerm in
m h kPa⎛ ⎞⎜ ⎟⎝ ⎠
(13)
In this way, in the new units the Permeability varies in the interval: 6 31.8·10 10Perm− −≤ ≤ .
In a rigorous model the ideal cross flow membrane is only and approximation of the actual behavior of the membrane. Industrial membrane modules are usually formed by hollow fibers. Therefore, a hollow fiber membrane model, which accurately represents an actual membrane, is included in the rigorous model. A detailed derivation can be found in Smith et al25. The following assumptions were made in the derivation of the governing differential equations:
1. Steady state operation
2. The only pressure drop in the module is due to the membrane.
3. Plug flow in the feed side of the module
4. Perfect mixed flow in the permeate side of the module. This means that yδ is constant
in all points. ( /out inP Pδ = ).
5. Isothermal operation.
The performance of the hollow fiber model is then described by the following system of differential and algebraic equations (DAE). Figure 4 shows a scheme with the main nomenclature included.

( ) ( )
( )( ) ( )
0 0 ( 1) ( 1)
0
1 1 (1 )
1 1 (1 )
z z
d F R x y x yd z
dx xF R x x y x yd z
F z F x Dy
F B D
δ δγ
δ δγ
= =
⎧ ⎫=− − + − − −⎡ ⎤⎨ ⎬⎣ ⎦
⎩ ⎭⎧ ⎫
= − − − − − − −⎡ ⎤⎨ ⎬⎣ ⎦⎩ ⎭
= +
= +
(14)
0
0 0; ; Area Perm Pz Fz F R
L F F= = =
4. Base case and case study
As a base case we consider a distillation column at 2000 kPa with 70 theoretical distillation trays and the feed placed in tray number 40 (starting from the top of the column). The feed is 100 kmol/h with a mole composition of 0.6 ethylene and 0.4 ethane. The objective is to obtain a distillate with at least 0.995 ethylene mole fraction and at least 0.995 ethane mole fraction in bottoms. Table 1 shows the main parameters of the base distillation column.
In order to validate the shortcut model, Figure 5 shows a comparison using a rigorous UNISIM.Design26 simulation, with some lateral streams to simulate the behavior of the column when a separator is added. As can be seen differences are small and not important for studying the effects of the main parameters when a parallel separator is used. The maximum error is in the vapor mole flow in tray 40 and it is only of 3.75%. The maximum error in liquid phase is in trays 1 and 70, and it is only around 3%. All the rest of the errors are lower than 3%.
The objective in the next section will be to study the effects on energy consumption on the different parameters in a hybrid distillation configuration.
4.1. Effects of different parameters on energy savings.
As mentioned before, in cryogenic distillation the dominant cost is the heat removed in the condenser of the distillation column. Therefore, the main objective in this phase is to reduce the amount of heat that must be removed in the condenser, which in turn is equivalent to reducing the vapor flow-rate entering the condenser.
Some interesting conclusions can be drawn from the model:
1. The maximum energy savings depend on the concentration and flowrate in DX stream and on the ethylene mole ratio between DX and FX streams. See Figure 6
2. For a given DX/FX ethylene mole ratio there is a minimum DX flowrate needed to obtain the maximum energy savings. The energy saved in the condenser decreases linearly with the DX flowrate. See Figure 7.
3. For a given ethylene mole fraction in DX stream, the energy saved in the condenser increases with the DX/FX ethylene mole ratio up to a maximum value. Increasing more this value does not produce further improvements. See Figure 6.

4. The minimum DX ethylene flowrate to obtain the maximum energy savings decreases with ethylene concentration in DX stream until a minimum value, then the minimum flowrate increases. See Figure 6.
The results shown in Figures 6 and 7 are general and do not depend on the nature of the separator that has been considered in the black box, and the qualitative behavior is the same for all binary zeotropic mixtures. This information is useful because it allows separating the distillation column from the separator. In other words, knowing “what the separator can do” it is possible to anticipate what the energy saved in the distillation column will be, which is useful information in preliminary design.
We have used the DX/FX ethylene mole ratio and ethylene mole fraction in DX stream. However, any other pair of parameters could be used and can be directly obtained from mass balances or design equations of the specific separator.
If we want to specialize the black box separator to a vapor membrane with the objective of obtaining realistic energy savings estimations -instead of only the bounds provided by the black box approach- while maintaining the model simplicity, the ideal perfect cross flow model is a good option for preliminary design.
Assuming that the concentration fed to the membrane is the same as the concentration fed to the column (0.6, 0.4 ethylene-ethane mole fractions), the ethylene mole fraction in DX stream are 0.75 ( 2γ = ) and 0.9429( 11γ = ) respectively. The maximum energy saved in condenser is then between 20.3-38.6 % (upper line in Figure 6)
Table 2 presents the area needed to obtain the maximum energy savings for a given selectivity using the ideal perfect flow cross model together with correlation presented by Fuertes and Menendez (equation 13) that relates permeability and selectivity together with the minimum flowrate of stream DX to obtain these savings.
Using the data shown in Table 2, it is possible to perform a preliminary economic evaluation of the hybrid system, even though there is some uncertainty in the cost data, especially in the membrane. Figure 8 shows the economic savings with respect to the base case design (column without membrane) for different values of area (calculated using data presented in Table 3). Due to the uncertainty in the cost of the membrane, values for membrane cost between 20 and 200 US$/m2 were considered. The optimal value is to use membranes with selectivities between 4 and 6 depending on the cost of the membrane. Note that at higher selectivities it is possible that the total cost of the hybrid system be greater than the cost of the original column.
Note that the results presented in Figure 8 are considering only the energy savings (costs of compressor and membranes have been calculated to obtain the maximum energy savings, but they have not included in the optimization model).
It is worth noting that both parameters, selectivity and permeability are important. In other words it is usually not possible to simply increase the energy savings by increasing one them. That is, the facilitated transport membranes27 increase the selectivity by one or two orders of magnitude (values around 100 or larger are common), but unfortunately this decreases the ethane permeability instead of increasing the ethylene permeability. Therefore, although it is theoretically possible to improve the energy savings, the minimum flow to obtain those savings is too large.

4.2 Distillation column: retrofit using rigorous model.
In the previous sections we have investigated the main trade-offs that appear in a hybrid distillation system using a shortcut model. That model is very useful for preliminary design or for a preliminary study for retrofitting a given column. However, once the economic potential of the hybrid system has been established, a more rigorous model is needed to determine the final configuration at least for the following reasons:
1. In the shortcut model the cost of the membrane, compressor and operating conditions have been calculated for the conditions of maximum energy savings, but they were not included in the optimization model. Of course, it would be possible to include those costs in the model, but for a rigorous cost optimization it is better to use a rigorous model like the one presented in this section.
2. In an actual industrial membrane the flow rarely follows the perfect cross model. Instead, for devices at high pressure, a hollow fiber membrane (HFM) is used. In general, the perfect cross flow model overestimates the permeate concentration (DX stream) and underestimate the membrane area. In a hollow membrane there is a trade- off between the permeate concentration and the flux through the membrane. This trade off does not appear in perfect cross flow membranes.
3. The shortcut model for the distillation column accurately reproduces the flows in the column, but the error in the number of trays in each section can be significant. For binary mixtures the number of trays in each section can accurately be calculated with the method proposed by Stephan et al28. The optimal tray position for each stream is accurately calculated in the rigorous model.
4. It has been assumed that the feed is withdrawn from the column with the same concentration as the feed to the column. However, the tray at which this stream is extracted is not necessarily the same in which the feed is introduced, although it is near the feed tray in binary distillation. In multi-component systems, it could be far from the feed tray.
5. The permeate stream must be recompressed and reintroduced again back to the column. Since the temperature increases, it is convenient to cool that stream, at least partially. The net result is that the stream is introduced again to the column as a superheated vapor which could have an important effect on the total heat removed in the condenser.
In this section we use rigorous models to optimize the hybrid configuration using the hollow fibers model.
Due to the mixed flow assumption in the permeate side, for the same membrane characteristics the ethylene permeate concentration will always be lower than the one predicted by the perfect cross flow model. Furthermore, in this model the permeate concentration and the total permeate flow are not independent. There is a trade off between the permeate flow and the permeate purity as is shown in Figure 9
The distillation column is simulated with the commercial process simulator UNISIM.Design26, and the rigorous model for hollow fibers is simulated in Matlab29.
The first step is to generate a superstructure that allows determining the optimal location at which all the streams must be introduced or withdrawn. (See Figure 10). The superstructure is
implemented in the process simulator and the system is connected to Matlab thorough the ActiveX capabilities and optimized using Matlab-Tomlab30 and proprietary software. The problem is a mixed-integer nonlinear programming problem (MINLP) in which a part of the equations appear in an implicit form (equations in the process simulator and the differential algebraic system of equations due to the membrane) and other part appear explicitly (See Caballero and Grossmann17 for detailed discussion of these systems and solution algorithms). The MINLP is usually solved as an NLP problem because the binary variables take integer values in the NLP relaxation problem.
The objective is to maximize the annualized costs savings with respect to the basic configuration (actual column without membrane) taking into account the following items:
1. The investment and operating costs of the compressor, and data for operating costs can be found in Table 3. Investment costs were calculated using the correlations presented by Turton et al31, and annualized following the procedure by Smith32.
2. The permeate stream exits from the compressor at high temperature. Cooling this stream down to the temperature of the tray in which it must be introduced is too expensive. Therefore, it is assumed that the permeate stream is cooled down to 35ºC using cooling water.
3. There is significant uncertainty about the cost of the membrane and its useful life. Here it has been assumed that the membrane must be replaced every two years with a cost of US$100/m2.
4. The independent variables to be optimized are the following: reflux and boilup ratios in distillation column, total flow withdrawal from each of the candidate trays of the column, membrane area and selectivity (the permeability is then fixed by the correlation of equation 13), split fraction of DX and BX streams to each candidate tray, and pressure in permeate.
5. The DAE system is solved numerically as an implicit block in Matlab. Concentration requirements in distillate and bottoms streams are introduced as constraints in the model.
6. Note that the configuration of the distillation column with the membrane introduces a recycle stream. It is numerically more robust and efficient to let the optimizer converge this recycle instead of converging the entire flowsheet each time the model is called from the optimizer. Therefore, it has been introduced as an external set of equality constraints in the optimization model.
Conceptually the model can be written as follows:
First we define the following index sets:
SFX = {i | i is a tray candidate to withdraw FX stream}
SDX = {j | j is a tray candidate to return DX stream to the column}
SBX = { k | k is a tray candidate to return BX stream to the column}
COM ={ c | c is a component –ethylene, ethane-}
The independent variables in the problem are
RR = Reflux ratio
RB = Reboil Ratio
iFXI = Mole flow withdrawn from tray i. i SFX∈
jspDX = Fraction of stream DX returned to tray j, j SDX∈
kspBX = Fraction of stream BX returned to tray k. k SBX∈
outP = Pressure in the permeate stream
Selec = Selectivity
cFM = Mole flows of ethylene and ethane in FX stream in the final solution must
have the same values than those calculated by the process simulator ( FXcal ). Recall that the convergence of the recycle is done by the optimizer and not by the simulator.
D jy = Binary variable. It takes value 1 if the permeate stream (DX) is introduced in
the column in tray j.
F iy = Binary variable. It takes value 1 if the FX stream is withdrawn from tray i.
Bky = Binary variable. It takes value 1 if the BX stream is introduced in the column
in tray k.
The implicit blocks (modules in UNISIM.DESIGN and MATLAB) calculate a large number of dependent variables. Some of them appear in the following model as explicit variables:
Dx = Ethylene mole fraction in distillate.
Bx = Ethane mole fraction in bottoms.
cFXcal = Mole flows of ethylene and ethane in FX stream calculated by the
implicit modules.
The model can be written as follows:
..cos :min
tstTotal
( )( )
, , ,
, , , , , , , ,D B cal
out
x x FX Total cost
f RR RB FXI FM spDX spBX P Area Selec
=
1jj SDX
spDX∈
=∑
1jj SBX
spBX∈
=∑
j DjspDX y j SDX≤ ∀ ∈
k BkspBX y k SBX≤ ∀ ∈

UPi i FiFX FX y i SFX≤ ∀ ∈
1Djj SDX
y∈
=∑ 1Bkk SBX
y∈
=∑ 1Fii SFX
y∈
=∑
c cFM FXcal c COM= ∀ ∈
0.995; 0.995D Bx x≥ ≥ ; yDj = 0,1; yBk = 0, 1; yFi = 0.1
The implicit block is a combination of different blocks, all them coordinated from Matlab and optimized using an in-house version of the LP-NLP based branch and bound33. We used CPLEX34 as the MILP solver and SNOPT35 as the NLP solver. A call of the NLP solver to the implicit block follows the following steps:
a) Values of the independent variables are sent to the block.
b) With the values of step 1, (FM, Selectivity, Area and Pout) the membrane module is calculated. The feed stream is assumed to be vapor at its dew point. The cost of the membrane can then be calculated.
c) With values DX, and BX calculated by the membrane module and the rest of the independent variables, UNISIM.DESIGN is invoked and the compressor, the cooler and the distillation column are calculated. All costs (compressor, cooler, heat in condenser and reboiler etc) can now be calculated.
d) Values of ethylene mole fraction in the distillate and ethane mole fraction in the bottoms together with the FXcal (stream after the mixer) and the calculated total cost are sent back to the main block.
The optimal results for the membrane models are shown in Table 4 and Figure 11. It is worth noting that like in the shortcut model the optimal selectivity is relatively small (4.8). Note that larger selectivities produce lower permeabilities, and, therefore, larger flows to get the same energy recovery in the column. One interesting conclusion for researchers involved in membranes,, at least for the applications discussed in this paper, is that increasing selectivity but sacrificing permeability (or vice-versa) does not increase the performance. That is, as mentioned previously, the facilitated transport membranes27 increase the ethylene – ethane selectivity, but unfortunately by decreasing the ethane permeability rather than increasing it. The net effect is that no improvement –when used in a hybrid distillation system- is obtained using this new membranes. A similar conclusion was obtained by Fahmy et al36 in the ethanol dehydration process.
In the base case column, the annualized cost associated with the energy in condenser is 581.20 kUS$/year. The annualized cost of the hybrid system (energy in condenser, compressor and membrane) is 467.6 kUS$/year, which yields 19.5% annualized cost savings.
4.3 Other membrane configurations
Besides the parallel arrangement other configurations are possible as shown in Figures 1a,b,c.
Using the shortcut model the predicted energy savings in the configuration of Figure 1b are exactly the same that those obtained with the original parallel configurations with similar areas.
For the case a series arrangement (Figure 1a), assuming a perfect cross flow membrane it, is possible to estimate the energy savings.
Assuming 11α = (best case), yields
0.995; 11 ( )/ (1 ) 0.9476/ (1 )
Dx
Dx DxD
D D
y If best casey y yy y
α
α
= =
−= ⇒ =
−
The energy reduction in the condenser is due to a decrease in purity in the distillate stream. But it is only about 5.3 %.
Finally, the configuration of Figure 1c is only feasible for membranes with high selectivity values. If the concentration in the permeate stream is equal to the required distillate purity, it would be equivalent to introducing the permeate stream in the top tray. Note that the permeate stream is a vapor stream that must be condensed.
4.4. Optimal feed composition for maximum energy savings using a hybrid distillation membrane system.
Another interesting point is related to the fact that one of the factors that has major impact on the energy savings by the hybrid distillation membrane system is the feed composition. Therefore, it is of interest to determine what is the feed composition that produces the higher energy savings in the condenser.
The first step is to establish the model and the base of comparison. In this study we use a shortcut model based on the Underwood equations:
Relative volatility constant and equal to 1.42.;
Feed flow rate equal to 100 kmol/h, vapor at its dew point.
A perfect cross flow model is assumed for the membrane. Since we are interested in the effect of the feed composition over the energy saved in the condenser the nature of the separator is not relevant and any other model could be used. Therefore, we use a simple separator model
The stream introduced to the membrane has the same composition as the feed stream and it is vapor at its dew point.
Under these conditions, the Underwood model for a single column (without membrane) predicts that the vapor in the rectifying section (going to the condenser) varies less than a 3% for values of ethylene mole fraction in feed between 0.3 and 0.9.
Figure 12 shows that for a fixed selectivity the maximum energy saved in the condenser is obtained at low or high ethylene concentrations. There is a minimum for mole fraction values in feed around 0.8. For this feed concentration the potential savings are the lowest possible.
A final consideration is important. All the energy savings in the condenser are referred to the column without membrane, i.e. the energy savings for a feed 0.5 in ethylene with membrane are compared with the same column (with the same feed) without membrane. But in this example we found that the energy required in the condenser is approximately the same for all the base columns. However, although the composition in the distillate and bottoms are equal in all cases,

the flowrate in the distillate and bottoms change. Therefore, if we are interested in comparing the energy used per kmol of ethylene (or ethane) obtained in the distillate (bottoms), the results could change significantly. It is easy to see that if we want to get 1 kmol/h of ethylene in the distillate, we need to introduce more flow if the feed mole fraction is 0.5 than if it is 0.8
5. Conclusions
A systematic procedure for the design and the retrofit of cryogenic binary separation systems using a separator placed in parallel (membrane) has been presented. Due to the fact that in cryogenic systems the cost of the process is determined by the cost of the refrigeration in the condenser, a shortcut approach was proposed to predict the potential energy saved in the condenser. The most relevant result is that the maximum energy savings depend on both the separation capacity of the separator (i.e. selectivity in a membrane) and on the flow to obtain that separation. For a given separation factor, there is a maximum possible energy saved in the column and a minimum flowrate of DX stream (permeate in a vapor membrane) needed to obtain that separation. The flowrate of the stream withdrawn from the column has a lower impact on the energy saved.
Once the economic potential of the hybrid design was established, a rigorous model was described. This model has been developed using a superstructure in a process simulator (Unisim.Design) that includes the distillation column, compressor, cooler and all the potential locations for feeding and withdrawing the streams. A rigorous membrane model was developed in Matlab. The results obtained show an interesting economic potential in the use of hybrid systems in cryogenic separation. In the case study used in this paper, savings up to 30% in energy are possible and around 20% in total annualized cost.
It is clear that the economic potential of the system depends heavily on the particular conditions (costs of refrigeration, electricity, compressor and membrane), and there are some uncertainties about the performance of the membrane, in particular the trade-off between selectivity and permeability. However, despite all these uncertainties, the economic potential of the system shows that in most cases the hybrid system outperforms the original distillation column.
References
1. Humphrey, J., Separation processes: playing a critical role. Chemical Engineering Progress 1995, 91, (10), 43-54.
2. Soave, G.; Feliu, J. A., Saving energy in distillation towers by feed splitting. Applied Thermal Engineering 2002, 22, (8), 889.
3. Lipnizki, F.; Field, R. W.; Ten, P. K., Pervaporation-based hybrid process: a review of process design, applications and economics. Journal of Membrane Science. 1999, (153), 183.
4. Pressly, T. G.; Ng, K. M., A Break-Even Analysis of Distillation -Membrane Hybrids. AIChE Journal 1998, 44, (1), 93-105.
5. Moganti, S.; Noble, R. D.; Koval, C. A., Analysis of a Membrane Distillation Column Hybrid Process. Journal of Membrane Science. 1994, 93, 31-44.

6. Pettersen, T.; Lien, K. M., Design of Hybrid Distillation and Vapor Permeation Processes. Journal of Membrane Science. 1995, 99, 21-30.
7. Bausa, J.; Marquardt, W., Shortcut Design Methods for Hybrid Membrane/Distillation Processes for the Separation of Nonideal Multicomponent Mixtures. Industrial & Engineering Chemistry Research 2000, 39, 1658-1672.
8. Bausa, J.; von Watzdorf, R.; Marquardt, W., Shortcut Methods for Nonideal Multicomponent Distillation: 1. Simple Columns. AIChE Journal 1998, 44, (10), 2181-2198.
9. von Watzdorf, R.; Bausa, J.; Marquardt, W., Shortcut Methods for Nonideal Multicomponent Distillation: 2. Complex Columns. AIChE Journal 1999, 45, (8), 1615-1628.
10. Kookos, I. K., Optimal Design of Membrane/Distillation Column Hybrid Processes. Industrial & Engineering Chemistry Research 2003, 42, 1731-1738.
11. Viswanathan, J.; Grossmann, I. E., An Alternate MINLP Model for Finding the Number of Trays Required for a Specified Separation Objective. Computers & Chemical Engineering 1993, 17, (9), 949-955.
12. Szitkai, Z.; Lelkes, Z.; Rev, E.; Fonyo, Z., Optimization of hybrid ethanol dehydration systems. Chemical Engineering and Processing 2002, 41, 631-646.
13. Steinigeweg, S.; Gmehling, J., Transesterification processes by combination of reactive distillation and pervaporation. Chemical Engineering and Processing 2004, 43, 447-456.
14. Diwekar, U. M.; Grossmann, I. E.; Rubin, E. S., An MINLP Process Synthesizer For A Sequential Modular Simulator. Industrial & Engineering Chemistry Research 1992, 31, (1), 313-322.
15. Reneaume, J. M. F.; Koehert, B. M.; Joulia, X. L., Optimal process synthesis in a modular simulator environment: new formulation on the mixed integer nonlinear programming problem. Industrial & Engineering Chemistry Research 1995, 34, 4378-4394.
16. Caballero, J. A.; Milan-Yanez, D.; Grossmann, I. E., Rigorous design of distillation columns: Integration of disjunctive programming and process simulators. Industrial & Engineering Chemistry Research 2005, 44, (17), 6760-6775.
17. Caballero, J. A.; Odjo, A.; Grossmann, I. E., Flowsheet Optimization with Complex Cost and Size Functions Using Process Simulators. AIChE Journal 2007, 53, (9), 2351-2366.
18. Marquardt, W.; Kossack, S.; Kraemer, K., A Framework for the Systematic Design of Hybrid Separation Processes. Chinese Journal of Chemical Engineering 2008, 16, (3), 333-342.
19. Eliceche, A. M.; Daviou, M. C.; Hoch, P. M.; Ortiz Uribe, I., Optimisation of azeotropic distillation columns combined with pervaporation membranes. Computers & Chemical Engineering 2002, 26, 563-573.
20. Underwood, A., Fractional distillation of multicomponent mixtures. Chemical Engineering Progress 1948, 44, 603-614.
21. Nikolaides, I. P.; Malone, M. F., Approximate Design of Multiple Feed/Side Draw Distillation Systems. Industrial & Engineering Chemistry Research 1987, 26, (9), 1839-1845.
22. Sahinidis, N. V., BARON: A general purpose global optimization software package. Journal Of Global Optimization 1996, 8, (2), 201-205.
23. Mulder, M., Basic Principles of Membrane Technology. Kluwer Academic Publishers: Dordrecht, Netherlands, 1991.
24. Fuertes, A. B.; Menéndez, I., Separation of Hydrocarbon Gas Mixtures Using Phenolic Resing-Based Carbon Membranes. Separation and Purification Technology 2002, 28, 29-41.
25. Smith, S. W.; Hall, C. K.; Freeman, B. D.; Rautenbach, R., Corrections for the analythical gas-permeation models for separation of binary gas mixtures using membrane modules. Journal of Membrane Science 1996, 118, 289-294.
26. UniSIm.Design UniSIm.Design. Honeywell, 370; London, Ontario, 2008.
27. Teramoto, M.; Takeuchi, N.; Maki, T.; Matsuyama, H., Ethylene/Ethane separation by facilitated transport membrane accompanied by permeation of aqueous silver nitrate solution. Separation and Purification Technology 2002, 28, 117-124.
28. Stephan, W.; Noble, R. D.; Koval, C. A., Design Methodology for a Membrane/Distillation Column Hybrid Process. Journal of Membrane Science. 1995, 99, 259-272.
29. MATLAB. MATLAB. The Language of Technical Computing., 2006.
30. Holmström, K., The Tomlab Optimization Environment in Matlab. Adv. Model Optim. 1999, 1, 47-69.
31. Turton, R.; Bailei, R. C.; Whiting, W. B.; Shaeiwitz, J. A., Analysis Synthesis and Design of Chemical Processes. McGraw-Hill.: New York, 1998.
32. Smith, R., Chemical Process Design and Integration. John wiley & Sons, Ltd.: Chichester, 2005; p 687.
33. Quesada, I.; Grossmann, I. E., An LP/NLP based branch and bound algorithm for convex MINLP optimization problems. Computers & Chemical Engineering 1992, 16, (10-11), 937-947.
34. Holmström, K.; Anders, O. G.; Edwall, M., User's guide for TOMLAB/CPLEX v.11.2. In http://tomopt.com/docs/TOMLAB_CPLEX.pdf, Ed. 2009.
35. Gill, W. P. E.; Murray, W.; Saunders, SNOPT: an SQP algorithm for large-scale constrained optimization. SIAM J. Optimization 2002, 979-1006.
36. Fahmy, A.; Mewes, D.; Ebert, K., Design methodology for the optimization of membrane separation properties for hybrid vapor permeation-distillation processes. Separation Science and Technology 2001, 36, (15), 3287-3304.

Table 1. Data for the base case column.
Thermodynamics: SRK default Unisim.Design values Number of Trays = 70; Feed Tray = 40 Q Condenser (kW) = 856.4 Q Reboiler (kW) = 598.4 Reflux ratio = 4.633.
Feed Distillate Bottoms Temperature (ºC) -20.38 -29.16 -6.729 Pressure (kPa) 2000 2000 2060
Mole Flow (kmol/h) 100 60.1 39.9 Ethylene (mole fraction) 0.60 >0.995 >0.995

Table 2 Area for different values of selectivity to obtain the maximum energy savings, and minimum flowrate of stream DX to obtain these savings.
Permeability P* Selectivity Area(m2) DX(kmol/h) % E.S
2 4.2 39.1 20.3 3 33 36.0 27.2 4 145 34.6 31.3 5 453 33.8 33.0 6 1147 33.3 34.5 7 2514 33.0 35.7 8 4916 32.8 36.6 9 9035 32.7 37.4 10 15446 32.6 38.1 11 25094 32.5 38.6
2kmolPermeability in
m h kPa⎛ ⎞⎜ ⎟⎝ ⎠
; * Permeability calculated using the correlation by Fuertes
and Menendez. ES = energy saved in condenser.
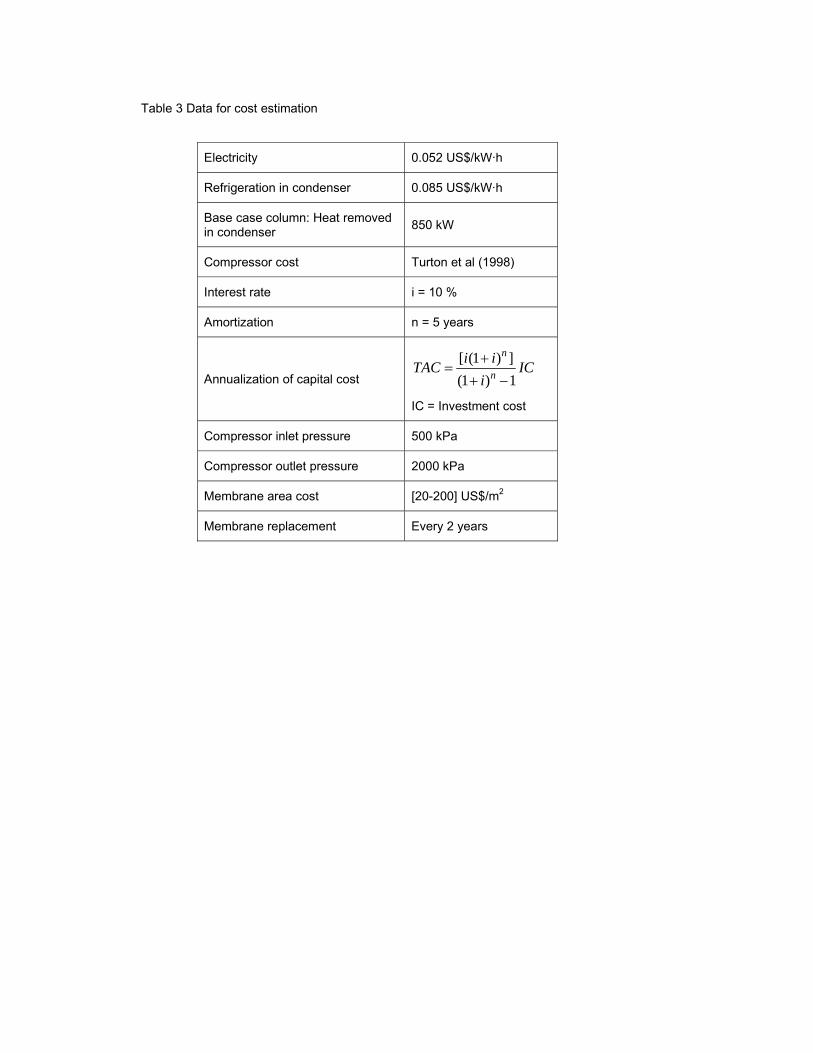
Table 3 Data for cost estimation
Electricity 0.052 US$/kW·h
Refrigeration in condenser 0.085 US$/kW·h
Base case column: Heat removed in condenser 850 kW
Compressor cost Turton et al (1998)
Interest rate i = 10 %
Amortization n = 5 years
Annualization of capital cost [ (1 ) ](1 ) 1
n
ni iTAC IC
i+
=+ −
IC = Investment cost
Compressor inlet pressure 500 kPa
Compressor outlet pressure 2000 kPa
Membrane area cost [20-200] US$/m2
Membrane replacement Every 2 years

Table 4. Results of the rigorous models
Thermodynamics: SRK default Unisim.Design values
Number of Trays = 70; Feed Tray = 40 Distillate 0.995 ethylene mole fraction; T = -29.16 ºC Bottoms 0.995 ethane mole fraction;
Base Case HFM Model
Reflux Ratio 4.633 3.288
Q Condenser (kW) 856.4 654.1
Q Reboiler (kW) 598.4 998.4
W Compressor (kW) ---- 20.53
FX Flow (kmol/h) ---- 320.9
FX Ethy. mol fraction ---- 0.779
FX column tray ---- 38
DX Flow (kmol/h) ---- 18.28
DX Ethy. mol fraction ---- 0.928
DX column tray ---- 23
BX Flow (kmol/h) ---- 302.7
BX Ethy. mol fraction ---- 0.770
BX column tray ---- 39
Membrane Area (m2) ---- 121.9
Membrane Select. ---- 4.72
Membrane Pout (kPa) ---- 500
Saved with respect to base case (kUS$/year) ---- 113.6

Feed
D
B
Feed
D
B
Feed
D
BB
Feed
D
BB
Feed
D
BB
(a) (b)
(c) (d)
Figure 1
Possible configurations for a hybrid distillation column vapor membrane.
------------------------------------------

Feed
D
FX
DX
BX
2
3Feed
DX
B
D
1
B
4BX
FX
(a) (b)
Figure 2
Parallel hybrid distillation vapor membrane configuration(a) and its decomposition in column sections (b)
Fx, z
Dx, y
Bx, x
(1 )
(1 )
zz
yy
γ −=
−
( )
⎟⎟⎠
⎞⎜⎜⎝
⎛−
=−=
yPPzPPermArea
yPzPPermAreaDx
F
DF
DF
··
··
Figure 3
Scheme of a perfect cross flow membrane
------------------------------------------

Fo, zo, PinDx, y, Pout
Bx, xw, Pin
Plug Flow
Perfect Mixed Flow (i.e. constant δy in all points)
F, x B, xz z + dz
Figure 4
Scheme of a hollow fiber membrane

100 kmol/h(0.6, 0.4)
73.47 kmol/h(0.67,0.33)
47.05 kmol/h(0.94, 0.06)
26.42 kmol/h(0.19, 0.81)
60.36 kmol/h(0.995, 0.005)
Underwood equations relative volatility = 1.42
0 10 20 30 40 50 60 70100
120
140
160
180
200
220
240
260
280
300
Tray Number
Mol
ar F
low
(km
ol/h
)
Figure 5
Shortcut model and rigorous Unisim.Design simulation comparison. Lines correspond to shortcut model, points to rigorous simulation vapor phase, crosses to rigorous simulation liquid phase. The maximum error is in the vapor flow in tray number 39 (3.75%). The maximum error in liquid mole flow is around 3% in trays 1 and 70. The rest of errors in mole flows are under 3%.

0.7 0.75 0.8 0.85 0.9 0.95 10
5
10
15
20
25
30
35
40
45
DX ethylene molar fraction
Ene
rgy
save
d in
con
dens
er (%
)
0.2
0.3
0.4
0.5
0.6
0.7
0.8
0.9
0.95
0.7 0.75 0.8 0.85 0.9 0.95 10
5
10
15
20
25
30
35
40
45
DX ethylene molar fraction
Ene
rgy
save
d in
con
dens
er (%
)
0.2
0.3
0.4
0.5
0.6
0.7
0.8
0.9
0.95
0.7 0.75 0.8 0.85 0.9 0.95 15
10
15
20
25
30
35
40
45
DX ethylene molar fraction
Min
imum
Flo
w ra
te in
stre
am D
X (k
mol
/h)
0.2
0.3
0.4
0.5
0.6
0.7
0.8
0.9
0.95
0.7 0.75 0.8 0.85 0.9 0.95 15
10
15
20
25
30
35
40
45
DX ethylene molar fraction
Min
imum
Flo
w ra
te in
stre
am D
X (k
mol
/h)
0.2
0.3
0.4
0.5
0.6
0.7
0.8
0.9
0.95
Figure 6
Energy saved and minimum flow rate in permeate (stream DX) in terms of DX ethylene mole fraction and ethylene recovery fraction (numbers on the lines).

Figure 7
Energy saved in the condenser for different permeate (stream DX) flowrates. Recovery of ethylene in permeate was fixed to 0.7.
-----------------------------------------
0 10 20 30 40 500
5
10
15
20
25
30
Flow rate in DX stream
Ene
ry s
aved
in c
onde
nse
r(%
)
y = 0.75y = 0.80y = 0.85

1 2 3 4 5 6 7 8 9 10 11 12-1
-0.5
0
0.5
1
1.5
2x10⁵
US$
/yea
rSa
ved
Selectivity
150 US$/m2
200 US$/m2
100 US$/m2
50 US$/m2
20 US$/m2
Figure 8
Economic evaluation of a hybrid system in terms of selectivity. Savings with respect to the base case design for different costs of membrane areas. The permeability was calculated using the correlation in equation 13. Other data for cost estimation are given in Table 3.
-----------------------------------------
0 200 400 600 800 10000.73
0.74
0.75
0.76
0.77
0.78
0.79
0.8
Area (m2)
Per
mea
te m
olar
frac
tion
0 200 400 600 800 10000
5
10
15
20
25
30
35
40
45
50
Area (m2)
Per
mea
te fl
ow (k
mol
/h)
Figure 9
Permeate mole fraction and permeate mole flow rate in terms of area in a hollow fiber membrane. Permeability 5 10-5 kmol/(h m2 kPa); selectivity 4; ethylene molar fraction in feed 0.6

Feed FX
DX
BX
D
B
(a)
FX
DX
BX
Feed
Q Cond
Q Reb
W CompDistillate
Bottoms
FX
DX
BX
Feed
Q Cond
Q Reb
W CompDistillate
Bottoms
(b)
Figure 10 (a) Superstructure. (b) Simplified version in UniSim.Design.

Figure 11

Energy saved in condenser for different ethylene feed concentrations and different selectivities.
0.2 0.3 0.4 0.5 0.6 0.7 0.8 0.9 120
25
30
35
40
45
50
55
60
65
70
Feed ethylene molar fraction
% E
nerg
y sa
ved
in c
onde
nser
Selectivity = 6Selectivity = 8Selectivity = 10Selectivity = 20
Figure 12


![Liquid-Vapor Separation Efficiency [envp0102].doc](https://static.fdocuments.us/doc/165x107/577cc4171a28aba711981830/liquid-vapor-separation-efficiency-envp0102doc.jpg)