DESIGN OF DEWATERING SCHEMES USING ANALYTICAL AND...
15
Seventeenth International Water Technology Conference, IWTC17 Istanbul, 5-7 November 2013 DESIGN OF DEWATERING SCHEMES USING ANALYTICAL AND NUMERICAL METHODS AT RESIDENTIAL AREAS IN KUWAIT Amjad Aliewi 1 , Ali Oudwani 1 , Habib Qallaf 1 , Tariq Rashid 1 , Maha El Mansour 2 , and Saleh Al Mufleh 2 1 Water Research Center, Kuwait Institute for Scientific Research, [email protected] 2 Ministry of Electricity and Water, Kuwait ABSTRACT The water table of the shallow aquifers at many residential areas (e.g, Jaber Al-Ahmad and Al- Qirawan) in Kuwait is close to the ground surface, which has forced a lot of individuals and companies to conduct unplanned dewatering activities. The elevated water table and the insensible dewatering schemes can have negative impacts on the existing buildings and the infrastructure services such as collapse or fracturing. The aim of this paper was to develop an integrated management approach that solves the problem of high water levels through dewatering schemes that deal with environmental consequences and reduce the demand on brackish groundwater well fields by treating the drained water using a new desalination technology consisting of small Reverse Osmosis (RO) units. In this paper, a dewatering system was designed, using field pumping tests, analytical models (Tartakovsky-Neuman and Theis) and a numerical model (the USGS software package, Visual MODFLOW). This paper illustrates that, that the water table can be reduced to a maximum of four m without causing problems of formation stability and without raising the groundwater salinity above 10,000 mg/l. Based on the results of this study, the Ministry of Electricity and Water (MEW) is planning to use the existing brackish water networks situated in these residential areas to supply this to the main roads and public parks for irrigation, and to implement similar designs of these dewatering schemes and RO units in other residential areas. This paper does not address the RO design and technology used in this project. Keywords: Dewatering, groundwater flow, numerical modeling, RO technology, Kuwait 1. INTRODUCTION For many years, rise in the level of water table in residential and commercial areas in Kuwait has been a serious problem causing road instability, subsiding issues and moisture-related problems for building foundations, flooding of basements, over loading of sewer systems, increase of salinity of shallow groundwater, flash floods caused by water logging of soil, and other public health problems. If the water table is too high, then the hydrostatic pressure against basement walls will be high as well. To remove and prevent this water from entering the basement and/or foundation areas, dewatering schemes are always suggested. It was estimated in Kuwait that a permanent abstraction by vertical wells (at 30 – 50 m total drilling depth) would be required to keep the water table at a desired level below the foundations in residential areas of Kuwait (Mossaad and Sayed [4] and El- Nahhas et al. [3]).
Transcript of DESIGN OF DEWATERING SCHEMES USING ANALYTICAL AND...

Seventeenth International Water Technology Conference, IWTC17 Istanbul, 5-7 November 2013
DESIGN OF DEWATERING SCHEMES USING ANALYTICAL AND NUMERICAL
METHODS AT RESIDENTIAL AREAS IN KUWAIT
Amjad Aliewi1, Ali Oudwani
1, Habib Qallaf
1, Tariq Rashid
1,
Maha El Mansour2, and Saleh Al Mufleh
2
1Water Research Center, Kuwait Institute for Scientific Research, [email protected]
2Ministry of Electricity and Water, Kuwait
ABSTRACT
The water table of the shallow aquifers at many residential areas (e.g, Jaber Al-Ahmad and Al-
Qirawan) in Kuwait is close to the ground surface, which has forced a lot of individuals and
companies to conduct unplanned dewatering activities. The elevated water table and the insensible
dewatering schemes can have negative impacts on the existing buildings and the infrastructure
services such as collapse or fracturing. The aim of this paper was to develop an integrated
management approach that solves the problem of high water levels through dewatering schemes that
deal with environmental consequences and reduce the demand on brackish groundwater well fields by
treating the drained water using a new desalination technology consisting of small Reverse Osmosis
(RO) units. In this paper, a dewatering system was designed, using field pumping tests, analytical
models (Tartakovsky-Neuman and Theis) and a numerical model (the USGS software package, Visual
MODFLOW). This paper illustrates that, that the water table can be reduced to a maximum of four m
without causing problems of formation stability and without raising the groundwater salinity above
10,000 mg/l. Based on the results of this study, the Ministry of Electricity and Water (MEW) is
planning to use the existing brackish water networks situated in these residential areas to supply this
to the main roads and public parks for irrigation, and to implement similar designs of these
dewatering schemes and RO units in other residential areas. This paper does not address the RO
design and technology used in this project.
Keywords: Dewatering, groundwater flow, numerical modeling, RO technology, Kuwait
1. INTRODUCTION For many years, rise in the level of water table in residential and commercial areas in Kuwait has been
a serious problem causing road instability, subsiding issues and moisture-related problems for
building foundations, flooding of basements, over loading of sewer systems, increase of salinity of
shallow groundwater, flash floods caused by water logging of soil, and other public health problems.
If the water table is too high, then the hydrostatic pressure against basement walls will be high as
well. To remove and prevent this water from entering the basement and/or foundation areas,
dewatering schemes are always suggested. It was estimated in Kuwait that a permanent abstraction
by vertical wells (at 30 – 50 m total drilling depth) would be required to keep the water table at a
desired level below the foundations in residential areas of Kuwait (Mossaad and Sayed [4] and El-
Nahhas et al. [3]).
Seventeenth International Water Technology Conference, IWTC17 Istanbul, 5-7 November 2013
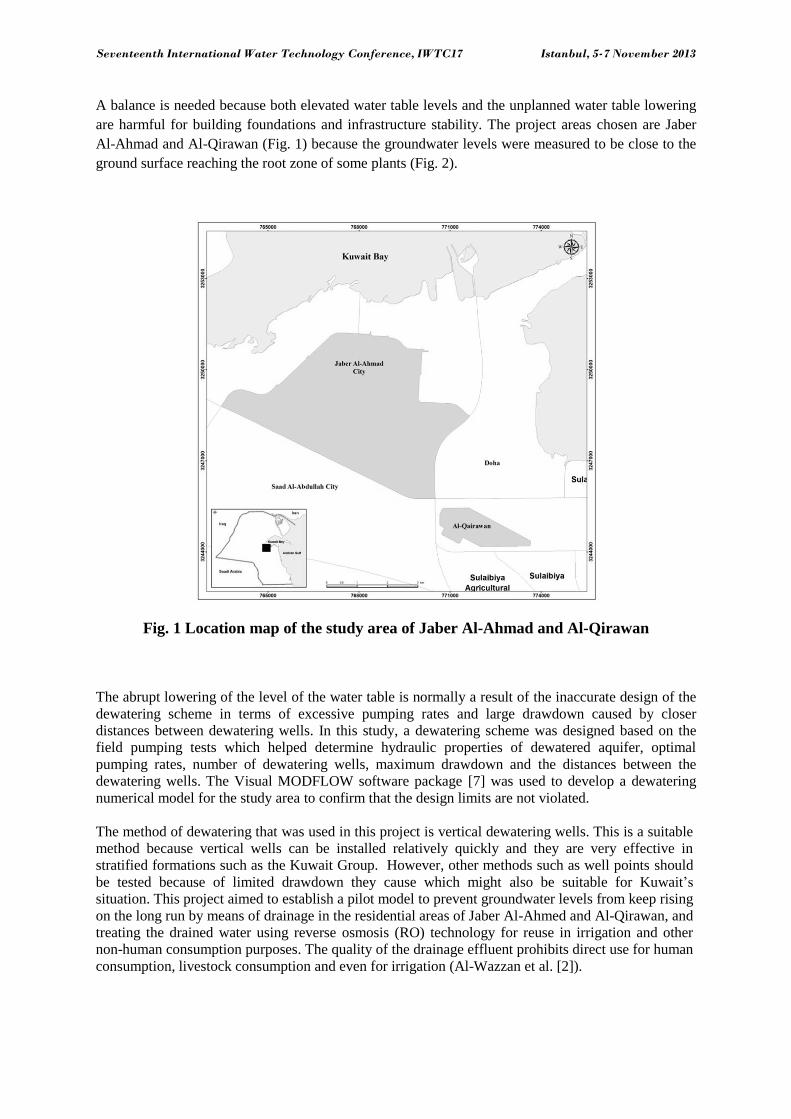
A balance is needed because both elevated water table levels and the unplanned water table lowering
are harmful for building foundations and infrastructure stability. The project areas chosen are Jaber
Al-Ahmad and Al-Qirawan (Fig. 1) because the groundwater levels were measured to be close to the
ground surface reaching the root zone of some plants (Fig. 2).
Fig. 1 Location map of the study area of Jaber Al-Ahmad and Al-Qirawan
The abrupt lowering of the level of the water table is normally a result of the inaccurate design of the
dewatering scheme in terms of excessive pumping rates and large drawdown caused by closer
distances between dewatering wells. In this study, a dewatering scheme was designed based on the
field pumping tests which helped determine hydraulic properties of dewatered aquifer, optimal
pumping rates, number of dewatering wells, maximum drawdown and the distances between the
dewatering wells. The Visual MODFLOW software package [7] was used to develop a dewatering
numerical model for the study area to confirm that the design limits are not violated.
The method of dewatering that was used in this project is vertical dewatering wells. This is a suitable
method because vertical wells can be installed relatively quickly and they are very effective in
stratified formations such as the Kuwait Group. However, other methods such as well points should
be tested because of limited drawdown they cause which might also be suitable for Kuwait’s
situation. This project aimed to establish a pilot model to prevent groundwater levels from keep rising
on the long run by means of drainage in the residential areas of Jaber Al-Ahmed and Al-Qirawan, and
treating the drained water using reverse osmosis (RO) technology for reuse in irrigation and other
non-human consumption purposes. The quality of the drainage effluent prohibits direct use for human
consumption, livestock consumption and even for irrigation (Al-Wazzan et al. [2]).

Seventeenth International Water Technology Conference, IWTC17 Istanbul, 5-7 November 2013
Based on the expected quality of the treated water and the robustness of the design and operation of
the dewatering scheme in the study area, the Ministry of Electricity and Water (MEW) will plan to
implement this pilot project in other residential areas especially those that lack brackish water
networks.
Fig. 2 Shallow water table helped plants to grow in the study area
Disposing of the drained water as waste, however, constitutes a great loss that the country cannot
afford. Therefore, as a resource, it should be treated and properly utilized. RO Desalination Units are
being installed at two well sites in the study area. The use of recovered water for irrigation purposes
through brackish water networks is the most viable option. The specific objectives of this paper are
given as follows:
To design a dewatering scheme at the study area using field pumping tests and
Tartakovsky-Neuman [5] analytical model so that the decline of groundwater levels does
not exceed 4 m and the total dissolved solids (TDS) of the pumped water remains less
than 10,000 mg/l.
To use the numerical model, Visual Modflow (McDonald, G., and A. Harbaugh, 1988 [7]) in order to check that the design limits of the dewatering scheme are not violated under
different operational scenarios..
During the implementation of this project, the safe disposal of the pumped water (that will not be
treated by RO Units) was provided to avoid negative impacts on the environment.

Seventeenth International Water Technology Conference, IWTC17 Istanbul, 5-7 November 2013
2. METHODOLOGY The methodology used to design the dewatering schemes at the study area is based on using pumping
tests in the field, analytical models (such as Tartakovsky-Neuman [5] and Theis [6] to analyze the
pumping tests data) and numerical models (such as Visual Modflow [7]) to validate design limits.
The Tartakovsky-Neuman Method [5] is an analytical method that is suitable for analyzing pumping
data for unsteady flow to a fully or partially penetrating well in a homogeneous, anisotropic,
unconfined aquifer with a delayed gravity response. The Tartakovsky-Neuman solution [5] does not
allow for instantaneous drainage at the water table. The solution neglects wellbore storage and can be
used to analyze both the pumping and recovery data from constant or variable rate pumping tests.
Tartakovsky and Neuman [5] developed a Laplace Transform solution for the unsteady flow to a
partially penetrating well in an unconfined aquifer with three-dimensional flow in the saturated and
unsaturated zones as follows:
s =
∫
[ ] [ ]
y (y√ )dy (1)
Where:
s is drawdown in [L]
b is aquifer thickness [L]
dD is dimensionless depth to top of pumping well screen (d/b)
J0 is Bessel function of first kind, zero order
Kr is radial hydraulic conductivity [L/T]
Kz is vertical hydraulic conductivity [L/T]
KD is dimensionless Gardner parameter for the unsaturated zone
lD is dimensionless depth to bottom of pumping well screen (l/b)
is Laplace transform variable [T-1
]
Q is pumping rate [L3/T]
r is radial distance [L]
S is storativity [dimensionless]
Sy is specific yield [dimensionless]
t is time [T]
T is transmissivity [L2/T]
y is variable of integration
ZD is dimensionless elevation of piezometer opening above base of aquifer (z/b)
and the parameters are related as follows:

Seventeenth International Water Technology Conference, IWTC17 Istanbul, 5-7 November 2013
√
ρD = tρ
The Visual Modflow package [7] solves equation 2 below using finite difference technique for
unconfined aquifers of constant density.
)..( hhkt
hSy
+ q (2)
Where:
The source and/or sink term, q, stands for abstraction from dewatering wells plus the leakage from
water and sewerage pipes in addition to irrigation returns, recharge from rainfall and marine discharge
flux to the Arabian Gulf.
h is the hydraulic head [L].
Other terms are defined above.
The Visual ModFlow solves equation 2 using a set of initial and boundary conditions including the
physical geometry of the aquifer, in the finite difference approximations. The data needed to solve this
equation are basically the inputs and outputs (q) to the aquifer; the physical geometry of the aquifer;
the boundary conditions; the spatial head distribution ( h ); the temporal head distribution (t
h
); the
hydraulic conductivity coefficients, k; the storage coefficients (Ss and Sy) and the initial conditions.
A dewatering model for the study area was developed and calibrated using the Visual Modflow
software package as described in the next section.
3. RESULTS AND DISCUSSION
3.1 Analytical Model Figure 3 shows the locations of dewatering wells and their associated observation wells at Jaber Al-
Ahmad area. At each site, there are two dewatering wells and two observation wells (one observation
is located at 11 m deep and the second at 21 m deep). A program of pumping tests was undertaken at
all the wells of Jaber Al-Ahmad dewatering sites as follows: Pumping the two dewatering wells (DW-
1 and DW-2) for a period up to 6 days on a continuous basis at one dewatering site (JB-A) while one
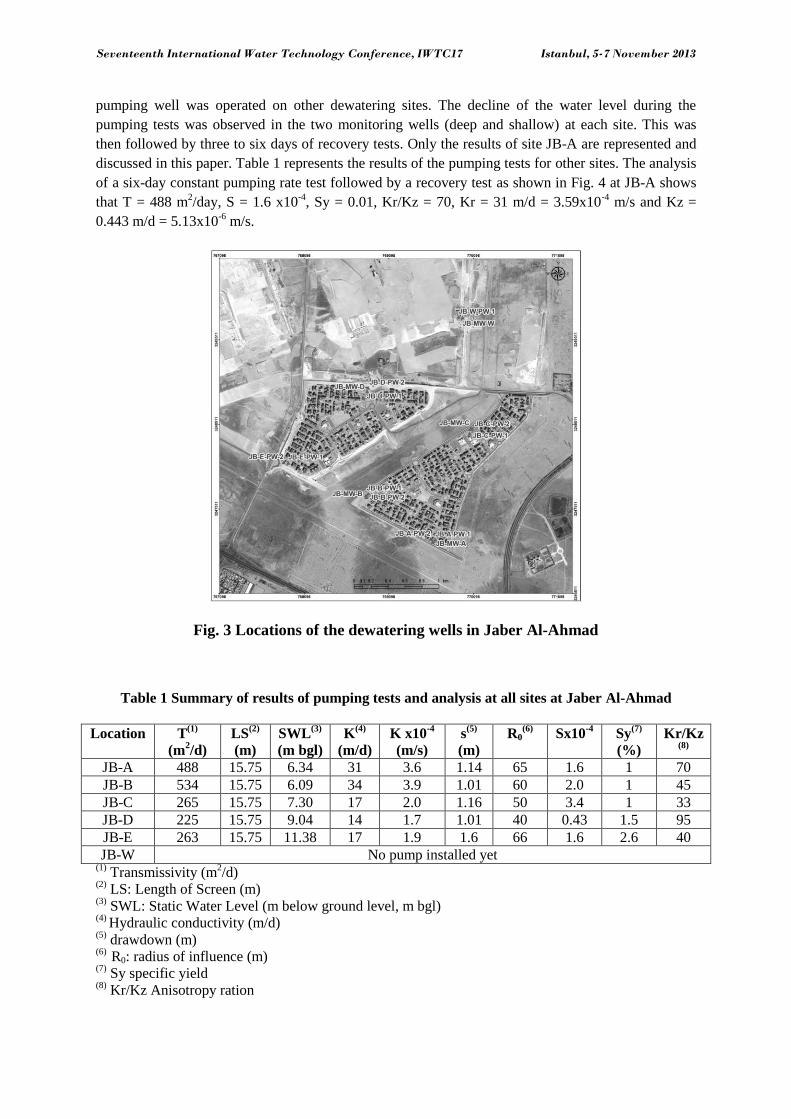
Seventeenth International Water Technology Conference, IWTC17 Istanbul, 5-7 November 2013
pumping well was operated on other dewatering sites. The decline of the water level during the
pumping tests was observed in the two monitoring wells (deep and shallow) at each site. This was
then followed by three to six days of recovery tests. Only the results of site JB-A are represented and
discussed in this paper. Table 1 represents the results of the pumping tests for other sites. The analysis
of a six-day constant pumping rate test followed by a recovery test as shown in Fig. 4 at JB-A shows
that T = 488 m2/day, S = 1.6 x10
-4, Sy = 0.01, Kr/Kz = 70, Kr = 31 m/d = 3.59x10
-4 m/s and Kz =
0.443 m/d = 5.13x10⁻⁶
m/s.
Fig. 3 Locations of the dewatering wells in Jaber Al-Ahmad
Table 1 Summary of results of pumping tests and analysis at all sites at Jaber Al-Ahmad
Location T(1)
(m2/d)
LS(2)
(m)
SWL(3)
(m bgl)
K(4)
(m/d)
K x10-4
(m/s)
s(5)
(m)
R0(6)
Sx10-4
Sy(7)
(%)
Kr/Kz(8)
JB-A 488 15.75 6.34 31 3.6 1.14 65 1.6 1 70
JB-B 534 15.75 6.09 34 3.9 1.01 60 2.0 1 45
JB-C 265 15.75 7.30 17 2.0 1.16 50 3.4 1 33
JB-D 225 15.75 9.04 14 1.7 1.01 40 0.43 1.5 95
JB-E 263 15.75 11.38 17 1.9 1.6 66 1.6 2.6 40
JB-W No pump installed yet (1)
Transmissivity (m2/d)
(2) LS: Length of Screen (m)
(3) SWL: Static Water Level (m below ground level, m bgl)
(4) Hydraulic conductivity (m/d)
(5) drawdown (m)
(6) R0: radius of influence (m)
(7) Sy specific yield
(8) Kr/Kz Anisotropy ration
Seventeenth International Water Technology Conference, IWTC17 Istanbul, 5-7 November 2013
Figure 4 shows the effect of delay yield of unconfined aquifers, although the specific yield value is
low at 1% and the general storage coefficient is 1.6x10⁻⁴
, which indicates that although the utilized
aquifer is unconfined, but the presence of clay and silt as shown in Fig. 5 has semi-confining effects.
The transmissivity values of the utilized (Kuwait Group) aquifer at Jaber Al-Ahmad shows that the
Kuwait Group Aquifer is significant in terms of quantity potential and it can be utilized on the
national Kuwaiti level. This is confirmed by relatively low drawdown values and high specific
capacity values. It is also shown that the average anisotropy ratio is just above 70 which shows that
the aquifer is strongly anisotropic. Fig. 6 illustrates the status of water levels under static and
dynamic conditions for JB-A wells. It is clear that water will move upwards under static conditions
(the lower sections/aquifers have larger hydraulic heads than the upper ones) and downwards under
dynamic (pumping) conditions. Since, the results of pumping tests at Jaber Al-Ahmad will be used to
design the dewatering scheme at Al-Qirawan, Table 1 above shows that SWL at any location is deeper
than 4 m and therefore it is needed to design the system at Al Qirawan with only one dewatering well
at each dewatering site. This fact was also confirmed by the numerical dewatering model.
In summary the dewatering scheme can be designed analytically by following these parameters:
Distance between any two dewatering sites ≥ 500 m
Distance between any two pumping wells at the same site ≤ 66 m
Distance between the dewatering well and its observation well ≤ 50 m
Pumping rate of any dewatering well should be between 1,000 and 1,500 m3/day.
The radius of influence ≤ 66 m
The steady state drawdown ≤ 1.6 m which is less than four m (the maximum limit)
The pump of any dewatering site should be used with the specifications of Q = 42 m3/hr,
Total Dynamic Head (TDH) = 30 m and efficiency of pump ≥ 70%
Fig. 4 Analysis of pumping and recovery data using Tartakovsky-Neuman method for JB-A
6-day Constant Test followed by recovery at JB-A in Nov 2012
1. 10. 100. 1000. 1.0E+4 1.0E+5
0.1
1.
10.
Time (min)
Dis
pla
cem
ent (m
)
Obs. Wells
JB-A-MW
Aquifer Model
Unconfined
Solution
Tartakovsky-Neuman
Parameters
T = 487.5 m2/dayS = 0.0001609Sy = 0.01Kz/Kr = 0.01401kD = 11.03

Seventeenth International Water Technology Conference, IWTC17 Istanbul, 5-7 November 2013
3.2 Numerical Model
The numerical model was used to demonstrate that applying the above design elements does not
violate the condition of a maximum drawdown of 4 m . The boundaries of the Jaber Al-Ahmad & Al-
Qirawan Areas model are presented in Fig. 7. The dewatering wells are located in the upper first 30
m of the Kuwait Group Aquifer. Fig. 8 is a geological cross section in the study area.
LEGEND
Fine sand
Medium sand
Coarse sand
Silt
Clay
Gravel
Fig. 5 Well log at site JB-A

Seventeenth International Water Technology Conference, IWTC17 Istanbul, 5-7 November 2013
Fig. 6 Vertical gradient at JB-A
The southern boundary was simulated as specified flux by assuming recharge wells at this boundary
as shown in Fig. 9. The numerical techniques require a grid to be imposed upon the model domain.
Finite difference grids are generally composed (Fig. 9) of small cells in the region, where the water
levels will decline quickly near the dewatering wells. The next step was calibration which is the
process by which the model is systematically turned to represent the true aquifer conditions. Table 2
represents the water level data used for steady state calibration. It should be noted that the data from
Jaber Al-Ahmad dewatering wells (in particular, the Static Water Levels, SWL) were used to calibrate
the model under static conditions and data from the pumping tests were used to calibrate the model
under dynamic conditions. The numerical model will be recalibrated when the construction of the
wells at Al-Qirawn area is completed and pump-tested.

Seventeenth International Water Technology Conference, IWTC17 Istanbul, 5-7 November 2013
Fig. 7 Boundary conditions of JBQ flow model
Fig. 8 Geological cross section in the study area (Fadlelmawla, A.; F. Al-Yamani; A.
Mukhopadhyay; K. Rakha; M. AlSenafy; and H. Bhandary [8])

Seventeenth International Water Technology Conference, IWTC17 Istanbul, 5-7 November 2013
Fig. 9 Grid and location of recharge wells to specify flux at the southern boundary
Table 2 Water level data for steady state calibration
Observation
wells
x y SWL
(m asl)
JB-A 769,617 3,247,120 6.2
JB-B 768,828 3,247,669 4.3
JB-C 770,069 3,248,464 3.5
JB-D 768,844 3,248,899 4.1
JB-E 767,883 3,248,096 3.2
JB-W 769,971 3,249,772 1.4
DOH-1 771,750 3,252,300 0.5
KBL-22 774,100 3,247,050 4.3
KBL-23 767,275 3,252,275 3.2
KBL-24 765,930 3,249,275 0.9 SWL (m asl): Static Water Levels in meter above sea level
The steady state calibration matching results are presented in Fig. 10 which show that the match
between observed and simulated water levels is good, as they are within 95% confidence interval. The
calibration results using pumping tests data are presented in Fig. 11. The match captures the trend and
is considered to be good. The calibrated model was then run to detect that drawdown at any location
and it is shown that the maximum drawdown was about 1.5 m which means it does not exceed 4 m.
The design of the dewatering scheme at Jaber Al-Ahmad with acceptable quality (Al-Odwani et al.
[1]) requires that the TDS does not exceed 10,000 mg/l. A massive water sampling campaign was
carried out during pumping tests and all field analysis confirmed that (Fig. 12) the maximum value of
Electrical Conductivity (EC) under dynamic conditions is 12,500 uS/cm which is about 8000 mg/l

Seventeenth International Water Technology Conference, IWTC17 Istanbul, 5-7 November 2013
which is less than the limit of 10,000 mg/l. The distribution of water levels after four days of pumping
is presented in Fig. 13.
Fig. 10 Steady state calibration using JB wells
Fig. 11 Transient calibration using the pumping and recovery data at well JB-D

Seventeenth International Water Technology Conference, IWTC17 Istanbul, 5-7 November 2013
Fig. 12 EC versus drawdown at monitoring well JB-E1-LMW under dynamic conditions
Fig. 13 Distribution of groundwater heads after four days

Seventeenth International Water Technology Conference, IWTC17 Istanbul, 5-7 November 2013
4. CONCLUSIONS This paper shows that the dewatering scheme by vertical wells to a total depth at 30 m is efficient and
can be designed using both analytical and numerical models to solve the problem of continuous water
rising in residential areas in Kuwait.
The analysis of the pumping tests show that the Kuwait Group Aquifer at Jaber Al-Ahmad study area
has moderate to significant transmissive properties and the values of storativity can be attributed to
unconfined aquifers with clear effect of confining materials of clay and silt.
Also, the analysis of the pumping tests shows that the Kuwait Group aquifer at the project area has
considerable anisotropic properties and weak heterogeneous properties.
This paper shows that the quality of the drained water under pumping conditions is less than the upper
limit of 10,000 mg/l and thus it can be treated by the RO Desalination Units.
The paper also concluded that the reuse of a blended RO treated water with brackish water (TDS <
10,000 mg/l) for irrigation purposes through brackish water networks is the most viable option.
The dewatering numerical model using visual modelflow was developed and calibrated under static
and transient conditions. The calibrated model was used to simulate the drawdown at Jaber Al-Ahmad
and the results of the analytical model match the results of the numerical model. However, the
numerical model will be recalibrated when the rest of the dewatering wells and their observation wells
are constructed and tested.
The proper design of the dewatering scheme at residential area in Kuwait requires that the distance between any two dewatering sites to be about 500 m ; distance between the dewatering well and its observation well is less than 50 m; the pumping rate of any dewatering well between 1,000 and 1,500 m3/day in order to achieve drawdown at equilibrium less than 4 m; and finally the pump of any dewatering site should be used with the specifications of pumping rate around 40 m3/hr and a total dynamic head about 30 m with a pump efficiency about 70% .
ACKNOWLEDGEMENTS The authors would like to extend their appreciation to the Ministry of Electricity and Water (MEW)
of the State of Kuwait for funding this project. The active involvement of the Groundwater Resource
Development and Management Department of MEW is highly appreciated. The unlimited support of
KISR’s management was pivotal in carrying out the various tasks of the project. The constant
encouragement and support by the efficient management of the Water Research Center of KISR is
highly appreciated as they kept the morale of the project team always at a high level.
Seventeenth International Water Technology Conference, IWTC17 Istanbul, 5-7 November 2013
REFERENCES [1] Al-Odwani, A., Bou-Hamad, S., Al-Tabtabaei, M., Al-Sairafi, A., Ahmed, M., Al-Mesri, A., Atallah,
M. and Jabsheh , F., Pilot study on high-quality freshwater production utilizing beachwells,
(WT008K), Kuwait Institute for Scientific Research, Report No. KISR 8983, Kuwait. 2007.
[2] Al-Wazzan, Y., Safar, M. and Al-Mesri, A., Reverse osmosis brine staging treatment of
subsurface water. Desalination Vol. 155, pp. 141-151. 2003.
[3] El-Nahhas, F., Sherif, M., Abdullah, W., Hadi, K. and Ghoneim, H., Study, design and
construction supervision of a pilot groundwater drainage project, Part 1: Main Report, Kuwait
Institute for Scientific Research, Report No. KISR5840, Kuwait. 2000.
[4] Mossaad, M., and Sayed, S.A.S., Study, design and construction supervision of a pilot
groundwater drainage project, (Phase 2). Part 1: Main Report, Kuwait Institute for Scientific
Research, Report No. KISR5095, Kuwait. 1997.
[5] Tartakovsky, G.D. and Neuman, S.P., Three-dimensional saturated-unsaturated flow with axial
symmetry to a partially penetrating well in a compressible unconfined aquifer, Water Resources
Research, Vol. 43, Issue 1, 2007.
[6] Theis, C.V., The relation between the lowering of the piezometric surface and the rate and
duration of discharge of a well using groundwater storage, American Geophysical Union
Transactions, Vol. 16, pp. 519-524. 1935.
[7] http://www.swstechnology.com/groundwater-modeling-software/visual-modflow-flex based on
the work of McDonald, G., and A. Harbaugh. A modular three-dimensional finite-difference ground-water flow model: Techniques of Water-Resources Investigations of the United States Geological Survey, Book 6, Chapter A1, 586 p. 1988
[8] Fadlelmawla, A.; F. Al-Yamani; A. Mukhopadhyay; K. Rakha; M. AlSenafy; and H. Bhandary.
2009. Evaluation of Quantity and Quality of Groundwater Seepage to Kuwait Bay (WM019C).
Kuwait Institute for Scientific Research, Report No. KISR9770, Kuwait.