Design of Box Culvert
12
STRUCTURAL DESIGN OF SINGLE CELL BOX CULVERT Based on AASHTO LRFD Bridge Design 2007 SI Client: GeoData Survey Company Designed By: Ali Akbar Shaikhzadeh Date: Job Name/Station: Culvert Structural Design Verified By: Revision: INPUT DATA CONCRETE COMPRESSIVE STRENGTH, f'c 28 MPA REBAR YIELD STRENGTH, fy 420 MPA 24 kN/cum 18 kN/cum HEIGHT OFCULVERT, H 1500 mm WIDTH OF CULVERT, B 2000 mm 350 mm 350 mm 350 mm 2000 mm 0 KPa 144 KPa 30 Deg. PREFERRED REBAR SIZE 12 mm CONCRETE COVER TO REBAR CENTER 75 mm Design Summary NO. OF REINFORCEMENT LAYERS 2 Shear Status O.K. MAIN REINFORCEMENT SPACING 200 mm Flexure Status O.K. TEMPERATURE REINFOR. SPACING 200 mm Soil Pressure Status O.K. LOADS ON THE CULVERT For the design purposes a one-meter length of the culvert is considered. Top Slab Vehicular Live Loads (HS 20 AASHTO Truck) 2000 mm LL considered. Multiple presence factor 1.20 Traffic travelling parallel to spa Width of distributed load (parallel to span 2250 mm Length of distributed load (perpend. to spa 4510 mm Equiv. wheel loads don't overlap. Pressure intensity at the specified depth o 7.14 KPa Wheel Load = 72.5 KN Linear load on the top slab 7.14 KN/m Dynamic Load Allowance (Impact Factor) 5.94 % Factor for increasing live load du Increased linear live load 9.08 KN/m Impact and multiple presence facto Weight of earth fill Linear weight of fill on the slab 36.00 KN/m Imposed dead loads Linear imposed dead loads on the slab 0 KN/m Selfweight Linear selft weight of the slab 8.4 KN/m Side Walls Soil pressure 0.333 CONCRETE UNIT WEIGHT, gc SATURATED SOIL UNIT WEIGHT, gs THICKNESS OF SIDE WALLS, tw THICKNESS OF TOP SLAB, tts THICKNESS OF BOTTOM SLAB, tbs DEPTH OF FILL, hf IMPOSED SERVICE DEAD LOADS, wd ALLOWABLE SOIL PRESSURE, Qa SOIL ANGLE OF FRCITION, f Include live loads if hf < 2400mm hf = Design B IM = 33(1 - 0.00041 hf) > 0% kah = (1 - sinf ) / (1 + sinf )
-
Upload
jochen-lichtmann -
Category
Documents
-
view
861 -
download
90
Transcript of Design of Box Culvert
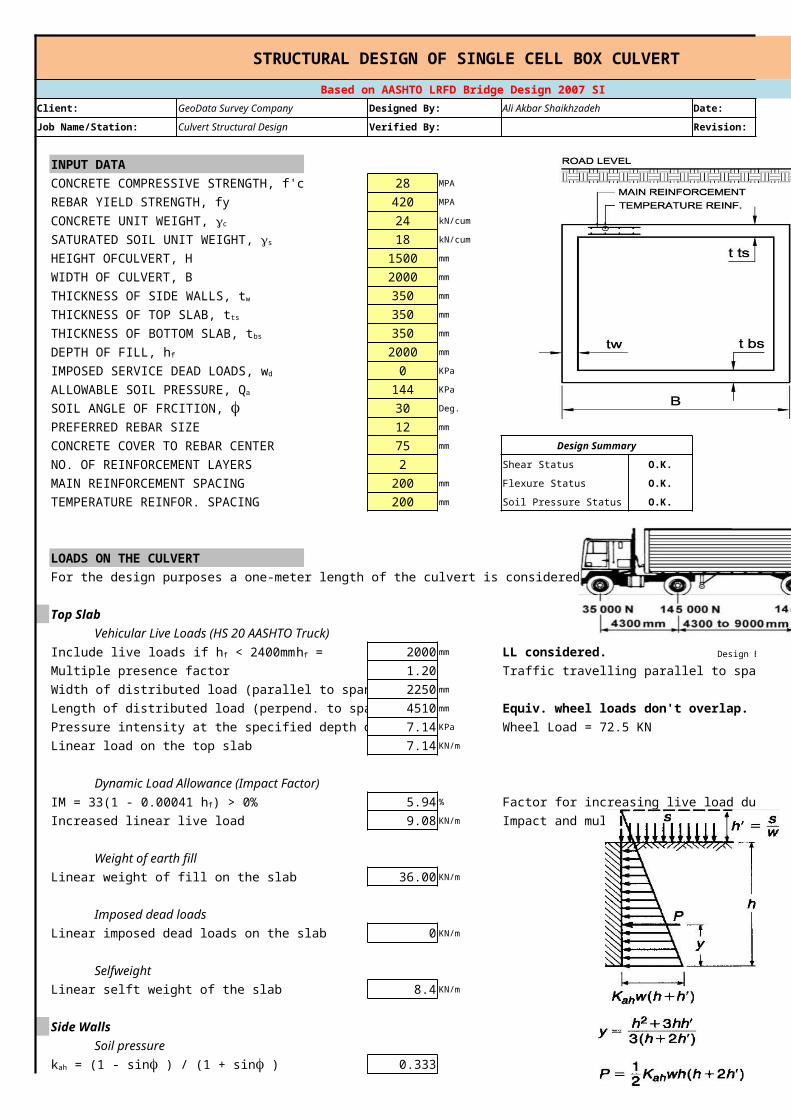
STRUCTURAL DESIGN OF SINGLE CELL BOX CULVERT
Based on AASHTO LRFD Bridge Design 2007 SI
Client: GeoData Survey Company Designed By: Ali Akbar Shaikhzadeh Date: 1-Jul-12
Job Name/Station: Culvert Structural Design Verified By: Revision:
Version 1.0
INPUT DATA
CONCRETE COMPRESSIVE STRENGTH, f'c 28 MPA
REBAR YIELD STRENGTH, fy 420 MPA
24 kN/cum
18 kN/cum
HEIGHT OFCULVERT, H 1500 mm
WIDTH OF CULVERT, B 2000 mm
350 mm
350 mm
350 mm
2000 mm
0 KPa
144 KPa
30 Deg.
PREFERRED REBAR SIZE 12 mm
CONCRETE COVER TO REBAR CENTER 75 mm Design Summary
NO. OF REINFORCEMENT LAYERS 2 Shear Status O.K.
MAIN REINFORCEMENT SPACING 200 mm Flexure Status O.K.
TEMPERATURE REINFOR. SPACING 200 mm Soil Pressure Status O.K.
LOADS ON THE CULVERT
For the design purposes a one-meter length of the culvert is considered.
Top Slab
Vehicular Live Loads (HS 20 AASHTO Truck)
2000 mm LL considered. (AASHTO 3.6.1.2.6)
Multiple presence factor 1.20 Traffic travelling parallel to span (AASHTO 3.6.1.1.2)
Width of distributed load (parallel to span) 2250 mm (AASHTO 3.6.1.2.6)
Length of distributed load (perpend. to span) 4510 mm Equiv. wheel loads don't overlap. (AASHTO 3.6.1.2.6)
Pressure intensity at the specified depth of fill 7.14 KPa Wheel Load = 72.5 KN
Linear load on the top slab 7.14 KN/m
Dynamic Load Allowance (Impact Factor) (AASHTO 3.6.2.2)
5.94 % Factor for increasing live load due to impact effects
Increased linear live load 9.08 KN/m Impact and multiple presence factor included.
Weight of earth fill
Linear weight of fill on the slab 36.00 KN/m
Imposed dead loads
Linear imposed dead loads on the slab 0 KN/m
Selfweight
Linear selft weight of the slab 8.4 KN/m
Side Walls
Soil pressure
0.333
CONCRETE UNIT WEIGHT, gc
SATURATED SOIL UNIT WEIGHT, gs
THICKNESS OF SIDE WALLS, tw
THICKNESS OF TOP SLAB, tts
THICKNESS OF BOTTOM SLAB, tbs
DEPTH OF FILL, hf
IMPOSED SERVICE DEAD LOADS, wd
ALLOWABLE SOIL PRESSURE, Qa
SOIL ANGLE OF FRCITION, f
Include live loads if hf < 2400mm hf = Design Based on →
IM = 33(1 - 0.00041 hf) > 0%
kah = (1 - sinf ) / (1 + sinf )
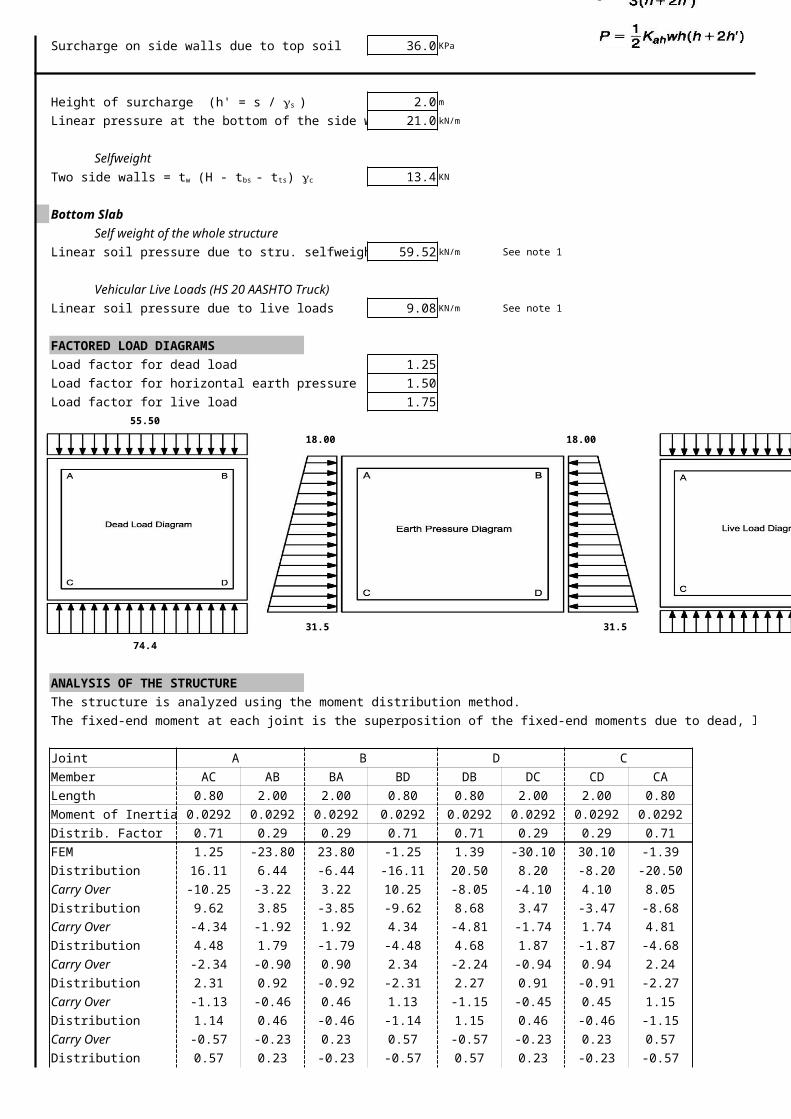
Surcharge on side walls due to top soil 36.0 KPa
(cont'd)
2.0 m
Linear pressure at the bottom of the side wall 21.0 kN/m
Selfweight
13.4 KN
Bottom Slab
Self weight of the whole structure
Linear soil pressure due to stru. selfweight 59.52 kN/m See note 1
Vehicular Live Loads (HS 20 AASHTO Truck)
Linear soil pressure due to live loads 9.08 KN/m See note 1
FACTORED LOAD DIAGRAMS
Load factor for dead load 1.25 (AASHTO 3.4.1)
Load factor for horizontal earth pressure 1.50 (AASHTO 3.4.1)
Load factor for live load 1.75 (AASHTO 3.4.1)
55.50 15.89
18.00 18.00
31.5 31.5
74.4 15.89
ANALYSIS OF THE STRUCTURE
The structure is analyzed using the moment distribution method.
The fixed-end moment at each joint is the superposition of the fixed-end moments due to dead, live and earth pressure loads.
Joint A B D C
Member AC AB BA BD DB DC CD CA
Length 0.80 2.00 2.00 0.80 0.80 2.00 2.00 0.80
Moment of Inertia 0.0292 0.0292 0.0292 0.0292 0.0292 0.0292 0.0292 0.0292
Distrib. Factor 0.71 0.29 0.29 0.71 0.71 0.29 0.29 0.71
FEM 1.25 -23.80 23.80 -1.25 1.39 -30.10 30.10 -1.39
Distribution 16.11 6.44 -6.44 -16.11 20.50 8.20 -8.20 -20.50
Carry Over -10.25 -3.22 3.22 10.25 -8.05 -4.10 4.10 8.05
Distribution 9.62 3.85 -3.85 -9.62 8.68 3.47 -3.47 -8.68
Carry Over -4.34 -1.92 1.92 4.34 -4.81 -1.74 1.74 4.81
Distribution 4.48 1.79 -1.79 -4.48 4.68 1.87 -1.87 -4.68
Carry Over -2.34 -0.90 0.90 2.34 -2.24 -0.94 0.94 2.24
Distribution 2.31 0.92 -0.92 -2.31 2.27 0.91 -0.91 -2.27
Carry Over -1.13 -0.46 0.46 1.13 -1.15 -0.45 0.45 1.15
Distribution 1.14 0.46 -0.46 -1.14 1.15 0.46 -0.46 -1.15
Carry Over -0.57 -0.23 0.23 0.57 -0.57 -0.23 0.23 0.57
Distribution 0.57 0.23 -0.23 -0.57 0.57 0.23 -0.23 -0.57
Height of surcharge (h' = s / gs )
Two side walls = tw (H - tbs - tts) gc
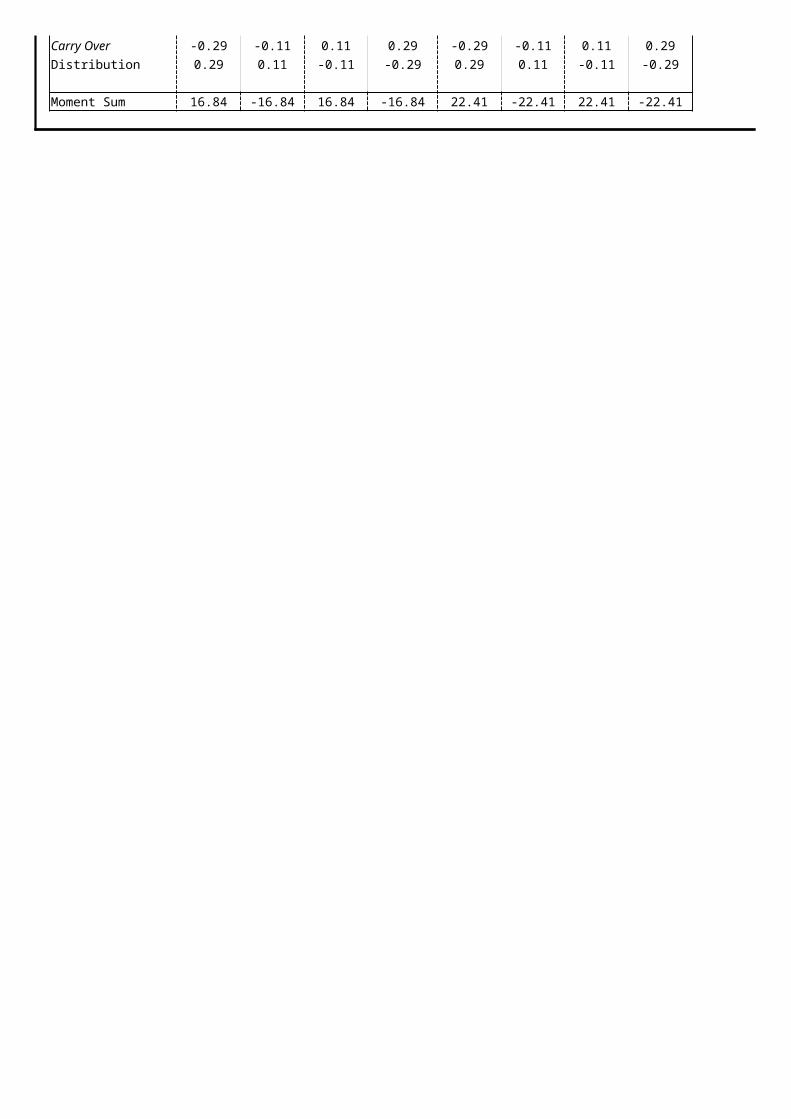
Carry Over -0.29 -0.11 0.11 0.29 -0.29 -0.11 0.11 0.29
Distribution 0.29 0.11 -0.11 -0.29 0.29 0.11 -0.11 -0.29
Moment Sum 16.84 -16.84 16.84 -16.84 22.41 -22.41 22.41 -22.41
(cont'd)
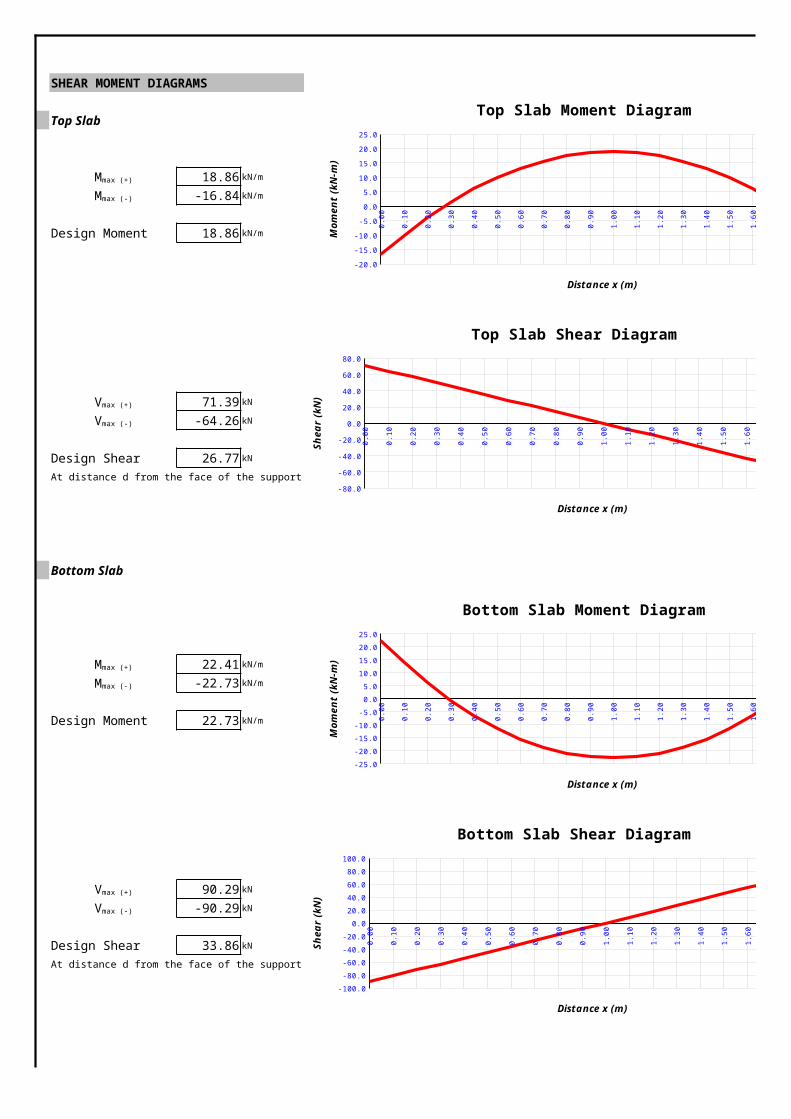
SHEAR MOMENT DIAGRAMS
Top Slab
18.86 kN/m
-16.84 kN/m
Design Moment 18.86 kN/m
71.39 kN
-64.26 kN
Design Shear 26.77 kN
At distance d from the face of the support
Bottom Slab
22.41 kN/m
-22.73 kN/m
Design Moment 22.73 kN/m
90.29 kN
-90.29 kN
Design Shear 33.86 kN
At distance d from the face of the support
Mmax (+)
Mmax (-)
Vmax (+)
Vmax (-)
Mmax (+)
Mmax (-)
Vmax (+)
Vmax (-)
0.00
0.10
0.20
0.30
0.40
0.50
0.60
0.70
0.80
0.90
1.00
1.10
1.20
1.30
1.40
1.50
1.60
1.70
1.80
1.90
2.00
-20.0
-15.0
-10.0
-5.0
0.0
5.0
10.0
15.0
20.0
25.0
Top Slab Moment Diagram
Distance x (m)M
omen
t (kN
-m)
0.00
0.10
0.20
0.30
0.40
0.50
0.60
0.70
0.80
0.90
1.00
1.10
1.20
1.30
1.40
1.50
1.60
1.70
1.80
1.90
2.00
-80.0
-60.0
-40.0
-20.0
0.0
20.0
40.0
60.0
80.0
Top Slab Shear Diagram
Distance x (m)
Shea
r (kN
)
0.00
0.10
0.20
0.30
0.40
0.50
0.60
0.70
0.80
0.90
1.00
1.10
1.20
1.30
1.40
1.50
1.60
1.70
1.80
1.90
2.00
-25.0
-20.0
-15.0
-10.0
-5.0
0.0
5.0
10.0
15.0
20.0
25.0
Bottom Slab Moment Diagram
Distance x (m)
Mom
ent (
kN-m
)
0.00
0.10
0.20
0.30
0.40
0.50
0.60
0.70
0.80
0.90
1.00
1.10
1.20
1.30
1.40
1.50
1.60
1.70
1.80
1.90
2.00
-100.0
-80.0
-60.0
-40.0
-20.0
0.0
20.0
40.0
60.0
80.0
100.0
Bottom Slab Shear Diagram
Distance x (m)
Shea
r (kN
)
(cont'd)
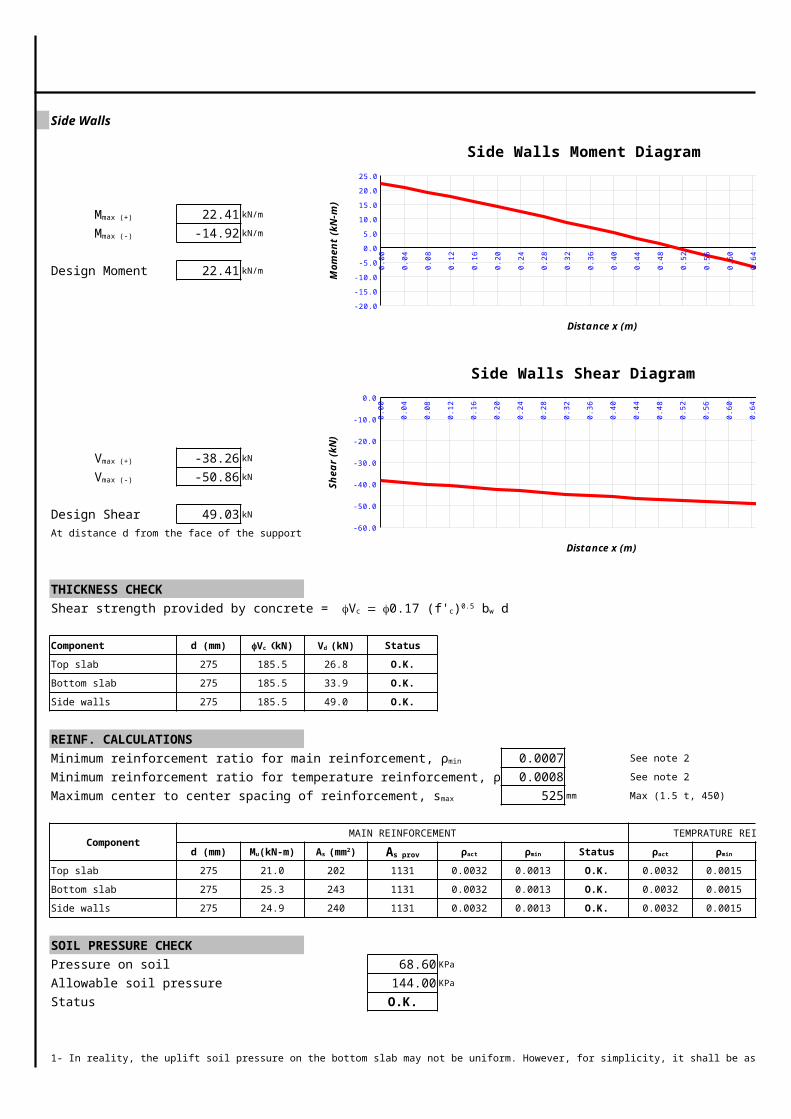
Side Walls
22.41 kN/m
-14.92 kN/m
Design Moment 22.41 kN/m
-38.26 kN
-50.86 kN
Design Shear 49.03 kN
At distance d from the face of the support
THICKNESS CHECK
(ACI 11.2.1.2)
Component d (mm) Status
Top slab 275 185.5 26.8 O.K.
Bottom slab 275 185.5 33.9 O.K.
Side walls 275 185.5 49.0 O.K.
REINF. CALCULATIONS
0.0007 See note 2 (AASHTO 5.10.8)
0.0008 See note 2 (AASHTO 5.10.8)
525 mm Max (1.5 t, 450) (AASHTO 5.10.3.2)
ComponentMAIN REINFORCEMENT TEMPRATURE REINF.
d (mm) Status Status
Top slab 275 21.0 202 1131 0.0032 0.0013 O.K. 0.0032 0.0015 O.K.
Bottom slab 275 25.3 243 1131 0.0032 0.0013 O.K. 0.0032 0.0015 O.K.
Side walls 275 24.9 240 1131 0.0032 0.0013 O.K. 0.0032 0.0015 O.K.
SOIL PRESSURE CHECK
Pressure on soil 68.60 KPa
Allowable soil pressure 144.00 KPa
Status O.K.
1- In reality, the uplift soil pressure on the bottom slab may not be uniform. However, for simplicity, it shall be assumed to be uniform.
Mmax (+)
Mmax (-)
Vmax (+)
Vmax (-)
Shear strength provided by concrete = fVc = f0.17 (f'c)0.5 bw d
fVc (kN) Vd (kN)
Minimum reinforcement ratio for main reinforcement, ρmin
Minimum reinforcement ratio for temperature reinforcement, ρmin
Maximum center to center spacing of reinforcement, smax
Mu(kN-m) As (mm2) As prov ρact ρmin ρact ρmin
0.00
0.04
0.08
0.12
0.16
0.20
0.24
0.28
0.32
0.36
0.40
0.44
0.48
0.52
0.56
0.60
0.64
0.68
0.72
0.76
0.80
-20.0
-15.0
-10.0
-5.0
0.0
5.0
10.0
15.0
20.0
25.0
Side Walls Moment Diagram
Distance x (m)
Mom
ent (
kN-m
)
0.00
0.04
0.08
0.12
0.16
0.20
0.24
0.28
0.32
0.36
0.40
0.44
0.48
0.52
0.56
0.60
0.64
0.68
0.72
0.76
0.80
-60.0
-50.0
-40.0
-30.0
-20.0
-10.0
0.0
Side Walls Shear Diagram
Distance x (m)
Shea
r (kN
)

2- Minimum reinforcement ratio found is for one layer of reinforcement and shall be multiplyed by 2 if there is 2 layers of reinforcement.
3- Clear distance between two layers of reinforcement shall not be more than 150mm and less than 25mm.
4- All soil has been assumed to be saturated soil.
5- It has been assumed that only one axle of the design truck comes on the culvert at a time. This is true for culvert width up to 4300. For more widths
this design spreadsheet can not be used since it is possible that two axle loads come on the culvert.