DESIGN OF A PRE STRESSED BRIDGE DECK WITH ULTRA … · DECK WITH ULTRA-HIGH PERFORMANCE CONCRETE...
151
DESIGN OF A PRE-STRESSED BRIDGE DECK WITH ULTRA-HIGH PERFORMANCE CONCRETE RUI MACÁRIO GOMES VALENTE Dissertação submetida para satisfação parcial dos requisitos do grau de MESTRE EM ENGENHARIA CIVIL — ESPECIALIZAÇÃO EM ESTRUTURAS Orientador: Professor Doutor Pedro Álvares Ribeiro do Carmo Pacheco Coorientador: Engenheiro Gilberto Castro Alves Junho de 2017
-
Upload
vuongkhanh -
Category
Documents
-
view
222 -
download
0
Transcript of DESIGN OF A PRE STRESSED BRIDGE DECK WITH ULTRA … · DECK WITH ULTRA-HIGH PERFORMANCE CONCRETE...

DESIGN OF A PRE-STRESSED BRIDGE
DECK WITH ULTRA-HIGH
PERFORMANCE CONCRETE
RUI MACÁRIO GOMES VALENTE
Dissertação submetida para satisfação parcial dos requisitos do grau de
MESTRE EM ENGENHARIA CIVIL — ESPECIALIZAÇÃO EM ESTRUTURAS
Orientador: Professor Doutor Pedro Álvares Ribeiro do Carmo
Pacheco
Coorientador: Engenheiro Gilberto Castro Alves
Junho de 2017

MESTRADO INTEGRADO EM ENGENHARIA CIVIL 2016/2017
DEPARTAMENTO DE ENGENHARIA CIVIL
Tel. +351-22-508 1901
Fax +351-22-508 1446
Editado por
FACULDADE DE ENGENHARIA DA UNIVERSIDADE DO PORTO
Rua Dr. Roberto Frias
4200-465 PORTO
Portugal
Tel. +351-22-508 1400
Fax +351-22-508 1440
http://www.fe.up.pt
Reproduções parciais deste documento serão autorizadas na condição que seja
mencionado o Autor e feita referência a Mestrado Integrado em Engenharia Civil -
2016/2017 - Departamento de Engenharia Civil, Faculdade de Engenharia da
Universidade do Porto, Porto, Portugal, 2017.
As opiniões e informações incluídas neste documento representam unicamente o
ponto de vista do respetivo Autor, não podendo o Editor aceitar qualquer
responsabilidade legal ou outra em relação a erros ou omissões que possam existir.
Este documento foi produzido a partir de versão eletrónica fornecida pelo respetivo
Autor.

Design of a pre-stressed bridge deck with ultra-high performance concrete
Aos meus Pais

Design of a pre-stressed bridge deck with ultra-high performance concrete

Design of a pre-stressed bridge deck with ultra-high performance concrete
i
ACKNOWLEDGMENTS
I would like to thank not only who directly helped me to develop this work but also the ones who had
an important role in my academic course. I would particularly like to acknowledge:
▪ Professor Pedro Pacheco for his motivational words, timely and experienced advices, and
the readiness to answer my questions. I would also like to thank by making possible my
attendance on High Tech Concrete Symposium in Maastricht which I will never forget.
▪ Engineer Gilberto Alves for his availability to help me whenever I needed. All our
discussions about issues that arose along work process have enriched me. Finally, I
should thank him for his predisposal to let me know about deeper subjects that aroused
my interest, and for make understand how important is to face the difficulties by going
through them as soon as possible.
▪ Professor Mário Pimentel for receive me to discuss about the particularities of Ultra-High
Performance Concrete and also for providing me useful scientific documentation and
bibliographic references.
▪ Professor Miguel Castro for introduce me computational programming in the point of
view of structural optimization. It is a subject that interests me and which soon or later I
will go back to it again.
▪ CSI Portugal technical support for elucidate me about software considerations on creep
effects.
▪ My cousin, Daniela Valente, for her readiness to assist me in text revision as well as my
friends Luis Tiago Costa and Andreia Cardoso.
▪ Above all, to my parents for all the effort to attend all my needs, since ever.

Design of a pre-stressed bridge deck with ultra-high performance concrete
ii

Design of a pre-stressed bridge deck with ultra-high performance concrete
iii
RESUMO
Este trabalho inclui duas soluções diferentes resultantes do dimensionamento de um tabuleiro de uma
ponte com Betão de Desempenho Ultra-Elevado (UHPC). No primeiro caso (Caso 1) o tabuleiro foi
inteiramente dimensionado com UHPC, enquanto no segundo caso (Caso 2) é uma solução mista onde
o UHPC é colocado onde surgem maiores esforços e no restante tabuleiro é colocado betão normal. O
objetivo prende-se com a avaliação da viabilidade económica e comparar estas duas soluções com o
projeto da ponte existente, que é um tabuleiro em viga caixão feito de betão normal pré-esforçado.
Adicionalmente, análise modal seguida de análise sísmica são realizadas com o intuito de avaliar
possíveis mudanças nos esforços máximos que se instalam na substrutura.
Devido às elevadas propriedades mecânicas do UHPC, espera-se que a massa da superestrutura possa
ser reduzida. Contudo, com um material de características soberbas vem um custo elevado que pode
comprometer a viabilidade económica das soluções em estudo. Por essa razão, o estudo deve ser
realizado para que seja avaliado se o dimensionamento com UHPC em lugar do betão normal conduz a
soluções viáveis ou não.
A análise estrutural é executada após a elaboração do modelo de cálculo da ponte no software
CSiBridge ter sido feita. Além da análise estrutural no modelo da ponte completa, a análise da
construção faseada não linear é também considerada para controlar tensões durante a execução da
obra. Esta última análise requere a definição da evolução das propriedades dos materiais ao longo do
tempo e do planeamento construtivo. O método de dimensionamento passa por realizar verificações
das tensões durante o processo construtivo e verificações do estado limite de serviço e do estado limite
último durante o período de serviço da estrutura. O dimensionamento dos elementos de UHPC é
apoiado por uma norma adequada, NF P18-710, e por uma ferramenta numérica propositadamente
desenvolvida para realizar análise da secção transversal durante o dimensionamento ou verificação a
flexão e ao corte em estado limite último. Finalmente, para que a solução final da secção transversal
seja validada, são realizadas análises de estabilidade quer durante a construção, quer durante a fase em
que a estrutura se encontra em serviço para que seja avaliado se o estado limite último é condicionado
pela instabilidade ou pela capacidade resistente do material.
É alcançada uma redução da massa da superestrutura na ordem dos 36% para a o Caso 1 e 26 % para o
Caso 2, e a quantidade de cordões de pré-esforço é também reduzida para 36% e 32%, respetivamente.
Ao contrário do que era esperado, a ação sísmica na direção do alinhamento do tabuleiro não muda
nos dois casos, mas na direção transversal o corte basal reduziu cerca de 14.6% para o Caso 1 e 8%
para o Caso 2. Existe grande variedade de preço para o UHPC mas não foi encontrada nenhuma
solução economicamente viável em ambas as soluções alcançadas. Contudo, é necessário continuar o
estudo no sentido da otimização estrutural e quantificação das armaduras.
PALAVRAS-CHAVE: Dimensionamento estrutural, Betão de Desempenho Ultra-Elevado, Ponte, Cimbre
Auto lançável, Viga Caixão.

Design of a pre-stressed bridge deck with ultra-high performance concrete
iv

Design of a pre-stressed bridge deck with ultra-high performance concrete
v
ABSTRACT
A bridge deck is designed with two different solutions where is used Ultra-High Performance
Concrete (UHPC) as structural element. The first Case 1, involves a deck thoroughly using UHPC.
And the second, Case 2, is a mixed solution with UHPC being placed where the internal forces are
higher and the remaining deck is casted with regular concrete. The purpose of this study is to assess
the economic feasibility and compare those solutions with the existing bridge which is a multi-span
box girder deck made of regular pre-stressed concrete. Additionally, modal analysis preceded by
seismic analysis are performed to evaluate eventual changes that may occur on substructure internal
forces.
Due to high mechanical properties of this material, it is expected a superstructure with less material.
However, with a superb material comes a high cost which may comprise economic feasibility. For that
reason, the study must be go forward in order to assess whether the application of UHPC in turn of
regular concrete leads to a feasible solution or not.
The structural analysis is executed after the development of bridge numerical model on the software
CSiBridge have been done. Besides the analysis on bridge integral model, nonlinear staged
construction analysis is also considered to control stresses during execution. This last analysis requires
the definition of time dependent properties of the materials and of constructive schedule. The method
of design goes through stress verifications during constructive stage, serviceability limit state and
ultimate limit state verifications during service stage. The design of UHPC elements is aided by proper
design code, NF P18-710, and by a numerical tool purposely developed to perform sectional
calculations on both flexural and shear design or verifications in ultimate limit state. Finally, to
validate the final solution for the cross-section, buckling analysis is performed in both service and
constructive stages to assess if the ultimate limit state is governed by instability issues or by material
strength.
It is achieved a reduction on superstructure mass of 36% for Case 1 and 26% for Case 2 and the
amount of pre-stress tendons is also reduced to 36% and 32%, respectively. On the contrary to
expected, seismic action along superstructure alignment does not change in both cases, but in
transverse direction the global base reaction decreased about 14.6% for Case 1 and 8% for Case 2.
There is high scatter about the UHPC cost but no economic feasibility was found on both solutions
achieved. However, a deeper study on it is required regarding structural optimization and also the
quantification of steel reinforcement.
KEYWORDS: Ultra-High Performance Concrete, Movable Scaffolding System, Box Girder, Structural
design.

Design of a pre-stressed bridge deck with ultra-high performance concrete
vi

Design of a pre-stressed bridge deck with ultra-high performance concrete
vii
TABLE OF CONTENTS
ACKNOWLEDGEMENTS ............................................................................................................................ i
RESUMO ................................................................................................................................... iii
ABSTRACT ............................................................................................................................................... v
1. Introduction ........................................................................................................................ 1
1.1. PREFACE .......................................................................................................................................... 1
1.2. OBJECTIVES ..................................................................................................................................... 1
2. State of the art ................................................................................................................... 3
2.1. HISTORICAL OVERVIEW ................................................................................................................... 3
2.2. BRIDGES MADE OF UHPC ............................................................................................................... 5
2.2.1. FOREWORD ...................................................................................................................................... 5
2.2.2. Footbridges .................................................................................................................................... 5
2.2.3. Road bridges .................................................................................................................................. 6
2.3. SUMMARY ......................................................................................................................................... 8
3. UHPC as a structural material ........................................................................ 11
3.1. COMPOSITION ................................................................................................................................ 11
3.1.1. CEMENT ......................................................................................................................................... 11
3.1.2. AGGREGATE ................................................................................................................................... 11
3.1.3. SILICA FUME ................................................................................................................................... 11
3.1.4. SUPERPLASTICIZER ........................................................................................................................ 12
3.1.5. STEEL FIBERS ................................................................................................................................ 12
3.1.6. PROPORTIONS................................................................................................................................ 12
3.2. FRESH STATE ................................................................................................................................. 13
3.2.1. MIXING .......................................................................................................................................... 13
3.2.2. PLACING ........................................................................................................................................ 13
3.2.3. CURING AND HARDENING ................................................................................................................ 14
3.3. HARDENED STATE .......................................................................................................................... 15
3.3.1. MECHANICAL PROPERTIES ............................................................................................................... 15
3.3.1.1. Behavior in compression ........................................................................................................... 15

Design of a pre-stressed bridge deck with ultra-high performance concrete
viii
3.3.1.2. Behavior in tension ................................................................................................................... 16
3.3.1.3. Shrinkage .................................................................................................................................. 17
3.3.1.4. Creep ........................................................................................................................................ 17
3.3.1.5. Other mechanical properties ..................................................................................................... 17
3.3.2. DURABILITY ................................................................................................................................... 17
3.4. AFFORDABILITY ............................................................................................................................. 18
4. UHPC standards.......................................................................................................... 19
4.1. AUSTRALIA .................................................................................................................................... 19
4.2. JAPAN ............................................................................................................................................ 20
4.3. SWITZERLAND ............................................................................................................................... 21
4.4. FRANCE ......................................................................................................................................... 22
4.4.1. RECOMMENDATIONS ...................................................................................................................... 22
4.4.2. STANDARDS .................................................................................................................................. 22
4.5. SUMMARY ...................................................................................................................................... 23
5. Pre-stress ........................................................................................................................... 25
5.1. TECHNIQUES ................................................................................................................................. 25
5.2. INTERNAL VS. EXTERNAL ............................................................................................................. 25
5.2.1. TENDON LAY-OUT .......................................................................................................................... 25
5.2.2. EQUIVALENT LOADS ....................................................................................................................... 26
5.2.3. COMPATIBILITY .............................................................................................................................. 27
5.2.4. LOSSES ......................................................................................................................................... 28
5.2.5. PARTICULARITIES OF EXTERNAL PRE-STRESSING ............................................................................. 28
6. Constructive methods .......................................................................................... 29
6.1. FOREWORD ................................................................................................................................... 29
6.2. BALANCED CANTILEVER METHOD ................................................................................................ 29
6.2.1. DESCRIPTION AND EQUIPMENT ....................................................................................................... 29
6.2.2. IMPACT ON INTERNAL FORCES ........................................................................................................ 30
6.3. INCREMENTAL LAUNCHING METHOD ............................................................................................ 31
6.3.1. DESCRIPTION AND EQUIPMENT ....................................................................................................... 31
6.3.2. IMPACT ON INTERNAL FORCES ........................................................................................................ 31

Design of a pre-stressed bridge deck with ultra-high performance concrete
ix
6.4. MOVABLE SCAFFOLDING SYSTEM ................................................................................................ 32
6.4.1. DESCRIPTION AND EQUIPMENT ........................................................................................................ 32
6.4.2. IMPACT ON INTERNAL FORCES ......................................................................................................... 35
7. Design principles and assumptions ...................................................... 37
7.1. FOREWORD .................................................................................................................................... 37
7.2. MATERIAL....................................................................................................................................... 37
7.2.1. MECHANICAL PROPERTIES .............................................................................................................. 37
7.2.2. CONSTITUTIVE LAW FOR DESIGN ..................................................................................................... 38
7.2.3. TIME DEPENDENT PROPERTIES ........................................................................................................ 40
7.3. ULTIMATE LIMIT CAPACITY ............................................................................................................ 41
7.3.1. BENDING ........................................................................................................................................ 41
7.3.2. SHEAR ........................................................................................................................................... 42
7.3.3. CALCULATION TOOL ........................................................................................................................ 44
7.3.4. SHEAR AND TRANSVERSE BENDING .................................................................................................. 44
8. Case study: Río Cabriel Bridge ................................................................... 47
8.1. DESCRIPTION AND GEOMETRY ...................................................................................................... 47
8.2. LOAD CASES .................................................................................................................................. 50
8.2.1. STAGED CONSTRUCTION ................................................................................................................. 50
8.2.2. PERMANENT LOADS (GK) ................................................................................................................. 50
8.2.3. TRAFFIC LOADS (TS AND UDL) ....................................................................................................... 51
8.2.4. THERMAL ACTION (TK) ..................................................................................................................... 53
8.3. LOAD COMBINATIONS AND VERIFICATIONS .................................................................................. 55
8.3.1. EXECUTION STAGE ......................................................................................................................... 55
8.3.2. SERVICE STAGE .............................................................................................................................. 56
8.4. CASE 0 ........................................................................................................................................... 57
8.4.1. OVERVIEW ..................................................................................................................................... 57
8.4.2. PRE-STRESS .................................................................................................................................. 57
8.4.3. RESULTS........................................................................................................................................ 58
8.5. CASE 1 ........................................................................................................................................... 64
8.5.1. OVERVIEW ..................................................................................................................................... 64

Design of a pre-stressed bridge deck with ultra-high performance concrete
x
8.5.2. PRE-STRESS ................................................................................................................................. 65
8.5.3. DESIGN ......................................................................................................................................... 66
8.5.4. RESULTS ....................................................................................................................................... 70
8.6. CASE 2 ........................................................................................................................................... 74
8.6.1. OVERVIEW .................................................................................................................................... 74
8.6.2. DESIGN ......................................................................................................................................... 74
8.6.3. RESULTS ....................................................................................................................................... 79
8.7. COMPARATIVE ANALYSIS ............................................................................................................. 84
8.7.1. SUBSTRUCTURE ............................................................................................................................ 84
8.7.2. QUANTITIES ................................................................................................................................... 86
8.7.3. COST ASSESSMENT ....................................................................................................................... 87
9. Conclusion ........................................................................................................................ 91
9.1. DISCUSSION .................................................................................................................................. 91
9.2. RECOMMENDATIONS FOR FUTURE RESEARCH ............................................................................ 92
REFERENCES ........................................................................................................................................ 95
APPENDICES

Design of a pre-stressed bridge deck with ultra-high performance concrete
xi
INDEX OF FIGURES
Fig.2.1 - The Sherbrooke Footbridge in Sherbrooke, Quebec, spans 60 m across the Magog River
with a precast truss made of reactive powder concrete ........................................................................... 5
Fig.2.2. - Seon Yu Footbridge: a) Arch; b) Cross-section ........................................................................ 6
Fig.2.3. - General view of Sakata-Mirai Footbridge .................................................................................. 6
Fig.2.4. - General view of one of the Bourg-Les-Valence Bridges, France, 2001 ................................... 6
Fig.2.5. - Standard cross-section of Bourg-Les-Valence Bridges, France, 2001 ..................................... 7
Fig.2.6. - Elevation of the Pont de la Chabotte ........................................................................................ 7
Fig.2.7. - The Wapello County Mars Hill Bridge ....................................................................................... 7
Fig.2.8. - Elevation view of Batu 6 Bridge ................................................................................................ 8
Fig.2.9. - Detail of UHPC box girder of Batu 6 Bridge .............................................................................. 8
Fig.2.10. - Typical section view of Sungai Nerok Bridge .......................................................................... 8
Fig.3.1. - Examples of treatment for overlaying placement and merging............................................... 14
Fig.3.2. - Typical stress-strain-diagrams of UHPC ................................................................................. 15
Fig.3.3. - Idealized response of UHPC element subjected to uniaxial tensile force .............................. 16
Fig.4.1. - Design stress-strain relationship recommended in Design Guidelines for Ductal Pre-Stressed
Concrete Beams: in compression (left) and in tension (right) ................................................................ 19
Fig.4.2. - JSCE composition of standard mixed ingredients (left) and conditions of standard heat curing
(right) ...................................................................................................................................................... 20
Fig.4.3. - JSCE Compressive stress-strain curve (left) and tensile stress-strain curve (right) ............... 21
Fig.5.1. - Balancing of the dead load in a two-span beam by internal tendons (above) and external
tendons (below) ...................................................................................................................................... 26
Fig.5.2. - Equilibrium of an infinitesimal segment of pre-stressing tendon............................................. 26
Fig.5.3. - Equivalent load due to a polygonal tendon ............................................................................. 27
Fig.6.1. - Balanced cantilever method with provisional scaffolding system ........................................... 30
Fig.6.2. - Balanced cantilever method without provisional scaffolding system ...................................... 30
Fig.6.3. - Dead load internal forces resulting from balanced cantilever method .................................... 30
Fig.6.4. - Balanced cantilever method - Dead load internal forces redistribution caused by creep ....... 31
Fig.6.5. - Effect of the steel nose on internal forces during incremental launching ............................... 31
Fig.6.6. - Dead load internal forces resulting from incremental launching method ................................ 32
Fig.6.7. - Dead load internal forces envelope resulting from incremental launching method ................ 32
Fig.6.8. - Movable scaffolding system equipment .................................................................................. 33
Fig.6.9. - Movable scaffolding system equipped with organic pre-stressing system (OPS). ................. 33
Fig.6.10. - Schematic representation of large movable scaffolding system (LMSS) ............................. 34

Design of a pre-stressed bridge deck with ultra-high performance concrete
xii
Fig.6.11. - Positioning of the M70-S during casting works .................................................................... 34
Fig.6.12. - Preparing M70-S for launching by opening formwork system ............................................. 35
Fig.6.13. - Preparing M70-S for launching by bringing supports closer ................................................ 35
Fig.6.14. - M70-S reaching the support above the pier of the following span ....................................... 35
Fig.6.15. - Dead load internal forces resulting from construction with movable scaffolding system
(MSS) ..................................................................................................................................................... 36
Fig.6.16. - Construction with movable scaffolding system – Dead load internal forces redistribution
caused by creep .................................................................................................................................... 36
Fig.7.1. - NF P 18-710 Design stress-strain relationship in compression ............................................. 38
Fig.7.2. - NF P 18-710 Design stress-strain relationship in tension ..................................................... 39
Fig.7.3. - Limit strains diagram in ULS for plain UHPC ......................................................................... 41
Fig.7.4. - Limit strains diagram in ULS for reinforced and/or pre-stressed UHPC ................................ 41
Fig.7.5. - Analogy between crack width-stress diagram and strain-stress diagram .............................. 43
Fig.7.6. - Schematic explanation of stress and strain distributions in cross-section ............................. 44
Fig.8.1. - Río Cabriel Bridge - Plan view ............................................................................................... 47
Fig.8.2. - Río Cabriel Bridge - Elevation view ........................................................................................ 47
Fig.8.3. - Río Cabriel Bridge - Cross-section at mid-span ..................................................................... 48
Fig.8.4. - Río Cabriel Bridge - Cross-section at above the piers ........................................................... 48
Fig.8.5. - Piers cross-section geometry ................................................................................................. 49
Fig.8.6. - Real pot bearings lay-out ....................................................................................................... 49
Fig.8.7. - Equivalent pot bearings lay-out .............................................................................................. 50
Fig.8.8. - Schematic sequence of tasks which represents M70-S loads on structure during a
constructive cycle. ................................................................................................................................. 50
Fig.8.9. - Non-structural elements ......................................................................................................... 51
Fig.8.10. - Transverse positioning of the remaining permanent loads (RPL) ........................................ 51
Fig.8.11. - Application of load Model 1 for global (left) and local (right) verifications ............................ 52
Fig.8.12. - Load model 1: characteristic values ..................................................................................... 52
Fig.8.13. - UDL and TS positioning in order to intensify global internal forces ..................................... 52
Fig.8.14 - Dispersal of TS loads ............................................................................................................ 53
Fig.8.15 - Traffic load arrangement for local verifications 1 .................................................................. 53
Fig.8.16 - Traffic load arrangement for local verifications 2 .................................................................. 53
Fig.8.17 - Traffic load arrangement for local verifications 3 .................................................................. 53
Fig.8.18. - Diagrammatical representation of constituent components of a temperature profile ........... 54
Fig.8.19. - Case 0 - Tendons lay-out per web for a typical segment cast in each stage ...................... 58

Design of a pre-stressed bridge deck with ultra-high performance concrete
xiii
Fig.8.20. - Case 0 - Stresses envelope during constructive process [kPa]. .......................................... 59
Fig.8.21. - Case 0 - Axial force installed in one equivalent tendon after friction losses (P0) and
anchorage setting (Pm0). ....................................................................................................................... 60
Fig.8.22. - Case 0 - Stresses envelope under characteristic load combination [kPa]. ........................... 60
Fig.8.23. - Case 0 - Stresses envelope under frequent load combination [kPa]. ................................... 61
Fig.8.24. - Case 0 - Stresses envelope under quasi-permanent load combination [kPa] ...................... 61
Fig.8.25. - Deformed shape of a representative single span with shell elements under a fundamental
load combination. ................................................................................................................................... 62
Fig.8.26. - Transverse bending moment at mid-span on top slab under a fundamental load
combination [kN.m/m]. ............................................................................................................................ 62
Fig.8.27. - Scheme illustrating where internal forces are measured ...................................................... 62
Fig.8.28. - Case 1 - Initial tendons lay-out [m] ....................................................................................... 65
Fig.8.29. - Case 1 - Top slab solution [m]. ............................................................................................. 67
Fig.8.30. - Case 1 - Cross-section solution. ........................................................................................... 68
Fig.8.31. - Case 1 - Stresses envelop during constructive process with a polygonal lay-out of tendons
[kPa] ....................................................................................................................................................... 69
Fig.8.32. - Case 1 - External tendons lay-out [m] ................................................................................... 70
Fig.8.33. - Case 1 - Stresses envelope under quasi-permanent load combination [kPa]. ..................... 71
Fig.8.34. - Case 1 - Stresses envelope under characteristic load combination [kPa] ............................ 71
Fig.8.35. - Case 1 - Buckling mode during constructive process. .......................................................... 73
Fig.8.36. - Case 1 - Buckling mode during service stage. ..................................................................... 74
Fig.8.37. - Case 2 - Top slab solution [m] .............................................................................................. 74
Fig.8.38. - Case 2 - Longitudinal stresses on bottom fibers during 2nd stage, 1st task of constructive
process [kPa] .......................................................................................................................................... 76
Fig.8.39. - Case 2 - Longitudinal stresses on bottom fibers during 2nd stage, 6th task of constructive
process [kPa]. ......................................................................................................................................... 76
Fig.8.40. - Case 2 - Material distribution along deck length [m] ............................................................. 76
Fig.8.41. - Case 2 - Cross-section solution [m] ...................................................................................... 79
Fig.8.42. - Case 2 - Stresses envelope under quasi-permanent load combination [kPa] ...................... 81
Fig.8.43. - Case 2 - Stresses envelope under characteristic load combination [kPa] ............................ 81
Fig.8.44. - Case 2 - Buckling mode during constructive process ........................................................... 83
Fig.8.45. - Case 2 - Buckling mode during service stage ...................................................................... 83
Fig.8.46. - Axis orientation regarding bridge alignment ......................................................................... 85
Fig.8.47. - Partial costs of scenario 1 ..................................................................................................... 88
Fig.8.48. - Partial costs of scenario 2 ..................................................................................................... 89

Design of a pre-stressed bridge deck with ultra-high performance concrete
xiv

Design of a pre-stressed bridge deck with ultra-high performance concrete
xv
INDEX OF TABLES
Table 2.1. - Summary of concrete compressive strength developments ................................................. 3
Table 3.1. - Dosages and properties of the most common commercial UHPC ..................................... 13
Table 3.2. - Usual values elasticity modulus, poisson´s ratio, thermal expansion coefficient, and
density .................................................................................................................................................... 18
Table 7.1. - Mechanical properties assumed for UHPC during the current study .................................. 37
Table 7.2. - Values of a-parameter determined by Habel et al. ............................................................. 40
Table 7.3. - Assumed values to characterize creep and shrinkage based on the suggestions of NF
P18-710 .................................................................................................................................................. 40
Table 8.1. - Characterization of piers’ geometry and foundation ........................................................... 49
Table 8.2. - Case0 - Structural materials ............................................................................................... 57
Table 8.3. - Case 0 - Verification of stress limits during constructive process ....................................... 59
Table 8.4. - Case 0 - Local maximum internal forces in the top slab ..................................................... 63
Table 8.5 - Case 0 - Average internal forces along in a 2-m cut around the local maximum internal
force ........................................................................................................................................................ 63
Table 8.6. - Case 0 - Most governing global internal forces under fundamental load combination only
containing pre-stressing second order effects ....................................................................................... 63
Table 8.7. - Case 0 - Most governing global internal forces under fundamental load combination
containing pre-stressing effects .............................................................................................................. 63
Table 8.8. - Case 0 - Bending capacity above the piers ........................................................................ 64
Table 8.9. - Case 0 - Shear capacity above the pier .............................................................................. 64
Table 8.10. - Case 0 - Bending capacity at mid-span ............................................................................ 64
Table 8.11. - Case 1 - Structural materials ............................................................................................ 65
Table 8.12. - Case 1 - First approach to assess minimum slab thickness on Section 1. ....................... 66
Table 8.13. - Case 1 - First approach to assess minimum slab thickness on Section 2 ........................ 66
Table 8.14. - Case 1 - First approach to assess minimum slab thickness on Section 3 ........................ 67
Table 8.15. - Case 1 - First approach to assess minimum web thickness (flexural reinforcement) ...... 68
Table 8.16. - Case 1 - First approach to assess minimum web thickness (shear reinforcement) ......... 68
Table 8.17. - Case 1 - Assessment of longitudinal reinforcement at mid-span. .................................... 68
Table 8.18. - Case 1 - Stresses control during constructive stage ........................................................ 70
Table 8.19. - Case 1 - Local maximum internal forces in the top slab ................................................... 71
Table 8.20. - Case 1 - Local verification of Section 1............................................................................. 72
Table 8.21. - Case 1 - Local verification of Section 2............................................................................. 72
Table 8.22. - Case 1 - Local verification of Section 3............................................................................. 72
Design of a pre-stressed bridge deck with ultra-high performance concrete
xvi
Table 8.23. - Case 1 - Most governing global internal forces under fundamental load combination .... 72
Table 8.24. - Case 1 - Assessment of longitudinal reinforcement at above the piers ........................... 72
Table 8.25. - Case 1 - Assessment of shear reinforcement above the piers ........................................ 72
Table 8.26. - Case 1 - Assessment of longitudinal reinforcement at mid-span ..................................... 73
Table 8.27. - Case 1 - Assessment of shear reinforcement at mid-span .............................................. 73
Table 8.28. - Case 2 - Structural materials ............................................................................................ 74
Table 8.29. - Bending and shear capacity of Section 1 ......................................................................... 75
Table 8.30. - Bending and shear capacity of Section 2. ........................................................................ 75
Table 8.31. - Bending and shear capacity of Section 3. ........................................................................ 75
Table 8.32. - Case 2 - Most governing global internal forces under fundamental load combination .... 77
Table 8.33. - Case 2 - First approach to assess minimum web thickness (flexural reinforcement) ...... 77
Table 8.34. - Case 2 - First approach to assess minimum web thickness (shear reinforcement) ........ 77
Table 8.35. - Case 2 - Bending capacity in the left constructive joint. ................................................... 78
Table 8.36. - Case 2 - Shear capacity in the left constructive joint ....................................................... 78
Table 8.37. - Case 2 - Bending capacity at mid-span ........................................................................... 78
Table 8.38. - Case 2 - Shear capacity at mid-span ............................................................................... 78
Table 8.39. - Case 2 - Bending capacity above the piers ...................................................................... 78
Table 8.40. - Case 2 - Shear capacity at mid-span ............................................................................... 78
Table 8.41 - Case 2 - Control of compressive stresses control during constructive stage ................... 80
Table 8.42. - Case 2 - Control of tensile stresses control during constructive stage ............................ 80
Table 8.43. - Case 2 - Most governing global internal forces under fundamental load combination .... 81
Table 8.44. - Case 2 - Assessment of longitudinal reinforcement in the right constructive joint. .......... 82
Table 8.45. - Case 2 - Assessment of shear reinforcement in the right constructive joint. ................... 82
Table 8.46. - Case 2 - Assessment of longitudinal reinforcement in the left constructive joint. ............ 82
Table 8.47. - Case 2 - Assessment of shear reinforcement in the left constructive joint. ..................... 82
Table 8.48. - Case 2 - Assessment of longitudinal reinforcement at mid-span ..................................... 82
Table 8.49. - Case 2 - Assessment of shear reinforcement at mid-span .............................................. 82
Table 8.50. - Case 2 - Assessment of longitudinal reinforcement above the piers. .............................. 83
Table 8.51. - Case 2 - Assessment of shear reinforcement above the piers. ....................................... 83
Table 8.52. - Variation of axial force at piers base when compared with Case 0. ................................ 84
Table 8.53. - Variation of global base reactions when compared with Case 0 ..................................... 85
Table 8.54 - Variation of piers base reactions from Case 0 to Case 1 .................................................. 86
Table 8.55 - Variation of piers base reactions from Case 0 to Case 2 .................................................. 86

Design of a pre-stressed bridge deck with ultra-high performance concrete
xvii
Table 8.56. - Amount of concrete and/or UHPC .................................................................................... 87
Table 8.57. - Amount of pre-stressing steel ........................................................................................... 87
Table 8.58. - Total cost. .......................................................................................................................... 88
Table 8.59. - Variation of total cost when compared with Case 0. ......................................................... 88
Table 8.60. - Quantity of steel reinforcement allowed, per case, to match the total cost of existing
bridge deck. ............................................................................................................................................ 89

Design of a pre-stressed bridge deck with ultra-high performance concrete
xviii

Design of a pre-stressed bridge deck with ultra-high performance concrete
xix
SYMBOLS, ACRONYMS AND ABBREVIATIONS
Ac - Area of concrete cross-section
Afv - Area of fiber effect
Ak - Area enclosed by the center-lines of the connecting walls, including inner hollow areas
Ap - Area of pre-stressing steel
As - Area of steel reinforcement
b(i) - Width of layer i
bw - Web thickness
bw,nom - Web thickness deducted by ducts
d - Effective depth
Ecm - Mean Elasticity Modulus
Es - Elasticity modulus of steel reinforcement
F(i) - Resultant force on layer i
fcd - Design value of concrete compressive strength
fck - Characteristic compressive strength
fcm - Mean compressive strength
fctf1%,k - Characteristic post-cracking stress corresponding to a crack width of 0.01H
fctf1%,u - Ultimate post-cracking stress corresponding to a crack width of 0.01H
fctfk - Characteristic maximal post-cracking stress
fctfk,u - Ultimate maximal post-cracking stress
fctfm - Mean maximal post- cracking stress
fctk,el - Characteristic limit of elasticity under tension
fctm,el - Mean limit of elasticity under tension
fp0.1k - Characteristic 0,1% proof-stress of pre-stressing steel
fpk - Characteristic tensile strength of pre-stressing steel
Fs - Total force installed on steel reinforcement
Fs,corrected - Corrected force of steel reinforcement
Fs,correction - Force deducted from UHPC because of steel reinforcement presence
fywd - Yield stress of steel reinforcement
H - Depth of the tested prism with dimensions complying with the structures dimensions
h0 - Notional size of the cross-section
i - Layer i

Design of a pre-stressed bridge deck with ultra-high performance concrete
xx
K - Fiber orientation factor
Lc - Characteristic length used to calculate equivalent strain from the crack width
Lf - Fibers length
nducts - Number of ducts on the same horizontal plan
Ned - Design axial force
Pmax - Maximum force applied to the tendon
r - Degree of reaction
RH - Relative Humidity
t - Equivalent time
t0 - Age of the concrete which is subjected to permanent load
Ted - Design value of longitudinal torsion force
ts - Age of the concrete at the beginning of drying shrinkage
Ved - Design value of longitudinal shear force
Ved,i,t - Design value of shear force in one wall due to longitudinal torsion force
Ved,i,tot - Total design value of shear force in one wall
Ved,i,v - Design value of shear force in one wall due to shear longitudinal force
Vrd,c - Contribution to shear resistance brought by the concrete matrix
Vrd,f - Contribution to shear resistance brought by the fibers
Vrd,max - Resistance of the concrete compressive struts
Vrd,s - Contribution to shear resistance brought by the vertical shear reinforcement
w - Crack width
w1% - Crack width of 0.01H
wpic - Crack width corresponding to local peak in post-cracking phase or to a crack width equal to 0.3
mm if there is no peak
x - neutral axis depth or height of the compression zone
xi - Position of Layer i
z - Lever arm of internal forces
zi - Lever arm of internal forces in one wall
α - Shear reinforcement inclination angle
αcc - Coefficient that takes into account the long-term effects on the compressive strength
ε(i) - Strain of the layer i
εc0d - Design value of maximum compressive elastic strain
εca - Autogenous shrinkage strain

Design of a pre-stressed bridge deck with ultra-high performance concrete
xxi
εcd - Drying shrinkage strain
εcs - Total shrinkage strain
εcud - Design value of ultimate compressive strain
εs - Steel reinforcement strain
εsyd - Yield strain of steel reinforcement
εu - Ultimate tensile strain in the extreme fiber
εu,el - Elastic tensile strain at ULS
“εu,el” - Truncated elastic tensile strain at ULS
εu,lim - Ultimate strain beyond which fibers participation is no longer taken into account at ULS
εu,pic - Ultimate equivalent strain corresponding to the local peak in post-cracking phase or to a crack
width equal to 0.3 mm if there is no peak
εu,1% - Ultimate equivalent strain corresponding to a crack width of 0.01H
θ - Strut inclination angle
ν - Poisson's ratio
ρ - Reinforcement ratio
σ(i) - Stress installed on layer i
σc - Stress installed on concrete
σcp - Average cross-section stress
σf(w) - Stress law as a function of crack width
σp,max - Maximum stress applied to the tendon
σpm0 - stress in the tendon immediately after tensioning or transfer
σRd,f - Residual strength of the fiber-reinforced cross-section
σs - Steel reinforcement stress
σt,averege - Average stress along the crack
ϒc - Partial factor on compression
ϒcf - Partial safety factor on fibers
φ - Curvature
φb - Basic creep coefficient
φd - Drying creep coefficient
Φducts - Ducts diameter
AFGC - Association Française de Génie Civil
CC - Conventional Concrete
DSPs - Densified with small particles

Design of a pre-stressed bridge deck with ultra-high performance concrete
xxii
EC2 - Eurocode 2
FHWA - Federal Highway Administration
JSCE - Japan Society of Civil Engineers
LMSS - Large Movable Scaffolding System
MDF - Micro-Defected-Free
MSS - Movable Scaffolding System
OPS - Organic Pre-Stressing System
PS - Pre-stressing
RCP - Reactive Powder Concrete
SLS - Serviceability limit state
TS - Tandem System
UDL - Uniformed Distributed Load
ULS - Ultimate limit state
US - United States
W/B - Water-Binder ratio
W/C - Water-Cement ratio
Eq. - Equation
Fig. - Figure

Design of a pre-stressed bridge deck with ultra-high performance concrete
xxiii

Design of a pre-stressed bridge deck with ultra-high performance concrete
xxiv

Design of a pre-stressed bridge deck with ultra-high performance concrete
1
1
INTRODUCTION
1.1. PREFACE
History have been showed us that structural form is closely interrelated with the material of which it is
made of. For this reason, when some new material emerges new structural geometries may also appear
so that the material properties can be fully exploited. Arches were early built with stone and then steel
brought other structural geometries as trusses, suspension and tied bridges. Consequently, and as
already have been proven, UHPC will also provide structural designers with superb mechanical
properties to develop new structural concepts.
With the increasing mobility and accessibility needs comes a growing demand on infrastructures like
bridges either in quantity or load bearing capacity. Consequently, the search for economical solutions
is indispensable. The emergence of a new material such as UHPC, which is characterized by its
compressive strength higher than 150MPa and tensile strength provided by steel fibers around 10MPa,
certainly leads to lighter structures once that there is required less material to resist the same loading.
However, a major hindrance emerges and which is related with material high cost. Therefore, to
evaluate whether UHPC application is economical or not, studies on that should be performed.
This study bases in a real project of an existing multi-span continuous bridge whose cross-section is
re-designed with UHPC material. A pair of different solutions are proposed, designed and then
compared with the initial and existing solution. In the first case, the bridge deck is thoroughly
designed with UHPC and, in the second case, it is designed with a mixed solution of conventional
concrete (CC) and UHPC.
Even before reaching design phase, there was a need of studying and understanding several matters
without which it would be impossible to go forward. It starts by a deeper understanding on material
properties and composition. Then, a review over existing codes and guidelines referred to UHPC
structural design allowed making a reasonable choice on what would be the proper document to follow
during design. The differences between internal and external tendons are described so that can support
design and modeling procedures as well as the constructive method and its implications on structural
analysis and design.
1.2. OBJECTIVES
The focus of this study is on the design of a bridge deck with UHPC. In order to accomplish that, it is
necessary to go through the following works:
▪ Material characterization (composition and properties);

Design of a pre-stressed bridge deck with ultra-high performance concrete
2
▪ Identify existing design standards;
▪ Study of the constructive process;
▪ Load characterization;
▪ Develop numerical structural models in the software CSiBridge;
▪ Comparative analysis.

Design of a pre-stressed bridge deck with ultra-high performance concrete
3
2
STATE OF THE ART
2.1. HISTORICAL OVERVIEW
Several experiments and studies were carried out aiming to increase concrete strength. Most
developments occurred during two decades between 1970’s and mid-1990’s. In Table 1.1. is shown a
brief chronological explanation of most significate advances during that period.
Table 2.1. - Summary of concrete compressive strength developments
Source fcm [MPa] Name Conditions/Technics
Roy, Gouda
and Bobrowsky
(USA, 1972)
[20]
510 - ▪ Only cement paste with high heat treatment
(250ºC) and high-pressure treatment (50MPa).
Yudenfreund,
Odler and
Brunauer (USA,
1972) [21]
240 -
▪ Only cement paste with very thin clinkers
(Blaine surface areas ranging from 6000 to
9000cm2/g);
▪ Low water-cement ratio (0.2-0.3);
▪ Use of additives to increase workability;
▪ Vacuum mixing to reduce air entrainment.
Birchall,
Howard and
Kendall (UK,
1981) [22]
200
Micro-
Defected-Free
(MDF) Paste
▪ Only cement paste;
▪ Removal of large voids on cement undetected
by conventional methods.
Bache
(Denmark,
1981) [23]
Up to 270
High-Strength
Densified with
small particles
(DSPs)
Concrete
▪ Mortar made of sand (up to 4mm);
▪ Densely packed cement with ultra-fine particles
arranged in the space between the cement;
▪ Heat treatment during cure (80ºC);
▪ Extremely low water content (0.13-0.18 by
weight of cement and ultra-fine particles);
▪ Large quantity of superplasticizer.
Richard and
Cheyrezy
(France, 1995)
[24]
Up to 810
Reactive
Powder
Concrete
(RPC)
▪ Excluding coarse aggregate;
▪ Heating (250-400ºC) and pressure (50MPa)
treatments;
▪ Steel fibers and steel aggregate.

Design of a pre-stressed bridge deck with ultra-high performance concrete
4
Two major lines of research have been followed aimed to achieve high mechanical performance with
cementitious matrix materials. The first concerns high-strength DSPs concrete, with high
superplasticizer and silica fume content, also incorporating ultra-hard aggregate [23]. Another
approach was oriented towards improving the strength of the paste, based on the concept of the so
called MDF [22].
But high-strength DSPs concrete was developed further by Scientific Division of Bouygues [24]. This
research considered not only different aggregates and steel fiber lengths but also different curing
treatments. In one of their tests neither pressuring treatment nor heat-treatment was applied (20ºC)
which can be compared to field cast conditions. Steel straight fibers were added to the cementitious
material matrix (2-2.5% per volume) and compressive strength reached 170MPa. Moreover, it was
concluded that steel fibers enhanced ductile behavior on rupture. With the Lafarge cooperation, a new
mix formulation was developed and called of “Reactive Powder Concrete” (RCP) which continues to
exist in the commercial form of “Ductal” [25].
RCP is a branch of UHPC family whose maximum grain sizes is approximately 0.8 mm whereas it
generally may reach approximately 5.0mm [26]. In section Proportions where different mix
formulations are presented, that particularity can be verified.
Since then, this material was the starting point for researchers and engineers who have begun
extensive investigation studies. The objective was to improve and characterize even better its
behavior. Only this way would be possible to industrialize it and provide engineers with technical
normalization to apply it in design and construction.
After UHPC have become commercially available in the United States in 2000, the Federal Highway
Administration (FHWA) started to investigate its use in highway infrastructure in 2001. FHWA along
with State Transportation Department have worked to deploy the technology since 2002.
Simultaneously, several universities were doing research work on UHPC. All of this led engineers to
apply this material in bridges in many ways. The most common usage was in bridge joints but in 2006
the first highway bridge was constructed in the US [27].
In 2002, France came with the first design recommendation on UHPC. This document results from
multiple checks and tests carried out during the development of nuclear-power-plant cooling towers
and Bourg-lès-Valence bridges [28]. It addresses mechanical characteristics, structural design methods
and durability of UHPC [29]. Consequently, several bridges have been built in France since then. As
design standards were missing elsewhere, this recommendation had been also used out of France [25].
Later in 2013 this recommendation was updated mainly motivated by compatibility with entering in
force of Eurocodes [30] and, in 2016, a French national annex to EC2 arose.
Since 2004, International Symposium on Ultra-High Performance Concrete have taken place in Kassel
(Germany) every 4 years. But later in 2012, the international symposium extended its focus towards
nanotechnology in construction materials. A 12-million-euros Research Program on UHPC was
launched by German Research Foundation. It begun in 2005 with the contribute of more than 20
institutes to investigate about 40 projects. In the end (2012), the research results were supposed to
provide a strong basis to develop reliable technical standards. The goal was to enable industries to
produce reliable UHPC using regionally available raw materials and provide engineers with guidelines
to design proper structures [27].
Other Asian countries have shown interest in this material too. Japan’s first guideline appeared in 2004
which represents a modified version of the French recommendations [16]. Korea Institute of
Construction Technology launched a 6 years’ research program (Super Bridge 200) started in 2007 to

Design of a pre-stressed bridge deck with ultra-high performance concrete
5
investigate the use of UHPC in cable-stayed bridges. The total budget was about 10 million euros [31].
Bridge construction cases on these countries are as well referred in Bridges made of UHPC chapter. In
Malaysia, UHPC has been used as a sustainable way of construct bridges and, in 2014, it had already
been built 24 bridges with this material [32].
According to State-of-The-Art Report of FHWA [27] there are several countries spread all over the
globe which adopted UHPC as main structural material for bridge construction. It shows, therefore,
that UHPC potentials are being recognized and receiving worldwide attention.
2.2. BRIDGES MADE OF UHPC
2.2.1. FOREWORD
The report made by U.S. Department of Transportation, that approaches the UHPC state of the art
[27], lists several bridges where this material had been applied before 2013. This list covers North
America, Europe, Asia, and Australia. Some cases, UHPC is used on local repairs, or wet joints or
even connecting adjacent precast beams. Other cases it is applied as the main structural element and is
about this last case the following examples are referred to.
2.2.1. FOOTBRIDGES
Footbridges are interesting structures in the point of view of UHPC potential. That is justified by
architectural requirements, for instance visual lightness. The material higher strength allows the design
of slender structures. Herein are mentioned some remarkable UHPC footbridges and their main
features.
The first UHPC bridge is located at Sherbrooke in Canada in 1997. It is a pre-stressed
pedestrian/bikeway bridge (Fig.2.1.) made of six precast segments each 10m long and spanning a total
of 60m long. The precast segments are open-web space trusses without conventional steel
reinforcement. Upper and lower chord members are made from UHPC with 200MPa compressive
strength. The top chord is materialized with a ribbed slab with 30mm thickness, and transverse pre-
stressing was applied with sheathed monostrands. The bottom chord is made of two pre-stressed
beams. In the web diagonal members, UHPC is confined in stainless steel tubes. Finally, the precast
segments are assembled with external pre-stressing tendons [19].
Fig.2.1 - The Sherbrooke Footbridge in Sherbrooke, Quebec, spans 60 m across the Magog River with a precast truss made of reactive powder concrete [1, 19].
The Seon Yu Footbridge (2001) was erected in Seoul, South Korea, with 430m of total length
(Fig.2.2.). To allow pedestrians crossing the Han River, the structure is composed by an arch which
accomplishes 120m span. It consists of six precast elements with double-T (or π-shape) cross-section

Design of a pre-stressed bridge deck with ultra-high performance concrete
6
supporting a UHPC ribbed slab [18]. Due to UHPC mechanical properties, it was possible to design a
very slender arch with thin sections, resulting in a lighter perception.
Fig.2.2. - Seon Yu Footbridge: a) Arch [1]; b) Cross-section [18].
Other structures, with the same function but with different forms, have been built since then in many
countries. For instance, the Sakata-Mirai footbridge (Fig.2.3.) was built in 2002 and it was the
beginning of bridge design using UHPC in Japan. It is a post-tensioned box girder structure with
perforated webs. The self-weight of the deck resulted in about 25% of that of ordinary pre-stressed
concrete bridge. The deck is also constituted with 6 precast segments that when combined with
external pre-stressing it achieves 50m span length [33].
Fig.2.3. - General view of Sakata-Mirai Footbridge [1]
2.2.3. ROAD BRIDGES
The Bourg-Les-Valence Bridges (Fig.2.4.) are known to be the two first UHPC road bridge
applications. They have two 20-m-long-spans each constructed by mean of π-shaped pre-stressed
beams without any passive reinforcement (Fig.2.5.). These spans are statically determinate and the
joint connecting longitudinal beams was made in situ using internal reinforcement and UHPC too [7].
Fig.2.4. - General view of one of the Bourg-Les-Valence Bridges, France, 2001 [1].

Design of a pre-stressed bridge deck with ultra-high performance concrete
7
Fig.2.5. - Standard cross-section of Bourg-Les-Valence Bridges, France, 2001 [7].
Still in France, a single span bridge with 47.40m of length was constructed during 2004. Its name is
Pont de la Chabotte (Fig.2.6.) and it comprises 22 glued segments with some of them having different
geometry to anchorage external pre-stressing tendons. The depth of the cross-section is 1.6m and the
upper slab width is 4.4m. So, this bridge slenderness is characterized by span-to-depth ratio of 30. The
webs and the lower slab have a constant thickness of 0.12m whereas the upper slab has 0.14m. When
compared with an eventual conventional C35/45 concrete solution, this bridge only needs 40% of that
concrete volume and 1/3 of that assembling duration. Furthermore, this box girder bridge is free of
longitudinal passive reinforcement [11].
Fig.2.1. - Elevation of the Pont de la Chabotte. [11].
The construction of first highway bridge in the US making use of UHPC dates to 2006 (Iowa, USA)
and it is called The Wapello County Mars Hill Bridge (Fig.2.6.). It comprises three 33.5m long precast
UHPC beams with bulb-tee cross-section form. Each beam is pre-stressed and there is no need of
shear reinforcement. All together support a cast-in-place bridge deck [14].
Fig.2.2. - The Wapello County Mars Hill Bridge [14].
Malaysia have been adopted UHPC has a mainstream material for bridge construction. It is there that
the world’s longest single span road bridge was constructed. Batu 6 Bridge (Fig.2.7.) is constructed
with precast segments of 4 m high, 2.5m long and 5m wide. The typical mid-span section has very
slender elements (Fig.2.8.) but the webs are locally thickened to accommodate the shear keys and the
bottom slab at the ends is also thickened to accommodate anchorages. There is no passive

Design of a pre-stressed bridge deck with ultra-high performance concrete
8
reinforcement to stand ultimate bending moment forces. However, it is uniquely used as anti-bursting
reinforcement in the anchorages and to transfer longitudinal shear between webs and upper slab [34].
Fig.2.3. - Elevation view of Batu 6 Bridge [34].
Fig.2.4. - Detail of UHPC box girder of Batu 6 Bridge [mm] [34].
One last existing example is given. Sungai Nerok Bridge is another bridge in Malaysia with integral
beam-deck system (Fig.2.9.). This multi-span, continuous road bridge has a total width of 15m and
three spans of 30 m each, creating a total bridge length of 90m. The structural component cost was
USD906/m2 which is lower than the homologous value of CC bridges in Malaysia, USD1.100 to
USD1.400/m2. The immediate cost saving s amounts 17% even knowing that durability may increase
that value at long-term.
Fig.2.5. - Typical section view of Sungai Nerok Bridge [mm] [32].
2.3. SUMMARY
In the last 5 decades have been published works that show the interest in enhancing concrete overall
performance mainly its maximum compressive strength. The material formulation has been changed
until mid-90’s. Since then the formulation have remained practically unchanged and studies started to

Design of a pre-stressed bridge deck with ultra-high performance concrete
9
focus in the characterization of mechanical properties. There are 3 work fronts which have an
interdependent relationship between each other. They are researching, standard development, and real
structures applications. Most of the continents have been doing that resulting in UHPC bridges all over
the world.
All the bridges introduced are examples of how bridges have been designed with UHPC. Most of the
times bridge elements are pre-cast and then assembled at their final position which is justified by the
high controlled conditions during material production. With UHPC is possible to design slender and
lighter solutions and, in some particular cases, it may compete against CC structures regarding
immediate costs.

Design of a pre-stressed bridge deck with ultra-high performance concrete
10

Design of a pre-stressed bridge deck with ultra-high performance concrete
11
3
UHPC AS A STRUCTURAL MATERIAL
3.1. COMPOSITION
3.1.1. CEMENT
UHPC mixtures usually are designed of ordinary Portland cement (generally combined with silica
fume). As result of dense packing, a very low water-cement ratio is achieved. Consequently, binder
components do not hydrate completely and they will also work as filler [35]. Furthermore, cement
selection cannot be dissociated from that of superplasticizer [24].
3.1.2. AGGREGATE
Fine quartz sand aggregate combined is frequently used as this material is readily available, has low
cost, is very strong and promotes excellent paste/aggregate interfaces. The most common maximum
particle size of sand used in UHPC is limited to over 5 or 6 mm [26, 36]. Both angular or natural sand
can be used but is preferred the second one because of lower water requirements [24].
In some cases, quartz powder may be used. It has particle size distribution ranging from 0.1 to 100μm
and usually acts like a filler. However, this ultra-fine material is an essential ingredient for heat-treated
UHPC whose maximum reactivity is obtained for particle size of between 5 and 25 µm [24].
3.1.3. SILICA FUME
Silica fume is an industrial byproduct and has a typical diameter of 0.2μm. This admixture is usually
combined with cement. The implementation of this admixture has three main functions:
▪ Filling the empty space between the cement particles
▪ Improvement of rheological behavior through the lubrication effect resulting from the
perfect sphericity of the basis particles
▪ Secondary hydrates resulting from pozzolanic reaction with the calcium hydroxide
In order to control impurities, that the Blaine finesses must be limited to 22m2/g. It was also proposed
that silica fume content should be about 25% of Portland cement weight. [24].
If heat treatment is applied (80-90°C) there will be formation of additional strength-forming hydrate
phases. Contrary, without that treatment the filler effect remains [37].

Design of a pre-stressed bridge deck with ultra-high performance concrete
12
3.1.4. SUPERPLASTICIZER
It was concluded that a combination of selectively adsorbing polycarboxylate superplasticizers is more
effective than individual polymers [38] for dispersion of the cement/silica blend. This chemical
admixture is a dispersing agent that allow to reduce water content. But superplasticizers also exhibit a
retarding characteristic on cement hydration which can present a problem for practical applications
[24].
The main characteristics of the polycarboxylate based superplasticizers are the following:
▪ High water reduction (up to 40%)
▪ High flowability
▪ Polymer-design allows to control the main characteristics (setting time and workability)
▪ Blending of different polymers is possible: formulation of customized solutions
As mentioned previously, cement and superplasticizer cannot be chosen individually. With these main
characteristics, it is possible to adapt the superplasticizer to the cement conditions and to achieve a
perfect optimization of the cement paste. The binder content of UHPC can be 4 times higher when
compared to a CC, which leads to an increased admixture content of up to 15 times. This shows the
importance of the choice of the right superplasticizer type. Studies show that big differences occur
mainly in setting time and early strength development, whereas the influence on final strength is not
significantly influenced [39].
3.1.5. STEEL FIBERS
There are several types of fibers that can be integrated in UHPC mixture. In the current work only
steel fibers are used. Depending on fiber content, UHPC attains the following characteristics [26]:
▪ Increase of fracture energy, subsequent improvement of ductility;
▪ Increase of strength (manly tensile strength);
▪ Reduction of tendency for cracking.
In order to enhance ductility in their compressive tests, Richard and Cheyrezy [24] used straight steel
fibers with 12mm long and a diameter of 0.15mm.
In Malaysia, several bridges have been constructed using UHPC whose steel fibers are from two
different type. One of them is straight with 20mm length and 0.2mm of diameter. And the other type is
end-hooked and had dimensions of 25mm length by 0.3mm diameter [32]. Moreover, Japanese
Recommendation [40] suggests the use of fibers 10 to 20 mm in length and 0.1 to 0.25 mm in
diameter, with a tensile strength of 2000MPa or more and 2% volume fraction.
3.1.6. PROPORTIONS
In CC, water-binder ratio (W/B) is between 0.4 and 0.6. But in UHPC that ratio is reduced to below
0.25 thanks to two major aspects. First, the addition of superplasticizer has a deflocculating effect on
binder. And second, thin granulometry is used and which requires higher content of cement. In
summary, binder content increases whereas water content remains practically the same. Silica fume
amounts about 20% of the cement weight [41].
The very compact UHPC induces not only very high compressive strength but also more pronounced
fragile behavior with complete loss of any plastic domain. Steel fibers are added to ensure non-brittle
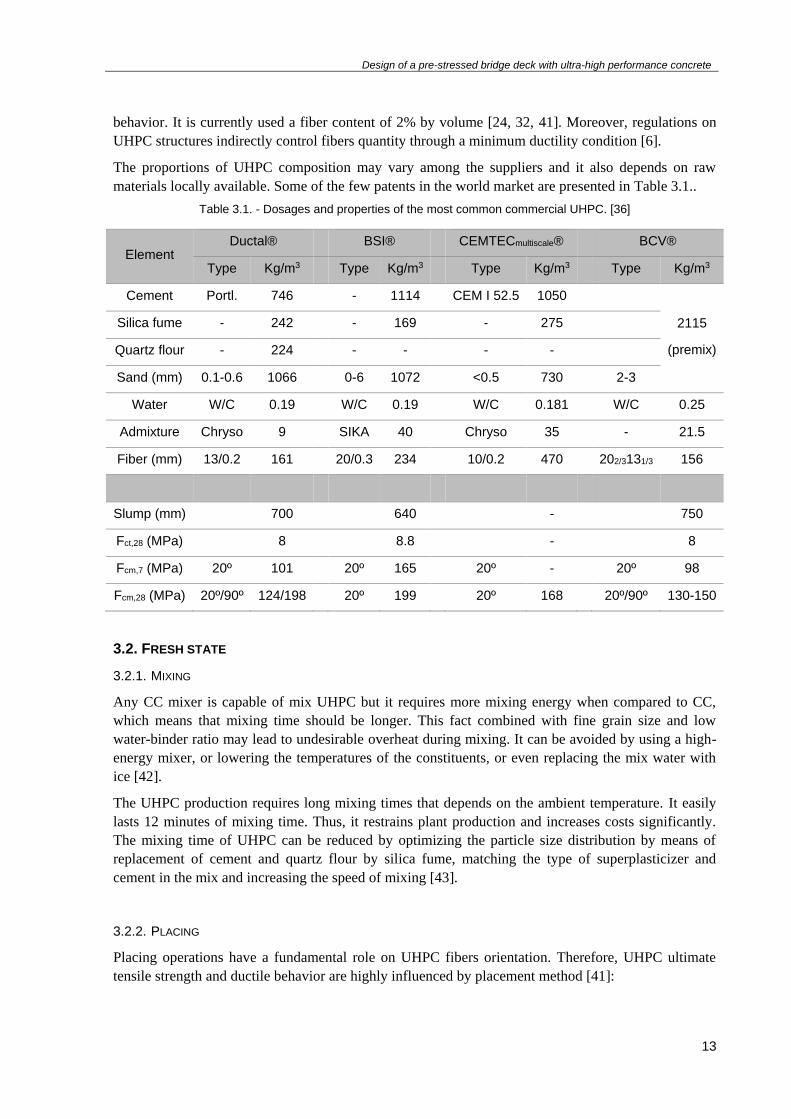
Design of a pre-stressed bridge deck with ultra-high performance concrete
13
behavior. It is currently used a fiber content of 2% by volume [24, 32, 41]. Moreover, regulations on
UHPC structures indirectly control fibers quantity through a minimum ductility condition [6].
The proportions of UHPC composition may vary among the suppliers and it also depends on raw
materials locally available. Some of the few patents in the world market are presented in Table 3.1..
Table 3.1. - Dosages and properties of the most common commercial UHPC. [36]
Element Ductal® BSI® CEMTECmultiscale® BCV®
Type Kg/m3 Type Kg/m3 Type Kg/m3 Type Kg/m3
Cement Portl. 746 - 1114 CEM I 52.5 1050
2115
(premix)
Silica fume - 242 - 169 - 275
Quartz flour - 224 - - - -
Sand (mm) 0.1-0.6 1066 0-6 1072 <0.5 730 2-3
Water W/C 0.19 W/C 0.19 W/C 0.181 W/C 0.25
Admixture Chryso 9 SIKA 40 Chryso 35 - 21.5
Fiber (mm) 13/0.2 161 20/0.3 234 10/0.2 470 202/3131/3 156
Slump (mm) 700 640 - 750
Fct,28 (MPa) 8 8.8 - 8
Fcm,7 (MPa) 20º 101 20º 165 20º - 20º 98
Fcm,28 (MPa) 20º/90º 124/198 20º 199 20º 168 20º/90º 130-150
3.2. FRESH STATE
3.2.1. MIXING
Any CC mixer is capable of mix UHPC but it requires more mixing energy when compared to CC,
which means that mixing time should be longer. This fact combined with fine grain size and low
water-binder ratio may lead to undesirable overheat during mixing. It can be avoided by using a high-
energy mixer, or lowering the temperatures of the constituents, or even replacing the mix water with
ice [42].
The UHPC production requires long mixing times that depends on the ambient temperature. It easily
lasts 12 minutes of mixing time. Thus, it restrains plant production and increases costs significantly.
The mixing time of UHPC can be reduced by optimizing the particle size distribution by means of
replacement of cement and quartz flour by silica fume, matching the type of superplasticizer and
cement in the mix and increasing the speed of mixing [43].
3.2.2. PLACING
Placing operations have a fundamental role on UHPC fibers orientation. Therefore, UHPC ultimate
tensile strength and ductile behavior are highly influenced by placement method [41]:

Design of a pre-stressed bridge deck with ultra-high performance concrete
14
▪ Fiber reinforcement tends to show a preference for aligning in the direction of flow
during casting;
▪ The fibers close to the walls tend to be oriented parallel to the formwork. The thinner the
element, the greater will be the impact on the tensile strength;
▪ A preferred orientation of fibers in the direction of gravity can sometimes occur due to
the natural behavior of fibers in the viscous liquid phase of the UHPC before setting.
These phenomena must be considered during development of casting sequence. In an advanced phase
of this work it will be explained how fiber scatter and element fineness is considered on design.
Internal vibration is not recommended so that fibers orientation don’t be interfered. However, limited
external form vibration can be applied in order that entrapped air could be released. Despite that,
packing rarely is a problem due to UHPC self-compacting ability. Placement shall be performed using
tremie pipes or buckets. Additionally, continuous poring until the completion in one area shall be
planned. Overlay placing and merging areas shall be avoided (Fig.3.1.) during casting process because
they become weak points [16, 42]. UHPC must be dropped up to 0.50 m and if this indication cannot
be satisfied, a test should be done beforehand to ensure that there is no segregation of fibers nor fiber
clustering [30].
Fig.3.1. - Examples of treatment for overlaying placement and merging [3]
The French recommendation [30] gives some instructions that should be considered in adverse
weather conditions. Concreting is not recommended when the outdoor temperature falls below +5°C.
However, special arrangements can be made to overcome this issue allowing proper concreting
process:
▪ Heating of aggregate and/or mix water;
▪ Use of thick timber or insulated forms;
▪ Use of setting and hardening accelerators.
High outdoor temperature (>35°C) induces undesirable high temperatures inside thick components
during hydration process. The precautions pointed are similar to those which can be adopted for CC
for example cooling of mixing water.

Design of a pre-stressed bridge deck with ultra-high performance concrete
15
3.2.3. CURING AND HARDENING
The reduced water-binder ratio in a UHPC mix necessitates careful attention to prevent water to
escape prior to hydration. That is why, right after casting, UHPC surface must be covered with an
impermeable layer. When UHPC surface is properly covered, avoiding any space between seal and
UHPC, the possibility of surface dehydration is eliminated. That avoids cracking and significant
degradation of final material properties [42]. Additionally, the surface of constructive joints should be
systematically cured so that surface drying and also micro-cracking during setting may be prevented
[30].
Heat (90ºC) and steam (RH=95%) treatment may be applied to UHPC to accelerate hydration and
enhance final mechanical properties including durability. These treatments are only feasible in precast
plant [42]. When comparing compressive strength of UHPC cured at 90ºC (until 7 days) and 20ºC, it
was concluded that without heat treatment the compressive strength decreases (≈20%) whereas
compressive ductility increases. The UHPC cured at 20ºC, like in situ curing conditions, could lead to
a more economical and sustainable option. Despite of compressive strength reduction, cast-in-place
must be considered so that expenses of both high-temperature curing and pre-casting procedures can
be avoided [44].
A study on mechanical properties development [45] at 20ºC, demonstrate that hydration reaction starts
after 26h after water addition. This period is denominated of “dormant period” which is longer than in
CC and that is governed by high amount of superplasticizer in the mix. Mechanical properties started
to develop at approximately 32h after water addition. 7 days after, the UHPC compressive strength
reached 140MPa (81% of final strength). This high rate of mechanical properties development on
early ages may be advantageous to accelerate the construction process. And finally, 90 days after, the
development of mechanical properties practically stopped.
3.3. HARDENED STATE
3.3.1. MECHANICAL PROPERTIES
3.3.1.1. Behavior in compression
The typical compressive strength of UHPC is in the range of 150 to 250MPa. UHPC shows a linear
elastic behavior until about 70 to 80 % of the ultimate compressive strength. The scatter of
compressive strengths tests results is usually low due to homogeneity of the material [41]. The strain
at peak stress for UHPC is approximately 4.4 ‰. Thanks to the fibers, a pronounced descending
branch can be developed (Fig.3.2.). Its configuration is influenced by the following aspects [8]:
▪ Fiber content;
▪ Fiber orientation;
▪ Fiber geometry;
▪ Fiber stiffness (in case of using different fiber types);
▪ Relation between fiber length and maximum aggregate dimension.

Design of a pre-stressed bridge deck with ultra-high performance concrete
16
Fig.3.2. - Typical stress-strain-diagrams of UHPC [8].
3.3.1.2. Behavior in tension
Graybeal and Baby [9] characterized uniaxial tensile response of UHPC specimen after a set of direct
tension tests (Fig.3.3.). The response can be divided into four phases:
▪ Phase I - Linear elastic domain;
▪ Phase II - Multiple tightly spaced cracks occur in the cementitious matrix whereas fibers
are bridging those cracks. The cracks occur sequentially whenever the stress overpass the
matrix cracking strength;
▪ Phase III - It occurs crack saturation where additional cracking is unlikely so individual
cracks extend;
▪ Phase IV - Individual crack has reached its extension limit and the fibers bridging that
crack begin to pull out of the matrix.
Fig.3.3. - Idealized response of UHPC element subjected to uniaxial tensile force [9].
It is important to mention that only was considered strain hardening behavior which is associated with
a limited minimum fiber content and appropriate fiber orientation. Otherwise, neither multi-cracking
phase would be possible nor the consequent phases. Therefore, a softening post peak behavior would
occur subsequently to phase I.

Design of a pre-stressed bridge deck with ultra-high performance concrete
17
In their experiments, Graybeal and Baby tested UHPC produced in different curing conditions and
with different compositions [9]. The mechanical response results of direct tensile test had the
fallowing values:
▪ First cracking strength from 6 to 9MPa;
▪ Multi-cracking stress from 7.8 to 11.5MPa;
▪ Maximum tensile stress from 8.5 to 11.5MPa;
▪ Strain at crack saturation from 3 to 5.4‰;
▪ Strain at localization from 3.4 to 6.5‰.
French recommendations [29, 30] identify three different tensile behaviors after cracking for design
purpose:
▪ High strain-hardening which the post-cracking peak is higher than elastic resistance
because of high fiber content.
▪ Low strain-hardening which corresponds to most of the UHPCs currently on the market.
▪ Strain-softening is characterized by crack localization once the matrix strength is reached,
when a tensile force is applied. This type of constitutive law can be found in UHPCs with
a low fiber content or containing fibers that are not very efficient.
Additionally, a new French standard [46] gives expressions to classify post-cracking behavior of a
given UHPC material from specific tests results.
3.3.1.3. Shrinkage
The shrinkage of UHPC barely depend on humidity and elements dimensions, because it is primarily
influenced by endogenous processes [47]. In the case of a heat treatment during the first few hours,
shrinkage partly occurs during heat treatment and 550 µm/m total shrinkage is expected for outdoor
environment. In the case of heat treatment after the UHPC has hardened, it is considered that there will
be no further shrinkage once the treatment is finished. And finally, if there is no heat treatment, to the
550 µm/m for endogenous shrinkage is added the 150 µm/m for drying shrinkage in an outdoor
environment [30].
3.3.1.4. Creep
Like CC, creep is mainly influenced by the age of loading, permanent load magnitude and its duration.
Heat treatment at early age before or after UHPC has hardened may significantly stabilize creep
effects [47]. Indicative values of the long-term creep for UHPC with heat treatment before or after
UHPC has hardened, and UHPC without heat treatment normally round 0.4, 0.2, and 0.8, respectively
[30].
3.3.1.5. Other mechanical properties
In the Table 3.2. are summarized indicative or recommended values by different countries for
predesign calculations. Those values are referred to elasticity modulus (E), poisson´s ratio (ν), thermal
expansion coefficient (α), and density (ρ).

Design of a pre-stressed bridge deck with ultra-high performance concrete
18
Table 3.2. – Usual values elasticity modulus, poisson´s ratio, thermal expansion coefficient, and density.
Country E ν α ρ
[GPa] - [10-6 m/m/ºC] [kg/m3]
France 45 - 65 0.2 11 2200 - 2800
Japan 50 0.2 13.5 -
Switzerland 45 - 65 0.2 10 -
Australia 50 0.2 - 2400 - 2650
3.3.2. DURABILITY
It has been mentioned that UHPC is very homogeneous concrete thanks to its high packing density and
its ultrafine particles. Its dense matrix prevents from being penetrated by aggressive agents.
Consequently, durability properties are significantly better than those of CC [9, 30].
Considering the main objective of this study, durability has not an important role and that is why it is
not deeper detailed, even knowing that it may assure low maintenance and then life-cycle cost savings.
However, these enhanced durability properties have positive influence on UHPC cover thickness by
reducing it.
3.4. AFFORDABILITY
It can be seen in the Table 2 that UHPC has not a unique formulation and, therefore, high range of
material cost can be expected. UHPC is characterized by its high performance but it comes along with
a price which makes it difficult to fight against reinforced CC solutions.
During 2013, there was only one commercial supplier for transportation infrastructure in the United
States. That blend was sold for about USD2600/m3 (≈2000€/m3 at that time) and it includes not only
the raw materials cost and fiber reinforcement but also costs related with production and delivery. It
means that UHPC may cost 20 times higher than CC. This discrepancy is justified by proprietary
nature, high material cost and high production quality control.
A non-proprietary UHPC was developed with local raw materials which accomplishes compressive
strength not lower than 155MPa. This material costs 1110$/m3 (≈850€/m3) whose steel fibers
(1.5%/volume) cost amounts half of the total material total cost [48]. Moreover, there is a company
[49] that claims its UHPC technology is 3 to 4 times cheaper than other regular UHPC commercially
available and, the author was informed that the UHPC produced by Dura Technology® costs
USD475-500/m3 in Malaysia.

Design of a pre-stressed bridge deck with ultra-high performance concrete
19
4
UHPC STANDARDS
4.1. AUSTRALIA
DESIGN GUIDELINES FOR DUCTAL PRESTRESSED CONCRETE BEAMS [15]
Australian guidelines on UHPC are based on a study of the existing literature at that time, research
undertaken at University of New South Wales (UNSW) and information gained from the performance
of existing UHPC structures constructed overseas. This document emerged in 2000 and it was the first
specification concerning UHPC in structural design.
However, this document is only applicable on design of pre-stressed concrete beams manufactured
from the Reactive Powder Concrete (RPC) known as Ductal. As result, it addresses a limited material
and structural field of application. Where possible, these guidelines are consistent with the limit states
design philosophy of Australian Standard for Concrete Structures (AS3600-1994).
Stress-strain curves in compression and tension are provided as well as values for modulus of
elasticity, density, Poisson’s ratio, creep, and shrinkage. Design guidelines are provided for strength in
flexure, shear, and torsion followed by specifications for flexural crack control and deflection at
service loads. It is slightly referred issues like resistance to fire and fatigue. It ends with indications
for pre-stressing losses and anchorage zones calculations.
The idealized stress-strain curve shown in Fig.4.1. may generally be used for the evaluation of
ultimate limit state (ULS). For the evaluation of serviceability limit state (SLS) stress-strain diagram
may be regarded as linear.
Fig.4.1. - Design stress-strain relationship recommended in Design Guidelines for Ductal Pre-Stressed Concrete Beams: in compression (left) and in tension (right) [15].

Design of a pre-stressed bridge deck with ultra-high performance concrete
20
Design flexural strength is based on equilibrium of forces and strain compatibility using constitutive
laws in compression and tension for UHPC. Ductility is provided by limiting the ratio of neutral axis
depth to effective depth (x/d) to a maximum value of 0.4.
Shear strength of the UHPC in beams is based on limiting the principal tensile stress either at the
centroidal axis or at the junction of the web and the flange of the cross-section, whichever is the
smaller, to a maximum value based on a section uncracked in flexure. Shear reinforcement and pre-
stress can contribute to shear strength but steel fibers contribution is not considered.
In this document appendix could be found numerical examples illustrating the behavior of pre-
tensioned concrete beams and unreinforced elements are included together with detailed design
calculations.
4.2. JAPAN
Recommendations for Design and Construction of Ultra High Strength Fiber Reinforced Concrete
Structures (Draft)
Concrete Committee of Japan Society of Civil Engineers (JSCE) established a subcommittee for the
research on UHPC in 2003 to publish recommendations for design and construction. The research was
based on the results of a technical examination of Sakata-Mirai footbridge and the guidelines from
French Association of Civil Engineers. JCSE published UHPC recommendations in 2004 and English
version in 2006 [40], which provide basic principles for design and construction [16].
Most of the design values for UHPC are determined through pre-existing Japanese standards for CC or
fiber reinforced concrete. JSCE recommendation provides those values that can be used under
standard material mix and standard curing conditions (Fig.4.2.).
Fig.4.2. - JSCE composition of standard mixed ingredients (left) and conditions of standard heat curing (right) [16].
Constitutive law of UHPC is shown in the Fig.4.3. and is used for ultimate limit state (ULS). For
tensile behavior, and based on Association Française de Génie Civil (AFGC) recommendations, it is
defined the orientation factor with which it is considered the difference in fiber orientation between
test specimens and in the actual structure. Under service loads, stress-strain diagram may be regarded
as linear.

Design of a pre-stressed bridge deck with ultra-high performance concrete
21
Fig.4.3. - JSCE Compressive stress-strain curve (left) and tensile stress-strain curve (right) [16].
No strain hardening behavior is considered not even steel rebar reinforcement are permitted according
to this recommendation. This constitutes a limitation for designers when using this document.
Usual section analysis using the stress-strain curves are performed during flexural design. Identical to
French recommendations, shear capacity provided by steel fibers bridging the diagonal crack surface
is considered. For verification of serviceability (SLS), tensile stress in UHPC should not exceed the
first cracking strength. Determination of tensile stresses induced by flexure, shear force, torsional
moment and axial force shall be performed in accordance with the elastic assumption. The following
chapters address fatigue resistance, structural details, pre-stressed concrete, durability, construction,
and concreting conditions.
4.3. SWITZERLAND
SNR 592052:2016 - Béton Fibré Ultra-Performant (BFUP) - Matériaux, Dimensionnement et
Execution
This technical specification is based on Swiss Society of Engineers and Architects structure norms and
was submitted for consultation in 2014 [47]. In the following year, it was validated by Swiss Society
of Engineers and Architects and in 2016 it became effective.
This specification aims to regulate the use of UHPC in the design, construction, and execution of load-
bearing structures. It is essentially based on two basic concepts:
▪ The construction of structures of UHPC elements, generally pre-casted elements,
reinforced and/or pre-stressed.
▪ Rehabilitation and reinforcement of existing structures made of CC. This concept is
equally applicable to the construction of new load-bearing structures.
Like many other documents on this subject, this technical specification forwards the designer to proper
tests so that UHPC mechanical properties can be assessed. However, ranges of common values for
those properties are provided.
The section that addresses structural analysis in ultimate and serviceability limit states is split in two
parts. One for UHPC elements with or without reinforcement steel bars, and the other part for UHPC-
CC composite elements where UHPC is completely compressed or tensioned.
Constructive detailing for reinforcement, UHPC precast elements and UHPC-CC composite elements
are referred. Additionally, execution rules are mentioned regarding fabrication, placement and cure.
This technical report does not deal with the behavior of UHPC load-bearing structures subjected to
seismic action, or with punching in the case of slabs.

Design of a pre-stressed bridge deck with ultra-high performance concrete
22
4.4. FRANCE
4.4.1. RECOMMENDATIONS
Ultra High Performance Fibre-Reinforced Concretes - Interim Recommendations
This recommendation [29] was requested by the Association Française de Génie Civil (AFGC) to
Service d'études Techniques des Routes et Autoroutes and at the beginning of 2002 it was ready to be
used. It was elaborated from experience with the first industrial applications, and experimental
structures, as well as 10 years of laboratory research. These recommendations are composed of three
major chapters:
▪ Characterization of UHPC;
▪ Design and analysis of UHPC structures;
▪ Durability of UHPC.
Ultra High Performance Fibre-Reinforced Concretes – Recommendations
With the Eurocodes entrance came a request from AFGC to elaborate a new version of the previous
recommendations due mainly to compatibility reasons. In 2013, the update was made [30] and it
comprised the following changes:
▪ Improves of UHPC characterization and testing methods;
▪ Structural design methods were totally rewritten respecting design principles of EC2;
▪ Updated fire resistance and durability performance chapters as well as addition of
abrasion resistance topic;
▪ Implementation of a new chapter about this material in terms of sustainable development.
4.4.2. STANDARDS
Two French standards related to UHPC have been published in 2016. These documents are technically
based on the AFGC recommendations that were previously referred. One major aim was to conform
with the arrangement of Eurocode 2. This resulted in the consistent elaboration of two documents [6,
46]:
▪ NF P18-470 essentially concerns about the construction product and it describes test
protocol as well as standardized methods to assess material characteristics.
▪ NF P18-710 is a standard for the design of UHPC structures.
▪ PR NF P P18-451 is a draft document about UHPC that was not been published yet. Its
publication is planned for the 4th quarter of 2017 [50]. It addresses issues related with
execution of UHPC structures
NF P 18-470 - Concrete - Ultra-high performance fibre-reinforced concrete - Specifications,
performance, production and conformity
In this standard, classes are defined aiming to become UHPC specification easier. Those classes are
referred to compressive strength, tensile behavior, workability, thermal treatment, durability
characteristics, and resistance to abrasion.
NF P 18-470 gives basic requirements that UHPC has to meet and that concerns mix-proportions,
properties of UHPC at the fresh state and properties of hardened UHPC. There are also defined phases
of evaluation and validation of UHPC supply along with who is responsible for doing so:
▪ Evaluation of the conformity of constituents according to this standard;

Design of a pre-stressed bridge deck with ultra-high performance concrete
23
▪ Validation of the design study which evaluates conformity to the project requirements;
▪ Validation of the suitability test based on trial production regarding expected production
conditions;
▪ Validation of the production control of UHPC at both fresh and hardened state.
NF P 18-710 - National addition to Eurocode 2 - Design of concrete structures: specific rules for
Ultra-High Performance Fibre-Reinforced Concrete
This standard constitutes a French national annex to EC2 (Part 1 and 2) and it follows the same
architecture and content as the EC2. It is given design rules for this material while is indicated the
applicability or nonrelevance of clauses of EC2. This way it easy to correlate this new standard with
the pre-existing one.
One of the most remarkable changes in the design has to do with the consideration of the tensile
contribution of the UHPC due to fibers, not only in serviceability but also in ultimate limit state design
and verifications. With that comes a different approach about the minimum required reinforcement
ratio which in some cases reinforcement is not even needed.
Considering the high compacity of UHPC, this standard adjusts anchor lengths of reinforcement bars
and cover thickness that generally become lower when compared with CC elements.
Contrary to what happens in EC2, this standard does not allow to estimate UHPC mechanical
properties as function of compressive characteristic strength. Each mechanical parameter should be
estimated through tests described in NF P 18-470. For preliminary design, this norm provides a set of
ranges and values for each one of mechanical properties. Moreover, the designer may also use
“identity cards” of UHPC from suppliers whose material is well defined due to repetition of
production and tests. In order to validate design solution, the mechanical parameters must be
determined from trial production as mentioned in NF P 18-470.
4.5. SUMMARY
At this point it is possible to review and discuss what should be the right standard to follow looking
forward to structural analysis and design.
Australian and Japanese documents are applicable in very restricted cases. The first is only applicable
in pre-stressed beams made from RPC, the second only gives material properties values for a strict
cure condition and material mix.
Swiss norm is predisposed for pre-cast elements or reinforcement of existing structures. Besides that,
the Swiss norm is a very brief document that despite of addressing several issues, it does not go deep
into it.
Finally, France counts with expertise evidences in UHPC matters including regulation. In 2002,
France came up with a complete recommendation for that time and which allowed engineers to design
bridges like The Bourg-Les-Valence Bridges, Footbridge Seon Yu, and Sakata Mirai Footbridge,
already introduced in section 2.2.. Later in 2013, it was updated mainly due conformity reasons with
Eurocode 2. In 2016, France provided engineers with a national annex where every issue addressed in
Eurocode 2 are also mentioned and review for UHPC applications.
Concluding, NF P 18-710 shows to be the most reliable and embracing UHPC design code. Moreover,
this code comes in line with previous French recommendations which had shown practical evidences
of their application. That is why NF P 18-710 is the main reference during the case study.

Design of a pre-stressed bridge deck with ultra-high performance concrete
24

Design of a pre-stressed bridge deck with ultra-high performance concrete
25
5
PRE-STRESS
5.1. TECHNIQUES
Pre-stressing is an induced and deliberated permanent action in a structure to improve its behavior. It
is known that concrete is strong in compression and for design purposes its tensile resistance is
neglected. Then, compressive stresses induced by pre-stressing will counteract tensile stresses
promoted by external loadings [51]. Several techniques of pre-stressing are available but they may be
divided into two major groups: pre-tensioning and posttensioning.
In the first group, the pre-stressing tendons are strained to a predetermined tension and anchored to
fixed molds. The concrete is poured around the tendons, cured, and after hardening process the
tendons are released. The bonding between the materials allows the concrete to oppose the shortening
of the tendons while it becomes compressed.
In the second group, the tendons are strained and anchored after the hardened concrete member has
attained sufficient strength. The tendons must therefore be enclosed in ducts which may be either
embedded in concrete (internal pre-stressing) or outside of the concrete section (external pre-
stressing). In the case of internal pre-stressing, the tendons can be either bonded or unbonded to
concrete. The first is achieved by filling the void in the duct with mortar grout whereas the last is
achieved by filling it with grease instead of mortar grout. In the case of external pre-stressing, the
grout that fills the duct is only a mean of protecting the tendons [51, 52].
Additionally, pre-tensioning technique is frequently used to produce precast concrete elements
because it offers a great potential industrialization and the costs of anchors and grouting can be
eliminated. Although posttensioning can also be used in pre-cast elements, it may be most useful in
cast-in-place construction where bridge girders are too large to be transported [51, 52]. Once the
current work is focused in cast-in-place bridges, post-tensioning is the technique which is considered.
Internal bonded pre-stressing and external unbonded pre-stressing are detailed in this chapter leaving
aside internal unbonded pre-stressing. These two techniques are further ahead involved in the Case
Study: Río Cabriel Bridge.
5.2. INTERNAL VS. EXTERNAL
5.2.1. TENDON LAYOUT
In internal pre-stressing method, tendons are placed before concrete poring and they remain their
position during and after that. Once tendons are thoroughly in contact with concrete element, the pre-
stressing equivalent loads are continuously transmitted to it. Then, parabolic layout is usually adopted

Design of a pre-stressed bridge deck with ultra-high performance concrete
26
for the tendons because that is the most effective way of counterbalance dead loads (Fig.5.1.) and
because it does not cause increased constructive effort.
External pre-stressing tendons are not embedded in concrete member but, in case of box girder decks,
tendons may be positioned inside the void of the box girder which is assumed for this work. In order to
transmit equivalent pre-stressing force to concrete element, tendons are connected to it on its ends and
by mean of deviation blocks (Fig.5.1.). In this case, the layout has a polygonal shape due to
constructive constrains mainly related to deviators placement.
Fig.5.1. - Balancing of the dead load in a two-span beam by internal tendons (above) and external tendons (below) [17]. g = uniform dead load; G = resultant of the dead load; P = pre-stressing force; r = uniform radial forces from pre-stressing; R= radial force from pre-stressing at support; Rp = radial force from pre-stressing.
5.2.2. EQUIVALENT LOADS
Given an infinitesimal segment of pre-stressing tendon, the concrete element actions on this last
where:
▪ dβ – Infinitesimal deviation angle;
▪ R - Radius of curvature;
▪ ds - infinitesimal length;
▪ q* - Concrete load on tendon;
▪ dP – infinitesimal variation of pre-stressing force.
Fig.5.2. - Equilibrium of an infinitesimal segment of pre-stressing tendon [10]
𝑑𝑠 = 𝑅 𝑑𝛽 ⇔ 𝑑𝛽
𝑑𝑠=1
𝑅= φ = 𝑐𝑢𝑟𝑣𝑎𝑡𝑢𝑟𝑒

Design of a pre-stressed bridge deck with ultra-high performance concrete
27
Considering a very small deviation angle,
sin𝑑𝛽
2≅ tan
𝑑𝛽
2≅𝑑𝛽
2
cos𝑑𝛽
2≅ 1
From the vertical equilibrium of forces,
∑𝐹𝑣 = 0⇔ 𝑃 𝑑𝛽
2+ (𝑃 + 𝑑𝑃)
𝑑𝛽
2= 𝑞∗𝑑𝑠
𝑑𝑃≈0⇔ 𝑃 𝑑𝛽 = 𝑞∗ 𝑑𝑠
𝑞∗ = 𝑃 𝑑𝛽
𝑑𝑠⇔ 𝑞∗ = 𝑃 φ
It is possible to understand that the action of the concrete element on the tendon is proportional to both
tendon axial force and how its slope varies (φ). Then, the action of pre-stressing tendons on concrete
element is symmetric, opposite direction with the same intensity. So, when a pre-stressing tendon has
a parabolic layout, its rotation changes linearly and the curvature is constant. If we assume pre-
stressing axial force (P) constant, the equivalent load (q*) would be constant too.
However, in a polygonal layout of a pre-stressing tendon the rotation is constant with discontinuities at
deviation blocks. It means that there is no vertical equivalent load in between discontinuities and at the
deviation blocks occur a vertical point load (Fig.5.3.).
Fig.5.3. - Equivalent load due to a polygonal tendon [10]
tan𝛽 =𝑓
𝐿1
𝑄∗ = 𝑃 tan𝛽 = 𝑃𝑓
𝐿1
5.2.3. COMPATIBILITY
In the internal (bonded) pre-stressing technique, before even grouting, the tendon can move almost
freely within the duct. After the ducts have been grouted, there is strain combability between the
tendon and the surrounding concrete. This means that the tendon strain depends on concrete element
curvature at each cross-section.
In case of external pre-stressing, the deformation of the tendons and the concrete element are
independent and, consequently, there is movement of tendons through the deviation blocks. The
tendon strains are averaged over the length of the tendon and depends on global deformation of the
concrete element.
When exists compatibility between materials the stiffness to bending and the resisting bending
moment of the element counts with tendons contribution. Otherwise, pre-stressing tendons practically
act as only an imposed load.

Design of a pre-stressed bridge deck with ultra-high performance concrete
28
5.2.4. LOSSES
Both techniques involve short-term losses due to friction, anchorage slip and elastic-shortening. But,
friction losses only occur at deviation blocks for external pre-stressing tendons resulting in reduced
short-term losses. Long-term losses due to creep, shrinkage and relaxation are inherent to both
techniques.
5.2.5. PARTICULARITIES OF EXTERNAL PRE-STRESSING
Most of the times, web thickness design is restricted by constructive constrains related to internal pre-
stressing tendons. Therefore, external pre-stressing has been used to reducing the structures weight,
essentially by reducing the thickness of the webs [53].
Besides of the differences between internal and external pre-stressing solutions already mentioned
which are relevant for a proper analysis and design in the current work, there are other few particular
characteristics on external pre-stressing that should be considered during an advanced design stage
[54]:
▪ Better accessibility of tendons;
▪ Tendons can be replaced without major effort;
▪ Fatigue advantages due to lower stress fluctuation under live load;
▪ Issues related with tendons vibration and fretting at the deviation blocks;
▪ Reduced ductility;
▪ Concentrated forces at the anchorages and deviation blocks.

Design of a pre-stressed bridge deck with ultra-high performance concrete
29
6
CONSTRUCTIVE METHODS
6.1. FOREWORD
In this chapter are only addressed constructive methods that, at first, are feasible for cast-in-place
bridges, deck at more than 45 m high, and spans with about 70 m long. The cast-in-place solution
comprises methods based on ground scaffolding system, movable scaffolding system, balanced
cantilever method, and incremental launching. From these four methods, ground scaffolding system
starts to be an unfeasible solution for decks at more than 40 m high [13]. The other three methods are
conceivable solutions for 70 m long spans. Movable scaffolding system is the one more detailed herein
because of its importance on Case Study: Río Cabriel Bridge. Balanced cantilever method and
incremental launching are detailed enough to understand their constructive particularities, equipments,
and impact on internal forces during constructive process. Where relevant, some considerations about
internal forces redistribution during time are also taken.
6.2. BALANCED CANTILEVER METHOD
6.2.1. DESCRIPTION AND EQUIPMENT
The construction of bridges with large spans and with decks at high altitude is closely related with this
constructive method. The economical range of span lengths for this method goes from 70m to beyond
250m.
The deck is divided into segments whose common length ranges between 3 and 5 m (6 and 7m is also
possible) which are sequentially casted outward from pier to form a cantilever structure. Two
cantilevers are simultaneously and symmetrically constructed from each pier and the metallic
scaffolding is supported by the last segment already casted. A complete sequence of operations to
build a segment usually lasts one week and it comprises the following steps:
1. Launching of the balanced cantilever carriage;
2. Leveling of the equipment;
3. Reinforcement and pre-stressing tendons placement;
4. concreting and curing;
5. Tensioning of the pre-stressing tendons and formwork removal.
An important step during construction occurs in the beginning of the cantilever when the advance
starts in both pier sides. To overcome that, it is necessary to stablish a provisional scaffolding system
supported at each pier side so that the first segments may be casted (Fig.6.1). Without this step, it
would not be possible to place the constructive equipment at the top of the pier.

Design of a pre-stressed bridge deck with ultra-high performance concrete
30
Fig.6.1. - Balanced cantilever method with provisional scaffolding system [13].
However, some advanced systems allow the construction of those initial segments without provisional
scaffolding system. A special structural element is used to unify both equipments until the two first
segments have been casted. Then, the unifying element is released and the typical constructive
sequence starts (Fig.6.2.).
Fig.6.2. - Balanced cantilever method without provisional scaffolding system [13]
6.2.2. IMPACT ON INTERNAL FORCES
In Fig.6.3. is qualitatively illustrated how bending moments change during balanced cantilever method
construction. At the end of constructive process all the segments are under negative bending moments
by only considering the dead load acting on structure.
Fig.6.3. - Dead load internal forces resulting from balanced cantilever method [12].
As soon as viscoelastic phenomenon starts to act, internal forces start to redistribute and the bending
moments at the end of constructive process (M0) evolve toward that would exist if dead load was

Design of a pre-stressed bridge deck with ultra-high performance concrete
31
hypothetically applied after the structure had been ended (Me). When this phenomenon stabilizes,
bending moments diagram (Mꝏ) lays at an intermediate position between those aforementioned
(Fig.6.4.).
Fig.6.4. - Balanced cantilever method - Dead load internal forces redistribution caused by creep [5]
6.3. INCREMENTAL LAUNCHING METHOD
6.3.1. DESCRIPTION AND EQUIPMENT
This constructive method is recommended for bridges with spans ranging between 30 and 70 m. This
method is also restricted to bridges with horizontal lay-out either circular or straight along all its
extent. Otherwise it is not possible to coincide bridge deck with piers top. The economic advantage of
this method resides on a casting plant stationed at a bridge end where deck segments (15 to 20 m long)
are casted and pushed forward by successive displacements by means of hydraulic jacks. Thus, bridge
deck travels over all piers top until it reaches the other abutment with no scaffolding system needed.
There is a steel nose at the front of the traveling deck (Fig.6.5.) which has two main purposes. One of
them is to reduce internal forces due to the cantilever dead load. The other one is to facilitate the deck
to pass over the piers.
Fig.6.5. - Effect of the steel nose on internal forces during incremental launching [13]
6.3.2. IMPACT ON INTERNAL FORCES
Once that the segments occupy different positions during construction, each cross-section is submitted
to changes of internal forces during constructive process (Fig.6.6.). For instance, when it is positioned

Design of a pre-stressed bridge deck with ultra-high performance concrete
32
at mid-span it is subjected to positive bending moments and when it is positioned at pier it is subjected
to negative bending moments.
Fig.6.6. - Dead load internal forces resulting from incremental launching method [12].
In Fig.6.7. is represented the bending moments diagram envelope resulting of dead load action during
constructive process. This envelope shows how this constructive method can be conditioning for deck
design. Besides that, it requires the existence of provisional external pre-stressing to avoid tensile
stresses during construction.
Fig.6.7. - Dead load internal forces envelope resulting from incremental launching method [13].
6.4. MOVABLE SCAFFOLDING SYSTEM
6.4.1. DESCRIPTION AND EQUIPMENT
This is a sophisticated procedure to construct bridge decks in situ where scaffolding operations are
fully automated. This span-by-span construction system also overcomes limitations inherent to ground
scaffolding system related with soil influence and deck height. However, considering its high
performance as well as the high investment on it, movable scaffolding system becomes profitable in
applications of long bridge constructions. Usually, this procedure has been used to construct bridges
with common spans within 30 and 40 m long [13].
Every span construction follows these steps summarized below (Fig.6.8.):
1. Once a span is casted and pre-stressed, each set of beams is released from its support (A)
by being lowered slightly with help of vertical jacks;
2. Beams move transversely on the brackets (3) supported by the piers (4). These two steps
refer to the transition from a) to b);

Design of a pre-stressed bridge deck with ultra-high performance concrete
33
3. The scaffolding system slides over the brackets attached to the piers until it reaches the
following span;
4. When it has reached its final position, the system is leveled, the formwork (2) is closed,
longitudinal beams are supported by the cantilever of the last casted span;
5. Placement of ordinary reinforcement, concreting, curing and pre-stressing procedures.
Fig.6.8. - Movable scaffolding system equipment [13].
Movable Scaffolding System (MSS) allows the construction of curved deck bridges but some
adjustments must be performed. The space between beams must be such that the curve of the bridge
stays inscribed between them. Additionally, the formwork needs to be segmented to fit the curve
shape. Precautions should be taken to the deflections of scaffolding system due to their self-weight,
that of the formwork and that of the fresh concrete. These deflections must be opposed with a pre-
camber.
Recently, the state of the art of this construction method has changed with the Organic Pre-Stressing
System (OPS) which is a concept inspired in muscle behavior (Fig.6.9.). It consists in an active control
system whose main target is decrease deflections and stresses of scaffolding system during casting
process. It is achieved by tensioning external pre-stressing tendons while the load over MSS increases
[55].
Fig.6.9. - Movable scaffolding system equipped with organic pre-stressing system (OPS).
With OPS implementation is possible to use MSS to cast deck segments with 60m long where the
scaffolding system can perform in two ways, under or above the deck. Even more recently, this system
has met a new development and now it is possible to cast 90m spans with large movable scaffolding
system (LMSS) [56]. These developments on MSS technology have made possible its use on long
spans applications while avoiding undesirable loads in the structure during constructive process which
would become its use infeasible.

Design of a pre-stressed bridge deck with ultra-high performance concrete
34
LMSS was firstly used to build the superstructure of Río Cabriel Bridge with 70m spans. This
equipment (M70-S) is characterized by its “Bowstring” arch behavior where the lower chord is
actively controlled by OPS during the concrete pouring stage which prevents the opening of the arch
(Fig.6.10.). Consequently, this active control promotes a reduction deformations during the concrete
pouring stage, with a maximum mid-span deflection lower than L/2000. However, the cantilever
concrete pouring extension has no OPS influence. Yet, its deformations are limited thanks to stiffness
provided by the inclusion of two superior passive ties.
Fig.6.10. - Schematic representation of large movable scaffolding system (LMSS).
Like the regular MSS without OPS, M70-S is supported by the following pier and by the end of
previews casted deck during the casting of the following deck segment (Fig.6.11.). Right after the
pushing of pre-stressing tendons, formworks move transversely (Fig.6.12.) thanks to a hydraulic
system so that all the M70-S can cross the intermediate pier to achieve the next span.
Fig.6.11. - Positioning of the M70-S during casting works.

Design of a pre-stressed bridge deck with ultra-high performance concrete
35
Fig.6.12. - Preparing M70-S for launching by opening formwork system.
In order to launch M70-S to the following span, the rear support is replaced by another one near mid-
span, designated by “launching frame” from now on (Fig.6.13.). The main purpose of bringing
supports closer is to increase the room for maneuver M70-S. Therefore, the equipment is easily
adjustable during launching in curved decks. Then, M70-S starts to move forward until it reaches the
front pier where is placed a provisional support (Fig.6.14.). At this point, the rear support is again
replaced by a support at the cantilever end, the support at the back pier is also removed. Then, M70-S
moves until its final position to start the cycle again (Fig.6.11.).
Fig.6.13. - Preparing M70-S for launching by bringing supports closer.
Fig.6.14. - M70-S reaching the support above the pier of the following span.
6.4.2. IMPACT ON INTERNAL FORCES
In order to understand the influence of this constructive method on structural analysis, it is illustrated a
simplified scheme where is only considered deck self-weight loading the structure. As can be seen in
Fig.6.15., every time that is added a new deck segment its self-weight is also “activated”. This self-
weight is applied when occurs formwork removal. The same is applied to pre-stressing loads.
Equipment loads during staged construction are relevant and must be considered for limit states
verifications.

Design of a pre-stressed bridge deck with ultra-high performance concrete
36
Fig.6.15. - Dead load internal forces resulting from construction with movable scaffolding system (MSS) [12].
After staged construction is ended occurs internal forces redistribution during time. In the Fig.6.16. is
illustrated how bending moments diagram changes from built-up distribution (M0) towards that for
monolithic construction (Me).
Fig.6.16. - Construction with movable scaffolding system – Dead load internal forces redistribution caused by creep [5].

Design of a pre-stressed bridge deck with ultra-high performance concrete
37
7
DESIGN PRINCIPLES AND ASSUMPTIONS
7.1. FOREWORD
As already said, the design methods described in NF P 18-710 are based on EC2. Some articles have
remained unchanged, some are not applied anymore, and others which have been changed or have
been added are thoroughly described. In this chapter, the topics about properties modeling which are
relevant for UHPC structural design in the current study are summarized. Some assumptions related to
material properties are also detailed because of lack of material characterization data.
Some particularities about structural analysis are also addressed with regard to time dependent effects
and box girder beams design.
7.2. MATERIALS
7.2.1. MECHANICAL PROPERTIES
According with what is said in the NF P 18-470 about thermal treatment class, compressive strength
class, and tensile behavior class, and due to the lack of that information some assumptions should be
done.
The case study is developed considering a field cast procedure, therefore, no thermal treatment neither
steam treatment is presumed to be applied. Consequently, the thermal treatment class is “STT”. This
assumption has direct influence on shrinkage and creep magnitudes, as previously explained in chapter
3.
French norm provides indicative values of UHPC characteristics at 28 days of age. These values are
tabulated in the Appendix A.1. in form of ranges. It can be said beforehand that the UHPC material
assumed for the case study comprises the minimum values for the strengths (Table 7.1.).
Table 7.1. – Mechanical properties assumed for UHPC during the current study.
Property Symbol Value
Elasticity Modulus Ecm 45GPa
Characteristic compressive strength fck 150MPa
Mean compressive strength fcm 160MPa
Characteristic limit of elasticity under tension fctk,el 7.0MPa
Mean limit of elasticity under tension fctm,el 8.0MPa

Design of a pre-stressed bridge deck with ultra-high performance concrete
38
Property Symbol Value
Characteristic maximal post-cracking stress fctfk 6.0MPa
Mean maximal post-cracking stress fctfm 7.0MPa
Fibers length Lf 16mm
Global fiber orientation factor Kglobal 1.25
Local Fiber orientation factor Klocal 1.75
Thermal expansion coefficient αt 11 µm/m/ºC
Crack opening corresponding to local peak wpic 0.3
Mean post-cracking stress corresponding to a crack with of 0.01H fctf1% 4.8MPa
From now on, any time that is intended to refer to this material it will be designated by UHPC150,
because of its characteristic compressive strength.
7.2.2. CONSTITUTIVE LAW FOR DESIGN
In this section is intended to introduce to the reader the stress-strain relationship in ultimate limit state
safety verifications when elements are subjected to bending moments and/or axial forces. Similar
stress-strain relationships with average or characteristic values are also provided in French norm to use
on serviceability limit state verifications, for instance cracking control, which is not going to be
needed in the current work.
Fig.7.1. - NF P 18-710 Design stress-strain relationship in compression [6].
fcd=αcc fck 𝛾𝑐⁄ (7.1.)
𝜀𝑐0𝑑 = 𝑓𝑐𝑑 𝐸𝑐𝑚⁄ (7.2.)
𝜀𝑐𝑢𝑑 = [1 + 14 𝑓𝑐𝑡𝑚
𝐾𝑔𝑙𝑜𝑏𝑎𝑙 𝑓𝑐𝑚
] 𝜀𝑐0𝑑 (7.3.)

Design of a pre-stressed bridge deck with ultra-high performance concrete
39
Material constitutive law in tension depends on two aspects:
▪ Whether it is a thick element or a thin element. There are expressions which classify
elements regarding their thickness.
▪ Tensile behavior class according to NF P 18-470
In the current work the elements are in the domain of the thick elements and with tensile behavior
class “T1” (softening behavior). So, the constitutive law in tension comes with the shape illustrated in
the image.
Fig.7.2. - NF P 18-710 Design stress-strain relationship in tension [6].
A safety factor (γcf=1.3) is introduced regarding manufacturing defects and it is applied to tensile
strength of UHPC. The key points of tensile constitutive law are defined in the following equations.
𝜀𝑢,𝑝𝑖𝑐 =
𝑤𝑝𝑒𝑎𝑘
𝐿𝑐+
𝑓𝑐𝑡𝑘,𝑒𝑙
𝛾𝑐𝑓 𝐸𝑐𝑚
(7.4.)
𝜀𝑢,1% =
𝑤1%
𝐿𝑐+
𝑓𝑐𝑡𝑘,𝑒𝑙
𝛾𝑐𝑓 𝐸𝑐𝑚
(7.5.)
𝜀𝑢,𝑙𝑖𝑚 =
𝐿𝑓
4 𝐿𝑐
(7.6.)
𝐿𝑐 =
2
3ℎ
(7.7.)
With “h” as being cross-section depth. This means that post cracking constitutive law depends not
only on the material but also cross-section geometry. Its presence on those formulas is supposed to
express the scale effect on tensile constitutive law after crack opening.
How fibers are distributed influence the nonlinear part of the tensile constitutive law. Their
distribution depends on the placing method and element geometry. In order to take this into account, a
K factor is implemented to correct the tensile resistance in nonlinear behavior. Moreover, K factor
may take different values depending on the analysis direction at the same structural point.

Design of a pre-stressed bridge deck with ultra-high performance concrete
40
In a real design situation, and before implementing the validation process, the designer is allowed to
use recommended values for K factor (Appendix A.1.). Then, suitability tests should be carried out to
validate those values.
7.2.3. TIME DEPENDENT PROPERTIES
How material strength and stiffness evolve during time has major importance during staged
construction analysis. The results achieved by Habel et al. [45] in determining the models of
mechanical properties development are used in this study. That paper is based in a proprietary UHPC
(CEMTECmultiscale®). The development of the mechanical properties is function of degree of
reaction, which in turn is function of time. All specimens were demolded after three days and then
water-cured at 20°C until testing. The model of development of the degree of reaction with time
comes is in equation (7.8.), thus, any mechanical property “p” studied by Habel et al. can be modeled
by the general equation (7.9.).
𝑟 =
0.038 (𝑡 − 26)
1 + 0.038 (𝑡 − 26)
(7.8.)
𝑝(𝑟) = (
𝑟 − 𝑟0
1 − 𝑟0)
𝑎
×𝑝(𝑟 = 1) (7.9.)
Where
▪ p - Considered mechanical property;
▪ r0 - Degree of reaction at the beginning of the strength development, and takes the value
of 0.16;
▪ a - Parameter which depends on mechanical property to be evaluated (Table 7.2.).
Table 7.2. - Values of a-parameter determined by Habel et al. [45].
Mechanical Property Symbol a
Elasticity Modulus 𝐸𝑐𝑚 0.8
Mean compressive strength 𝑓𝑐𝑚 1.1
Mean limit of elasticity under tension 𝑓𝑐𝑡𝑚,𝑒𝑙 2.5
French norm also provides indicative models for creep and shrinkage which are described in the
appendix (A.1.). For the parameters whose values come in range form, it is assumed their intermediate
values (Table 7.3.).
Table 7.3. – Assumed values to characterize creep and shrinkage based on the suggestions of NF P18-710 [6]
𝛽𝑐𝑎 450 µm/m
𝛽𝑐𝑑 0.005 days/mm2
𝛽𝑏𝑐1 2
𝜑𝑑0 35

Design of a pre-stressed bridge deck with ultra-high performance concrete
41
In the appendix (A.2.) can also be found the diagrams which illustrate UHPC150 time dependent
properties during time.
For pre-stressed members, the redistribution of moments and stresses is particularly important for the
serviceability limit state design, as it can lead to unacceptable cracking and serviceability stresses, if
creep effect is not considered properly. To attend this issue during case study, it was modeled the
creep coefficient development during time for each age that concrete is loaded by permanent actions
along constructive process. The curve of shrinkage strain along time is also defined. Finally, all time
dependent data is inputted on structural analysis software and then it will perform step by step
calculation which is the general method mentioned in EN1992-2 for assessment of structural effects of
time dependent behavior [57].
7.3. ULTIMATE LIMIT STATE CAPACITY
7.3.1. BENDING
The resistant bending moment and/or axial force are calculated regarding a linear variation of strains.
The limits of a strain linear diagram for a given cross-section is different whether it includes
reinforcement and/or pre-stress or not. The following images show those limits whether it is plain
UHPC element (Fig.7.3.) or not (Fig.7.4.).
Fig.7.3. - Limit strains diagram in ULS for plain UHPC [6].
Fig.7.4. - Limit strains diagram in ULS for reinforced and/or pre-stressed UHPC [6].
▪ A - Reinforcing steel tension strain limit;
▪ B - UHPC compression strain limit;
▪ C - UHPC strain limit under pure compression;
▪ F - UHPC tension strain limit.
An important particularity for this study is that in parts of cross-sections which are subjected to
approximately concentric loading (e/h < 0.1), such as compression flanges of box girders, the mean

Design of a pre-stressed bridge deck with ultra-high performance concrete
42
compressive strain in that part of the section should be limited to εc0d. This information is relevant
because during case study it is dealt with box girder beams where this rule must be applied either for
negative or positive bending moments.
Contrary to what is stated in EC2, no minimum flexural reinforcement area neither shear
reinforcement is required in UHPC elements. This is justified by the fact that NF P18-710 is only
applicable for UHPC materials that fulfill the ductility requirement expressed in equation (7.10.).
1
𝑤0.3∫
𝜎𝑓(𝑤)
1.25 𝑑𝑤
𝑤0.3
0
≥ 𝑚𝑎𝑥( 0.4 𝑓𝑐𝑡𝑚,𝑒𝑙 ; 3 𝑀𝑃𝑎) (7.10.)
7.3.2. SHEAR
Unlike EC2, NF P 18-710 allows the superposition of shear strength of the UHPC matrix and shear
reinforcement. Besides that, a shear strength component due to fibers bridging cracks is considered
when determining the total shear strength of a given cross-section as expressed in equations (7.11.),
(7.12.), and (7.13).
𝑉𝑅𝑑 = 𝑚𝑖𝑛{𝑉𝑅𝑑,𝑚𝑎𝑥 ; 𝑉𝑅𝑑,𝑐 + 𝑉𝑅𝑑,𝑠 + 𝑉𝑅𝑑,𝑓}
(7.11.)
𝑉𝑅𝑑,𝑓 = 𝐴𝑓𝑣 𝜎𝑅𝑑,𝑓 cot 𝜃
(7.12.)
𝐴𝑓𝑣 = 𝑏𝑤 𝑧
(7.13.)
The equation (7.14.) represents the mean value of the post-cracking stress resistance along the shear
crack. The parameter wu is the ultimate opening of the cracks on the extreme fiber, under the moment
and axial force acting in the same cross-section, and is characterized by equation (7.15.).
𝜎𝑅𝑑,𝑓 =
1
𝐾 𝛾𝑐𝑓
1
𝑤∗∫ 𝜎𝑓(𝑤) 𝑑𝑤
𝑤∗
0
(7.14.)
𝑤∗ = 𝑚𝑎𝑥{𝑤𝑢 ; 0.3𝑚𝑚}
(7.15.)
Characterization testes should be previously performed in order to know σf(w). However, it is possible
to know σf(ε) from recommended values provided by the code. Then, it was assumed that equation
(7.14.) would be equivalent to the equation (7.16.), which also gives the mean value of the post-
cracking stress resistance along the shear crack. Consequently, with that transformation comes
equation (7.17.) and (7.18.). This transformation can be better explained with Fig.7.5., which shows
the analogy between domain of integration of crack opening and strains diagram. Furthermore, is also
shown the correspondent stresses diagram inherent to those domains. The parameter εu is the ultimate
strain of the cracks on the extreme fiber. Notice that this simplification is only an assumption of the
author, it is not mentioned on French norm.

Design of a pre-stressed bridge deck with ultra-high performance concrete
43
𝜎𝑅𝑑,𝑓 =
1
𝐾 𝛾𝑐𝑓
1
𝜀∗ − "𝜀𝑢,𝑒𝑙"∫ 𝜎𝑓(𝜀) 𝑑𝜀
𝜀∗
"𝜀𝑢,𝑒𝑙"
(7.16.)
"𝜀𝑢,𝑒𝑙" =
𝑓𝑐𝑡𝑓𝑘
(𝛾𝑐𝑓 𝐾)⁄
𝐸𝑐𝑚
(7.16.)
𝜀∗ = 𝑚𝑎𝑥{𝜀𝑢 ; 𝜀𝑢,𝑝𝑖𝑐}
(7.17.)
Fig.7.5. – Analogy between crack width-stress diagram and strain-stress diagram.
The UHPC matrix contribution to shear strength is similar to that is described on EC2 and the shear
reinforcement contribution is exactly the same as EC2. The shear strength provided by UHPC matrix
(VRd,c), depending whether it is a steel reinforced cross-section (7.18.), pre-stressed cross-section
(7.19.) or none of them (7.20.).
𝑉𝑅𝑑,𝑐 =
0.21
𝛾𝑐𝑓 𝛾𝐸𝑘 𝑓𝑐𝑘
1/2𝑏𝑤 𝑑 (7.18.)
𝑉𝑅𝑑,𝑐 =
0.24
𝛾𝑐𝑓 𝛾𝐸𝑘 𝑓𝑐𝑘
1/2𝑏𝑤 𝑧 (7.19.)
𝑉𝑅𝑑,𝑐 =
0.18
𝛾𝑐𝑓 𝛾𝐸𝑘 𝑓𝑐𝑘
1/2𝑏𝑤 ℎ (7.20.)
Where k (7.21.) is a parameter that takes into account the positive effect of compressions usually
induced be pre-stressing.
𝑘 = 1 + 3𝜎𝑐𝑝
𝑓𝑐𝑘
(7.21.)
When determining the compressed strut strength (7.22.), no positive direct influence provided by pre-
stressing is considered, contrary to what described in EC2.

Design of a pre-stressed bridge deck with ultra-high performance concrete
44
𝑉𝑅𝑑,𝑚𝑎𝑥 = 2.3
𝛼𝑐𝑐
𝛾𝑐𝑏𝑤 𝑧 𝑓𝑐𝑘
2/3 [𝑉𝑅𝑑,𝑠(cot 𝜃 + cot 𝛼)
1 + cot (𝜃)2 + 𝑉𝑅𝑑,𝑓 tan 𝜃] ∙ [1
𝑉𝑅𝑑,𝑠 + 𝑉𝑅𝑑,𝑓]
(7.22.)
7.3.3. CALCULATION TOOL
A worksheet in Excel was developed aiming to assist ULS sectional analysis. It was useful to avoid
repetitive and complex hand calculations considering the complex shape of tensile constitutive law of
UHPC. The concept is similar to that used by Yoo and Yoon to predict the flexural behavior of UHPC
beams with steel reinforcement [58].
Firstly, the cross-section under analysis is discretized into horizontal layers along its height. For a
given neutral axis position (x) and a given cross-section curvature (φ), the strains and stresses at each
layer are calculated based on the usual assumption of linear strain distribution (Fig.7.6.). Then, the
Solve module on Excel may be defined to iteratively search for the best result for a given objective
function, for instance:
▪ Maximum resisting bending moment for a given axial force;
▪ Minimum steel reinforcement required for a given solicitation.
Fig.7.6. - Schematic explanation of stress and strain distributions in cross-section [58].
This operation is always performed with verification of equilibrium condition of external forces and
moments with the resulting forces of stress field on materials. At the same time, shear equations use
the results from bending analysis to calculate shear strength.
An example (in appendix A.4.) is given for a cross-section geometry with 1 m width and 0.25 m depth
and material class of UHPC150 which is supposed to resist 260 kN.m bending moment. It is also
possible draw Moment-curvature (M-φ) diagrams just by assuming several curvature values, and ask
for the corresponding bending moment that satisfies equilibrium conditions. It may be useful to assess
the cross-section flexural ductility.
7.3.4. SHEAR AND TRANSVERSE BENDING
According with what is said in the EN1992-2, the interaction between transverse bending and
longitudinal shear in the webs of box girder sections should be considered in the design. That norm
guides the designer to annex M where is explained an appropriate method for concrete structures
based on “sandwich model”.

Design of a pre-stressed bridge deck with ultra-high performance concrete
45
In the current work, no interaction will be performed and the webs are supposed only to resist the
longitudinal shear force. Moreover, French norm states that that annex is no longer applicable for
UHPC and does not come with other alternative methods or expressions.

Design of a pre-stressed bridge deck with ultra-high performance concrete
46

Design of a pre-stressed bridge deck with ultra-high performance concrete
47
8
CASE STUDY: RÍO CABRIEL BRIDGE
8.1. DESCRIPTION AND GEOMETRY
The case study bridge was constructed in 2009-2010, it is located in Spain (Cofrentes, Valencia), and
integrates the national road N-330. It passes over the river Cabriel and counts with 8 spans which
amounts 520m length. The common span has 70m of length and 11m of width. The highest pier has
approximately 45m. The superstructure was built with an overhead movable scaffolding system
(MS70-S) as mentioned in chapter 6. It is assumed a structural class S4 and with an exposure class of
XC2 or XC3 (inferred from cover thickness).
The horizontal alignment (Fig.8.1.) configures a compound curve with a circular part and two clothoid
spiral parts before and after the first mentioned. The minimum radius of curvature is 1170 m and the A
parameter of the two spirals are 196.8 and 163.5 m, respectively. For simplicity reasons, and attending
to the high value of the curvature radius, a straight line is assumed for the horizontal alignment during
numerical calculations. The vertical alignment (Fig.8.2.) is slightly sloped but, again, for simplicity
reasons and without induce significant errors, a horizontal straight line is assumed during numerical
calculations.
Fig.8.1. - Río Cabriel Bridge - Plan view.
Fig.8.2. - Río Cabriel Bridge - Elevation view.

Design of a pre-stressed bridge deck with ultra-high performance concrete
48
The superstructure is concrete box girder with variable inertia and 11 m width. The girder depth at mid
span is 2.5 m (Fig.8.3.) whereas over the piers it reaches 3.47 m (Fig.8.4.). Other geometrical
parameters like bottom slab thickness are variable and they are all modeled according to a parabolic
variation law. No web thickening to accommodate pre-stress anchorages neither deck superelevation
are considered. The diaphragms at the abutments and above the piers are only included in shell
numerical models.
Fig.8.3. - Río Cabriel Bridge - Cross-section at mid span
Fig.8.4. - Río Cabriel Bridge - Cross-section at above the piers
The abutments (E-1 and E-2) are fixed to the ground and they provide support to the girder by means
of elastomeric bearings in the bottom of the girder. The superstructure is also supported by 7 single
piers (Table 8.1.) which are non-prismatic elements whose cross-section geometry changes linearly
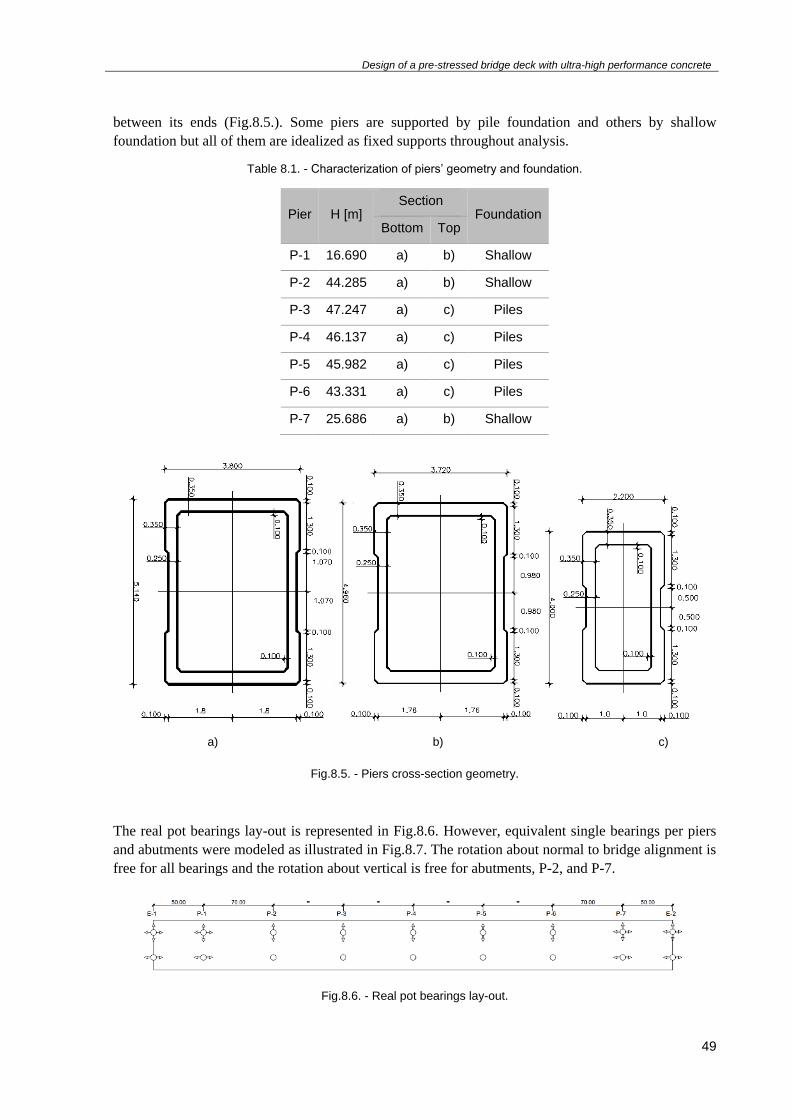
Design of a pre-stressed bridge deck with ultra-high performance concrete
49
between its ends (Fig.8.5.). Some piers are supported by pile foundation and others by shallow
foundation but all of them are idealized as fixed supports throughout analysis.
Table 8.1. - Characterization of piers’ geometry and foundation.
Pier H [m] Section
Foundation Bottom Top
P-1 16.690 a) b) Shallow
P-2 44.285 a) b) Shallow
P-3 47.247 a) c) Piles
P-4 46.137 a) c) Piles
P-5 45.982 a) c) Piles
P-6 43.331 a) c) Piles
P-7 25.686 a) b) Shallow
a) b) c)
Fig.8.5. - Piers cross-section geometry.
The real pot bearings lay-out is represented in Fig.8.6. However, equivalent single bearings per piers
and abutments were modeled as illustrated in Fig.8.7. The rotation about normal to bridge alignment is
free for all bearings and the rotation about vertical is free for abutments, P-2, and P-7.
Fig.8.6. - Real pot bearings lay-out.

Design of a pre-stressed bridge deck with ultra-high performance concrete
50
Fig.8.7. - Equivalent pot bearings lay-out.
8.2. LOAD CASES
8.2.1. STAGED CONSTRUCTION
This bridge was built span-by-span with Movable Scaffolding System (MSS), more precisely with the
equipment M70-S as previously described. During equipment launching to the following span, its
support conditions changes as well transmitted forces to the structure. The load that M70-S transmits
to the structure during constructive process is simply modeled as equivalent point loads when and
where they are most unfavorable. Furthermore, only loads acting on the deck are considered because
loads on the piers have no interest in the current study. Those loads were provided by the company
responsible for developing the M70-S, “BERD - Bridge Engineering Research & Design”. Each stage
of constructive process (Fig.8.8.) comprises the following tasks:
1. Add a new deck segment with its self-weight and add the corresponding pre-stressing
tendons with their tensioning force;
2. Remove Concreting Frame (CF = 2545kN ↑);
3. Add Launching Frame (LF = 2600kN ↓);
4. Remove Launching Frame (LF = 2600kN ↑);
5. Add Concreting Frame (CF = 2545kN ↓);
6. Add Concrete Load (CL = 3706kN ↓);
7. Remove Concrete Load (CL = 3706kN ↑) which occurs simultaneously with task 1 of the
following stage.
In the appendix A.5. can be found a table where this procedure is sequenced for all the stages until the
construction is completed. The tasks are identified with numbers that correspond to the numbering of
Fig. 8.8. and they are accompanied by the strength development of UHPC and CC.
Fig.8.8. - Schematic sequence of tasks which represents M70-S loads on structure during a constructive cycle.
8.2.2. PERMANENT LOADS (GK)
The specific-weight, either for CC or for UHPC, is assumed to be 25kN/m3. In Fig.8.9. is illustrated
the roadway and where can be seen non-structural elements whose self-weight must be modeled along
bridge length. Those elements are:

Design of a pre-stressed bridge deck with ultra-high performance concrete
51
▪ 2 parapets
▪ 2 cornices
▪ Asphalt layer
Fig.8.9. - Non-structural elements.
It is considered that asphalt layer has a constant thickness of 7 cm and is bounded by cornice inner
edges. Asphalt is inputted as a surface load:
𝑞𝑎𝑠𝑝ℎ𝑎𝑙𝑡 = 24 ×0.07 = 1.68 𝑘𝑁 𝑚2⁄
Parapet is considered to weight 1kN by linear length and both parapet and cornice are conservatively
modeled as a linear load at the overhang ends.
𝑝𝑝𝑎𝑟𝑎𝑝𝑒𝑡 = 1 𝑘𝑁 𝑚⁄
𝑝𝑐𝑜𝑟𝑛𝑖𝑐𝑒 = 25 × 0.145 = 3.63 𝑘𝑁 𝑚⁄
In Fig.8.10 is summarized the RPL locations and values.
Fig.8.10. - Transverse positioning of the remaining permanent loads (RPL)
8.2.3. TRAFFIC LOADS (TS AND UDL)
Load models defined in EN1991-2 [2], which approaches traffic loads on bridges, should be used for
bridges with loaded lengths lesser than 200 m. However, for bridges longer than 200 m is also said
these load models result safe-sided. The carriageway width is 10 m and from that results 3 notional
lanes of 3 m width each and a remaining area with a total width of 1 m.
The load model for global analysis is the Load Model 1 (LM1) and the class assigned to the bridge is,
as suggested by EN1991-2, international heavy vehicle traffic. With these considerations comes a load
distribution for global analysis that is similar to the one represented in Fig.8.11.

Design of a pre-stressed bridge deck with ultra-high performance concrete
52
Fig.8.11. - Application of load Model 1 for global (left) and local (right) verifications.
The Tandem System (TS) vehicles are placed side by side to run all deck length such that an internal
forces envelope for every TS position may be determined. The uniformed distributed loads (UDL) are
properly placed to increase internal forces over the 4th pier and in the mid-span of the odd spans
where will appear the most conditioning internal forces. In Fig.8.12. can be found axle loads and UDL
used for each lane.
Fig.8.12. - Load model 1: characteristic values [2].
In order to intensify torsion forces, notional lanes are positioned near the edge of the carriageway with
Lane n.1 being the one placed closest to it (Fig.8.13.). Only one axle loads per vehicle are represented.
Fig.8.13. - UDL and TS positioning in order to intensify global internal forces.
Tandem system 1 is also used to perform local verifications in a shell model. In this kind of
verifications, axle loads must be characterized more realistically with surface loads which represents
the contact pressure of the wheels. Besides that, dispersal of the load up to slab middle plan must be
considered (Fig.8.14.). It is simply assumed that the slab has constant thickness of 0.20 m. The surface
loaded is a square 0.74 x 0.74 m where the point load is now uniformly distributed.

Design of a pre-stressed bridge deck with ultra-high performance concrete
53
Fig.8.14 - Dispersal of TS loads.
Load arrangement of Fig.8.15. is supposed to, first, maximize shear forces and negative bending
moments in the cantilever-slab connection and, second, promote positive bending moments in the
inner slab. Fig.8.16. and Fig.8.17. shows to different load arrangement considered to maximize
internal forces in the inner slab.
Fig.8.15 – Traffic load arrangement for local verifications 1.
Fig.8.16 - Traffic load arrangement for local verifications 2.
Fig.8.17 - Traffic load arrangement for local verifications 3.
8.2.4. THERMAL ACTIONS (TK)
The thermal actions can be divided into 4 components (Figure 49):
▪ Uniform temperature component (a);
▪ Horizontal temperature difference component (b);

Design of a pre-stressed bridge deck with ultra-high performance concrete
54
▪ Vertical temperature difference component (c);
▪ Non-linear temperature component (d).
Fig.8.18. - Diagrammatical representation of constituent components of a temperature profile [4]
The component (a) induces a variation in length of the bridge deck which is restrained by the piers.
Then, internal forces will appear in the deck and in the piers. It is assumed that thermal actions on the
existing bridge can be characterized by NP EN1991-1-5 for Zone A in both winter and summer
conditions. Thus, maximum (Tmax) and minimum temperature (Tmin) which the bridge will achieve are:
𝑇𝑚𝑎𝑥 = 45º𝐶
𝑇𝑚𝑖𝑛 = −5º𝐶
And if initial bridge temperature at the time the structure is restrained is:
𝑇0 = 15º𝐶
Then, the characteristic values of the maximum expansion (∆TN,exp) and maximum contraction
(∆TN,con) range of uniform bridge temperature component are:
∆𝑇𝑁,𝑒𝑥𝑝 = 30º𝐶
∆𝑇𝑁,𝑐𝑜𝑛 = 20º𝐶
For superstructure design purposes, vertical temperature difference component (c) governs the
problem by imposing relevant bending moments. NP EN1991-1-5 defines two extreme values for this
component, one corresponding to heating and the other corresponding to cooling of the deck [4]. In
bridges Type 3 (concrete box girder) with 7 cm of asphalt thickness, vertical temperature difference
component (∆TMz) comes:
∆𝑇𝑀𝑧,ℎ𝑒𝑎𝑡 = 13.2º𝐶
∆𝑇𝑀𝑧,𝑐𝑜𝑜𝑙 = 5º𝐶
To model the difference temperature component, the gravity center is assumed 63% of girder depth
away from box girder bottom along all bridge length. It is true for mid-span cross-section and almost
true near de piers which actually is 57%.

Design of a pre-stressed bridge deck with ultra-high performance concrete
55
The non-linear component (d) is not included in the approach specified in the national annex of the
same norm. Finally, according to NP EN1991-1-5, the combination of actions corresponding to
uniform and difference components are the following:
∆𝑇𝑀𝑧,ℎ𝑒𝑎𝑡 + 0.8 ∆𝑇𝑁,𝑒𝑥𝑝
0.8 ∆𝑇𝑀𝑧,ℎ𝑒𝑎𝑡 + ∆𝑇𝑁,𝑒𝑥𝑝
∆𝑇𝑀𝑧,𝑐𝑜𝑜𝑙 + 0.8 ∆𝑇𝑁,𝑐𝑜𝑛
0.8 ∆𝑇𝑀𝑧,𝑐𝑜𝑜𝑙 + ∆𝑇𝑁,𝑐𝑜𝑛
The characteristic internal forces envelope resulting from these four combinations is referred as being
Tk, from now on.
8.3. LOAD COMBINATIONS AND VERIFICATIONS
8.3.1. EXECUTION STAGE
For execution stage, no ultimate limit state (ULS) verifications are performed even though EN1992-2
requires that both ultimate and serviceability limit states (SLS) must be verified during structure
execution. However, information about stresses limits to be respected in SLS is not clear. Therefore,
the SLS verifications assumed during execution stage are performed by restricting concrete
compressive (Eq.8.1.) and tensile stresses (Eq.8.2.). Furthermore, the displacement in the end of the
cantilever at the moment of casting of the following segment (see task 6 in section 8.2.1.) is
determined. The prediction of this value is important to provide the cantilever with a pre-deflection
such that cantilever end may have approximately null deflection right before the following span is
casted.
𝜎𝑐 ≤ 0.6 𝑓𝑐𝑘(𝑡) (8.1.)
𝜎𝑐 ≤ 𝑓𝑐𝑡𝑚(𝑡) (8.2.)
Moreover, tensile stresses on pre-stressing tendons are also controlled with Eq.8.3. and Eq.8.4.
𝜎𝑝,𝑚𝑎𝑥 ≤ min(0.8 𝑓𝑝𝑘; 0.9 𝑓𝑝0.1𝑘) (8.3.)
𝜎𝑝𝑚0 ≤ min (0.75 𝑓𝑝𝑘; 0.85 𝑓𝑝0.1𝑘) (8.4.)
The stresses under those restrictions result from nonlinear staged analysis whose loads involved are
applied with their characteristic values. Only structure self-weight, equipment loads, and pre-stressing
loads are considered. No thermal actions during execution are considered in the analysis.

Design of a pre-stressed bridge deck with ultra-high performance concrete
56
8.3.2. SERVICE STAGE
The load combinations used for this study came from the most common combinations of actions for
road bridges in persistent design situations suggested by Designers’ Guide to Eurocode 1: Action on
Bridges [59]
These pair of fundamental combination of actions (Eq.8.5.) are used to perform ULS safety
verifications on shear and bending strength capacity of cross-sections.
𝐸𝑑 = 1.35 𝐺𝑘 + 𝑃𝑘 + {1.35 (𝑇𝑆 + 𝑈𝐷𝐿) + 1.5×0.6 𝑇𝑘
1.5𝑇𝑘 + 1.35 (0.75 𝑇𝑆 + 0.4 𝑈𝐷𝐿) (8.5.)
The characteristic (Eq.8.6.), frequent (Eq.8.7.) and quasi-permanent (Eq.8.8.) combination of actions
are used to verify serviceability limited state. All limit states during service stage are performed
assuming that has passed enough time to occur all pre-stress losses, thus, pre-stressing effects on the
structure (Pk) take into account those losses.
𝐸𝑑 = 𝐺𝑘 + 𝑃𝑘 + {(𝑇𝑆 + 𝑈𝐷𝐿) +×0.6 𝑇𝑘
𝑇𝑘 + (0.75 𝑇𝑆 + 0.4 𝑈𝐷𝐿) (8.6.)
𝐸𝑑 = 𝐺𝑘 + 𝑃𝑘 + {(0.75 𝑇𝑆 + 0.4 𝑈𝐷𝐿) +×0.5 𝑇𝑘
0.6 𝑇𝑘 (8.7.)
𝐸𝑑 = 𝐺𝑘 + 𝑃𝑘 + 0.5 𝑇𝑘 (8.8.)
Under characteristic load combination, three conditions related with concrete (Eq.8.9.), pre-stress
tendons (Eq.8.10.), and steel reinforcement (Eq.8.11.) must be respected. However, the verification of
steel reinforcement stresses may be neglected because it will be studied pre-stressed elements and,
consequently, lower tensions on reinforcement will occur. Furthermore, the E.8.11. is useless in
unbonded tendons solutions because they barely contribute to element stiffness and as result they do
not develop internal forces due to vertical loads. The frequent load combination would be useful
during cracking control verifications in case of bonded pre-stressing tendons. However, it is not used
because it is adopted external and unbonded pre-stressing solution. Finally, it is required to verify the
Eq.8.12. under quasi-permanent load combination.
𝜎𝑐 ≤ 0.6 𝑓𝑐𝑘 (8.9.)
𝜎𝑝 ≤ 0.7 𝑓𝑝𝑘 (8.10.)
𝜎𝑠 ≤ 0.8 𝑓𝑦𝑘 (8.11.)
𝜎𝑐 ≤ 0.45 𝑓𝑐𝑘 (8.12.)
And according to Christian Menn [52], the deflection in bridges should be restricted by the Eq.8.13..

Design of a pre-stressed bridge deck with ultra-high performance concrete
57
𝛿 <𝐿𝑠𝑝𝑎𝑛
750⁄ (8.13.)
8.4. CASE 0
8.4.1. OVERVIEW
This section aims to introduce the starting point of structural design of the Case 1 and Case 2.
Structural analysis is performed to know its internal forces for all load cases and combinations.
Additionally, limit states verifications are also performed. In Table 8.2. are defined the materials used
in the real project as well their grades.
Table 8.2. – Case 0 - Structural materials.
Material Structural Element Grade
Concrete Substructure C30/37
Superstructure C40/50
Steel Passive reinforcement A500 NR SD
Pre-stress strands Y 1860 S7
The development of materials properties is modeled for the staged construction analysis. That is only
considered for superstructure materials: pre-stress tendons and concrete C40/50. Some assumptions
are made to develop concrete model according to EN1992-1-1:
▪ Cement class: N;
▪ A mid-span cross-section (Fig.8.3.) (Ac=6.4048m2 and h0=345.6mm);
▪ Outdoor temperature (T) equals to 20ºC;
▪ Relative Humidity (RH) equals to 60%;
▪ Several ages of permanent loading for concrete members occur during staged
construction;
▪ Drying shrinkage starts at the time of formwork removal (ts=3days).
The diagrams illustrating time dependent properties during time can be found on appendix A.3.
Tendon relaxation is internally modeled by the software according to CEB-FIP 90 (unique possibility
provided by structural analysis software). The class of relaxation considered is class 2.
8.4.2. PRE-STRESS
From the existing execution project, it was gathered the following information:
▪ There are 6 pre-stressing tendons per web (Fig.8.19.) and they are tensioned with 6061kN
(1397MPa) each;
▪ There are 31 strands per tendon with 0.6’’ diameter which amounts 43.4 cm2 per tendon;
▪ The ducts have 120 mm diameter and they are grouted after tensioning, which must occur
after concrete reaches a minimum compressive strength of 30MPa;
▪ The steel has an elasticity modulus of 195GPa and low relaxation effects (Type R-2).

Design of a pre-stressed bridge deck with ultra-high performance concrete
58
Fig.8.19. - Case 0 - Tendons lay-out per web for a typical segment cast in each stage.
This information is used for structure numerical modeling. Other missing data which is relevant for
calculate short-term pre-stress losses are assumed as being:
▪ Friction coefficient - µ = 0.20;
▪ Wobble coefficient - k = 0.01 m-1;
▪ Anchorage set slip - Δs = 5 mm.
Elastic shortening and long-term pre-stress losses are implicit in the numerical calculation performed
by the structural analysis software. These losses are achieved through nonlinear staged construction
analysis and providing the materials with time dependent properties definitions (creep, shrinkage,
relaxation). This way of proceeding is possible by modeling pre-stress tendons as elements and not as
simply loads, otherwise, these losses should be hand calculated and then inputted on software.
If elastic shortening losses were considered, all the single tendons would have to be modeled as also
their staged tensioning sequence. For simplicity reasons, elastic shortening losses are not taken into
account because it is only modeled one equivalent tendon per web. So, the equivalent tendons are
modeled as they had been simultaneously tensioned until they attain 36366kN each (= 6 x 6061kN).
As aforementioned in load combinations during execution stage, is essential to know long-term pre-
stressing effects after all losses have occurred. In order to evaluate that, the strategy adopted was the
following:
▪ Add complete structure with 3 days of age;
▪ Tensioning all pre-stress tendons at the same age (t0=3days);
▪ Add permanent loads (dead load and RPL) at the same age (t0=3days);
▪ Perform a material non-linear analysis for 50 years;
▪ Remove permanent loads and output internal forces due to long-term pre-stress effects.
The resulting effects (Pk) at the end of that procedure are used to combine with the remaining effects
in each load combination.
8.4.3. RESULTS
The stresses envelope (Fig.8.20.) shows that all spans were under identical maximum stresses. It was
expected by knowing that every constructive stage follows the same tasks sequence during
constructive process. Consequently, a unique stage of the constructive process may represent all stages
so, for instance, 7th stage is analyzed task by task to know if compressive limit stress is respected. It is
known that concrete is firstly loaded at 3 days of age but the highest stresses may also occur for higher
concrete ages, thus, higher strength.

Design of a pre-stressed bridge deck with ultra-high performance concrete
59
Fig.8.20. - Case 0 - Stresses envelope during constructive process [kPa].
Tensile limit stress is respected (Table 8.3.) during constructive process. Between task 1 and 4 and at
the end of the task 6, the compressive limit stress assumed is not respected in the existing bridge. This
problem had already been identified in a previous study [60] and the author was informed that this
problem was noticed and properly solved before the execution. Additionally, the displacement of the
cantilever end is 10.7 cm.
Table 8.3. - Case 0 - Verification of stress limits during constructive process.
Task t tc
Maximum compressive stresses Maximum tensile stresses
Top Bottom 0.6 fck(tc) Top Bottom fctm(tc)
days days MPa MPa MPa MPa MPa MPa
1 109 3 14.3 18.2 12.4 - 0.6 2.09
2 109 3 14.2 18.2 12.4 - - 2.09
3 109 3 14.5 18.2 12.4 - 1.1 2.09
4 109 3 14.2 18.2 12.4 - - 2.09
5 124 18 10.0 17.3 22.3 - - 3.29
6 127 21 11.3 23.4 22.9 1.4 - 3.37
7 127 21 10 17.2 22.9 - - 3.37
Stresses on an equivalent tendon (6 real tendons in a single web) are evaluated right after the
tensioning procedure and, then, right after anchorage setting (Fig.8.21.).

Design of a pre-stressed bridge deck with ultra-high performance concrete
60
Fig.8.21. - Case 0 - Axial force installed in one equivalent tendon after friction losses (P0) and anchorage setting
(Pm0).
𝜎𝑝 =36.366 𝑀𝑁
6×43.33×10−4 𝑚2= 1399 𝑀𝑃𝑎 (< 𝜎𝑝,𝑚𝑎𝑥 = 1488 𝑀𝑃𝑎)
𝜎𝑝 =32.935 𝑀𝑁
6×43.33×10−4 𝑚2= 1267 𝑀𝑃𝑎 (𝜎𝑝,𝑚0 < 1395 𝑀𝑃𝑎)
The maximum compressive stress installed on concrete under characteristic load combination is
16.1MPa (Fig.8.22.) and it respects the limit defined by the Eq.8.12.. Still in the same load
combination, the maximum tensile stress installed in the tendons is 1130MPa which is under the limit
defined by equation.
Fig.8.22. - Case 0 - Stresses envelope under characteristic load combination [kPa].
𝜎𝑝 = 16.1 𝑀𝑃𝑎 (< 24 𝑀𝑃𝑎)
𝜎𝑝 = 1131 𝑀𝑃𝑎 (< 1395 𝑀𝑃𝑎)
36366
32935
0
5000
10000
15000
20000
25000
30000
35000
40000
0 10 20 30 40 50 60 70
P(x
) [k
N]
x [m]
Axial force installed in one equivalent tendon
P0(x) Pm0(x)

Design of a pre-stressed bridge deck with ultra-high performance concrete
61
The frequent load combination results show that occurs cracking on the concrete (Fig.8.23.). The crack
width should be determined and compared with the maximum admissible. However, it is not relevant
for the current work.
Fig.8.23. - Case 0 - Stresses envelope under frequent load combination [kPa].
The quasi-permanent load combination installs on the concrete a maximum compressive stress of
11.3MPa (Fig.8.24.) which is under the limit imposed by the Eq.8.9.. Furthermore, the decompression
restriction under this load combination is not verified. Lastly, the deflection is controlled either in end
or inner spans.
Fig.8.24. - Case 0 - Stresses envelope under quasi-permanent load combination [kPa]
To perform transversal analysis, it is modeled a single representative span with shell elements. In
addition to the permanent loads, traffic loads are included and placed in unfavorable positions to
aggravate transverse bending moments and shear forces. In Fig.8.25. tries to illustrate the model used
and, for instance, it is represented a deformed shape for a fundamental load combination with traffic
load arrangement corresponding to Fig.8.15. Additionally, in Fig.8.26. are shown the transverse
bending moments used to fulfill the bending moment field for Section 1 on following Table 8.4..

Design of a pre-stressed bridge deck with ultra-high performance concrete
62
Fig.8.25. - Deformed shape of a representative single span with shell elements under a fundamental load
combination.
Fig.8.26. - Transverse bending moment at mid-span on top slab under a fundamental load combination [kN.m/m].
So, three different ULS combinations are considered which correspond to the arrangements illustrated
in Fig.8.15., Fig.8.16., and Fig.8.17. where traffic load is the leading variable action. The maximum
internal forces (Table 8.4.) are calculated for three different places (Fig.8.27.), from now on referred as
Section 1, Section 2, and Section 3.
Fig.8.27. - Scheme illustrating where internal forces are measured

Design of a pre-stressed bridge deck with ultra-high performance concrete
63
Table 8.4. - Case 0 - Local maximum internal forces in the top slab.
Section 1 2 3
M [kN.m/m] -327 -152 +61
V [kN/m] 294 215 -
Conservatively, these internal forces correspond to maximum local values. However, it would be
acceptable to consider a resultant value of, for example, 2-m cut around the maximum value and
determine the average internal force per meter. This consideration is valid thanks to slabs capability of
transverse redistribution of internal forces. For that case, the maximum internal forces would be that in
Table 8.5..
Table 8.5 - Case 0 - Average internal forces along in a 2-m cut around the local maximum internal forces
Section 1 2 3
M [kN.m/m] -320 -100 +61
V [kN/m] 255 152 -
Now, in the longitudinal direction, the most conditioning internal forces (Table 8.6.) considered for
ULS occur near the piers and at mid spans.
Table 8.6. - Case 0 - Most governing global internal forces under fundamental load combination only containing
pre-stressing second order effects.
Section N [kN] M [kN.m] V [kN] T [kN.m]
Above the pier - -155657 13724 7450
Mid-span - +100128 - -
The truncated fields correspond to residual values. Notice that these results are based on the
consideration that pre-stressing tendons are exclusively considered to contribute to cross-section
strength, in ULS, meaning that only second order effects due to pre-stressing are considered acting on
the structure.
However, in case of external unbounded tendons, pre-stressing effects can be compared to a simple
load and it barely contributes to element strength. So, by considering this point of view, the ULS
internal forces on the structure are presented in Table 8.7.. These internal forces contain pre-stressing
effects on the structure, both isostatic and second order effects.
Table 8.7. - Case 0 - Most governing global internal forces under fundamental load combination containing pre-
stressing effects.
Section N [kN] M [kN.m] V [kN] T [kN.m]
Above the pier -45000 -97690 13380 7430
Mid-span -23267 57715 - -

Design of a pre-stressed bridge deck with ultra-high performance concrete
64
The ultimate capacity of the existing structure is also evaluated. Sectional analysis of CC elements is
performed with the same method that has been introduced for UHPC elements. Meaning that the
worksheet tool addressed in chapter 7 was adjusted to CC design code, EC2. The results are in the
following tables. The safety is checked as expected.
Table 8.8. - Case 0 - Bending capacity above the piers.
bw [m] Ac [m2] x [m] x/d εs [%] As [cm2] εp [%] Ap [cm2] ρ [%] Mrd [kN.m]
0.60 8.19 1.11 0.33 0.72 173 0.56 521 0.85 178039
Table 8.9. - Case 0 - Shear capacity above the pier.
bw,nom
[m]
Vrd,c,i
[kN]
Asw/s
[cm2/m]
Vrd,s,i
[kN]
Vrd,max,i
[kN]
Vrd,i
[kN]
Ved,V,i
[kN]
Ved,T,i
[kN]
Ved,Total,i
[kN]
0.48 1824 49 11186 10217 10217 6862 843 7705
Table 8.10. – Case 0 - Bending capacity at mid-span.
bw [m] Ac [m2] x [m] x/d εs [%] As [cm2] εp [%] Ap [cm2] ρ [%] Mrd [kN.m]
0.60 6.40 0.73 0.30 0.83 69 0.67 521 0.11 137711
8.5. CASE 1
8.5.1. OVERVIEW
This chapter aims to describe the process followed for the design of Río Cabriel Bridge with pre-
stressed UHPC. In the current study case, the superstructure is supposed to be materialized with
UHPC along its length, uniquely. Additionally, the superstructure is modeled with shell elements so
that an external pre-stressing solution can also be modeled. Furthermore, shell models do not require
adjustments on cross-section shape to include shear-lag effect because shell models can catch that
effect during numerical calculation. Finally, two simplified auxiliary models are developed to perform
transverse analysis of the cross-section and as well buckling analysis.
An observation about constructive process have to be mentioned. It is reasonable to assume that the
load of the fresh concrete that M70-S transfers to the structure may decrease while the cross-section
area decreases too. For that reason, that load variation is simply considered directly proportional to the
variation of the cross-section area during design.
Along design process, the minimum steel reinforcement necessary to verify safety conditions is
calculated for both bending and shear ultimate limit states. Moreover, a constant cross-section is
assumed in order to provide an expedite constructive processes. And finally, the substructure remains
equal to that in Case 0. The materials grade used for this specific case are in Table 8.11..

Design of a pre-stressed bridge deck with ultra-high performance concrete
65
Table 8.11. - Case 1 - Structural materials.
Material Structural Element Grade
Concrete Substructure C30/37
Superstructure UHPC150
Steel Passive reinforcement A500 NR SD
Pre-stress strands Y 1860 S7
8.5.2. PRE-STRESS
How it is already known, UHPC is a high cost material and, in order to reduce its consumption, it is
vital to reduce cross-section dimensions. For that reason, and considering the enhanced strength and
stiffness of the UHPC, a pre-stress solution with external tendons is assumed to this case study. It is
expected to achieve a lighter superstructure by decreasing webs thickness. In addition to diaphragms
above the piers, some more diaphragms are modeled at the anchorages and where the tendons deviate
so that the pre-stress loads can be effectively transferred to the superstructure. Tendons lay-out are
initially assumed having a polygonal theoretical configuration (Fig.8.28.).
Fig.8.28. - Case 1 - Initial tendons lay-out [m].
Between deviators and anchorages, the tendons are out of section and then they are unbonded. In
contrast, the tendons have compatibility of displacements in the deviators and anchorages. However,
that has no great impact on superstructure internal forces. Furthermore, the friction between tendons
and the deviators are neglected for short-term losses calculation. So, for the current case and Case 2,
the following parameters are assumed for the full length of the tendons:
▪ Friction coefficient - µ = 0;
▪ Wobble coefficient - k = 0 m-1;
▪ Anchorage set slip - Δs = 5 mm.
So, the short-term pre-stress losses occur only due to anchorage set slip and amounts:
∆𝜎𝑝 =0.005
70 200×103 = 14.3 𝑀𝑃𝑎
Consequently, the initial pre-stress force is governed by the allowed limit stress after short-term losses
(Eq.8.4.) have occurred. Which means the maximum stress during tensioning must be limited to:
𝜎𝑝,𝑚𝑎𝑥 = 𝜎𝑝𝑚0 + 14.3 = 0.75 ×1860 + 14.3 = 1409.3 𝑀𝑃𝑎

Design of a pre-stressed bridge deck with ultra-high performance concrete
66
8.5.3. DESIGN
The first step of design process is to calculate top slab thickness through ULS transverse analysis. The
internal forces used in the first iteration are in Table 8.4.. The procedure of designing included
reduction of slab thickness followed by flexural steel reinforcement design. Remember that an
example explaining this procedure is presented in the appendix A.4..
All the solutions (Table 8.12) have sufficient strength to verify safety conditions and they also have
enough ductility. Considering the amount of reinforcement and that cantilever self-weight is expected
to reduce, solution 3 is selected for Section 1 (Fig.8.27.). The cantilever end remains its actual
thickness of 0.20m.
Table 8.12 - Case 1 - First approach to assess minimum slab thickness on Section 1.
h [m] x [m] x/d εs [%]
As
[cm2/m] ρ [%]
Vrd,c
[kN/m]
Vrd,f
[kN/m]
Vrd,s
[kN/m]
Vrd,max
[kN/m]
Vrd
[kN/m]
1 0.35 0.06 0.19 0.5 11.2 0.32 532 821 0 4618 1353
2 0.30 0.05 0.19 0.6 18.3 0.61 446 734 0 4191 1180
3 0.25 0.04 0.20 0.8 27.8 1.11 360 628 0 3629 989
4 0.20 0.04 0.26 0.8 43.2 2.16 274 504 0 2875 779
In Table 8.13. are shown some possible solutions for Section 2. For the same reasons stated for
Section 1, it was selected the solution 3.
Table 8.13 - Case 1 - First approach to assess minimum slab thickness on Section 2.
h [m]
x
[m] x/d
εs
[%]
As
[cm2/m] ρ [%]
Vrd,c
[kN/m]
Vrd,f
[kN/m]
Vrd,s
[kN/m]
Vrd,max
[kN/m]
Vrd
[kN/m]
1 0.35 0.03 - - 0.0 0.00 532 509 0 3425 1041
2 0.25 0.04 0.18 0.5 6.4 0.25 360 564 0 3147 924
3 0.20 0.03 0.19 0.8 14.0 0.70 274 474 0 2691 749
4 0.15 0.03 0.26 0.8 27.6 1.84 189 355 0 1994 543
Finally, 3th solution could be adopted but solution 2 is selected (Table 8.14.) in order to have a
constant thickness. Additionally, that solution does not require no steel reinforcement to face positive
bending moments. Fig.8.29. illustrates the top slab geometry at this point of design.

Design of a pre-stressed bridge deck with ultra-high performance concrete
67
Table 8.14 - Case 1 - First approach to assess minimum slab thickness on Section 3.
h [m] x [m] x/d
εs
[%]
As
[cm2/m] ρ [%]
Vrd,c
[kN/m]
Vrd,f
[kN/m]
Vrd,s
[kN/m]
Vrd,max
[kN/m]
Vrd
[kN/m]
1 0.24 0.02 - - 0.0 0.00 343 291 0 2162 634
2 0.20 0.02 - - 0.0 0.00 274 357 0 2109 631
3 0.15 0.02 0.19 0.7 5.6 0.37 189 331 0 1835 520
4 0.10 0.02 0.35 0.5 20.3 2.03 103 205 0 1117 308
Fig.8.29. - Case 1 - Top slab solution [m].
During longitudinal analysis and design, girder depth is not going to be variable. It is assumed a
reasonable value for that which remains constant for all bridge length. It is estimated by relating deck
slenderness with existing UHPC box girders. As introduced in the State of the Art, the Batu 6 Bridge
spans 100 m with a cross-section depth of 4 m. Whereas PS34 Bridge, with a sectional depth of 1.63
m, spans 48 m. This means that the deck slenderness (length/depth) ranges between 25 and 30.
Moreover, those decks have widths of 5 and 4.4 meters, respectively. Another difference, when
compared with the case study bridge, is that those decks are simply supported. However, in the case
study bridge, the deck has 11 m width and, besides that, is continuously supported which may be an
advantage to mid span deflection and maximum bending moment values by reducing them.
Considering all just said, a sectional depth of 2.5 is assumed for the design. It means that the deck
slenderness is 28.
The bottom slab thickness is initially assumed as being 0.20 m and constant although it may be
conditioned by negative bending moments or instability above the piers. During ULS bending
calculations, it is conservatively assumed that top slab, including cantilevers, has a constant thickness
of 0.20 m.
The internal forces for longitudinal design are in table 8.7.. Firstly, the web thickness is iteratively
reduced while both bending (Table 8.15.) and shear strength verify safety conditions (Table 8.16.) in a
critical cross-section above the piers. Notice that the shear analysis is made for a single web with the
superposition of longitudinal shear and torsion effects. The thinnest web which respects the minimum
shear strength is in solution 5.

Design of a pre-stressed bridge deck with ultra-high performance concrete
68
Table 8.15 - Case 1 - First approach to assess minimum web thickness (flexural reinforcement).
bw [m] Ac [m2] x [m] x/d εs [%] As [cm2] ρ [%]
1 0.36 4.86 0.44 0.18 0.9 597 1.23
2 0.30 4.61 0.46 0.19 0.8 605 1.31
3 0.25 4.40 0.47 0.20 0.8 613 1.39
4 0.23 4.32 0.48 0.20 0.8 616 1.43
5 0.22 4.27 0.49 0.20 0.8 617 1.44
Table 8.16. - Case 1 - First approach to assess minimum web thickness (shear reinforcement).
Vrd,c,i
[kN]
Vrd,f,i
[kN]
Asw/s
[cm2/m]
Vrd,s,i
[kN]
Vrd,max ,i
[kN]
Vrd,i
[kN]
Ved,V,i
[kN]
Ved,T,i
[kN]
Ved,Total,i
[kN]
1 1756 552 31.9 5183 12787 7491 6690 801 7491
2 1476 470 34.0 5534 10594 7480 6690 790 7480
3 1239 401 35.9 5832 8788 7472 6690 782 7472
4 1144 383 36.5 5942 8075 7469 6690 779 7469
5 1096 373 36.9 5999 7719 7467 6690 777 7467
Additionally, table 8.17. shows the reinforcement solution for mid-span cross-section. This first
iteration on cross-section design concludes in the geometry illustrated in the Fig.8.30..
Table 8.17. - Case 1 - Assessment of longitudinal reinforcement at mid-span.
bw [m] Ac [m2] x [m] x/d εs [%] As [cm2] ρ [%]
0.22 4.27 0.08 0.04 5.2 363 0.85
Fig.8.30. - Case 1 - Cross-section solution.
A pre-stress solution still missing before running structural analysis with this new cross-section
geometry and material. The pre-stressing force after losses is estimated to avoid cracking under quasi-

Design of a pre-stressed bridge deck with ultra-high performance concrete
69
permanent combination. This means that tensile stresses are limited to mean limit of elasticity under
tension (fctm,el = 8MPa). Top fiber near the pier and bottom fiber at mid span were subjected to this
verification and the pre-stress solution after assuming 25% of total losses is:
▪ Pmax = 18151 kN
▪ Ap= 128.8 cm2 (92 strands)
With that pre-stress solution the deck remains uncracked in quasi-permanent load combination in both
top and bottom fibers. However, the deflection at mid span takes unacceptable values (10.8 cm). The
quantity of pre-stress is then governed by deflection limit. With the following quantity of pre-stress, it
was possible to reduce mid span deflection to 8.61 which is now acceptable (Eq.8.13.).
▪ Pmax = 26833 kN
▪ Ap = 190.4 cm2 (136 strands)
Two problems arise during the constructive process. First, the maximum tensile stress on top fibers is
not respected (Fig.8.31.). Second, the deflection at the cantilever end, before the tensioning process of
the following span, is approximately 20.3 cm for all stages. It is recommended that this displacement
may be as lower as possible, but a pre-camber may be foreseen to correct the final position of
cantilever end.
The characteristic compressive strength of UHPC at the age of 3 days amounts 84.65MPa, thus, the
compressive stress limit during execution is 50.79MPa. When compared with the maximum
compressive stress installed during execution (38.3MPa), it is possible to conclude that the
compressive stress limit is always respected.
Notice that there is a gap, or discontinuity, in the diagram where exists the constructive joint that
connects two adjacent segments which are casted at different times. That gap is exclusively a result
from numerical analysis considerations and does not represent the real response of the structure. That
happens because the cantilever end has no null deflection, therefore, it is not in the same position
where the following segment is added. Consequently, the software forces the continuity of
displacements at that joint by bring those adjacent cross-sections together.
Fig.8.31. - Case 1 - Stresses envelop during constructive process with a polygonal lay-out of tendons [kPa].
To face those issues during constructive process, additional pre-stressing tendons were designed in
order to compress and induce a positive bending moment in the cross-section near the piers. The aim is
to reduce top fiber tensile stresses during constructive process. At the same time, the deflection at the
end of the cantilever is also attenuated. The lay-out of the tendons is schematically illustrated in

Design of a pre-stressed bridge deck with ultra-high performance concrete
70
Fig.8.32. which includes the additional tendons with a total length of 40.83m. All tendons are
considered to be tensioned at the same time. The quantity of the additional pre-stressing is:
▪ Pmax = 36765kN
▪ Ap = 259cm2 (185 strands)
Fig.8.32. - Case 1 - External tendons lay-out [m].
8.5.4. RESULTS
The stresses control during constructive stage is similar with that described in Case 0. As it is shown
in Table 8.18., there is no crack formation due to both compressive and tensile stresses. Moreover, the
displacement at the end of the cantilever decreased to 14.0cm.
Table 8.18 - Case 1 - Stresses control during constructive stage.
Task t tc
Maximum compressive stresses Maximum tensile stresses
Top Bottom 0.6 fck(tc) Top Bottom fctm,el(tc)
days days MPa MPa MPa MPa MPa MPa
1 109 3 19.4 12.3 50.8 - - 2.18
2 109 3 18.2 12.3 50.8 - - 2.18
3 109 3 20.0 12.3 50.8 - 1.0 2.18
4 109 3 14.4 26.7 50.8 - - 2.18
5 124 18 14.4 26.7 87.3 - - 7.47
6 127 21 14.6 41.0 88.4 2.8 - 7.68
7 127 21 14.4 26.7 88.4 - - 7.68
NF P 18-710 does not require decompression verification for UHPC elements with unbonded tendons
and it only defines the maximum crack opening during quasi-permanent load combination. However,
the strategy is to avoid crack opening by limiting tensile stresses installed on structure. Therefore, no
crack opening calculations are necessary. Additionally, compressive limits (Eq.8.9.) are respected for
the quasi-permanent load combination either in the bottom and top fibers (Fig.8.33.). Furthermore, the
mid span deflection was reduced to 5.7cm.
The maximum stress installed in the tendons is 1200MPa and is under the limit admissible in
characteristic combination of loads (Eq.8.10.). Besides that, in the characteristic load combination,

Design of a pre-stressed bridge deck with ultra-high performance concrete
71
longitudinal cracking is avoided because compressive stresses (Fig.8.34.) are under the compressive
stress limit (Eq.8.12.).
Fig.8.33. - Case 1 - Stresses envelope under quasi-permanent load combination [kPa].
Fig.8.34. - Case 1 - Stresses envelope under characteristic load combination [kPa].
Then, it is described the ultimate limit state verifications and reinforcement design, first, in transverse
direction followed by longitudinal direction. The maximum internal forces with the updated slab
thickness have changed and are described in the Table 8.19..
Table 8.19. - Case 1 - Local maximum internal forces in the top slab.
Section 1 2 3
M [kN.m/m] -260 -127 +79
V [kN/m] 223 203 -
In Section 1, the slab thickness of 0.25 m leads to an acceptable reinforcement solution (Table 8.20.)
and also respects shear strength (notice, that this solution is the one that was used as practical example
in the Appendix A.4.). For the top inner slab, the thickness of 0.20 m leads to a satisfactory solution to
stand negative bending moments (Table 8.20.) but, the lower quantity of reinforcement to face positive
bending moment suggests that slab thickness could be reduced at mid-span of top slab (Table 8.22.).
However, no more optimization is going to be performed.

Design of a pre-stressed bridge deck with ultra-high performance concrete
72
Table 8.20. - Case 1 - Local verification of Section 1
h [m] x [m] x/d εs [%] As [cm2] ρ [%] Vrd,c
[kN/m]
Vrd,f
[kN/m] Vrd,s [kN/m]
Vrd,max
[kN/m] Vrd [kN/m]
0.25 0.04 0.19 0.78 19.6 0.78 360 611 0 3511 972
Table 8.21. - Case 1 - Local verification of Section 2
h [m] x [m] x/d εs [%] As [cm2] ρ [%] Vrd,c
[kN/m]
Vrd,f
[kN/m] Vrd,s [kN/m]
Vrd,max
[kN/m] Vrd [kN/m]
0.20 0.03 0.18 0.70 10.0 0.50 274 465 0 2611 739
Table 8.22. - Case 1 - Local verification of Section 3
h [m] x [m] x/d εs [%] As [cm2] ρ [%] Vrd,c
[kN/m]
Vrd,f
[kN/m]
Vrd,s
[kN/m]
Vrd,max
[kN/m] Vrd [kN/m]
0.20 0.03 0.18 0.52 2.3 0.11 274 426 0 2351 701
Table 8.23. contains the governing internal forces for global verifications.
Table 8.23. - Case 1 - Most governing global internal forces under fundamental load combination.
Section N [kN] M [kN.m] V [kN] T [kN.m]
Above the pier -52000 -98700 10950 8415
mid-span -22140 66000 - 4500
The solutions in the tables bellow fulfill safety requirements. Those internal forces lead to feasible
solutions of longitudinal reinforcement above the piers (Table 8.24. and Table 8.25.) and also in the
mid-span (Table 8.26. and Table 8.27.).
Table 8.24. - Case 1 - Assessment of longitudinal reinforcement at above the piers.
bw [m] Ac [m2] x [m] x/d εs [%] As [cm2] ρ [%]
0.22 4.27 0.61 0.26 0.6 577 1.35
Table 8.25. - Case 1 - Assessment of shear reinforcement above the piers.
Vrd,c,i
[kN]
Vrd,f,i
[kN]
Asw/s
[cm2/m]
Vrd,s,i
[kN]
Vrd,max ,i
[kN]
Vrd,i
[kN]
Ved,V,i
[kN]
Ved,T,i
[kN]
Ved,Total,i
[kN]
1126 493 29.1 4737 7809 6355 5475 880 6355

Design of a pre-stressed bridge deck with ultra-high performance concrete
73
Table 8.26. - Case 1 - Assessment of longitudinal reinforcement at mid-span.
bw [m] Ac [m2] x [m] x/d εs [%] As [cm2] ρ [%]
0.22 4.27 0.09 0.04 5.4 453 1.06
Table 8.27. - Case 1 - Assessment of shear reinforcement at mid-span.
Vrd,c,i
[kN]
Vrd,f,i
[kN]
Asw/s
[cm2/m]
Vrd,s,i
[kN]
Vrd,max ,i
[kN]
Vrd,i
[kN]
Ved,V,i
[kN]
Ved,T,i
[kN]
Ved,Total,i
[kN]
999 45 0.0 0 10095 1044 - 471 471
The purpose now is to know if local instability is conditioning in ULS. Once the design is done with
high compressive strength material, the structure elements are likely to be slenderer. May occur that
ULS is conditioned by buckling in turn of material strength.
First, a buckling analysis in ULS is performed to assess the stability of the bottom slab above the pier
during constructive process. The critical moment occurs after task 6 has completed (Fig.8.8.) where
the negative bending moment above the piers takes high values and the bottom flange is highly
compressed. The elasticity modulus at that moment had attained 44.5GPa. The critical segment was
modeled as a cantilever box girder beam. The first buckling mode occurred in the bottom slab near the
support (Fig.8.35.) as expected. The buckling factor of that mode is 9.9 which lead to conclude that the
ULS is governed by material strength capacity.
Fig.8.35. - Case 1 - Buckling mode during constructive process.
Second, a buckling analysis in ULS is performed to assess the stability during service stages. Again,
for simplicity, it was modeled a standard span clamped in both ends and no pre-stressing losses were
considered. It was expected to observe buckling modes on top slab at mid span and/or on bottom slab
near the supports. However, the first buckling mode points to a buckling factor of 11.6 and it seems to
be related to the a very high point load resulting from pre-stressing anchorage. Actually, that point
load does not exist because that tendon represents a set of cables which are supposed to be distributed.
The one that seems to be the first real buckling mode has a buckling factor of 13.4 and is associated
with instability of bottom slab near the pier (Fig.8.36.). Again, it can be concluded that the thickness
of structure members may be even more decreased if material strength allows it.

Design of a pre-stressed bridge deck with ultra-high performance concrete
74
Fig.8.36. - Case 1 - Buckling mode during service stage.
8.6. CASE 2
8.6.1. OVERVIEW
The purpose of this case is to design the deck with UHPC near the piers and the CC segment at mid
span where shear and bending forces take lower values. The reasoning is analogous to what happens
during lightened slabs design where a solid slab is designed near supports to resist high internal forces.
But, in this case, it would be the strength of the material changing instead of the cross-section. Again,
it is assumed a constant bridge deck geometry. So, Table 8.28. identifies the materials involved in this
case.
Table 8.28. - Case 2 - Structural materials.
Material Structural Element Grade
Concrete
Substructure C30/37
Superstructure UHPC150
C40/50
Steel Passive reinforcement A500 NR SD
Pre-stress strands Y 1860 S7
8.6.2. DESIGN
The thickness of the top slab is expected to be governed by ULS design in the deck part which is
casted with CC. By acknowledging that top slab thickness is mainly influenced by transverse internal
forces resulting from ULS, it is possible to conclude that, the existing solution (Case 0) for bridge
deck already has the solution of top slab thickness which is going to be used in this case (Fig.8.37.).
Then, it is going to be verified if that solution is admissible for longitudinal limit states.
Fig.8.37. - Case 2 - Top slab solution [m].

Design of a pre-stressed bridge deck with ultra-high performance concrete
75
Before going into the longitudinal analysis, the ULS internal forces are determined in the transverse
direction to check safety. Now, when determining internal forces, it is going to be considered a 2-m
edge around the maximum local value and estimate the average internal force per meter in that zone
(Table 8.5.). The strength is determined with the existing thicknesses and reinforcements. As can be
seen in Tables 8.29., 8.30., and 8.31., corresponding to Section 1, 2, and 3 (Fig.8.27.), the bending
strength is high enough to resist the ultimate bending moments. However, shear strength is under the
required in the cantilever part. That may be justified by overestimation of the shear forces and the
underestimation of the shear strength, respectively:
▪ The internal forces induced by the wheels of the tandem system that are closest to the
web may not enter thoroughly in the design values of shear forces because part of that
load is directly transferred to the support (web) by means of a compressed strut.
▪ The positive contribution to shear strength provided by the slope of the bottom face of the
cantilever is not being considered.
Table 8.29. - Bending and shear capacity of Section 1.
h [m] Mrd [kN.m/m] x [m] x/d εs [%] As [cm2] ρ [%] Vrd,c [kN] Vrd,max [kN] Vrd [kN]
0.35 323.07 0.05 0.17 1.8 25.8 0.74 166 1624 166
Table 8.30. - Bending and shear capacity of Section 2.
h [m] Mrd [kN.m/m] x [m] x/d εs [%] As [cm2] ρ [%] Vrd,c [kN] Vrd,max [kN] Vrd [kN]
0.35 323.07 0.05 0.17 1.8 25.8 0.74 166 1624 166
Table 8.31. - Bending and shear capacity of Section 3.
h [m] Mrd [kN.m/m] x [m] x/d εs [%] As [cm2] ρ [%] Vrd,c [kN] Vrd,max [kN] Vrd [kN]
0.24 83.72 0.02 0.10 3.4 10.1 0.42 123 1048 123
A cross-section depth of 2.5m is used which is justified by the same motivations mentioned in Case 1.
The final internal forces results from previous case are used to realize a preliminary design on the
material distribution along the bridge and the webs thickness. It is considered a valid start once that the
few differences that are expected to occur in internal forces are result of the increase of self-weight
due to the thickness of top slab and, maybe, due to the not so slender webs. Consequently, the solution
of pre-stressing lay-out may not change but additional pre-stressing force may be required to balance
the permanent load.
During 2nd stage, 1st task, it is installed in the bottom fiber of cantilever end a compressive stress of
14.1MPa (Fig.8.38.). It occurs when the CC only attained 20.72MPa of characteristic compressive
strength which means that compressive limit stress is 12.43MPa. That fact requires that UHPC must
go until 17.5m to the right side of each pier.

Design of a pre-stressed bridge deck with ultra-high performance concrete
76
Fig.8.38. - Case 2 - Longitudinal stresses on bottom fibers during 2nd stage, 1st task of constructive process [kPa].
During 2nd stage, 6th task (Fig.8.39.), the CC has attained 38.18MPa of characteristic compressive
strength, so, it is allowed to stand 22.9MPa in order to avoid longitudinal cracking. The compressive
stress installed on bottom fiber is lower than that limit at 23.23m away from the pier (P-2). This means
that between this cross-section and the pier, the deck must be casted with UHPC.
Fig.8.39. - Case 2 - Longitudinal stresses on bottom fibers during 2nd stage, 6th task of constructive process [kPa].
This reasoning concludes in a material distribution according with that illustrated in Fig.8.40..
Fig.8.40. - Case 2 - Material distribution along deck length [m].

Design of a pre-stressed bridge deck with ultra-high performance concrete
77
For this first iteration on longitudinal design, it is used the internal forces resulted from Case 1 with
the addition of internal forces at constructive joints at both right and left side of each pier (Table
8.32.).
Table 8.32. - Case 2 - Most governing global internal forces under fundamental load combination.
Section N [kN] M [kN.m] V [kN] T [kN.m]
Constructive joint (right) -17677 34363 4715 6694
Constructive joint (left) -17677 41756 4279 5923
Above the pier -52000 -98700 10950 8415
mid-span -17677 66000 - 4500
The CC is the weakest material at constructive joints, therefore, the verification of UHPC is
unnecessary. Thickness of the webs is going to be governed by CC in the constructive joint (right) or
by UHPC above the piers. First, the web thickness is going to be reduced at the constructive join and,
then, it is checked above the piers both bending (Table 8.33.) and shear capacity (Table 8.34.).
Table 8.33. - Case 2 - First approach to assess minimum web thickness (flexural reinforcement)
bw [m] Ac [m2] x [m] x/d εs [%] As [cm2] ρ [%]
1 0.36 5.40 0.15 0.06 6.3 351 0.65
2 0.30 5.16 0.15 0.06 6.3 351 0.68
3 0.25 4.95 0.15 0.06 6.3 351 0.71
4 0.22 4.83 0.15 0.06 6.3 351 0.73
Table 8.34. - Case 2 - First approach to assess minimum web thickness (shear reinforcement)
Vrd,c,i
[kN]
Asw/s
[cm2/m]
Vrd,s,i
[kN]
Vrd,max ,i
[kN]
Vrd,i
[kN]
Ved,V,i
[kN]
Ved,T,i
[kN]
Ved,Total,i
[kN]
1 704 19.0 3079 5081 3079 2358 721 3079
2 603 18.9 3070 4256 3070 2358 712 3070
3 516 18.9 3062 3563 3062 2358 705 3062
4 461 18.8 3058 3145 3058 2358 700 3058
The iteration stops here because is expected that structure self-weight will increase and, consequently,
shear force increases too. The web thickness used in the following steps is 0.25 m. In the left
constructive joint, the shear strength is enough and the reinforcement quantity is satisfactory, and
Tables 8.35. and 8.36. show right that. At mid-span, shear forces (Table 8.38.) do not constitute a
problem but the positive bending moment requires a high amount of steel reinforcement (Table 8.37.).
The maximum reinforcement ratio (4%) is respected but 1.36% may lead to an infeasible constructive
solution. However, the study is going to continue without any change on geometry or pre-stress

Design of a pre-stressed bridge deck with ultra-high performance concrete
78
solution. Above the piers, UHPC resists to internal forces with satisfactory quantity of steel
reinforcement both in the longitudinal direction (Table 8.39.) and in the transverse direction (Table
8.40.).
Table 8.35. - Case 2 - Bending capacity in the left constructive joint.
bw [m] Ac [m2] x [m] x/d εs [%] As [cm2] ρ [%]
0.25 4.95 0.16 0.07 5.7 427 0.86
Table 8.36. - Case 2 - Shear capacity in the left constructive joint.
Vrd,c,i [kN] Asw/s [cm2/m] Vrd,s,i [kN] Vrd,max ,i [kN] Vrd,i [kN] Ved,V,i [kN] Ved,T,i [kN] Ved,Total,i [kN]
516 17.0 2763 3563 2763 2140 623 2763
Table 8.37. - Case 2 - Bending capacity at mid-span.
bw [m] Ac [m2] x [m] x/d εs [%] As [cm2] ρ [%]
0.25 4.95 0.21 0.09 4.2 675 1.36
Table 8.38. - Case 2 - Shear capacity at mid-span.
Vrd,c,i [kN] Asw/s [cm2/m] Vrd,s,i [kN] Vrd,max ,i [kN] Vrd,i [kN] Ved,V,i [kN] Ved,T,i [kN] Ved,Total,i [kN]
516 0.0 0 3563 516 - 474 474
Table 8.39. - Case 2 - Bending capacity above the piers.
bw [m] Ac [m2] x [m] x/d εs [%] As [cm2] ρ [%]
0.25 4.95 0.64 0.27 0.5 611 1.23
Table 8.40. - Case 2 - Shear capacity above the piers.
Vrd,c,i
[kN]
Vrd,f,i
[kN]
Asw/s
[cm2/m]
Vrd,s,i
[kN]
Vrd,max ,i
[kN]
Vrd,i
[kN]
Ved,V,i
[kN]
Ved,T,i
[kN]
Ved,Total,i
[kN]
1245 589 27.83 4527 8934 6361 5475 886 6361
With the pre-design concluded, the deck geometry used to run the analysis is illustrated in the
Fig.8.41.. The change of the load that M70-S transfers to the bridge deck due to fresh concrete self-
weight is assumed to be proportional to the variation of the cross-section area. So, the load
corresponding to task 6 and 7 (Fig.8.8.) is now 2865kN.

Design of a pre-stressed bridge deck with ultra-high performance concrete
79
Fig.8.41. - Case 2 - Cross-section solution [m].
The same pre-stressing solution, lay-out and force, was used from Case 1 solution. The self-weight of
the superstructure naturally increased when compared with the solution of Case 1. However, the
solution of pre-stress of Case 1 have left room to increase superstructure self-weight without
disrespecting stresses and deflections limits in service stage and that was what happened.
In the other hand, during constructive process, undesirable tensile stresses occur in bottom fibers at
mid-span at the age of the concrete of 3 days which will cause crack opening. Those bottom fibers are
under tensile stresses for the quasi-permanent load combination, thus, those cracks still opened during
service stage and they may comprise serviceability behavior.
In order to solve this problem, the pre-stressing force of the tendons with polygonal layout is increased
to avoid cracking during constructive process. Then, the pre-stressing force in tendons with polygonal
lay-out totals:
▪ Pmax = 29596kN
▪ Ap= 210cm2 (150 strands)
And for the pre-stressing tendons disposed only near the piers, the amount is:
▪ Pmax = 36765kN
▪ Ap = 259cm2 (185 strands)
At this point it was possible to run analysis again with the cross-section proposed in the Fig.8.40., and
with the pre-stress solution, as aforementioned.
8.6.3. RESULTS
During construction stages, there is no stresses above the limits assumed, as is shown in Table 8.41.
for maximum compressive stresses, and in Table 8.42. for maximum tensile stresses. Those tables are
referred to stage 7 which is assumed to be representative of all other stages. Additionally, the
deflection of the cantilever end is 16.8 cm.

Design of a pre-stressed bridge deck with ultra-high performance concrete
80
Table 8.40 - Case 2 - Control of compressive stresses control during constructive stage.
Task t tc
C40/50 UHPC150
Top Bottom 0.6 fck(tc) Top Bottom 0.6 fck(tc)
days days MPa MPa MPa MPa MPa MPa
1 109 3 8.9 4.6 12.4 17.4 12.3 50.8
2 109 3 7.0 9.7 12.4 16.4 12.3 50.8
3 109 3 9.8 2.1 12.4 17.8 12.3 50.8
4 109 3 4.3 12.2 12.4 13.3 26.4 50.8
5 124 18 4.3 12.2 22.3 11.5 26.4 87.3
6 127 21 2.5 20.9 22.9 11.5 42.5 88.4
7 127 21 4.4 11.9 22.9 11.4 26.3 88.4
Table 8.42. - Case 2 - Control of tensile stresses control during constructive stage.
C40/50 UHPC150
Task t tc Top Bottom fctm(tc) Top Bottom fctm,el(tc)
days days MPa MPa MPa MPa MPa MPa
1 109 3 - - 2.09 - - 2.18
2 109 3 - - 2.09 - - 2.18
3 109 3 - 1.5 2.09 - - 2.18
4 109 3 - - 2.09 - - 2.18
5 124 18 - - 3.29 - - 7.47
6 127 21 2.1 - 3.37 4.5 - 7.68
7 127 21 - - 3.37 - - 7.68
During quasi-permanent load combination, all the deck remains uncracked and the creep effects may
be considered linear because of the maximum compressive stress is under the limit establish
(Eq.8.12.). The maximum compressive stresses installed in the concrete and UHPC are 8.2MPa and
26.4MPa (Fig.8.42.) which have as limits 18MPa and 67.5MPa, respectively. Moreover, the maximum
tensile stress verified does not induce cracking. The deflection limit established is also respected in
inner spans (8.0 cm) and end spans (3.5 cm).
Longitudinal crack opening is also controlled either in the concrete or in the UHPC. For the
characteristic load combination (Fig.8.43.), the maximum compressive stress in the concrete and in the
UHPC are 13.2MPa and 37.7MPa which have as limits 24MPa and 90MPa. Furthermore, the
maximum tensile stress in the tendons is 1272MPa which is under the limit established (Eq.8.10.).

Design of a pre-stressed bridge deck with ultra-high performance concrete
81
Fig.8.42. - Case 2 - Stresses envelope under quasi-permanent load combination [kPa]
Fig.8.43. - Case 2 - Stresses envelope under characteristic load combination [kPa].
In Table 8.43. are presented the internal forces required to evaluate the amount of reinforcement and
check safety conditions. These internal forces lead to reasonable reinforcement solutions for the CC
segment at constructive joints at the right (Tables 8.44. and 8.45.) and at the left side of the piers
(Tables 8.46. and 8.47.).
Table 8.43. - Case 2 - Most governing global internal forces under fundamental load combination.
Section N [kN] M [kN.m] V [kN] T [kN.m]
Constructive joint (right) -27115 31800 4932 6257
Constructive joint (left) -27115 38690 4494 5629
Above the pier -56867 -109601 10157 8014
Mid-span -27115 65975 - 4513

Design of a pre-stressed bridge deck with ultra-high performance concrete
82
Table 8.44. - Case 2 - Assessment of longitudinal reinforcement in the right constructive joint.
bw [m] Ac [m2] x [m] x/d εs [%] As [cm2] ρ [%]
0.25 4.95 0.19 0.08 4.8 339 0.69
Table 8.45. - Case 2 - Assessment of shear reinforcement in the right constructive joint.
Vrd,c,i [kN] Asw/s [cm2/m] Vrd,s,i [kN] Vrd,max ,i [kN] Vrd,i [kN] Ved,V,i [kN] Ved,T,i [kN] Ved,Total,i [kN]
687 19.2 3125 3788 3125 2466 659 3125
Table 8.46. - Case 2 - Assessment of longitudinal reinforcement in the left constructive joint.
bw [m] Ac [m2] x [m] x/d εs [%] As [cm2] ρ [%]
0.25 4.95 0.20 0.08 4.4 410 0.83
Table 8.47. - Case 2 - Assessment of shear reinforcement in the left constructive joint.
Vrd,c,i [kN] Asw/s [cm2/m] Vrd,s,i [kN] Vrd,max ,i [kN] Vrd,i [kN] Ved,V,i [kN] Ved,T,i [kN] Ved,Total,i [kN]
687 17.5 2840 3788 2840 2247 593 2840
However, the longitudinal reinforcement at mid span (Table 8.48.) may be restricted by constructive
constraints even knowing that the maximum quantity of longitudinal steel reinforcement is respected
(4%). There is no shear reinforcement needed (Table 8.49.) but the minimum quantity of that must be
respected for CC.
Table 8.48. - Case 2 - Assessment of longitudinal reinforcement at mid-span.
bw [m] Ac [m2] x [m] x/d εs [%] As [cm2] ρ [%]
0.25 4.95 0.29 0.12 2.8 693 1.40
Table 8.49. - Case 2 - Assessment of shear reinforcement at mid-span
Vrd,c,i [kN] Asw/s [cm2/m] Vrd,s,i [kN] Vrd,max ,i [kN] Vrd,i [kN] Ved,V,i [kN] Ved,T,i [kN] Ved,Total,i [kN]
687 0.0 0 3788 687 0 475 475
There is a problem with the reinforcement solution above the piers is related with lack of ductility. As
can be noticed in Table 8.50., the steel reinforcement yields (εs ≥ 0.217 %) almost when the cross-
section reaches its maximum bending strength. It could be achieved more ductility just by increasing
the bottom slab thickness, for instance, to 0.30 m. This would approximate the compression resultant
force to extreme fiber, and neutral axis too. With that, cross-section curvature in ULS would increase
and the strain of the reinforcement would also become higher. Other measure with the same effects

Design of a pre-stressed bridge deck with ultra-high performance concrete
83
would be the adoption of compressive steel reinforcement. In last case, superstructure depth should be
increased. Finally, with shear (Table 8.51.) there is no problems to be noticed.
Table 8.50. - Case 2 - Assessment of longitudinal reinforcement above the piers.
bw [m] Ac [m2] x [m] x/d εs [%] As [cm2] ρ [%]
0.25 4.95 1.09 0.46 0.217 683 1.38
Table 8.51. - Case 2 - Assessment of shear reinforcement above the piers.
Vrd,c,i
[kN]
Vrd,f,i
[kN]
Asw/s
[cm2/m]
Vrd,s,i
[kN]
Vrd,max ,i
[kN]
Vrd,i
[kN]
Ved,V,i
[kN]
Ved,T,i
[kN]
Ved,Total,i
[kN]
1265 1471 19.7 3210 9505 5947 5105 842 5947
The considerations described in Case 1, about buckling analysis, are also applied in this case on what
concerns assessment of the stability during constructive process and service stage. In first place,
during execution, the first buckling mode configuration is like the one occurred in Case 1 (Fig.8.44.)
but the correspondent buckling factor slightly increased to 10.0. Nevertheless, the result shows that
instability is unexpected during the constructive process.
Fig.8.44. - Case 2 - Buckling mode during constructive process.
In second place, during service stage, the first buckling mode configuration is an instability in the
bottom slab near the support (Fig.8.45.) where the axial and negative bending moments are high. This
time, that buckling mode has a slightly higher buckling factor of 13.7. One more time, there is no
instability problems conditioning the design.
Fig.8.45. - Case 2 - Buckling mode during service stage.

Design of a pre-stressed bridge deck with ultra-high performance concrete
84
8.7. COMPARATIVE ANALYSIS
8.7.1. SUBSTRUCTURE
By decreasing superstructures self-weight, it is understandable that substructure members like piers
and foundations may also have some reduction of volume once they are less loaded. At the Appendix
A.6. can be found the axial forces installed on piers base for each case and under quasi-permanent load
combination of actions (RPL and self-weight). In Table 8.52. is shown the relative variation of axial
force at piers base.
Table 8.52. - Variation of axial force at piers base when compared with Case 0.
Pier
ΔN
[%]
Case 1 Case 2
P1 -28.1 -20.6
P2 -22.9 -16.7
P3 -22.8 -16.7
P4 -23.0 -16.8
P5 -23.0 -16.8
P6 -23.2 -17.0
P7 -26.3 -19.2
Notice that not only vertical loads transferred to substructure may change. Lateral loads induced by
seismic action may also decrease. As superstructure mass decreases, the inertial forces resulting from
ground acceleration may also decrease. However, it is not that simple because natural frequency of the
structure is expected to become higher making the structure more susceptible develop higher
accelerations during seismic action. A better understanding of seismic action and its effects on
substructure, it is performed a modal analysis followed by a seismic analysis based on response
spectrum given by 1998-1 and considering that the piers are unchanged.
Square Root of the Sum of the Squares (SRSS) method is used to combine modal responses and
perform directional combination. The seismic action is defined according to EN 1998-2, with the
following parameters:
▪ Ground type B;
▪ Importance Class 1 (average importance);
▪ Behavior factor: q = 1;
▪ Both types of seismic actions are analyzed according to NP EN 1998-1
o Type 1 - Near Earthquake (Seismic Zone 1.4) with ground acceleration of 1.0 m/s2
o Type 2 - Distant Earthquake (Seismic Zone 2.4) with ground acceleration of 1.1 m/s2
▪ Equivalented viscous damping ratio for all modes of 0.05;
▪ Bridge mass defined by characteristic value of self-weight and characteristic value of
remaining permanent loads (RPL).

Design of a pre-stressed bridge deck with ultra-high performance concrete
85
Fig.8.46. shows the directions whose results are referred. Direction 3 corresponds to deck alignment
whereas direction 2 is transversally oriented. The global base reactions in the superstructure alignment
and in the perpendicular direction resulting from seismic action are detailed in the Appendix A.6.. It
can also be found there the base reactions for each pier, for each case study, and for each seismic
action. From those tables is possible to conclude that the bridge is more vulnerable to seismic type 1
which, by other words, induces higher internal forces than seismic type 2 does.
Fig.8.46. - Axis orientation regarding bridge alignment.
In Table 8.53. are described variations of the global base reactions. In a first approach, the results
referred to seismic type 1 in the direction 3 are quite unexpected but, if it is looked closer, easily is
understood why it has occurred.
Translation of bridge deck along its longitudinal axis alignment constitutes the first fundamental
dynamic mode of the structure and the unique contributing in that direction. For that mode, the period
of vibration is 3.52s for Case 0 and 2.98s for Case 1. Which means that for that dynamic mode and for
those, the corresponding accelerations (𝑎) are 0.33 m/s2 and 0.45 m/s2, respectively. Whereas the mass
(𝑀) of the structure has reduced 24%, the acceleration has increased 26%. Consequently, the seismic
action (𝑀×𝑎) barely does not change in that direction. The same reasoning is applied between Case 0
and Case 2. Nevertheless, piers should first be redesigned and then the modal and seismic analysis
should be repeated, because both mass and stiffness may reduce, and consequently the seismic action
too.
In seismic type 2, direction 3, the acceleration does not change and the equivalent seismic action relies
only on mass. In the other hand, the transverse direction (2) does not has a fundamental mode and the
seismic response results from the combination of several modes so, hand calculation may be more
complex.
Table 8.53. - Variation of global base reactions when compared with Case 0.
Case
Seismic type 1 Seismic type 2
ΔF3 ΔF2 ΔF3 ΔF2
% % % %
1 0.9 -14.6 -26.9 -14.4
2 -0.9 -8.0 -19.8 -7.7
Naturally, the same impact on internal forces of piers base is foreseen and described in tables 8.54. and
8.55.. There is a significant reduction on internal forces for seismic type 2 but the internal forces
resulting from seismic type 1 are the ones that count because are higher. For this last, only in
transverse direction is verified a general reduction of internal forces. Additionally, the shorter piers
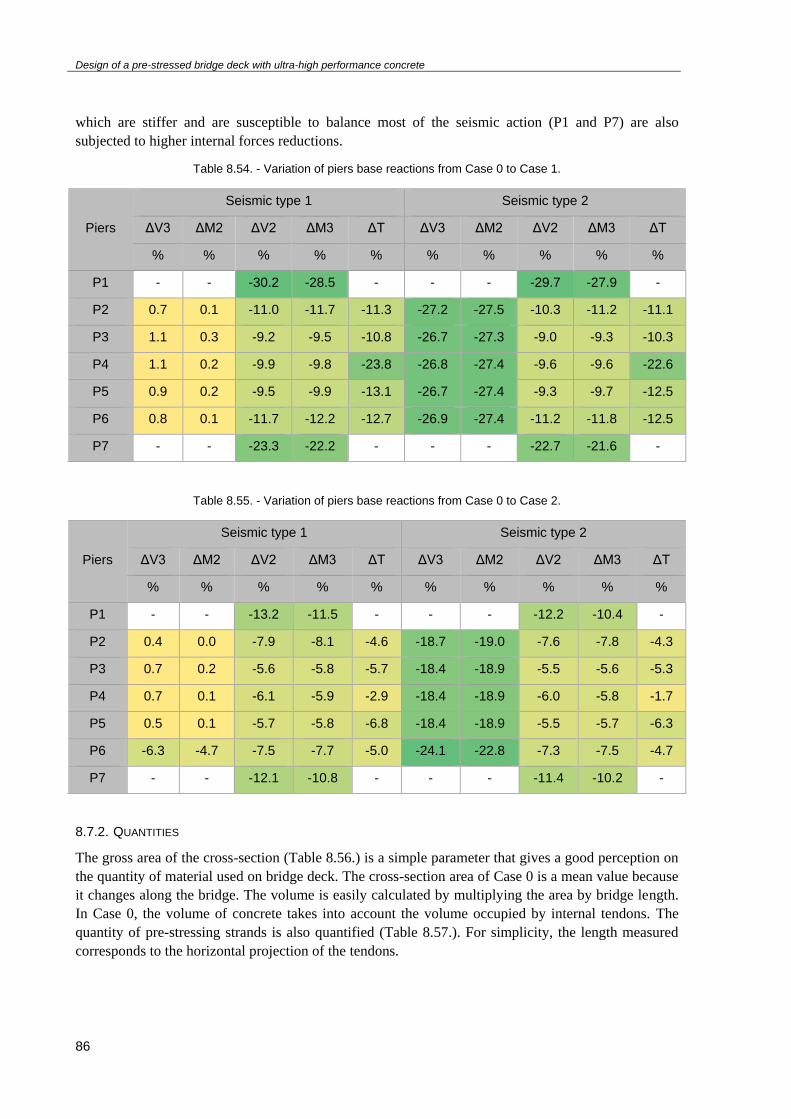
Design of a pre-stressed bridge deck with ultra-high performance concrete
86
which are stiffer and are susceptible to balance most of the seismic action (P1 and P7) are also
subjected to higher internal forces reductions.
Table 8.54. - Variation of piers base reactions from Case 0 to Case 1.
Piers
Seismic type 1 Seismic type 2
ΔV3 ΔM2 ΔV2 ΔM3 ΔT ΔV3 ΔM2 ΔV2 ΔM3 ΔT
% % % % % % % % % %
P1 - - -30.2 -28.5 - - - -29.7 -27.9 -
P2 0.7 0.1 -11.0 -11.7 -11.3 -27.2 -27.5 -10.3 -11.2 -11.1
P3 1.1 0.3 -9.2 -9.5 -10.8 -26.7 -27.3 -9.0 -9.3 -10.3
P4 1.1 0.2 -9.9 -9.8 -23.8 -26.8 -27.4 -9.6 -9.6 -22.6
P5 0.9 0.2 -9.5 -9.9 -13.1 -26.7 -27.4 -9.3 -9.7 -12.5
P6 0.8 0.1 -11.7 -12.2 -12.7 -26.9 -27.4 -11.2 -11.8 -12.5
P7 - - -23.3 -22.2 - - - -22.7 -21.6 -
Table 8.55. - Variation of piers base reactions from Case 0 to Case 2.
Piers
Seismic type 1 Seismic type 2
ΔV3 ΔM2 ΔV2 ΔM3 ΔT ΔV3 ΔM2 ΔV2 ΔM3 ΔT
% % % % % % % % % %
P1 - - -13.2 -11.5 - - - -12.2 -10.4 -
P2 0.4 0.0 -7.9 -8.1 -4.6 -18.7 -19.0 -7.6 -7.8 -4.3
P3 0.7 0.2 -5.6 -5.8 -5.7 -18.4 -18.9 -5.5 -5.6 -5.3
P4 0.7 0.1 -6.1 -5.9 -2.9 -18.4 -18.9 -6.0 -5.8 -1.7
P5 0.5 0.1 -5.7 -5.8 -6.8 -18.4 -18.9 -5.5 -5.7 -6.3
P6 -6.3 -4.7 -7.5 -7.7 -5.0 -24.1 -22.8 -7.3 -7.5 -4.7
P7 - - -12.1 -10.8 - - - -11.4 -10.2 -
8.7.2. QUANTITIES
The gross area of the cross-section (Table 8.56.) is a simple parameter that gives a good perception on
the quantity of material used on bridge deck. The cross-section area of Case 0 is a mean value because
it changes along the bridge. The volume is easily calculated by multiplying the area by bridge length.
In Case 0, the volume of concrete takes into account the volume occupied by internal tendons. The
quantity of pre-stressing strands is also quantified (Table 8.57.). For simplicity, the length measured
corresponds to the horizontal projection of the tendons.
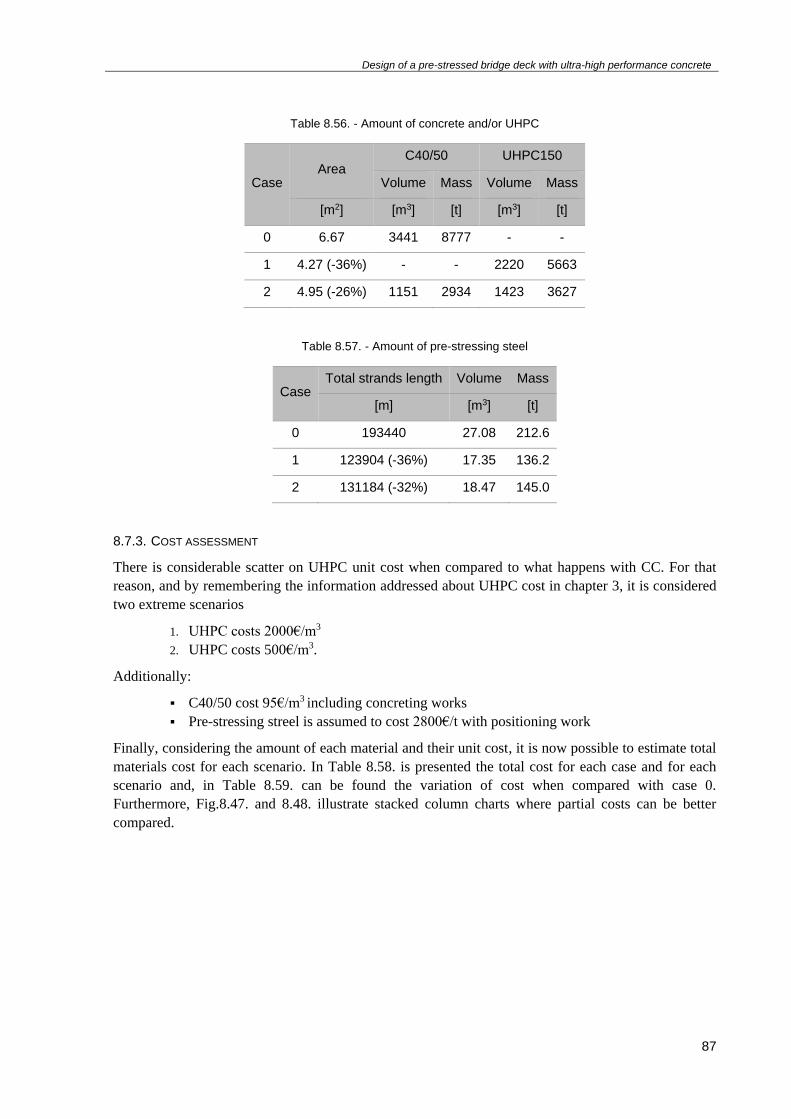
Design of a pre-stressed bridge deck with ultra-high performance concrete
87
Table 8.56. - Amount of concrete and/or UHPC
Case Area
C40/50 UHPC150
Volume Mass Volume Mass
[m2] [m3] [t] [m3] [t]
0 6.67 3441 8777 - -
1 4.27 (-36%) - - 2220 5663
2 4.95 (-26%) 1151 2934 1423 3627
Table 8.57. - Amount of pre-stressing steel
Case Total strands length Volume Mass
[m] [m3] [t]
0 193440 27.08 212.6
1 123904 (-36%) 17.35 136.2
2 131184 (-32%) 18.47 145.0
8.7.3. COST ASSESSMENT
There is considerable scatter on UHPC unit cost when compared to what happens with CC. For that
reason, and by remembering the information addressed about UHPC cost in chapter 3, it is considered
two extreme scenarios
1. UHPC costs 2000€/m3
2. UHPC costs 500€/m3.
Additionally:
▪ C40/50 cost 95€/m3 including concreting works
▪ Pre-stressing streel is assumed to cost 2800€/t with positioning work
Finally, considering the amount of each material and their unit cost, it is now possible to estimate total
materials cost for each scenario. In Table 8.58. is presented the total cost for each case and for each
scenario and, in Table 8.59. can be found the variation of cost when compared with case 0.
Furthermore, Fig.8.47. and 8.48. illustrate stacked column charts where partial costs can be better
compared.

Design of a pre-stressed bridge deck with ultra-high performance concrete
88
Table 8.58. - Total cost.
Case Scenario 1 Scenario 2
€ €
0 922108 922108
1 4824323 1492100
2 3360939 1226739
Table 8.59. - Variation of total cost when compared with Case 0.
Case Scenario 1 Scenario 2
% %
1 423 61
2 264 33
Fig.8.47. - Partial costs of scenario 1
Case 0 Case 1 Case 2
PS steel 595280 381360 406000
UHPC150 0 4442963 2845599
C40/50 326828 0 109340
0
1000000
2000000
3000000
4000000
5000000
6000000
Co
st [€
]
Scenario 1

Design of a pre-stressed bridge deck with ultra-high performance concrete
89
Fig.8.48. - Partial costs of scenario 2
Even though the amount of steel reinforcement for Case 1 and 2 was not counted, it is estimated how
much the steel rebar should be reduced to match the total cost of Case 0. The total amount of steel
reinforcement for the deck in the existing bridge is 410.6 t and the unit cost assumed for it is 750€/t,
including positioning works. Then, the total cost of steel rebar used on existing bridge deck (Case 0) is
307950€. Thus, in Table 8.60. is shown how much the total of steel rebar should cost, the
corresponding quantity, and the corresponding variation in order to satisfy the condition
aforementioned.
The negative values for cost and quantity means that even if the bridge deck had not steel rebar, it
would not be enough to match the cost of deck of Case 0. Only for Case 2 combined with scenario 2 it
would be hypothetically possible to match the cost of the existing deck.
Table 8.60. - Quantity of steel reinforcement allowed, per case, to match the total cost of existing bridge deck.
Case
Scenario 1 Scenario 2
Total Cost Quantity ΔQuantity Total Cost Quantity ΔQuantity
€ t % € t %
1 -3594265 -4792 -1267 -262043 -349 -185
2 -210881 -2841 -792 3318 4.42 -99
Case 0 Case 1 Case 2
PS steel 595280 381360 406000
UHPC150 0 1110741 711400
C40/50 326828 0 109340
0
200000
400000
600000
800000
1000000
1200000
1400000
1600000
Co
st [€
]
Scenario 2

Design of a pre-stressed bridge deck with ultra-high performance concrete
90

Design of a pre-stressed bridge deck with ultra-high performance concrete
91
9
CONCLUSION
1.1. DISCUSSION
Concrete have been improved during decades in order to increase its performance and a formulation
for that material have been stabilized since twenty years ago. That formulation is referred to UHPC
and its high-performance characteristics are related to ductility, compressive strength and durability,
mainly. However, its high raw materials cost and restrict conditions during production make it difficult
to compete against CC. Nevertheless, it has been applied in several bridges while proper design codes
have been developed. Initially there was only recommendations and guidelines supporting the
designers but at the moment of this study, there is design codes addressing almost the same matters
that reinforced CC structures codes do. It is the case of French national annex to EC2, NF P 18-710
and which was used during the study case.
A brief review on internal and external pre-stressing solutions showed that the last may permit reduce
web thickness and short-term pre-stress losses. However, the tendons contribution to stiffness and
strength is negligible. Also, an overview on constructive methods able to be used on case study bridge
was made with more focus on Movable Scaffolding System (MSS) which was used to execute Río
Cabriel Bridge. The concluding remark of this chapter was that constructive staged analysis and the
resulting internal forces must be considered at the moment of design. Essentially because the structure
changes during time, equipment loads, and finally internal forces redistribution due to viscoelasticity.
About the case study itself, it was possible conclude the following:
▪ In contrast with the real project (Case 0), the design of both Case 1 and Case 2 respect
compressive stress limit during constructive process;
▪ The loads imposed by constructive equipments to the structure are reduced as result of the
decrease of fresh material that the equipment must support. Regardless, the constructive
process remained with major influence on structure design;
▪ It is possible to decrease the top slab thickness while maintaining the transverse bending
moment reinforcement ratio and without include shear reinforcement. In fact, shear
strength is far away of being the internal force governing slab thickness;
▪ It is verified an important contribution of steel fibers to shear and bending strength in slab
elements;
▪ In one hand, it is possible to decrease webs thickness up to 63% (Case 1) by using
external pre-stress solution. In the other hand, more quantity of passive steel
reinforcement in longitudinal direction in needed because pre-stress tendons are no longer
contributing to cross-section strength;

Design of a pre-stressed bridge deck with ultra-high performance concrete
92
▪ The safety is governed by material strength and instead of instability issues despite the
elements slenderness;
▪ Lower amount of cementitious composite material in both cases studied, less 36% for
Case 1 and less 26% for Case 2;
▪ Lower amount of pre-stressing tendons in both cases studied. In the Case 1 that quantity
is reduced 36% whereas in the case 2 it is reduced 32%;
▪ Substructure ends up being less loaded, naturally. The axial force on piers base is
generally reduced by 25% in Case 1 and 17% in Case 2;
▪ Equivalented seismic action did not decrease as much as expected, considering the
superstructure mass reduction. Despite mass reduction, equivalent seismic action along
bridge alignment barely does not changed because acceleration has increased. In
transverse direction, the seismic action was reduced by 14.6 % for Case 1 and 8% for
Case 2;
▪ The large range of unit cost of UHPC material leads to high scatter on bridge deck total
cost and, under those circumstances, it is difficult to achieve precise conclusions about
economic feasibility. However, the solutions proposed in Case 1 and 2 are economically
infeasible regardless the UHPC cost scenario.
▪ The best-case scenario occurs when UHPC costs 500€/m3 and it is adopted a mix solution
of UHPC and CC for bridge deck design (Case 2). The total cost increased 33% when
compared with actual bridge deck (Case 0).
▪ Still in that case scenario, it would be needed almost total reduction (-99%) of steel
reinforcement amount on bridge deck which is impossible is both cases studies.
One final note about steel reinforcement in UHPC elements. In 2nd chapter were introduced cases
where passive steel reinforcement is not needed. In the case study performed it was concluded that in
the longitudinal direction, due to external pre-stressing solution, the amount of flexural reinforcement
is higher than in the real bridge. In the other hand, shear reinforcement decreased. The EC2 requires
minimum shear reinforcement, minimum bending reinforcement, distribution reinforcement in slabs,
and minimum steel reinforcement to control cracks. Those minimum quantities may have high impact
on total steel rebar used in a bridge. However, NF P18-710 states that all of those minimum quantities
are no more applicable to UHPC structures and, consequently, it can be a great aspect to take
advantage of.
Finally, the design developed along this study has not included sophisticated optimization of the
solution and much other variables that may change and influence economic feasibility assessment are
not considered. As could be seen, and considering the particular circumstances in which the study was
done regarding the span length, cross-section type, and constructive method, it is concluded that a
superstructure solution that makes use of UHPC as main structural element (Case 1) or even combined
with CC, in the way it was done in Case 2, is economically infeasible.
1.2. RECOMMENDATIONS FOR FURTHER RESEARCH
In the point of view of the author, studies about the design of bridges with UHPC should continue.
With the steel and conventional concrete, it is possible to design different and uncountable of solutions
for bridges. With this new material, UHPC, more solutions may arise and some of them may be even
better than those first mentioned. To evaluate that, the author recommends future research, in first
place, on continuing the study that has been done with this Río Cabriel Bridge:
▪ Perform deeper optimization of cross-section geometry;

Design of a pre-stressed bridge deck with ultra-high performance concrete
93
▪ Test different solutions of pre-stress and the corresponding lay-out;
▪ Study the impact the usage of UHPC has on constructive equipment and the changes that
may occur in the construction schedule;
▪ Design and quantify steel reinforcement;
▪ Design of substructure with CC and/or UHPC considering the decreasing of internal
forces.
And in second, extend the study to other type of bridge projects where UHPC is expected to become
profitable either as a main structural material or not.

Design of a pre-stressed bridge deck with ultra-high performance concrete
94

Design of a pre-stressed bridge deck with ultra-high performance concrete
95
REFERENCES
[1] AFGC, Bétons fibrés à ultra-hautes performances–Recommandations, in Recommandations.
2013.
[2] Standardization, E.C.f., Eurocode 1: Actions on structures - Part 2: Traffic loads on bridges
2003.
[3] Engineers, J.S.o.C., Recommendations for Design and Construction of High Performance Fiber
Reinforced Cement Composites with Multiple Fine Cracks. 2008.
[4] Qualidade, I.P.d., NP EN1991 - Acções em estruturas - Parte 1-5: Acções gerais - Acções
térmicas. 2009.
[5] Magalhães, F., Influence of the construction phases on the bridges forces and stresses, in
Redistribution of bridges forces and stresses. 2015.
[6] AFNOR, Calcul des structures en béton – Règles spécifiques pour les bétons fibrés à ultra-hautes
performances in Complément national à l'Eurocode 2. 2016: France.
[7] Hajar, Z., et al. Design and construction of the world first ultra-high performance concrete road
bridges. in Proceedings of the International Symposium on Ultra High Performance Concrete.
Kassel, Germany. 2004.
[8] Fehling, E., T. Leutbecher, and K. Bunje. Design relevant properties of hardened ultra high
performance concrete. in Proceedings of the International Symposium on Ultra High
Performance Concrete. Kassel, Germany. 2004.
[9] Graybeal, B.A. and F. Baby, Development of Direct Tension Test Method for Ultra-High-
Performance Fiber-Reinforced Concrete. ACI Materials Journal, 2013. 110(2).
[10] Costa, A., Estruturas de Betão II, in Folhas de apoio às aulas. 2013, Departamento de
Engenharia Civil e Arquitetura: Instituto Superior Técnico de Lisboa.
[11] Delauzun, O., et al., Construction of the PS34 UHPFRC bridge. Designing and building
withUHPFRC, 2011: p. 137-148.
[12] Amorim, M., Estudo do tabuleiro de um viaduto de betão pré-esforçado construído tramo a
tramo com vãos de 90m, in Engenharia Civil. 2008, Universidade do Porto: Faculdade de
Engenharia da Universidade do Porto.
[13] Manterola, J., Puentes : apuntes para su diseño, cálculo y construcción. Vol. II. 2006, Madrid:
Colegio de Ingenieros de Caminos, Canales y Puertos.

Design of a pre-stressed bridge deck with ultra-high performance concrete
96
[14] Endicott, W.A., A Whole New Cast, in ASPIRE. 2007, Precast/Prestressed Concrete Institute,
James G. Toscas, President. p. 26-29.
[15] Gowripalan, N. and R. Gilbert, Design Guidelines for Ductal Prestressed Concrete Beams.
Design Guide. Civil & Environmental Engineering School, University of NSW, Sydney,
Australia, 2000.
[16] Uchida, Y., et al. Outlines of" Recommendations for Design and Construction of Ultra High
Strength Fiber Reinforced Concrete Structures" by JSCE. in International RILEM Workshop on
High Performance Fiber Reinforced Cementitious Composites in Structural Applications. 2006.
RILEM Publications SARL.
[17] Stráský, J. The power of prestressing. in Role of Concrete Bridges in Sustainable Development:
Proceedings of the International Symposium held at the University of Dundee, Scotland, UK on
3–4 September 2003. 2003. Thomas Telford Publishing.
[18] Behloul, M. and R. Ricciotti. Footbridge of Peace–Seoul. in Role of Concrete Bridges in
Sustainable Development: Proceedings of the International Symposium. 2003. University of
Dundee, Scotland, UK Thomas Telford Publishing.
[19] Blais, P.Y. and M. Couture, Precast, prestressed pedestrian bridge: World's first Reactive
Powder Concrete structure. PCI journal, 1999. 44(5): p. 60-71.
[20] Roy, D.M., G. Gouda, and A. Bobrowsky, Very high strength cement pastes prepared by hot
pressing and other high pressure techniques. Cement and Concrete Research, 1972. 2(3): p. 349-
366.
[21] Yudenfreund, M., I. Odler, and S. Brunauer, Hardened portland cement pastes of low porosity I.
Materials and experimental methods. Cement and Concrete Research, 1972. 2(3): p. 313-330.
[22] Birchall, J., A. Howard, and K. Kendall, Flexural strength and porosity of cements. Nature, 1981.
289(5796): p. 388-390.
[23] Bache, H.H., Densified cement ultra-fine particle-based materials. 1981, Aalborg, Portland.
[24] Richard, P. and M. Cheyrezy, Composition of reactive powder concretes. Cement and concrete
research, 1995. 25(7): p. 1501-1511.
[25] Fehling, E., et al., Ultra-High Performance Concrete UHPC: Fundamentals, Design, Examples.
2014: John Wiley & Sons.
[26] Orgass, M. and Y. Klug. Fibre reinforced ultra-high strength concretes. in Proceedings of the
International Symposium on Ultra High Performance Concrete. Kassel, Germany. 2004.
[27] Russell, H.G., et al., Ultra-high performance concrete : a state-of-the-art report for the bridge
community. 2013, McLean, VA: U.S. Department of Transportation, Federal Highway

Design of a pre-stressed bridge deck with ultra-high performance concrete
97
Administration, Research, Development, and Technology, Turner-Fairbank Highway Research
Center. vii, 163 pages.
[28] Thibaux, T., UHPFRC Development: The Experience of BSI® Applications. Designing and
Building with UHPFRC, 2010: p. 63-76.
[29] AFGC, S., Bétons fibrés à ultra-hautes performances, in Recommandations provisoires. 2002.
[30] AFGC, S., Bétons fibrés à ultra-hautes performances–Recommandations, in Recommandations.
2013.
[31] Kim, B., et al. R&D activities and application of ultra high performance concrete to cable-stayed
bridges. in Proceedings of Hipermat 2012 3rd International Symposium on UHPC and
Nanotechnology for High Performance Construction Materials, Kassel University Press, Kassel.
2012.
[32] Voo, Y.L., S.J. Foster, and C.C. Voo, Ultrahigh-performance concrete segmental bridge
technology: Toward sustainable bridge construction. Journal of Bridge Engineering, 2014. 20(8):
p. B5014001.
[33] Tanaka, Y., et al. Design and construction of Sakata-Mirai footbridge using reactive powder
concrete. in Proceedings of the 1st fib Congress. 2002.
[34] Voo, Y.L. and S.J. Foster, Design and Construction of the 100 metre Span UHPC Batu 6
Segmental Box Girder Bridge, in Proceedings of Hipermat 2016 - 4th International Symposium
on Ultra-High Performance Concrete and High Performance Construction Materials Kassel.
2016, Kassel University Press: Kassel, Germany.
[35] Strunge, J. and T. Deuse. Special cements for ultra high performance concrete. in Proceedings of
the Second International Symposium on UHPC, Kassel, Germany. 2008.
[36] Camacho, E., J.Á. López, and P.S. Ros. Definition of three levels of performance for UHPFRC-
VHPFRC with available materials. in Proceedings of Hipermat 2012 3rd International
Symposium on UHPC and Nanotechnology for High Performance Construction Materials, Kassel
University Press, Kassel. 2012. kassel university press GmbH.
[37] Heinz, D., L. Urbonas, and T. Gerlicher. Effect of heat treatment method on the properties of
UHPC. in Proceedings of Hipermat 2012 3rd International Symposium on UHPC and
Nanotechnology for High Performance Construction Materials, Kassel University Press, Kassel.
2012.
[38] Schröfl, C., M. Gruber, and J. Plank, Preferential adsorption of polycarboxylate superplasticizers
on cement and silica fume in ultra-high performance concrete (UHPC). Cement and Concrete
Research, 2012. 42(11): p. 1401-1408.
[39] Hirschi, T. and F. Wombacher. Influence of different superplasticizers on UHPC. in Proceedings
of the Second International Symposium on UHPC, Kassel, Germany. 2008.

Design of a pre-stressed bridge deck with ultra-high performance concrete
98
[40] Engineers, J.S.o.C., JSCE Guidelines for Concrete No.9, in Recommendations for Design and
Construction of Ultra High Strength Fiber Reinforced Concrete Structures (draft). 2006.
[41] Resplendino, J., Introduction: What is a UHPFRC? Designing and Building with UHPFRC,
2011: p. 3-14.
[42] Graybeal, B., Ultra-high performance concrete. 2011.
[43] Mazanec, O., D. Lowke, and P. Schießl, Mixing of high performance concrete: effect of concrete
composition and mixing intensity on mixing time. Materials and structures, 2010. 43(3): p. 357-
365.
[44] Yang, S. and B. Diao, Influence of curing regime on the ductility of ultra-high performance fiber
reinforced concrete (UHPFRC), in ICCTP 2009: Critical Issues In Transportation Systems
Planning, Development, and Management. 2009. p. 1-7.
[45] Habel, K., et al., Development of the mechanical properties of an ultra-high performance fiber
reinforced concrete (UHPFRC). Cement and Concrete Research, 2006. 36(7): p. 1362-1370.
[46] AFNOR, Bétons fibrés à Ultra Hautes Performances - Spécification, performance, production et
conformité, in Bétons. 2016: France.
[47] des Architectes, Société S.des Ingénieurs e., Béton fibré ultra-performant (BFUP) - Matériaux,
dimensionnement et exécution, in prSIA 2052 :2014-04. 2014.
[48] Wille, K. and B. Graybeal, Development of Non-Proprietary Ultra-High Performance Concrete
for Use in the Highway Bridge Sector. 2013.
[49] G.tecz, Quantz®- The Next Generation of cement bonded materials! Kassel.
[50] Ductal. UHPC Standards & Recommendations. 2017 16-06-2017]; Available from:
http://www.ductal.com/en/architecture/uhpc-standards-recommendations.
[51] Naaman, A.E., Prestressed concrete analysis and design: fundamentals. 1982: McGraw-Hill New
York.
[52] Menn, C., Prestressed concrete bridges. 2012: Birkhäuser.
[53] Naaman, A.E. and J.E. Breen. External prestressing in bridges. 1990. American Concrete
Institute.
[54] Powell, L., J.E. Breen, and M.E. Kreger, State of the Art Externally Post-tensioned Bridges with
Deviators. 1988: The Center.
[55] Pacheco, P., et al. A new concept of overhead movable scaffolding system for bridge construction.
in IABSE Symposium Report. 2008. International Association for Bridge and Structural
Engineering.

Design of a pre-stressed bridge deck with ultra-high performance concrete
99
[56] Pacheco, P., et al., Technical challenges of large movable scaffolding systems. Structural
Engineering International, 2011. 21(4): p. 450-455.
[57] Hendy, C.R. and D.A. Smith, Designers' Guide to EN 1992-2: Eurocode 2: Design of Concrete
Structures. Concrete bridges. 2007: Thomas Telford.
[58] Yoo, D.-Y. and Y.-S. Yoon, Structural performance of ultra-high-performance concrete beams
with different steel fibers. Engineering Structures, 2015. 102: p. 409-423.
[59] Calgaro, J.-A., M. Tschumi, and H. Gulvanessian, DESIGNERS'GUIDE TO EUROCODE 1:
ACTIONS ON BRIDGES: EN 1991-2, EN 1991-1-1,-1-3 TO-1-7 AND EN 1990 ANNEX A2.
2010: Thomas Telford Ltd.
[60] Alves, G.C., Determinação de esforços em tabuleiros de pontes de betão armado contruídos
tramo a tramo - Estudo de um caso concreto, in Engenharia Civil. 2009, Universidade do Porto:
Faculdade de Engenharia p. 157.

Design of a pre-stressed bridge deck with ultra-high performance concrete
100

Design of a pre-stressed bridge deck with ultra-high performance concrete
101

Design of a pre-stressed bridge deck with ultra-high performance concrete
102

Design of a pre-stressed bridge deck with ultra-high performance concrete
Versão para discussão
A
APPENDICES
A.1. INDICATIVE VALUES FOR UHPC PROPERTIES ................................................................................. 1
A.2. UHPC150 - TIME DEPENDENT PROPERTIES ................................................................................. 3
A.3. C40/50 - TIME DEPENDENT PROPERTIES ...................................................................................... 5
A.4. ULS SECTIONAL ANALYSIS ............................................................................................................ 7
A.5. CONSTRUCTIVE SCHEDULE .......................................................................................................... 13
A.6. INTERNAL FORCES IN THE SUBSTRUCTURE ................................................................................. 15

Design of a pre-stressed bridge deck with ultra-high performance concrete

Design of a pre-stressed bridge deck with ultra-high performance concrete
1
A.1. INDICATIVE VALUES FOR UHPC PROPERTIES
A.1.1. FOREWORD
NF P 18-710 provides some indicative values and models of UHPC properties in its appendix T. This
information is intended to be used by designers in preliminary studies due to inexistence of
characterization tests and identity card of the material. Only relevant information for this work is
herein summarized.
A.1.2. MECHANICAL PROPERTIES
Elasticity Modulus 𝐸𝑐𝑚 45 – 65 GPa
Characteristic compressive strength 𝑓𝑐𝑘 150 – 200 MPa
Mean compressive strength 𝑓𝑐𝑚 160 – 230 MPa
Characteristic limit of elasticity under tension 𝑓𝑐𝑡𝑘,𝑒𝑙 7.0 – 10.0 MPa
Mean limit of elasticity under tension 𝑓𝑐𝑡𝑚,𝑒𝑙 8.0 – 12.0 MPa
Characteristic maximal post-cracking stress 𝑓𝑐𝑡𝑓𝑘 6.0 – 10.0 MPa
Mean maximal post-cracking stress 𝑓𝑐𝑡𝑓𝑚 7.0 – 12.0 MPa
Fibers length 𝐿𝑓 12 – 20 mm
Global fiber orientation factor 𝐾𝑔𝑙𝑜𝑏𝑎𝑙 1.25
Local Fiber orientation factor 𝐾𝑙𝑜𝑐𝑎𝑙 1.75
Thermal expansion coefficient 𝛼𝑡 11 µm/m/ºC
Crack opening corresponding to local peak 𝑤𝑝𝑖𝑐 0.3
Mean post-cracking stress corresponding to a crack with of 0.01H 𝑓𝑐𝑡𝑓1% 0.8 𝑓𝑐𝑡𝑓𝑘
A.1.3. SHRINKAGE
𝜀𝑐𝑎 =
{
0,
𝑓𝑐𝑚(𝑡)
𝑓𝑐𝑘< 1
𝛽𝑐𝑎 [1 − 𝑒−𝑡𝜏𝑐𝑎] 10−6,
𝑓𝑐𝑚(𝑡)
𝑓𝑐𝑘> 1
𝜀𝑐𝑑 =𝐾[80 − 𝑅𝐻](𝑡 − 𝑡𝑠)10
−6
(𝑡 − 𝑡𝑠) + 𝛽𝑐𝑑 ℎ02
𝛽𝑐𝑎 300 – 600 µm/m
𝜏𝑐𝑎 100 days
𝛽𝑐𝑑 0.003 – 0.01 days/mm2
K 5

Design of a pre-stressed bridge deck with ultra-high performance concrete
2
A.1.4. CREEP
𝜑𝑏(𝑡, 𝑡0) = 𝛽𝑏𝑐1 𝜑𝑏0√𝑡 − 𝑡0
√𝑡 − 𝑡0 + 𝛽𝑏𝑐
𝛽𝑏𝑐 = 𝛽𝑏𝑐2 𝑒2.8
𝑓𝑐𝑚(𝑡0)𝑓𝑐𝑘
𝜑𝑏0 =3.6
𝑓𝑐𝑚(𝑡0)0.37
𝜑𝑑(𝑡, 𝑡0) = 𝜑𝑑0 [𝜀𝑐𝑑(𝑡) − 𝜀𝑐𝑑(𝑡0)]
𝛽𝑏𝑐1 1.5 – 2.5
𝛽𝑏𝑐2 0.7
𝜑𝑑0 20 – 50

Design of a pre-stressed bridge deck with ultra-high performance concrete
3
A.2. UHPC150 - TIME DEPENDENT PROPERTIES
0.60
0.70
0.80
0.90
1.00
3 8 13 18 23 28
Ecm
(t)/
Ecm
t [days]
Stiffness Multiplier
50
70
90
110
130
150
170
3 8 13 18 23 28
fck(
t) [
MP
a]
t [days]
fck(t)
0
2
4
6
8
10
3 8 13 18 23 28
fctm
,el(
t) [
MP
a]
t [days]
fctm,el(t)

Design of a pre-stressed bridge deck with ultra-high performance concrete
4
It is assumed that for shrinkage model that Ac, h0, and RH values do not change from Case 0.
▪ A mid-span cross section (Ac=6.4048m2 and h0=345.6mm)
▪ Relative Humidity (RH) equals to 60%
0.0
0.2
0.4
0.6
0.8
1.0
1.2
0 1000 2000 3000 4000 5000
μ(t
,t0
)
t-t0 [days]
Creep
t0 = 3 days t0 = 21 days t0 = 129 days
0.0E+00
1.0E-04
2.0E-04
3.0E-04
4.0E-04
5.0E-04
6.0E-04
0 1000 2000 3000 4000 5000
ε(t)
t-ts [days]
Shrinkage
εca(ts = 3 days) εcd(ts = 3days) εs(ts = 3 days)

Design of a pre-stressed bridge deck with ultra-high performance concrete
5
A.3. C40/50 - TIME DEPENDENT PROPERTIES
0.85
0.90
0.95
1.00
3 8 13 18 23 28
Ecm
(t)/
Ecm
t [days]
Stiffness Multiplier
15
20
25
30
35
40
45
3 8 13 18 23 28
fck(
t)[M
Pa]
t [days]
fck(t)
1.50
2.00
2.50
3.00
3.50
4.00
3 8 13 18 23 28
fctm
(t)
[MP
a]
t [days]
fctm(t)

Design of a pre-stressed bridge deck with ultra-high performance concrete
6
0.0E+00
1.0E-04
2.0E-04
3.0E-04
4.0E-04
0 1000 2000 3000 4000 5000
ε cs(
t)
t-ts [days]
Shrinkage
ts = 3 days
0.00
0.50
1.00
1.50
2.00
2.50
0 1000 2000 3000 4000 5000
μ(t
,t0
)
t-t0 [days]
Creep
t0 = 3 days t0 = 21 days t0 = 129 days

Design of a pre-stressed bridge deck with ultra-high performance concrete
7
A.4. ULS SECTIONAL ANALYSIS
The following tables describe the values of the parameters to define compressive constitutive law and
tensile constitutive law.
αcc 0.85
ϒc 1.5
fcd [kPa] -85000
εc0d -0.001889
εcud -0.00295
wpic [m] 0.0003
Lc [m] 0.1666
Lf [m] 0.016
H [m] 0.2
w1% [m] 0.002
fctf1%,k [Mpa] 4.8
K 1.25
fctfk,u [kPa] 3692
fctf1%,u [kPa] 2954
εu,el 8.20E-05
εu,pic 0.00192
εu1% 0.0121
εu,lim 0.0240
This is the stress-strain relationship for a particular UHPC class and cross-section geometry already
described in chapter 7. Should be remembered that constitutive law in tension depends on cross-
section depth and not only on material properties.

Design of a pre-stressed bridge deck with ultra-high performance concrete
8
For a design bending moment of 260 kN.m combined with a null axial force, the worksheet tool was
used to calculate the minimum longitudinal reinforcement area needed to verify safety conditions. In
the following tables are the results curvature (φ) and the position of neutral axis (x). Thus, the strains
field is defined as well as the stresses field. It can be noticed that the maximum compressive strain is
not fully exploited when the maximum bending resisting moment is achieved.
φ [m-1] 0.044697347
x [m] 0.03957524
xi b(xi) ε(xi) σ(xi) F(xi) xi b(xi) ε(xi) σ(xi) F(xi)
[m] [m] [kPa] [kN] [m] [m] [kPa] [kN]
0.001 1.00 -0.00171 -77087 -193 0.126 1.00 0.00387 3551 9
0.004 1.00 -0.0016 -72058 -180 0.129 1.00 0.00399 3543 9
0.006 1.00 -0.00149 -67030 -168 0.131 1.00 0.0041 3535 9
0.009 1.00 -0.00138 -62001 -155 0.134 1.00 0.00421 3527 9
0.011 1.00 -0.00127 -56973 -142 0.136 1.00 0.00432 3518 9
0.014 1.00 -0.00115 -51944 -130 0.139 1.00 0.00443 3510 9
0.016 1.00 -0.00104 -46916 -117 0.141 1.00 0.00454 3502 9
0.019 1.00 -0.00093 -41887 -105 0.144 1.00 0.00466 3494 9
0.021 1.00 -0.00082 -36859 -92 0.146 1.00 0.00477 3486 9
0.024 1.00 -0.00071 -31831 -80 0.149 1.00 0.00488 3478 9
0.026 1.00 -0.0006 -26802 -67 0.151 1.00 0.00499 3470 9
-85000-85000
3692369229540
-90000
-80000
-70000
-60000
-50000
-40000
-30000
-20000
-10000
0
10000
-0.00500.0050.010.0150.020.025
σ[k
Pa]
ε
σ-ε

Design of a pre-stressed bridge deck with ultra-high performance concrete
9
xi b(xi) ε(xi) σ(xi) F(xi) xi b(xi) ε(xi) σ(xi) F(xi)
[m] [m] [kPa] [kN] [m] [m] [kPa] [kN]
0.029 1.00 -0.00048 -21774 -54 0.154 1.00 0.0051 3462 9
0.031 1.00 -0.00037 -16745 -42 0.156 1.00 0.00522 3454 9
0.034 1.00 -0.00026 -11717 -29 0.159 1.00 0.00533 3446 9
0.036 1.00 -0.00015 -6688 -17 0.161 1.00 0.00544 3438 9
0.039 1.00 -3.7E-05 -1660 -4 0.164 1.00 0.00555 3429 9
0.041 1.00 7.5E-05 3369 8 0.166 1.00 0.00566 3421 9
0.044 1.00 0.00019 3692 9 0.169 1.00 0.00577 3413 9
0.046 1.00 0.0003 3692 9 0.171 1.00 0.00589 3405 9
0.049 1.00 0.00041 3692 9 0.174 1.00 0.006 3397 8
0.051 1.00 0.00052 3692 9 0.176 1.00 0.00611 3389 8
0.054 1.00 0.00063 3692 9 0.179 1.00 0.00622 3381 8
0.056 1.00 0.00075 3692 9 0.181 1.00 0.00633 3373 8
0.059 1.00 0.00086 3692 9 0.184 1.00 0.00644 3365 8
0.061 1.00 0.00097 3692 9 0.186 1.00 0.00656 3357 8
0.064 1.00 0.00108 3692 9 0.189 1.00 0.00667 3349 8
0.066 1.00 0.00119 3692 9 0.191 1.00 0.00678 3340 8
0.069 1.00 0.0013 3692 9 0.194 1.00 0.00689 3332 8
0.071 1.00 0.00142 3692 9 0.196 1.00 0.007 3324 8
0.074 1.00 0.00153 3692 9 0.199 1.00 0.00711 3316 8
0.076 1.00 0.00164 3692 9 0.201 1.00 0.00723 3308 8
0.079 1.00 0.00175 3692 9 0.204 1.00 0.00734 3300 8
0.081 1.00 0.00186 3692 9 0.206 1.00 0.00745 3292 8
0.084 1.00 0.00197 3688 9 0.209 1.00 0.00756 3284 8
0.086 1.00 0.00209 3680 9 0.211 1.00 0.00767 3276 8
0.089 1.00 0.0022 3672 9 0.214 1.00 0.00779 3268 8
0.091 1.00 0.00231 3664 9 0.216 1.00 0.0079 3260 8
0.094 1.00 0.00242 3656 9 0.219 1.00 0.00801 3251 8
0.096 1.00 0.00253 3648 9 0.221 1.00 0.00812 3243 8
0.099 1.00 0.00264 3640 9 0.224 1.00 0.00823 3235 8
0.101 1.00 0.00276 3632 9 0.226 1.00 0.00834 3227 8

Design of a pre-stressed bridge deck with ultra-high performance concrete
10
xi b(xi) ε(xi) σ(xi) F(xi) xi b(xi) ε(xi) σ(xi) F(xi)
[m] [m] [kPa] [kN] [m] [m] [kPa] [kN]
0.104 1.00 0.00287 3624 9 0.229 1.00 0.00846 3219 8
0.106 1.00 0.00298 3616 9 0.231 1.00 0.00857 3211 8
0.109 1.00 0.00309 3607 9 0.234 1.00 0.00868 3203 8
0.111 1.00 0.0032 3599 9 0.236 1.00 0.00879 3195 8
0.114 1.00 0.00332 3591 9 0.239 1.00 0.0089 3187 8
0.116 1.00 0.00343 3583 9 0.241 1.00 0.00901 3179 8
0.119 1.00 0.00354 3575 9 0.244 1.00 0.00913 3171 8
0.121 1.00 0.00365 3567 9 0.246 1.00 0.00924 3162 8
0.124 1.00 0.00376 3559 9 0.249 1.00 0.00935 3154 8
For design calculation, the yield stress remains constant after yielding with no ultimate strain limit.
Some information referred to steel reinforcement is shown in table which includes the solution of steel
reinforcement needed.
As [m2] 1.96E-03
d [m] 0.21
fywd [kPa] 434782.6087
Es [kPa] 200000000
εsyd 0.002173913
εs 0.192482338
σs [kPa] 434782.6087
Fs [kN] 852.173913
Fs,correction [kN] -6.436320028
Fs,corrected[kN] 845.737593
Additionally, the figure shows the Moment-curvature (M-φ) diagram for this solution of reinforcement
and for a solution without reinforcement. This is achieved by determining the bending moment that
satisfies the equilibrium and other constrains for each curvature value (φ).

Design of a pre-stressed bridge deck with ultra-high performance concrete
11
In the following table are described partial results from shear strength calculation.
Vrd,c Vrd,f Vrd,s Vrd,max
ϒcfϒE 1.5 Afv [m2] 0.165 Asw [m2] 0 αcc 0.85
Ned [kN] 0 K 1.25 s [m] 1 ϒc 1.5
A [m2] 0.21 ϒcf 1.3 z [m] 0.165 bw [m] 1
σcp [Mpa] 0 σt,average [kPa] 3474 fywd [kPa] 434782 z [m] 0.165
fck [Mpa] 150 σrd,f [kPa] 2137 θ (º) 30 fck [Mpa] 150
k 1 θ (º) 30 cot(θ) 1.732 θ (º) 30
z [m] 0.165 cot(θ) 1.732 α (º) 90 tan(θ) 0.577
Φducts 0 cot(α) 0 cot(θ) 1.732
nducts 0 sin(α) 1 α (º) 90
bw [m] 1 cot(α) 0
bw,nom [m] 1 Vrd,f [Mpa] 0.612
d [m] 0.21 Vrd,s [Mpa] 0
Vrd,c = 360 kN Vrd,f = 612 kN Vrd,s = 0 kN
Vrd = 972 kN Vrd,max = 3512 kN
260
100
0
50
100
150
200
250
300
0 0.01 0.02 0.03 0.04 0.05 0.06 0.07 0.08 0.09 0.1
M [
kN.m
]
φ [m-1]
M-φ
As = 19,55 cm2 As = 0 cm2

Design of a pre-stressed bridge deck with ultra-high performance concrete
12

Design of a pre-stressed bridge deck with ultra-high performance concrete
13
A.5. CONSTRUCTIVE SCHEDULE
Stage Task
duration Start End segment 1 segment 2
day(s) day day tc [days] C40/50 UHPC150
tc [days] C40/50 UHPC150
fck fctm fck fctm,el fck fctm fck fctm,el
1
1 1 0 1 3 20.72 2.09 84.65 2.18 - - - - -
3 1 0 1 3 20.72 2.09 84.65 2.18 - - - - -
4 1 0 1 3 20.72 2.09 84.65 2.18 - - - - -
5 16 0 16 18 37.12 3.29 145.53 7.47 - - - - -
6 3 16 19 21 38.18 3.37 147.32 7.68 - - - - -
7 1 18 19 21 38.18 3.37 147.32 7.68 - - - - -
2
1 1 18 19 21 38.18 3.37 147.32 7.68 3 20.72 2.09 84.65 2.18
2 1 18 19 21 38.18 3.37 147.32 7.68 3 20.72 2.09 84.65 2.18
3 1 18 19 21 38.18 3.37 147.32 7.68 3 20.72 2.09 84.65 2.18
4 1 18 19 21 38.18 3.37 147.32 7.68 3 20.72 2.09 84.65 2.18
5 16 18 34 36 40.00 3.50 150.00 8.00 18 37.12 3.29 145.53 7.47
6 3 34 37 39
…
21 38.18 3.37 147.32 7.68
7 1 36 37 39
21 38.18 3.37 147.32 7.68
3
1 1 36 37 39
21 38.18 3.37 147.32 7.68
2 1 36 37 39
21 38.18 3.37 147.32 7.68
3 1 36 37 39
21 38.18 3.37 147.32 7.68
4 1 36 37 39
21 38.18 3.37 147.32 7.68
5 16 36 52 54
36 40.00 3.50 150.00 8.00
6 3 52 55 57
39
…
7 1 54 55 57
39
4
1 1 54 55 57
39
2 1 54 55 57
39
3 1 54 55 57
39
4 1 54 55 57
39
5 16 54 70 72
54
6 3 70 73 75
57
7 1 72 73 75
57
5 1 1 72 73 75
57

Design of a pre-stressed bridge deck with ultra-high performance concrete
14
2 1 72 73 75
57
3 1 72 73 75
57
4 1 72 73 75
57
5 16 72 88 90
72
6 3 88 91 93
75
7 1 90 91 93
75
6
1 1 90 91 93
75
2 1 90 91 93
75
3 1 90 91 93
75
4 1 90 91 93
75
5 16 90 106 108
90
6 3 106 109 111
93
7 1 108 109 111
93
7
1 1 108 109 111
93
2 1 108 109 111
93
3 1 108 109 111
93
4 1 108 109 111
93
5 16 108 124 126
108
6 3 124 127 129
111
7 1 126 127 129
111
8 1 1 126 127 129
111
2 1 126 127 129
111

Design of a pre-stressed bridge deck with ultra-high performance concrete
15
A.6. SUBSTRUCTURE INTERNAL FORCES
A.6.1. AXIAL LOADS DUE TO PERMANENT LOADS
Pier
N]
[kN]
Case 0 Case 1 Case 2
P1 16393 11784 13016
P2 20094 15494 16733
P3 20058 15483 16706
P4 20016 15419 16652
P5 19919 15347 16569
P6 19842 15232 16474
P7 17390 12816 14042
A.6.2. GLOBAL BASE REACTIONS
Case
Seismic type 1 Seismic type 2
F3 F2 F3 F2
[kN] [kN] [kN] [kN]
0 4125 8471 2747 3894
1 4162 7231 2008 3332
2 4086 7797 2204 3595

Design of a pre-stressed bridge deck with ultra-high performance concrete
16
A.6.3. CASE 0
Case 0
Seismic type 1 Seismic type 2
V3 M2 V2 M3 T V3 M2 V2 M3 T
[kN] [kN.m] [kN] [kN.m] [kN.m] [kN] [kN.m] [kN] [kN.m] [kN.m]
P1 0 0 2223 42824 0 0 0 1033 19905 0
P2 1012 44450 1057 47618 3375 674 29598 485 21842 1552
P3 703 32672 1454 68500 3016 468 21755 667 31410 1384
P4 751 34167 1980 90280 761 500 22751 907 41389 354
P5 759 34417 1573 72836 3119 505 22917 721 33386 1435
P6 898 38570 1111 48819 2979 598 25683 510 22397 1370
P7 0 0 1820 50607 0 0 0 840 23355 0
A.6.4. CASE 1
Case 1
Seismic type 1 Seismic type 2
V3 M2 V2 M3 T V3 M2 V2 M3 T
[kN] [kN.m] [kN] [kN.m] [kN.m] [kN] [kN.m] [kN] [kN.m] [kN.m]
P1 0 0 1551 30615 0 0 0 726 14345 0
P2 1019 44480 941 42031 2993 491 21469 435 19392 1379
P3 711 32755 1320 61978 2689 343 15809 607 28496 1242
P4 759 34236 1784 81409 580 366 16524 820 37435 274
P5 766 34488 1423 65593 2709 370 16646 654 30147 1255
P6 905 38615 981 42855 2601 437 18638 453 19759 1199
P7 0 0 1396 39377 0 0 0 649 18319 0

Design of a pre-stressed bridge deck with ultra-high performance concrete
17
A.6.5. CASE 2
Case 2
Seismic type 1 Seismic type 2
V3 M2 V2 M3 T V3 M2 V2 M3 T
[kN] [kN.m] [kN] [kN.m] [kN.m] [kN] [kN.m] [kN] [kN.m] [kN.m]
P1 0 0 1929 37915 0 0 0 907 17827 0
P2 1016 44455 974 43775 3221 548 23977 448 20133 1485
P3 708 32724 1372 64553 2845 381 17650 630 29637 1311
P4 756 34214 1859 84925 739 407 18453 853 38985 348
P5 763 34456 1483 68643 2906 411 18583 681 31497 1344
P6 841 36748 1028 45058 2831 454 19820 473 20723 1305
P7 0 0 1600 45122 0 0 0 744 20971 0

Design of a pre-stressed bridge deck with ultra-high performance concrete
18

Design of a pre-stressed bridge deck with ultra-high performance concrete
19