Design of a plasma neutralizer for negative ion...
60
Universit` a degli Studi di Padova DIPARTIMENTO DI FISICA E ASTRONOMIA “GALILEO GALILEI” Corso di Laurea in Fisica Design of a plasma neutralizer for negative ion beam Progetto di un neutralizzatore al plasma per fasci di ioni negativi Candidato: Luca Balbinot Matricola 1069477 Relatore: Dott. Gianluigi Serianni Correlatore: Dott. Emanuele Sartori Anno Accademico 2015/2016
Transcript of Design of a plasma neutralizer for negative ion...

Universita degli Studi di Padova
DIPARTIMENTO DI FISICA E ASTRONOMIA “GALILEO GALILEI”
Corso di Laurea in Fisica
Design of a plasma neutralizer for negative ion beam
Progetto di un neutralizzatore al plasma per fasci di ioni negativi
Candidato:
Luca BalbinotMatricola 1069477
Relatore:
Dott. Gianluigi Serianni
Correlatore:
Dott. Emanuele Sartori
Anno Accademico 2015/2016


Contents
Introduction 10.1 NIO1 . . . . . . . . . . . . . . . . . . . . . . . . . . . . . . . . . . . 20.2 Thesis objectives . . . . . . . . . . . . . . . . . . . . . . . . . . . . 4
1 Particle beam evolution and plasma formation 51.1 Beam-gas interactions . . . . . . . . . . . . . . . . . . . . . . . . . 51.2 Effects of the gas on the beam . . . . . . . . . . . . . . . . . . . . 61.3 Beam effects on the gas . . . . . . . . . . . . . . . . . . . . . . . . 8
1.3.1 Beam induced ionization . . . . . . . . . . . . . . . . . . . . 81.3.2 Ionization by stripped electrons . . . . . . . . . . . . . . . . 91.3.3 Space charge compensation . . . . . . . . . . . . . . . . . . 101.3.4 Simplified beam plasma model . . . . . . . . . . . . . . . . 101.3.5 Plasma losses . . . . . . . . . . . . . . . . . . . . . . . . . . 11
1.4 Dynamics of neutral gas . . . . . . . . . . . . . . . . . . . . . . . . 11
2 Plasma confinement 152.1 Confinement with magnetic Cusps . . . . . . . . . . . . . . . . . . 15
2.1.1 Boundary conditions . . . . . . . . . . . . . . . . . . . . . . 162.1.2 Plasma density . . . . . . . . . . . . . . . . . . . . . . . . . 16
2.2 Axial magnetic field . . . . . . . . . . . . . . . . . . . . . . . . . . 172.2.1 Charged particle dynamics . . . . . . . . . . . . . . . . . . 192.2.2 Plasma density . . . . . . . . . . . . . . . . . . . . . . . . . 20
3 Evolution of the beam through the neutralizer in different con-figurations 233.1 Beam composition . . . . . . . . . . . . . . . . . . . . . . . . . . . 233.2 Relation with experimental data . . . . . . . . . . . . . . . . . . . 293.3 Individuation of neutralizing collisions . . . . . . . . . . . . . . . . 29
4 Design of a beam-driven plasma neutralizer for NIO1 354.1 Description of NIO1 . . . . . . . . . . . . . . . . . . . . . . . . . . 354.2 Neutralizer geometry . . . . . . . . . . . . . . . . . . . . . . . . . . 354.3 Neutral gas flow and pressure profile . . . . . . . . . . . . . . . . . 364.4 Expected performances . . . . . . . . . . . . . . . . . . . . . . . . . 39
4.4.1 Cusps magnetic field . . . . . . . . . . . . . . . . . . . . . . 394.4.2 Axial magnetic field . . . . . . . . . . . . . . . . . . . . . . 42
Conclusions 49
iii

iv

Introduction
Plasma, in fusion chambers, needs to be heated to reach fusion temperature.Traditional heating of thermonuclear fusion experiments are ohmic heating, bymagnetic induction, and 4He2+ (produced in fusion reaction) bremsstrahlung.Others additional heating systems are required, as sketched in figure 1. Amongthese, the injection of intense beams of energetic particles is very important,generally obtained by electrostatic acceleration of negative hydrogen ions. Ionsselected are hydrogen and deuterium ions in order to heat the fusion plasma withthe same elemens it is made of.
Ions are accelerated and collimated by electric fields, so reaching the energy
Figure 1: Sketch of different energy supplies to a tokamak [3]
required; then ions have to be neutralized before being injected in order to passthrough the magnetic plasma confinement of the fusion chamber. This is thereason why negative ion beams are chosen as the precursor beam of neutral beaminjectors (NBIs) instead of positive ion beams. Infact neutralization of a negativeion beams is much easier than that of positive ion beams 1.Negative ion-based neutral beam injectors will play an important role in heatingand driving a current of fusion plasma. As an example ITER 2 will be providedwith three NBIs, two hydrogen NBIs and a deuterium one. The demonstrationreactor DEMO will be provided with NBIs as well.Neutral beam injectors can be divided in five parts: source of negative plasmaparticles, accelerator, neutralizer, separator, that discarts residual ions of thebeam, and the duct going to the fusion chamber.[1]Future fusion plants will require NBI with a high system efficiency, in order toreduce power dispersion and optimize power recycling.NBI efficiency is determined mainly by the neutralization efficiency of the driven
1For high energy beams stripping cross sections are much bigger than electron capure ones[2].2The next biggest reactor under construction in southern France
1

0.1. NIO1
negative ion beams, that is the percentage of the primary beam neutralized inthe neutralizer. The beam infact could not be completely neutralized, some of itspower infact has to be discarted as H− and H+ beam fraction.In the world the major research institutes studing Ion-based neutral beam injectosare: QST (Japan)3, NIFS (Japan) 4, IPP (Germany)5 and Consorzio RFX (Italy).It was demonstrated that the neutralization efficiency of a neutral gas neutralizeris limited to ' 60% for the current high energy negative ion beams. [4] [5]Plasma neutralizer instead should provide a higher neutralization efficiency of theprimary negative ion beam [4] [5]. With generating a high density plasma in theneutralizer higher performances of the NBI are reached, efficiency of neutralizationof DEMO plasma neutralizer is predicted to reach ' 80%.Nevertheless, costs, in terms of energy, of generation of high density plasma couldbe high enough to cancel the energetic benefits of the plasma neutralizer. [6] [7]This thesis describes a method for using the plasma generated by the passage ofthe beam itself through a neutral gas neutralizer. The plasma required for higherneutralization efficiency will not be externally activated, requiring energy, but willbe generated be the beam itself thanks to ionizing collisions with the backgroundgas.Thus, with the purpose of generating high density plasma, confinement of selfgenerated plasma and neutral gas density have to be optimized.
0.1 NIO1
NIO1 (Negative Ion Optimization phase 1) 6 is a compact radio frequency ionsource, installed at Consorzio RFX. It is designed to generate a 60 keV-130 mAhydrogen negative ion beam.[10]In figure 2 a external view of NIO1 current source accelerator and neutralizer is
Figure 2: Nio1 ovrerall final version design
shown 7. In figure 3 a section of NIO1 ion source is shown. 8
According to figure 3, plasma in produced in the chamber (region 1 in the figure)
3Nation Institutes for Quantum and Radiological Science and Technology, Japan4National Institute for Fusion Science, Japan5Max-Planck-Institut fur Plasmaphysik, Germany6Information about NIO1 were taken from [8] and [9]7Picture 2 is taken from [9]8Figure 3 is taken from [10]
2

0.1. NIO1
Figure 3: Longitudinal section (xz plane) of the NIO1 ion source and acceleratorassembly.
by the series of coils shown in the figure. Then a magnetic filter (region 2) selectsonly negative hydrogen particles from the generated plasma; in region 3, whereions are collimated, electrons are discarted with a magnetic field thanks to theysmaller Larmor radius. Negative ions are then accelerated, up to reach 60 keVkinetics energy (region 4), and injected in the neutralizer.At first, the composition of NIO1 beam has to be clarified; the beam could becomposed of nine, four or only one beamlet each one with a radius of 5 mm, adivergence of 5 mm/m and a nominal current of approximately 14.4 mA. In thenine and four beamlets set up, the beamlets are ordered in a 3x3 or 2x2 matrix; inthose two configurations the distance beetwen two consecutive beamlets is 0.015m.In picture 4 an example of 3x3 beamlet configuration is shown. 9
The final purpose of this thesis is making preliminary studies of the design of a
Figure 4: Longitudinal section (xy plane) of the NIO1 ion source
self powered plasma neutralizer for NIO1.The actual NIO1 neutral gas neutralizer is a cylinder, a vessel with R = 0.35 m ofradius and L = 2 m of length. NIO1 plasma neutralizer will be a smaller cylinder,coaxial to the vessel.The model displayed in figure 5 shows the geometry form of the system, made of
9picture 4 is taken from [10]
3

0.2. Thesis objectives
two cylinders, that would compose NIO1 neutralizer.Neutralizer form and characteristics will be extensively discussed in chapter 4.Neutral gas will be provided to the neutralizer by a pump at its center (representedby the down arrow), in order to mantain the chosen pressures P1, P2 and P3
throughout the neutralizer-vessel system, while the vacuum in the vessel will bemantained by two cryogenic pumps (represented by the diagonal arrow).The form of the neutralizer is chosen to keep a higher gas density along the path
Figure 5: Neutralizer form
of the beam than in the other regions of the vessel, thus generating more plasmaas described in sections 1.3.1 and 1.3.2.It is assumed since the beginning that the length of the neutralizer, about onemetre, will be much larger that its width, some centimetres, so all the plasmacurrent generated in the neutralizer, will be assumed to be collected at its wallsand not to be lost at the two ends of the neutralizer itself.
0.2 Thesis objectives
Firstly this thesis aims to extimate the neutralization efficiency of different degreesof ionization neutralizer.The second objective is understanding why, in term of collisions, plasma neutral-izers provide better efficiency than neutral gas ones.Then the focus will move to NIO1 with the purpose of making preliminary studiesfor the design of a self powered plasma neutralizer for this experiment.Great importance will be given to plasma confinement in order to reach the highestpossible degree of ionization; then, an extimation of the efficiency of the proposedneutralizer models will be given.
4

Chapter 1
Particle beam evolution andplasma formation
The beam composition and its evolution along the neutralizer length were studiedby a statistical model, which considers the most significant collisions of beamparticles with the neutralizer target. The latter consists of a weakly ionized gas,composed by neutral hydrogen molecules or atoms, molecular and atomic ionsand electrons.Three H− beam conditions were considered at three energies: 60 keV (NIO1),200 keV (the energy of an experiment we will use to compare our predictions withexperimental data 1, and which results are taken in [4]) and 1 MeV (ITER).In the following, the beam-gas interactions (section 1.1) and their effects on a H−
beam (section 1.2) are discussed; later on, beam-induced effects on the gas aredescribed (section 1.3) particularly considering the production of ”slow” particles.Finally, the gas flow in molecular regime is described by a lumped model ap-proach (section 1.4) to obtain the actual profile of gas density along the beam path.
1.1 Beam-gas interactions
Reactions affecting the charge state of the precursor negative ion beam are dis-cussed in this section; to this purpose only the reactions which change the chargeof the beam particles were considered.Furthermore, in the relevant range, the impact energy of beam ions against gasparticles at room temperature (' 0.03 eV) is dominated by the beam energy, sokinetic energy in single collisions is the energy of the beam particle.The collisional process listed in table 1.1 were considered. These include single anddouble ionization, responsible for primary ionization process, stripping, includingall the precess analyzed in section 1.3.2, charge exchange, dissociation and others.Coolisional process can act on beam particles, or be a source of charges by gasionization, thus generating a secondary plasma along the beam path. These twoaspects are discussed in sections 1.2 and 1.3.
In table 1.1 simbols σsijns follow the following convention: the subscripts i ej refer to the inizial and final charge states and the apexes e, i, g, h refer toreactions with electrons, ions, molecular gas and atomic hydrogen respectively.
1The experiment is located at the NBI Heating laboratory, Japan Atomic Energy ResearchInstitute, 801-1 Mukoyama, Naka-machi, Naka-gun, Ibaraki-ken 311-0193, Japan
5

1.2. Effects of the gas on the beam
H− → H0 σ60keV σ200keV σ1MeV simb. ref
H−, H2 → H,H2, e 5.44 · 10−16 2.53 · 10−16 4.94 · 10−17 cm2 σg−0 [2] (p:F-8)H−, H+ → H,H+, e 2.92 · 10−15 2.00 · 10−15 8.00 · 10−16 cm2 σi−0 [2] (p:F-6)H+, H− → H,H 3.241 · 10−16 1.26 · 10−16 2.77 · 10−17 cm2 σi−0 [2] (p:A-46)e,H−[G]→ e,H[G], e, e 2.00 · 10−18 5.00 · 10−19 1.00 · 10−19 cm2 σe−0 [11]H−, H → H,H, e 3.24 · 10−16 1.26 · 10−16 2.77 · 10−17 cm2 σh−0 [2] (p:F-2)
H− → H+ σ60keV σ200keV σ1MeV simb. ref
H−, H2 → H+, H2, 2e 3.50 · 10−17 1.77 · 10−17 3.26 · 10−18 cm2 σg−+ [2] (p:F-10)H−, H → H+, H, 2e 1.03 · 10−17 3.53 · 10−18 8.00 · 10−19 cm2 σh−+ [2] (p:F-4)H+, H− → H−, H+ 1.03 · 10−17 3.53 · 10−18 8.00 · 10−19 cm2 σi−+ [2] (p:A-44)e,H−[G]→ e,H+, e, e 4.00 · 10−19 1.00 · 10−19 3.00·−20 cm2 σe−+ [11]
H → H+ σ60keV σ200keV σ1MeV simb. ref
H,H2 → H+, H2, e 1.19 · 10−16 7.4643 · 10−17 1.76 · 10−17 cm2 σg0+ [2] (p:E-6)H,H2 → H+, H+, H+, 3e 1.29 · 10−18 1.17 · 10−18 1.00 · 10−18 cm2 σg0+ [2] (p:G-2)H,H2 → H+, H,H+, 2e 4.51 · 10−19 4.10 · 10−19 2.00 · 10−19 cm2 σg0+ [2] (p:G-6)H,H → H+, H, e 8.60 · 10−17 3.78 · 10−17 8.75 · 10−18 cm2 σh0+ [2] (p:E-2)H+, H[G]→ H+, H+, e 8.60 · 10−17 3.78 · 10−17 8.75 · 10−18 cm2 σi0+ [11]H+, H → H,H+ 7.00 · 10−17 1.00 · 10−18 1.00 · 10−19 cm2 σh0+ [11]e,H[1s]→ e,H+, e 3.00 · 10−19 1.00 · 10−19 3.00 · 10−20 cm2 σe0+ [12]
H+ → H σ60keV σ200keV σ1MeV simb. ref
H+, H[G]→ H[G], H+ 7.00 · 10−17 1.00 · 10−18 1.00 · 10−19 cm2 σh+0 [11]H+, H2[G]→ H[G], H+
2 7.00 · 10−17 1.00 · 10−18 4.00 · 10−22 cm2 σg+0 [11]
Table 1.1: List of cross section of interation on beam particles with backgroundgas
From figure 1.1 and table 1.1 it is clear that the most relevant reactions, for H−
beam fraction neutralisation, are: H−, H2 → H,H2, e and H−, H+ → H,H+, e;while stripping and double stripping reactions H,H2 → H+, H2, e and H−, H2 →H+, H2, 2e are the most relevant contributions to H+ beam fraction. It is evenshown that the most relevant reactions for each energy considered are the same.The cross sections of some reactions are not available at high energies, 200 keV and1 MeV, but this mainly happens with minor reactions. For this reason they wereapproximated following the trend of reactions, whose cross sections where found,involving particles differing only by the sign of the charge. This is the case of singlestripping on H+ target: H−, H+ → H,H+, e whose cross section was approxi-mated at high energies by that of single stripping on H0 target: H−, H → H,H, e.
1.2 Effects of the gas on the beam
The precursor negative ion beam will evolve by charge changing process occurringwith the gas target. The neutral, positive and negative beam particles (Γ0, Γ+
and Γ−) at a certain distance z from the accelerator are composed by H0, H+
and H− respectively. They will evolve following the differential equation system1.1 2
dΓ−
dz = Γ+∑
s[σs+−ns]− Γ−
∑s[(σ
s−0 + σs−+)ns] + Γ0
∑s[σ
s0−ns]
dΓ0
dz = Γ+∑
s[σs+0ns] + Γ−
∑s[σ
s−0ns]− Γ0
∑s[(σ
s0+ + σs0−)ns]
dΓ+
dz = −Γ+∑
s[(σs+0 + σs+−)ns] + Γ−
∑s[σ
s−+ns] + Γ0
∑s[σ
s0+ns]
(1.1)
2Equation 1.1 is taken from [5]
6

1.2. Effects of the gas on the beam
Figure 1.1: Cross section of interaction of beam particles with the gas target
In equation 1.1 summations and densities n ensue from 1.2.
∑s
[σsijns] = σeijne + σiijni + σgijng + σhijnh (1.2)
System 1.1 is the general system to study the evolution of a beam, but, at theenergy considered, cross sections relative to the production of H− ions by beamparticles can be neglected to semplify the system. According to 1.2 this semplifi-cation consists in assuming
∑s[σ
s+−ns] =
∑s[σ
s0−ns] = 0.
To solve the system an initial condition, describing the state of the beam immedi-ately downstream the grounded grid of the electrostatic accelerator, is imposed:
Γ−(0) = 1 Γ+(0) = 0 Γ0(0) = 0 (1.3)
The new system will be:
dΓ−(z)dz = −Γ−
∑s[(σ
s−0 + σs−+)ns]
dΓ0(z)dz = Γ+
∑s[σ
s+0ns] + Γ−
∑s[σ
s−0ns]− Γ0
∑s[σ
s0+ns]
dΓ+(z)dz = −Γ+
∑s[σ
s+0ns] + Γ−
∑s[σ
s−+ns] + Γ0
∑s[σ
s0+ns]
(1.4)
which, with the initial conditions 1.3, results integrable, results are shown inequation 1.5.For example, figures 3.1, 3.2, 3.3 show the evolution of the three beam fractions
7

1.3. Beam effects on the gas
H−, H0, H+ against target thickness which is simply defined at 3.2
Γ−(z) = exp((−σs−0ns − σs−+ns) · z)Γ0(z) = −[−σs+0nsσ
s+0ns + σs+0nsσ
s−0ns − σs+0nsσ
s0+ns+
+σs−0nsσs0+ns · exp((−σs+0ns − σs0+ns) · z)+
+σs+0nsσs+0ns · exp((−σs−0ns − σs−+ns) · z)+
−σs+0nsσs−0ns · exp((−σs−0ns − σs−+ns) · z)+
+σs+0nsσs0+ns · exp((−σs−0ns − σs−+ns) · z)+
−σs−0nsσs0+ns · exp((−σs−0ns − σs−+ns) · z)+
+σs+0nsσs−+ns − σs+0nsσ
s−+ns · exp((−σs+0ns − σs0+ns) · z)]/
/[(σs+0ns + σs0+ns)(σs+0ns − σs−0ns + σs0+ns − σs−+ns)]
Γ+(z) = −[−σs+0nsσs0+ns + σs−0nsσ
s0+ns − σs0+nsσ
s0+ns+
+σs0+nsσs−+ns − σs−0nsσ
s0+ns · exp((−σs+0ns − σs0+ns) · z)+
+σs+0nsσs0+nsexp((−σs−0ns − σs−+ns) · z)+
+σs0+nsσs0+ns · exp((−σs−0ns − σs−+ns) · z)+
+σs+0nsσs−+ns · exp((−σs+0ns − σs0+ns) · z)+
−σs+0nsσs−+ns · exp((−σs−0ns − σs−+ns) · z)+
−σs0+nsσs−+ns · exp((−σs−0ns − σs−+ns) · z)]/
/[(σs+0ns + σs0+ns)(σs+0ns − σs−0ns + σs0+ns − σs−+ns)]
(1.5)
1.3 Beam effects on the gas
For the following studies it is also necessary to consider the effects of the beamon the backgroung gas which should provide the plasma required for a plasmaneutralizer.
1.3.1 Beam induced ionization
If N is the local gas density, the charges Ixb generated per second in a neutralizerlenght ∆z, by primary ionization by the beam particles, are given by:
Ixb = NIbeam[Γ−Σ−x + Γ0Σ0x + Γ+Σ+x
]∆z (1.6)
where x = i, e refers to ions and electrons, while Ibeam, An, and r are the beamcurrent, the neutralizer cross− section and the neutralizer radius respectively.Σkx represents the cross section for slow ion or electron production by the beamparticles in the neutral gas so only ionization or similar are considered implyingthat Σke = Σki.
• Σ−x = 0 cm2 see 3
3Stripping is the only reaction of a H− particles with a gas one that produces free electrons;anyway stripped electrons have higher energy than those produced by ionization and they havemainly the same direction as the primary beam, hence they have to be treated as a differentplasma as will be seen in section 1.3.2
8

1.3. Beam effects on the gas
• Σ0x = σ1 + σ2 + σ3 + 2σ4 + 2σ5 + σ6 = 1.43−16 cm2 see 4
• Σ+x = σ7 = 2.06−16 cm2
with the cross sections σn (n = 1, ..., 7) in table 1.2.As we can see from table 1.2 the cross section of ionization of molecular hydrogen
reaction σ at 60 keV [ref]
H,H2 → H,H+2 , e → σ1 = 1.35 · 10−16 cm2 [2] p:D-4
H,H2 → H−, H+, H+, e → σ2 = 1.90 · 10−19 cm2 [2] p:G-2H,H2 → H,H,H+, e → σ3 = 1.00 · 10−18 cm2 [2] p:G-4H,H2 → H,H+, H+, 2e → σ4 = 3.50 · 10−18 cm2 [2] p:G-2H,H2 → H+, H+, H+, 3e → σ5 = 1.10 · 10−18 cm2 [2] p:G-2H,H2 → H+, H,H+, 2e → σ6 = 3.75 · 10−19 cm2 [2] p:G-2
H+, H2 → H+, e,H+2 , e → σ7 = 2.05 · 10−16 cm2 [2] p:D-16
Table 1.2: Cross sections for ionization of background gas by 60 keV beam particles
σ1 is much bigger than those of ionization of atomic hydrogen (cross sections fromσ2 to σ6) so plasma generated by ionization will be considered made made of H+
2
ions.
1.3.2 Ionization by stripped electrons
Fast electrons are produced by single or double stripping of the H− beam fractionor ionization of the H0 fraction caused by impact on H2 moleculas. Normally, itis assumed that stripping electrons are generated with the same velocity as thebeam particles.Stripping reactions considered in the present work, and the related cross sectionsfor 60 keV beam, are shown in table 1.3Stripped electron current generated in given interval ∆z, in a uniform neutral
reaction σ at 60 keV [ref]
H−, H2 → H, e,H2 → σ−0 = 5.50 · 10−16 cm2 [2] p:F-8H−, H2 → H+, 2e,H2 → σ−+ = 3.50 · 10−17 cm2 [2] p:F-10H0, H2 → H+, e,H2 → σ0+ = 1.18 · 10−16 cm2 [2] p:E-6
Table 1.3: Cross sections of generation of stripping electrons by 60 keV beamparticles on the background gas
gas, is given by:
Is = Γ−Ib
[1− e(−N(z)(σ−0+2σ−+)∆z)
]+ Γ0Ib
[1− e(−N(z)σ0+∆z)
](1.7)
4σ4 and σ5 are summed twice because they refer to double ionization reactions as shown intable 1.2
9

1.3. Beam effects on the gas
Discretizing the length of the neutralizer, the total stripped electron currentgenerated at a given position zl =
∑li ∆zi is given by:
Itots(zl) =l∑i
{Γ−i Ib
[1− e(−Ni(σ−0+2σ−+)∆zi)
]+ Γ0
i Ib
[1− e(−Niσ0+∆zi)
]}(1.8)
The stripped electrons make up a third plasma with different characteristics thanthe other two considered: the beam and the primary ionization plasma. Theenergy of the stripped electrons would be Es = me
mbEb ' 33.3 eV for a 60 keV
Hydrogen beam.The 33.3 eV stipped electrons could contribute to the plasma current by ionizationof the background gas
Ixs = IsNΣsxwb2
(1.9)
where Σsx is the cross section for ionization of the background gas by the strippedelectrons given by
Σsx = σsx1 + σsx2 (1.10)
In table 1.4 values for σsx1 and σsx2 are shown.
reaction σ for 33.3 eV [ref]
e,H2[G]→ e,H+2 , e → σsx1 = 1.26 · 10−16 cm2 [11]
e,H2[G]→ e,H+, H[G], e → σsx2 = 1.60 · 10−18 cm2 [11]
Table 1.4: Cross sections of ionization by 33.3 eV stripped electrons
1.3.3 Space charge compensation
In order for an ion beam to propagate, it is necessary that the beam space chargeis compensated for. It means that charges of opposite sign with respect to thebeam ions are trapped in the potential well initially produced by the beam. Suchcharges, which are electrons in the case of positive ion beams or positive ionsin the case of negative ion beams, are typically produced by the beam itself, byionizing the background gas. The process follows a time scale τscc ' 1
ngasσizvbeamwhere ngas is the gas density, σiz is the ionization cross section and vbeam is thebeam particle speed.With this assumpion a higher density of electrons and H+
2 ions in the center of theneutralizer is predicted, compensating the spatial charges; the border conditionswill be discused in chapter 2.1.1, while, beetwen the low plasma density of theborder and the higher density of the center, a diffusive model will be assumed.
1.3.4 Simplified beam plasma model
Whit assuming all the generated plasma to be collected at the neutralizer walls,the local plasma density current generated by primary ionization will be:
jxb =NIbeamAn
[Γ−Σ−x + Γ0Σ0x + Γ+Σ+x
] r2
(1.11)
10

1.4. Dynamics of neutral gas
where r is the neutralizer radius and An is the neutralizer surface.The contribution to ionization, and therefore to the particle flux at walls, givenby stripped electrons is calculated in equation 1.12 and 1.13. One should noticethat electron induced ionization is only possible for electron energies higher thanthe ionization potential for H2 which is 13.6eV; for comparison, stripped electronsin a 60keV beam have 33.3 eV energy as mentioned.The contribution of the ionization by stripped electrons to the plasma flux tothe wall of the neutralizer will be calculated in analogy with section 1.3.2. Thestripped electrons generated over a length ∆z will be calculated as:
js =Γ−IbeamAb
[1− e(−N(σ−0+2σ−+)∆z)
]+
Γ0IbeamAb
[1− e(−Nσ0+∆z)
]. (1.12)
The total flux of the generated stripped electron at a given point zl will be:
jtots(zl) =
l∑i
{Γ−i IbeamAb
[1− e(−Ni(σ−0+2σ−+)∆zi)
]+
Γ0i IbeamAb
[1− e(−Niσ0+∆zi)
]}.
(1.13)This approximation holds as long as the mean free path for electron scatteringλe is larger than the lenght scale of the system. Typically, the cross section formomentum transfer at 33 eV is 5 · 1020 m2 and typical H2 densities are around5 ·1018 m−3 thus yielding λe ' 4m. Thus the plasma flux of ionization by strippedelectrons will be:
jxs = jsNΣsxwb2. (1.14)
The total plasma flux to the wall of the neutralizer is given by
jx = jxb + jxs (1.15)
In this calculation secondary electrons generated by the primary ones, which mayhave enough energy to ionize the background gas, will not be considered.
1.3.5 Plasma losses
Plasma loss, inside the neutralizer, is due to recombination of electrons with H+2
ions. The number of plasma particles loss per unity of volume and time, L willbe calculated as:
L = neKe−recnH+2
(1.16)
where in the quasi neutrality approximation ne = nH+2
= np.
Ke−rec is the rate of recomination of the electrons on ions; electron speed isdistributed according to Maxwell-Boltzmann energy distribution, thusKe−rec =< veσrec >MB
1.4 Dynamics of neutral gas
Gas flow in high vacuum is called “molecular flow” because viscosity is negligibleand only single collisions beetwen molecules play a significant role. In high vacuum,free molecular flow regime is often attained, a regime in which only collisions withsolid surfaces determine the flow parameters.
11

1.4. Dynamics of neutral gas
Figure 1.2: Resistive system canalisations in NIO1 neutralizer
In those conditions conductances through channels are indipendent from thepressure difference at the two sides of the channel, and the gas flux F is linearlydependent on the pressure difference:
F = C ·∆P (1.17)
The resistence of a channel R will be the reciprocal of the conductance C; resistorsin series will be summed like parallel conductances to realize a lumped model,such as in the electric circuits.In this section conductances, for the system described in section 1.3 and shown infigure 5 are calculated.5
The resistive model for NIO1 neutralizer is shown in figure 1.2Being D and d the diameters of the vessel and neutralizer, vrms the root meansquare of thermal speed of neutral gas at temperature T , L and l the lengths ofthe vessel and neutralizer, dp and lp the diameter and length of the tubes enteringto the pumps, the following conductances are calculated.The conductance entering the neutralizer from the vessel calculated as the con-ductance of a not small hole:
Cen =πvrms
4
πr2
1− ( dD )2(1.18)
where r is the radius of the neutralizer.The conductance for traversing half the length of the neutralizer (because gas isinjected at the center of the neutralizer):
Ctn/2 =π
12vrms
d3
l/2(1.19)
The conductance of traversing the cylindrical corona between the vessel andneutralizer:
Ctc =1
3
(πRT
2M
) 12 (D − d)2(D + d)
lKf (1.20)
where R is the gas constant, T the gas temperature and Kf a form factor thatdepends on the fraction d/D. In table 1.5 values of Kf against d/D are shown.To determine the value of Kf for each value of d/D those data were fit by a fourth
5All the statements and all the formulas about conductances in this section come from [13]
12

1.4. Dynamics of neutral gas
d/D 0 0.259 0.5 0.707 0.866 0.966
Kf 1 1.072 1.154 1.254 1.430 1.675
Table 1.5: Values of Kf
degree polynomial.The conductance for entering the cylinndrical corona was calculated as the conduc-tance for entering a hole with the diameter of the vessel minus the conductancefor entering the neutralizer.
Cec =1
4vrms(Avessel −Aneutr) (1.21)
where A is the section of the vessel or of the neutralizer.So the conductance of the circular corona will be calculated as:
Cc =Cec · CtcCec + Ctc
(1.22)
There is the conductance of the tube that goes from the vessel to the pump thatconsists in the conductance for entering a small tube:
Cep =1
4vrmsπr
2p (1.23)
and traversing the tube:
Ctp =π
12vrms
(2rp)3
lp(1.24)
So, similarly to equation 1.22 the total resistence of each tube will be:
Cp =Cep · CtpCep + Ctp
(1.25)
The last conductance in the considered system is the speed of the pumps Cs thatcompletes the equivalent lumped model.To extimate the time the experiment could stay on, before having to regeneratethe pumps, is calculated as:
T =Q
Ftot(1.26)
where Q is the total capacity of the pumps and Ftot it the total gas current.
13

1.4. Dynamics of neutral gas
14

Chapter 2
Plasma confinement
Two different possibilities were studied for the magnetic plasma confinement inthe neutralizer in cylindrical geometry: the two possibilities are magnetic cuspsand active coils. The former is made with permanent magnets around the neu-tralizer; the latter with an axial magnetic field produced by coils wound aroundthe neutralizers so as to produce a magnetic mirror at both sides.This chapter describes the two approaches and how to include these in the plasmaloss terms.
2.1 Confinement with magnetic Cusps
This type of confinement involves the deployment of several permanent magnetswith alternating poles, as shown in figure 2.1. Magnetic cusp are used to increaseplasma density in the neutralizer by reducing the loss area and so changing theboundary conditions. 1
Figure 2.1: Section, in cylindrical coordinates, of magnetic cusp configuration.
1Immage 2.1 comes from [14]
15

2.1. Confinement with magnetic Cusps
2.1.1 Boundary conditions
The usual condition, for a quasi − neutral plasma, je = ji, in the consideredsystem, considering the stripped electron, plasma and the charge exchange flux,is replaced by: [6]
ji −je4e(− ϕ
Te) − jse
(− ϕEsB
)= jcx − js (2.1)
where ji,e are defined in equation 1.15 (with the convention x = i, e), ϕ is theplasma potential, js is the stripped electron flux defined in equation 1.16, Te is theelectron temperature, EsB is the energy of the stripped electron at the border (approximately 33 eV) and jcx is the charge exchange flux. Equation 2.1 implicitlyassumes that the charges generated at a given axial point z flow to the neutralizerwalls at the same position z where they are generated. This is in general the casefor a neutralizer tube having a small aspected ratio beetwen diameter and length:d/l << 1.It is calculated the average number of collisions the stripped electrons have withthe background gas along the neutralizer nc, given by: 2
nc =
∫ l
0ngas(x)σeH2dx (2.2)
Calculating 2.2 for 33.3 eV electrons, a constant gas density, ngas = 1 · 1019 m−3,for a beam path of length 1 m, it is obtained that almost a tenth of the strippedelectrons will collide before being lost at the end of the neutralizer.For this reason stripped electron will be treated as a untermalized beam with thesame direction as the ion beam; therefore the stripped electron current at thewalls of the neutralizer, js in equation 2.1, will be assumed equal to 0 A/m2.With this consideration equation 2.1 becomes:
0.6ni
(eTemi
)0.5
− ne4
(8eTeπme
)0.5
e(− ϕTe
) = Ψni
(eTemi
)0.5
(2.3)
where the factor 0.6 represents the drop of ion density at the plasma pre-sheath
predicted in Bohm theory, and(eTemi
)0.5is the ion sound speed, the speed of ions
entering the Debay sheath. Lastly Ψ = jcx/jx ' 0, where jx is the electron or ioncurrent.As ni = ne = np at the plasma boundary, the plasma density is given by:
np =jpe
1(eTemi
)0.5 (2.4)
With the plasma density current jp calculated in equation 1.15
2.1.2 Plasma density
The relevant quantity in plasma confinement is leak width w of a line of cusps.The leak width indicates the loss area of plasma to the walls. As shown in figure
2σeH2 is the sum of the cross sections of four collisions the stripped electrons could makewith H2 particles: dissociation (σdis ' 1.58 · 10−21m2), ionization (σion ' 1.26 · 10−20m2), singledissociative ionization (σsdi ' 1.60 · 10−22m2), and excitation (σexc ' 3.66 · 10−22m2) [11]
16

2.2. Axial magnetic field
2.1 magnetic cusp reduce the loss area.If N is the number of cusps and w the leak width the effective loss circumferencewill be Nw. So the fraction of ions/electrons lost by ambipolar diffusion at thewalls will be:
floss =Nw
2πR[14] (2.5)
where R is the circumference of the neutralizer.Total plasma current generated inside the neutralizer Ix = Ixb + Ixs (calculated inequations 1.6 and 1.9) must be equal to the current collected to the walls of theneutralizer, considering that the whole plasma is lost at the walls.This implies plasma current density to be 1
flosstime bigger than without plasma
confinement. Substituting in equation 2.4, plasma density in the neutralizer withmagnetic cusp confinement will be obtained.
np =jpfloss
1
e
1(eTemi
)0.5 (2.6)
It is lastly observed that in this model recombination of electrons with H+2 ions
in not considered, so 2.6 will probably overestimate np.An extimation of the leak width, from theoretical calculation for low pressures, isgiven by Liebermann [14] 3
w ' 4(rcerci)0.5 (2.7)
The geometric mean beetwen ion and electron Larmor radii: rci and rce.
2.2 Axial magnetic field
A second possiblity for plasma confinement is an axial magnetic field. Themagnetic field, produced with a series of coils wound around the neutralizer,should give a larger confinement time to the plasma particles along its field lines,reducing the loss of plasma at the walls of the neutralizer. To reduce the lossat the two ends of the neutralizer, a magnetic mirror is produced increasing thenumber of windings at both sides.In this case the steady state plasma density can be calculated by a diffusivemodel, that provides the plasma density in the volume by taking into accountthe different transport coefficients in a magnetic field. To this purpose, a 2Dmodel was prepared to quantify plasma confined: all the currents, densities, allthe quantities related with diffusion and transport and the magnetic field itselfwere calculated point-by-point in a grid representing the axial dimension z andthe radial direction r, with assuming a reasonable symmetry along the azimuthalcoordinate θ. The radius of the netralizer will be divided into nr intervals oflength ∆r = R/nr, while its length will be divided into nz intervals of length∆z = L/nz.Magnetic field was calculated in 3D space and then projected onto 2D. Magneticfield was calculated by a program that maps the magnetic field produced by asingle coil iterated for the all coils, using the superposition principle.In figure 2.2 and 2.3 an example of configuration of the magnetic field is shown; itis produced by a 100 coils, wound along the neutralizer, each one with a radius of
3In [14] Liebermann cites Hershkowitz et al., 1975
17

2.2. Axial magnetic field
0.045 m and a current of 1000 A. In this simulation magnetic field was calculatedonly inside the neutralizer (of 0.04 m of radius, 1.30 m of length and positioned0.40 m far from the beginning of the vessel) and in the two zones, before andafter the neutralizer, that are within 0.04 m from the axis of the neutralizer. Themagnetic mirror is obtained thanks to five coils all wound at the begining and atthe end of the neutralizer.As shown in figures 2.2 and 2.3, in the majority of the volume of the neutralizer,the axial component of the magnetic fiel, Bz, is dominant on the radial one, Br.This consideration will be significant in section 2.2.1.
Figure 2.2: Axial component of the magnetic field: Bz, before, inside and afterthe neutralizer
Figure 2.3: Radial component of the magnetic field: Br, before, inside and afterthe neutralizer
18

2.2. Axial magnetic field
2.2.1 Charged particle dynamics
Plasma dynamics will be determined by four forces: the pressure gradient, thecollisions beetwen particles, the Lorentz force, and the force due to the gradientof the magnetic field.The motion equation for each species: H+
2 ions and electrons will be 4:
0 = qnp(E + u×B)− np|mx|∇|B| − kTx∇np −mxnxνmxu (2.8)
where x = i, e refers to ions and electrons, np is the plasma density, equal forboth species, m is the magnetic moment, m is the mass and νm is the momentumtransfer elastic collision frequency. The following system will be obtained for ionsand electrons:
0 = qnpEz + qnx(uxrBθ − uxθBr)− np|mx|∇z|B| − kTx ∂np∂z −mxnpνxmu
xz
0 = qnpEθ + qnx(uxzBr − uxrBz)− np|mx|∇θ|B| − kTx ∂np∂θ −mxnpνxmu
xθ
0 = qnpEr + qnx(uxθBz − uxzBθ)− np|mx|∇r|B| − kTx ∂np∂r −mxnpνxmu
xr
(2.9)whith the usual convention x = e, i To simplify the two systems, vectors B and∇|B| will be further assumed to be parallel to the axis of the neutralizer through-out the neutralizer itself. This is not a very physical assumption because it wouldviolate the law ∇ ·B = 0. Anyway, it greatly semplifies equation 2.9 withoutloosing much information for the two following reasons: the first is that the lengthof the neutralizer will be much bigger than its diameter, implying the magneticfield, in this configuration, to be constant and parallel to z for the majority ofthe volume of the neutralizer, as as it was shown in the previous simulation. Thesecond reason is that the two regions, where the magnetic field B is not parallelto z, the two ends of the neutralizer, are not so relevant for gas ionization andplasma confinement: that is because in the initial part the beam radius is smaller,so the ionization is concentrated closely to the axis where the magnetic field isparallel to z; while the plasma generated by ionization in the ending region willbe mainly lost following the magnetic lines out of the neutralizer. Ratio |Br||Bz | isshown in figure 2.4In figure 2.4 the two black lines indicate the two ends of the neutralizer; as shown
in the figure, inside the neutralizer, assuming B ‖ z is not that far from reality.This semplification makes the plasma flux perpendicular to B (Γ⊥), to be in-dipendent from magnetic field gradient, so the dynamics will be determined bythe usual ambipolar perpendicular diffusion:
Γ⊥ = −Da⊥∇⊥n (2.10)
so, assuming B ‖ z, the radial flux in cilindrical coordinates will be
Γr = −Da⊥1
r
∂(rn)
∂r(2.11)
Along the axis of the neutralizer, with the previous simplification and upon solvingfor uxz , equation 2.9 becomes:
uxz = µxEz −|mx|mxνxm
∂B
∂z−Dx
1
np
∂np∂z
(2.12)
4equation 2.8 comes from [15]
19

2.2. Axial magnetic field
Figure 2.4: Ratio |Br||Bz |
Where µx = qmxνxm
and Dx = KTxmxνxm
are the mobility and diffusive coefficient ofthe x-species.Imposing uiz = uez and carring out Ez it is obtained:
Ez =∇zBµi + µe
(|mi|miνim
− |me|meνem
)+
1
np
∂np∂z
(Di −De
µi + µe
)(2.13)
By substituting equation 2.13 in equation 2.12 for ions or elecrons, upon solvingfor the plasma current along z: Γz = npuz, it is obtained:
Γz = −Da∂np∂z− np∇zB
(µiNe + µeNi
µi + µe
)(2.14)
where Da = µiDe+µeDiµi+µe
is the ambipolar diffusive coefficient, and Nx = |mx|mxνxm
is a coefficient related to a single species. To simplify the equation furtherNa = µiNe+µeNi
µi+µewas introduced similarly to Da.
After those calculations the plasma flux Γ in the 2D −model was obtained:
Γ =
{−Da
∂np∂z − np(∇zB)Na z,
−Da⊥∂np∂r r.
(2.15)
2.2.2 Plasma density
It was further imposed the conservation of the electric charge in cylindricalcoordinates:
∇ · Γ =∂Γz∂z
+1
r
∂(rΓr)
∂r= G− L (2.16)
where G and L are plasma generation and loss.The source term, G, can be calculated as
G = jionnyσiy (2.17)
where jion is the ionising current (beam current or stripped electron current aswidely described in section 1.3), ny is the density of the target y (that refers to
20

2.2. Axial magnetic field
neutral gas or plasma) and σiy is the cross section of ionization of the species y bythe ionising particle.5
Plasma loss (L) in the neutralizer, in this model, will be given by recombina-tion of thermal electrons with H+
2 ions. Ions will be considered fixed and theelectron speed to be distributed according to a Maxwell-Boltman distribution oftemperature Te; the loss term will be calculated as:
L = neKrecni (2.18)
where K =< σrecve >MB is the rate coefficient of recombination: the average ofthe cross section of recombination σrec ([11]) times the electron speed integratedover the Maxwell-Boltzmann distribution of the electrons.Equation 2.16 turns into the partial differential equation 2.19; upon solving thisequation, for each point of our 2D grid, the plasma density will be found.
[∇ · Γ]ri,zk =
[−∂Da
∂z
∂np∂z−Da
∂2np∂z2
− ∂np∂z
∂B
∂zNa − np
∂2B
∂z2N−np
∂B
∂z
∂Na
∂z
]ri,zk
+
−[
1
rDa⊥
∂np∂r− ∂Da⊥
∂r
∂np∂r−Da⊥
∂2np∂r2
]ri,zk
= [G− L]ri,zk
(2.19)
where ri = i ·∆r and zk = k ·∆z with i = 1, ..., nr and k = 1, ..., nz refers to thepoints of the grid.Equation 2.19 is solved in the 2D symmetric domain with a relaxation methodusing the following formulas for the derivative calculation of the quantity x(r, z):
∂x(r, z)
∂r|i,k =
xi+1,k − xi−1,k
2∆r∂x(r, z)
∂z|i,k =
xi,k+1 − xi,k−1
2∆z
(2.20)
and
∂2x(r, z)
∂r2|i,k =
xi+1,k + xi−1,k − 2xi,k
∆r2
∂2x(r, z)
∂z2|i,k =
xi,k+1 + xi,k−1 − 2xi,k
∆z2
(2.21)
By substituting 2.20 and 2.21 for plasma density in equation 2.19 and upon solvingfor the plasma density calculated at a given point (i, k):
ni,k =1
Ai,k(Gi,k − Li,k + ni,j+1Bi,k + ni,j−1Ci,k + ni+1,jDi,k + ni−1,jEi,k)
(2.22)
5All the cross sections σiy are in chapter 1.3
21

2.2. Axial magnetic field
where Ai,k, Bi,k, Ci,k, Di,k and Ei,k are coefficients whose expression is as follows:
Ai,k =∂2Bz∂z2
Na|i,k +∂Bz∂z
∂Na
∂z|i,k + 2
Da
∆z2|i,k +
2Da⊥∆r2
|i,k
Bi,k =Da
∆z2|i,k +
1
2∆z
(∂Da
∂z+∂Bz∂z
Na
)|i,k
Ci,k =Da
∆z2|i,k −
1
2∆z
(∂Da
∂z+∂Bz∂z
Na
)|i,k
Di,k =Da⊥∆r2|i,k +
1
2∆r
(Da⊥r
+∂Da⊥∂r
)|i,k
Ei,k =Da⊥∆r2|i,k −
1
2∆r
(Da⊥r
+∂Da⊥∂r
)|i,k
(2.23)
All the derivatives in equation 2.23 according to 2.20 and 2.21.
22

Chapter 3
Evolution of the beam throughthe neutralizer in differentconfigurations
This chapter will treat the composition of three H− beams through H2 gas, withdifferent degrees of ionization. The beam considered will be those three describedin the introdution of chapter 1.The objective of this chapter is to analyze the expected performances of a plasmaneutralizer and, comparing with a gas cell neutralizer, to understand which arethe neutralizing collisions, of beam particle with plasma, that ensure a plasmaneutralizer better performances.
3.1 Beam composition
To simulate the evolution of the beam through the neutralizer equation 1.4 wasused, with the initial conditions 1.3.The evolution of the beams was studied through: neutral hydrogen gas, 10% and30% degree of ionization hydrogen plasma; those percentage values were chosento compare the obtained results with experimental data [4].The ionization degree is defined as:
χ =npn
(3.1)
where np is the plasma density ans n is the total particle density: n = ngas+ni+nh.With this definition of plasma density it is assumed that in the secondary beamplasma, quasi− neutrality is ensured: ne ' ni ' np.In the next simulations the focus will be on knowing which is the compositionof the beams after a certain target thickness t.t. (defined in equation 3.2). Theaxial position z where a certain target thickness is reached is not considered inthis section, pressures infact will be adapted to reach the chosen target thickness.
t.t.(l) =
∫ l
0n(x)dx (3.2)
With Knowing that the evolution of a beam in a gas follows equation 1.5, andwith the cross section shown in table 1.1, for a 60 keV beam, the following results
23

3.1. Beam composition
are obtained shown in figures 3.1, 3.2 and 3.3.
Figure 3.1: Composition of a 60 keV beam through neutral gas
Figure 3.2: Composition of a 60 keV beam through 10% degree of ionizationplasma
Figure 3.3: Composition of a 60 keV beam through 30% degree of ionizationplasma
24
3.1. Beam composition
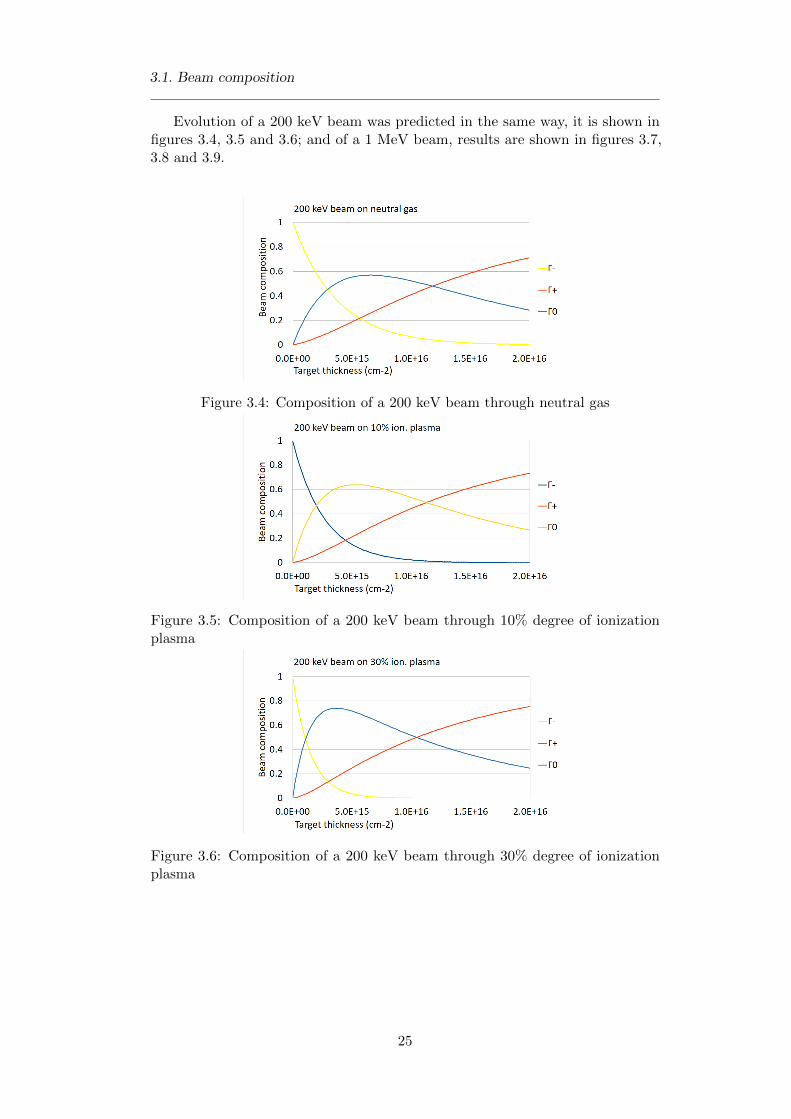
Evolution of a 200 keV beam was predicted in the same way, it is shown infigures 3.4, 3.5 and 3.6; and of a 1 MeV beam, results are shown in figures 3.7,3.8 and 3.9.
Figure 3.4: Composition of a 200 keV beam through neutral gas
Figure 3.5: Composition of a 200 keV beam through 10% degree of ionizationplasma
Figure 3.6: Composition of a 200 keV beam through 30% degree of ionizationplasma
25

3.1. Beam composition
Figure 3.7: Composition of a 1 MeV beam through neutral gas
Figure 3.8: Composition of a 1 MeV beam through 10% degree of ionizationplasma
Figure 3.9: Composition of a 1 MeV beam through 30% degree of ionizationplasma
26

3.1. Beam composition
In the figures, Γ0 represents the efficiency of a neutralizer with a given targetthickness and a given degree of ionization.In the graphs it is shown that the target thickness at the point where Γ− = Γ+
is almost the target thickness when selecting the maximum of efficiency. Thishappens for all beam energies and for all degrees of ionization considered.This is an advantageous coincidence, because, when selecting to work with thetarget thickness that optimizes neutralisation, also the same power at the and ofthe neutralizer is lost, in terms of H− and H+ particles.For these two reasons during operation the total target thickness, at the end ofthe neutralizer is the one at the maximum of Γ0.Only two differences between the compositions of different energy beams areobserved: the first is that, with increasing beam energy, a bigger target thicknessis needed in order to optimize the efficiency; this is an obvious consequence ofthe fact that the cross sections are decreasing with increasing energy. The seconddifference is that upon increasing the beam energy the asymptotic value of Γ0
decreases, but this is not a real problem because a neutralizer works in the firstarea of the graph, before the maximum of efficiency.In figure 3.10, 3.11 and 3.12 the estimated efficiency of the 60 keV, 200 keV and 1MeV beams, for neutralizers with different degrees of ionization, is shown againsttarget thickness,.
The most important thing that figures 3.10, 3.11 and 3.12 show is that efficiency
Figure 3.10: Efficiency of a 60 keV beam
Figure 3.11: Efficiency of a 200 keV beam
increases with increasing plasma ionization degree, and it is also shown that it
27

3.1. Beam composition
Figure 3.12: Efficiency of a 1 MeV beam
happens for all the energies considered. The higher the ionization degree, thehigher the efficiency. Here it is confirmed that, in order to reduce the beampower loss in neutralisation a plasma neutralizer is needed; a plasma neutralizerinfact could raise the performancees of neutral beam injector even more than tenpercentage points.In table 3.1 the maximum efficency estimed, for all considered configurations, isreported.For NIO1 beam it is estimed the efficiency for a 10% degree of ionization to be
energy χ = 0% χ = 10% χ = 30%
60keV 0.65 0.72 0.78200 keV 0.57 0.64 0.741 MeV 0.54 0.61 0.72
Table 3.1: Expected efficiencies
almost ten percentage points higher than with a neutral one; the same happendsfor a 200 keV beam and for ITER beam.In figures 3.10, 3.11 and 3.12 it is shown that the target thickness relative to themaximum of the efficiency decreases with increasing ionization degree. This canbe a second advantage of the plasma neutralizer with respect to the neutral gasone: because a lower target thickness is provided by a lower gas density; the lowerthe gas density the longer the experiment could be kept on, according to equation1.26.
energy χ = 0% χ = 10% χ = 30%
60 keV 4 · 1019 3 · 1019 2 · 1019 m−2
200 keV 7 · 1019 5 · 1019 4 · 1019 m−2
1 MeV 3 · 1020 2.5 · 1020 1.5 · 1020 m−2
Table 3.2: Target thickness relative to the optimal efficiency
28

3.3. Individuation of neutralizing collisions
3.2 Relation with experimental data
As anticipated in capter 2, it was chosen to study the composition af a 200 keVbeam to compare predictions with experimental data taken from [4].Figure 3.13 shows a good agreement between experimental data and predictedefficiency.
Figure 3.13: Estimation and eperimental data for efficiency of a 200 keV beam
3.3 Individuation of neutralizing collisions
In section 3.1 it was established that a plasma neutralizer ensures higher efficienciesthat a neutral gas one. This section will treat, in two different ways, which typeof collision guarantees the plasma neutralizer better efficiency than a neutral gasneutralizer.In figure 3.14 the product σs−0ns (s=g, e, i,h) is shown, that, according to theconvention established in section 1.1, is the product of neutralisation cross sectionof H− beam particles times the density of particles.In the figure neutralizing collisions with neutral gas are in blue, while neutralizingcollisions with plasma particles are in pink or similar colors.With the same conventions, in figure 3.15 σs0+ns (s=g, e,i,h), that represents theloss of H0 beam particles by reionization, is shown.In figures 3.14 and 3.15 it was chosen to calculate this quantity for a 30% degreeof ionization plasma.As it is shown in figure 3.14 the reaction H−, H+ → H,H+, e makes the plasma
contribution to neutralization about three times bigger than neutral gas, even ifplasma density is less than half the neutral density; this happens for all consideredenergies.In figure 3.15 it is shown that re-ionization given by collision with plasma particlesis comparable to that with neutral gas; furthermore the neutralization term isabout one order of magnitude higher than the re-ionization one.The combination of these facts allows the plasma neutralizer to attain a betterefficiency that a neutral gas one, for all energies considered.A second way to study the contribution of plasma and neutral gas to neutralizationinvolves studing the different contibutions, positive and negative, to the firstderivative of the function Γ0.
29

3.3. Individuation of neutralizing collisions
Figure 3.14: Evaluation of neutralizing collisions for a 30% degree of ionizationplasma
Figure 3.15: Evaluation of re-ionizing collisions for a 30% degree of ionizationplasma
From equation 1.4:
dΓ0(z)
dz= Γ+(z)
∑s
[σs+0ns] + Γ−(z)∑s
[σs−0ns]− Γ0(z)∑s
[σs0+ns] (3.3)
splitting the neutral gas and plasma contribution it is obtained:{dΓ0(z)dz = Γ+(z)
(σg+0ng +
∑x[σx+0nx]
)+ Γ−(z)
(σg−0ng +
∑x[σx−0nx]
)+
−Γ0(z)(σs0+ns +
∑x[σx0+nx]
)(3.4)
where x = i, e, h.In figure 3.16, 3.17 and 3.18 the cumulative graphs are shown for positive andnegative contribution to the first derivative of Γ0 for a 60 keV beam at the usualdegrees of ionization.Obviously in figure 3.16 the contribution of reactions with the plasma is zero
throughout all the target thickness crossed by the beam. In figure 3.17 but evenmore in 3.18 it is shown that the plasma positive contribution to the first derivativeis much higher than its negative contribution.Comparing figure 3.16 with 3.18 is visible that, with a 30% degree of ionizationplasma, the total positive contribution to the first derivative is three times biggerthan with a neutral gas.
30

3.3. Individuation of neutralizing collisions
Figure 3.16: Contribution to first derivative of Γ0 for a 60 keV beam on neutralgas
Figure 3.17: Contribution to first derivative of Γ0 for a 60 keV beam on 10%degree of ionization plasma
Figure 3.18: Contribution to first derivative of Γ0 for a 60 keV beam on 30%degree of ionization plasma
Analogously the same graphics are produced for 200 keV and 1 MeV beam, thesame trend for all energies considered is observed.
31

3.3. Individuation of neutralizing collisions
Figure 3.19: Contribution to first derivative of Γ0 for a 200 keV beam on neutralgas
Figure 3.20: Contribution to first derivative of Γ0 for a 200 keV beam on 10%degree of ionization plasma
Figure 3.21: Contribution to first derivative of Γ0 for a 200 keV beam on 30%degree of ionization plasma
32

3.3. Individuation of neutralizing collisions
Figure 3.22: Contribution to first derivative of Γ0 for a 1 MeV beam on neutralgas
Figure 3.23: Contribution to first derivative of Γ0 for a 1 MeV beam on 10%degree of ionization plasma
Figure 3.24: Contribution to first derivative of Γ0 for a 1 MeV beam on 30%degree of ionization plasma
33

3.3. Individuation of neutralizing collisions
34

Chapter 4
Design of a beam-drivenplasma neutralizer for NIO1
4.1 Description of NIO1
With the model of the neutralizer proposed in section 0.1 a minimum diameterfor the neutralizer is needed in order not to loose the power of the beam directlyto the neutralizer walls.In table 4.1 the minimum diameter of the neutralizer is shown against distancefrom the source in the three different beam configurations exposed in section 0.1 .The vacuum in the vessel will be kept by two cryogenic pumps with the nominal
distance 0.80 1.00 1.20 1.40 1.60 m total current
1 beam 1.30 1.50 1.70 1.90 2.10 cm 14.4 mA4 beams 4.12 4.32 4.52 4.72 4.92 cm 57.8 mA9 beams 6.95 7.15 7.35 7.55 7.75 cm 130 mA
Table 4.1: Minimum diameter of the neutralizer
speed Rs = 2000 l/s and the capacity Q = 900 Pa m3.The diameter and length of the vessel are respectively 0.35 m and 2 m. Eachpipe going from the vessel to a pump has a diameter dp = 0.20 m and a length oflp = 0.20 m.Here is a table summarizing all the dimensions of the system [8].
L 2 mD 0.35 mlp 0.2 mld 0.2 mQ 900 Pam3
Rs 2000 l/s
4.2 Neutralizer geometry
The geometry of the neutralizer-vessel system was shown in figure 5 while the gasflow was sketched in 1.2.The gas will be supplied at the neutralizer center in order to mantain the chosen
35

4.3. Neutral gas flow and pressure profile
target thickness along the path of the beam.The diameter and length of the neutralizer will be determined by analytical studyin section 4.3.All the resistances of the system were calculated as the reciprocal of the respectiveconductances, calculated in section 1.4 and, with the geometry previously de-scribed, the electrical equivalent resistive system, shown in figure 4.1, is obtained.The resistance beetwen P2 and the “ground” is not Rp +Rs but
Rp+Rs2 because,
Figure 4.1: resistive system
as anticipated, the vacuum is mantained by two cryogenic pumps, halving theresistence there would have been with just one pump. With the resistive systemshown in figure 4.1 the resistance seen beetwen p2 and the “ground” is:
Req =
(Rp +Rs
2
)+[(Rtn/2 +Ret
)||(Rc +Rtn/2
)](4.1)
4.3 Neutral gas flow and pressure profile
As anticipated in section 1.4, the conductance C of a channel, in molecular flow,does not depend on difference of pressure ∆p but only on geometric propreties ofthe channels like length, diameter etc.; so equation 4.2 shows a linear dependenceof flux on pressure.
F = C ·∆p (4.2)
Equation 4.2 and the system shown in figure 4.1 link together the pressures inthe different points of the neutralizer with the following equations:
p2 = Ftot · [(Rn/2 +Rec +Rc)‖(Rn/2 +Ren) +Rep +Rp] (4.3)
where Ftot is the total flux from the centre of the neutralizer to the pumps.
p1 = Ftot · (Rn/2 +Ren) (4.4)
p3 = p1 + (Ftot −p2 − p1
Rn/2 +Ren) · (Rec +Rc) (4.5)
There is still a degree of freedom that is the pressure at the center of the neutralizerp2, to fix it, the target thickness is settled along the path of the beam to be3 · 1019m−2: the target thickness required for the maximum efficiency for 60 keV
36

4.3. Neutral gas flow and pressure profile
beam on a neutral gas, as computed in section 3.1.With those formulas neutral gas density along the neutralizer was calculated fordifferent configurations of the neutralizer in order to reach the previous targettickness at the end of the neutralizer.In figure 4.2 density profiles are shown for different neutralizers. In this simulationa neutralizer of 1.30 m positioned 0.40 m far from the beginning of the vessel wasused. Every two centimetres the density profile in neutralizers with diametersfrom 2 to 18 cm, was scanned.In the figure diameter was reduced progressively from 18 cm (light blue line) to
Figure 4.2: Density profile with different diameters
2 cm (black line). Gas density in the neutralizer increases with reducing of thediameter.From figure 4.2 it is evident that a neutralizer with a smaller diameter confinesthe neutral gas better that a larger one, this is the reason why it will be chosento reduce the radius of the neutralizer as much as possible.A scan of the density profile was performed when changing the length of theneutralizer, in this simulation diameter was kept to 6 cm and the neutralizer waspositioned 0.40 m far from the beginning of the vessel.In figure 4.3 length was increased progressively from 0.6 m (light blue line) to
1.4 m (black line).In the figure it is shown that the shorter the neutralizer, the higher the maximumof neutral gas density, but here the relevant quantity is not the maximum ofneutral gas density but the target thickness of neutral gas inside the neutralizer:
ttgin =
∫ neut.end
neut.beginngas(x)dx (4.6)
that is proportional to the probability of ionization, inside the neutralizer, by abeam particle.As previously said, a smaller radius neutralizer will ensure a higher gas density
therefore, according to equation 1.6, a higher first ionization current Ixb. It is nowtime to decide whether better to use a smaller radius neutralizer, that will not
37

4.3. Neutral gas flow and pressure profile
Figure 4.3: Density profile with different length
allow to use the 9 beamlet configuration, renouncing some power, or a larger oneusing all the power supplied.Limits to the neutralizer radius are in table 4.1; according to the table and equa-tion 1.6 the first ionization current for different configuration of the neutralizerwas calculated and shown in figure .Where the utilisation time is calculated with equation 1.26.
From figure 4.5 it is evident that the best configuration is that with a 8 cmdiameter with all the power suplied.
38

4.4. Expected performances
Figure 4.4: In the figure target thickness in the neutralizer for different length isshown, the targhet thickness in the neutralizer were calculated keeping constantthe total target thickness, through the all path of the beam, to 3 · 1019 m−2
Figure 4.5: First ionization plasma current in different configurations neutralizers
4.4 Expected performances
This section will treat the expected performances of NIO1 neutralizer in differentmagnetic field configurations. Whit Changing the plasma confinement, the neu-tralizer length and target thickness, the best configuration of the neutralizer willbe sought for, in order to reach the highest degree of ionization in the neutralizer.
4.4.1 Cusps magnetic field
To extimate the neutralizer efficiency plasma density in the neutralizer has to befound. Plasma density np will be calculated with equation 2.6.As determined in section 4.3 the optimal neutralizer radius would be 4 cm. Dueto lack of space (a neutralizer circumference of about 12.6 cm), the magneticcusps will be produced by 6 magnets oround the neutralizer which should produce
39

4.4. Expected performances
a field of about 0.1 T. Calculating the leak width (w), with equation 2.7, themagnetic field is considered constant at the neutralizer border.Al the quantities related with plasma generation, first ionization current, strippedelectron current etc. were calculated along z axis. In this simulation beam currentjbeam was assumed uniform on the radial and azimuthal coordinates, so the onlycoordinate which metters is the axial one z.Nine simulations of plasma density were made with electron temperature Te = 10eV and ion temperature Ti = 0.03 eV, with changing the length of the neutralizer.Densities and ionization degrees were calculated for neutralizer from 0.60 m up to1.40 m of length every 0.10 m.In figure 4.6 neutral gas density and plasma density are shown. Neutral gas densityis in blue, from light blue 0.60 m neutralizer, to dark blue 1.40 m neutralizer;while plasma density is in red, from light red 0.60 m neutralizer, to dark red 1.40m neutralizer.In figure 4.7 ionization degree is shown, with the previous convention: from light
Figure 4.6: Neutral gas and plasma density
bluee 60 cm neutralizer, to dark bluee 140 cm neutralizer.As it is shown in the figure, the maximum ionization degree in the neutralizer is
Figure 4.7: Ionization degree
40

4.4. Expected performances
less than 1%. A further comparison beetwen different length neutralizers is shownin figure 4.8.The figure shows the maximum ionization degree, the maximum local plasma
Figure 4.8: Comparison between parameters of different length neutralizers
current jx and the utilization time for different length neutralizers. It is shown thatthe longer the neutralizer the higher the maximum plasma density; as predictedby equation 1.26 even utilization time encreases with increasing neutralizer length.Anyway from figure 4.8 it was found that a self powered plasma neutralizer,confined with magnetic cusps, will not be usefull for NIO1 beam.With a ionization degree below 1% infact, the neutralizer efficiency will notincrease significantly so as to be measurable.Anyway in figure 4.9 the beam composition through the neutralizer is shown fordifferent lengths. Whit the same convention as the previus figures the colorsgoes from light to dark in correspondence to simulations from 0.60 m to 1.40 mneutralizers. As in chapter 3 blue lines refer to Γ0, red lines to Γ+ and yellowlines to Γ−.In the figure it is shown that efficiency reaches about 65%, the same efficiency ofneutral gas neutralizer.
Figure 4.9: Beam composition for different length neutralizer
41

4.4. Expected performances
4.4.2 Axial magnetic field
As said in section 2.2, plasma confinement with axial magnetic field was studiedthanks to a 2D model that quantifies plasma density point − by − point in theneutralizer.The regions of the vessel considered in the simulations will be those traversed bythe beam: the neutralizer and the two zones of the vessel, before and after theneutralizer, that are within 4 cm from the axis of the neutralizer. According towhat was found in section 4.3 4 cm is the optimal neutralizer radius for NIO1beam features.Beam current was approximated along the radius as a sin-like distribution whichis 0 at border and has the maximum at the center. To be normalize to NIO1current Ibeam = 0.130 A, the beam current density jbeam(r) was calculated as thefollowing expression:
jbeam(r) =
I
2πR2b
11− 8
π2cos( πr
2Rb) if r ≤ Rb,
0 if r > Rb.(4.7)
where Rb is the beam radius.The beam width, in the 9 beamlets configuration, would be of of 3.3 cm at the
Figure 4.10: Current density of a 3.5 cm beam in a neutralizer of 4 cm
beginning and 3.9 cm at the end of the neutralizer, so a constant beam radiusapproximation, throughout the neutralizer, was chosen to simplify the calculationwithout loosing much information. The beam radius was approximated equal to3.5 cm, as in figure 4.10.Plasma density was calculated according to equation 2.22. In equation 2.22 plasmagain and loss: G and L were calculated according to equations 2.17 and 2.18; theelectron temperature was approximated to 10 eV, while the ions are consideredcold, 0.3 eV.Neutral gas density was considered constant along radial coordinate and calculatedalong the axial one according to section 4.3, thus keeping the neutral gas targetthickness after the neutralizer fixed to 3 · 1019 m−2.The relaxation method, used to extimate the plasma density np, in these simula-tions was structured this way. Plasma density inside the neutralizer was initialized0 m−3 at the first iteration; than, all the coefficients of equation 2.22 were calcu-lated according to what previously said. Than Equation 2.22 was iterated 1000times. After the first relaxation the entire cycle, calculations of coefficients andrelaxation method of np, was repeated 100 times, with the new values of np found
42

4.4. Expected performances
in the previous cycle.With this method four different simulations of plasma density were made.
Standard simulation
Firstly the case that, according to preliminary studies (section 4.3), is expected toensure better perfonrmances was studied: a 1.30 m neutralizer with a 4 cm radiuspositioned 0.40 metres from the beginning of the vessel. With this configurationthe pumps could work for about 6 hours before being regenerated.Magnetic field is produced by a series of 100 coils each with the nominal currentof 1000 A; to produce the magnetic mirror five coils are positioned at the two endof of the neutralizer.Another approximation was needed due to a convergence problem of the algorithm.The force given by the gradient of |B|, in formula ∇|B|Na, is very high, specallyclose to the magnetic mirrors, this makes the algorithm diverge. This is due tothe approximation ∇|B| ‖ z that is good inside the neutralizer but is no longercorrect close the magnetic mirror where the radial component becomes bigger;this approximation overestimates plasma confinement of magnetic mirror. So, toavoid this convergence problem the value of ∇|B|Na in modulus was cut to themaximum of 1014.Neutral gas density was calculated as in section 4.3, then the local value of np issubtracted to ngas.Plasma gain per second is shown in figure 4.12; it is shown that plasma gain isconcentrated in the center where neutral gas density is higher. Anyway plasmagain in not symmetrical with respect to the center of the neutralizer; in the secondhalf of the neutralizer infact, stripping electrons current is higher, so there thecontribution of stripped electron to ionization is higher.Plasma density is shown in figure 4.13. Outside the neutralizer plasma densitywas set equal to 0 m−3 because particles generated there would be lost followingthe magnetic lines to the wall of the vessel. Plasma density in the middle of theneutralizer reaches the value of 1.5·10−17 m−3 a value that could be experimentallyverified.Figure 4.14 shows the ionization degree χ. As the figure shows, with this config-
Figure 4.11: Neutral gas density
uration, ionization degree can only reach about 1%, not enough to appreciate thebenefits of a plasma neutralizer on the neutralization efficiency.It seems that for NIO1 a self powered plasma neutralizer would not generateenough plasma to optimize neutralization.In figure 4.15 the neutral fraction of the beam Γ0 at the end of the neutralizer is
43

4.4. Expected performances
Figure 4.12: Plasma gain per second
Figure 4.13: Plasma density
Figure 4.14: Ionization degree
Figure 4.15: Neutralizer efficiency Γ0 at the end of the neutralizer
shown; from the figure it is visible that close to the neutralizer axis, where theionization degree is higher, the neutralizer is more efficient than at the border,where the beam traverses only neutral gas, but the difference is irrelevant. Plasmacontribution increases neutralizer efficiency about 0.5 percentage point.
0.6 m neutralizer
The second simulation was made with a neutralizer with 0.60 m length, againwith keeping constant the total target thickness at the end of the neutralizer.In this configuration the system could operate for about 1 hour before having to
44

4.4. Expected performances
regerate the pumps, according to equation 1.26.The magnetic confinement is provided by 46 coils instead of 100 due to the shorterlength. For the same reason to produce the magnetic mirrors 3 coils were used atthe beginning and at the end of the neutralizer.With this configuration of the neutralizer almost the same ionization degree isreached as in the previous case. For this reason even neutralizer efficiency will bethe same as in the previous case.
Figure 4.16: Plasma gain per second
Figure 4.17: Plasma density
Figure 4.18: Ionization degree
5 Ev electrons
The case of colder electron plasma was studied. In this simulation the same con-figuration of the first simulation was used but changing the electron temperature,from 10 eV to 5 eV.Results are shown with the same conventions as the previous simulations in figures4.19, 4.20 and 4.21.
Not even in this simulation ionization degree gets higher; on the contrary itseems to be equal to that of the first simulations. Higher ionization degree wasexpected due to the lower diffusion of the cold electrons. Anyway recombinationcould cancel this positive aspect: cross section of recombination infact is higherfor lower electron temperature, therefore the loss coefficient L will be higher.
45

4.4. Expected performances
Figure 4.19: Plasma gain per second
Figure 4.20: Plasma density
Figure 4.21: Ionization degree
With those three simulations it was demonstrated that for NIO1 a self poweredplasma neutralizer would not generate enough plasma to achieve a relevant in-crease of neutralization efficiency.
In figure 4.22 a comparison beetwen degrees of ionization in the three con-
Figure 4.22: Longitudinal view of ionization degree on the axis of the neutralizer
siguration is shown. In the figure longitudinal view of ionization degree, on theneutralizer axis, in the three configurations, is shown. In the figure ionizationdegree of first simulation neutralizer, with 10 eV electrons is in red; ionizationdegree of the shorter neutralizer is the orange line, while degree of ionizationobtained with the last simulation, with 5 eV electrons, is represented by the blueline.
46

4.4. Expected performances
A neutralizer in the first configuration guarantees higher ionization degree thanother two.
0.39 A beam current
Whit the previous three simulations it was found that for NIO1 a self poweredplasma neutralizer will not generate enough plasma; beam current infact doesnot guarantee enough ionization. The gain of plasma by primary ionization isproportional to the beam current, a higher beam current would generate moreplasma in the neutralizer.In this last simulation the same configuration as the first one will be kept but withthree times as much total beam current, up to 0.39 A, to quantify if with a highercurrent would generate enough plasma to obtain significantly higher efficiencythan with a neutral gas neutralizer.Results are shown in figures 4.23, 4.24 and 4.25. Figure 4.25 shows that plasma
Figure 4.23: Plasma gain per second
Figure 4.24: Plasma density
Figure 4.25: Ionization degree
degree of ionization reaches about 1.5%, so by tripling the beam corrent ionizationdegree is doubled.In figure 4.26 the neutralization efficiency Γ0 at the end of the plasma neutralizeris shown. From the figure it is visible that close to the neutralizer axis, wherethe ionization degree is higher, the neutralizer is more efficient than at theborder, where the beam traverses only neutral gas, as in the first simulation. In
47

4.4. Expected performances
this simulation plasma contribution increases neutralization efficiency about 1percentage points, twice the contribution of the first simulation.
Figure 4.26: Neutralizer efficiency Γ0 at the end of the neutralizer
48

Conclusions
Optimization of auxiliary heating systems will be crucial in future fusion plants.Among the major issues, this thesis is concerned with the efficiency of negativeion-based neutral beam injectors neutralizers.Neutralization of three high energy negative ion beams was studied with an energyof 60 keV, 200 keV and 1 MeV. It was found that, for all three negative ionbeams, a plasma neutralizer guarantees better efficiency than the usual neutralgas neutralizer.The positive contribution of plasma to neutralization was quantified for all threebeams and for different degrees of ionization of the plasma neutralizers. It wasfound that, for each energy considered, neutralization efficiency grows with in-creasing plasma degree of ionization, proving the possible relevance of plasmaneutralizers in the controlled thermonuclear fusion panorama.For a 60 keV beam, neutralization efficiency of a 30% degree ionization plasmaneutralizer is extimed about 25 percentage points higher than the efficiency ob-tained with neutral gas neutralizer.Prediction of the neutralizing model cosidered were successfully compared withexperimental data for a 200 keV beam.The most important neutralizing collisions of beam particles on plasma were stud-ied to understand which collisions guarantee plasma neutralizers better efficiencythan neutral gas neutralizers, finding that stripping reactions of negative beamparticles on plasma are the main responsible for neutralization.The subsequent step of this work was the design of a self powered plasma neutral-izer for NIO1 negative ion beam source. A self powered plasma neutralizer doesnot require external plasma generation, plasma infact is generated by the beamitself with ionizing collisions with background gas.Gas flux through NIO1 neutralizer-vessel system was studied with a lumped modelin order to find the neutralizer configuration which guarantees higher neutral gasdensity in the neutralizer and so higher ionization probability by beam particles.It was valued that the smaller the neutralizer radius, the higher the gas densityin the neutralizer, this with the condition of larger neutralizer radius than beamradius. Utilization time of the neutralizer-vessel model proposed was extimed ofabout six hours hours with cryogenic pumps.With this purpose two different plasma confinement models were studied: mag-netic cusps and magnetic coils. It was found that magnetic coils confinementguarantees higher plasma density than magnetic cusps.It was demonstrated that for NIO1 beam a self powered plasma neutralizer is notconfigurable due to lack of beam current. Plasma degree of ionization infact isvalued to reach about 1%.Anyway a higher current beam could provide the density required to reach 10−20%ionization degree thus increasing the neutralizer efficiency by almost the same
49

4.4. Expected performances
percentage without requiring any device for plasma production.Plasma neutralizers will play a important role in optimizing neutral beam injectorsefficiency; self powered plasma neutralizers could guarantee higher neutralizationefficiency for high current beams as for the fusion demonstration reactor DEMO.It is clear that a self powered plasma neutralizer will not work with NIO1 beamfeatures because degree of ionization is insufficient to influence the neutralizationefficiency. By contrast, if the plasma density can be increased by a dedicatedplasma generator, test on neutralization with NIO1 will be made.Neutralization efficiency could be compared for different degrees of ionizationplasma.In a larger scale, applying gas-beam interaction model to the DEMO neutralbeam injectors plasma generation could be calculated.The objective will be that of increasing negative ion neutralization reaching 80%efficiency with a self powered plasma neutralizers.
50

Bibliography
[1] Fusion Physics, International Atomic Energy Agency, Vienna, 2012.
[2] C.F. Barnett, Atomic Data for Fusion. Volume 1, (ORNL-6086),1990.
[3] P. Veltri, Lessons on ion sources, Course of Basic Plasma Physics, Universityof Padova, 2015-2016.
[4] M. Hanada, M. Kashiwagi, T. Inoue, K. Watanabe, and T. Imai. Experimentalcomparison between plasma and gas neutralization of high-energy negativeion beams, Review of Scientific Instruments, (75,1813), 2004.
[5] K.H. Berkner, R.V. Pyle, S.E. Savas and K.R. Stalder. Plasma neutralizersfor H− or D− beams. Upton, NY, Oct. 1980,
[6] E. Surrey. Gas heating in the neutralizer of the ITER neutral beam injectionsystems, Nucl. Fusion (46), 2006.
[7] E. Surrey and A.Holmes, The beam driven plasma neutralizer, AIP ConferenceProceedings (1515, 532), 2013.
[8] M. Cavenago et al,. Design of a versatile multiaperture negative ion source,Rewiew of Scientifin Instruments (81, 02A713), 2010.
[9] M. Cavenago et al., Status o f NIO1 construction, AIP Conf. Proc. 1390,640-649 (2011), American Institute of Physics, 2011.
[10] N. Fonnesu, M. Cavenago, G. Serianni, P. Veltri, Particle Transport and HeatLoads in NIO1, Oct. 2015.
[11] R.K. Janev, W.D. Langer, K. Evans Jr., D.E. Post Jr, Elementary Processesin Hydrogen-Helium Plasmas, Springer-Verlag, 1987.
[12] R.K. Janev, J.J. Smith, Review of Fundamental Processes and Applicationsof Atoms and Ions, World scientific publishing 1993.
[13] B. Ferrario, Introduzione alla tecnologia del vuoto, Patron Editore, Bologna,1999.
[14] M. Liebermann, A. Lichtenberg, Principles of Plasma Discharges and Materi-als Processing, Wiley, May 2005.
[15] NRL plasma formulary. 2013. Naval Research Laboratory, Washington DC.
51

BIBLIOGRAPHY BIBLIOGRAPHY
52

List of Tables
1.1 List of cross section of interation on beam particles with backgroundgas . . . . . . . . . . . . . . . . . . . . . . . . . . . . . . . . . . . . 6
1.2 Cross sections for ionization of background gas by 60 keV beamparticles . . . . . . . . . . . . . . . . . . . . . . . . . . . . . . . . . 9
1.3 Cross sections of generation of stripping electrons by 60 keV beamparticles on the background gas . . . . . . . . . . . . . . . . . . . . 9
1.4 Cross sections of ionization by 33.3 eV stripped electrons . . . . . 101.5 Values of Kf . . . . . . . . . . . . . . . . . . . . . . . . . . . . . . 13
3.1 Expected efficiencies . . . . . . . . . . . . . . . . . . . . . . . . . . 283.2 Target thickness relative to the optimal efficiency . . . . . . . . . . 28
4.1 Minimum diameter of the neutralizer . . . . . . . . . . . . . . . . . 35
53

LIST OF TABLES LIST OF TABLES
54

List of Figures
1 Sketch of different energy supplies to a tokamak [3] . . . . . . . . . 1
2 Nio1 ovrerall final version design . . . . . . . . . . . . . . . . . . . 2
3 Longitudinal section (xz plane) of the NIO1 ion source and acceler-ator assembly. . . . . . . . . . . . . . . . . . . . . . . . . . . . . . . 3
4 Longitudinal section (xy plane) of the NIO1 ion source . . . . . . . 3
5 Neutralizer form . . . . . . . . . . . . . . . . . . . . . . . . . . . . 4
1.1 Cross section of interaction of beam particles with the gas target . 7
1.2 Resistive system canalisations in NIO1 neutralizer . . . . . . . . . 12
2.1 Section, in cylindrical coordinates, of magnetic cusp configuration. 15
2.2 Axial component of the magnetic field: Bz, before, inside and afterthe neutralizer . . . . . . . . . . . . . . . . . . . . . . . . . . . . . 18
2.3 Radial component of the magnetic field: Br, before, inside andafter the neutralizer . . . . . . . . . . . . . . . . . . . . . . . . . . 18
2.4 Ratio |Br||Bz | . . . . . . . . . . . . . . . . . . . . . . . . . . . . . . . . 20
3.1 Composition of a 60 keV beam through neutral gas . . . . . . . . . 24
3.2 Composition of a 60 keV beam through 10% degree of ionizationplasma . . . . . . . . . . . . . . . . . . . . . . . . . . . . . . . . . . 24
3.3 Composition of a 60 keV beam through 30% degree of ionizationplasma . . . . . . . . . . . . . . . . . . . . . . . . . . . . . . . . . . 24
3.4 Composition of a 200 keV beam through neutral gas . . . . . . . . 25
3.5 Composition of a 200 keV beam through 10% degree of ionizationplasma . . . . . . . . . . . . . . . . . . . . . . . . . . . . . . . . . . 25
3.6 Composition of a 200 keV beam through 30% degree of ionizationplasma . . . . . . . . . . . . . . . . . . . . . . . . . . . . . . . . . . 25
3.7 Composition of a 1 MeV beam through neutral gas . . . . . . . . . 26
3.8 Composition of a 1 MeV beam through 10% degree of ionizationplasma . . . . . . . . . . . . . . . . . . . . . . . . . . . . . . . . . . 26
3.9 Composition of a 1 MeV beam through 30% degree of ionizationplasma . . . . . . . . . . . . . . . . . . . . . . . . . . . . . . . . . . 26
3.10 Efficiency of a 60 keV beam . . . . . . . . . . . . . . . . . . . . . . 27
3.11 Efficiency of a 200 keV beam . . . . . . . . . . . . . . . . . . . . . 27
3.12 Efficiency of a 1 MeV beam . . . . . . . . . . . . . . . . . . . . . . 28
3.13 Estimation and eperimental data for efficiency of a 200 keV beam . 29
3.14 Evaluation of neutralizing collisions for a 30% degree of ionizationplasma . . . . . . . . . . . . . . . . . . . . . . . . . . . . . . . . . . 30
3.15 Evaluation of re-ionizing collisions for a 30% degree of ionizationplasma . . . . . . . . . . . . . . . . . . . . . . . . . . . . . . . . . . 30
55

LIST OF FIGURES LIST OF FIGURES
3.16 Contribution to first derivative of Γ0 for a 60 keV beam on neutralgas . . . . . . . . . . . . . . . . . . . . . . . . . . . . . . . . . . . . 31
3.17 Contribution to first derivative of Γ0 for a 60 keV beam on 10%degree of ionization plasma . . . . . . . . . . . . . . . . . . . . . . 31
3.18 Contribution to first derivative of Γ0 for a 60 keV beam on 30%degree of ionization plasma . . . . . . . . . . . . . . . . . . . . . . 31
3.19 Contribution to first derivative of Γ0 for a 200 keV beam on neutralgas . . . . . . . . . . . . . . . . . . . . . . . . . . . . . . . . . . . . 32
3.20 Contribution to first derivative of Γ0 for a 200 keV beam on 10%degree of ionization plasma . . . . . . . . . . . . . . . . . . . . . . 32
3.21 Contribution to first derivative of Γ0 for a 200 keV beam on 30%degree of ionization plasma . . . . . . . . . . . . . . . . . . . . . . 32
3.22 Contribution to first derivative of Γ0 for a 1 MeV beam on neutralgas . . . . . . . . . . . . . . . . . . . . . . . . . . . . . . . . . . . . 33
3.23 Contribution to first derivative of Γ0 for a 1 MeV beam on 10%degree of ionization plasma . . . . . . . . . . . . . . . . . . . . . . 33
3.24 Contribution to first derivative of Γ0 for a 1 MeV beam on 30%degree of ionization plasma . . . . . . . . . . . . . . . . . . . . . . 33
4.1 resistive system . . . . . . . . . . . . . . . . . . . . . . . . . . . . . 364.2 Density profile with different diameters . . . . . . . . . . . . . . . . 374.3 Density profile with different length . . . . . . . . . . . . . . . . . 384.4 In the figure target thickness in the neutralizer for different length
is shown, the targhet thickness in the neutralizer were calculatedkeeping constant the total target thickness, through the all path ofthe beam, to 3 · 1019 m−2 . . . . . . . . . . . . . . . . . . . . . . . 39
4.5 First ionization plasma current in different configurations neutralizers 394.6 Neutral gas and plasma density . . . . . . . . . . . . . . . . . . . . 404.7 Ionization degree . . . . . . . . . . . . . . . . . . . . . . . . . . . . 404.8 Comparison between parameters of different length neutralizers . . 414.9 Beam composition for different length neutralizer . . . . . . . . . . 414.10 Current density of a 3.5 cm beam in a neutralizer of 4 cm . . . . . 424.11 Neutral gas density . . . . . . . . . . . . . . . . . . . . . . . . . . . 434.12 Plasma gain per second . . . . . . . . . . . . . . . . . . . . . . . . 444.13 Plasma density . . . . . . . . . . . . . . . . . . . . . . . . . . . . . 444.14 Ionization degree . . . . . . . . . . . . . . . . . . . . . . . . . . . . 444.15 Neutralizer efficiency Γ0 at the end of the neutralizer . . . . . . . . 444.16 Plasma gain per second . . . . . . . . . . . . . . . . . . . . . . . . 454.17 Plasma density . . . . . . . . . . . . . . . . . . . . . . . . . . . . . 454.18 Ionization degree . . . . . . . . . . . . . . . . . . . . . . . . . . . . 454.19 Plasma gain per second . . . . . . . . . . . . . . . . . . . . . . . . 464.20 Plasma density . . . . . . . . . . . . . . . . . . . . . . . . . . . . . 464.21 Ionization degree . . . . . . . . . . . . . . . . . . . . . . . . . . . . 464.22 Longitudinal view of ionization degree on the axis of the neutralizer 464.23 Plasma gain per second . . . . . . . . . . . . . . . . . . . . . . . . 474.24 Plasma density . . . . . . . . . . . . . . . . . . . . . . . . . . . . . 474.25 Ionization degree . . . . . . . . . . . . . . . . . . . . . . . . . . . . 474.26 Neutralizer efficiency Γ0 at the end of the neutralizer . . . . . . . . 48
56