Design of a load cell with large overload capacity · DESIGN OF A LOAD CELL WITH LARGE OVERLOAD...
13
DESIGN OF A LOAD CELL WITH LARGE OVERLOAD CAPACITY Farhad Aghili Canadian Space Agency (CSA), Saint-Hubert, Quebec, Canada, J3Y 8Y9 E-mail: [email protected] Received April 2010, Accepted October 2010 No. 10-CSME-24, E.I.C. Accession 3187 ABSTRACT To increase the signal-to-noise (S/N) ratio and sensitivity of a load cell, it is desirable to design a structure that generates large strain close to maximum allowable strain of the sensor material for a given rating load force. However, accommodating the margin of safety with respect to overloading, compromises the sensitivity. This paper presents the design, analysis, and prototype testing of a load cell which can provide large overload protection capacity without compromising the sensitivity of the sensor. This is achieved by a special design of sensor structure that becomes virtually rigid after its flexures reach their maximum deflection, thereby the sensor can be protected against a large over load. The sensor dimensions, which maximizes the sensor’s sensitivity, for given values of rating load and overload are obtained through mechanical strength analysis. A load cell prototype is fabricated and then tested to measure its linearity and overload characteristics. The experimental results show an accuracy of 0.2% of full scale and overload protection of the sensor flexures. Keywords: load cell; force sensor; force transducer; overload protection. CONCEPTION D’UNE CELLULE DE CHARGE AVEC UN GRAND CAPACITE ´ DE SURCHARGE RE ´ SUME ´ Pour augmenter le rapport signal sur bruit et la sensibilite ´ d’une cellule de charge, il est souhaitable de concevoir une structure qui ge ´ne `re des de ´formations avoisinant la limite permise du mate ´riau pour une charge donne ´e. Toutefois, prendre en compte un facteur de se ´curite ´ par rapport a ` la surcharge peut compromettre la sensibilite ´. Cet article pre ´sente la conception, l’analyse et la validation expe ´rimentale d’une cellule de charge pouvant fournir une protection contre la surcharge sans compromettre la sensibilite ´ du capteur. Cela est atteint gra ˆce a ` une conception particulie `re de la structure du capteur qui devient pratiquement rigide juste avant l’atteinte de l’e ´tat de de ´formation maximale, le capteur peut e ˆtre ainsi prote ´ge ´ des surcharges. Les dimensions optimisant la sensibilite ´ du capteur pour des valeurs de charge et de surcharge donne ´es sont obtenues d’une analyse de structure. Un prototype de cellule de charge est fabrique ´ puis teste ´ afin de mesurer sa line ´arite ´ et ses caracte ´ristiques de surcharge. Les re ´sultats expe ´rimentaux montrent une pre ´cision de 0.2% de la pleine e ´chelle et une protection contre les surcharges en flexion du capteur. Mots-cle ´s : cellule de charge; capteur de force; protection contre les surcharges. Transactions of the Canadian Society for Mechanical Engineering, Vol. 34, No. 3–4, 2010 449
Transcript of Design of a load cell with large overload capacity · DESIGN OF A LOAD CELL WITH LARGE OVERLOAD...

DESIGN OF A LOAD CELL WITH LARGE OVERLOAD CAPACITY
Farhad AghiliCanadian Space Agency (CSA), Saint-Hubert, Quebec, Canada, J3Y 8Y9
E-mail: [email protected]
Received April 2010, Accepted October 2010
No. 10-CSME-24, E.I.C. Accession 3187
ABSTRACT
To increase the signal-to-noise (S/N) ratio and sensitivity of a load cell, it is desirable todesign a structure that generates large strain close to maximum allowable strain of the sensormaterial for a given rating load force. However, accommodating the margin of safety withrespect to overloading, compromises the sensitivity. This paper presents the design, analysis,and prototype testing of a load cell which can provide large overload protection capacitywithout compromising the sensitivity of the sensor. This is achieved by a special design of sensorstructure that becomes virtually rigid after its flexures reach their maximum deflection, therebythe sensor can be protected against a large over load. The sensor dimensions, which maximizesthe sensor’s sensitivity, for given values of rating load and overload are obtained throughmechanical strength analysis. A load cell prototype is fabricated and then tested to measure itslinearity and overload characteristics. The experimental results show an accuracy of 0.2% of fullscale and overload protection of the sensor flexures.
Keywords: load cell; force sensor; force transducer; overload protection.
CONCEPTION D’UNE CELLULE DE CHARGE AVEC UN GRAND CAPACITE DESURCHARGE
RESUME
Pour augmenter le rapport signal sur bruit et la sensibilite d’une cellule de charge, il estsouhaitable de concevoir une structure qui genere des deformations avoisinant la limite permisedu materiau pour une charge donnee. Toutefois, prendre en compte un facteur de securite parrapport a la surcharge peut compromettre la sensibilite. Cet article presente la conception,l’analyse et la validation experimentale d’une cellule de charge pouvant fournir une protectioncontre la surcharge sans compromettre la sensibilite du capteur. Cela est atteint grace a uneconception particuliere de la structure du capteur qui devient pratiquement rigide juste avantl’atteinte de l’etat de deformation maximale, le capteur peut etre ainsi protege des surcharges.Les dimensions optimisant la sensibilite du capteur pour des valeurs de charge et de surchargedonnees sont obtenues d’une analyse de structure. Un prototype de cellule de charge estfabrique puis teste afin de mesurer sa linearite et ses caracteristiques de surcharge. Les resultatsexperimentaux montrent une precision de 0.2% de la pleine echelle et une protection contre lessurcharges en flexion du capteur.
Mots-cles : cellule de charge; capteur de force; protection contre les surcharges.
Transactions of the Canadian Society for Mechanical Engineering, Vol. 34, No. 3–4, 2010 449

1 INTRODUCTION
Load Cells, also known as force transducers, have a variety of applications in industry as well asR&D in science and technology. For example, they are used in vehicle and aerospace andautomobile industry [1, 2, 3], industrial machinery, robotics and automation [4], civil andconstruction engineering [5], cable manufacturers, glass, iron & steel, power plants, metallurgy [6],mining, oil & gas, paper & pulp, gas or wind turbine [7], vibration detection, traffic monitoring [8],seismology [9], and military. Also, load cell are often used for weighting measurements inagriculture as well as food and animal product industry [10]. Many modern industrial machinery,turbines, as well as bridges, buildings, and dams are heavily instrumented by load cells either forstructural health monitoring [5] or to check the exerted forces . Another interesting application ofload cells is for the thrust measurement of rocket propellant systems [11, 12]. The nature of forcesin some of these applications is rather uncertain so that the load cells may encounter unexpectedlylarge forces causing sensor breakdown. For example, it is reported that load cells for weightingobjects show output failures approximately after one year of use [13].
In essence, load cells are fragile devices so as exceeding their force limits results in structuraldamage of the sensor. The overload capacity of many commercial load cells is not high enoughfor many industrial and laboratory applications. Therefore, in practice, an over sized sensor ischosen in order to increase the margin of safety with respect to overloading. However, the largersensors are usually the less accurate one. The vast majority of commercial load cells (e.g. theproduces of Omega Eng. Inc. [14] or S. Himmelstein and Company [15] or Interface Force
Nomenclature
D ring diameter (m)d hub diameter (m)E Young’s modulus (N/m2)F force applied at the beam end
point (N)Faxial axial force applied on the
beams (N)Fcr buckling load of a beam with
two of its ends clamped (N)Foverload maximum overload force
capacity of the load cell (N)Frating rating force of the load cell (N)GF gauge factor of the strain
gaugesh beam’s width-to-length ratioI second moment of inertia of
the beams (m4)K load cell stiffness (N/m)L beam length (m)Lg strain gauge length (m)M moment applied at the beam
end point (Nm)
Mb xð Þ moment applied to the beam atdistance x (Nm)
R strain gauge’s resistance (V)S load cell sensitivity (1/N)Smax optimal sensitivity (1/N)t beam thickness (m)v excitation voltage of
Wheatstone bridge (volt)Dv output voltage of Wheatstone
bridge (volt)W beam width (m)
Greek symbols
a coefficient of thermalexpansion
DT temperature variation (0)d beam deflection (m)e straineallow allowable strain of the load cell
materialg overload force to rating force
ratiosallow allowable stress of the load cell
material
Transactions of the Canadian Society for Mechanical Engineering, Vol. 34, No. 3–4, 2010 450

Measurement Ltd. [16]) are designed based on maximum strain/stress corresponding to 1.5times of maximum load. This accommodates the load cell sensor with only 150% safe overloadcapacity. In order to boost the overload capacity, one may design a structure which generatesless stress, and strain, in response to the load. But that compromises the sensitivity of the sensor.Another existing solution offered by Inter Technology is to use a shunt non-linear springsupporting the load cell [17]. The non-linear spring abruptly collapses in case of overloadingthat shunts the excess of rating load to built-in mechanical stops.
In general, force measurement is derived from strain measurement at location on an elasticsensor body. To increase the signal-to-noise (S/N) ratio and sensitivity of the sensor, it isdesirable to design a structure that generates large strain close to maximum allowable strain ofthe sensor material for the maximum load force. However, a sensor designed based on such aspecification doesn’t bear any overload. Therefor, in order to accommodate the margin ofsafety with respect to overloading, the sensor must be designed for a load much higher than therating load and that inevitably compromises the sensitivity of the sensor. The design solutionbased on the concept of non-linear spring is claimed to be able to provide overload capacity fivetime as much as the rating load [17]. This is high, but not sufficient in many practical casesespecially where an impact force is involved. Moreover, such a protector mechanism is bulkyand expensive and hence not suitable for miniature sensor.
This paper presents the design and analysis of a load cell which provides large overloadprotection capacity without compromising the sensitivity or affecting the characteristic of thesensor. The senor becomes virtually rigid after the sensor’s flexures reach their maximumdeflection, thereby the sensor can be protected against a large over load. Stress-stain analysis ofthe sensor was used to find the optimal dimensions of the sensor for a given rating load thatmaximizes the sensor sensitivity. A sensor prototype has been fabricated and subsequently hasbeen undergone the linearity and overload tests. This paper is arranged as follows: Section 2described the mechanical design of the load cell. Section 3 is devoted to mathematical modelingof the sensor used to calculate the optimal dimensions of the sensor with respect to a givenearing load force. Finally, description of a load cell prototype and experimental validation ofthe sensor characteristics are presented in Section 4.
2 SENSOR DESIGN
Figure 1 illustrates the exploded view of the sensor design with a hub-sprocket shape. Thetransducing element is strain gauge, while the structure of the sensor is comprised of three parts:hub-sprocket, donut shim, and solid disk that are bolted together. The sprockets (or beams)connect the inner hub to the rigid ring. They also constitute the sensor flexures on which thestrain gauges are cemented. Fig. 2 depicts schematically how the sensor functions (the beamdeflection is exaggerated). The hub and the ring have identical thickness, hence their flatsurfaces can site on a single plane. However, as shown in the Fig. 2A, the shim creates a gapbetween the hub and the flat surface of the rigid disk. That permits to deflect the flexure beamsup to exactly the thickness of the shim. The shim thickness is chosen to be coincident with themaximum beam deflection corresponding to the rating load. Therefore, in case of overload, thehub flat surface reaches the disk; shunting the excess of the load to the disk, see Fig. 2B. Sincenormally there is no contact between the hub and disk, the mechanical stop does not affectthe dynamics respond of the sensor whatsoever. The overload capacity of the sensor dependson the hub cross-section area, which can be arbitrarily chosen to be large enough. Also, theproposed sensor structure features high stiffness and excellent rejection of the extraneous loads,
Transactions of the Canadian Society for Mechanical Engineering, Vol. 34, No. 3–4, 2010 451

i.e. non-axial components of the external load, assuring precision. The former is because theflexure beams are clamped at both ends (instead of the commonly used cantilever beam), whilethe latter is because of the symmetry of the sensor geometry. This in conjunction with additiveproperties of the Wheatstone bridge permits decoupling of output from extraneous forcewithout any subsequent arithmetic.
3 MATHEMATICAL MODEL OF THE SENSOR
Figure 3 schematically shows one of the sensor’s flexures. The flexures are primarily subjectedto bending when external force is applied. Therefore, they are modeled as a beam whose left andright ends are clamped to the rigid ring and to the solid hub, respectively. Let F denote theexternal axial force applied to the load cell sensor which has three flexure beams. Due to thesymmetric geometry of the sensor, the applied force is evenly distributed among the three
beams. Hence each beam is subjected to shear force1
3F and moment M at its end point. That
is, the bending moment along the beam is Mb xð Þ~ 1
3Fx{M. The differential equation
describing the deflection of a beam can be written by [18]
y’’ xð Þ~ 1
EI
1
3Fx{M
� �, ð1Þ
where E is the Young’s modulus, and I is the beams second moment of area. Let L denote the
beam length; it is apparent from Fig. 2 that L~D{d
2, where D and d are the ring and the hub
diameters, respectively. Since the beam’s both ends are clamped, the boundary conditions aregiven by y’ 0ð Þ~0 and y’ Lð Þ~0. Incorporating these boundary conditions on the integrationof (1) yields
Fig. 1. The exploded view of the load cell: flexure beam (1); solid ring (2); hub (3); shim (4); soliddisk (5); stain gauge (6); bolt (7).
Transactions of the Canadian Society for Mechanical Engineering, Vol. 34, No. 3–4, 2010 452

M~1
6FL ð2Þ
Moreover, by incorporating the other boundary condition y Lð Þ~0 on the second integral of(1), one can found the beam’s end-point deflection d~y 0ð Þ to be
d~FL3
36EIð3Þ
Let us consider v and as GF the excitation voltage of the strain gauges in Wheatstone bridgecircuit, and the gauge factor of the strain gauges1, respectively. Then, the output voltage of ahalf-bridge circuit, Dv, is given by
Fig. 2. The cross section view of the sensor: (A) no deflection, (B) maximum deflection.
1 The gauge factor is used to quantify strain gauges:
GF~LR=R
LLg
�Lg
,
where R and Lg are the strain gauge0s resistance and length: For typical foil strain gauge GF ¼ 2:0
Transactions of the Canadian Society for Mechanical Engineering, Vol. 34, No. 3–4, 2010 453

Dv
v~GF�ee, ð4Þ
where �ee is the strain average under the strain gauge detecting area. The sensitivity of the loadcell is defined as
S~Dv=v
F~
GF�ee
Fð5Þ
The strain induced along the beam as a function of distance is equal to
e xð Þ~{Mb xð Þt
2EI~
Ft
6EI
1
2L{x
� �, ð6Þ
where t is the thickness of the the beams. Since strain gauges average the strain field over theirarea, we need to integrate (6) over the gauge length of the strain gauges, Lg, to obtain the loadcell sensitivity, i.e.,
�ee~1
Lg
ðLg
0
e xð Þdx~ktL
12EIF , ð7Þ
where
k~1{Lg
Lð8Þ
On the other hand, it is apparent form (6) that the maximum strain occurs at x~0, i.e.,
emax~tL
12EIFrating, ð9Þ
Fig. 3. One of the sensor’s flexure.
Transactions of the Canadian Society for Mechanical Engineering, Vol. 34, No. 3–4, 2010 454

where Frating is the rating load force of the sensor. The maximum allowable strain for foil straingauge is typically 3%, which is at least one order of magnitude higher that that of industrialmetals, eallow, making the materials the limiting factor. Because a linear response is desired fromthe sensor, the chosen sensor material must have a linear strain-stress relationship. Steel is thebest available industrial material that has good linearity properties within a large stress range.Moreover, due to the oscillatory nature of the force, steel can work with infinite fatigue life asthe allowable stress (or equivalently strain) determined based on endurance limit corresponds toinfinite lifetime. The maximum induced strain must be maintained lower than the allowablestrain, i.e. maxeƒeallow. However, in order to gain maximum sensitivity
e 0ð ÞjF~Frating~eallow: ð10Þ
Increasing the S/N ratio of the sensor output requires maximizing the sensor sensitivity. In viewof (5), (7), (9) and (10), the maximum achievable sensitivity is given by
Smax~kGF eallow
Frating
ð11Þ
In our design, the beam has rectangular cross section with width of W , hence
I~Wt3
12: ð12Þ
Substituting (12) into (7) and then into (5) yields
S~kGF L
EWt2ð13Þ
The goal is to design the load cell for maximum sensitivity. Therefore, by equating the right-hand sides of (11) and (13) we arrive at
S~Smax [eallow
Frating
~L
EWt2
Hence, the maximum sensitivity can be archived if the beam thickness satisfies the followingidentity
t~
ffiffiffiffiffiffiffiffiffiffiffiffiffiffiFrating
hsallow
r, ð14Þ
where h~W=L is beam’s width-to-length ratio and sallow~Eeallow is the correspondingmaximum allowable stress. Finally, substituting (14) into (12) and then into (3) yields thesensor’s full scale deflection
dmax~L2eallow
3
ffiffiffiffiffiffiffiffiffiffiffiffiffiffihsallow
Frating
sð15Þ
Transactions of the Canadian Society for Mechanical Engineering, Vol. 34, No. 3–4, 2010 455
It should be pointed out that the shim thickness, b, should be selected equal to the full-scaledeflection. In order to achieve maximum sensor stiffness, it is desirable to have dmax small asmuch as possible. However, from a practical point of view the minimum full-scale deflection islimited by the quality of machined surfaces and machining tolerances. Thus, for a given shimthickness b~dmax, the flexure length and thickness can be calculated from
L~Frating
hsallow
� �14
ffiffiffiffiffiffiffiffiffiffi3b
eallow
sð16Þ
t
L~
eallow
3bL ð17Þ
It is worth mentioning that the hub-sprocket design of the sensor is prone to thermal stressesthat may result in beam bucking if the thickness is small. It can be shown that for this structure,the bucking can be avoided if t=Lw0:02 (see the Appendix for details), that can be checked bymaking use of (17). The stiffness of the load cell can be readily calculated from
K~Frating
bð18Þ
It is interesting to note that combining (11) and (18) together reveals that the maximumsensitivity is inversely proportional to the stiffness regardless of the size of the load cell, i.e.,
Smax~kGF eallow
b
� �1
K
As illustrated in the structure of sensor in Fig. 2, the flexures take all the load force exerted tothe load cell up to FƒFrating. However, in the case of overloading, i.e., FoverloadwFrating, theexcess of load Foverload{Frating is shunted through the hub-disk contact. Therefore, themaximum overload force corresponding to the maximum bearing stress, sallow, can becalculated by
Foverload{Frating~p
4sallowd2
where d is the hub diameter. Thus, the overload capacity of the sensor can be calculated from
g : ~Foverload
Frating
~1zpsallowd2
4Frating
, ð19Þ
and hence
d~1:13
ffiffiffiffiffiffiffiffiffiffiffiffiffiffiffiffiffiffiffiffiffiffiffiffiffig{1ð ÞFrating
sallow
s: ð20Þ
Transactions of the Canadian Society for Mechanical Engineering, Vol. 34, No. 3–4, 2010 456
The intersection of the three flexures with width W at the center of the sensor virtually makesthe vertices of an equilateral triangle. The radius of the circumcircle of such a triangle is equal toffiffiffi
3p
3W . The circumcircle must be enclosed within the circular hub to have a geometry consistent
with the baseline design in Fig. 2. Therefore, the geometry of a sensor with three flexuresimposes the following constraint
Wƒ
ffiffiffi3p
2d [
d
L§1:15h ð21Þ
Substituting L and d respectively from (16) and (20) into the latter inequality of (21) yields
gw1z3:1b
ffiffiffiffiffiffiffiffiffiffiffiffiffiffiffiffiffiffiffiffiffiffiEh3
eallowFrating
s, ð22Þ
which specifies the minimum overload ratio ensuring the geometry consistency (21).
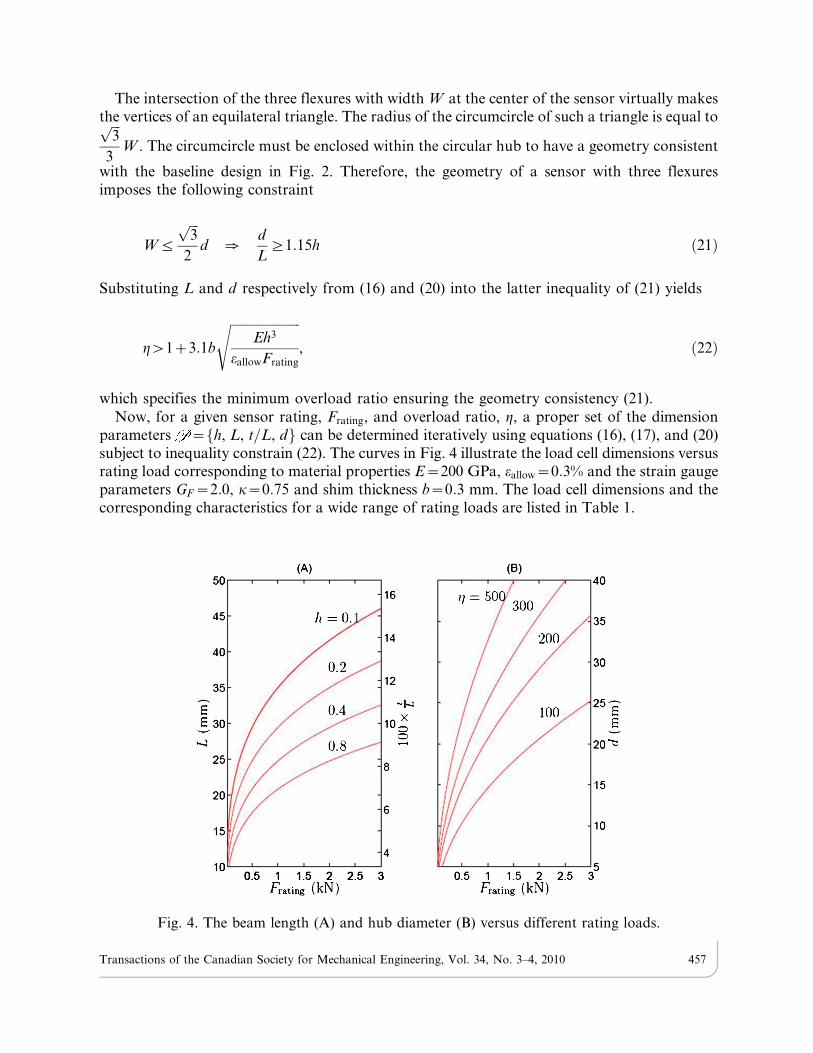
Now, for a given sensor rating, Frating, and overload ratio, g, a proper set of the dimensionparameters ~ h, L, t=L, df g can be determined iteratively using equations (16), (17), and (20)subject to inequality constrain (22). The curves in Fig. 4 illustrate the load cell dimensions versusrating load corresponding to material properties E~200 GPa, eallow~0:3% and the strain gaugeparameters GF~2:0, k~0:75 and shim thickness b~0:3 mm. The load cell dimensions and thecorresponding characteristics for a wide range of rating loads are listed in Table 1.
Fig. 4. The beam length (A) and hub diameter (B) versus different rating loads.
Transactions of the Canadian Society for Mechanical Engineering, Vol. 34, No. 3–4, 2010 457

4 SENSOR PROTOTYPE AND TESTING
Figures 5 and 6 illustrate a load cell prototype and its parts designed for rating load 30 N.The design parameters of the sensor and its dimensions are quoted in the first row of Table 1.The sensor body is a monolithic structure; that is, it is machined from a solid piece of metal.This decreases the hysteresis and increases the strength and repeatability of the sensor. Thedonut shim with thickness of b~0:3 mm creates the required gap between the sensor hub andthe flat surface of the disk. A pair of foil stain gauges (SG-3/350-LY11 from Omega [14]) arecemented at the fixed-end location of each beams, while the strain gauges of the three beams areconfigured as series resistors by completing the bridge wiring inside the sensor; see Fig. 5. Thestrain gauges bridge is excited by a precisely regulated 8:0 VDC voltage.
The sensor prototype has been undergone linearity and overload tests. To characterize thelinearity and sensitivity of the sensor, the sensor outputs in response to known weight loads are
Table 1. Dimensions and characteristics of a series of load cells.
Load(N)
D�
(mm)d
(mm)t
(mm)W
(mm)Overload
ratio
S
(mV/V/N)
30 33 10 0.4 3.3 800 0.15300 57 17 1.3 5.9 200 1:5|10{2
3000 109 38 4.1 10.5 100 1:5|10{3
30000 170 61 10.0 27 25 1:5|10{4
300000{ 490 173 25 126 20 1:5|10{5
* D~2Lzd is the load cell diameter.{ shim thickness b~1:0 mm, for other load cases b~0:3 mm.E~200 GPa, sallow~600 MPa, GF~2:0, k~0:75.
Fig. 5. The load cell prototype.
Transactions of the Canadian Society for Mechanical Engineering, Vol. 34, No. 3–4, 2010 458

measured. The load forces are applied to the load cell using a high-precision standard weightset. The load cell is connected to a laboratory Wheatstone bridge instrument equipped with ananalog amplifier to boost the signal level of the bridge with factor of 100. The measuredvoltages corresponding to the masses of the weight set and the deviation from linearity are givenin Table 2. The data shows that all collective deviation from linearity are about 0:2% full scale.The slope of a line passing through the data points indicates that the sensitivity of the sensor is1:13 mV/N. Since the excitation voltage is 8 V, the theoretical sensitivity can be readily obtainedfrom the first row of Table 1 to be 1:20 mV/N, which is in a close agreement with the measuredsensitivity 1:13 mV/N. In the second part of the test, the load cell is overload by three weightsabove the sensor rating force. The load cell output voltages against underload forces andoverload forces are depicted in Fig. 7. It is clear from that graph that the sensor output voltagesaturates when the applied exceeds the rating load force 30 N. This observation support the factthat the excess load is shunted by sensor hub and hence the flexures must carry only the ratingforce portion of the overload force.
However, it is evident from Fig. 7 that there is slight slope in the response of the sensor afteroverloading. It should be notated that in the case of overloading, the excess of rating force isshunted by the hub, which is now under compression. Although the hub is very stiff comparedto the flexure, the stiffness is not infinite and hence the compression cases minute deformationeven when the hub flat surface reaches the disk.
Fig. 6. The sensor components: body of sensor (A), shim (B), rigid disk (C).
Table 2. Sensor calibration data.
Weight mass(Kg)
100|vo
(volt)Deviation fromlinearity (FS) %
0.5 0.561 0.110.75 0.845 0.061.0 1.123 0.191.25 1.406 0.181.50 1.688 0.181.75 1.971 0.172.00 2.255 0.092.50 2.830 0.213.00 3.396 0.24
Transactions of the Canadian Society for Mechanical Engineering, Vol. 34, No. 3–4, 2010 459

5 CONCLUSION
The design and mechanical analysis of load cell with hub-sprocket shape with donut shim foroverload protection has been presented. Stress-stain analysis of such a load cell was performedto find the optimal geometry of the sensor for given values of rating load and overload ratiothat maximizes the sensor sensitivity. A load cell prototype for rating force 30 N has beenfabricated and tested. The voltage outputs of the sensor in response to the forces less than therating load showed an accuracy of 0:2% of full scale. Further experimental results showed thatthe sensor output voltage saturated as the applied force exceeded the rating load. This clearlydemonstrated the sensor’s flexures were protected against overloading.
REFERENCES
1. Chang, F.-K., Structural health monitoring, 2005: advancements and challenges for Implementation.
Pennsylvanis, U.S.A.: A DEStech Publications, IMc., 2005.
2. Mrad, M., ‘‘Potential of bragg grating sensors for aircraft health monitoring,’’ Transactions of
the Canadian Society for Mechanical Engineering, Vol. 31, pp. 1–17, 2007.
3. Ciniviz, M., ‘‘Performance and energy balance of a low heat rejection diesel engine operatedwith diesel fuel and ethanol blend,’’ Transactions of the Canadian Society for Mechanical
Engineering, Vol. 34, pp. 93–104, 2010.
4. Rentschler, M.E., Farritor, S.M. and Iagnemma, K.D., ‘‘Mechanical design of robotic in vivo
wheeled mobility,’’ ASME Journal of Mechanical Design, Vol. 129, pp. 1037–1045, 2007.
5. Saouma, V.E., Anderson, D.Z., Ostrander, K., Lee, B. and Slowik, V., ‘‘Application of fiber
bragg grating in local and remote infrastructure health monitoring,’’ Materials and Structures,Vol. 31, No. 2, pp. 259–266, 1998.
6. Wright, W.J., Schwartz, R.B. and Nixa, W.D., ‘‘Localized heating during serrated plastic flowin bulk metallic glasses,’’ Materials Science and Engineering, Vol. 319–321, pp. 229–232,
December 2001.
7. Sutherland, H., Beattie, A., Hansche, B., Musial, W., Allread, J., Johnson, J. and Summers, M.,
‘‘The application of non-destructive techniques to the testing of a wind turbine blade,’’ Sandla
National Laboratories, Llvermore, California, Tech. Rep., 1994.
Fig. 7. Sensor output versus applied loads.
Transactions of the Canadian Society for Mechanical Engineering, Vol. 34, No. 3–4, 2010 460

8. Whitten, L., Schulz, J.M., Seim, E.U. and Morrell, M., ‘‘Traffic monitoring/control and roadcondition monitoring using fiber optic-based systems,’’ in Proc. SPIE/Smart Sensors, Vol. 3671,May 1999.
9. Otsuka, H., Takeshita, E., Yabuki, W., Wang, Y., Yoshimura, T. and Tsunomot, M., ‘‘Studyon the seismic performance of reinforced concrete columns subjected to torsional moment,bending moment and axial force,’’ in 13th World Conference on Earthquake Engineering,Vancouver, B.C., Canada, Paper No. 393, Aug. 2004.
10. Muller, I., de Brito, R.M., Pereira, C.E. and Brusamarello, V., ‘‘Load cells in force sensinganalysis - thoery and a novel application,’’ IEEE Instrument & Measurement Magazine, Feb.2010.
11. Taylor, R.P., Streele, W.G. and Douglas, F., ‘‘Uncertainty analysis of rocket motor thrustmeasurements with correlated biases,’’ ISA Transactions, Vol. 34, No. 3, pp. 253–259, 1995.
12. de Lucena, S.E., de Aquino, M.G.S. and Caporalli-Filho, A., ‘‘A load cell for grain-propelledballistic rocket thrust measurement,’’ in IEEE Instrumentation and Measurement TechnologyConference, Ottawa, Canada, pp. 1767–1772, May 2005.
13. Makabe, M. and Harada, S., ‘‘Research of protection equipment for load cell receiving a largeimpact load,’’ in SICE-ICASE International Joint Conference, Bexco, Busan, Korea, pp. 2521–2526, Oct. 2006.
14. The Pressure Strain and Force Handbook, Omega Engineering, Inc., Stamford, CT, 1995.15. Precision Load Cells, S. Himmelstien and Company, IL 60195, USA, 1991.16. Load and Torque Cells, Interface Force Measurement Ltd., Crowthorne, Berks., UK, 1995.17. Load Cell and Torque Sensor Handbook, Lebow Product Inc., Don Mills, ON, 2003.18. Timoshenko, S., Strength of Matrials: Part II Advanced Theory and Problems. NY: D. Van
Nostrand Co, 1941.
APPENDIX
The thermal stress induces axial force which, in turn, may cause structural instability of thebeams due to buckling. According to the extended Euler’s formula, the critical buckling load ofa beam with two of its ends clamped is [18]
Fcr~4p2EI
L2ð23Þ
On the other hand, the axial force, Faxial, corresponding to temperature variation DT is
Faxial~EAaDT ð24Þ
where A~Wt is the beam’s cross-section area, and a is the coefficient of thermal expansion ofthe sensor’s material. Buckling can be avoided if FaxialvFcr, which leads to
t
Lw
ffiffiffiffiffiffiffiffiffiffiffiffi3aDTp
p: ð25Þ
For stainless steel material a~17:3|10{6 and maximum temperature variation DT~750C, theright-hand side of (25) is equal to 0:02.
Transactions of the Canadian Society for Mechanical Engineering, Vol. 34, No. 3–4, 2010 461