
Design of a Composite Combat Helmet Liner for Prevention ...
128
Design of a Composite Combat Helmet Liner for Prevention of Blast- Induced Traumatic Brain Injury by Andrew Vechart B.S., Mechanical Engineering and Physics University of Wisconsin - Milwaukee, 2009 Submitted to the School of Engineering in Partial Fulfillment of the Requirements for the Degree of Master of Science in Computation for Design and Optimization at Massachusetts Institute of Technology February 2011 ©Massachusetts Institute of Technology 2011. All Rights Reserved Author ............................................................................................................................................................ Computation for Design and Optimization Program January 14, 2011 Certified by..................................................................................................................................................... Laurence R. Young Apollo Professor of Astronautics Professor of Health Sciences and Technology Thesis Supervisor Accepted by.................................................................................................................................................... Nicolas Hadjiconstantinou Associate Professor of Mechanical Engineering Director, Computation for Design and Optimization Program
Transcript of Design of a Composite Combat Helmet Liner for Prevention ...

Design of a Composite Combat Helmet Liner for Prevention of Blast-
Induced Traumatic Brain Injury
by
Andrew Vechart
B.S., Mechanical Engineering and Physics
University of Wisconsin - Milwaukee, 2009
Submitted to the School of Engineering
in Partial Fulfillment of the Requirements for the Degree of
Master of Science in Computation for Design and Optimization
at
Massachusetts Institute of Technology
February 2011
©Massachusetts Institute of Technology 2011. All Rights Reserved
Author ............................................................................................................................................................
Computation for Design and Optimization Program
January 14, 2011
Certified by.....................................................................................................................................................
Laurence R. Young
Apollo Professor of Astronautics
Professor of Health Sciences and Technology
Thesis Supervisor
Accepted by....................................................................................................................................................
Nicolas Hadjiconstantinou
Associate Professor of Mechanical Engineering
Director, Computation for Design and Optimization Program

2

3
Design of a Composite Combat Helmet Liner for Prevention of Blast-
Inducted Traumatic Brain Injury
by
Andrew Vechart
Submitted to the School of Engineering
in Partial Fulfillment of the Requirements for the Degree of
Master of Science in Computation for Design and Optimization
Abstract Air blast-induced traumatic brain injuries (TBIs) represent a significant percentage of military
personnel injuries observed in Operation Enduring Freedom (OEF) and Operation Iraqi Freedom (OIF).
Prevalence of blast-induced TBIs is attributed to several factors, including improved body armor,
improved diagnostic techniques, greater awareness, and the increased threat of attack by improvised
explosive devices (IEDs). Though the mechanisms of blast-induced TBIs are not fully understood, this is a
serious problem that needs to be addressed.
The overall goal of the work presented in this report is to explore a possible improvement to the
Advanced Combat Helmet (ACH) liner increasing the protection against blast-induced TBIs. The essential
new element is the inclusion of moveable or deformable materials sandwiched within foam to dissipate
the blast energy, reduce the peak transmitted pressure, and stretch the blast waveform before it
reaches the brain. Filler materials explored in this work include glass beads, aerogel, glycerin, and
water.
To contribute to this goal, the description and validation of a model of the dynamic response of
a (modified) helmet and head surrogate to an air blast event is presented in this report. An initial
prototype for a liner incorporating the filler material technology is designed and manufactured. The
response characteristics of this prototype are then assessed experimentally by collecting pressure data
during air blast loading provided by an explosive drive shock tube. Experimental work is carried out at
Purdue University. A nonlinear finite element model is then developed using the commercial code
ABAQUS® to describe the response observed experimentally. Consistency between results obtained
numerically and results obtained experimentally indicates the model accurately describes the physics of
a blast event impinging on a helmet and head. Several suggestions are then provided for how the model
may be used to optimize the design of a helmet liner providing the maximum protection against air-
blasts.
Thesis Supervisor: Laurence R. Young
Apollo Program Professor of Astronautics
Professor of Health Sciences and Technology

4

5
Acknowledgements
I would like to begin by thanking my advisor Prof. Laurence Young for the chance to work on this
project. I truly appreciate not only the guidance he provided but also the freedom and flexibility he
allowed to approach the research problem from different perspectives. For providing generous funding
for this project, I would like to acknowledge the Office of Naval Research (# N00014-08-1-0261), the
Center for Integration of Medicine and Innovative Technology (# W81XWH-07-2-0011), and Deshpande
Center at MIT (MIT OSP # 689934).
I would like to thank Prof. Steven Son and his graduate student, Ben Schimizze, at Purdue
University for their experimental efforts providing critical data for this project. Thank you to Prof. Raul
Radovitzky for lending his expertise to this project. For guidance and discussion about material
modeling, I thank Prof. Lorna Gibson in the Department of Materials Science and Engineering at MIT.
For her extensive efforts to characterize the high strain rate compression response of foam, Dr. Simona
Socrate deserves much recognition and thanks. I would like to extend my gratitude as well to Prof.
Andrew Whittle and Dr. Jack Germaine in the Department of Civil and Environmental Engineering at MIT
for their advice and assistance in testing and modeling the stress-strain response of glass beads. Finally,
for the technical expertise with ABAQUS® he provided in the early stages of this project, I would like to
thank Dr. Antoine Jérusalem.
I thank George Christou for his efforts laying the groundwork for the simulations performed for
this project. A special thanks goes to my colleague, Rahul Goel, with whom I worked for the majority of
the time I was involved with the project. Many 'fruitful' discussions between he and I led to important
and effective work towards progress on this project. I thank Laura Koller for her guidance and support,
making my experience in the CDO program very enjoyable. I also thank Liz Zotos for all of the support
she provided during my time in the MVL. I also want to thank Michal Kracik for his help on some of the
images included in this report. Thanks also to all of my colleagues in the MVL. I was glad to be a part of
arguably the best lab on campus.
A big thank you goes out to my wife, Katie, for all of her love, support, and understanding
throughout my graduate career. Thanks also to all of our family and friends in Wisconsin and Minnesota
for their support of our adventure to the East Coast.
Finally, I thank all of the men and women serving in our armed forces to protect the security and
freedom of the United States. I hope this technology will one day make their jobs much safer.

6

7
Table of Contents
Abstract ......................................................................................................................................................... 3
Acknowledgements ....................................................................................................................................... 5
Table of Contents .......................................................................................................................................... 7
List of Figures ................................................................................................................................................ 9
List of Tables ............................................................................................................................................... 12
List of Abbreviations ................................................................................................................................... 13
Chapter 1 Introduction ............................................................................................................................ 15
1.1 Motivation ................................................................................................................................... 15
1.2 Objectives and Methods ............................................................................................................. 16
1.3 Thesis Organization ..................................................................................................................... 17
Chapter 2 Background and Related Work ............................................................................................... 19
2.1 Blast Injury Mechanisms ............................................................................................................. 19
2.2 Air Blast Characteristics .............................................................................................................. 23
2.3 Air Blast Interactions With Structures ........................................................................................ 31
2.4 Blast Mitigation Strategies .......................................................................................................... 35
Chapter 3 The Use of Filler Materials for Head Protection ..................................................................... 39
3.1 Sports Helmet Research at MIT .................................................................................................. 39
3.1 Blast Protection Using Filler Materials ........................................................................................ 43
Chapter 4 Material Characterization ....................................................................................................... 51
4.1 Fluid Materials ............................................................................................................................ 51
4.1.1 Air ........................................................................................................................................ 51
4.1.2 Water and Glycerin ............................................................................................................. 53
4.2 Solid Materials ............................................................................................................................ 55
4.2.1 VN600 Foam ........................................................................................................................ 55
4.2.2 Advanced Combat Helmet .................................................................................................. 59
4.2.3 Glass Beads ......................................................................................................................... 60
4.2.4 PMMA ................................................................................................................................. 64
4.2.5 Aerogel ................................................................................................................................ 65
Chapter 5 Blast Experiments.................................................................................................................... 67
5.1 First Helmet Liner Prototype ....................................................................................................... 67
5.2 Experimental Set-up .................................................................................................................... 70
5.3 Experimental Results and Discussion .......................................................................................... 73
5.3.1 Comparison By Filler Material ............................................................................................. 73
5.3.2 Comparison By Measurement Location .............................................................................. 78
5.4 Further Discussion of Experimental Results ............................................................................... 84
Chapter 6 Numerical Modeling ................................................................................................................ 89
6.1 The Numerical Model.................................................................................................................. 89
6.2 Model Initialization ..................................................................................................................... 95
6.2.1 Boundary Conditions ........................................................................................................... 95
6.2.2 Simulation Details ............................................................................................................... 97

8
6.3 Air Blast Simulation ..................................................................................................................... 98
6.3.1 Boundary Conditions ........................................................................................................... 98
6.3.2 Initial Conditions ................................................................................................................. 99
6.3.3 Simulation Details ............................................................................................................. 101
6.3.4 Results By Filler Material................................................................................................... 102
6.3.5 Results By Measurement Location.................................................................................... 105
6.3.6 Further Discussion of Simulation Results .......................................................................... 108
Chapter 7 Conclusions and Future Work ............................................................................................... 113
7.1 Conclusions ............................................................................................................................... 113
7.2 Suggestions for Future Work .................................................................................................... 115
Appendix A - Coefficients in the Perturbation Solution of Bach and Lee ................................................. 119
References ................................................................................................................................................ 121

9
List of Figures
Figure 2-1 - "Predicted survival curves for man exposed to surface bursts of TNT where the thorax is near
a flat rigid surface reflecting the blast wave at normal incidence." (10) .................................................... 19
Figure 2-2 - "The most common types of nonpenetrating traumatic brain injury are diffuse axonal injury,
contusion, and subdural hemorrhage. The most common locations for diffuse axonal injury (pink) are
the corticomedullary (gray matter-white matter) junction (particularly frontotemporal), internal capsule,
deep gray matter, upper brainstem, and corpus callosum. The most common locations for contusions
(blue) are the superficial gray matter of the inferior, lateral and anterior aspects of the frontal and
temporal lobes, with the occipital poles or cerebellum less often involved. The most common locations
for subdural hemorrhage (purple) are the frontal and parietal convexities." Figure and caption taken
from (9) ....................................................................................................................................................... 21
Figure 2-3 - Coup-Contrecoup Injury - Figure taken from (13) adapted from (15)..................................... 22
Figure 2-4 - Characteristics of an "ideal blast wave" (24) ........................................................................... 23
Figure 2-5 - "The variation of the shock decay coefficient vs shock strength for spherical blast
waves, =1.4" (28) ..................................................................................................................................... 31
Figure 3-1 - A mesh of interconnected channels (69) ................................................................................. 40
Figure 3-2 - Drop Test Apparatus (71) ........................................................................................................ 41
Figure 3-3 - Performance of VN600 with and without channels compared to EPS (71) ............................ 42
Figure 3-4 - Ski helmets tested by Leedom (left) and POC (right) (4) ......................................................... 42
Figure 3-5 - (left) Solid block of VN600 (center) single channel (right) dual channel (4) ........................... 43
Figure 3-6 - Setup used by Alley (72) .......................................................................................................... 44
Figure 3-7 - Modified experimental setup (4) ............................................................................................. 46
Figure 3-8 - Results from modified testing of sandwich structures (4) ...................................................... 47
Figure 3-9 - Comparison of experimentally measured and numerically applied loading (4) ..................... 48
Figure 4-1 - Compressive stress-strain curve for an elastomeric foam (74) ............................................... 55
Figure 4-2 - Tensile stress-strain curve for elastomeric foam (74) ............................................................. 56
Figure 4-3 - Comparison of the model predictions and experimental results ............................................ 59
Figure 4-4 - Consolidation Test Set-up ........................................................................................................ 61
Figure 4-5 - Consolidation Test Results ....................................................................................................... 62
Figure 4-6 - Dry glass beads stress-strain data and fit ................................................................................ 63
Figure 4-7 - Mesh and set-up for consolidation simulation ........................................................................ 64
Figure 4-8 - Abaqus model predictions for the consolidation test ............................................................. 64

10
Figure 4-9 - Material parameters used for aerogel .................................................................................... 65
Figure 5-1 - The Advanced Combat Helmet ................................................................................................ 67
Figure 5-2 - Standard ACH liner pad configuration ..................................................................................... 67
Figure 5-3 - Top and bottom views of the first prototype liner .................................................................. 68
Figure 5-4 - The prototype liner installed in the ACH shell ......................................................................... 69
Figure 5-5 - Experimental Set-up ................................................................................................................ 70
Figure 5-6 - Explosively driven shock tube (72) .......................................................................................... 70
Figure 5-7 - Support for the helmet during testing ..................................................................................... 71
Figure 5-8 - End caps over the channels ..................................................................................................... 72
Figure 5-9 - First ACH standard pad test ..................................................................................................... 73
Figure 5-10 - Second ACH standard pad test .............................................................................................. 74
Figure 5-11 - First glass beads test .............................................................................................................. 74
Figure 5-12 - Second glass beads test ......................................................................................................... 75
Figure 5-13 - First aerogel test .................................................................................................................... 75
Figure 5-14 - Second aerogel test ............................................................................................................... 76
Figure 5-15 - First glycerin test ................................................................................................................... 76
Figure 5-16 - Second glycerin test ............................................................................................................... 77
Figure 5-17 - First water test ....................................................................................................................... 77
Figure 5-18 - Second water test .................................................................................................................. 78
Figure 5-19 - "Worst" case results at gauge 1 ............................................................................................. 79
Figure 5-20 - "Best" case results at gauge 1 ............................................................................................... 79
Figure 5-21 - "Worst" case results at gauge 2 ............................................................................................. 80
Figure 5-22 - "Best" case results at gauge 2 ............................................................................................... 81
Figure 5-23 - "Worst" case results at gauge 4 ............................................................................................. 82
Figure 5-24 - "Best" case results at gauge 4 ............................................................................................... 82
Figure 5-25 - "Worst" results at gauge 5 ..................................................................................................... 83
Figure 5-26 - "Best" results at gauge 5 ....................................................................................................... 84
Figure 5-27 - Numerical results from Nyein et. al. (19) .............................................................................. 85
Figure 6-1 - Standard ACH geometry .......................................................................................................... 91
Figure 6-2 - Standard ACH mesh - 66189 C3D4 elements (four node linear tetrahedral) .......................... 91
Figure 6-3 - Mesh of helmet with prototype liner - 57260 C3D4 elements ............................................... 92
Figure 6-4 - Tube mesh - 21274 C3D8 (eight node linear brick elements) ................................................. 93

11
Figure 6-5 - Air domain surrounding the helmet and tube ......................................................................... 94
Figure 6-6 - Comparison of meshes of the air domain, helmet, and tube .................................................. 94
Figure 6-7 - Placement of parts prior to the initialization step................................................................... 95
Figure 6-8 - Orange and red regions correspond to locations of symmetry boundary conditions ............ 96
Figure 6-9 - Anchor points for the helmet denoted in orange and blue .................................................... 96
Figure 6-10 - Orange arrows indicate prescribed displacement of the tube .............................................. 97
Figure 6-11 - Boundary conditions on the Eulerian mesh .......................................................................... 98
Figure 6-12 - Comparing ConWep and the Bach and Lee model .............................................................. 100
Figure 6-13 - Contour plot of the initialized pressure field ....................................................................... 101
Figure 6-14 - Simulation results for the standard ACH helmet ................................................................. 102
Figure 6-15 - Simulation results for a glass beads-filled prototype .......................................................... 103
Figure 6-16 - Simulation results for an aerogel-filled liner ....................................................................... 104
Figure 6-17 - Simulation results for a glycerin-filled liner ......................................................................... 104
Figure 6-18 - Simulation results for a water-filled liner ............................................................................ 105
Figure 6-19 - Comparison of numerical results at gauge 1 ....................................................................... 106
Figure 6-20 - Comparison of numerical results at gauge 2 ....................................................................... 106
Figure 6-21 - Comparison of numerical results at gauge 4 ....................................................................... 107
Figure 6-22 - Comparison of numerical results at gauge 5 ....................................................................... 108
Figure 6-23 - Contour plot of the pressure wave interacting with the helmet and tube ......................... 109
Figure 6-24 - Illustration of conforming Eulerian mesh ............................................................................ 110
Figure 6-25 - Illustration of poorly shaped elements resulting from the conforming mesh .................... 110

12
List of Tables
Table 3-1 - Results from Alley's testing of sandwich plates (72) ................................................................ 44
Table 4-1 - Air Properties ............................................................................................................................ 52
Table 4-2 - Parameters used for fluid filler materials ................................................................................. 54
Table 4-3 - Coefficients in the viscoelastic Prony series for VN600 ............................................................ 58
Table 4-4 - Parameters used for the ACH helmet ....................................................................................... 60
Table 4-5 - Material parameters used for PMMA ....................................................................................... 65
Table 5-1 - Weight comparison (4) ............................................................................................................. 69
Table 5-2 - Pressure gauge details - Pressure (Pa)=1000*(Reading (V))*b1+b0 ......................................... 72

13
List of Abbreviations
" - inches ACH - Advanced Combat Helmet ALE - Arbitrary Lagrangian - Eulerian ASTM - American Society for Testing and Materials atm - atmospheres C3D4 - Four node linear tetrahedral element C3D8 - Eight node linear brick element cc - cubic centimeter CEL - Coupled Eulerian - Lagrangian cm - centimeter ConWep - Conventional Weapons Effects DAI - Diffuse Axonal Injury DVBIC - Defense and Veterans Brain Injury Center EEG - Electroencephalogram EPS - Expanded Polystyene FEM - Finite Element Method g - gram ICP - Intracranial Pressure IED - Improvised Explosive Device in - inches kHz - kiloHertz kPa - kiloPascals LCC - Limiting Compression Curve mm - millimeter MPa - megaPascals ms - milliseconds OEF - Operation Enduring Freedom OIF - Operation Iraqi Freedom Pa - Pascals PASGT - Personal Armor System Ground Troops' PMMA - Poly(methyl methacrylate) psig - Pounds Per Sqaure Inch - Gage SHPB - Split Hopkinson Pressure Bar TBI - Traumatic Brain Injury TNT - Trinitrotoluene V - Volts VFT - Volume Fraction Tool wrt - with respect to

14

15
Chapter 1 Introduction
The work discussed in this report was performed during the third year of a now four year
contract with the Office of Naval Research focusing on improving blast protection for combat troops.
This chapter presents some of the motivation for the research along with the objectives and methods
employed. A description of the organization of the rest of the report is included as well.
1.1 Motivation
Traumatic Brain Injuries (TBIs) resulting from explosions represent a significant percentage of
military personnel injuries. According to the Defense and Veterans Brain Injury Center (DVBIC), more
than 150,000 U.S. Military personnel have been medically diagnosed with a traumatic brain injury (TBI)
since 2001. Severity of TBIs ranges from so-called mild injuries, such as concussions, all the way to head
penetration injuries (1). In a study by Wojcik et. al., 46.7% of TBIs in subjects from Operation Enduring
Freedom (OEF) in Afghanistan and 63.9% of TBIs in subjects from Operation Iraqi Freedom (OIF) in Iraq
were attributable to exposure to explosions (2).
There are several reasons TBIs have become more prevalent in OEF and OIF. In contrast to the
pattern in previous conflicts, improved body armor permits personnel to survive TBI-causing experiences
that were previously fatal. Furthermore, understanding and recognition of TBIs has improved in the
medical community, leading to a higher rate of diagnosis. In addition, increased use of Improvised
Explosive Devices (IEDs) has increased the probability of exposure of personnel to TBI-causing explosions
(3). Regardless of the reason, blast-induced TBIs are a prominent problem that need to be addressed.
This project addresses the immediate need for improved protection against primary blast-
related TBI resulting from the shock wave generated by an explosion. A new combat helmet liner is
being developed that adds blast protection to the capabilities of the standard issue helmet,
supplementing the current protection afforded against impact type injuries. The essential new element
is the inclusion of moveable or deformable materials sandwich within the foam to dissipate the blast
energy, reduce the peak transmitted pressure, and lengthen the blast waveform before it reaches the
brain. Candidates for filler materials considered in this report are glass beads, aerogel, water, and
glycerin. The work for this thesis emphasizes development and validation of a numerical model of the
air-blast scenario loading a head surrogate model coupled with a helmet-liner model.

16
1.2 Objectives and Methods
The overarching purpose of the blast protection project is to provide an improved helmet
capable of providing better blast protection from TBIs that the current helmet can. As a contribution to
that goal, this work aims to develop and validate a numerical model that will provide insight into the
physics of blast phenomena interacting with a helmet and head as well as design support for liner
optimization. To this end, both experimental and numerical work is performed on the current Advanced
Combat Helmet (ACH) as well as the ACH with a modified liner.
Previous work on this project has focused on blast loading of sandwich structures, investigating
capabilities of different filler materials compared to a standard ACH pad in a more basic and
enlightening setting. This work has shown promising results, and this project extends the idea to more
realistic geometries. As a first step, a design for an initial prototype of an actual liner is conceived from
the same foam material used in sandwich structure testing, namely VN600 from provided by Der-Tex
Corporation (Saco, ME). Several samples of this prototype are then constructed via a simple hand lay-up
technique. Experimental work on these liners inserted into the current ACH shell is carried out at
Purdue University. The modified helmets are loaded via an explosive drive shock tube. Five pressure
transducers are placed inside the head surrogate during these experiments to record the pressure
history during the blast event. The main features investigated from these pressure histories are the
peak pressure, rise time, and time duration of the blast.
Armed with these experimental results, a numerical model is then developed to describe the
physics of these blast events. Material characterization is important to the accuracy of these
simulations. Most material parameters are taken from available literature. Material models are not
readily available for VN600 foam or for glass beads. Therefore, a split-Hopkinson pressure bar is used to
assess the high strain rate behavior of the foam, and a material model was developed by Dr. Simona
Socrate at MIT. For glass beads, consolidation tests are performed in the Civil Engineering department
at MIT to obtain a compressive stress-strain relationship. These results are then fit to a material model
for use in simulations.
The numerical model is developed in the commercially available nonlinear finite element code
ABAQUS® v6.10. Most of the modeling is done using ABAQUS®/CAE, while initial conditions are largely
written to the input file via a script implementing an analytical blast field solution. The blast model is
initialized with a static step taken with ABAQUS®/Standard, and the blast event is simulated with

17
ABAQUS®/Explicit. Results from the dynamic simulations are then compared with experimental results
to assess the strengths, weaknesses, and overall validity of the numerical model.
1.3 Thesis Organization
This thesis is broken up into five major sections: background and literature survey, discussion of
previous work on this project at MIT, material characterization, experimental work and results, and
numerical modeling and results.
Chapter 2 includes background information and a description of other work related to this
project. The chapter is further divided into a discussion of proposed blast injury mechanisms,
characteristics of blast waves in air, interaction of blast waves with structures, and blast mitigation
strategies. Section 2.2 particularly discusses in detail the analytical blast field solution that is used to
initialize the blast wave in the numerical model.
In Chapter 3 is a discussion of the evolution of the filled helmet liner project at MIT. First, the
original sports helmet research and findings are discussed. Then, a description of the blast protection
research leading up to this project is discussed to lay the ground work for much of what is found here.
In Chapter 4, a discussion of material characterizations used for numerical modeling is
presented. This section includes a discussion of the experimental work performed to develop material
models for VN600 foam and for glass beads.
In Chapter 5, all aspects of the blast experiments are discussed. Topics include a description of
the prototype liner used for experimental and numerical work, a description of the test setup and data
recording technique, and presentation and discussion of the results obtained.
The numerical model, including geometry, mesh, boundary conditions, initial conditions, and
simulation parameters, is discussed in Chapter 6. Also presented here are the results obtained as well as
a detailed discussion of their consistency with the experimental results.
Finally, Chapter 7 presents the conclusions gleaned from this work as well as suggestions for
future work on the project.

18

19
Chapter 2 Background and Related Work
This project is multi-disciplinary in nature, involving topics from structural and solid mechanics,
fluid dynamics, shock physics, material science, medicine, and computational science. In a closely
related thesis (4), a thorough literature survey was presented on the causes and diagnosis of TBIs.
Causes of TBI are briefly reviewed here, along with a broad presentation of blast mitigation strategies as
well as computational work performed related to shock loading and propagation.
2.1 Blast Injury Mechanisms
The effect of blast on humans has been a topic of research for several years. During World War
I, two British Army physicians, Dr. Fred Mott and Dr. Gordon Holmes, studied soldiers who had survived
exposure to blast (it was out of these efforts that the phrase "shell shock" came into use) (5)(6)(7)(8).
Due to very limited medicinal diagnosis capabilities (by their own admission), they had difficulty
distinguishing between emotional and physical trauma due to blast. Indeed looking back it is likely many
TBIs were misdiagnosed as "psychic trauma" by their methods (9). In 1968, Bowen, et. al. (10) compiled
and analyzed several years worth of data from studies of animals exposed to blast waves. The results
were interpreted to predict humans' survivability to varying blast wave intensities as shown in Figure
2-1.
Figure 2-1 - "Predicted survival curves for man exposed to surface bursts of TNT where the thorax is near a flat rigid surface
reflecting the blast wave at normal incidence." (10)

20
As reflected in the figure, Bowen et. at. focused on thoracic trauma because of, "the effects on the lungs
being particularly important in determining morbidity or mortality" (10). His work is a good illustration
of the category of blast injuries of interest in this project.
There are three general characterizations of blast-induced injury. Primary blast injuries result
from air pressure fluctuations in the atmosphere causing stress and shear waves to pass through the
body. Secondary injuries are caused by debris accelerated by the blast impacting a person, and tertiary
injuries result when a person is accelerated into an object or wall as a result of the blast (3)(9). Both
secondary and tertiary injuries can be recast as impact-type injuries, studied by a relatively large
community including motorcycle and sports helmets manufacturers. In contrast, primary injuries are
unique to blast exposure, and indeed these are the type of injuries of interest in this project. Most
literature available on primary blast-induced injury originates from war-related injuries, though some
cases are known involving civilian incidents involving, for example, fireworks (9).
The work of Bowen mentioned above may have direct implications for primary blast-induced
TBI. Courtney and Courtney reviewed a large body of work suggesting TBIs may be caused by
propagation of blast waves to the brain via a thoracic mechanism (11). Cernak hypothesizes that one of
the possible reasons for alteration of brain function following blast exposure is transfer of kinetic energy
from the blast overpressure through the great vessels in the abdomen and thorax to the central nervous
system (12). In work supporting this hypothesis involving animal models, blast waves focused on the
thorax have shown such cerebral effects as suppression of electroencephalograpic (EEG) activity and
hippocampal and hypothalamic neuron damage (11). Though the thoracic mechanism is a valid
hypothesized cause of TBI, this project does not aim to curtail these effects.
Before looking at other mechanisms, it is instructive to understand what constitutes a TBI,
particularly primary effects blast-induced TBI. Of course head penetration injuries qualify as TBIs, but
these would be secondary or tertiary effects blast-induced. Taber et. al. provided an illustrative graphic
(Figure 2-2) as well as informative description of the three most common types of TBI, diffuse axonal
injuries (DAI), contusion, and subdural hemorrhage (9). DAIs are common following closed-head injuries
and result from shearing, stretching, and/or angular forces pulling on axons and small vessels (9).
Contusions result when the brain moves relative to and impacts the skull (9)(13)(14). One type of
contusion injury, called the coup-contrecoup injury, is illustrated well in Figure 2-3 (13). For a frontal
impact, the skull "slaps" the coup region, causing contusions. Lesions in the contrecoup region occur
when the brain bounces off the inside of the skull. Furthermore, during different times negative

21
pressures are seen in both regions, leading to the possibility of development of "cavitation bubbles", the
growth and collapse of which may lead to brain damage (13). Subdural hemorrhages result from the
brain moving sufficiently far relative to the skull to tear tributary surface veins bridging the gap between
the brain surface and the dural venous sinus (9).
As Chafi et. al. pointed out, blast waves can certainly cause acceleration/deceleration forces on
the head, leading to contusions of the frontal and temporal lobes (14). Furthermore, these forces may
impart shearing and rotational forces on the axons, for example due to tissues of different densities
being accelerated at different rates, potentially leading to DAIs (14). Similarly, the high frequency shock
loading can induce brain tissue stress and strains, also potentially leading to DAIs or subdural
hemorrhages (14). To investigate these issues more closely, Chafi et. al. developed a three-dimensional
non-linear finite element model employing an Arbitrary Lagrangian-Eulerian (ALE) method to aid with
fluid-structure interaction (FSI) effects using the explicit FEM software LS-DYNA® (14). They found their
model is able to accurately predict intracranial pressure (ICP) as well as stresses and strains within the
brain.
Figure 2-2 - "The most common types of nonpenetrating traumatic brain injury are diffuse axonal injury, contusion, and subdural hemorrhage. The most common locations for diffuse axonal injury (pink) are the corticomedullary (gray matter-
white matter) junction (particularly frontotemporal), internal capsule, deep gray matter, upper brainstem, and corpus callosum. The most common locations for contusions (blue) are the superficial gray matter of the inferior, lateral and
anterior aspects of the frontal and temporal lobes, with the occipital poles or cerebellum less often involved. The most common locations for subdural hemorrhage (purple) are the frontal and parietal convexities." Figure and caption taken from
(9)

22
Figure 2-3 - Coup-Contrecoup Injury - Figure taken from (13) adapted from (15)
In a different simulation study, Nyein et. al. used the Virtual Test Facility (16)(17), a suite of
integrated computational solid and fluid mechanics solvers, to investigate the response of a validated
human head model (18) to a frontal blast (19). Specifically, and what is of high relevance to this project,
they investigated the effect of the ACH on intracranial blast wave mitigation. They found that the main
wave transmission pathways are the soft tissues directly in contact with the blast and that cavitation is
more likely a result of wave reflections inside the skull rather than the blast wave underpressure (19).
Furthermore, they discovered that the liner pads of the ACH provide a slight pressure concentration
effect on the skull, but that overall that the ACH provides unappreciable mitigation of the blast wave.
However, they also found that the ACH does not enhance the damage due to the blast wave, in
contradiction with other findings using more simplistic models (i.e. (20)) (19). They did find that adding
a face shield potentially can dramatically reduce the blast wave pressure transmitted to the brain for a
blast exposure (19).
Taylor and Ford performed a modeling and simulation study to investigate the role of stress
wave interactions in blast-induced TBIs (21). Simulation work was done using the shock physics code
CTH, an Eulerian formulation finite-volume code capable of simultaneously tracking up to twenty
different materials . They used high resolution photographic data to construct the head model,
differentiating between skull, white matter, gray matter, and cerebrospinal fluid. Their results suggest
that early-time stress wave interactions lead to stress localizations contributing to multifocal axonal
injury (21). Furthermore, they suggest that blast-induced TBI may occur much earlier than previously
thought, that is before the usual linear and rotational accelerations thought to cause TBI occur (21).
Although there has been a great deal of effort to understand the mechanisms behind blast-
induced TBI (22), it remains a controversial and active topic of research as to whether or not the brain is

23
even susceptible to primary blast injury (9). However, this project, as do so many others, proceeds
under the assumption that something can and should be done to mitigate primary blast-induced TBIs.
2.2 Air Blast Characteristics
IED detonations involve chemical explosions, whereby a condensed explosive material (either
solid or liquid) rapidly oxidizes, creating very hot high pressure gases (23). Large amounts of energy are
released, leading to local high pressures. In chemical explosions, almost all of this energy expands
outwards in the form of a shockwave. As the blast wave moves outwards, the air pressure falls back to
atmospheric pressure. Because of the momentum of the gas particles, the pressure briefly falls below
atmospheric pressure, causing the characteristic "underpressure" of the blast (23).
A typical pressure time trace of a point in the path of an "ideal blast wave" is shown in Figure
2-4. The air at the point of interest is initially at atmospheric pressure 0p . With the arrival of the blast
wave at the arrival time at , the pressure experiences a discontinuous jump to the blast peak
overpressure 0ppS
. The pressure then decays back to atmospheric pressure at time Tta. As
mentioned before, gas molecule momentum causes the pressure to briefly drop slightly below
atmospheric pressure to the peak underpressure Spp0. After a length of time T the air returns to
atmospheric pressure. Important blast quantities illustrated by Figure 2-4 include the positive phase
duration T and the peak overpressure
Sp . In reality, the jump in pressure does not occur
discontinuously, and a parameter of interest is the time it takes to attain the peak over pressure, called
the rise time rt . Finally, the specific impulse of the positive phase duration, as defined in Equation 2-1,
is also of interest (23).
Figure 2-4 - Characteristics of an "ideal blast wave" (24)

24
Tt
t
S
a
a
dtptpi 0
Equation 2-1
It is often of interest to have an expression describing the profile shown in Figure 2-4. One such
expression, known as the Friedlander equation is given in Equation 2-2 (23)(25).
T
bt
T
tptp S exp1
Equation 2-2
The parameter b is known as the waveform parameter and is a function of peak overpressure (23).
Of course, it is instructive to know how a blast wave travels through air. To investigate this, one
can employ the ideal gas model for air assuming a non-temperature dependent constant volume specific
heat.
v
v
p
ve cc
ccNRp
11
Equation 2-3
vcE
Equation 2-4
Here, ep is the equilibrium pressure of the air, N is the mole number, R is the universal gas constant,
is the density, is the temperature (on an absolute scale), E is the internal energy, pc is the
constant pressure specific heat, and vc is the constant volume specific heat (26). Equation 2-4 is valid
only in the situation that vc is a constant. This assumption will remain in effect throughout this project.
For a shockwave passing through air initially at rest, the following jump conditions can be derived from
the conservation of linear momentum and conservation of energy, respectively (26).

25
12
000 FCNR S
Equation 2-5
22
00000 12
11 FCFNRc Sv
Equation 2-6
Here, the + subscript indicates the region immediately behind the shock, and the 0 subscript indicates
the properties of the air at rest. States achieved immediately behind the shock are known as Hugoniot
states. Also, 0F and SC is the shock velocity. These relationships can be combined to the
relationship shown below (26).
0111211 2 MFFF
Equation 2-7
Here, the Mach number 00 c
Uc
CM SS and the speed of sound in air 0
2
0 1 vcc have
been used (26). Equation 2-7 allows for two states of the material. The first, 1F corresponds to the
material at rest. The other state is given below.
2
11
1
21
MF
Equation 2-8
Solving Equation 2-8 for the deformation gradient after the shock yields the jump in density across the
shock as a function of the shock velocity.
21
12
2
0
M
M
Equation 2-9
Solving Equation 2-8 for the Mach number yields an expression for the shock velocity in terms of the
peak overpressure 0pppS
(27).

26
00
0
2
1
p
ppU S
S
Equation 2-10
Combining Equation 2-5 and Equation 2-6 and inserting the expression for the Mach number obtained
from Equation 2-8, the following expression for jump in temperature across the shock is obtained (26).
l
l
FF
FFF
1
0
Equation 2-11
1
1
lF
Equation 2-12
Having the temperatures and densities, the pressure jump across the shock can be determined from
Equation 2-3 (27).
11
21 2
0
Mp
p
Equation 2-13
In the limit of an infinitely strong shock in an ideal gas initially at rest (i.e. M ), from Equation 2-8
it can be seen that lFF . For air, 4.1 , and Equation 2-12 reveals that a strong shock in air can
increase the density by at most a factor of 6 (26).
The relations above generally express the properties at the blast discontinuity. However, it is
useful to have a description of the whole blast domain. An important technique to generate such a
description is known as theory of point blast waves (28). Sedov (29), von Neumann (30), and Taylor (31)
describe exact self-similar solutions to the equations of fluid dynamics; however, these solutions are
only valid for very strong shocks (28)(32). Sakurai (33) developed a perturbation solution in an attempt
to accurately describe the blast over the whole regime of shock strengths (28). He assumed a linear
velocity profile behind the shock and that the derivative of the density with respect to the Mach number

27
can be neglected. These two assumptions lead to relatively inaccurate results in the weak shock regime
(28).
Following the same general approach as Sakurai, Bach and Lee developed the theoretical basis
for a point blast solution valid over the full regime of shock strengths (28)(34). They start from the mass
(Equation 2-14), momentum (Equation 2-15), and energy (Equation 2-16) conservation equations given
below for unsteady adiabatic expansion of a blast wave.
2j
Equation 2-14
2
1 f
Equation 2-15
fff
ff22
Equation 2-16
0
2
0
,,
,,
,,
tr
R
trpf
tR
tru
SS
Equation 2-17
22
2
0
2
1
MR
c
tR
r
R
RR
SSS
SS
Equation 2-18
In these equations, r is the distance from the point of detonation, SSS RRR ,, are the location, radial
velocity, and radial acceleration of the blast front, respectively, and u is the air particle velocity. Also,
for a spherical blast wave, 2j (28). These equations are solved with the following boundary
conditions at the blast front, following from the normal shock conditions derived above (28).

28
11
2,1
Equation 2-19
1
1
1
2,1
f
Equation 2-20
21
1,1
Equation 2-21
The key to method of Bach and Lee is assuming a power law relationship the density profile.
q,1,
Equation 2-22
The exponent is solved by plugging Equation 2-22 into the mass conservation integral.
1,11 jq
Equation 2-23
Equation 2-22 and Equation 2-23 can be used along with the conservation mass (Equation 2-14) and the
boundary condition 0,0 (the velocity at the detonation point is zero by symmetry) to obtain an
expression for the particle velocity behind the blast discontinuity.
ln1,1,
Equation 2-24
d
d ,1
,1,1
2
Equation 2-25

29
The expressions for density and particle velocity and their derivatives are plugged into the conservation
of momentum equation and integrated to obtain an expression for the dimensionless pressure.
2ln22ln22
11ln21,1,222
4
2
3
2
2
qqf
qffffq
Equation 2-26
d
d
qf
,12,1,1,11
2
,1 2
2
Equation 2-27
,12,1,1,12,12
,1 222
23d
d
qf
Equation 2-28
222
42
,1,1
qf
Equation 2-29
The solution of the dimensionless particle velocity and pressure profiles requires knowledge of as
well as its derivative. Plugging in the density, particle velocity, and pressure expressions into the
conservation of energy integral, the following relationship is obtained (28).
4
1122
,12
11112
,1
1,1,14
18
4
14
4,111
1
4,121
2
1
1
21
2
1
2
11
D
j
jDD
y
Dj
D
d
d
Equation 2-30

30
1
1
2
00
0
0
1
0
1 13
j
j
j
S
kc
ER
R
RyjjD
Equation 2-31
In Equation 2-31, 0E is the energy released by the blast and 4,2,1jk for 2,1,0j (28).
Differentiating the expression for y , the following expression is obtained (28).
2
1 yj
d
dy
Equation 2-32
Equation 2-30 and Equation 2-32 are a system of ordinary differential equations that can be numerically
integrated (e.g. with fourth-order Runge-Kutta) to fully describe the point blast solution pressure and
particle velocity (28). Numerical integration must proceed from the initial condition 00 and
00 y . However, both Equation 2-30 and Equation 2-32 are singular at this condition. To circumvent
this difficulty, Bach and Lee begin the numerical integration from a small perturbation of and expand
an initial condition of the following form (28).
4
4
3
3
2
21
3
3
2
210
yyyyy
Equation 2-33
Coefficients of Equation 2-33 are provided in Appendix A. Results of Bach and Lee's method are
provided below along with a comparison with other attempts (28).

31
Figure 2-5 - "The variation of the shock decay coefficient vs shock strength for spherical blast waves, =1.4" (28)
2.3 Air Blast Interactions With Structures
Air blast interaction with structures has been an important topic of research as well. A simple
yet informative analysis to examine is that of a blast wave normally reflecting off of an infinitely rigid
surface. The pressure of the air impinging on the rigid surface has two components, the static pressure
and the dynamic pressure. For air, the reflected pressure rp can be related to the atmospheric
pressure and peak overpressure of the blast wave as shown below (23).
S
S
Srpp
pppp
0
0
7
472
Equation 2-34
For peak overpressures very small compared to atmospheric pressure, the minimum reflected pressure
is twice the peak overpressure. In the opposite limit, the maximum reflected pressure is eight times the
peak overpressure. Equation 2-34 was derived by Rankine and Hugoniot assuming air behaves like a real
gas with a constant ratio of specific heats. Experimentally measured ratios of reflected pressure to peak
overpressure have reached as much as twenty (23).
32
Kambouchev, Noels, and Radovitzky have performed several studies extending Taylor's (35)
analysis of fluid-structure interaction for waves in the acoustic range (27)(32)(36)(37). Taylor showed
that the impulse transmitted by a reflected wave to a free-standing plate is reduced due to pressure
relief effects caused by the motion of the plate (32)(35). Kambouchev et. al. investigated this effect
analytically for uniform (37) and exponential (36) incident blast profiles of arbitrary intensities for the
asymptotic limits of very heavy and very light plates (32). They also developed a numerical method to
simulate blasts having arbitrary profiles incident on a free-standing plate. The method is a shock-
capturing finite-difference scheme solving the Lagrangian form of the equations of compressible flow
based largely on the von Neumann and Richtmyer algorithm (38) as presented by Drumheller (26)(32).
The method is applied not only to uniform and exponential profiles but also to the point source solution
provided by von Neumann and Sedov(30)(29). Through simulations and analytical work Kambouchev et.
al. demonstrate that fluid-compressibility effects greatly affect the momentum transmitted to a free-
standing plate from an incident blast wave (32). Specifically, lighter plates acquire less momentum at
the cost of greater displacement (32).
There have been many studies on the interaction of blast waves with cellular materials (i.e.
foams and honeycombs), defined by Gibson and Ashby to be materials "made up of an interconnected
network of solid struts or plates which form the edges and faces of cells" (39). The most important
property defining these materials is the relative density: the ratio of the density of the cellular material
to that of the solid material composing the walls of the cells (39). Once this ratio exceeds 0.3, the
material is no longer cellular but rather is a solid material containing isolated pores (39).
Mazor et. al. considered the effect of inserting a foam at the end of a shock tube on the
pressure transmitted to the back wall of the tube following an incident shock wave (40). They develop
the governing equations for the problem and offer a proof for why insertion of the foam can only
increase the pressure transmitted to the back wall as demonstrated experimentally by Skews et. al. (41)
and others (40). In fact, the results of Gvozdeva et. al. (42) investigating this problem with polyurethane
foam suggest the peak pressure reflected from the end wall of the shock tube is higher due to the foam,
this peak pressure increases as the initial length of the foam increases, and that there is an asymptotic
limit where the increase in length of foam no longer increases the peak pressure (43). Ben-Dor et. al.
investigated this uniaxial strain problem further experimentally and numerically (using the von
Neumann and Richtmyer algorithm) with an open-cell polyurethane foam (43). The major outcomes of
this effort were validation of their numerical simulation code qualitatively with their own experiments

33
and those of others as well as determination some dependencies of the shock propagation through the
foam specific to the uniaxial strain case (43).
Li and Meng modeled shock propagation through a cellular material using a one-dimensional
mass-spring model (44). While cellular materials generally attenuate low-intensity pulse pressures when
the stress waves do not cause densification, Li and Meng considered the "unpredictable" behavior when
higher intensity stress waves are transmitted. Their results suggest that blast pulse shape helps
determine whether the shock is enhanced or attenuated in a cellular material. Furthermore, their
model indicates that while momentum and energy decrease as the shock passes through a cellular
material from nonlinear dissipation, the peak stress or pressure may be amplified. They develop
dimensionless parameters for material properties and loading conditions to give critical conditions for
blast pulse transmission enhancement. It should be noted, however, that this model considered only
the structure of the solid phase of the cellular material; consideration of the fluid phase may provide
additional insights into the behavior under shock loading (44).
Hanssen et. al. investigated the effect of aluminum foam panels on the energy and impulse
imparted to a blast pendulum due to a close-range detonation (45). Their experimental results showed
that the impulse and energy transferred to the pendulum increased with the addition of foam panels.
They try to explain the results through an analytical solution and non-linear finite element simulation in
LS-DYNA®. Though the results were not explained as expected, they did show that while the local
response to a blast can be shaped by addition of the foam panels, the global response of the structure is
governed by the total impulse imparted rather than the shape of the impulse. They do suggest that the
increased transmission of impulse and energy may be due to the change in shape of the original planar
panel geometry to a double-curved geometry (45).
Levy et. al. considered propagation of shock waves in rigid porous materials via numerical
simulations (46). They used a multiphase approach considering the dynamics of both the solid
composing the porous structure as well as the fluid inside the structure at the representative
elementary volume level. An upwind shock-capturing total variation diminishing scheme for the
governing equations was developed and validated against experimental results for a number of different
initial conditions, providing the first time compaction waves in a porous media were successfully
simulated (46).

34
Several investigators have considered shock wave propagation through sandwich structures.
Xue and Hutchinson conducted a numerical study using the explicit form of the finite element software
ABAQUS® comparing the deflection of a metal sandwich structure to that of a solid metal structure of
equal mass. Their results suggest that such sandwich structures outperform their solid counterparts of
equal material and weight if the core of the sandwich structure is sufficiently strong (47). This analysis,
however, neglected important aspects of the blast problem, including fluid-structure interaction and
strain-rate dependence of materials. Later, Qiu et. al. looked at the same problem analytically and
computationally (using ABAQUS®) including fluid-structure interaction effects and strain hardening (48).
Their computational results showed reasonable agreement with the analytical ones They conclude that
strain hardening had a negligible effect on this sandwich plate response and confirm the conclusion of
Xue and Hutchinson that an optimized sandwich design can sustain a larger shock impulse than a
monolithic design of the same mass and material (48).
Zhuang et. al. examined shock propagation through bi-material sandwich structures of
alternating polycarbonate and either glass, aluminum, or stainless steel via flyer-plate experiments (49).
They found a number of interesting things, including the following: 1) Periodically layered composites
can support steady structured shock waves. 2) Scattering of the shock wave due to internal interfaces
slows the propagation velocity of the wave and increases the rise time of the shock. 3) Also, the higher
the intensity of the shock, the steeper the shock front. 4) Furthermore, increasing the number of
interfaces while maintaining the total weight of each constitutive material increases the nonlinearity of
the composite as well as contributes to greater energy dissipation. 5) Finally, impedance mismatch
between constitute materials contributes to the dissipation and dispersion of the shock wave (49).
Berezovski et. al. investigate a similar set-up as did Zhuang in a computational context (50).
They employ a composite wave propagation scheme involving a Gudonov step after several second-
order Lax-Wendroff steps to solve the one-dimensional governing equations. Results are shown to
agree well with those of Zhuang. Furthermore, they explore a parameter of non-linearity incorporating
material, geometrical, and blast information to help determine the response characteristics (50).
Main and Gazonas considered the optimization of a sandwich structure consisting of two solid
plates sandwiching a cellular material (51). They propose an analytical solution and then compare these
results with a finite element simulation in LS-DYNA® for the problem of an air-blast incident on the
structure with the back face unconstrained. It was found that the capacity of the sandwich structure to
mitigate shock transmission was limited by the impulse required to create full densification in the core

35
cellular material. Furthermore, their results suggest blast mitigation is enhanced with increasing the
fraction of total mass in the front face of the sandwich structure. This, however, leads to undesirable
back face accelerations and, therefore, they propose an optimal mass ratio for a maximum allowed back
face acceleration (51). Karagiozova et. al. used the commercial finite element code ABAQUS® to
investigate air-blast loading of sandwich structures including an aluminum foam core (52). They found
that optimizing a blast mitigation structure of this type depends on the interaction effects of sandwich
geometry and material properties.
2.4 Blast Mitigation Strategies
An incredibly important reason to understand the characteristics of blast waves as well as their
interactions with structures and materials is to be able to design equipment to protect people and
infrastructure from ill-intentioned blast effects. A popular method of blast wave mitigation under
consideration is use of water. Chong et. al. developed and validated a finite element model in MSC-
Dytran® demonstrating the effectiveness of volumes of water surrounding an explosive mitigating the
blast effects (53). Overpressure and impulse density are reduced when the shock breaks up the water
into droplets, further increasing the surface area available for heat transfer for vaporization and
reducing the temperature of the surroundings. Their findings were consistent with previous
experimental results indicating that the higher the water to explosive ratio, the greater the reduction in
peak pressure from the blast (53). Homae et. al. considered surrounding an explosive with a mixture of
water gel and small foam polystyrene spheres as well as sand (54). Their results suggest for a given
mass, the lower density mixtures provide superior blast mitigation, while for a given volume, the 50/50
mixture of sand to polystyrene or sand provide the best blast mitigation (54).
Schwer and Kailasanath take a different approach using numerical simulations to investigate the
effect of a water mist on a blast (55). Through parametric studies, they indicate a number of conclusions
regarding the effectiveness of water mist at blast mitigation. First, they suggest the mitigation of the
shock-front using water mist is through momentum extraction. Next, for a water mist to be effective, it
does not need to be directly adjacent to the explosive, just relatively close. Furthermore, they showed a
relatively diffuse mist of water may be just as effective as having a "water wall" surrounding the
explosive. In addition, results indicate that there exists an optimal droplet size to maximize mitigation at
various distances from an explosive (55).

36
Of course, other mitigation techniques not using water exist as well. Pfannes et. al. investigate
shock propagation through a chain of elastic spheres of gradually reducing diameters, also referred to as
"tapered granular chains' (56). When larger spheres contact smaller spheres, momentum is conserved
while kinetic energy is not. The effect of the tapered granular chain is to decimate the original shock
into tiny shocks. These tiny energy bundles are eventually absorbed by the system due to friction and
restitution effects. Results of the study indicate that the greater the tapering of the beads the higher
the absorption of the shock energy by the system (56).
Nesterenko surveys use of "soft" condensed matter (including granular and porous materials
and foams) for blast mitigation (57). According to Nesterenko, the important parameters of a "soft"
condensed matter for determining blast mitigation capabilities are density, porosity, and relative
geometrical size. Furthermore, blast mitigation may be enhanced by including larger pores along with
the smaller pores in the material, allowing energy absorption through large displacements of adjacent
particles as large pores collapse. In accordance with other efforts, Nesterenko agrees that nonlinearity
of periodically layered composites and granular materials may be exploited to tailor the response of a
structure to shock loading. Furthermore, while shock enhancement by "soft" condensed materials is
possible, it can be avoided by using a sufficiently thick layer of material. The main conclusion from the
broad survey of work is that these types of materials can be successfully used for shock/blast wave
mitigation (57).
Allen et. al. investigated the blast mitigation characteristics of different material properties (58).
Experiments were performed by surrounding an explosive by water, glycerin, expanded Perlite, or sand.
They found that porosity plays an important role in determining blast mitigation capabilities and that
there exists and optimum porosity for blast mitigation for a given material. Furthermore, they found
that more dense materials provide a greater level of blast attenuation and that evaporation of water did
not provide a mitigating mechanism (58).

37

38

39
Chapter 3 The Use of Filler Materials for Head Protection
The use of a fluid-filled helmet to protect against head trauma has been considered before. In
his 1971 patent, Morgan describes a multitude of chambers connected through valves inside a helmet
structure (59). Some of the chambers would be filled with a nearly incompressible fluid. Upon impact,
the fluid would be forced through the valves into the empty chambers. Then, through clever design, the
fluid would return to the original chambers. The energy required to achieve this fluid motion
represented a direct measure of the impact energy dissipated (59). Others have made similar efforts.
Patents by Holt (60), Villari (61), Gooding (62), Hosaka (63), Calogne (64), and Mendoza (65) spanning
the last four decades all describe some manner of including fluid inside helmet liners. These patents all
focused on improving protection from head impacts, not from blast loading as is the focus of this study.
Improvement of helmets in general has been an active research topic, moreso for impact
protection than for blast protection. Forero Rueda et. al. investigated different designs of liners for
equestrian helmets using finite element simulations (66)(67). In the first paper, they looked at the
performance of two different liners: the first was composed of three layers of foam of different
densities and the second was a conventional liner composed of a single foam. Results indicated that
attenuation of peak acceleration was tied to the contact area, distribution of material stresses, and
dissipated plastic energy density. Peak accelerations were reduced by increasing contact area and
varying foam density through the thickness to ensure plastic absorption of energy as the foam deforms
(66). In a second paper, Cui et. al. consider a functionally graded foam of varying density rather than
layers of different density foam to avoid delamination and crack propagation, and similar results were
obtained to those in the first paper (67).
In a very interesting and relevant paper, Aare and Kleiven describe simulations using LS-
DYNA3D® of ballistic impacts on a human head wearing a military helmet (68). The helmet used in this
study is the Personal Armor System Ground Troops' (PASGT) helmet, the predecessor to the Advanced
Combat Helmet (ACH) being considered in this study. Their simulations indicate that there exists an
optimal helmet shell stiffness to prevent stress transmission to the skull, though no implications on
pressure transmission to the brain are indicated (68).
3.1 Sports Helmet Research at MIT
Professor Young at MIT has pursued improved helmet performance via inclusion of filler
materials in foam liners of sporting helmets since 2004 (69). The original idea included a liner
40
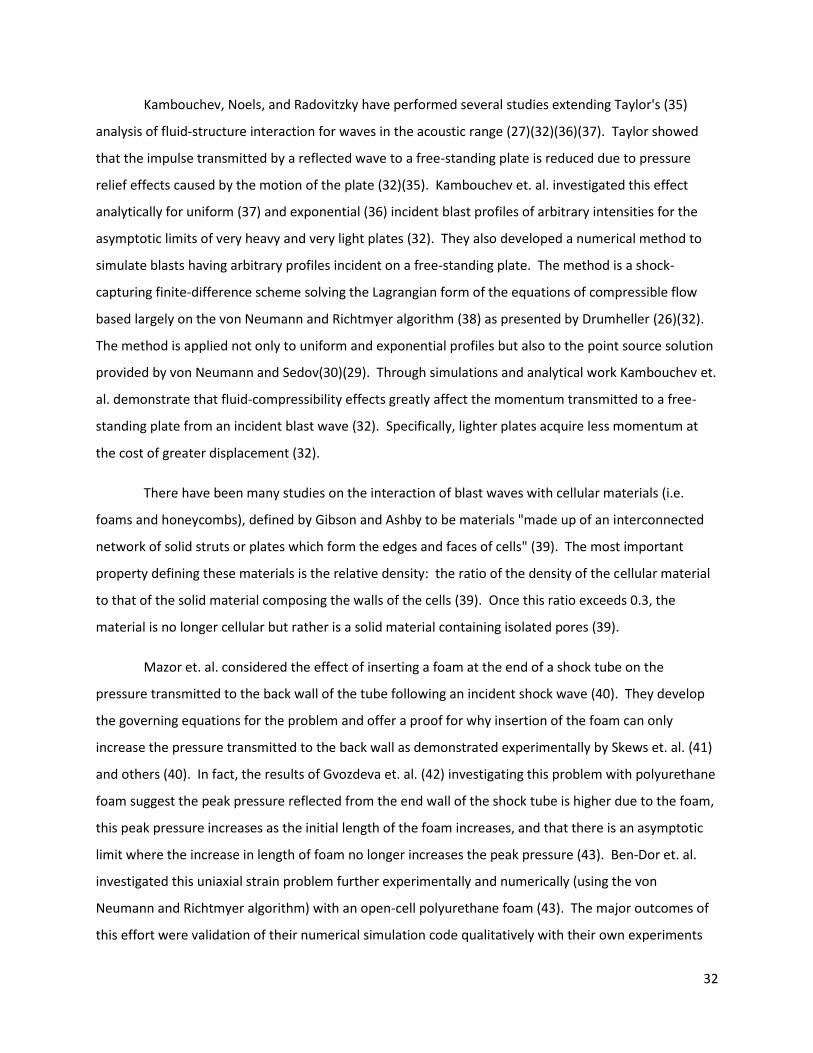
constructed from a closed-cell foam containing a series of channels and reservoirs to spread the forces
from impact and distribute the fluid to different areas in the liner away from the impact site. In general,
the liner was to include a mesh of coupled channels and reservoirs filled with an incompressible fluid.
The proposed mechanisms for increased biomechanical protection were reduction in the peak force as
well as lengthening of the duration of the forces caused by impact. A conceptual drawing of such a liner
is shown below (69).
Figure 3-1 - A mesh of interconnected channels (69)
Claire and Vue investigated the effectiveness of viscous dissipation for peak acceleration
reduction (70). They showed up to a 35% reduction in peak forces may be attained by surrounding
VN600 foam - a closed-cell vinyl nitrile foam provided by Der-Tex Corporation (www.dertexcorp.com/)
with a highly viscous fluid compared to the performance of the foam alone. Improvement was found in
both spatial and temporal distribution of the forces using the viscous fluid. Furthermore, they showed
acceleration reduction by including fluid-filled channels inside the VN600 (70).
Stewart completed a Master's degree thesis project investigating the benefits of the resilient
VN600 over the traditional bicycle helmet liner material expanded polystyrene (EPS) and the effects of
channel geometry and fluid filler viscosity on peak acceleration reduction (71). Experiments were
performed via drop tests using a headform conforming to ASTM F1447-06 bicycle helmet drop testing
standard. The headform was dropped onto a test sample resting on a flat anvil. The setup is shown
below(71).

41
Figure 3-2 - Drop Test Apparatus (71)
Acceleration data was collected using accelerometers attached to the headform. Impact
velocity was recorded via consecutive light gates. Tests were conducted using both constrained and
unconstrained channels. That is, in one design fluid flowed freely into and out of the channels, whereas
in the other fluid was trapped in the channels. Furthermore, multiple drops were performed on each
sample, testing the integrity of the samples over multiple impacts(71).
Results showed that VN600 substantially outperformed EPS in terms of peak headform
acceleration, especially over multiple impacts. Tests of samples of varying channel diameters using air
and water with the channels constrained showed higher peak headform accelerations over samples with
no filler materials, consistent with the findings of Claire and Vue (70). Tests using air and water in
unconstrained channels showed noticeably different characteristics. Results for air were not
appreciably different than those of no filler materials. However, using water as a filler material showed
acceleration reduction, with the best reduction occurring with 3/8 in diameter channels. Other tests
were conducted with various mixtures of water and glycerin as a filler material in unconstrained
channels. Of the mixtures tested, the most effective at reducing peak acceleration was 30% glycerin by
weight. A representative chart summarizing these results is provided below (71).

42
Figure 3-3 - Performance of VN600 with and without channels compared to EPS (71)
Testing was performed at MIT on ski helmets and other test samples as well using the same test
apparatus as Stewart (4). The first set of tests demonstrated the superior performance of a high end ski
helmet manufactured by POC® over a cheaper helmet in both impact and load-deflection tests. These
helmets are shown below.
Figure 3-4 - Ski helmets tested by Leedom (left) and POC (right) (4)
Other testing involved samples of VN600 having either zero, one, or two channels filled with water,
glycerin, or glass beads. In the dual channel configuration, only water was tested. Pictures of the
samples are shown below.

43
Figure 3-5 - (left) Solid block of VN600 (center) single channel (right) dual channel (4)
Results from these tests indicate that for impact scenarios, smaller channels produced a lower
acceleration with water as a filler than did larger channels. Furthermore, glycerin out-performed water
as well. Both of these results indicate viscous losses contribute to stress wave mitigation in impact
events. These preliminary results were encouraging enough to pursue this technology further as a head
protection method (4).
3.1 Blast Protection Using Filler Materials
Promising results of using filler materials to provide protection from impacts encouraged
application of the technology to the problem of blast-induced traumatic brain injury. In the first stage of
this research, materials having various physical properties were tested in a simplified geometry to
investigate their mitigation properties inside channels in VN600 foam. The second stage of the project is
to investigate a design for an actual helmet prototype liner, which is the topic of this thesis.
For his Master's thesis, Alley performed blast experiments on sandwich structures containing
the various filler materials (72). Samples were 10 in x 10 in x 1 in, and those with filler materials had an
8 in x 10 in x 0.5 in cavity. Samples were held between two 1/8 in thick pieces of poly(methyl
methacrylate), or PMMA and were exposed to a blast from an explosive driven open-ended shock tube.
The mouth of the shock tube was 12 in from the front of the test sample. The pressure measurement
region behind the sample was surrounded by a PMMA enclosure to prevent the shock wave from
converging around the sample and confounding the isolation of the transmitted shock strength. The
experimental setup is shown in Figure 3-6. Data was collected with a pressure transducer located 2.75
in behind the center of the test sample (72).
Several filler materials were considered encompassing a wide variety of physical characteristics.
These included the granular/porous solid fillers CAB-O-SIL®, aerogel, expanding foam, volcanic tuff, and
glass beads. Fluid fillers tested included water and glycerin. Results of the tests are provided in Table
3-1 (72).

44
Figure 3-6 - Setup used by Alley (72)
Table 3-1 - Results from Alley's testing of sandwich plates (72)
Experimental results suggest the high density fillers, tuff, glass beads, water, and glycerin,
provide the best mitigation levels, especially with respect to impulse and peak pressure. While water

45
and glycerin both performed well, there was no discernible advantage to the higher viscosity of glycerin
over that of water leading to blast mitigation. All samples show high levels of blast pressure attenuation
and impulse reduction; however, it should be noted that most of this attenuation was attributable to
the PMMA sheets sandwiching the test samples (72).
Christou worked towards a finite element model of blast loading of these samples validated with
the results of Alley (73). The model was developed using ABAQUS/CAE® and solved using the
ABAQUS/Explicit® code. To maintain a distinct definition of the test sample while accommodating the
large deformations in the air domain experienced during shock transmission, he used the coupled
Eulerian-Lagrangian (CEL) formulation (73). In this formulation, the air domain is treated using an
Eulerian formulation of the governing equations while the test sample and supporting structure are
treated with the Lagrangian formulation. General contact algorithms are used to track the boundary
between materials (74). More about CEL will be discussed later.
As a first step, Christou verified that the solution provided by ABAQUS® of a uniform planar
shock in air reflecting normally off a rigid surface agrees with the shock jump conditions as described in
section 2.2. Specifically, he found that the pressure jump, density jump, and particle and shock
velocities agreed with theory. Error in these values increased with an increase in the strength of the
shock, though at the shock levels tested in the project errors were around 1%. In the reflected region,
particle velocities showed a substantial percentage of error, though error in absolute value was small.
Overall, the results demonstrate that ABAQUS® is capable of simulating air blast scenarios (73).
Christou found instabilities in the solution surrounding the passage of the shock in the form of
local oscillations of the solution near the jump. These instabilities may be treated using artificial
viscosity, which allows shocks to be captured that have a width less than the mesh size.
ABAQUS/Explicit® includes a linear term and a quadratic term of artificial viscosity. The linear term is
linear in volumetric strain rate and is meant to dampen ringing effects. The quadratic term is quadratic
in volumetric strain rate and applies only when the material is under compressive stress (74). Christou
determined for these simulations that the best coefficient for the linear term is 0.2 and that for the
quadratic term is 1.2 (73).
To simulate blast loading, Christou applied a decaying pressure load at one end of the air
domain. The load was tuned in such a way as to agree with the experimentally measured free field
pressure profile. For simplicity, Christou assumed a planar incoming wave, and symmetry boundary

46
conditions were imposed on lateral sides of the air domain to achieve this effect. Results were obtained
for a solid foam sample as well as a sample with water as a filler material. The numerical and
experimental results agreed in order of magnitude, but values did not show excellent agreement. Peak
pressure for the water filler material matched well, but it was out of phase with the experimental results
(73).
A likely reason for the discrepancy between Christou's model and experimental results is the
very low transmitted pressures involved. Based on the sensitivity of the pressure transducers, there
may have been as much as 50% discrepancy between measured results and actual results. To alleviate
this issue, the experimental test setup was reconsidered. These efforts were recently described in
Goel's thesis (4). Smaller test samples were used this time. Furthermore, the test samples were secured
flat against an aluminum plate. Two pressure transducers were inserted into the plate with the
diaphragm flush with the front face of the plate. One transducer was behind the center of the test
sample, and the other was adjacent to, but not covered by, the test sample. The test setup is shown
below.
Figure 3-7 - Modified experimental setup (4)
Test samples for these experiments were similar to those used by Alley, only smaller. That is,
samples were 5 in x 5 in by 1 in, and cavities were 5 in x 3 in x 0.5 in. Filler materials tested included

47
glass beads, aerogel, volcanic tuff, CAB-O-SIL®, water, glycerin, and AgileZorbTM. AgileZorbTM is an
advanced material containing nanoporous spheres suspended in a hydrophobic gel
(www.agilenano.com). This material was blasted directly. Also, a standard pad from an Advanced
Combat Helmet was blasted for comparison purposes. Peak pressures for each sample are provided
below.
Figure 3-8 - Results from modified testing of sandwich structures (4)
Performance of each filler material may be assessed from Figure 3-8. With the exception of
aerogel, all samples tested provide some attenuation of the peak pressure. AgileZorbTM shows the
greatest reduction in peak pressure. While these results were promising, the company that makes this
material was not interested in pursuing further research with this group. Glycerin and glass beads were
the most promising among the remaining filler materials. Water, solid VN600 foam, and the Army pads
performed roughly the same as shown here. Results also show that the rise times increase using
glycerin and water fillers, a desirable effect for minimizing damage to the brain (4).
A finite element model of the new scenario was then pursued. The release of ABAQUS® v 6.10
included the ConWep (https://pdc.usace.army.mil/software/conwep/) air blast module. Given a point
of detonation and equivalent mass of TNT for the explosion, the module imposes appropriate loading on
structures, including dynamic pressure effects (74). The main advantage of using this module is avoiding
modeling the air domain and shock propagation through it, substantially reducing the computational
effort. This module rather than CEL is employed by Goel to achieve blast loading. However, for fluid
filler materials, CEL is still used for the channel domain. Good agreement is found between the
measured and simulated loading, as indicated in the figure below (4).

48
Figure 3-9 - Comparison of experimentally measured and numerically applied loading (4)
It is evident from the figure that use of the ConWep module captures the rise time and peak
pressure of the applied loading very well and is sufficient for use in these simulations. Simulations using
solid foam and other filler materials were then performed, with peak pressure used as a gauge of
similarity between experiments and simulations. Very good agreement between peak pressures was
found for solid foam, glass beads, and glycerin. Simulations indicated a lower peak transmitted pressure
for the aerogel filler material, while the same was not true experimentally. A plausible explanation for
this discrepancy is the lack of an accurate material model for aerogel, which is largely composed of air
and is very compressible. Discrepancy in the results with water as a filler material are not easily
explained. The simulations predict water to perform very similarly to glycerin, though experimentally
glycerin looks better than water (4).
After having a validated finite element model, Goel pursued parametric and sensitivity analyses.
He varied viscosity of a fluid filler material over several orders of magnitude. Results from these
simulations indicate that for the blast problem, viscosity does not play a role like it did in impact
experiments. He verified this property by simulating impacts on similar samples and demonstrating that
viscosity does affect those results. He also looked into varying the channel geometry, including multiple
round channels as well as interconnected channels. The results suggest that the configuration of the
channels does not matter as much as the amount of filler material present. That is, blast mitigation may
be more of an inertial effect than anything (4).

49

50

51
Chapter 4 Material Characterization
In order to perform numerical simulations, accurate material models are required to describe
air, VN600, and all filler materials involved. The material models used are described below.
4.1 Fluid Materials
The fluid materials for this study, air, water, and glycerin, are described using equations of state
describing the hydrodynamic behavior of the materials. That is, they are described by constitutive
equations defining the pressure of the material as a function of the density and internal energy (74).
Deviatoric behavior for these materials is modeled using Newtonian viscosity. This model assumes the
deviatoric and volumetric responses are uncoupled. Deviatoric stress is related to the deviatoric strain
rate and engineering shear strain rate as given below.
eS 2
Equation 4-1
Here, S
is the deviatoric stress, e
is the deviatoric part of the strain rate, is the viscosity of the fluid,
and
is the engineering shear strain rate (74). In general, viscosity is a function of temperature.
However, in this project it is assumed the dynamics of the problem are fast enough to ignore this
temperature dependence.
4.1.1 Air
The model applied to air is the ideal gas law. This was mentioned in Section 2.2, but is revisited
here to point out some properties required by ABAQUS®. Pressure, density, and temperature of an ideal
gas are related as follows.
Z
A Rpp
Equation 4-2
Here, p is the gauge pressure, Ap is atmospheric pressure, is the density, R is the gas constant,
is the temperature, and Z is the absolute zero on the temperature scale being used. An important
feature of an ideal gas is that the specific energy depends only on the temperature, which is given
below.

52
Z
Z
dTTcEE vmm
0
0
Equation 4-3
Here, 0mE is the initial specific energy at the initial temperature 0 and vc is the constant volume
specific heat, which is only a function of temperature for an ideal gas (74). The gas constant may be
calculated by dividing the universal gas constant by the molecular weight of the gas under
consideration. Furthermore, for an ideal gas, vp ccR where pc is the constant pressure specific
heat (74). Two of the quantities temperature, pressure, and density needs to be specified to fully define
the initial state of the gas.
For this project, time scales of compression of the air are very small, and it assumed the analysis
is adiabatic and that air has a constant specific heat. Calculation of the specific energy Equation 4-3 is
simplified greatly.
Z
vm cE
Equation 4-4
The ideal gas equation of state may then be recast in the form given here, the same relation given by
Equation 2-3.
mA Epp 1
Equation 4-5
Properties used for air in this project are given in the table below.
Table 4-1 - Air Properties

53
4.1.2 Water and Glycerin
For modeling viscous, incompressible fluids governed by the Navier-Stokes equations of flow,
ABAQUS® suggests use of the linear pS UU equation of state model (74). The equation of state
describes the volumetric response, with the bulk modulus acting as a penalty parameter for the
incompressible constraint (74).
Water and glycerin are modeled using the Mie-Grüneisen equation of state, which is linear in
energy. The form used here is given below.
HmH EEpp
Equation 4-6
The subscript H stands for the so-called Hugoniot properties, and is the Grüneisen ratio. The
Grüneisen parameter is defined by a material constant 0 and reference density 0 as given below.
0
0
Equation 4-7
The Hugoniot energy is related to the Hugoniot pressure as given below.
02
H
H
pE
Equation 4-8
The quantity 01 is the nominal volumetric compressive strain. Plugging Equation 4-7 and
Equation 4-8 into Equation 4-6 yields an expression for pressure as a function of density and specific
energy.
mH Epp 00
0
21
Equation 4-9
Equation 4-9 and the energy equation form a coupled system that is solved by ABAQUS/Explicit® at
simultaneously at each material point (74).

54
It remains to determine an expression for the Hugoniot pressure. It has been shown that a
linear Hugoniot model relating the shock velocity SU and particle velocity pU represents the shock
response of a wide variety of materials well (26). This relationship is expressed as follows.
pS sUcU 0
Equation 4-10
A common fit to Hugoniot data of pressure and density is given below, parameterize by the same
variables as in Equation 4-10.
2
2
00
1
s
cpH
Equation 4-11
The quantity 2
00c is equivalent to the elastic bulk modulus of the material at small nominal strains,
connecting the use of this relation to model fluids (74). The expression for the Hugoniot pressure
suggests a limit for density in tension, below which negative sound speeds are calculated for the
material (74).
1
0
lim
s
s
Equation 4-12
In the absence of other specific initial conditions, ABAQUS/Explicit® assumes the material is at the
reference state, 0mE , 0p , and 0 (74). Parameters used for water and glycerin are
provided below.
Table 4-2 - Parameters used for fluid filler materials

55
4.2 Solid Materials
Unlike fluids, which are all treated using an equation of state, each solid is modeled using its
own stress-strain/strain-rate relation.
4.2.1 VN600 Foam
VN600 is a closed-cell elastomeric foam provided by Der-Tex Corporation. The solid phase of
the foam is constructed of vinyl nitrile. The typical compressive stress-strain curve for an elastomeric
foam is given below.
Figure 4-1 - Compressive stress-strain curve for an elastomeric foam (74)
There are three main phases of compressive deformation of the foam. Initially, the foam deforms in a
linear elastic manner. Deformation is controlled by cell-wall bending and, for closed-cell foams, by cell
face stretching (39). Often an elastic modulus *E coinciding with the initial slope of the stress strain
curve is defined. During the second phase, the stress-strain relationship plateaus where there is little
stress increase for a large increase in strain. Compression during this phase causes elastic buckling in
the cell walls. In closed cell foams, the pressure of the entrapped gas and membrane stretching increase
the level and slope of the plateau (74). Eventually, the cells have almost completely collapsed and
opposite cell walls touch and the solid phase itself is compressed. This causes a rapid stress increase in a
process labeled densification (74)(39). A typical tensile stress-strain curve for elastomeric foams is
shown below.

56
Figure 4-2 - Tensile stress-strain curve for elastomeric foam (74)
As in compression, the first stage of tension is a linear elastic region caused by cell wall bending and, for
closed cell foams, stretching of cell faces. At large strains, cell edges are rotated towards the tensile
axis, increasing the stiffness of the structure (74)(39).
The linear elastic deformation phase of an isotropic elastomeric foam is generally characterized
by two moduli, usually chosen from the Young's modulus *E , shear modulus *G , bulk modulus *K ,
and Poisson's ratio * (39). Gibson and Ashby relate these quantities to the elastic modulus of the solid
material composing the cell faces and edges SE and relative density S * . For a closed cell
elastomeric foam, comparison with test data indicate moduli are adequately described as follows (39).
3
1
18
3
1
211
*
*2
*2
*
*
*
0
**2
*
SSS
SSSSS
E
G
E
p
E
E
Equation 4-13
Other quantities included in Equation 4-13 are the fraction of the solid material in the foam contained in
the cell edges and the initial pressure of the pore gas 0p (39). Generally the linear elastic region for
these materials exists for small strains, e.g. less than 5%. Compression beyond this point is still fully
recoverable and, consequently, elastic. However, the response is nonlinear past the elastic collapse
stress *
el (39). A stress-strain ( * ) relation describing the behavior of a closed cell foam including
gas pressure contributions during this plateau stage is given below (39).

57
SSSS E
p
E
*
0
2**
105.0
Equation 4-14
An expression for the elastic collapse stress is provided as well (39).
S
at
SSS
el
S
at
SS
el
E
pp
E
E
pp
E
0
22/1
*2
**
0
2**
103.0
05.0
Equation 4-15
These expressions include a correction for the difference between the initial pore gas pressure and
atmospheric pressure atp . Both expressions are for closed cell foams, and the second includes a
density correction (39). After a limiting strain D , opposite cell walls touch and are compressed. At this
point the slope of the stress-strain curve approaches SE , which is so much larger than *E that the curve
appears vertical. Experimental data suggest that the limiting strain may be estimated as follows (39).
S
D
*
4.11
Equation 4-16
Use of the relations presented here requires knowledge of the mechanical properties of the solid
material composing the cell walls and edges. While other properties of the bulk foam material were
provided by the manufacturer, none of those required here were available.
For the blast problem at hand, it is required to understand the behavior of VN600 under high
strain rates. Christou performed low strain rate (~1%/s) uniaxial and volumetric compression tests and
used scaling arguments to estimate the stress-strain relationship at high strain rates (73). For this work,
a different approach was taken to directly measure the behavior of VN600 at high strain rates. One way
of performing high strain rate uniaxial compression tests on materials is to use a Split-Hopkinson
Pressure Bar (SHPB) (75). The essence of the test is to suspend a sample of test material between two
bars. A compressive wave is transmitted via one bar to the sample. Some of the wave is reflected, and
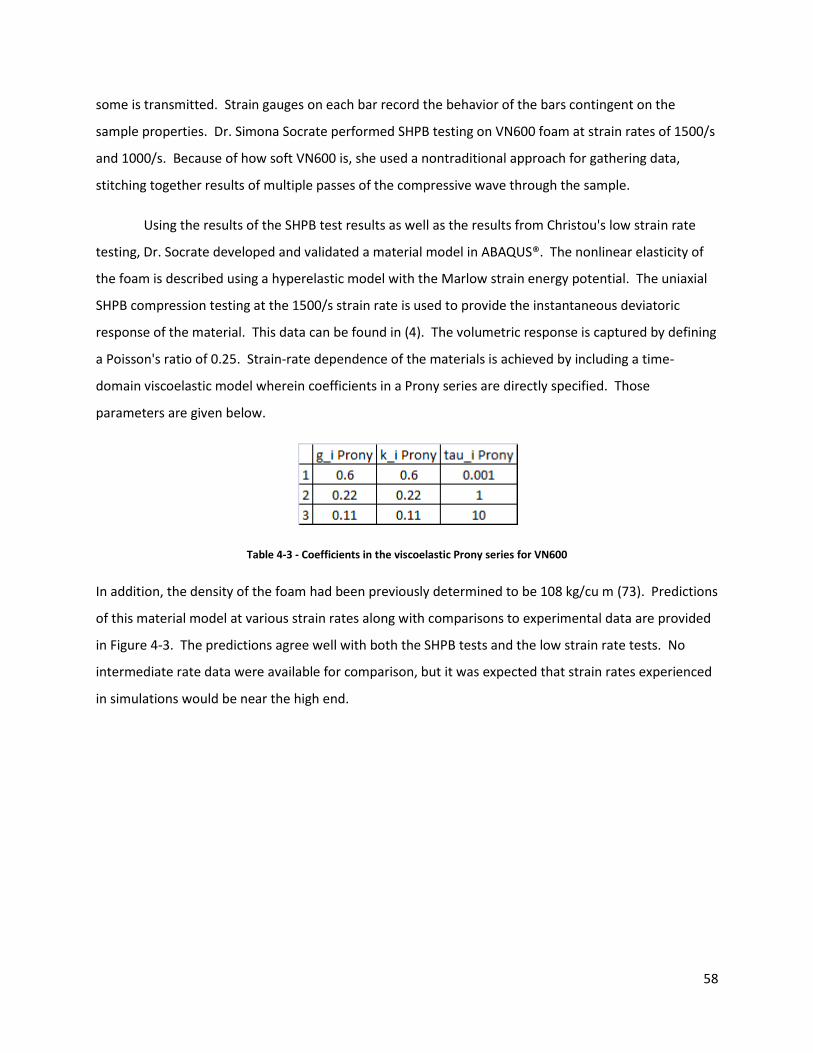
58
some is transmitted. Strain gauges on each bar record the behavior of the bars contingent on the
sample properties. Dr. Simona Socrate performed SHPB testing on VN600 foam at strain rates of 1500/s
and 1000/s. Because of how soft VN600 is, she used a nontraditional approach for gathering data,
stitching together results of multiple passes of the compressive wave through the sample.
Using the results of the SHPB test results as well as the results from Christou's low strain rate
testing, Dr. Socrate developed and validated a material model in ABAQUS®. The nonlinear elasticity of
the foam is described using a hyperelastic model with the Marlow strain energy potential. The uniaxial
SHPB compression testing at the 1500/s strain rate is used to provide the instantaneous deviatoric
response of the material. This data can be found in (4). The volumetric response is captured by defining
a Poisson's ratio of 0.25. Strain-rate dependence of the materials is achieved by including a time-
domain viscoelastic model wherein coefficients in a Prony series are directly specified. Those
parameters are given below.
Table 4-3 - Coefficients in the viscoelastic Prony series for VN600
In addition, the density of the foam had been previously determined to be 108 kg/cu m (73). Predictions
of this material model at various strain rates along with comparisons to experimental data are provided
in Figure 4-3. The predictions agree well with both the SHPB tests and the low strain rate tests. No
intermediate rate data were available for comparison, but it was expected that strain rates experienced
in simulations would be near the high end.

59
Figure 4-3 - Comparison of the model predictions and experimental results
4.2.2 Advanced Combat Helmet
The ACH shell is a composite material constructed of layers of aramid fibers combined with a
matrix material. Because it is constructed of a fiber-reinforced composite, the shell experiences
anisotropic strength properties and is most likely complicated to fully describe. In fact, characterization

60
of the mechanical response of the ACH shell material is a topic of current research. For the work
presented here, the approach used by Nyein et. al. (19) investigated the response of the ACH to blast
loading is followed. The helmet shell and ACH pads are modeled using hyperelasticity with a neo-
Hookean strain energy potential. Parameters used to define the helmet model are provided below (19).
Table 4-4 - Parameters used for the ACH helmet
4.2.3 Glass Beads
A filler material of primary interest for this project is glass beads. For testing, glass beads of
mesh size 40-60 from McMaster-Carr® (part number 3398K11 or 3386K71) were used. These are
spherical beads having nominal diameters ranging from 0.0098 in - 0.0165 in (76). The measured
density of the glass beads (as a granular material as opposed to each individual glass bead) is 1460
kg/m3. There are a couple of different approaches to treating the response of such granular materials to
loading. One approach is to model the dynamics and interactions of each individual particle within the
granular material. This approach is broadly known as the discrete element method (DEM). Several open
source and commercial codes are available implementing this method as well as interfaces for coupling
it with other codes (see for example LAMMPS at http://lammps.sandia.gov/). In many situations of
interest, the scale of the system is much larger than the scale of the individual particles, and it becomes
impractical to model the dynamics of each individual particle.
To improve the efficiency of these models involving multiscale phenomena, it is desirable to
have a continuum representation of granular materials in the form of a constitutive model. An example
of such a relationship for the incremental elastoplastic effective stress-strain response for hydrostatic
compression of cohesionless soils is provided by Pestana and Whittle (77).
a
b
a
c
ab
b
p
d
ppCnd
'1
''3/1
Equation 4-17
Material Density Young's Modulus Poisson's Ratio
kg/cu m Pa
Shell 1440 1.24E9 0.36
Pads 136 8.00E+06 0.2

61
Here, ' is the mean effective stress, is the natural volumetric strain, e is the current void ratio, ap is
an arbitrary reference stress, n is the current porosity, bC is a constant to be determined
experimentally, c is the slope of the Limiting Compression Curve (LCC) in 'loglog e space, is a
positive constant exponent, and b is the dimensionless distance between the current mean effective
stress and the equivalent LCC stress at the same void ratio (77). Parameters in this expression can be
determined through one-dimensional or hydrostatic compression testing. In a different modeling
analysis, Humrickhouse explores several hyperelastic models developed for granular materials,
specifically for application in nuclear safety analysis (78). Testing of these models was achieved by
implementing a user material routine in ABAQUS®. He found that while hyperelastic models are
intended to capture a "well-known" behavior of the dependence of the elastic moduli of granular
materials on the square root of the pressure in the material, they suffer similar short-comings to a much
simpler linear elastic model. In fact, his findings suggest that linear elasticity is often an appropriate
choice of constitutive model for granular materials (78).
Because mechanical properties were not immediately available for the glass beads used in this
project, it was necessary to perform mechanical testing. To this end, consolidation (or confined
compression) tests were performed in the Soils Lab in the Department of Civil and Environmental
Engineering at MIT with the help of Dr. Jack Germaine and Prof. Andrew Whittle. The set-up for these
tests is shown below.
Figure 4-4 - Consolidation Test Set-up
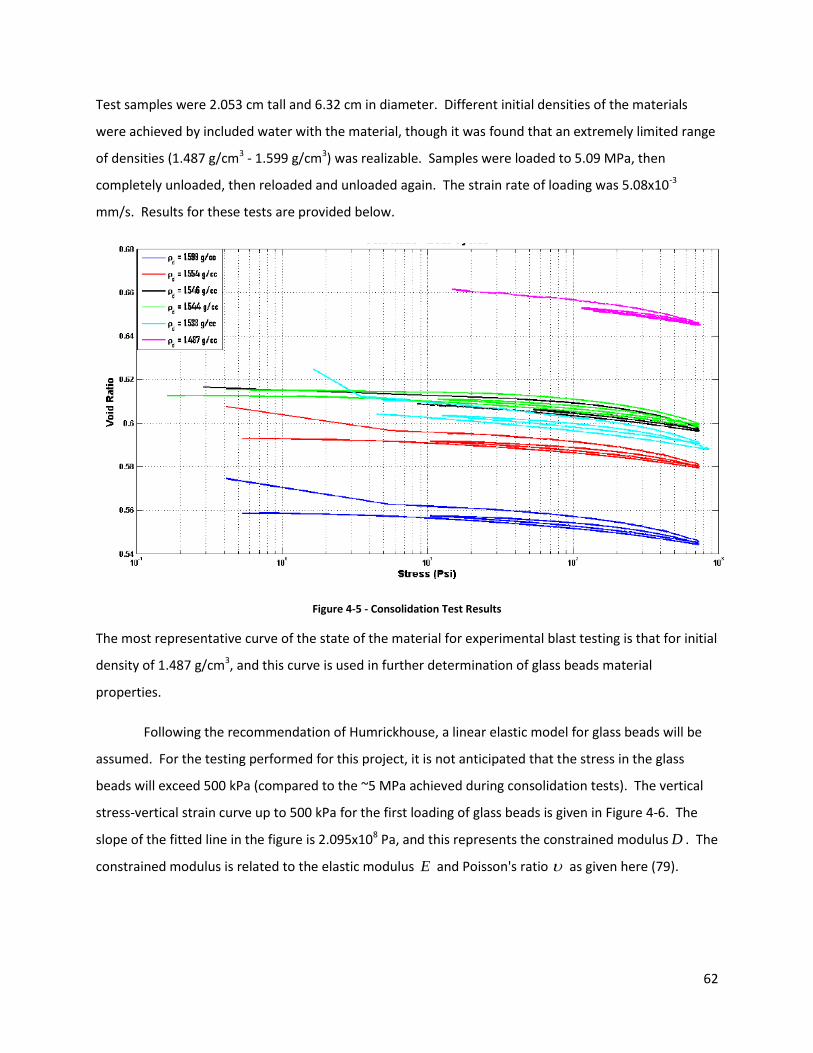
62
Test samples were 2.053 cm tall and 6.32 cm in diameter. Different initial densities of the materials
were achieved by included water with the material, though it was found that an extremely limited range
of densities (1.487 g/cm3 - 1.599 g/cm3) was realizable. Samples were loaded to 5.09 MPa, then
completely unloaded, then reloaded and unloaded again. The strain rate of loading was 5.08x10⁻³
mm/s. Results for these tests are provided below.
Figure 4-5 - Consolidation Test Results
The most representative curve of the state of the material for experimental blast testing is that for initial
density of 1.487 g/cm3, and this curve is used in further determination of glass beads material
properties.
Following the recommendation of Humrickhouse, a linear elastic model for glass beads will be
assumed. For the testing performed for this project, it is not anticipated that the stress in the glass
beads will exceed 500 kPa (compared to the ~5 MPa achieved during consolidation tests). The vertical
stress-vertical strain curve up to 500 kPa for the first loading of glass beads is given in Figure 4-6. The
slope of the fitted line in the figure is 2.095x10⁸ Pa, and this represents the constrained modulus D . The
constrained modulus is related to the elastic modulus E and Poisson's ratio as given here (79).

63
211
1
ED
Equation 4-18
Figure 4-6 - Dry glass beads stress-strain data and fit
For modeling linear elasticity in ABAQUS®, it is required to input the elastic modulus and
Poisson's ratio. Here, a Poisson's ratio of 0.3 is assumed (80). Given this Poisson's ratio and the
experimentally determined constrained modulus, the elastic modulus according to Equation 4-18 is
1.5563x10⁸ Pa. As a point of verification, the constrained compression test was simulated in ABAQUS®
using this material model. The mesh and set-up for the simulation is shown in Figure 4-7. The bottom
boundary is constrained to zero displacement in the Y-direction. The circumference of the sample is
constrained to zero displacement in the X- and Z-directions. The top face is displaced in the negative Y-
direction, consistent with the experimental procedure. Figure 4-8 shows the vertical stress-vertical
strain relationship predicted during the simulation. Comparing these results with Figure 4-6, one can
see agreement between these model parameters and those obtained through experimental data
analysis.

64
Figure 4-7 - Mesh and set-up for consolidation simulation
Figure 4-8 - Abaqus model predictions for the consolidation test
4.2.4 PMMA
Two different relations are required for modeling PMMA, properties of which are taken from
literature. The initialization step of the numerical model uses a linear elastic model, while the blast step
uses the Mie-Grüneisen equation of state. Parameters for the equation of state are available in (81).
Parameters for the linear elastic model were estimated based values found on the internet, for example
(82). Shear behavior was introduced through linear elastic strain modulus.

65
Table 4-5 - Material parameters used for PMMA
4.2.5 Aerogel
Aerogel is modeled using the Mie-Grüneisen equation of state as well. Shear behavior was
again treated with a linear elastic shear modulus. Properties used for aerogel are provided below (4).
Figure 4-9 - Material parameters used for aerogel
kg/cu m 1180
1.82
m/s 2260
0.75
G GPa 1.148
E GPa 2.2
v 0.39
0
s
0c
0
kg/cu m 95
1.08
m/s 567
G MPa 4.17
0
s
0c

66

67
Chapter 5 Blast Experiments
Blast tests were performed on the first prototype of a liner including the technology discussed
here. Tests were performed on the standard helmet pad included with the ACH as well as liners
constructed of Der-Tex with channels for filler materials. Filler materials tested included glass beads,
aerogel, water, and (pure) glycerin. In this chapter, the experiments are discussed, and the results
obtained are presented.
5.1 First Helmet Liner Prototype
The purpose of this project is to introduce additional functionality (i.e. blast protection) to the
liner of the ACH. Figure 5-1 below shows the outer shell of the ACH (purchased from GENTEX®
Corporation, Simpson, PA, USA). Figure 5-2 below shows the standard set of helmet pads that are
included with the ACH. Other pad sets may be purchased for the helmet. Furthermore, attachments
(i.e. night vision goggles, cameras, etc.) and coverings are frequently added to the outside of the helmet
shell as well.
Figure 5-1 - The Advanced Combat Helmet
Figure 5-2 - Standard ACH liner pad configuration

68
Figure 5-3 shows the first prototype of an ACH helmet liner incorporating the relevant
technology from this research.
Figure 5-3 - Top and bottom views of the first prototype liner
The prototype is constructed essentially of three 0.25" thick layers of Der-Tex foam. The outermost
layer, which contacts the helmet shell, is a solid layer constructed of three cuts of foam. Pieces of foam
are attached using 3M® Hi-Strength 90 Spray Adhesive, which was found to provide sufficient bonding
strengths while not chemically reacting with the foam in an adverse way. The second layer in the liner
defines the channel geometry. There are five parallel channels each 3 cm wide. Finally, the last layer is
composed of five cuts of foam provided a sealing cover to each individual channel.
There are a few important issues to mention regarding this prototype. First, this is only a first
prototype meant to provide initial insight into the performance of such liners as well as a basis for
comparison of numerical modeling. It may or may not suggest the optimally designed liner. Secondly,
the quality of the constructed prototypes depends largely on the skills of the person manufacturing
them. To construct these liners in a commercial fashion using specially designed molds would be
prohibitive in both time and cost at this stage in the project. Finally, this prototype is one single liner
covering the entire inside of the helmet compared to the modular design of the standard pads for the
ACH. This is mainly for simplicity of design for an initial prototype. The optimal design for a liner may, in

69
fact, resemble the current modular design. The figure below shows the newly designed liner installed in
the ACH shell.
Figure 5-4 - The prototype liner installed in the ACH shell
Another interesting consideration for this initial prototype is the weight comparison between
the ACH with the standard pads and the ACH with the new liner filled with various filler materials. This
comparison is provided below.
Table 5-1 - Weight comparison (4)
It is clear from Table 5-1 that this prototype design substantially increases the mass of the ACH.
However, as mentioned before, this is only a first prototype. Optimization studies will need to be
S. No. Material Weight (g)% Difference wrt
Army Pads
% Difference
wrt helmet*
1 Liner made of Der-Tex Foam 150 56 3.9
2 Liner with cavities in Der-Tex Foam 127.5 34 2.3
3 Army Foam Pads 96 - -
4 Glass Beads in (2) 443 361 25.0
5 Aerogel in (2) 148 54 3.7
6 Water in (2) 344 258 18.0
7 Glycerin in (2) 400 316 22.0
*Weight of Standard Size 'M' Army Helmet = 1.38 kg

70
performed to minimize the weight added by the filler materials while maintaining a sufficient level of
blast mitigation.
5.2 Experimental Set-up
Blast experiments were performed at Purdue University with Prof. Steve Son and graduate
student Ben Schimizze. A photo of the set-up is shown below.
Figure 5-5 - Experimental Set-up
Seen in Figure 5-5 is the explosively driven shock tube aimed at the "face" of the ACH. A photo and
drawing of the shock tube assembly is provided below.
Figure 5-6 - Explosively driven shock tube (72)

71
Details of this shock tube have been discussed in detail elsewhere (72)(73)(4), but a brief review
is provided here. The detonator for these experiments was a Teledyne RISI RP-502 exploding bridge
wire (EBW) detonator located in the detonation chamber. Six inches of PETN detonation cord is then
used to connect the detonation in the detonation chamber to the high explosive (HE) chamber, where 3
g of Primasheet 1000 by Ensign-Bickford Aerospace & Defense (EBA&D) in a spherical configuration was
attached to the cord. Primasheet 1000 is a plastic explosive containing 63% PETN and has a detonation
velocity around 6800 m/s. This produced an explosion with equivalent yield of 2.87 g TNT and 13.24 kJ.
Within the HE chamber the shock wave is allowed to separate from the slower moving detonation
products (72). For these experiments, the opening of the shock tube was centered on the closest point
on the rim of the helmet and maintained at a distance of 12" away.
The helmet was supported by a PMMA hemisphere attached to a PMMA cylinder. This whole
assembly was then placed inside a heavy steel pipe to hold it for experiments. This entire arrangement
and orientation with respect to the shock tube is illustrated in Figure 5-7.
Figure 5-7 - Support for the helmet during testing
Also visible in Figure 5-7 are the five pressure transducers installed in the PMMA hemisphere. In this
report, the gauges are labeled sequentially from 1 to 5 with gauge 1 being closest to the shock tube.
These are piezoelectric pressure transducers PCB® models 113A22 and 113B22. Serial numbers and
calibrations for these gauges are provided below in Table 5-2. Data from these sensors was conditioned
and amplified using PCB® model 482A22 signal conditioners. Data was recorded by Tektronix® DPO4034

72
oscilloscopes. Finally, the data was filtered four times using the two-pass bandpass filter in DPlot®
Graph Software within the 0-100kHz frequency band.
Table 5-2 - Pressure gauge details - Pressure (Pa)=1000*(Reading (V))*b1+b0
It can also be seen from Figure 5-5 that the helmet is oriented with the channel openings
pointing downwards for testing. Therefore, it was necessary to seal the channels. In previous
experimental work with sandwich structures, channels were generally taped shut. It was difficult to get
a sufficient seal (particularly for the fluid and glass beads filler materials) with this method. Additionally,
the tape would generally have to be wrapped tightly around the test sample, leading to unknown initial
stress distributions before a test even took place. Furthermore, fluid filler materials often prevented a
good bond between the tape and the foam. To alleviate all of these issues for testing the liner
prototypes, a new method was used to seal the channels. Each channel was filled completely with the
desired filler material. Then, each channel opening was covered by using super glue to attach a small
piece of Der-Tex foam over the opening. The super glue did not cause any discernible damage to the
foam. Furthermore, this method seemed to provide an excellent seal to prevent leaking of any kind,
even from fluid filler materials. Figure 5-8 shows these end caps applied to a test sample.
Figure 5-8 - End caps over the channels
Gauge Serial Num. b1 b0
1 18623 0.9844 1.5042
2 19126 1.009 -0.8876
3 19128 1.003 0.1036
4 17073 1.0095 0.2871
5 19122 0.9746 1.5629

73
5.3 Experimental Results and Discussion
Experiments were carried out using the standard ACH pads as well as the prototype liner filled
with water, glycerin, glass beads, and aerogel. Two main comparisons of results are made here. First, a
comparison between the pressure response at each of the gauges for a given trial is explored to get an
idea of the spatial distribution of the pressures. Second, a comparison across different liners at each of
the gauges individually is explored to compare the mitigation capabilities of the different liners. For all
test results, the third gauge became saturated and data was unreliable. This data is excluded from these
analyses.
5.3.1 Comparison By Filler Material
For each filler material, two tests were carried out. Helmet liners were not reused, but helmet
shells were reused as they showed no indication of damage after the tests, nor were they anticipated to.
Results for the standard ACH pads (called "Army Foam") are provided below.
Figure 5-9 - First ACH standard pad test

74
Figure 5-10 - Second ACH standard pad test
Qualitatively, these two results show similarities. The shapes of the waveforms are similar for gauges 1,,
2, and 5. Gauge 4 shows some greater variations in the second test compared to the first test. Peak
pressure levels were greater during the second test. The peak pressure during the first test was just
under 200 kPa, while that for the second test was nearly 350 kPa. It is interesting to note that the peak
pressure for the fourth gauge is reached before the peak pressure for the second gauge, though it can
be seen in both tests a pressure rise initiates sooner at the second gauge compared to the fourth gauge.
The only "underpressure" seen is in the fourth gauge. Next, the results for glass beads are presented.
Figure 5-11 - First glass beads test

75
Figure 5-12 - Second glass beads test
Here, as with the ACH pad result, there are qualitative consistencies. The general shapes of the
waveforms are similar for both tests. However, magnitudes between gauges and between tests do not
match well. In the first test, the first gauge exhibits the peak pressure of about 380 kPa, gauges 2 and 5
exhibit similar peak pressures at about 275 kPa, and gauge 4 has a peak around 250 kPa. Gauges 2 and 4
reach their peaks at approximately the same time. In contrast, the highest peak pressure for test two is
recorded by gauge number 4, initially about 450 kPa but also showing a later peak about 500 kPa. Also,
the peak reached at gauge 2 is about 300 kPa, while that for gauge 1 is only around 250 kPa. The
relative timing and oscillations after the initial peak are similar for all gauges between the two tests. The
results for aerogel will be presented and discussed next.
Figure 5-13 - First aerogel test

76
Figure 5-14 - Second aerogel test
Results between tests for aerogel are more consistent then the previously two considered cases.
The peak pressure in both cases is obtained with gauge 4, and both are around 330 kPa. The second
highest peak pressure was obtained at gauge 2 at the same time as gauge 4, in both cases just under 300
kPa. Gauges 1 and 5 recorded peak pressures around 200 kPa. Qualitatively the two tests show very
similar results, particularly during the first millisecond of the blast event, leading to increased
confidence in these results. Now, the results using fluid filler materials will be presented, beginning with
glycerin.
Figure 5-15 - First glycerin test

77
Figure 5-16 - Second glycerin test
As has been the case with the results presented so far, the shapes of the waveforms (except for
gauge 4) are qualitatively similar between the two tests. In both tests the highest peak pressure was
measured by gauge 2 at just under 400 kPa. Peak pressures for gauges 1 and 5 were 275 kPa and 200
kPa, respectively, for test 1, and 200 kPa and 150 kPa, respectively, for test 2. The response for gauge 4
was drastically different between tests. For test 1, there is no identifiable peak pressure. In fact, the
first pressure change for this gauge is negative. This suggests, possibly, that the gauge became
dislodged during testing. The result for gauge 4 from the second test is more in line with the previously
discussed results. For this test and gauge, a peak pressure of just under 300 kPa is measured about the
same time as the peak for gauge 2 is reached. Finally, the results for water will be presented.
Figure 5-17 - First water test

78
Figure 5-18 - Second water test
Once again the water results do display some qualitative consistencies between the two tests. In both
tests, gauges 2 and 4 measure peak pressures at approximately the same time. In the first test, gauge 2
records just under 400 kPa while gauge 4 records over 450 kPa. In contrast, for the second test gauge 2
records a peak pressure of around 375 kPa while gauge 4 records only about 350 kPa. In both tests
gauge 1 reaches an initial peak around 200 kPa; however, during the second test subsequent oscillations
reach pressure levels of over 250 kPa. In the first test, gauge 5 records pressures under 100 kPa
throughout the test, while for test two it records a peak pressure over 150 kPa.
5.3.2 Comparison By Measurement Location
To compare the performance of the different filler materials, the pressure readings at each
gauge for the different tests are examined here. Results from the previous section suggest that it is not
valid to simply average the pressure profiles for the two tests for each liner type to use in these
comparisons. Instead, what is done here is to compare the "best" readings for each liner type and the
"worst" readings of each liner type. That is, the tests with lower pressure levels for each liner type are
compared, and the tests with higher pressure levels for each liner type are compared. Results for gauge
1 are presented first.

79
Figure 5-19 - "Worst" case results at gauge 1
Figure 5-20 - "Best" case results at gauge 1
The pressure traces at gauge 1 for both tests for each material are given in Figure 5-19 and
Figure 5-20. The time profiles were shifted for each so pressure began rising at the same time for all
cases. In these figures it can be seen that, with the exception of the standard ACH foam, the general
shape of the response curve for each filler material is the same. Positive overpressure durations for all
filler materials are around 0.65 ms, after which another slower rise to peak in pressure is observed. The
highest peak pressure observed was with a glass beads-filled liner at around 380 kPa. Comparing the
worst cases for all liners, glass beads showed a consistently higher pressure throughout the blast event.

80
Water, aerogel, and glycerin all had very similar response curves. The peak pressure using the standard
ACH pads was around 200 kPa, very similar to that using aerogel, glycerin, and water. The difference
with the ACH pads was that a near-peak pressure was maintained for a longer period of time, then fell
off sharply for a positive duration of only around 0.25 ms. The second "peak" pressure seen in the worst
case figure probably corresponds to a reflection between the helmet support and the helmet and/or
liner. The peak pressures reached during the second peak were roughly 50%-60% of the initial peak
pressure.
The peak pressure reached in the best case comparison was with the glycerin-filled liner at
around 275 kPa. The peak pressure with the glass beads filled liner was similar to glycerin. Aerogel and
water had peak pressures just under 200 kPa, approximately the same as they were in the worst case
comparison. For the filled liners, time durations were again around 0.65 ms. The peak pressure reached
using the ACH pads was around 150 kPa, and again was maintained for a longer period of time before
sharply falling for a time duration of around 0.30 ms. Again, a second pressure peak is later observed,
with glass beads reaching the second highest peak pressure of around 170 kPa. Based on both
comparisons and the peak pressures and smoothness of waveforms, it seems that for gauge 1 the ACH
pads show the best mitigating capabilities. The results at gauge 2 are next discussed.
Figure 5-21 - "Worst" case results at gauge 2

81
Figure 5-22 - "Best" case results at gauge 2
In both cases, water and glycerin reached the highest peak pressures of between 350 kPa and
400 kPa, generally higher pressures than seen at the first gauge. In the worst case, the ACH pads, glass
beads filled liner, and aerogel filled liner all reached peak pressures around 285 kPa. The difference here
is that the glass beads filled liners peaked first, followed by the aerogel liner, then finally the ACH pads.
There is then a very narrow peak with the glycerin filled liner that was also observed at gauge 1. Positive
durations were all about 0.70 ms, though looking at the fine scale variations glycerin had the shortest
duration while ACH pads had the longest duration. Second pressure peaks are again seen with
magnitudes around 50% of the initial pressure peaks.
The best case results show similarities to the worst case results. The glass beads-filled liner and
aerogel filled liner again reached peak pressures of around 285 kPa at nearly the same time. However,
the ACH pads reached a peak pressure of under 200 kPa much later than the other liners. Positive
durations were around 0.65 ms, except for one low peak for glycerin which would make the "official"
positive duration closer to 0.50 ms. Second pressure peaks are again observed with pressure
magnitudes 50% to 60% of the initial peak pressure values. The lower pressure values and longest rise
time suggest that the ACH pads provided the best mitigation at gauge 2. As mentioned before, gauge 3
became saturated during testing and results are unreliable. Therefore, gauge 4 will be discussed next.

82
Figure 5-23 - "Worst" case results at gauge 4
Figure 5-24 - "Best" case results at gauge 4
Similarities between the two divisions of tests here are more difficult to make. For the worst
case test, water showed the highest peak pressure of around 450 kPa, the highest pressure discussed so
far. Glass beads and aerogel came in second with peaks around 350 kPa, ACH pads were lower with a
peak around 325 kPa, and glycerin was lowest at just under 300 kPa. The shape of these pressure peaks
is much different than previous results as well. Pressure rise and fall was initially very fast, with positive
durations only around 0.15 ms. Glass beads then exhibit an immediate pressure jump again, rising to
about 275 kPa. The rest of the materials exhibit a negative (gage) pressure region, with the ACH pads

83
and aerogel filled liner reaching nearly -100 kPa. The only materials with a substantial second pressure
events are glycerin and glass beads. Glycerin again shows a very sharp spike, also observed at the
previously two discussed gauges. Glass beads, however, reaches a third pressure peak over 300 kPa.
The glass beads liner looks bad in the "best" case scenario as well. It reaches the highest peak
pressure of nearly 450 kPa, relaxes back to atmospheric pressure, then jumps back up over 400 kPa
almost immediately. There are two more lower level high pressure regions, followed by a third peak of
over 500 kPa, the highest measured pressure of all tests and gauges. The water and aerogel filled liners
exhibit peak pressures around 320 kPa and reach this value at about the same time glass beads first
peaks. The ACH pads reach a peak of only about 150 kPa at a later time than the other materials peak.
Glycerin shows virtually no positive pressure readings. In fact, pressure readings drop to negative values
first. This suggests the gauge may have come loose during testing. At gauge 4, glass beads-filled liners
display the worst results, while the ACH pads show the most promise. Finally, the results at gauge 5 are
discussed.
Figure 5-25 - "Worst" results at gauge 5

84
Figure 5-26 - "Best" results at gauge 5
With the exception of aerogel, in the worst case comparison at gauge 5 all tests show a
smoother rise and fall of pressure to a relatively low (<100 kPa) peak value. Aerogel shows an initial
pressure decrease during this same time frame. Higher pressure peaks are seen after this point. Glass
beads exhibits the highest pressure peak of around 250 kPa and is the first to reach its peak value.
Aerogel and glycerin later reach their peak pressure values of around 150 kPa. Then, the ACH pads
reach the peak value of about 180 kPa. Smaller second peaks are again seen, with glass beads reaching
the only significant peak value of just under 200 kPa.
Similar behaviors are observed for the best case scenarios. There is a small, smooth initial
pressure hump followed by a sharp increase in pressure. This time, glass beads, glycerin, and water all
show a jump in pressure at roughly the same time to values of 180 kPa, 150 kPa, and 120 kPa,
respectively. Aerogel has a later jump in pressure up to over 200 kPa. Glycerin and water both show
second jumps in pressure to values slightly higher than the original pressure jumps. The ACH pads liner
is the last to reach its peak pressure of about 150 kPa. Later, glass beads and glycerin show second
sharp jumps in pressure to peak values similar to those observed in the initial peak. Water shows a
slower second rise in pressure up to just over 100 kPa. Results for gauge 5 again suggests glass beads do
not provide as much mitigation as does the standard ACH liner.
5.4 Further Discussion of Experimental Results
Experimental results here are very interesting and somewhat contradictory to those performed
on the sandwich structures using the same materials. With regards to sandwich structures, there was

85
very clear benefits to using Der-Tex foam with filler materials compared to the standard ACH helmet
pads. Rise times were increased, peak transmitted pressures were reduced, and positive durations were
increased. Glass beads, water, and glycerin were found to perform the best as filler materials, and
aerogel was found to decrease the performance compared to a solid piece of foam. Quite opposite
results have been found here. In most comparisons the ACH pads provided a larger increase in rise time
and lower peak pressures compared to Der-Tex liners complete with filler materials. Glass beads-filled
liners seem to consistently be among the worst performing at all gauges, though glass beads filled
sandwich structures were among the best performers.
Another interesting aspect of these results to note is that pressure magnitudes show
inconsistencies between the two tests at each material. This is most likely a result of several factors
confounding these types of experimental results. First, the exact shape and location of the explosive
and detonation cord are difficult to replicate from test to test. Test samples are prepared manually and
are certainly not identical for every test. Furthermore, no matter how carefully the explosive is placed
initially, assembly of the two shock tube chambers certainly moves the charge. Another important
factor is the aim of the shock tube relative to the helmet set-up. To get perfectly consistent results,
angular and translational alignment between the tube and helmet must be achieved. Furthermore, the
helmet would need to be placed on the support exactly the same every time. Every effort was made to
keep these factors consistent between tests, though without the aid of sophisticated laser alignment
equipment. What is also important to observe, however, is that the shapes of the waveforms measured
were fairly consistent between tests. In other words, even if the exact magnitude of the blast loading
varied from test to test, the blast wave was still generally shaped the same way by the helmet and tube
assembly. Pressure magnitudes may also be considered by comparing with other published results.
Figure 5-27 - Numerical results from Nyein et. al. (19)

86
The results presented in Figure 5-27 were obtained for a face on blast with 10 atm (1013.250
kPa) overpressure. The "head" trace is a blast directly onto a head model, the "Helmet" trace is with the
usual ACH with standard pads, and the "Face shield" trace is for a new design they are exploring. The
plot here is for the pressure on the front of the skull, in a location analogous to gauge 2 for the
experiments performed here. Qualitatively, similar pressure increase profiles are seen for the
experimental results and for the numerical results presented above for the "Helmet" trace. Also, the
maximum pressure is just over 1.5 times the incoming overpressure compared to the experimental
results here where the maximum pressure is most likely around 1.5 times the incoming overpressure.
This fact can only be taken as an observation and not a hard confirmation of the validity of these results,
though it is encouraging. A simplified geometry with different material properties was used here
compared to cited simulation results. Nonetheless, it is worth mentioning.
Now, it is important to explore possible reasons these tests suggest the filled liner does not
provide more blast mitigation capabilities than does the standard ACH pads. What are the main
differences between what was done here and in-theater situations where blast mitigation really
matters? First, there were large gaps between the liner and the support structure designed for these
tests. A well-fitting ACH should maintain contact between the head and pads as much as possible. This
eliminates free pathways for air to travel through, forcing compressive shock waves to travel through
the pads/liner where dissipation and additional reflections may occur from impedance mismatches. The
second pressure peaks seen in many of the tests are indicative of reflections between the PMMA
support and the liner/helmet, something that should be avoided by a well-designed helmet liner. A
second difference between this liner and the ACH pads is that the current prototype is of solid
construction whereas the liner of the current ACH is of modular design. That should mean that free air
pathways are eliminated by the new liner; however, as just discussed, the gap between the liner and
PMMA prevents evaluation of this effect. Another difference is that in reality, the helmet covers a
brain-filled skull while in these experiments, the helmet covered an air-filled PMMA tube. The dynamics
of these two underlying structures are obviously different and will produce different results.
Data collection for this type of test is also an issue. The gauges used here are perfectly capable
of handling the pressure levels observed. However, as mentioned before, they are pointed radially
outward towards the helmet from inside the PMMA hemisphere. Pressure waves are transmitted
through the PMMA tube and encounter the entire body of the sensor at various angles. It is unknown
how these effects affect the measurements provided by the sensor.

87

88
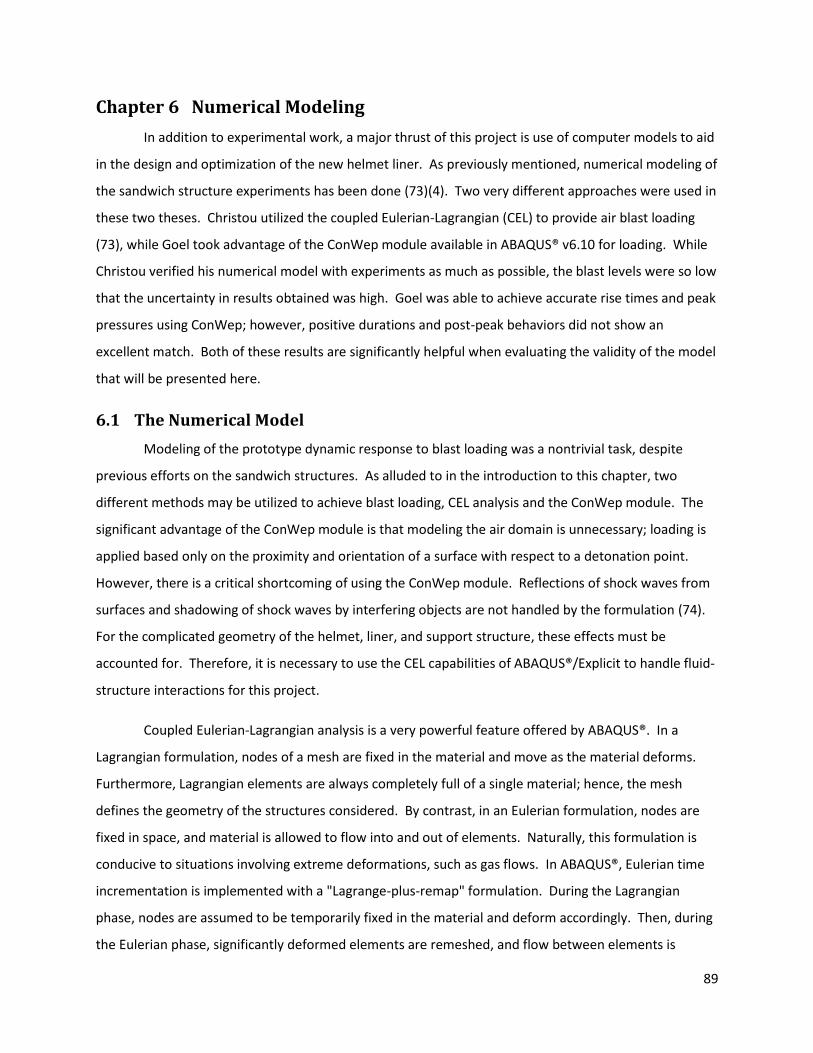
89
Chapter 6 Numerical Modeling
In addition to experimental work, a major thrust of this project is use of computer models to aid
in the design and optimization of the new helmet liner. As previously mentioned, numerical modeling of
the sandwich structure experiments has been done (73)(4). Two very different approaches were used in
these two theses. Christou utilized the coupled Eulerian-Lagrangian (CEL) to provide air blast loading
(73), while Goel took advantage of the ConWep module available in ABAQUS® v6.10 for loading. While
Christou verified his numerical model with experiments as much as possible, the blast levels were so low
that the uncertainty in results obtained was high. Goel was able to achieve accurate rise times and peak
pressures using ConWep; however, positive durations and post-peak behaviors did not show an
excellent match. Both of these results are significantly helpful when evaluating the validity of the model
that will be presented here.
6.1 The Numerical Model
Modeling of the prototype dynamic response to blast loading was a nontrivial task, despite
previous efforts on the sandwich structures. As alluded to in the introduction to this chapter, two
different methods may be utilized to achieve blast loading, CEL analysis and the ConWep module. The
significant advantage of the ConWep module is that modeling the air domain is unnecessary; loading is
applied based only on the proximity and orientation of a surface with respect to a detonation point.
However, there is a critical shortcoming of using the ConWep module. Reflections of shock waves from
surfaces and shadowing of shock waves by interfering objects are not handled by the formulation (74).
For the complicated geometry of the helmet, liner, and support structure, these effects must be
accounted for. Therefore, it is necessary to use the CEL capabilities of ABAQUS®/Explicit to handle fluid-
structure interactions for this project.
Coupled Eulerian-Lagrangian analysis is a very powerful feature offered by ABAQUS®. In a
Lagrangian formulation, nodes of a mesh are fixed in the material and move as the material deforms.
Furthermore, Lagrangian elements are always completely full of a single material; hence, the mesh
defines the geometry of the structures considered. By contrast, in an Eulerian formulation, nodes are
fixed in space, and material is allowed to flow into and out of elements. Naturally, this formulation is
conducive to situations involving extreme deformations, such as gas flows. In ABAQUS®, Eulerian time
incrementation is implemented with a "Lagrange-plus-remap" formulation. During the Lagrangian
phase, nodes are assumed to be temporarily fixed in the material and deform accordingly. Then, during
the Eulerian phase, significantly deformed elements are remeshed, and flow between elements is

90
calculated. CEL analysis allows for models to use both formulations, enabling simulations of multi-
physics phenomena such as fluid-structure interaction (74).
In ABAQUS®, the Eulerian implementation is based on the volume-of-fluid method. That is, each
element is assigned an Eulerian volume fraction indicating what fraction of the total element volume is
occupied by a given Eulerian material. Whatever fraction of an element is not occupied by an Eulerian
material is assigned void material, having neither mass nor strength. The actual shape of the structure
composed of the Eulerian materials is constructed at each time step by creating planar facets governed
by material volume fractions in neighboring elements. This method can lead to discontinuities in the
constructed structure, and a fine resolution grid is usually necessary when using the Eulerian analysis
(74).
What is truly important to this project are the fluid-structure interactions going on between the
air, helmet liner, and support structure/head surrogate. Eulerian-Lagrangian contact in ABAQUS® is
based on an enhanced immersed boundary method. Lagrangian parts overlap with an Eulerian mesh
and occupy void regions. The general contact algorithm in ABAQUS®/Explicit then tracks the interfaces
between Lagrangian structures and Eulerian materials. This formulation allows a simple, nonconforming
Eulerian mesh to be constructed surrounding the domain of interest to capture the physics. This
formulation requires that void material be initially included wherever a Lagrangian part overlaps. A
Lagrangian part and Eulerian material may never occupy the same physical space (74).
Most of the preprocessing for this project was performed with ABAQUS®/CAE, including
creation of all the geometry, boundary conditions, and material and section definitions. Initial
conditions were largely written into the input file with a script, as will be discussed later. Because the
blast events of interest were centered on the "face" of the helmet, symmetry was exploited so only half
of the domain needed to be modeled and meshed. One of the first modeling decisions was how to
handle the interface between the helmet shell and liner. In the standard ACH, the liner pads are
attached to the shell with hook-and-loop pads. For the prototype liners tested, the liners were simply
placed into the shell without any means of attachment. One could model the liner and shell separately
and use contact conditions and tie constraints to join the two. For the time scales of interest, it was not
anticipated that relative accelerations between the helmet and liner would matter. Therefore, for
simplicity, the liner and shell were modeled as a single part, using separate section definitions to assign
different material properties. The geometry for the standard ACH helmet is shown below along with its
mesh.

91
Figure 6-1 - Standard ACH geometry
Figure 6-2 - Standard ACH mesh - 66189 C3D4 elements (four node linear tetrahedral)
Modeling of the helmet with the prototype liner required extra considerations. The main
decision to make in that case was how to handle the filler materials. Water, glycerin, and glass beads all
had the potential to flow and undergo large deformations, suggesting an Eulerian treatment should be
used. Additionally, modeling these materials using an Eulerian formulation would introduce more
realistic contact conditions between the filler and the foam. Similar contact properties may be obtained
if the filler materials were modeled as Lagrangian parts separate from the helmet and liner, though
overall filler behavior in the channels would not be realistic. Finally, the option to include filler materials

92
as a single part with the helmet and liner was also available, and this was the route chosen for these
models. Attempts were made to model the filler materials with the Eulerian formulation. However, this
led to an unidentifiable source of instability within the model and the Eulerian approach needed to be
abandoned. The mesh of these liners inside the current ACH shell is shown below.
Figure 6-3 - Mesh of helmet with prototype liner - 57260 C3D4 elements
Assumptions were made when modeling the support structure as well (often referred to as
"tube" in this report). This structure can be seen in Figure 5-7. Nominally this is a 6" OD PMMA cylinder
with 1/8" thick walls topped with a PMMA hemisphere of compatible geometry. This structure is held in
place by inserting it inside a steel pipe as seen in the figure. To reduce the model size and complexity,
the steel tube was not included in the model. Rather, its effect was approximated by modeling the tube
extending 10 cm from the base of the hemisphere and fixing the bottom surface of the tube.
Furthermore, it can be seen in the figure that pressure gauges were secured in the hemisphere as well,
requiring five drilled holes for the sensors and one larger hole for the wires to pass through drilled into
the cylinder. Modeling of all the internal sensors and wires would have dramatically increased the
complexity of the model. Furthermore, properties of the sensors, wires, etc would need to be
approximated in a way that would likely be inaccurate. It was determined that the model would be
most effective by simply modeling the tube with no holes or internal structures. The tube mesh is
shown below along with yellow datum points corresponding to the pressure gauge locations. Elements

93
are sized to be as nearly cube-shaped as possible while including two elements through the thickness of
the tube. These elements are small enough to limit the simulation time step, and having smaller
elements would be undesirable. Shell elements could also be used; however, when used with the CEL
formulation problems may arise regarding pressure on each side of the element.
Figure 6-4 - Tube mesh - 21274 C3D8 (eight node linear brick elements)
The final part of the model is the air domain surrounding the helmet. As mentioned during the
description of CEL analysis, often times the most effective Eulerian domain is a simple, regular grid of
elements surrounding the domain of interest. It was decided to simply model the air domain as a
rectangular prism surrounding the helmet. Symmetry is again exploited, and the symmetry plane of the
air domain corresponds to the symmetry plane of the helmet and tube. The air domain extends
approximately 2.3 cm beyond the back of the helmet, approximately 4.8 cm above the top of the
helmet, approximately 3.0 cm outside the farther side of the helmet, and approximately 14.8 cm in front
of the front of the helmet. The total overall dimensions of the air domain are 42.0 cm x 15.0 cm x 25.0
cm. Elements in the mesh of the air domain are 3.0 mm x 3.0 mm x 3.0 mm EC3D8R eight node linear
Eulerian bricks with reduced integration and hourglass control. The default hourglass control is used.
There are 581000 elements in the air domain mesh. The air domain surrounding the helmet as viewed
from the symmetry plane is shown below.

94
Figure 6-5 - Air domain surrounding the helmet and tube
Figure 6-6 - Comparison of meshes of the air domain, helmet, and tube
From Figure 6-6, it is clear that the Eulerian mesh is rather coarse, especially with regards to the
tube. Some elements extend to both sides of the tube. However, element size reduction quickly leads
to a large number of elements. Nearly 700000 elements are used in the analysis as is, which already

95
pushes the limits of the capabilities of the machine these simulations are run on. This needs to be
considered when interpreting results.
6.2 Model Initialization
Before a blast event could be simulated, proper interfacing between the tube and the helmet
needed to be established. Rather than create conforming geometries, it was decided to use the realistic
geometries and perform an initial simulation initiating contact between the two parts.
6.2.1 Boundary Conditions
The initialization step begins with the helmet above the tube so the distance from the top of the
tube to the bottom of the top center portion of the liner are 18.0 mm apart, as shown below.
Figure 6-7 - Placement of parts prior to the initialization step
Symmetry boundary conditions were imposed on the tube and helmet. That is, displacement normal to
the symmetry plane is prescribed a permanent value of zero throughout the simulation Figure 6-8. To
prevent rigid body motion, nodes on the outside of the helmet shell were fixed completely at locations
corresponding approximately to where the straps anchor to the actual ACH Figure 6-9.

96
Figure 6-8 - Orange and red regions correspond to locations of symmetry boundary conditions
Figure 6-9 - Anchor points for the helmet denoted in orange and blue
To initiate contact between the parts, it is necessary to move one of the parts. As already
indicated, the helmet was fixed. Therefore, the tube needed to be displaced to initiate contact.
Corresponding to experimental observations, for the prototype liners the tube was displaced 18 mm
towards the helmet, while for the ACH pads the tube was displaced 20 mm towards the helmet. To
implement actual displacement, the bottom surface of the tube was prescribed the vertical
displacement over the course of the simulation step. To prevent rigid body motion, this surface was also
prescribed zero displacement in the direction parallel to the symmetry plane and perpendicular to the
displacement direction. The surface prescribed these conditions is highlighted below. The general
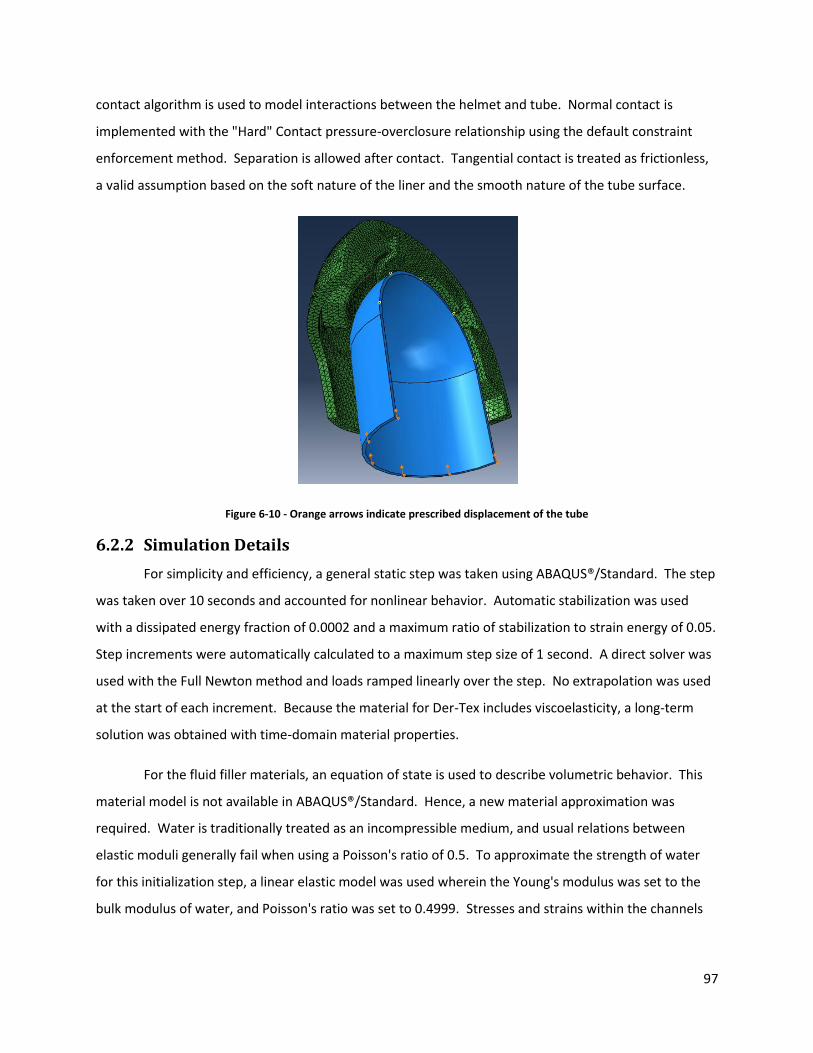
97
contact algorithm is used to model interactions between the helmet and tube. Normal contact is
implemented with the "Hard" Contact pressure-overclosure relationship using the default constraint
enforcement method. Separation is allowed after contact. Tangential contact is treated as frictionless,
a valid assumption based on the soft nature of the liner and the smooth nature of the tube surface.
Figure 6-10 - Orange arrows indicate prescribed displacement of the tube
6.2.2 Simulation Details
For simplicity and efficiency, a general static step was taken using ABAQUS®/Standard. The step
was taken over 10 seconds and accounted for nonlinear behavior. Automatic stabilization was used
with a dissipated energy fraction of 0.0002 and a maximum ratio of stabilization to strain energy of 0.05.
Step increments were automatically calculated to a maximum step size of 1 second. A direct solver was
used with the Full Newton method and loads ramped linearly over the step. No extrapolation was used
at the start of each increment. Because the material for Der-Tex includes viscoelasticity, a long-term
solution was obtained with time-domain material properties.
For the fluid filler materials, an equation of state is used to describe volumetric behavior. This
material model is not available in ABAQUS®/Standard. Hence, a new material approximation was
required. Water is traditionally treated as an incompressible medium, and usual relations between
elastic moduli generally fail when using a Poisson's ratio of 0.5. To approximate the strength of water
for this initialization step, a linear elastic model was used wherein the Young's modulus was set to the
bulk modulus of water, and Poisson's ratio was set to 0.4999. Stresses and strains within the channels

98
following this initialization step were low, and assumed to be adequate for describing the initialization
for all filler materials.
The main output from these simulations is the deformed coordinates of the helmet, liner, and
tube. These deformed parts are then used as the main parts for the blast simulation.
6.3 Air Blast Simulation
The deformed parts from the initialization analysis step are imported to compose the air blast
model. Only the coordinates of the nodes are imported. The stresses developed during the initialization
step are not imported, for the main purpose of the initialization step is simply to establish contact
between the helmet and tube. A main difference between the initialization and blast steps is inclusion
of the air domain in the blast step. Further details of the simulation are discussed next.
6.3.1 Boundary Conditions
The tube and helmet symmetry boundary conditions are the same in both steps. The region of
the tube that was displaced in the initialization step instead is fixed in the two directions parallel to the
symmetry plane corresponding to the steel tube holding the PMMA tube. The boundary condition fixing
the helmet shell is released during this step and is not necessary during this dynamic analysis. This is
physically realistic, for during experiments the helmet was simply placed on top of the tube.
The air domain is introduced during this step. Consequently, boundary conditions need to be
imposed. On the symmetry plane, zero velocity normal to the symmetry plane is imposed. On all other
surfaces of the Eulerian mesh, free inflow and free outflow conditions are imposed. These boundary
conditions are illustrated below. General contact conditions are used for these simulations as well.
Figure 6-11 - Boundary conditions on the Eulerian mesh

99
6.3.2 Initial Conditions
There are a couple of different ways to impose air blast loading on the helmet. Like this work,
Christou used CEL analysis for his blast simulations. He introduced a planar blast wave to the domain by
imposing a time-varying pressure distribution on one of the Eulerian surfaces (73). While this approach
allowed the velocity and temperature fields to evolve along with the pressure wave propagation, there
were two drawbacks. First, simulation effort was increased substantially by waiting for the propagating
blast wave to encounter the test sample. Second, the method was restricted to a planar wave. The test
samples considered here are substantially larger than the samples Christou was simulating; hence, the
planar wave assumption is less valid. To avoid these drawbacks, the general approach described by
Kambouchev et. al. (32) is implemented here.
Kambouchev et. al. (32) used a closed-form solution to a strong air blast to initiate the velocity
and pressure field in their work. The blasts considered in this work are not strong enough to use the
same formulation. However, the Bach and Lee (34) provided a solution more valid for the levels
experienced here. This solution was presented in detail in Section 2.2. It remained to estimate the
parameters to input to the model to determine the pressure and velocity field throughout the air
domain. Goel found the ConWep module provided an adequate loading condition for simulations (4). A
simulation of the ConWep module loading several single elements out to a distance of 12" was used as
the starting point. The loading was applied to the back surface of the elements to assess the
transmitted pressure rather than the reflected pressure. The elements were fixed completely. Pressure
was assessed by summing the reaction forces and dividing by the area of the element, consistent with
the practices in the ABAQUS® verification manual (74). The peak pressure obtained at 12" from a blast
of 2.87 kg TNT was 164500 kPa. This was used to estimate a shock velocity according to Equation 2-10.
Equation 2-30 and Equation 2-32 were then solved using an fourth-order Runge-Kutta (traditional RK4)
integration scheme. Finally, Equation 2-24 and Equation 2-26 are solved to give the velocity and
pressure fields. A comparison of the pressure field predicted by the model of Bach and Lee and that
given by the ConWep module is provided in Figure 6-12. The plot shows that the analytical expression
provided by Bach and Lee adequately describes the behavior provided by the ConWep module.
The solution obtained with the Bach and Lee model is valid for spherical blast symmetry. The
assumption applied in these simulations is that a spherical blast is initiated in open air at the center of
the mouth of the shock tube. To that end, it is a straightforward procedure to initialize the state of the
air domain based on a point of detonation.

100
Figure 6-12 - Comparing ConWep and the Bach and Lee model
The general initialization of the blast model is described here. First, the helmet and tube are
imported from the first simulation step. These parts and the air domain are assembled, and boundary
conditions are imposed. Next, the Volume Fraction Tool in ABAQUS®/CAE is used twice in a non-
intuitive way. First the volume fraction of helmet and liner in each Eulerian element is calculated.
Second, the volume fraction of the tube in each Eulerian element is calculated. The input file is then
manipulated directly to complete the field state initialization. First, the node numbers and locations of
the Eulerian domain are pulled from the input file. Next the elements and corresponding node numbers
are pulled from the input file. A script is then used with the Bach and Lee model to calculate the field
velocities, pressures, and densities of each node in the Eulerian domain. The ideal gas model is used
with the calculated pressures and densities to obtain the nodal temperatures. Initial air pressures can
only be described for elements, not nodes. Therefore, each element is initialized with a pressure equal
to the average of the pressures of its eight associated nodes. Volume fractions of each Eulerian element
are initially set full of air. The volume fractions obtained with the Volume Fraction Tool are then
subtracted from the appropriate elements to create void space for the Lagrangian parts within the
Eulerian domain. A contour plot of the initialized pressure field is shown in Figure 6-13.

101
Figure 6-13 - Contour plot of the initialized pressure field
6.3.3 Simulation Details
Non-linear dynamic finite element simulations are run in ABAQUS®/Explicit v6.10. Simulations
are run for a total time of 1 ms. Automatic time incrementation is used. Generally time steps were on
the order of tens of microseconds. Consistent with the findings of Christou, linear and bulk viscosities
were set to 0.2 and 1.2, respectively (73). To achieve the best understanding of the capabilities of the
model, five simulations were run, corresponding to the helmet with standard ACH pads and the helmet
with the prototype liner filled with water, glycerin, glass beads, and aerogel.
The data available for experimental validation are pressure values recorded by the pressure
transducers embedded in the PMMA hemisphere. Several ways to take similar values from the
simulations were considered. First, the air pressure of the Eulerian element immediately adjacent to the
measurement location on the tube was investigated. Typical pressure values at this location seemed to
be consistently low. This is not surprising considering the coarse nature of the mesh and the "sharp"
shape of the blast wave front. Eulerian elements are restricted to reduced integration, and all quantities
are evaluated at a single integration point at the center of the element. Second, it was considered to
examine the pressure inside the elements of the tube near the measurement site. These measurements
were also low and highly oscillatory, generally being affected by stress wave propagation through the

102
tube itself. Third, the contact pressure at the nodes of the tube corresponding to the experimental
measurement locations were considered. This represents the stress developed in preventing
penetration of air into the tube geometry. Generally pressure levels obtained numerically seemed
consistent with those measured experimentally. The main drawback of using this measure is that
underpressures are not recorded; however, overpressures are of greater interest for this model
validation.
6.3.4 Results By Filler Material
First, the results for the model of the standard ACH helmet are presented. The pressure profile
at each measurement location is provided below.
Figure 6-14 - Simulation results for the standard ACH helmet
As with all simulation results provided here, results have been run through the general SAE filer
provided by ABAQUS® with a cutoff frequency of 100 kHz. Many of the features seen in Figure 6-14 are
similar to the experimental results shown in Figure 5-9 and Figure 5-10, while there are some anomalous
features as well. Initial peak pressures observed at gauges 1, 2, and 5 are in the 200 - 250 kPa range,
consistent particularly with the second set of experimental results. Furthermore, temporal spacing
between the peaks at these gauges is consistent with both sets of experimental results. This excludes
the sharp initial peak seen at gauge 2, which was not at all seen experimentally. There is another high
magnitude (>400 kPa) pressure peak observed at the second gauge location. While a second peak was
observed experimentally, it did not occur until nearly a full millesecond after the initial peak. Not
observed in the numerical model is the initial high pressure peak at the fourth gauge location that was

103
measured experimentally in both cases. However, the lower magnitude (<100 kPa) pressure variations
seen numerically are consistent with experimental results. The other noticeable discrepancy between
experimental and numerical results is the width of the pressure peaks. Experimentally, the high
pressure regions lasted for a longer period of time, whereas the pressure peaks were more "sharp"
numerically. Next, the results for the prototype liner filled with glass beads are discussed.
Figure 6-15 - Simulation results for a glass beads-filled prototype
The comparison between experimental and numerical results for a glass beads-filled liner is
similar to that for the standard ACH helmet. The initial peak for gauges 1, 2, and 5 are around 250 kPa,
300 kPa, and 165 kPa, respectively, consistent especially with the second set of experimental results.
Furthermore, temporal spacing of these peaks is consistent with experimental results as well. There are
second, higher pressure peaks shortly after the initial pressure peaks at gauges 1 and 2. A similar
behavior is seen for the second gauge, but not for the first gauge experimentally. Once again, there are
high pressure peaks observed experimentally early in the blast event that are not observed numerically
at gauge location 4. There are sharp pressure peaks observed numerically consistent in magnitude
(~200 kPa) with pressures observed experimentally. As with the standard ACH pads, the pressure peak
temporal widths numerically were much smaller than the widths seen experimentally. The results for an
aerogel-filled prototype liner are discussed next.
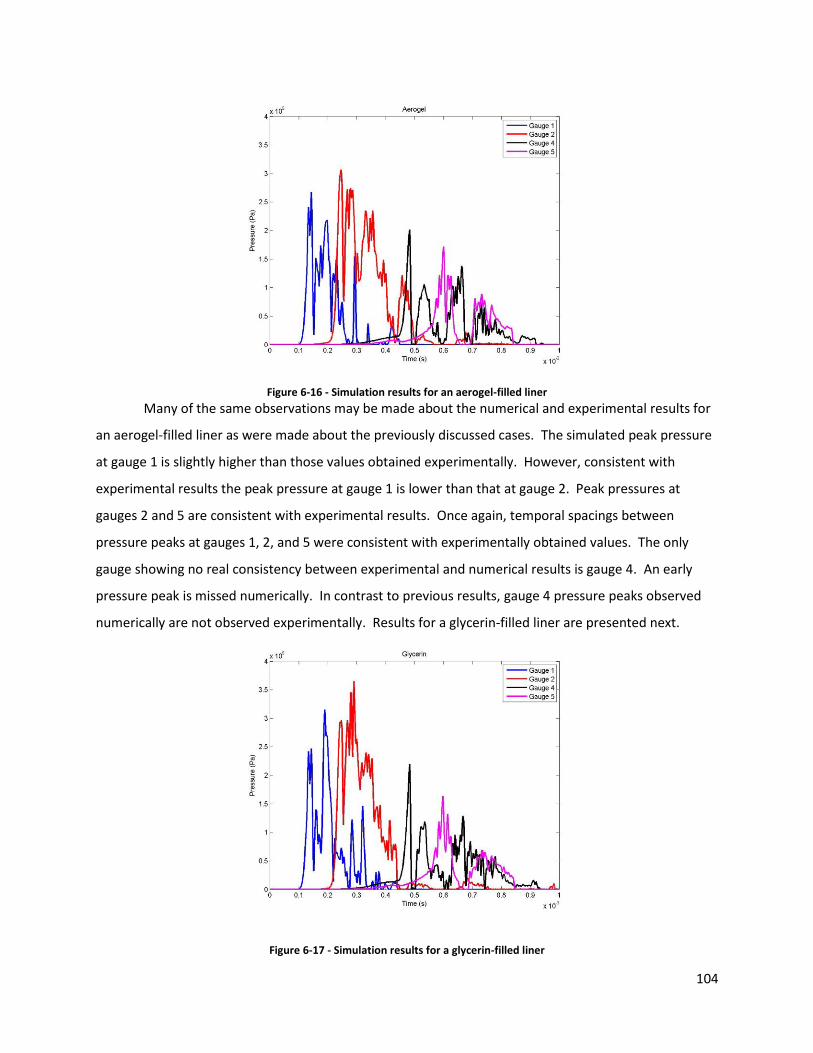
104
Figure 6-16 - Simulation results for an aerogel-filled liner
Many of the same observations may be made about the numerical and experimental results for
an aerogel-filled liner as were made about the previously discussed cases. The simulated peak pressure
at gauge 1 is slightly higher than those values obtained experimentally. However, consistent with
experimental results the peak pressure at gauge 1 is lower than that at gauge 2. Peak pressures at
gauges 2 and 5 are consistent with experimental results. Once again, temporal spacings between
pressure peaks at gauges 1, 2, and 5 were consistent with experimentally obtained values. The only
gauge showing no real consistency between experimental and numerical results is gauge 4. An early
pressure peak is missed numerically. In contrast to previous results, gauge 4 pressure peaks observed
numerically are not observed experimentally. Results for a glycerin-filled liner are presented next.
Figure 6-17 - Simulation results for a glycerin-filled liner

105
Similar consistencies between experimental and numerical results are observed for a glycerin-
filled liner as were found previously. Peak pressure values obtained at gauges 2 (360 kPa) and 5 (185
kPa) and the initial peak pressure obtained at gauge 1 (250 kPa) matched particularly well with the first
set of experimental data. Spacing of these particular peaks was also consistent with experimental
results. A second pressure peak is seen numerically shortly after the initial pressure peak that was not
observed experimentally. Similar inconsistencies are found for gauge location 4, an early pressure peak
is missed and subsequently observed numerical and experimental pressure peaks do not match well in
either time nor magnitude. Finally, the results for a water-filled liner are discussed.
Figure 6-18 - Simulation results for a water-filled liner
The simulation results for water do not match quite as well with experimental results compared
to the previously discussed cases, though the results are still sufficiently consistent. The numerical
model seems to overestimate the peak pressure at gauge locations 1 and 5 while underestimating the
pressure at gauge location 2. Spacing between the peaks, however, is consistent with experimental
results. Once again, little consistency is observed between numerical and experimental results at gauge
location 4.
6.3.5 Results By Measurement Location
To try to glean some insight into the relative performance of the different helmet liners with
respect to this test stand, a comparison of pressure profiles by gauge location is performed below.

106
Figure 6-19 - Comparison of numerical results at gauge 1
At gauge 1 it is immediately clear that the altered geometry of the helmet liner affects when the
pressure arrives at the first gauge, for every pressure profile starts rising at the same time except for the
standard ACH. The early time pressure responses for all filled liners are very similar, differing only
slightly in magnitude but all in the neighborhood of 250 kPa. Deviations in behavior occur after this
point. Glycerin and glass beads experience a second high magnitude pressure peak, with glycerin
reaching a top value of over 300 kPa. The lowest peak pressure of all liners was observed with the
standard ACH pads, never reaching a value higher than 250 kPa. Furthermore, the rise time to peak
pressure was the longest for the ACH pads, There were no appreciable differences in positive
overpressure time durations. A comparison at gauge 2 is considered next.
Figure 6-20 - Comparison of numerical results at gauge 2

107
It was noted in the previous section that the first peak seen here for the ACH pads was not
observed experimentally. However, in light of the fact that at the first gauge, pressure started rising for
the ACH pads before all the other liners, it would seem that this peak is very relevant. It is interesting to
see that after this peak, there is virtually no contact pressure until later, when a second peak of nearly
equal magnitude is observed. Regarding the other filler materials, once again profiles are very similar
until after the peak pressure is reached. Glycerin reaches the highest peak pressure at over 350 kPa,
with glass beads again reaching the second highest peak pressure of nearly the same value. The rise
time is longer for the filled liners than it is for the standard ACH pads. Once again, the lowest peak
pressure is observed using the ACH pads at just under 250 kPa. Results at gauge 4 are discussed next.
Figure 6-21 - Comparison of numerical results at gauge 4
While the numerical results did not show the same initial peak results as seen experimentally,
there were later pressure peaks calculated. All filled liners experienced a peak pressure of 225 kPa,
while pressure with the ACH pads never rose much about 50 kPa. The filled liners all displayed
subsequent pressure increases, the highest of which occurred for glass beads (200 kPa). As has been the
case so far, the pressure levels with the ACH pads have been lowest. Finally, the results at gauge 5 are
examined next.

108
Figure 6-22 - Comparison of numerical results at gauge 5
Pressure profiles for all filled liners are very similar throughout the duration of the simulation,
reaching a peak pressure of 170 kPa. The pressure peak for the ACH pads occurs later than the peak of
the filled liner and is, in fact, higher in magnitude at over 200 kPa.
6.3.6 Further Discussion of Simulation Results
Caution must be exercised when drawing conclusions based on the work presented here. In
general, comparisons of pressure profiles at the various measurement locations seem to indicate clearly
that the ACH pads outperform the prototype liners in terms of peak pressures. Also, with respect to the
first gauge, it seems the rise time to peak pressure is better with the ACH standard pads rather than the
prototype liner explored here. However, the pressures measured in these experiments are not affected
by the liner composition as much as geometry. This is not a result of a flaw in the single liner design as
opposed to a modular design, rather it is a direct result of the liner not conforming to the geometry of
the support structure. One example of evidence supporting this claim is that, despite having
significantly different material models for filler materials, the prototype liners all showed very similar
pressure profiles at all measurement locations initially. Furthermore, this claim is supported by a
contour plot of the pressure wave interacting with the helmet and tube. In Figure 6-23, the pressure
wave is clearly seen having traveled under the rim of the helmet and moving through the space between
the liner and tube. Pressures recorded at the gauges are a result of this pressure wave traveling through
air rather than a compression wave traveling through the helmet and liner.

109
Figure 6-23 - Contour plot of the pressure wave interacting with the helmet and tube
It is also interesting to note the inconsistencies seen in gauge 4 for all simulations. The initial
pressure peaks seen experimentally follow a very smooth profile, unusually smooth in fact.
Furthermore, these peaks occur at the same time peaks occur at gauges much closer to the detonation
point. This suggests a possible malfunction in this particular pressure gauge. This is further supported
by the consistencies between experimental and numerical results found with the remaining gauges
(excluding gauge 3, which became saturated).
The model worked remarkably well considering the relatively coarse mesh used to model the air
domain. There were Eulerian elements that, in fact, had nodes both inside and outside the tube walls,
though this seemed to cause no great difficulty. To obtain meaningful results it was necessary to take
contact pressure readings from nodes not contained with an Eulerian element enclosing the full
thickness of the tube. Originally it was attempted to avoid this issue all together by partitioning the air
domain to coincide with the midplane of the walls of the tube. While this solved the issue of having
elements fully encompassing the thickness of the tube wall, it led to swept meshes included elongated
and deformed elements located in crucial areas of fluid-structure interaction. This "conforming" mesh is
shown below, as well as the poorly shaped elements resulting from that particular mesh.

110
Figure 6-24 - Illustration of conforming Eulerian mesh
Figure 6-25 - Illustration of poorly shaped elements resulting from the conforming mesh
Pressure peak widths did not appear consistent with experimental results. However, this is
likely a product of the initialization of the blast field using the relation of Bach and Lee. Those relations
assume a spherical blast symmetry in free air. However, an explosive drive shock tube was used for
experiments, which likely altered the shape of the blast wave. While the peak pressure and propagation
velocity of the blast wave seem to have been captured well, the shape of the wave applied
experimentally probably deviates somewhat from that applied numerically. Overall, comparisons with
experimental results support the validity of the model that has been developed here.

111

112

113
Chapter 7 Conclusions and Future Work
Insight obtained from the experimental and numerical work presented in previous chapters is
summarized here.
7.1 Conclusions
The overall goal of this ongoing blast helmet project begun three years ago is to determine if a
liner including channels filled with various materials can provide a greater degree of protection from
blast waves than can the current ACH liner. It is unknown exactly what mechanisms cause blast-induced
TBIs; hence, the protection capabilities of a helmet must be estimated based on various measures of
mechanical performance. In previous work, such measures have included rise time to peak pressure,
peak overpressure, positive overpressure time duration, negative time duration, blast underpressure
magnitude, and blast impulse. The most accurate and accessible measures of comparison between the
different liners for the work presented here are the rise times and peak pressures. On the basis of rise
times and peak pressures observed during the numerical and experimental tests presented here, the
current standard ACH configuration performed better than the prototype liners containing various filler
materials. Rise times for all of the filled prototype liners are roughly the same. However, glass beads
and glycerin-filled liners displayed the highest peak pressures during the early time of the blast event.
An overly simple interpretation of these results suggests the prototype liners fail to achieve the main
objective.
However, as cautioned in Section 6.3.6, it is probably premature to make judgments about the
performance of the newly designed prototype helmet liner based solely on the results presented here.
In reality, a soldier's helmet should fit much better than the helmet samples fit the test support
structure, with each support pad mostly or fully contacting the head directly. The gaps between the
helmet liners and the support structure in the work presented here were shown to provide a direct path
for shock wave propagation through air, bypassing the liner for the most part. Differences in dynamic
responses were observed for different liners; however, this is mostly due to compressing of the liner by
the shock wave traveling through the air gaps rather than compression waves being transmitted through
the helmet shell and liner to the tube. Furthermore, the blast event considered here corresponds to a
soldier looking directly at the source of the blast. The helmet must protect against blasts from all
directions, and in other orientations stress waves in the brain are more likely to be due to the
transmission of a compression wave through the helmet rather than the blast wave curving around the
rim of the helmet shell.
114
Another reason to hold off on conclusions about the performance characteristics of the
prototype liner compared to the standard ACH helmet is the difference between the tube support and
an actual head. The "head surrogate" used here was a tube constructed of PMMA and generally filled
with air. A human head, by contrast, is composed of skin, fat, bone, and brain matter. The dynamics of
shock propagation and reflection are different for the structure used here compared to a human head.
Not only will fluid-structure interactions differ between the blast wave in air and head or head
surrogate, but also stress wave propagation and reflection will differ at interfaces of the helmet liner
and head or head surrogate.
While the overarching goal of the blast project is to design an improved helmet liner using the
filler material idea, the main thrust of the work described in this report was to develop and validate a
model describing the dynamic response of a (modified) helmet coupled with a head surrogate to an
impinging air blast wave. To this end it seems reasonable to deem the project a great success. Several
assumptions and simplifications were required throughout the modeling process. However, the fair
agreement between experimentally and numerically obtained results serves as strong evidence of the
validity of these assumptions. Notable features of the model are listed as a point of summary.
The ACH helmet shell, helmet liner, and any fillers are all modeled as a single part, having
different section definitions to delineate regions of different material properties. This greatly
reduces the complexity of the model by eliminating otherwise required contact definitions and
nodal tie constraints. Furthermore, initialization of air in the Eulerian domain is achieved by
only running the Volume Fraction Tool (VFT) twice, saving some model setup time.
The head surrogate was modeled numerically simply as a cylinder and connected hemisphere
filled with air. Holes for wires and pressure transducers were not included, nor were the
transducers or wires. Consistency between numerical and experimental results, particularly at
gauge location 5, support this simplification.
The total modeling and solution process consists of two simulation steps. The first step, a
nonlinear static analysis in ABAQUS®/Standard, initializes contact between the helmet liner and
head surrogate. Because ABAQUS®/Standard does not support EOS material models, those
materials require some other assumed material model, such as a linear elastic model. The
second step, a nonlinear dynamic analysis in ABAQUS®/Explicit, models the blast event and the
dynamic response of the structures involved.

115
The Eulerian mesh is relatively coarse, having element edge lengths larger than the thickness of
the tube support structure. Ideally this mesh would be much finer. However, because the
model is in three-dimensions, the total number of elements increases very quickly with
decreases in element width size. Because of the relatively coarse mesh, care needed to be
taken to evaluate model outputs at nodes not belonging to elements overlapping the entire
thickness of the tube.
Blast loading is achieved by initializing the velocity, pressure, and temperature field within the
air domain using the analytical solution for open air blasts with spherical symmetry presented
by Bach and Lee (28)(34). The pressure field obtained with this method was shown to be very
similar to that given by the ConWep module. The validity of the shock magnitude and
propagation velocity is supported by the matching of peak pressures and pressure peak spacing
in numerical and experimental results. The main discrepancies seen between numerical and
experiment results are the positive time durations, being much smaller in the numerical results
than in the experimental results. It is not unexpected to see some differences, for the analytical
solution to the blast waves assumes a spherical blast in open air, while actual loading came from
an explosive drive shock tube.
Out of the three considered simulation outputs chosen to compare with the pressure
measurements obtained experimentally (contact pressure between the air and tube, pressure
within the elements of the tube, and pressure in the Eulerian element immediately above the
tube), contact pressure on the tube was found to be the closest to experimentally obtained
values. The only downfall to studying only this output is that underpressure regions are not
captured quantitatively.
7.2 Suggestions for Future Work
A general framework for simulations of air blast loading on an ACH with different helmet liners
has been designed and validated. Now, this framework may be used towards achieving the ultimate
goal of this project to design a helmet liner for improved blast protection. All indications from initial
work on sandwich structures suggest the filler material idea does provide enhanced blast protection (4).
Whether these results extend directly to an actual helmet geometry may be assessed with a modified
version of this model. The most important modification to make to the model to gain realistic insight is
to use a more realistic head surrogate. This could be something as complicated as the human head
model used in (19), or something as simple as a conforming geometry with a bony shell and water-filled

116
inner structure. The main idea of this modification would be to eliminate the gaps between the helmet
liner and tube seen in this work allowing the blast wave to contact the head surrogate without having to
propagate through the helmet and liner. Such simulations would provide a direct comparison of the
performance of the standard ACH to that including a modified liner.
In addition to testing the helmets with a more realistic head model, it is important to test the
helmet performance in other realistic blast scenarios. This means a couple of different things. First,
both the orientation and distance of the helmet with respect to the blast point should be altered to
many different values. Changing the orientation changes the central loading point on the helmet, while
changing the distances changes the radius of the shock front encountering the helmet/head surrogate.
Second, different blast magnitudes and, therefore, shapes may be tested as well by varying parameters
in the Bach and Lee model used to determine the initial conditions. Performing these different tests
may require other tweaks to the model as well. For example, moving the detonation point most likely
necessitates a change in shape of the Eulerian domain for both accuracy and computational efficiency
purposes. Also, if the detonation point is moved off of the symmetry plane, then symmetry may no
longer be exploited and the full helmet and head surrogate must be modeled. This effectively doubles
the size of the computational domain, but would be necessary to obtain an accurate result.
In such future simulations where shock transmission to the head surrogate is facilitated more by
transmission through the liner and helmet, it will probably be necessary to assess the mesh used for the
filler materials. Ideally, the fillers would be treated using an Eulerian approach. However, as mentioned
before, some unidentified source of instability arises with this particular model using Eulerian material
for the fillers. It is most likely the case the Eulerian mesh needs to be much finer to resolve this
instability. However, the simulations performed here already pushed the memory limits of the available
equipment. Also, if the filler materials are treated with an Eulerian mesh, some sort of boundary
condition or end cap must be included to separate the filler material from the air. It may also work to
increase the Lagrangian mesh density within the channels and maintain a more manageable mesh size
overall.
The most important work this model may be used for is development of an optimally
performing liner. Several different modifications to the prototype liner may be tested. A modular
design should be tested for more direct comparison with the current ACH pad configuration. Alternate
filler material properties, including properties of hypothetical materials, should be tested. Different
channel sizes and shapes should be considered as well. Ultimately the goal should be to provide an

117
acceptable level of blast protection while minimizing the weight added to the current standard ACH
helmet. If possible, the thermal properties of this liner compared to the standard ACH liner should be
considered as well, for in a desert environment high ambient temperatures necessitate some measure
of ventilation should be afforded by a combat helmet.
This model may potentially provide a substantial amount of insight regarding the performance
of a helmet with respect to blast loading. It should be a valuable asset in future design and optimization
efforts of a liner incorporating the filler material idea, which has shown so much promise in previous
work.

118

119
Appendix A - Coefficients in the Perturbation Solution of Bach and Lee
The coefficients presented below are contained in (28) and are used for initialization of the blast
field for the simulations in this project.
3327
3223
22
2
21
21
03
3
0
3
1
2
02114
11101022
2
021104013
02
2
0
2
12
3
0
3
1
2
0211031221
2
03
02
2
0
2
113
11101303012
2
0
2
1102113
2
02
0112
101202012
2
01
01111
0
yy
yECyEECC
CCBBB
yy
yECyECCCBBA
yy
CyECBA
ACEy
j
13
1112
111
1811
1112
1412124116
14141216
141
1̀128
1122
2/1
1111
144311122/1
14
1
3
12
2
11
2
4
2
13
2
1
2
12
2
111
2
13
12
1
3
12
11
jjD
jE
DjE
DjE
jC
jjDC
jjDDC
jDDC
DjB
DjB
B
jA
DjA
DA

120

121
References
1. Defense and Veterans Brain Injury Center. DVBIC. [Online] http://www.dvbic.org.
2. Traumatic Brain Injury Hospitalizations of U.S. Army Soldiers Deployed to Afghanistan and Iraq.
Wojcik, Barbara E., et al. 1S, s.l. : Elsevier Inc., 2010, American Journal of Preventive Medicine, Vol. 38,
pp. S108-S116.
3. Military TBI During the Iraq and Afghanistan Wars. Warden, Deborah. 5, s.l. : Lippincott Williams &
Wilkins, Inc., 2006, Journal of Head Trauma Rehabilitation, Vol. 21, pp. 398-402.
4. Goel, Rahul. Study of an Advanced Helmet Liner Concept to Reduce TBI: Experiments & Simulation
using Sandwich Structures. Aeronautics and Astronautics, Massachusetts Institute of Technology.
Cambridge, MA : s.n., 2011. Masters Thesis.
5. The Effects of High Explosives Upon the Central Nervous System Lecture I. Mott, Fred W. 4824,
February 12, 1916, The Lancet, Vol. 187, pp. 331-338.
6. The Effects of High Explosives Upon the Central Nervous System Lecture II. Mott, Fred W. 4826,
February 26, 1916, The Lancet, Vol. 187, pp. 441-449.
7. The Effects of High Explosives Upon the Central Nervous System Lecture III. Mott, Fred W. 4828,
March 11, 1916, The Lancet, Vol. 187, pp. 545-553.
8. Shell shock, Gordon Holmes and the Great War. Macleod, A. D. February 2004, Journal of the Royal
Society of Medicine, Vol. 97, pp. 86-89.
9. Blast-Related Traumatic Brain Injury: What Is Known? Taber, Katherine H., Warden, Deborah L. and
Hurley, Robin A. 2, s.l. : American Psychiatric Publishing, Inc., Spring 2006, Journal of Neuropsychiatry
Clinical Neuroscience, Vol. 18.
10. Bowen, I. G., Fletcher, E. R. and Richmond, D. R. Estimate of Man's Tolerance To The Direct Effects
of Air Blast. Albuquerque, NM : Lovelace Foundation for Medical Education and Research, 1968.
11. A Thoracic Mechanism of Mild Traumatic Brain Injury Due to Blast Pressure Waves. Courtney, Amy C.
and W., Courtney Michael. 1, January 2009, Medical Hypotheses, Vol. 72, pp. 76-83.

122
12. Blast (explosion)-Induced Neurotrauma: A Myth Becomes Reality. Cernak, I. 2005, Restorative
Neurology and Neuroscience, Vol. 23, pp. 139-140.
13. Biomechanics of traumatic brain injury. El Sayed, Tamer, et al. s.l. : Elsevier B. V., 2008,
Computational Methods in Applied Mechancs and Engineering, Vol. 197, pp. 4692-4701.
14. Biomechanical Assessment of Brain Dynamic Responses Due to Blast Pressure Waves. Chafi, M. S.,
Karami, G. and Ziejewski, M. 2, s.l. : Biomedical Engineering Society, February 2010, Annals of
Biomedical Engineering, Vol. 38, pp. 490-504.
15. Kleiven, S. Finite Element Modeling of the Human Head. Royal Institute of Technology. Stockholm,
Sweden : s.n., 2002. Ph.D. Thesis.
16. A Virtual Test Facility for the Simulation of Dynamic Response in Materials. Cummings, Julian, et al.
s.l. : Kluwer Academic Publishers, 2002, The Journal of Supercomputing, Vol. 23, pp. 39-50.
17. A Virtual Test Facility for the Efficient Simulation of Solid Material Response Under Strong Shock and
Detonation Wave Loading. Deiterding, Ralf, et al. s.l. : Springer-Verlag London Limited, October 18,
2006, Engineering with Computers, Vol. 22, pp. 325-247.
18. Computational biology - Modeling of primary blast effects on the central nervous system. Moore,
David F., et al. s.l. : Elsevier Inc., 2009, NeuroImage, Vol. 47, pp. T10-T20.
19. In Silico Investigation fo Intracranail Blast Mitigation with Relevance to Military Traumatic Brain
Injury. Nyein, Michelle K., et al. 48, November 30, 2010, Proceedings of the National Academy of
Sciences of the United States of America, Vol. 107, pp. 20703-20708.
20. Skull Flexure from Blast Waves: A Mechanism for Brain Injury with Implications for Helmet Design.
Moss, William C., King, Michael J. and Blackman, Eric G. s.l. : The American Physical Society, 2009,
Physical Review Letters, Vol. 103, pp. 108702-1 - 108702-4.
21. Simulation of Blast-Induced Early-Time Intracranial Wave Physics leading to Traumatic Brain Injury.
Taylor, Paul A. and Ford, Corey C. s.l. : ASME, June 2009, Journal of Biomechanical Engineering, Vol.
131, pp. 061007-1 - 061007-11.
22. Explosive Blast Neurotrauma. Ling, Geoffrey, et al. s.l. : Mary An Liebert, Inc., June 2009, Journal of
Neurotrauma, Vol. 26, pp. 815-825.

123
23. Smith, P. D. and Hetherington, J. G. Blast and Ballistic Loading of Structures. Oxford : Butterworth-
Heinemann Ltd, 1994.
24. Zukas, Jonas A. and Walters, William. Explosive Effects and Applications. s.l. : Springer-Verlag, 1998.
25. Baker, W. E. Explosions in Air. s.l. : University of Texas Press, 1973.
26. Drumheller, D. S. Introduction to Wave Propagation in Nonlinear Fluids and Solids. Cambridge :
Cambridge University Press, 1998.
27. Kambouchev, Nayden. Analysis of Blast Mitigation Strategies Exploiting Fluid-Structure Interaction.
Aeronautics and Astronautics, Massachusetts Institute of Technology. Cambridge, MA : s.n., 2007. Ph.D.
Thesis.
28. An Analytical Solution for Blast Waves. Bach, G. G. and Lee, H. S. 2, February 1970, AIAA Journal, Vol.
8, pp. 271-275.
29. Sedov, L. I. Similarity and Dimensional Methods in Mechanics. New York : Academic Press, 1959.
30. von Neumann, J. The Point Source Solution. Collected Works of J. von Neumann. Oxford : Pergamon
Press, 1963, Vol. VI, p. 176.
31. The Formation of a Blast Wave by Very Intense Explosion, I, Theoretical Discussion. Taylor, G. I. 1950.
Proceedings of the Royal Society (London), Series A. Vol. 201, pp. 159-174.
32. Numerical simulation of the fluid-structure interaction between air blast waves and free-standing
plates. Kambouchev, Nayden, Noels, Ludovic and Radovitzky, Raul. s.l. : Elsevier Ltd., 2007, Computers
and Structures, Vol. 85, pp. 923-931.
33. Sakurai, A. Blast Wave Theory. [ed.] M. Holt. Modern Developments in Fluid Dynamics. New York :
Academic Press, 1965, pp. 309-375.
34. Higher-Order Perturbation Solutions for Blast Waves. Bach, G. G. and Lee, J. H. 4, 1968, AIAA Journal,
Vol. 7, pp. 742-744.
35. Taylor, G. The Pressure and Impulse of Submarine Explosion Waves on Plates. [ed.] G. Batchelor. The
Scientific Papers of Sir Geoffrey Ingram Taylor. Aerodynamics and the Mechanics of Projectiles and
Explosions. s.l. : Cambridge University Press, 1963, Vol. III, pp. 287-303.

124
36. Nonlinear Compressibility Effects in Fluid-Structure Interaction and Their Implications on the Air-Blast
Loading of Structures. Kambouchev, N., Neols, L. and Radovitzky, R. s.l. : The American Institute of
Physics, 2006, Journal of Applied Physics, Vol. 100, pp. 063519-1 - 063519-11.
37. Fluid-Structure Interaction Effects in the Dynamic Response of Free-Standing Plates to Uniform Shock
Loading. Kambouchev, Nayden, Radovitzky, Raul and Noels, Ludovic. s.l. : ASME, September 2007,
Journal of Applied Mechanics, Vol. 74, pp. 1042-1045.
38. A Method for the Numerical Computation of Hydrodynamic Shocks. von Neumann, J. and Richtmyer,
R. 1950, Journal of Applied Physics, Vol. 21, pp. 232-237.
39. Gibson, Lorna J. and Ashby, Michael F. Cellular Solids - Structure and Properties. Second Edition.
Cambridge : Cambridge Univeristy Press, 1999.
40. Shock Wave Interaction with Cellular Materials Part I: Analytical Investigation and Governing
Equations. Mazor, G., Ben-Dor, G. and Sorek, S. s.l. : Springer-Verlag, 1994, Shock Waves, Vol. 3, pp.
159-165.
41. Gas Dynamic and Physical Behavior of Compressible Porous Foams Struck By Wak Shock Waves.
Skews, B. W., Atkins, M. D. and Seitz, M. W. [ed.] K. Takayama. New York : Springer-Verlag, 1992.
Proceedings of the 18th International Symposium on Shock Waves. pp. 511-516.
42. Gvozdeva, L. G.; Faresov, Yu. M.; Fokeev, V. P. Materials, Interaction of Air Shock Waves with
Porous Compressible. 3, s.l. : Springer-Verlag, 1985, Journal of Applied Mechanics and Technical Physics,
Vol. 26, pp. 401-405.
43. Shock Wave Interaction With Cellular Materials Part II: Open Cell Foams; Experimental and
Numerical Results. Ben-Dor, G., et al. s.l. : Springer-Verlag, 1994, Shock Waves, Vol. 3, pp. 167-179.
44. Attenuation of Enhancement - A One-Dimensional Analysis on Shock Transmission in the Solid Phase
of a Cellular Material. Li, Q. M. and Meng, H. s.l. : Elsevier Science Ltd., 2002, International Journal of
Impact Engineering, Vol. 27, pp. 1049-1065.
45. Close-Range Blast Loading of Aluminum Foam Panels. Hanssen, A. G., L., Enstock and Langseth, M.
s.l. : Elsevier Science Ltd;, 2002, International Journal of Impact Engineering, Vol. 27, pp. 593-618.

125
46. Numerical Investigation of the Propagation of Shock Waves in Rigid Proous Materials: Development
of the Computer Code and Comparison With Experimental Results. Levy, A., Ben-Dor, G. and Sorek, S.
s.l. : Cambridge University Press, 1996, Journal of Fluid Mechanics, Vol. 324, pp. 163-179.
47. Preliminary Assessment of Sandwich Plates Subject to Blast Loads. Xue, Zhenyu and Hutchinson,
John W. s.l. : Elsevier Ltd., 2003, International Journal of Mechanical Sciences, Vol. 45, pp. 687-705.
48. Dynamic Response of a Clamped Circular Sandwich Plate Subject to Shock Loading. Qiu, X.,
Deshpande, V. S. and Fleck, N. A. s.l. : ASME, September 2004, Journal of Applied Mechanics, Vol. 71,
pp. 637-645.
49. An Experimental Investigation of Shock Wave Propagation in Periodically Layered Composites.
Zhuang, Shiming, Ravichandran, Guruswami and Grady, Dennis E. s.l. : Elsevier Science Ltd., 2003,
Journal of the Mechanics and Physics of Solids, Vol. 51, pp. 245-265.
50. Numerical Simulation of Nonlinear Elastic Wave Propagation in Piecewise Homogeneous Media.
Berezovski, Arkadi, Berezovski, Mihhail and Engelbrecht, Juri. s.l. : Elsevier Science Ltd., 2006, Materials
Science and Engineering A, Vol. 418, pp. 364-369.
51. Uniaxial Crushing of Sandwich Plates Under Air Blast: Influence of Mass Distribution. Main, Joseph A.
and Gazonas, George A. s.l. : Elsevier Ltd., 2008, International Journal of Solids and Structures, Vol. 45,
pp. 2297-2321.
52. Behaviour of Sandwich Panels Subject to Intense Air Blasts - Part 2: Numerical Simulation.
Karagiozova, D., Nurick, G. N. and Langdon, G. S. s.l. : Elsevier Ltd., 2009, Composite Structures, Vol. 91,
pp. 442-450.
53. Chong, W. K., et al. Computational Study of Water Mitigation Effects On An Explosion Inside A
Vented Tunnel System. Institute of High Performance Computing, National University of Singapore.
Singapore : s.n., 1998.
54. Reduction of Explosion Damage Using Sand or Water Layer. Homae, T., et al. [ed.] M. Elert, et al. s.l. :
American Institute of Physics, 2007, Shock Compression of Condensed Matter, pp. 1289-1292.
55. Schwer, D. and Kailasanath, K. Blast Mitigation by Water Mist (3) Mitigation of Confined and
Unconfined Blasts. Naval Research Laboratory. Washington, D.C. : s.n., 2006. Memorandum Report.
NRL/MR/6410--06-8976.

126
56. Energy Absorption and Recovery in Tapered Granular Chains: Small Chains and Low Tapering.
Pfannes, Jan, et al. s.l. : Materials Research Society, 2003. Materials Research Society Symposium
Proceedings. Vol. 759, pp. MM4.5.1 - MM4.5.8.
57. Shock (Blast) Mitigation by "Soft" Condensed Matter. Nesterenko, Vitali F. Pittsburgh, PA : Materials
Research Society, 2003. Materials Research Society Symposium Proceedings. Vol. 759, pp. MM4.3.1 -
MM4.3.12.
58. Experimental and Numerical Study of Free-Field Blast Mitigation. Allen, R. M., et al. [ed.] M. D.
Furnish, Y. M. Gupta and J. W. Forbes. s.l. : American Institute of Physics, 2003, Shock Compression of
Condensed matter, pp. 823-826.
59. Morgan, G. E. Energy ABsorbing and Sizing Means for Helmets. 3609764 USA, October 1971.
60. Holt, M. and Tomczak, W. F. Protective Gear with Hydraulic Liner. 3849801 USA, November 1974.
61. Villari, F. K., Steigerwald, C. J. and Rappleyea, F. A. Protective Helmet. 3994021 USA, November
1976.
62. Gooding, E. R. Energy-Absorbing Insert for Protective Headgear. 4375108 USA, March 1983.
63. Hosaka, D. K. Helmet and Fluid Reservoir Apparatus. 5148950 USA, September 1992.
64. Calonge, R. Resistant Helmet Assembly. 5815846 USA, October 1998.
65. Mendoze, I. D. Safety Helmet. 6560787 B2 USA, May 2003.
66. Optimisation of Energy Absorbing Liner for Equestrian Helmets. Part I: Layered Foam Liner. Forero
Reudo, M. A., Cui, L. and Gilchrist, M. D. s.l. : Elsevier Ltd., 2009, Materials and Design, Vol. 30, pp.
3405-3413.
67. Optimisation of Energy Absorbing Liner for Equestrian Helmets. Part II: Functionally Graded Foam
Liner. Cui, L., Forero Rueda, M. A. and Gilchrist, M. D. s.l. : Elsevier Ltd., 2009, Materials and Design, Vol.
30, pp. 3414-3419.
68. Evaluation of Head Response to Ballistic Helmet Impacts Using the Finite Element Method. Aare,
Magnus and Kleiven, Svein. s.l. : Elsevier Ltd., 2007, International Journal of Impact Engineering, Vol. 34,
pp. 596-608.

127
69. Young, Laurence, Chan, Nicholas and Ruchelsman, Jason. Fluid Safety Liner. US 2009/0265839 A1
USA, October 29, 2009. Patent Application Publication.
70. Claire, A. and Vue, B. Helmet Liners with Fluid Filled Channels. Department of Aeronautics and
Astronautics, Massachusetts INstitute of Technology. Cambridge, MA : s.n., 2007. MIT Course 16.621
Final Report.
71. Stewart, Douglas. Protective Helmet Liner Incorporating Fluid Channels. School of Electrical,
Electronic, and Mechanical Engineering, University College Dublin. Dublin, Ireland : s.n., 2008. Master
Thesis.
72. Alley, Matthew David. Explosive Blast Loading Experiments for TBI Scenarios: Characterization and
Mitigation. Mechanical Engineering, Purdue University. West Lafayette, IN : s.n., 2009. Master Thesis.
73. Christou, George Alexander. Development of a Helmet Liner for Protection Against Blast Induced
Trauma. Aeronautics and Astronautics, Massachusetts Instittute of Technology. Cambridge, MA : s.n.,
2010. Master Thesis.
74. ABAQUS v6.10 Documentation.
75. Johnson, T. P. M. High Strain Rate Mechanical Characterization of Trabecular Bone Utilizing the Split-
Hopkinson Pressure Bar Technique. Department of Mechical Engineering, Massachusetts Institute of
Technology. Cambridge, MA : s.n., 2005. Master's Thesis.
76. Media Blast & Abrasive, Inc. Glass Bead Conversion Table. [Online] 2011. [Cited: Jan 17, 2011.]
http://www.mediablast.com/glass-bead-conversions.php.
77. Compression Model for Cohesionless Soils. Pestana, J. M. and Whittle, A. J. 4, 1995, Geotechnique,
Vol. 45, pp. 611-631.
78. Humrickhouse, Paul W. Hyperelastic Models for Granular Materials. Fusion Technology Institute,
University of Wisconsin - Madison. Madison, WI : s.n., 2009. Ph. D. Thesis.
79. Lambe, T. William and Whitman, Robert V. Soil Mechanics, SI Version. s.l. : John WIley & Sons, Inc.,
1979. ISBN 0-471-02491-0.
80. Cohesionless Soil. [Online] [Cited: Jan 18, 2011.] http://bsi-
web.ce.ufl.edu/downloads/files/MultiPier_Soil_Table.pdf.

128
81. The Performance of Pressure Vessel Using Concentric Double Cylindrical High Explosive. Hamada,
Toru, Nakamura, Yuichi and Itoh, Shigeru. s.l. : American Society of Mechanical Engineers, November
2004, Journal of Pressure Vessel Technology, Vol. 126, pp. 409-413.
82. Comparing Two Materials. MakeItFrom.com. [Online]
http://www.makeitfrom.com/compare/?left=Acrylic&right=Soda_Lime_Glass.