DESIGN OF A BATTERY CHARGING STATION IN MOZAMBIQUE · •Solar business systems SBS, A household...
95
DESIGN OF A BATTERY CHARGING STATION IN MOZAMBIQUE by Sandra Chavez Master Thesis in the Postgraduate Programme RENEWABLE ENERGY Energy and Semiconductor Research Laboratory Department of Physics Faculty of Mathematics & Science Carl von Ossietzky University Oldenburg / F.R. Germany Examination date: March 19th 2012 Battery charging station in Mozambique Examiner 1 Prof. Jürgen Parisi Examiner 2 Dr. Martin Knipper Examiner 3 M.Sc. Hans Holtrof Examiner 4 M.Sc. Florian Geyer
Transcript of DESIGN OF A BATTERY CHARGING STATION IN MOZAMBIQUE · •Solar business systems SBS, A household...

DESIGN OF A BATTERY CHARGING STATION IN
MOZAMBIQUEby
Sandra Chavez
Master Thesisin the Postgraduate Programme
RENEWABLE ENERGY
Energy and Semiconductor Research LaboratoryDepartment of Physics
Faculty of Mathematics & ScienceCarl von Ossietzky University
Oldenburg / F.R. Germany
Examination date: March 19th 2012
Battery charging station in Mozambique
Examiner 1 Prof. Jürgen ParisiExaminer 2 Dr. Martin KnipperExaminer 3 M.Sc. Hans HoltrofExaminer 4 M.Sc. Florian Geyer

Battery charging station in Mozambique
2

Anyone who has never made a mistake has never tried anything new. Albert Einstein
Sandra Chavez
3

Battery charging station in Mozambique
4

ACKNOWLEDGEMENTSI have an endless list of people to thank....
First of all to DAAD-CONACYT scholarship for making my studies in Germany possible, this experience turned my life around.
PPRE • To the staff, to always have the right answer for me in a incredibly fast and
friendly way.• To Hans Holtroff, for the guidance in the technical and professional level. I
learned much more than the collector equation.• To my colleges for the endless enthusiasm, for all the happy moment and for the
warm welcome in the cold Germany after my Mozambique experience.• To the Eurec students, thanks for being my example and showing me the light at
the end of the tunnel, you were always a step ahead! Specially thanks to Michael Norton who learned Spanish by correcting my English.
GIZ• To EnDev for opening me the doors, and giving the opportunity to work in such
an exciting project in Mozambique. • To my colleagues from AMES-M, both in Chimoio and Maputo. Mr Van Eijk, Mr
Zana and Mr Geyer, thanks for making my stay in Mozambique an unforgettable experience.
• To Juan Pablo Villa and Ulrike Konrad, for being my adventure partners.• To my colleagues from EnDev in Eschborn and to Prof. Peter Adelmann, for
receiving me with open arms and a productive working environment.• To the other interns to be much more than just co-workers.
FAMILY AND FRIENDS IN MEXICO• To my Dad, my Mom and my bother for being always cheerful and strong even
when “el Gordito” my grandfather passed away.• Last but not least, I would like to thank all of my friends in Mexico who, despite
the distance, always were there when I needed them most.
Thanks to everyone who make this study possible.
Sandra Chavez
5

Battery charging station in Mozambique
6

Table of ContentsAcknowledgments 5 Executive Summary 121. Introduction 15
1.1 Mozambique country situation 151.1.1 Location 151.1.2 Political division 161.1.3 History 161.1.4 Culture 161.1.5 Geography 171.1.6 Climate 171.1.7 Energy situation and resources 17
1.2 Manica province 191.2.1 Location 191.2.2 Political Division 191.2.3 Chimoio city 201.2.4 Geography & Climate 201.2.5 Energy resources 21
1.3 GIZ-AMES-M Program 221.3.1 GIZ 221.3.2 EnDev 221.3.3 AMES-M 23
2. Battery charging stations 242.1 Scope and limitations of this study 24
2.1.1 EnDev Counting 252.1.2 Energy access and productive use of electricity 26
2.2 Battery charging station 272.3 Off-grid Cell phone charging 272.4 Examples of Battery Charging Stations 28
2.3.1 EnDev 302.3.2 Burundi 302.3.3 Mali 312.3.4 Uganda and Tanzania 312.3.5 Kenya 322.3.6 Rwanda 342.4 Summary other BCS’s 35
3. Energy Demand 363.1 Energy demand in Mozambique 36
3.2 RWI Baseline study GIZ Mozambique 363.3 Own data collection 38
4. System design 394.1 Options description 41
4.1.1 Solar business system SBS 41
Sandra Chavez
7
4.1.2 Solar battery charging station SBCS 424.1.3 MHP batteries charging station 43
4.2 Technical issues 444.2.1 Battery: Terminology and Definitions 444.2.2 Lead acid batteries 454.2.3 Lithium ion batteries 454.2.4 Nickel-based batteries 464.2.5 Battery charging and discharging 464.2.6 Battery & battery charging stations 484.2.7 Solar powered systems 504.2.8 Technical analysis SBS 534.2.9 Technical analysis SBCS 584.2.10 Technical analysis MHPP-BCS 62
4.3 Financial issues 644.3.1 Net present value introduction 644.3.2 Outgoing cash flows 654.3.3 Incoming cash flows 674.3.4 Sensitivity analysis: Users attendance 694.3.5 Cash flow diagrams 71
4.4 EnDev beneficiaries 734.5 Preliminary results from the analysis 74
5. Solar business system 785.1 Financing options 785.2 Implementation 80
5.2.1 SWOT analysis 815.2.3 Risks and mitigation 82
6. Conclusion and Recommendations 847. References 86
Appendix 89
Battery charging station in Mozambique
8
List of FiguresFigure 1: Mozambique geographical locationFigure 2: Provinces of MozambiqueFigure 3: Manica province locationFigure 4: Mountain Cabeça de Velho, ChimoioFigure 5: GIZ logoFigure 6: Ames-M teamFigure 7: Informal mobile charging station in ManicaFigure 8: Phone accessFigure 9: BCS in MaliFigure 10: Energy hub (left) O-Box with O-Lamp (right) OSRAM Kenya Figure 11: Energy kiosk in Minazi, Rwanda 2010Figure 12: Results RWI studyFigure 13: Electrical appliances RWI Figure 14: Vanduzi and Chimukono localization mapFigure 15: SHS + PUE setupFigure 16: Battery charge controllers in the SHS for PUEFigure 17: MHP Battery charging stationFigure 18: Diagram of the battery in the case with over discharge protectionFigure 19: Battery boxFigure 20: Qualitative analysis-Energy flow in a SHSFigure 21: Micro hydro battery charging stationFigure 22: Cash flow SBSFigure 23: Cash flow- SBCSFigure 24: Cash flow- MHP-BCSFigure 25. Cash flow- SBS - FunaeFigure 26. Cash flow- SBS -Comercial Bank Figure 27. SWOT analysis
Sandra Chavez
9

List of TablesTable 1: Synthesis of the main socio-economic indicators of MozambiqueTable 2. Renewable energy resources potential Table 3: Synthesis of the main socio-economic indicators of Manica Table 4: EnDev rules for measuring outcomes Table 5: Mozambique cellphones subscriptions per 100 peopleTable 6: Example of BCSTable 7: Usage of traditional energy sourcesTable 8: Different options for battery chargingTable 9: Charging efficienciesTable 10: Calculation energy for chargingTable 11: Chimoio annual irradiationTable 12: Efficiencies of the SHS componentsTable 13: Components offered by Savon tradingTable 14: Proposal usage of 100 Wh/dayTable 15: Energy demand to play one movieTable 16: Battery weekly SOC during JuneTable 17: Recommendation of components for the SHSTable 18: Recommendation of components for the SBCSTable 19: Investment cost –SHS + PUETable 20: Investment cost –SHS + battery chargingTable 21: Investment cost –MHP + battery chargingTable 22: Estimated lifetime of the componentsTable 23: Personal consumption savingsTable 24: Proposed tariffsTable 25: Sensitivity analysis demand-SBSTable 26: Sensitivity analysis demand-SBCSTable 27: Sensitivity analysis demand + batteryTable 28: Revenue from different PUETable 29. Qualitative risk assessment
Battery charging station in Mozambique
10

AbbreviationsAMES-M Access to Modern Energy Services-Mozambique
BCC Battery charge controller, also Battery charging unit BCU
BCS Battery charing station
DEEP Developing Energy Enterprises Project
DOD Deep of discharge
EdM Electricidade de Mozambique (Electricity of Mozambique)
EnDev Energising Development
FUNAE Fundo de Energia (Energy fund)
GDP Gross Domestic Product
GIZ Gesellschaft International Zusammenarbeit (German International cooperation agency)
Hh Household
INE Instituto Nacional de Estadistica (National Statistics Institute)
SBCS Solar battery charging station
SBS Solar business system
SHS Solar home system
SOC State of Charge
SOH State of health
STC Standard test conditions
MFI Micro finance institution
MHPP Micro hydro power plant
MSME’s Micro small and medium-sized enterprises
Mt Metical (Mozambique currency)
NPV Net present value
PUE Productive use of electricity
U Voltage (V)
W Watt
Wh Watt-hour
Wp Watt-peak
Sandra Chavez
11

Executive SummaryMozambique is one of the least developed countries in the world1, access to electricity being a mayor concern. For this reason, the Dutch German partnership, Energising development EnDev, is actively working in Mozambique throughout the AMES-M project.
One of the key interventions for AMES-M is to provide modern energy for lighting and small electric appliances to households through Battery Charging Systems.
The objective of this study is to perform a technical and economical analysis of the feasibility of battery charging stations in Mozambique. It answer the questions: “Are BCS technically and economically feasible in Mozambique?” if so, “Which setup (technology and PUE combination) is recommended?”
The study was done from October 2011 to February 2012, with 2 months of work field in the Manica province. All the prices used are the prices in Mozambique at that time.
At first a general overview of the country situation of Mozambique, Manica province and best practices of battery charging stations in Africa are presented in the first part of this study.
Then a technical and economic feasibility evaluation of 3 systems is performed:•Solar business systems SBS, A household size SHS (120 Wp) plus productive use of electricity PUE, like charging cellphones, charging lanterns, barber shop , cinema2, etc• Solar battery charging stations SBCS, SHS for starter battery charging, 600 Wp for Lead acid 70 Ah battery charging.•Micro hydro power MHP for starter battery charging, Using electricity from the MHPP mini grid to charge 70 Ah lead acid batteries.
For the technical feasibility a comprehensive analysis of the energy losses in the components is performed. The result is a recommendation of the optimal size of the components of each system to balance the capacity and the potential share of productive use of electricity.
Battery charging station in Mozambique
12
1 HDI 2011, ranked in the 184 of 187 countries UNDP (2011). Human development index trends 1980-2011.2 Use a TV set to play a movie For more information refer to the section 4.1.2

For the economical feasibility net present value and cash flow analysis are performed for the 3 options assuming the operator pays 100% for the system.
The main findings of the research are:• Starter battery charging stations are neither technically nor economically feasible
for Mozambique. The main limitation is the high cost and short lifetime of the starter batteries. When it is possible to supply the same service with other modern forms of energy, this should be preferred over the starter battery.
• Solar business systems ,SBS, are technical and economically feasible. By including productive use of energy the economic and social development can be boosted. The operator has an extra source of income and can pay for the system.
• Nevertheless, one obstacle that needs to be overcome is the high up front cost of the SBS, for this reason it is recommended to look for cheaper financial options than the commercial bank, for example Funae.
Finally a proposal for the implementation of this SBS in Mozambique is presented, a SWOT analysis and a qualitative risk assessment.
Sandra Chavez
13

Battery charging station in Mozambique
14

1. IntroductionThis chapter provides a description of Mozambique, Manica province and Chimoio city (where the BCS are going to be implemented), as well as a description of GIZ Ames-M project. It was written in cooperation with Juan Pablo Villa, another PPRE student who worked in Chimoio at the same time and for the same organization.
1.1 Mozambique country situation
QUICK FACTSQUICK FACTS Explanation
Population (million) 23,4 Year 2010
GDP per capita (US$) 410 Year 2010
HDI 0,317 Place 184 of 187 Countries.
Rural population (million) 14,4
Life Expectancy (years) 49
Literacy rate (%) 55 % of people ages 15 and above.
HIV (%) 14 Total (% of population ages 15-49)
Poverty index (%) 54,7 Under the national poverty line.(2008)
Electrification rate (%) 16 Connected to the national grid (EdM)
Table 1: Synthesis of the main socio-economic indicators of Mozambique Source: Data world bank and UNDP (Group 2011)(UNDP 2011)Table 1: Synthesis of the main socio-economic indicators of Mozambique Source: Data world bank and UNDP (Group 2011)(UNDP 2011)Table 1: Synthesis of the main socio-economic indicators of Mozambique Source: Data world bank and UNDP (Group 2011)(UNDP 2011)
1.1.1 Location
Mozambique is located in the southeastern Africa bordered by the Indian Ocean to the east, Tanzania to the north, Malawi and Zambia to the northwest, Zimbabwe to the west and Swaziland and South Africa to the southwest.
The total area of Mozambique is 799380 km2, from North to South to the East it has coastline with the Indian Ocean for over 2515 km (Estadistica 2011).
Sandra Chavez
15
Figure 1. Mozambique geographical location

1.1.2 Political division
Mozambique is divided into ten provinces and one capital city with provincial status. 1. Cabo Delgado2. Gaza3. Inhambane4. Manica5. Maputo (city)6. Nampula7. Niassa8. Sofala9. Tete10. Zambezia
1.1.3 History
Portugal began to colonize the area that later became Mozambique in the early 16th century. In 1974, with the Frelimo independence movement, Portugal colonial rule ended after ten years of war.The Renamo movement, an anti-Frelimo resistance group supported by Rhodesia and South Africa, fought Frelimo in the 1977-1992 civil war. This conflict, combined with the central economic planning by the Marxist leadership of Frelimo, left the country in chaos. About a million people died in the civil war.Frelimo inaugurated a new constitution in 1990 that enshrined free elections, and both sides signed the resulting Rome Peace Accords of 1992. Frelimo has won all subsequent elections, some of which have been disputed by Renamo and smaller opposition groups. Political life has nonetheless remained stable.(BBC)
1.1.4 Culture
Mozambique has been the home of various different groups Bantu, Swahili, Arabs, Indians and Europeans.
Traditional ways of life are well preserved in Mozambique culture - varying from province to province. This cultural kaleidoscope provides visitors with a host of treasured experiences and memories. The Makonde, from Cabo Delgado Province in the north-east, are known for their fearlessness and initiation rituals. For male initiation, participants dance in 'mapico' masks.
Music is part of the culture of Mozambique and is very important to the Niassa people who live in the sparsely populated North-western region.
Battery charging station in Mozambique
16
Figure 2: Provinces of Mozambique

The traditional, spicy cooking of Zambézia, Mozambique is highly regarded. Zambézian chicken, grilled with palm oil, is a particular delicacy. The agility of the Nhau dancers of Tete Province is much admired. To the sound of resounding drum beats, they dance holding huge and frightening wooden masks. For the Chope people of Inhambane Province the 'timbila' is both the name of a percussion instrument and a dance.
Regarding religion the mayor groups in Mozambique are: Christians 56%Muslims 18%Other beliefs 7%No religious beliefs 18%
Portuguese is the official language but Makua-Lomwe, Swahili, other indigenous languages are also spoken in different regions.
1.1.5 Geography
The country is divided into two topographical regions by the Zambezi River, the largest and most important in the country.To the North of the Zambezi River, the narrow coastline moves inland to hills and low plateaus, and further West to rugged highlands.To the South of the Zambezi River, the lowlands are broader with the Mashonaland plateau and Lebombo mountains located in the deep South.
1.1.6 Climate
Mozambique has an inter-tropical climate with two seasons, a wet season from October to March and a dry season from April to September. Climatic conditions, however, vary depending on altitude.
Rainfall is heavy along the coast and decreases in the north and south. Annual precipitation varies from 500 to 900 mm depending on the region; with an average of 590 mm. Cyclones are common during the wet season (Wikkipedia 2011).
1.1.7 Energy situation and resources
Biomass is by far the country´s predominant energy source, few people have access to modern forms of energy such as electricity (only 16%, most of them concentrated in the urban areas). Nevertheless, Mozambique is self sufficient in energy resources with the exception of liquid fuels; Table 2 summarizes the renewable and fossil fuels energy resources.
Sandra Chavez
17

Power generation is dominated by the hydroelectric facility Cahora Bassa, located on the Zambezi River in western Mozambique. It contributes significantly to the installed capacity in Mozambique and exports 2/3 of its output to South Africa and Zimbabwe. Due to the low population density, 29 inhabitants/km^2 and Germany 235 inhabitants/km^2, combined with to the low consumption per household make it financially complicated to distribute grid connected commercial sources of energy.
Electricidade de Moçambique EdM, responsible for transmission, distribution and commercialization. EdM is not strictly a government organization, but a government owned corporation. (Gunther 2010)
Resource Availability Comments
Wind Wind resource along coast, NiassaAverage wind speed 6 m/s
4 sites studied, resource mapping needed
Solar4.5-7 kWh/m2/daySurface annual irradiation 1.49 PWh/year
Assuming 5.2 kWh/m2/day Mozambique land surface receive 1.49 PWh/year
Hydro 13 GW. Where 1000 MW expected to be Small scale (Up to 10 MW) > 60 potential projects
BiomassIn order of hundreds of MW.Bagasse potential availably 433 thousand tones.
5 sugar plantations in Maputo and Sofala.
Gas reserves Estimated 700 billion cubic meters Potentially generate 500 MW
for over 300 years
Coal reserves
Estimated 3600 Mt, equivalent to 140 million TJ
Potentially generate 5000 MW for over 100 years
Table 2. Renewable energy resources potentialSource: (Hankins 2009; Hellpap 2011)Table 2. Renewable energy resources potentialSource: (Hankins 2009; Hellpap 2011)
Battery charging station in Mozambique
18

1.2 Manica province
EnDev decided to work only in the Manica province, therefore more specific information about it is presented in this section.
QUICK FACTSQUICK FACTS Explanation
Population 1,438,386 hab.
Rural Population 74,7%
Life expectancy 49.1 years
Literacy rate 41,5% % of population ages 15-49.
HIV rate 19,7% % of people ages 15 and above.
Poverty Index 43,6% Under the national poverty line
Electrification rate 11,5% Connected to the national grid
Table 3: Synthesis of the main socio-economic indicators of Manica Source: Data world bank and UNDP (Group 2011)(UNDP 2011)Table 3: Synthesis of the main socio-economic indicators of Manica Source: Data world bank and UNDP (Group 2011)(UNDP 2011)Table 3: Synthesis of the main socio-economic indicators of Manica Source: Data world bank and UNDP (Group 2011)(UNDP 2011)
1.2.1 Location
The Manica Province is located in the west area of Central Mozambique. Bordering in the North with Province of Tete, South with Inhambane and Gaza Provinces, East with Sofala Provinces and West with Zimbabwe has a total area of 61,661 km², and a population of 1.43 million habitants (INEM 2007).
Manica Province is located in one of the highest areas of the country and gives birth to several rivers that flow east towards the Indian Ocean. (Zana 2011),(Wikkipedia 2011). Also, Manica is the gateway with western neighbor Zimbabwe which makes it an important economical center.
1.2.2 Political Division
Administratively is divided in 10 districts: Báruè, Gondola, Guro, Machaze, Macossa, Manica, Mossurize, Sussundenga and Tambara.
Sandra Chavez
19
Figure 3. Manica province location

1.2.3 Chimoio city
Chimoio is the capital of Manica Province and represents the economical center of Manica. With a total population of 238,976 inhabitants, it occupies the 5th place in the more populated cities in the country (INEM 2007).
Chimoio's name under Portuguese administration was known as Vila Pery. Vila Pery was developed under Portuguese rule as an important agricultural and textiles centre. The change in name from Vila Pery to Chimoio took place on 12 June 1975, during the public rally of the first President of independent Mozambique - Samora Moisés Machel.
The town lies on the railway line from Beira to Harare (Zimbabwe), near the Cabeça do Velho rock, located about 95 km from the Zimbabwean border.
After the Zimbabwean political and social crisis of the 2000s, Chimoio has become a major destination for immigrants who were looking for work in Mozambique, and today is sometimes described as feeling more Zimbabwean than Mozambican.
1.2.4 Geography & Climate
The province of Manica stretches along the border with Zimbabwe to the West of Mozambique. It is generally characterized by the Vumba, Chimanimani and Nyanga mountain ranges which form the border with Zimbabwe. With a peak altitude of 2,436 metres, Mount Binga is the highest mountain in the country. Temperature wise, the average highest per year are above 30ºC (with peaks of above 40ºC) and the lowest is around 11ºC with an average of 22ºC throughout the year. (Climatedata.eu 2011) During the rainy season the amount of rain is very high, making even the transportation or communication with rural and semi-rural areas impossible
Figure 4. Mountain Cabeça de Velho, Chimoio
Battery charging station in Mozambique
20

1.2.5 Energy resources
Wind
The average wind speed in the landlocked areas of Mozambique is in general less than 2 [m/s]. Probably there are sites around the mountainous areas with more favorable conditions. In a general perspective, the conditions in the province are not good for electricity generation using wind. There are certain specific applications where wind energy could be used, and has been used to an small extent, for example, water pumping. (Klaus 2005)
Solar
Manica has a high solar irradiation level, with a yearly average of 5.4 kWh/m2/day with a monthly variation between 4.2 and 6.3 kWh/m2/day. (Klaus 2005)
Biomass
The current resource exploitation of fire wood has in most cases a devastating effect. Meanwhile, a sustainable usage of Miombo (indigenous tree) of forests and areas of agro-forestry presents high renewable potential for charcoal generation.On the other hand, compared with other provinces, Manica has a high index of agro production. Due to this, there is also a high quantity of residuals, both humid and dry, and therefore a good energy potential. The wood production industry in the province does not explore the energy content on the rest and residuals from their production. Also the biomass potential could be increased by cultivating certain species of grass, woody plants and vegetal oil. (Klaus 2005) Today large areas are being planted with Jatropha to produce biodiesel following the national objectives for this source of energy.
Hydropower
The mountainous areas on the West side of the province show a high rain level throughout the year. There are several small and medium sized rivers with permanent water level that would be appropriate for micro and pico hydropower systems. (Klaus 2005)
Studies from different sources have shown the high potential that the province has to generate this type of renewable energy, this was known since colonial times, and is still possible to find old setups in rural areas.
Sandra Chavez
21

1.3 GIZ-AMES-M Program
1.3.1 GIZ
GIZ operates in more than 130 countries worldwide. In Germany, GIZ maintains a presence in nearly all the federal states. Our registered offices are in Bonn and Eschborn. GIZ has more than 17,000 staff members across the globe – some 70 % of whom are employed locally as national personnel. In addition, GIZ places or finances around 1,110 development workers, 700 integrated experts, 455 returning experts and 820 volunteers worldwide.
The services delivered by the Deutsche Gesellschaft für Internationale Zusammenarbeit (GIZ) GmbH draw on a wealth of regional and technical expertise and tried and tested management know-how. As a federal enterprise, GIZ supports the German Government in achieving its objectives in the field of international cooperation for sustainable development. GIZ is also engaged in international education work around the globe (GIZ 2010).
1.3.2 EnDev
The aim of the Dutch-German partnership, Energising Development (EnDev), is to provide five million people in developing countries with sustainable access to modern energy services by 2015.
During the first phase of Energising Development (2005–2009), the target was to reach 3.1 million people. The activities of EnDev focus on providing access to modern and clean energy services to poor households, small enterprises and social institutions in rural areas.
The energy services include:1. Energy for lighting and household appliances2. Energy for cooking3. Energy for social infrastructure4. Energy for production and income generation
Figure 5: GIZ logo
Battery charging station in Mozambique
22

1.3.3 AMES-M
The project “Access to Modern Energy Services-Mozambique - AMES-M”, started its activities in Mozambique at the beginning of the year 2007. The duration of the first stage of the AMES-M project was 3 years, from early 2007 until ends of 2009. Among the many activities the project was involved, we can mention: -Improvement of the electrical grid in the cities of Maputo and Matola.-Financing 4 small hydropower stations in the province of Manica.-The promotion of small solar home systems in the province of Sofala.(Madeira 2011)
The second stage of the project extends until 2012 and is mainly focused in the province of Manica. It has for key objectives:-Provide modern energy for lighting and small electric appliances to households through Micro/Pico-Hydro, Grid Densification and Battery Charging systems.-Provide modern energy for productive use by small and medium-sized enterprises, craftsmen for employment creation and income generation. -Capacity building of local NGOs, Private Sector, Banks and Partner Institutions. (Ministry of Energy, FUNAE)
-AMES-M coordinate its activities in close cooperation with FUNAE and government structures both central and in the province.
Figure 6: Ames-M team
Sandra Chavez
23

2. Battery charging stationsThis chapter describes the AMES-M motivation for promoting BCS, also defines what a battery charging station is, and finally compares best practices in the field.
2.1 Scope and limitations of this study
As mentioned, one of the key objectives for the second stage of EnDev Mozambique Ames-M is to provide modern energy for lighting and small electric appliances to households through Battery Charging systems.
In the rural areas of Manica province there are some PV installations in hospitals and schools that are suspected to be misused by charging cellphones. This causes the battery operate constantly in a low state of charge, reducing their lifetime. The most critical part is that sometimes the community does not have the money or knowledge to replace the battery, so when the battery fails, the complete installation stops working as well.
The service life of the complete installation is considerably reduced due to the lack of technical knowledge of correct operation and system maintenance.
Another reported situation is the growth of informal cell phone charging market. The figure 7 shows examples of such charging stations. These stations operate by connecting a second hand PV module to a second hand car battery directly, without any charge controller.
Figure 7. Informal mobile charging station in Manica
These installations represent a health risk for the operators and the community, due to the bad quality of the electric connections and the old lead acid batteries that may have some leakages.
To tackle these two problems, abuse of current installations and health risk of informal charging stations, EnDev Mozambique decided to work in the development of a concept of a new BCS . “EnDev goal is to identify suitable BCS
Battery charging station in Mozambique
24
owners and managers, and support the elaboration of a workable business plan”. (Hellpap 2011)
This study concentrates only in Manica province, where Ames-M is concentrating its efforts. For the solar home system only the sales model is considered because there is no evidence of a fee based service business model is operating in Mozambique. EnDev is an output based project; the aim is to provide as many households as possible with modern energy services. In order to account the total beneficiaries in the different EnDev projects in a comparable way, standardized rules for calculating “EnDev beneficiaries” have been developed and are presented in detail in the section 2.1.1.
2.1.1 EnDev Counting
EnDev is a result based project, therefore monitoring is a essential component. There is a standard methodology to count the number beneficiaries of each project.
Different service level provided accounts for different share beneficiaries reached; giving access to modern energy to someone by connecting the user to the grid is not the same as giving him a Pico PV system, therefore the counting needs to be differentiated.
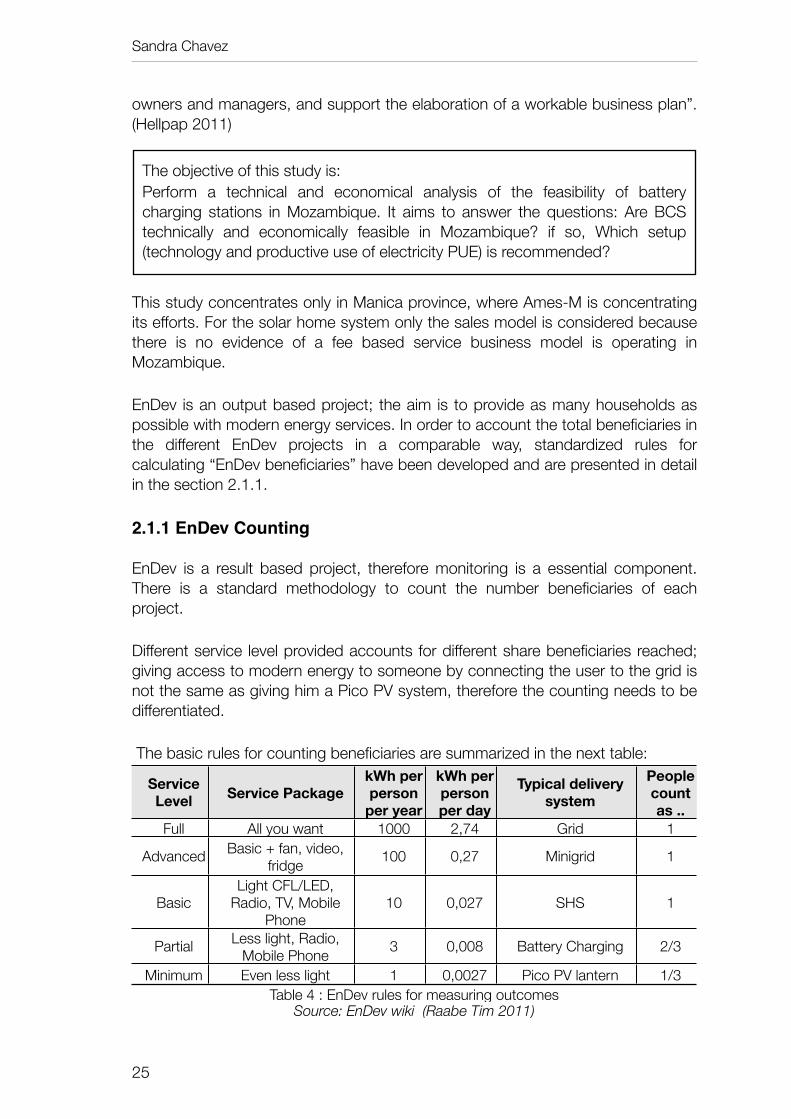
The basic rules for counting beneficiaries are summarized in the next table:
Service Level Service Package
kWh per person
per year
kWh per person per day
Typical delivery system
People count as ..
Full All you want 1000 2,74 Grid 1
Advanced Basic + fan, video, fridge 100 0,27 Minigrid 1
BasicLight CFL/LED,
Radio, TV, Mobile Phone
10 0,027 SHS 1
Partial Less light, Radio, Mobile Phone 3 0,008 Battery Charging 2/3
Minimum Even less light 1 0,0027 Pico PV lantern 1/3Table 4 : EnDev rules for measuring outcomes Table 4 : EnDev rules for measuring outcomes Table 4 : EnDev rules for measuring outcomes Table 4 : EnDev rules for measuring outcomes Table 4 : EnDev rules for measuring outcomes Table 4 : EnDev rules for measuring outcomes
Source: EnDev wiki (Raabe Tim 2011)Source: EnDev wiki (Raabe Tim 2011)Source: EnDev wiki (Raabe Tim 2011)Source: EnDev wiki (Raabe Tim 2011)Source: EnDev wiki (Raabe Tim 2011)Source: EnDev wiki (Raabe Tim 2011)
The objective of this study is:Perform a technical and economical analysis of the feasibility of battery charging stations in Mozambique. It aims to answer the questions: Are BCS technically and economically feasible in Mozambique? if so, Which setup (technology and productive use of electricity PUE) is recommended?
Sandra Chavez
25

For the propose of this study, the basic, partial and minimum service levels are relevant.
The categories are classified by kWh per person per year. This can be easily converted to kWh per household as follows: Assuming 1 household= 5 persons1 household = 50 kWh/year= 135 Wh/day
The number of EnDev beneficiaries is an important parameter while deciding between the different options for the BCS.
2.1.2 Energy access and productive use of electricity
Access to reliable and affordable energy services can generate local jobs, income and, thereby, promote local development (Brüderle 2011)..
However due to the high price of the systems in some cases the households cannot afford them. In contrast it has been reported by other SHS programs that only 10-15% of the households are using their system for income generation. (Blunck 2008). Including a productive use of electricity. Households could have the possibility to have an extra source of income that would help them to pay for the system.
Another significant point is that countless electrification programs have suffered from a “lower” demand response of the commercial sector than expected. Consequently, the programs do not have the impact forecasted and the electrification schemes suffered from a lack of new customers being able to pay for their electricity (Brüderle 2011)..
For this reason, GIZ and Energy Sector Management Assistance Program (ESMAP) from World Bank started a joint project in 2006 in which the impacts of electrification on small and micro enterprises in Sub-Saharan Africa were systematically analyzed. From this work:“Concrete and dedicated activities should wherever possible complement energy access programs so that they result in the productive use of the newly available energy services and, thus, promote income generating activity and local job creation” (Brüderle 2011).
Afterwards GIZ and the EUEI PDF decided to jointly start the ‘PRODUSE’ initiative and publish “The Productive Use of Electricity Manual”. In this manual productive use of electricity is defined as:
“An agricultural, commercial and industrial activities involving electricity services as a direct input to the production of goods or provision of services” (Brüderle 2011)..
Battery charging station in Mozambique
26
For the design of the battery charging station, different possibilities of PUE of low power and day light activities are explored. Productive use of electricity is strategic feature to be considered during this study, PUE’s objective is to increase income growth as well as local employment generation.
2.2 Battery charging station
A battery charging station is a central facility where charging service of some or all of the next components is provided: -Starter Batteries 12 V -Cellphones (Section 2.3) -LanternsIn addition others examples of PUE within the BCS can be offered such as: Cinema, barber shop, handcraft workshop, etc.
This BCS can be powered either from the grid or from renewable energy sources such as solar or hydro power.
The size of the installation, number of devices charged per day, cost and business-operational models are variable. Examples of best practice are can be found in the section 2.4.
2.3 Off-grid Cell phone charging US$2.3 Billion Market Opportunity
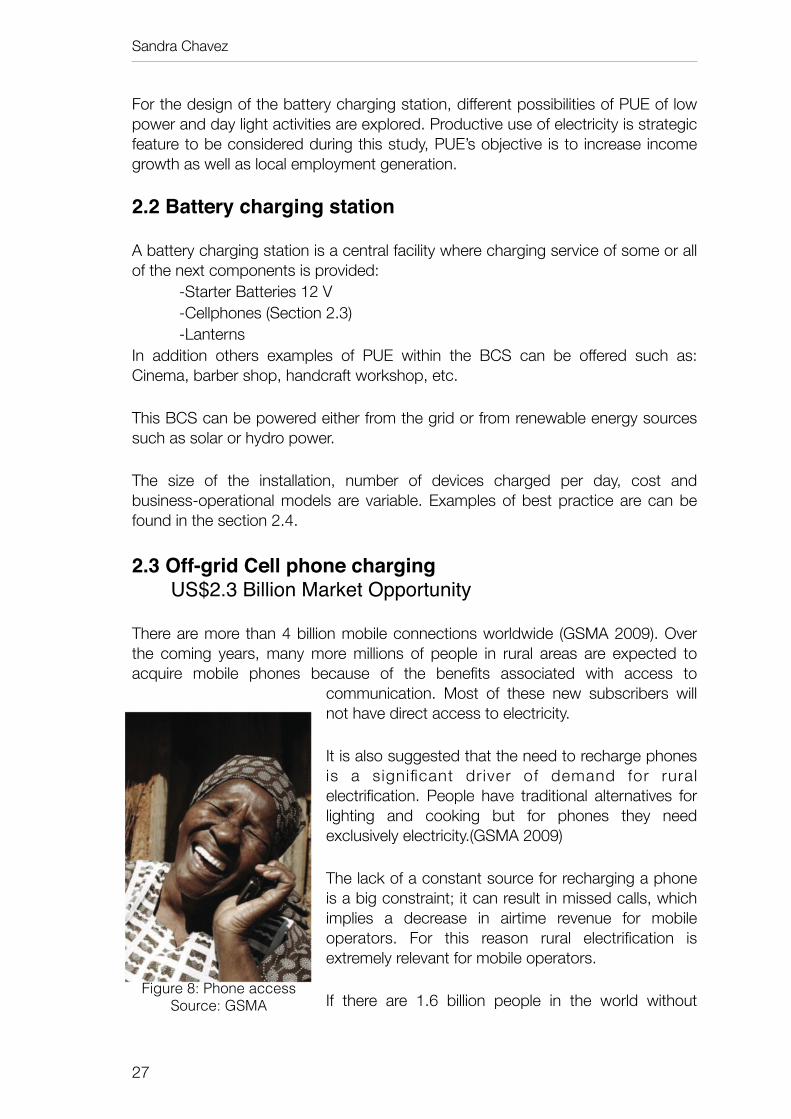
There are more than 4 billion mobile connections worldwide (GSMA 2009). Over the coming years, many more millions of people in rural areas are expected to acquire mobile phones because of the benefits associated with access to
communication. Most of these new subscribers will not have direct access to electricity.
It is also suggested that the need to recharge phones is a significant dr iver of demand for rural electrification. People have traditional alternatives for lighting and cooking but for phones they need exclusively electricity.(GSMA 2009)
The lack of a constant source for recharging a phone is a big constraint; it can result in missed calls, which implies a decrease in airtime revenue for mobile operators. For this reason rural electrification is extremely relevant for mobile operators.
If there are 1.6 billion people in the world without
Sandra Chavez
27
Figure 8: Phone accessSource: GSMA
access to grid electricity, GSMA and Wireless Intelligence research, estimates that 30% of those people have a mobile phone connection. This means nearly 500 million people currently have access to a mobile phone but do not have their own means for charging it. Field studies show that when a constant source of charging is available the usage increases by 10%. Considering average airtime spending of the average off-grid customer (US$4 per month), the expected increase in direct revenues would total US$2.3 billion per year. (GSMA 2009)
Specifically in Africa this situation is critical, a study carried out between February and April 2011 by Developing Energy Enterprises Project (DEEP) in Uganda, Kenya and Tanzania shows:
• Phone charging is a highly viable economic activity.• Phone users report significant economic and social benefits from the use of
their phones.• There is considerable unmet need and significant potential for phone
charging micro businesses to grow.• The major constraint on growth is lack of access to funds for the purchase of
panels and accessories.• These businesses represent a viable, cost efficient and sustainable way of
addressing the phone charging needs of off grid subscribers.
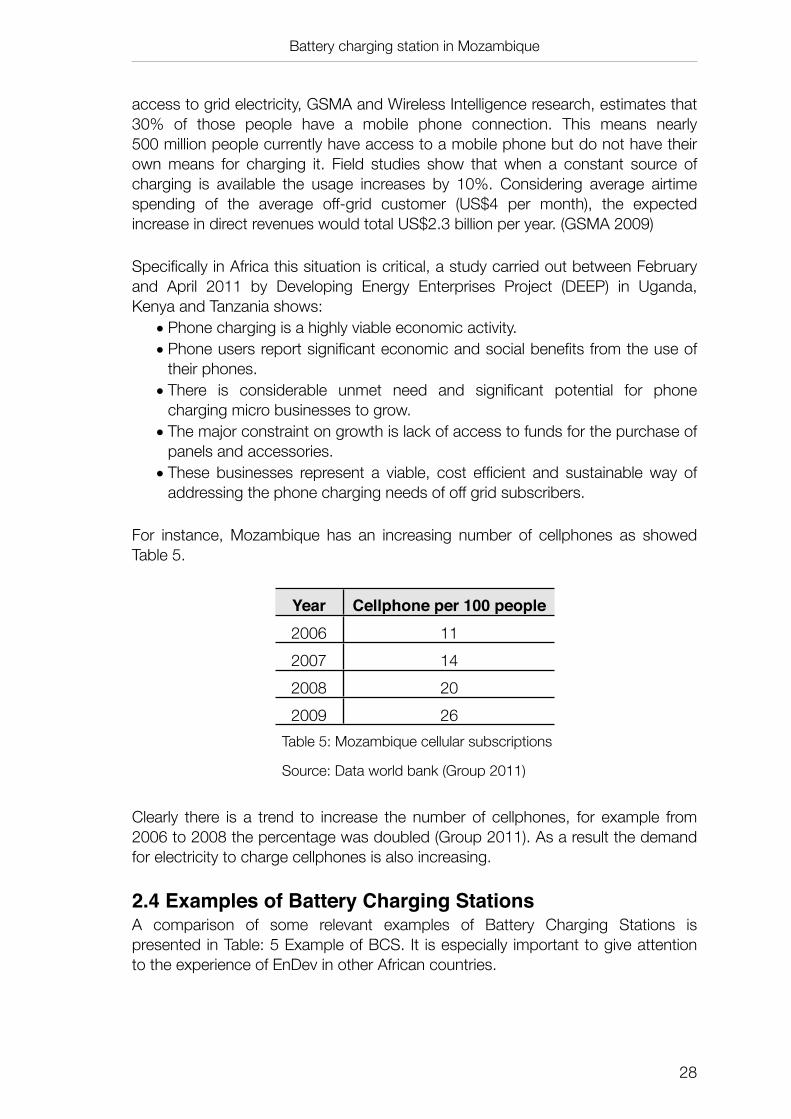
For instance, Mozambique has an increasing number of cellphones as showed Table 5.
Year Cellphone per 100 people2006 112007 142008 202009 26
Table 5: Mozambique cellular subscriptionsTable 5: Mozambique cellular subscriptions
Source: Data world bank (Group 2011)Source: Data world bank (Group 2011)
Clearly there is a trend to increase the number of cellphones, for example from 2006 to 2008 the percentage was doubled (Group 2011). As a result the demand for electricity to charge cellphones is also increasing.
2.4 Examples of Battery Charging StationsA comparison of some relevant examples of Battery Charging Stations is presented in Table: 5 Example of BCS. It is especially important to give attention to the experience of EnDev in other African countries.
Battery charging station in Mozambique
28

Sandra Chavez
29
Note
s:
[1] E
stim
atio
n of
the
ave
rage
num
ber o
f bat
terie
s. It
is d
ifficu
lt to
est
imat
e th
e ca
pacit
y in
Ah
due
to th
e sig
nifica
nt d
iffere
nces
in th
e SO
H an
d SO
C of
eac
h ba
ttery.
[2] S
tarte
r= C
ar L
ead
acid
bat
tery
[3] F
ee c
harg
ed e
very
tim
e th
e ba
ttery
or m
obile
pho
ne is
cha
rged
.[4
]1 U
S$=
500
FCF
A[5
] BCC
= Ba
ttery
cha
rge
cont
rolle
r
Tabl
e 6:
Exa
mpl
e of
BC
S

2.3.1 EnDev
EnDev has Battery Charging Stations in Mali, Burundi, and in soon in Ethiopia as well. According to EnDev experts, SBCS can be an economic solution in areas (Michael 2011) :
• Remote not connected to the grid.• Diesel fuel costs and battery transport costs are high.• Low income.• Low energy demand.
Important aspects to be considered for the success of SBCS are (Michael 2011):• Extensive marketing.• Additional services to be offered such as selling solar components, or cutting
hair.• Training of all local operators and technicians.
2.3.2 Burundi
A few facts about Burundi (Heidtmann 2011):• Only 2 % of the population has access to electricity.• Households have a very limited budget.• Grid connected battery charging stations already exist in the main cities. • People from rural areas require long journeys (40 km and more) for a battery
charge. • Quality of charge is often deplorable. • Batteries are being charged directly from the PV panel without a charge
controller.
BCS’s in Burundi consist of 85Wp-170 Wp for charging cellphones and 2 small batteries per day. Additionally in these centers Pico PV Solar Lanterns (SL), SHS and PV-Pumps will be promoted and sold.The promotion is done through sales exhibitions “road shows” near the most frequented markets and churches. At least one exhibition every week, followed by a second visit some weeks later, allowing potential customers to collect the money meanwhile.
BCSs are integrated in existing shops, therefore shop keepers do not only depend on the income generated by charging batteries since they diversify their income sources. The SBCS’s are owned by a private operator providing services on a fee based service.
For the operator selection, the following has has been established:• Shops built of concrete will be prioritized instead of wooden shops to secure
the equipment inside.
Battery charging station in Mozambique
30

• First come, first serve. The first operator who is able to pay the contribution of 50 % will be the beneficiary. (EnDev will pay the other 50%)
• Private operator will be sensitized about the proper use of the systems and the necessity of maintenance. (Heidtmann 2011)
2.3.3 Mali
A few f ac t s abou t Ma l i f rom Energypedia (Natascha 2011).:• Access to Electricity 17%, but in
urban areas is as high as 51%. • Electricity accounts for only 3 % of
Mali’s energy consumption.• Extreme poverty denies access to
modern energy services to much of the population.
Two different kinds of stations were constructed: a small system with the capacity to recharge 3 batteries per day (390 Wp) and a big one with the capacity of 6 batteries per day (780Wp). The system consists only on PV modules connected to the battery charger (Steca PL 2085).
Until 2009, 26 SBCS were constructed. The communities contributed with 10 to 20 % of the initial investment costs (in cash and in kind). The remaining 80 to 90 % was covered by EnDev funding. The SBCS are owned by the community and their operation is delegated to a private service provider, who runs them on a fee based service. The income generated from the SBCS is supposed to cover the maintenance and upgrade costs of all the installations (including key public buildings).
Key interventions in setting-up institutional framework by agreement on the management committee selection of the community, assignment of duties/ rights for operator and finally stakeholder supervision were established.
Options for autonomous up-scaling beyond the project boundary are limited; initial investment costs are high and largely subsidized; as setting up the fund for maintenance and repair already proves to be difficult, excess funds for up-scaling in this set up are unlikely (Natascha 2011).
2.3.4 Uganda and Tanzania
98% per cent of rural households in Tanzania lack access to electricity. The equivalent figure for Uganda is 96% (Collings 2011).
Sandra Chavez
31
Figure 9: BCS in Mali

The program Developing Energy Enterprises Project DEEP supports micro-businesses engaged in servicing the Energy needs of poor communities in Kenya, Tanzania and Uganda.The aim of the program is to strengthen the business practices of the participating entrepreneurs, support them in accessing small loans, and facilitate market linkages through information sharing and network building.
By June 2011 a total of 132 phone charging businesses were actively participating in the program - 78 of them in Tanzania, 28 in Kenya and 26 in Uganda.
Average system size is 50-80 Wp. Installations are generally performed by trained technicians but in a few cases by the owner himself. In almost all cases, the systems were paid for out of the owners’ savings or with support from other family members. Only one entrepreneur had taken a loan from a bank. In two cases the entrepreneur were using a battery which was recharged every few days from a charging station using grid electricity. Both of these entrepreneurs had purchased solar panels but these had been stolen before they could be installed. In one case, the business owner was using grid supply, with an inverter and battery providing back up when the grid was down.
From February to April 2011, a research was undertaken to better understand the marketing practices and challenges faced by a range of energy micro-businesses involved in the DEEP program. (Clough 2011)
The key findings from this study are as follows (Collings 2011):• Average price is 20 US cents per charge, which appears standard across the
region (informal agreement amongst phone charging businesses) • Customers charge their phone on average 3 times a week. • The phone charging services reported lots of competition- two of the six
said they had more than 7 competitors. • Entrepreneurs operating from their home also used the solar PV system for
lighting and TV.• There appears to be scope to expand into other phone accessories and
possibly solar lanterns. • Operators who ran grocery stores said the phone charging was more
profitable than the store.
2.3.5 Kenya
A few facts about Kenya (Loy 2011):• 75% of the population does not have access to electricity.• The average Kerosene consumption/month = 10 liters / household equivalent
to US$ 10 or more.• Heavy dependency on wood fuel and other biomass that account for 68% of
the total energy consumption (petroleum 22%, electricity 9%, others 1%)
Battery charging station in Mozambique
32

There are 2 different types of battery charging stations in Kenya, the UNIDO energy kiosks and the OSRAM energy hub.
UNIDO energy kiosk
A typical Kiosk of 10-30 kWp of solar power serves 1000 - 3000 households (5000-15000 inhabitants). Kerosene lamps are replaced by high efficient rechargeable LED lamps which need to be recharged once a week.500-1000 mobiles for 2000 homes are recharged on a 3 days basis and 50 car batteries are going to be recharged twice a month.
The cost for setting up a kiosk is around US$25,000 - US$150,000, this amount will be provided by UNIDO + donors. The energy kiosk remains property of the community.(Varaghese 2010)
The OSRAM energy hub
Alternative energy services for lighting, mobile phone charging and drinking water treatment for the rural fishing communities in Suba District – Kenya. Main emphasis of the project is to replace kerosene based lighting in households and fishing sector with efficient CFLs powered by batteries charged with solar energy, provided by Solar panels. (e.g. 42 Solarworld SW 220 panels with a performance of 220 Wp each).
O–Hub is equipped with:• A battery charging station for the O-box and battery powered lantern • A NOKIA mobile phone charging station • A water purification and sterilization plant with rainwater harvesting and collection System • A sales room, storage, and office.
Figure10 :Energy hub (left) O-Box with O-Lamp (right)Source: OSRAM Kenya
Sandra Chavez
33

O-Hubs are further leasing, sale and service points for OSRAM products based on renewable energy technologies, as well as a recycling and collection point for end-of-life products.
The reproduction of a standard installation allows taking advantage of economy of scale effects. So far 3 O-Hubs are operating in Suba District: Mbita Town, Sindo Town and Nyandiwa. (Mair 2010)
2.3.6 Rwanda
E.quinox is a non-profit, humanitarian project that aims to bring cost-effective, sustainable renewable energy to developing countries. Founded by students from different departments at the Imperial College in London equinox installed their first system in 2009.
Figure 11. Energy kiosk in Minazi, Rwanda 2010Source: E.quinox
The Energy Kiosk concept designed by E.quinox is centralized station for electricity generation to be consumed in a decentralized way via battery boxes3. The battery boxes are given to the customers against a small deposit as well as a payment for the recharge.
With the battery box lights and other small electronic devices, such as mobile phones, radios and shavers can be powered, because the electricity provided is already AC.
Regarding financing, E.quinox make 100% of the initial investment, and the community pay based on the monthly revenue. ideally the cost of the kiosk is recovered over a period of seven to ten years, and then, the systems will be handed over to the local governments or communities.
Battery charging station in Mozambique
34
3 Battery box is the integration of a battery plus an inverter with an over discharge protection circuit

The Energy Kiosks are managed by a single shopkeeper who has been trained to be able to sufficiently maintain the devices as well as competently manage our kiosks. Students from the Kigali Institute of Science and Technology (KIST), a local partner university, as well as the Belgian Technical Cooperation (BTC), conduct regular checks at our Rwandan kiosks. (e.quinox 2011)
2.4 Summary other BCS’s
From these examples it can be observed that other African countries share similar characteristics with Mozambique in the energy sector. There is no need to “re-invent the wheel”, for the design of a battery charging station the next points should be taken into account:
• Battery charging stations is a concept that is not restricted to only charge batteries; it is also possible to charge cellphones and lanterns.
• Flat rate per charge. In most of the cases the BCS operate under a “fix rate” payment per charge.
• Private operators are selected in the community to run the battery charging station. The desired characteristics of an operator is ownership of an existing shop, and capital to pay for the investment cost of the BCS and experience in sells and clients.
• Technical training for the operator. To assure a high performance of the BCS, its necessary to explain to the operator how the BCS works as well as basic troubleshooting information.
Sandra Chavez
35

3. Energy DemandThis chapter describes the present energy situation in Manica province, the energy services demanded as well as the current technologies used. A description of the monthly energy expenditures an average household is determined.
3.1 Energy demand in Mozambique
The battery charging station should respond to the energy service that people want. These conditions set the guidelines for an optimal design of battery charging stations.
Is important to know:• Monthly expenditure of people in energy related services• Potential willingness to pay for energy services and actual market prices• Electrical appliances that the people posses or can afford to buy
To respond to these questions a study from RWI in Mozambique (Gunther 2010) is used and complemented with a small survey that I personally performed.
3.2 RWI Baseline study GIZ Mozambique
In 2008, the Rheinisch-Westfälische Institut für Wirtschaftsforschung e. V. RWI Essen conducted the study “Energy usage and socio-economic conditions in Mozambique”. This study is a baseline survey for 2 electrification projects implemented by GIZ in Mozambique, Matola with grid densification component and Chua with pico micro hydro systems and maiz mill rehabilitation.
Since Chua is located in Manica the results of this baseline survey in the energy component will be used to describe the actual socio economical condition of the province. The relevant results from this questionnaire are:
21%
30%14%
13%
10%
12%Expenditures
Energy 12%Telecommunication 10%Housing 13%Schooling and Health 14%Food and water 30%Transport 21%
Monthly expenditures per household:-Energy = 170 Mt/month -Telecommunication = 140 Mt/month
Figure 12: Results RWI study Source: (Gunther 2010)
Battery charging station in Mozambique
36

Regarding the usage of traditional energy sources 5 categories are described in Table 7. For lighting there are 3 different options, candles, kerosene and torches, being candles the more popular and expensive solution.
Candles Kerosene Batteries for torches
Batteries for radio
Wood
% among all the households 82 51 11 45 92
Average monthly consumption 19 pieces 1.9 l 7.3 pieces 12.9 pieces 11.8
bunchesAverage monthly expenditures Mt 110 80 55 90 3
Table 7: Usage of traditional energy sourcesSource: RWI (Gunther 2010)
Table 7: Usage of traditional energy sourcesSource: RWI (Gunther 2010)
Table 7: Usage of traditional energy sourcesSource: RWI (Gunther 2010)
Table 7: Usage of traditional energy sourcesSource: RWI (Gunther 2010)
Table 7: Usage of traditional energy sourcesSource: RWI (Gunther 2010)
Table 7: Usage of traditional energy sourcesSource: RWI (Gunther 2010)
For those households that have access to electricity the most popular appliances are TV, Mobile phone and Radio. Figure 13 compares the results from RWI in Manica province with the values from the INE in rural Mozambique in share in % of the people interviewed. RWI states that the data from INE 2004 is outdated and this become evident for example in the % of cellphones.
Chua
Rural Mozambique*
0 20 40 60 8041
75
0,5
29
0,7
24
Electrical appliances (Share in %)
TVMobileRadio
* Data from the last household living conditions survey INE 2004 Figure 13: Electrical appliances RWI
Source: (Gunther 2010)
One of the limitations of this study is that the categories energy and telecommunication are not described and it is not possible to know what they include.
It can be assumed that energy category accounts for the energy for lighting and cooking, but the share of each is unclear. In the same way telecommunication category is confirmed by TV, Radio and Cell phone.
This study does not account for the expenses of charging cell phones, a common practice in rural Mozambique. To get an estimation of how much a household pays for charging its cellphone per month, a small survey was performed.
Sandra Chavez
37

3.3 Own data collection
With the aim to describe the monthly energy expenditures of the people in rural Manica, determined how much they pay for getting their cellphone charged, an alternative study was prepared. The idea was to interview households in 10 different rural communities of Manica province.
The interviews were conducted in Portuguese without a translator and they usually lasted 15 mins (the questionnaire in Portuguese and English can be found in the Appendix).
The households were selected randomly in Manica province in villages with the following characteristics:
• No connection to the national grid• Cell phone coverage• Road access
Due to time and resource limitations this study was not completed. At the end of my stay 15 households were interviewed in 2 different rural communities in Manica province, Vanduzi and Chimukono.
Being aware of the limitations of this study, especially the small sample size the main findings are summarized:
• People spend in average 40 Mt/month for getting their cell phone charged in a local shop. This amount corresponds to charging the cell phone once a week and paying the standard tariff of 10 Mt/service (which seems to be an informal agreement in the region).
• Torches powered with alkal ine batteries are the most popular lighting method. Such devices can be purchased in local shops for around 150-350 Mt and the set of two battery for a 8 Mt.
The monthly expenditure in energy can be complemented with the expenditure for cellphone charging. Then 170 Mt/month+ 40 Mt/month = 210 Mt/month.
Battery charging station in Mozambique
38
Figure 14: Vanduzi and Chimukono map Source: Google earth
Chimoio
Vanduzi
Chimukono

4. System designThis chapter provides a technical and economical analysis of the feasibility of battery charging stations in Manica province. It answers the question: “Are BCS technically and economically feasible in Mozambique?” For the technical part the energy losses and for the financial a cash flow and NPV analysis are performed.
As shown in chapter 2, there are many different configurations for battery charging stations with different sizes and powered by different energy sources, etc. Base on these options this study analyses :Option1: Solar business system SBSIs a SHS (120 Wp) plus PUE like charging cellphones, charging lanterns, barber shop , cinema4, etcOption 2: Solar battery charging station SBCSIs a solar stand alone system for starter battery chargingOption 3: Micro hydro power battery charging station MHP-BCS For starter battery charging
Two different options of solar system are presented:SBS-Smaller installation (120 Wp) for self consumption and PUESBCS-Battery charging station for starter battery charging 600 Wp.The goal with this is to determine which size of installation is more suitable for the local conditions in Manica province.
Finally, battery charging station powered by electricity from the mini grid of a pico/micro hydro power plant are specially interesting because Manica province has great pico/micro hydro power potential and some micro hydro power plants are being constructed in the next years.
The Table 8 presents a summary of the different setups from the technical and economics issues, as well as, operator and user perspectives.
Technical: Discuss the different size of the components and the electricity generated per each system. Unit potential for PUE and battery charging. Economics: Calculation of the NPV value of the different options after 10 years assuming the operator pays 100% of the investment cost and a discount rate of 15%.Operator: Service provided, self consumption and role from the operator. Costumer: Tariff paid for the services according to the maximum monthly expenditure in energy , as well as role and number of beneficiaries.
Sandra Chavez
39
4 Use a TV set to play a movie For more information refer to the section 4.1.2

SBS SBCS MHP+BCSTechnical
PV Module [Wp] 120 600 --Shortest Lifetime 3 years battery 3 years battery 3 years battery
Electricity [kWh/yr] 78 388 372
Maximum capacity units/week
42 Mobile phones42 haircuts
Play 1 movie9 batteries 7 batteries
Economics
Investment cost 26 664 Mt952 US$
129 300 Mt4 618 US$
47 340 Mt1 744 US$
Fee per service
Mobile:10 Mt/0.35 US$
Haircut:10 Mt/0.35 US$
Movie:5 Mt/ 0.17 US$
Battery50 Mt/charge
1.7 US$
Battery50 Mt/charge
1.7 US$
Estimated NPV 10 yrs [ Mt/US$]*
88 320 Mt3 150 US$
-149 834 Mt-5 350 US$
-47 138 Mt-1 680 US$
Operator
Personal consumption
Mobile phoneDC lightRadio
100 Wh/day
Mobile phoneDC lightRadio
100 Wh/day
Mobile phoneDC lightRadio
100 Wh/day
Service offeredMobile phonesBarber shop
CinemaLead acid starter batteries charging
Lead acid starter batteries charging
Operator roleCharge cellphones.
Cut hair in the barber shop.Get DVD Movie´s.
Management of the BCSCharge the batteries
Replacement of the batteriesMaintenance of the batteries: Clean the poles
Management of the BCSCharge the batteries
Replacement of the batteriesMaintenance of the batteries: Clean the poles
CostumerCost for the costumer
2.7 Mt/Wh0.1 US$/Wh
0.09 Mt/Wh 0.003 US$/Wh
0.09 Mt/Wh0.003 US$/Wh
Balance price (NPV=0)
0.40 Mt/Wh 0.015 US$/Wh
0.16 Mt/Wh0.005 US$/Wh
Role Bring his mobile and charger. Take care and return the battery. Take care and return the battery.
Beneficiaries** hh/EnDev 50/1 10/7 8/5
*See sensitivity analysis of the NPV in the section 5. ** Beneficiaries hh= total number vs EnDev= applying counting rules from Table 4.
Table 8: Different options for battery charging
*See sensitivity analysis of the NPV in the section 5. ** Beneficiaries hh= total number vs EnDev= applying counting rules from Table 4.
Table 8: Different options for battery charging
*See sensitivity analysis of the NPV in the section 5. ** Beneficiaries hh= total number vs EnDev= applying counting rules from Table 4.
Table 8: Different options for battery charging
*See sensitivity analysis of the NPV in the section 5. ** Beneficiaries hh= total number vs EnDev= applying counting rules from Table 4.
Table 8: Different options for battery charging
Battery charging station in Mozambique
40

4.1 Options description
The options presented offer different energy service levels from minimum to basic and therefore are not directly comparable . The aim of this analysis is to show three different options for providing access to modern energy services to the people in the rural areas in Mozambique.
Two different size solar system are compared, one is for low energy consumption applications such cell phone charging (SBS) and the second one is for battery charging (SBCS).Two different options for battery charging are compared, one powered by solar energy and the other by electricity from a micro hydro power plant.
In all the cases the same amount of energy is assumed to be self-consumed by the operator to cover his own needs.
4.1.1 Solar business system SBS
Is a “household size” solar home system (120 Wp) which allows the user to perform productive use of electricity PUE.
This system will cover the basic energy self consumption of the operator (Light, Radio and cell phone charging) plus a day operated low power productive use of electricity, this includes:• Cell phone charging, increasing demand for the service in remote areas. Use a
conventional AC charger or if possible operate a DC charger, similar to the one that is used in car chargers (DC-DC converter).
• Barber shop, it has been reported that the people need to travel to big cities to get a haircut, using a conventional electric shaver a barber shop can be started.
• Cinema, use a TV and a DVD to play movies. Then users would pay per movie like in the cinema.
Inverter*BCC
personal consumption
Charging CostumerCellphonechargingPVCostumerBarber shopCinema
Battery
* Ideally use DC appliances to avoid the use of an inverter.Figure 15: SHS + PUE setup
Sandra Chavez
41

In Mozambique solar components are very expensive and therefore they are hard to afford for average households. By including productive use of electricity an extra source of income would help them to pay for the system.
Battery charger configuration
The options are either to connect the battery of the solar home system and the battery to be rented to the same battery charge controller or to have a separate battery charger for each battery;.
EnDev Mali BCS utilized the battery charger from Steca PL 2085. This charge controller is specially design to charge independently eight different batteries at the same time. Technically the experience of this battery charger was satisfactory. Unfortunately this model is discontinued. From the retailers components list a similar charge controller from Steca of 20 A can be purchased in S&S Beria for 15000 Mt.
The recommendation is to have a charge controller able to charge more than one batteries in parallel, as shown in Figure 16:
Battery 1 (rent)
Battery 2 (rent)
Battery n (rent)
Battery private
BCC* special battery charger for multiple battery charging in parallel Steca PL2085
BCC*
Personal consumption 100 Wh/day
Inverter
PV module600 Wp
Figure 16: Battery charge controller in the SHS for PUESource: (Holtrof 2012)
4.1.2 Solar battery charging station SBCS
The main purpose of this installation is to charge starter batteries, conventional lead acid car batteries.The installation is a solar stand alone system big enough to generate energy to charge batteries and to cover the operators own electricity needs.
The fully charged batteries are going to be rented to the costumer for a fixed fee per charge. Additionally a deposit for the battery will be paid and a contract signed.
Battery charging station in Mozambique
42

The advantages of the operator owned batteries are:• Batteries will be complemented with an over discharge protection circuit and
a safety box. • Batteries can be collected at the end of the lifetime and recycled. Potentially
a battery manufacturer could offset the price of the empty battery when buying a new battery (For example, battery world Zimbabwe).
• Batteries will be the same model and will be operated under similar conditions. It is more likely they will provide a similar energy service than when different batteries are charged.
The disadvantages are: ✘ High investment cost. ✘ Costumers don't take care of the battery. ✘ Battery stealing.
4.1.3 MHP batteries charging station
From the electricity produced in micro hydro power plant a battery charging station can be operated. Directly connecting an AC battery charger batteries can be charged.
The operator of the battery charging station would pay a monthly fee to the operator of the MHPP. Then the investment cost is lower but the operational cost is higher compared with the solar operated battery charging station.
This battery charging station is the same concept as the solar battery charging station, regarding the business operational model of the batteries, the operator of the charging station owns the batteries and rents them to the costumers.
Figure 17: MHP Battery charging stationSource: (Hermann 2006)
Sandra Chavez
43

4.2 Technical issues
Battery charging systems will be optimized to meet the load requirements of the self consumption and the productive use of electricity at the lowest price possible. A comprehensive analysis of the components is performed, as a result a recommendation of the optimal size of each system to balance the capacity and the potential share of productive use of electricity is given.
Special attention is given to batteries, different technologies, charging and discharging process and recommendation for the operation are covered in this section.
4.2.1 Battery: Terminology and Definitions
A compendium of relevant battery definitions for this study is presented (Dunlop 1997):
Ampere-Hour (Ah): Is a common unit of measurement for a battery’s electrical storage capacity, obtained by integrating the discharge current in amperes over a specific time period. For example, a battery which delivers 5-amps for 20-hours delivered 100 ampere-hours.
Capacity: A measure of a battery’s ability to store or deliver electrical energy, commonly expressed in units of ampere-hours. Capacity is generally specified at a specific discharge rate. The capacity of a battery depends on several design factors including: the quantity of active material, design and physical dimensions of the plates, and the electrolyte specific gravity.
Operational factors affecting capacity include: the discharge rate, depth of discharge DOD, cut off voltage, temperature, age and cycle history of the battery.
Depth of Discharge (DOD): The percentage of capacity that has been withdrawn from a battery compared to the total fully charged capacity. When the battery is full the DOD is 0 and when empty the DOD is 100%.
State of Charge (SOC): The amount of energy in a battery, expressed as a percentage of the energy stored in a fully charged battery. Discharging a battery results in a decrease in state of charge, while charging results in an increase in state of charge.
Secondary batteries: Are the so called rechargeable batteries, the most common types are Lead Acid batteries, Lithium ion and Nickel metal batteries.
Battery charging station in Mozambique
44

4.2.2 Lead acid batteriesCan be found in rural electrification projects, automobile and other vehicles.Lead acid batteries can be classified as deep cycle or shallow cycle. (Alliance for Rural Electrification)
Deep Cycle batteries Designed to be operated at different SOC during long periods of time, therefore these should be considered for off-grid applications. These batteries are designed to provide energy to the systems during the night or on cloudy days.
Shallow Cycle Batteries designed for power applications, give a lot of energy in a short period of time. Also referred to as automotive batteries, are not appropriate for renewable energy applications.
A 12-Volt flooded lead acid deep cycle battery can be cycled approximately 600 times at 50% depth of discharge (DOD) at 25 C. Under the same conditions a shallow cycle battery (FLA, AGM or GEL) may last only 100 – 150 cycles.
Shallow cycling batteries are unfortunately often selected for their initial low prices, but are actually not cost-effective as their life term is much shorter and need to be regularly replaced. In addition, they are not really safe as when a battery reaches the end of its life suddenly, they are prone to shorting cells, which may lead to severe system damage.
Comparing the cost per cycle, deep cycle batteries have a much lower cost than the one of automotive batteries, unfortunately in the market in Mozambique is difficult to find deep cycle batteries.
4.2.3 Lithium ion batteries
Can be found in Pico PV systems, cellphones and consumer electronics. The nominal voltage of an individual Li-ion cell varies between 3.2V and 3.8V, depending on the choice of the cathode material. When the battery is being charged, the Lithium atoms in the cathode become ions and migrate through the electrolyte toward the carbon anode where the combine with external electrons and are deposited between carbon layers as lithium atoms. This process is reversed during discharge by applying a current.
The main advantages of Li-ion batteries are: ✔ High energy density ✔ High efficiency (near 100%) ✔ Long cycle life (>3,000 cycles at 80% DOD)
Sandra Chavez
45
✔ Low self discharge✔ No memory effect ✔ SOC & SOH indication. (Alliance for Rural Electrification)✘ The main disadvantage is the high cost.
A very promising type of Li-ion battery the lithium iron phosphate (LiFePO4) battery. This battery uses LiFePO4 as a cathode material, hence its name. The main advantage is a longer cycle life. This type of batteries can be found for example in products from Fosera.
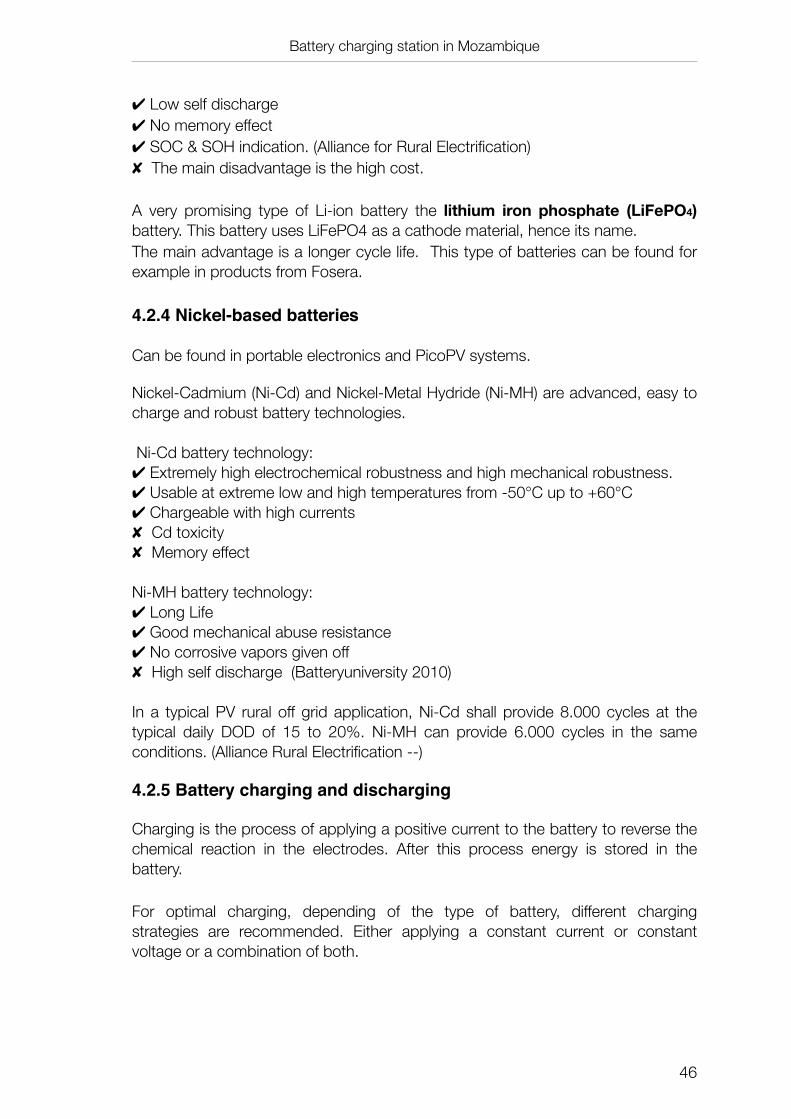
4.2.4 Nickel-based batteries
Can be found in portable electronics and PicoPV systems.
Nickel-Cadmium (Ni-Cd) and Nickel-Metal Hydride (Ni-MH) are advanced, easy to charge and robust battery technologies.
Ni-Cd battery technology:✔ Extremely high electrochemical robustness and high mechanical robustness.✔ Usable at extreme low and high temperatures from -50°C up to +60°C✔ Chargeable with high currents✘ Cd toxicity✘ Memory effect
Ni-MH battery technology:✔ Long Life ✔ Good mechanical abuse resistance✔ No corrosive vapors given off✘ High self discharge (Batteryuniversity 2010)
In a typical PV rural off grid application, Ni-Cd shall provide 8.000 cycles at the typical daily DOD of 15 to 20%. Ni-MH can provide 6.000 cycles in the same conditions. (Alliance Rural Electrification --)
4.2.5 Battery charging and discharging
Charging is the process of applying a positive current to the battery to reverse the chemical reaction in the electrodes. After this process energy is stored in the battery.
For optimal charging, depending of the type of battery, different charging strategies are recommended. Either applying a constant current or constant voltage or a combination of both.
Battery charging station in Mozambique
46

The charge controller selects the strategy that will optimize the charging process, maintaining the battery at the highest possible state of charge (SOC) and protecting it from deep discharge and overcharge.
The charging process is not 100% efficient, more energy needs to be put in the system than can be stored. The next table indicates the efficiency of the most common types of batteries in this field:
Battery type Charging efficiencyLead Acid 0.9
Li-ion 0.9NiMH 0.75NiCd 0.75
Table 9: Charging efficienciesSource: (LigthingAfrica 2010)Table 9: Charging efficienciesSource: (LigthingAfrica 2010)
For the design of a battery charging station its is necessary to know the real energy needed to charge a standard cell phone, solar lantern (Pico PV) and starter batteries.
The energy in the battery can be calculated as the product of the voltage and the capacity (LigthingAfrica 2010).
Energy battery (Wh)=Voltage (V)*Capacity (Ah)
For calculating the energy necessary for charging, the energy in the battery is divided by the charging efficiency (Table 9):
Energy charging =Energy battery
ηbattery
Energy charging = Voltage (V)*Capacity (Ah)ηbattery
The next table presents the energy required for charging the relevant appliances for this study:
[V] [Ah] Type of battery
Energy charging
[Wh]Cell phone 3,60 1 Li-ion 4Small battery 12 7 Lead acid 95Battery 70 Ah 12 70 Lead acid 933Battery 100 Ah 12 100 Lead acid 1335
Table 10: Calculation energy required for charging Table 10: Calculation energy required for charging Table 10: Calculation energy required for charging Table 10: Calculation energy required for charging Table 10: Calculation energy required for charging
Sandra Chavez
47

Battery discharging
Discharging is the reverse process of charging, is the process when a battery delivers current.
Depending on the amount and type of devices connected different currents are generated. The faster the energy is drawn, or in other words, the higher the discharge current the smaller the amount of energy available from the battery.
This discharge ratio, also known as C rate, is expressed as a ratio of the nominal battery capacity to the discharge time period in hours. For example, a 4 A discharge for a nominal 100 Ah battery would be considered a C/20 discharge rate. (James P. Dunlop 1997).
4.2.6 Battery & battery charging stations
In the charging station 2 and in some cases 3 different types of batteries can be found:
• Battery of the solar home system, Lead acid if possible solar 70 Ah and 12V,• Battery from cellphones, Li-ion 1-4 Ah • Battery to rented to the costumer, Lead acid starter battery 70 Ah and 12 V
The battery in the SHS is protected with the battery charge controller. This will optimize the charge and discharge process and try to extend their lifetime of the battery as much as possible.(IEA 2011)
Charge controllers normally provide information about the system’s performance through LEDs or/and LCD displays for simple models, and sound signals. The end-user should be trained to understand this information(Alliance for Rural Electrification)
Cellphones and lanterns already include the electronics circuits to protect the battery from overcharge and over discharge, and have a very intuitive display that shows the SOC of the battery in a graphic way.
In the case of the battery rented to the costumer an extra electronic circuit needs to be added to protect the battery and extend the lifetime . Starter batteries are designed for high power applications and not very deep discharge. Deep discharging batteries leads to irreversible damage which reduces their lifetime. In the case of lead acid batteries discharging under 20% SOC leads inevitably to a considerably reduced battery lifetime (Hermann 2006).
For this reasons the batteries need to be protected with a special electronic circuit attached to the top of the battery. This will not only protect the battery for deep
Battery charging station in Mozambique
48

discharge and but also will restrict the access to the battery pole from the user (Adelmann 2010).
Figure 18:Diagram of the battery in the case with over discharge protectionSource: (Hermann 2006)
The capacity level of a battery can easily be approximated by measuring the battery voltage at the terminals. If the voltage falls below a predefined level all consumers are automatically disconnected by a relay. (Hermann 2006) This is a low cost deep discharge protection system, more sophisticated charge controllers can be attached but the technological feasibility needs to be considered. This circuit will be attached to the battery by the BCS operator. The battery and the electronic controller will be contained in a sealed case that will also protect the user from any leakage or short circuit with the poles.
Battery
Protection case
Electronic circuit
Figure 19: Battery box
Is necessary to raise awareness in the community about the importance of the over discharge protection. Nowadays batteries are completely drawn out and since the electronic circuit will regulate that the battery does not go under 80% DOD, it is not hard to think that the costumers will try to remove the charge controller to obtain more energy from the battery.
Sandra Chavez
49

The following list present concrete recommendations for handing lead acid batteries:
General• Keep the battery a cool well ventilated place, never in the sun.• Use a battery charge controller.• Never store the battery empty, charge as frequently as possible.• Transport carefully.
For charging• Allow fully saturated charge in the lead acid battery .
For discharging• Don’t cycle in a low SOC• Avoid deep discharge using additional electronic circuits.
4.2.7 Solar powered systems
The options: SBS and SBCS are stand alone systems, whose main components are:
Solar panels: collect sunlight and convert it into electricity.Battery Charge Controller: controls battery overcharging and deep discharging protecting it and guaranteeing longevity. At the same time it protects the load against high and low voltages. Batteries: store energy for later use. In a SBCS is important to differentiatethe battery from the SHS with the battery rented to the costumers.Inverter: convert the energy from DC to AC5.Loads: are the final user of the energy that is produced.
For the operation of this systems it is necessary to differentiate between the energy demand in during the day and during the night.
DAY: PV modules produce electricity (battery charging); this is distributed among the battery and the load by the battery charge controller. The load during the day is mainly the electricity required for PUE. A small amount is used for self consumption in the shop, for example a radio.
NIGHT: the battery is the source of energy for the shop (battery discharging). Then the load is mainly self consumption (lights, radio, TV). Just in case of a very high demand is recommended to charge devices at night.
Battery charging station in Mozambique
50
5 Ideally the system would operate with DC appliances. It depends on the availability of DC devices in rural Mozambique.
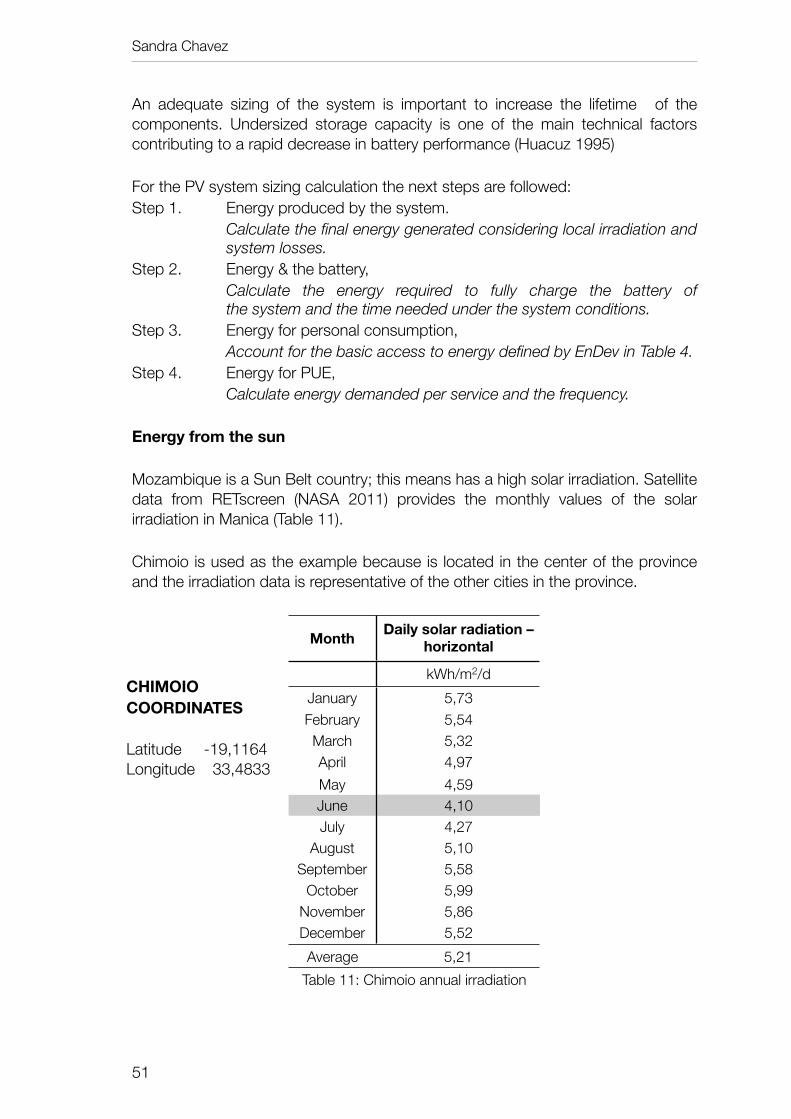
An adequate sizing of the system is important to increase the lifetime of the components. Undersized storage capacity is one of the main technical factors contributing to a rapid decrease in battery performance (Huacuz 1995)
For the PV system sizing calculation the next steps are followed:Step 1. Energy produced by the system. Calculate the final energy generated considering local irradiation and system losses.Step 2. Energy & the battery, Calculate the energy required to fully charge the battery of the system and the time needed under the system conditions.Step 3. Energy for personal consumption, Account for the basic access to energy defined by EnDev in Table 4.Step 4. Energy for PUE, Calculate energy demanded per service and the frequency.
Energy from the sun
Mozambique is a Sun Belt country; this means has a high solar irradiation. Satellite data from RETscreen (NASA 2011) provides the monthly values of the solar irradiation in Manica (Table 11).
Chimoio is used as the example because is located in the center of the province and the irradiation data is representative of the other cities in the province.
Month Daily solar radiation – horizontal
kWh/m2/dJanuary 5,73February 5,54March 5,32April 4,97May 4,59June 4,10July 4,27
August 5,10September 5,58
October 5,99November 5,86December 5,52Average 5,21
Table 11: Chimoio annual irradiationTable 11: Chimoio annual irradiation
Sandra Chavez
51
CHIMOIOCOORDINATES Latitude -19,1164 Longitude 33,4833

This is the energy input received by a PV module in Chimoio, but not all of this energy can be converted into electricity, there are several losses in the components.
A qualitative analysis in a Sankey diagram shows the energy conversion flow from the PV module to the electricity outlet:
Figure 20: Qualitative analysis-Energy flow
PV modules have a rated power determined according to standard test conditions, 1000 W/m2 and 25ºC. Every time these conditions are not met, the output energy from the PV module is different and the efficiency is than @STC.
This is consider in the PV losses the energy is calculated as follows:
EnergySTC = (Installed capacity Wp)(1000 W/m2 )
*(Solar radiation kWh/m2 / day)
The output from the PV module is DC electricity, which is transported-stored-converted into AC in the rest of the system. During this process there are several types of losses (BCC, Inverter, cables and battery).
A factor that accounts for the losses mentioned in Table 12 is added to the formula.
EnergySHS= (Installed capacity Wp)(1000 W/m2 )
*(Solar radiation kWh/m2 / day)*ηsub−system
Battery charging station in Mozambique
52

Component EfficiencyDeviation factor from STC efficiency 90%Cables and connectors 90%Battery* 70%Inverter 70%BCC 90%OVERALL (Subsystem) 34%*Product from charging efficiency, discharging efficiency
and factor accounting for the aging of the battery.*Product from charging efficiency, discharging efficiency
and factor accounting for the aging of the battery.
Table 12: Efficiencies of the SHS componentsTable 12: Efficiencies of the SHS components
Another possibility for the system is to operate it in DC instead of having an inverter. For lighting and cell phone charging DC equipment is relative available in the market in Mozambique, but in the case of TV and DVD a deeper research needs to be done. It is recommended to operate this system only with DC, in this case the efficiency will rise to 50%.
4.2.8 Technical analysis SBS
To simplify the implementation process it is considered that all the components for the SHS are bought in one shop. It is necessary to select one retailer, and from his list of products offered set up a SHS. The next step is to evaluate how the components interact together, detect the “bottle necks”. and possibly replace this components for better suitable components from other retailers. At the end a list of the recommended components, with the size and retailer, is given.
From the list of the Solarmoz partners, Savon trading was selected because it is located in the center of Manica province in Chimoio, and has a reasonable prices (average compared with retailers is Beria and Muxungue).
For practicality all the components for setting up a battery charging station are assumed to be purchased in Savon trading, Chimoio. This will reduce the complications of dealing with many retailers and will facilitate the transportation of the components to the place.
The next table shows the characteristic of the products that Savon trading offers: Specification Brand
PV module 120 Wp ProstarBattery 100 Ah ProstarInverter 500 W ProstarBCC 10 A PhocosTable 13: Components offered by Savon trading
Source: SolarMoz (João Junior 2011)Table 13: Components offered by Savon trading
Source: SolarMoz (João Junior 2011)Table 13: Components offered by Savon trading
Source: SolarMoz (João Junior 2011)
Sandra Chavez
53

By following the 4 steps proposed in the section 4.2.8 the system is sized.Step 1: Energy produced by the system.Assumptions-Solar irradiance in Chimoio (Average) =5.21 kWh/m2/day-Solar irradiance in Chimoio (June) =4.1 kWh/m2/day-Size of the PV generator (Wp)= 120 Wp
Energy SHS = (Installed capacity Wp)(1000 W/m2 )
*(Irradiance kWh/m2day)*ηsub−system
Energy SHS =120 Wp
1000 W/m2 *5,21 kWh/ m2day*0,34
Rounding the results:Energy SHS =200 Wh/day (AVERAGE)Energy SHS =160 Wh/day (JUNE)
The size of the PV generator can be increased in multiples of the size of the panels 120 Wp. For this calculation a single module of 120 Wp will be used. The bigger the capacity installed the bigger the energy that can be harnessed, but we cannot increase the size the system indefinitely, the system should be just big enough to cover the energy demand for charging cellphones.
Step 2: Energy & the battery The battery offered by Savon trading is a 12 V and 100 Ah lead acid battery, with:
Energy battery (Wh)=Voltage (V)*Current (A)*time (hrs)Energy battery =12V*100 Ah=1200 Wh
Energy charging =1200Wh0.9
=1335 Wh
With the 120 Wp panel 200 Wh of energy can be harness in one average day, then it will take 6.6-8.3 days to fully charge the battery.
Charging timeAverage= 1335 Wh200 Wh/day
=6.6 days
Charging timeJune= 1335 Wh160 Wh/day
= 8.3 days
Battery charging station in Mozambique
54

Daily charging of the battery, operational SOC, is perhaps the most important factor influencing longevity. A common mistake while designing renewable energy systems is to select a battery that never reaches a full SOC on a regular basis, this shortens the battery life. (Alliance for Rural Electrification)Having a smaller battery it can be charged faster by the system, for example a 70 Ah6, then:
Energybattery =12 V*70 Ah0.9
= 933 Wh
Rounding up the number counting for a low state of heath of the battery, 1 KWh is needed to fully charge a 70 Wh battery.
Charging time= 1000 Wh200 Wh/day
=5 days
With the 120 Wp panel it will take 5 days to fully charge the battery instead of 6.6 days with the 100 Ah battery. It is better to have a smaller battery that is not only faster to charge but also cheaper, and when it is time to replace it this is an advantage.
There should be a balance between the load demand and the charging capacity to try to maintain the battery at a high SOC.
Step 3: Energy for self consumptionEnDev define a BASIC access to energy, as when a household is provided with 50 kWh/yr, which is equal to 136 Wh/day. Factoring in 25% for losses and rounding off this value 100 Wh/day. For this study it is assumed that 100 Wh/day is the operator self electricity consumption.
One possible combination to consume this 100 Wh/day is: [hrs/day] [W] [Wh/day]
Light 5 11 55Mobile 1 2 2Radio 6 5 30
Table 14: Proposal consumption of 100 Wh/dayTable 14: Proposal consumption of 100 Wh/dayTable 14: Proposal consumption of 100 Wh/dayTable 14: Proposal consumption of 100 Wh/day By multiplying the [hrs/day]*[W] of each row and then add them all together the total energy demand is calculated.
Step 4. Energy for PUEFrom the daily energy production the energy for self consumption is subtracted and the remaining energy is the energy available for PUE.
Sandra Chavez
55
6 Can be purchased in ARS Maxixe

Energy available for charging =200 Wh-100 Wh=100 Wh/day
The suggested options for PUE are cell phone charging, barber shop and cinema.
Cell phone charging, Cellphones are brought by the users, there are some different models but in general most of them are small simple cellphones, Nokia or Samsung, black and white with lithium ion batteries.
Energy charging = Voltage (V)*Capacity (Ah)ηbattery
Energy charging = 3.6V *1Ah0.9
= 4Wh
Barber shop, the commercial electric shavers have relative small power consumption, 10 W (Wahlglobal). Assuming it takes 20 mins to complete one haircut, and that the AC electric shaver operates with an efficiency of 90% then the energy needed is for one haircut is:
Energyhaircut =10 W*0.33 hr
0.9= 4 Wh
Cinema, with TV and a DVD a movie can be played, and a fee per person attending to the function is charged.
The energy demanded to play a movie is: [hrs/day] [W] [Wh/day] CommentTV 2,5 100 250 CRT 19 inches (Bluejay 2011)DVD 2,5 20 50 Average DVD player (LBNL 2012)TOTALTOTALTOTAL 300
Table 15: Energy demand to play one movieTable 15: Energy demand to play one movieTable 15: Energy demand to play one movieTable 15: Energy demand to play one movieTable 15: Energy demand to play one movie More energy that the one produced during one day by the SHS is required to play a Movie, therefore this extra energy is drawn from the battery. The question is if the 70 Ah battery is able to give this energy and recover a 100% SOC before the next movie is played?
The load demand for a week is calculated and the theoretical SOC of the battery estimated if only one movie is played per week.
From the 100 Wh destined for productive use, is proposed that 50 Wh are use to Cell phone charging and the Barber shop and the remaining 50 Wh for the Cinema.
Battery charging station in Mozambique
56
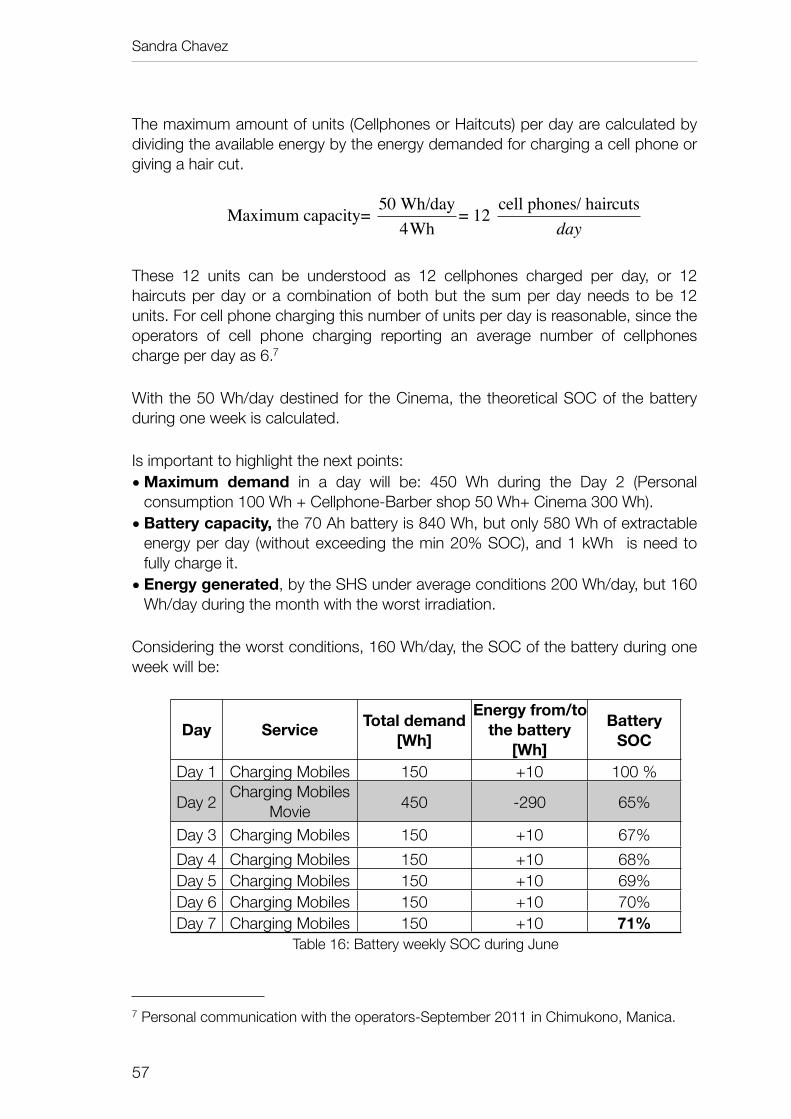
The maximum amount of units (Cellphones or Haitcuts) per day are calculated by dividing the available energy by the energy demanded for charging a cell phone or giving a hair cut.
Maximum capacity= 50 Wh/day4Wh
= 12 cell phones/ haircutsday
These 12 units can be understood as 12 cellphones charged per day, or 12 haircuts per day or a combination of both but the sum per day needs to be 12 units. For cell phone charging this number of units per day is reasonable, since the operators of cell phone charging reporting an average number of cellphones charge per day as 6.7
With the 50 Wh/day destined for the Cinema, the theoretical SOC of the battery during one week is calculated.
Is important to highlight the next points:• Maximum demand in a day will be: 450 Wh during the Day 2 (Personal
consumption 100 Wh + Cellphone-Barber shop 50 Wh+ Cinema 300 Wh). • Battery capacity, the 70 Ah battery is 840 Wh, but only 580 Wh of extractable
energy per day (without exceeding the min 20% SOC), and 1 kWh is need to fully charge it.
• Energy generated, by the SHS under average conditions 200 Wh/day, but 160 Wh/day during the month with the worst irradiation.
Considering the worst conditions, 160 Wh/day, the SOC of the battery during one week will be:
Day Service Total demand[Wh]
Energy from/to the battery
[Wh]
Battery SOC
Day 1 Charging Mobiles 150 +10 100 %
Day 2 Charging MobilesMovie 450 -290 65%
Day 3 Charging Mobiles 150 +10 67%Day 4 Charging Mobiles 150 +10 68%Day 5 Charging Mobiles 150 +10 69%Day 6 Charging Mobiles 150 +10 70%Day 7 Charging Mobiles 150 +10 71%
Table 16: Battery weekly SOC during JuneTable 16: Battery weekly SOC during JuneTable 16: Battery weekly SOC during JuneTable 16: Battery weekly SOC during JuneTable 16: Battery weekly SOC during June
Sandra Chavez
57
7 Personal communication with the operators-September 2011 in Chimukono, Manica.

Playing one movie per week considering the worst month irradiation conditions does not allow the battery to recover to 100% SOC before the next movie is played, resulting that every week the battery is going to be cycling at lower state of charge. Nevertheless, this occurs on the month with the worst irradiation, if the average energy production is considered to be, 200 Wh, the battery could recover 100 SOC within a week.
The simplest solution is to get a TV which consumes less than 100 W, which is possible. Another solution is to get a bigger system, not only a bigger battery but also increase the PV installed capacity. From the original list of components from Savon trading the next modifications have been done,
• Battery: Is preferred to have a 70 Wh battery, offered by the retailer in Maxixe. Raylite battery is a car lead acid battery not appropriate for deep cycles and low currents. Is recommended to have a deep cycle battery, but for the moment these batteries are not available with the Solarmoz retailers.(Raylite)
• Inverter: A bigger inverter accounts for a bigger self consumption, which is crucial in small off grid systems like this. The maximum power demand is 150 W, much lower than 500 W, as a rule of thumb the inverter should to be at least 20% bigger than the calculated power requirement. An inverter bigger than 180 W is appropriate for example the 350 W offered by ARS Muxungue.
The final list of the equipment for the SHS for productive use of energy is:Specification Brand
PV module 120 Wp ProstarBattery 70 Ah RayliteInverter 350 W UniversalBCC 10 A PhocosTable 17: Recommendation of components for the SHS
Source: Solarmoz (João Junior 2011) Table 17: Recommendation of components for the SHS
Source: Solarmoz (João Junior 2011) Table 17: Recommendation of components for the SHS
Source: Solarmoz (João Junior 2011)
It can be concluded that despite of the convenience to buy all the components from one supplier, it is recommended to get the components from different suppliers according to the specifications from table 17.
4.2.9 Technical analysis SBCS
In this case a solar system will be used to charge lead acid batteries that are going to be rented to the costumers, refer to figure 16.
Step 1. Energy produced by the system
Battery charging station in Mozambique
58

To directly compare the solar battery charging station with the micro hydro one the same amount of electricity needs to be provided. The tariff chosen is 31 kWh/month, which is equivalent to 1 kWh/day.
To generate this energy the size of the PV module is calculated under the worst conditions (June).
Energy SHS = (Installed capacity Wp)(1000 W/m2 )
*(Irradiance kWh/m2day)*ηsub−system
1 kWh/day= ( X * 120 Wp)(1000 W/m2 )
*(4.1 kWh/m2day)*0.49 (June)
A PV generator of 600 Wp is needed, which can be build out of 5 modules of 120 Wp each. All the other components, battery, inverter, and BCC are the same as in the SHS for PUE.
Step 2: Energy & the battery Battery of the system used for self consumption of the operator. As in the case of the SBS, the system would have a 70 Ah battery:
Energybattery =12V*70 Ah0.9
= 933 Wh
Rounding up the number counting for a low state of heath of the battery, 1 KWh is needed to fully charge a 70 Wh battery. The next step is to calculate the time needed to fully charge the battery with the energy from the system:
Charging time= 1000 Wh1000 Wh/day
= 1 day
This charging time is acceptable, then the 70 Ah battery is acceptable for the system.
The next table shows the list of the components recommended for setting up a battery charging station powered by solar energy. The main difference with the system for PUE is the size of the PV generator and the extra charge controller for the batteries to be rented.
Specification BrandPV module 600 Wp ProstarBattery 70 Ah RayliteInverter 350 W UniversalBCC (battery rent) 20 A Steca
Table 18: Recommendation of components for the SBCSSource: Solarmoz (João Junior 2011)
Table 18: Recommendation of components for the SBCSSource: Solarmoz (João Junior 2011)
Table 18: Recommendation of components for the SBCSSource: Solarmoz (João Junior 2011)
Sandra Chavez
59

Step 3: Energy for self consumption
The same as in the SBS, 100 Wh/day are considered for electricity self consumption. Refer to step 3 of the section 4.2.8 for further information.
Step 4: Energy for PUE
From the initial 31 kWh/month, 93% of the energy is used for battery charging. This is equivalent to 29 kWh/month, with this energy the number of batteries charged per month is determined by:
EnergyforPUE = #batteries *Ebattery *Frequencych arg e
#batteries =EnergyforPUE
Ebattery *Frequencych arg e
#batteries = 29(kWh / month)X(kWh / charge)*Y (charges / month)
-Calculation energy to charge one battery (kWh/charge)The energy to needed to fully charge one battery is about 1 kWh.In this case because an electronic circuit installed in the battery will limit the discharge to a maximum of 80% DOD (Alliance for Rural Electrification).
Also the efficiency of the charger used is considered. Similar to battery charger from BCS in Mali, Steca PL 2085, is used. The efficiency of this battery charger is 90%.
Energycharging-SBCS =1 kWh *DODηch arg er
Energycharging-SBCS =1kWh/batt*0.80.9
Energycharging-SBCS =880 Wh
-Calculation of the charging frequency (charges/month) This is determined the available energy from the battery and the energy daily energy demand.
Frequencybattery (charges / month) =Energy(kWh / day) * (30day / month)Energybatt _ available(kWh / charge)
From the rated capacity of the battery only a fraction of this energy can be used, the discharging process has an efficiency of 86% (LigthingAfrica 2010).
Battery charging station in Mozambique
60

The maximum DOD is 80%.The energy available for a 70 Ah lead acid battery is:
Energybatt available =Capacity (Ah)*U(V)*ηdisch arg e*DODEnergybatt available =70 Ah*12V*0.86*0.8 DODEnergybatt available =578 Wh
This will happen only during a couple of cycles. When the battery is new the capacity is lower and need some cycles to reach the nominal capacity (formatting), then the peak stage (when this capacity is reached) and finally a gradual decay occurs, due to aging effects (Batteryuniversity 2010). For a normal household a consumption of 100 Wh/day is considered as a basic access to energy (Raabe 2011).
Frequencybattery =100(kWh / day) * (30day / month)
578(kWh / charge)Frequencybattery = 5(charges / month)
Comparing this result with the experience of the battery charging stations installed Mali by EnDev, the system was designed for a charging frequency of 2 weeks (Raabe Tim 2010). After a couple of months of operation and evaluation of the performance reported that the BCS have also low frequentation rate (SARL 2011).
To correct for the low frequentation rate a factor of 0.8 is added.
Frequencybattery =100(kWh / day) * (30day / month)
578(kWh / charge)* 0.8
Frequencybattery = 4charges / month
The charging frequency is assumed to be one week (4 charges/month), another reason why the charging frequency is not assumed less is for optimization reasons of the battery performance. Leaving the battery at a low SOC for long periods damages the battery, therefore it is recommend to take as soon as possible an empty battery to the charging station and recharge it as soon as possible. Substituting the values the maximum number of batteries charged by the system is calculated:
#batteries = 29(kWh / month)880(kWh / charge) * 4(charges / month)
= 9 batteries
Sandra Chavez
61

From the experience of the BCS in Mali it is known that it is difficult to estimate a reliable charging frequency (SARL 2011). This may be a complication for the operator because he will need to have more than 9 batteries to compensate for the people that do not return the battery on time, also a penalization fee for not retuning the battery on time will be considered.
4.2.10 Technical analysis MHPP-BCS
Micro hydro power stations deliver a constant electricity supply which is distributed in a local mini grid. During the night the energy is used for lighting but during the day something needs to consume this energy. Charging batteries is a solution not only because it can store the energy during the day but also because it helps to bring access to modern energy services to the people that are not connected to the mini grid.
MHPPMini grid
AC battery charger Battery
Figure 21: Micro hydro battery charging station
A micro hydro battery charging station will use electricity from the mini grid to charge batteries with a battery charger. The function of the battery charger is to convert the AC electricity to DC, manage the charging strategy and protect the battery for overcharging.
Manica has a big hydro power potential, for example in Chimukono GIZ is building a MHP where a battery charging station can be installed.
The characteristics of the community are:• Hydro potential for installing a MHP plant• Community not connected to the national grid, or in plans to be connected• Demand for modern energy services• Mobile network coverage• Nearby households without connection to the mini grid from the MHPP.
Step 1: Energy produced by the system
The battery charging station operator will pay a fixed fee for the electricity consumed. For the evaluation of the Micro hydro battery charging stations the project in Chimukomo is going to be used as a reference:
Battery charging station in Mozambique
62

Step 2: Energy for self consumptionThe same personal consumption as in the previous cases will be consider 100 Wh/day or 3 kWh/month and 29 kWh/month are used for charging.
Step 3: Energy for PUE
#batteries =EnergyforPUE
Ebattery *Frequencych arg e
#batteries = 29(kWh / month)X(kWh / charge)*Y (charges / month)
The main difference with the SBCS is the energy needed for charging the battery since in this case an AC battery charger is used. A standard AC charger is assumed to have an efficiency of 85%.(Omnitech 2012)
EnergyCharging AC =kWh*DODηch arg ing
EnergyCharging AC =1kWh*0.8
(0.85) = 940 Wh
In the case of the SBCS 880 Wh are needed for charging one battery and for the MHPP 940 Wh, therefore less batteries can be charged with this set up.
#batteries = 29(kWh / month)940(Wh / charge) * 4(charges / month)
#batteries = 7 batteries
Then the MHP-BCS can support 7 batteries, charging each of them 4 times a month. Like in the case of the SBCS, is recommended that the operator would have more than 7 batteries to compensate for the delay of the costumer to bring back the battery to the station.
Chimukono - Micro hydro power plantFirst draft electricity tariff- Nov 2011 (Geyer 2011)
Electricity tariff: Domestic consumption 31 kWh/month, from 18:00 to 06:00 Hrs
Cost: 300 Mt/month
Sandra Chavez
63

4.3 Financial issues
This section will compare the cost of the 3 different options in 10 years with the Net present value NPV. This indicator considers the incoming and outgoing cash flows of the project in a time frame.
Important remarks: Is assumed that the operator pays 100% of the system cost without any loan from the Bank or a MFI.Prices of the components is Mozambique in September 2011-Jan 2012.The currency exchange rate 1US $ = 28 Mt8.
4.3.1 Net present value introduction
Is a tool that compares the value of the future cash flows with the investment cost in the present. Is calculated with the next formula:
NPV =Rt
(1+ i)tt=1
n
∑Where:NPV=Net present valueRt= Net cash flowi= Discount ratet= time of the cash flow
A positive NPV is desired, it means that the future cash flows of the project are going to be enough to pay for the investment cost and generate revenue. Following the same logic a negative number is not acceptable.
For the NPV calculation the next cash flows are considered:
OUTGOING CASH FLOWS- Investment cost of the components- Installation, plugs and cables- Operation, electricity- Maintenance, replacement of components
INCOMING CASH FLOWS- Energy self consumption savings- Revenue from cell phone charging- Revenue from the barber shop
Battery charging station in Mozambique
64
8 Oanda (2011). "Historical Exchange rates." Retrieved 01.August.2011, from http://www.oanda.com/currency/historical-rates/.!

- Revenue from the Cinema- Revenue from the battery charging
4.3.2 Outgoing cash flows
Investment cost From the list of the Solarmoz partners, the retailers located in Chimoio, Beira and Muxungue were selected to be the suppliers of the components for the battery charging station to reduce the transportation cost of the components. The prices considered for this study were taken from the report “Estudio Basico Sobre o Mercado PV en Moçambique” (João Junior 2011).
SBS
From the technical analysis the next list of components were recommended, plus the extra devices that need to be purchased to start with the PUE activities.
Specification Brand Cost [Mt] SupplierSolar Home System costSolar Home System costSolar Home System costSolar Home System costSolar Home System cost
PV module 120 Wp Prostar 12 750 Savon tradingBattery 70 Ah Raylite 4 500 ARS MaxixeInverter 350 W Universal 1 500 ARS MuxungueBCC 10 Ah Phocos 1 190 Savon trading
OthersOthersOthersOthersOthersTV 14´´ --- 2000 Market Chimoio
DVD --- --- 1300 Market ChimoioHair cuter --- --- 1000 Market Chimoio
TOTAL INVESTMENT COSTTOTAL INVESTMENT COSTTOTAL INVESTMENT COST 24240 $US 866Table 19: Investment cost –SHS + PUETable 19: Investment cost –SHS + PUETable 19: Investment cost –SHS + PUETable 19: Investment cost –SHS + PUETable 19: Investment cost –SHS + PUE
SBCS
In this case the cost are divided in the cost for the solar home system and the cost of the battery boxes.
Specification Brand Cost [Mt] Supplier Solar Home System cost Solar Home System cost Solar Home System cost Solar Home System cost Solar Home System cost PV module (5 units) 120 Wp Prostar 63750 Savon trading
Battery 70 Ah Raylite 4 500 ARS MaxixeInverter 350 W Universal 1 500 ARS Muxungue
Battery box Battery box Battery box Battery box Battery boxBCC 20 A Steca 1500 S&S
Battery (9 units) 70 Ah Raylite 40500 Savon tradingTOTAL INVESTMENT COSTTOTAL INVESTMENT COSTTOTAL INVESTMENT COST 125250 $US 4473
Table 20: Investment cost –SHS + battery chargingTable 20: Investment cost –SHS + battery chargingTable 20: Investment cost –SHS + battery chargingTable 20: Investment cost –SHS + battery chargingTable 20: Investment cost –SHS + battery charging
Sandra Chavez
65
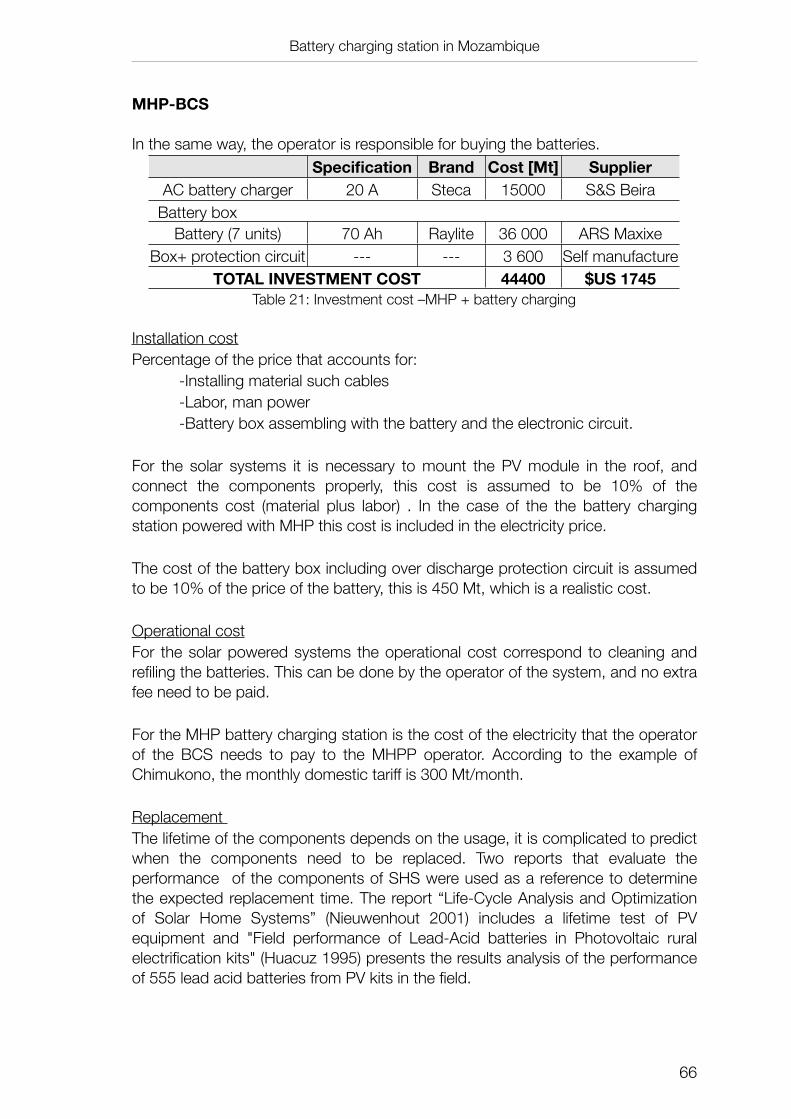
MHP-BCS
In the same way, the operator is responsible for buying the batteries. Specification Brand Cost [Mt] Supplier
AC battery charger 20 A Steca 15000 S&S Beira Battery box Battery box Battery box Battery box Battery box
Battery (7 units) 70 Ah Raylite 36 000 ARS MaxixeBox+ protection circuit --- --- 3 600 Self manufacture
TOTAL INVESTMENT COSTTOTAL INVESTMENT COSTTOTAL INVESTMENT COST 44400 $US 1745Table 21: Investment cost –MHP + battery chargingTable 21: Investment cost –MHP + battery chargingTable 21: Investment cost –MHP + battery chargingTable 21: Investment cost –MHP + battery chargingTable 21: Investment cost –MHP + battery charging
Installation costPercentage of the price that accounts for: -Installing material such cables -Labor, man power -Battery box assembling with the battery and the electronic circuit.
For the solar systems it is necessary to mount the PV module in the roof, and connect the components properly, this cost is assumed to be 10% of the components cost (material plus labor) . In the case of the the battery charging station powered with MHP this cost is included in the electricity price.
The cost of the battery box including over discharge protection circuit is assumed to be 10% of the price of the battery, this is 450 Mt, which is a realistic cost.
Operational costFor the solar powered systems the operational cost correspond to cleaning and refiling the batteries. This can be done by the operator of the system, and no extra fee need to be paid.
For the MHP battery charging station is the cost of the electricity that the operator of the BCS needs to pay to the MHPP operator. According to the example of Chimukono, the monthly domestic tariff is 300 Mt/month.
Replacement The lifetime of the components depends on the usage, it is complicated to predict when the components need to be replaced. Two reports that evaluate the performance of the components of SHS were used as a reference to determine the expected replacement time. The report “Life-Cycle Analysis and Optimization of Solar Home Systems” (Nieuwenhout 2001) includes a lifetime test of PV equipment and "Field performance of Lead-Acid batteries in Photovoltaic rural electrification kits" (Huacuz 1995) presents the results analysis of the performance of 555 lead acid batteries from PV kits in the field.
Battery charging station in Mozambique
66

The assumptions of the replacement time of the components used for this study are presented in the next table. Also these values are contrasted with the warranty offered by the manufacturer of the products recommended.
Component Replacement time WarrantyBattery 3 years NoInverter 8 years No
PV Module 20 years 25 yearsCharge controller 8 yeas 6 months
Table 22: Estimated lifetime of the componentsTable 22: Estimated lifetime of the componentsTable 22: Estimated lifetime of the components
It is evident that the battery is the bottle neck of the system, from the initial investment cost of the system it is the second most expensive component, just after the PV module. The battery lifetime is highly dependable on the usage, DOD, discharge current and aging. (Gustavsson 2004)
Lead acid car batteries lifetime is reported to be 2-3 years and after this, they are replaced with second hand batteries because they are cheaper (Nieuwenhout 2001). The problem is that the lifetime of a secondhand battery is shorter and this influence performance of the system. This problem can be avoided if the batteries are going to be owned by the operator, then he is responsible to replace the batteries for a new one that would provide the same energy service as the first one.
In contrast, when the battery is owned by the operator, one risk is that the batteries can be stolen. The BCS should operate under the principle that everyone trusts on each other. Nevertheless, is assumed that 20% of the batteries need to be replaced every year due to damaged batteries or stolen batteries.
4.3.3 Incoming cash flows
Energy personal consumption savings In the energy demand section the average household monthly expenditure in Manica is described. Assuming that the operator of a BCS covers their energy needs from his own individual system, what he saves is also a incoming cash flow.
For the Radio, cellphone charging and lighting the an average user spends 210 Mt/month (7.5 US$/month):
Mt/month US$/month
Radio (batteries) 90 3,00Cell phone 40 1,50Lights 80 3,00
Table 23: Personal consumption savingsTable 23: Personal consumption savingsTable 23: Personal consumption savings
Sandra Chavez
67

RevenueThe second source of incoming flows is the money from the service offered; this is calculated as:
Revenuemonthly = Fee per service(Mt) * demand usersmonth
⎛⎝⎜
⎞⎠⎟
To determine the fee charged per service there are 2 approaches:-Use the same price observed in other similar business. -Calculate the necessary price to make the NPV=0 (equilibrium price).
For mobile charging, a standard tariff of 10 Mt/cell phone was observed in the region, a similar phenomena was reported to happen in Uganda and Tanzania (Collings 2011).
For the barber shop, in Vilakulos Inhnmbane, exists a battery powered barber shop which charges 20 Mt/haircut. The barber shop is located very close to the city and the batteries are recharged by electricity from the gird.
The Fee proposed is 10 Mt per haircut. It is know that in rural areas the people can afford to pay 10 Mt, which is the price for charging a cell phone or buying a soda (coca cola).
For the Cinema in Mouha, Manica there is example of a “cinema” powered by diesel generator. The fee charged per movie is 5 Mt per adult and 3 Mt per kid.
Regarding battery charging fees in Mozambique no information was found.The fee is expected to be:MINIMUM: Price to pay for the investment cost in the battery lifetime . Calculate the price that needed to be charged to make the NPV=0, in the case of the SBCS is 123 Mt/charge and in the MHP is 75 Mt/charge9 under the moderate scenario.MAXIMUM: Monthly energy expenditure of an average household 210 Mt/month.
The price for the solar battery charging station should be in the range:Minimum: (123 Mt/charge)(4 charges/month)= 492 Mt/monthMaximum: 210 Mt/month
The price for the solar battery charging station should be in the range:Minimum: (94 Mt/charge)(4 charges/month)= 376 Mt/monthMaximum: 210 Mt/month
Battery charging station in Mozambique
68
9 Refer to the section 4.3.5 for more information.

In both cases the minimum price required to pay for the investment cost is higher than the monthly energy expenditure of the people, this can be explain by:•Short lifetime of the battery (Max 3 years)•High price of the battery ( 4500 Mt)•Low personal energy consumption (100 Wh/day lightning, radio, cellphone and in few cases TV).
Also, frequentation rate (charge/month) to battery charging station (in the case of starter batteries) is the result of the coordination of series of events. It is assumed the people will go weekly to charge the battery; they will have the time, physical strength to carry a 20 Kg battery for some kilometers and the money to pay for the charging fee.
For the calculations of the NPV the maximum price that the user can pay is considered. If the household monthly energy budget is 210 Mt/month and the battery is charged 4 times/month, the maximum price to charge is 50 Mt/charge.
The fees proposed are summarized in the next table:Service Tariff Comment
Mobile charging 10 Mt/mobile Informal agreement of a standard price in the province (survey).
Haircut 10 Mt/haircut Proposal (calculated)
Cinema 4 Mt/adult Same price as an existing cinema in Mouha. (survey)
Battery charging 50 Mt/ battery Battery of 70 Ah, from the battery
charging station only. (calculated)Table 24: Proposed tariffsTable 24: Proposed tariffsTable 24: Proposed tariffs
Determining the demand (users/month) is a complicated task, other BCS report that having reliable frequentation rate is a crucial factor for the success of the project (SARL 2011). A sensitive analysis of the user attendance and the price of the service is presented in the section 4.3.4.
4.3.4 Sensitivity analysis: Users attendance
The goal of the sensitivity analysis is to determine the effect of the user attendance in the final NPV of each option. Different scenarios are proposed depending on the % of the maximum charging capacity (users/month) of the system utilized:
•Optimistic scenario or 100% of the maximum charging capacity •Moderate scenario or 75% of the maximum charging capacity•Pessimistic scenario or 50% of the maximum charging capacity
Sandra Chavez
69

Using the proposed tariffs and different scenarios of users/month the total monthly revenue is calculated.
Total incoming flows= total income+savings
Unit 100% 75% 50%Cellphone charging
Service fee Mt/userCellphone charging Demand User/month
Haircut Service fee Mt/userHaircut Demand User/month
Cinema Service fee Mt/userCinema Demand User/monthTOTAL INCOMETOTAL INCOME Mt/month
Savings Light, radio and cell phone Mt/month
TOTAL Mt/monthNPV Mt
10 10 10200 150 10010 10 1035 25 154 4 420 15 10
2430 1810 1190210 210 210
2640 2020 1400125657 88317 50977
Table 25: Sensitivity analysis demand-SBS
By charging the income flow and different NPV are calculated. By reducing the users by half less than half of the initial NPV of the project is reached. The demand (users/month) has a strong influence on the NPV, and can not be directly controlled but by increasing the marketing or by having some special promotions.
Unit 100% 75% 50%
Battery rentalPrice Mt
Battery rental Users/monthTOTAL INCOME Mt/monthTOTAL SAVINGS Mt/month
TOTAL Mt/monthNPV Mt
50 50 5036 27 18
1800 1350 900210 210 210
2010 1560 1110-80575 -149835 -134778
Table 26: Sensitivity analysis demand-SBCS
In the case of MHPP battery charging station it is specially important to operate it at the maximum capacity, because the electricity price is set according a different categories, so is the same amount per month is payed if 1 kWh or up to 31 kWh are consumed.
Unit 100% 75% 50%
Battery rentalPrice Mt
Battery rentalUsers/month
50 50 5024 18 12
Battery charging station in Mozambique
70

Unit 100% 75% 50%TOTAL INCOME Mt/monthTOTAL SAVINGS Mt/month
TOTAL Mt/monthNPV Mt
1200 900 600210 210 2101410 1110 810
-29070 -47138 -65205Table 27: Sensitivity analysis demand-MHPP + battery
4.3.5 Cash flow diagrams
For building the cash flow diagrams the scenario where 75% of the capacity of the system was used.
The (-) flows are the outgoing flows and are shown as blue bars in the diagram. The (+) flow are the incoming flows and are shown as green bars.Additionally, a yellow line indicates the yearly balance between the incoming and outgoing flows.
The NPV of each option is indicated in the right corner of the table.
For calculating the NPV the next assumptions were used:i= 15%t= 10 years
Interest rate, i, has a strong influence on the result of the NPV, therefore selecting it is crucial for the analysis. In 2011 in Mozambique the interest rate paid by the banks for short term deposits is around 15%, therefore it was selected as a conservative value.
The interest rate is inversely proportional to the NPV result, a bigger i generates a smaller NPV.
The time period selected was 10 years. Some solar projects are evaluated over 10 years because this is the lifetime of the PV module, nevertheless due to the changing conditions in Mozambique a shorter period was chosen.
Sandra Chavez
71

SBS
Figure 22: Cash flow SBS
From the year one the SHS + PUE will have a positive balance, even when some outgoing cash flows are presented the incoming flows will be bigger each time. Which means the operator will have the money to pay for an appropriate component replacement.
The NPV is 88317 Mt, which is a desired result. Represent that by investing in this project the operator would increase his capital by 88 317 Mt.
SBCS
Figure 23: Cash flow- SBCS
In year 3 the operator needs to pay more than the money he has already collected in the year 1 and 2. In the model it is assumed that this money is payed but in real life when the balance of the year is negative it is not sure that the operator would have the means to pay. This negative balance occurs every 3 years when most of the batteries need to be replaced.
The NPV is -149 830 Mt, is not a desired result. This indicates that charging batteries is not a economically feasible option, and even less desirable than the micro hydro for battery charging station.
Battery charging station in Mozambique
72
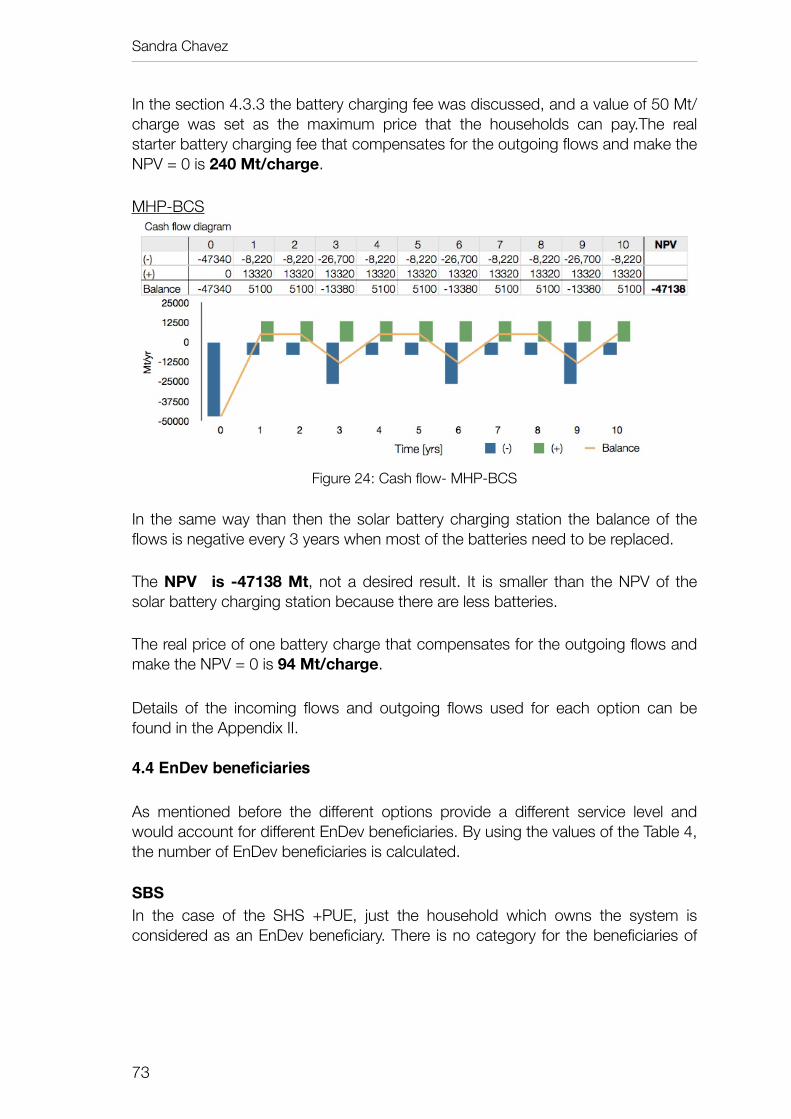
In the section 4.3.3 the battery charging fee was discussed, and a value of 50 Mt/charge was set as the maximum price that the households can pay.The real starter battery charging fee that compensates for the outgoing flows and make the NPV = 0 is 240 Mt/charge.
MHP-BCS
Figure 24: Cash flow- MHP-BCS
In the same way than then the solar battery charging station the balance of the flows is negative every 3 years when most of the batteries need to be replaced.
The NPV is -47138 Mt, not a desired result. It is smaller than the NPV of the solar battery charging station because there are less batteries.
The real price of one battery charge that compensates for the outgoing flows and make the NPV = 0 is 94 Mt/charge.
Details of the incoming flows and outgoing flows used for each option can be found in the Appendix II.
4.4 EnDev beneficiaries
As mentioned before the different options provide a different service level and would account for different EnDev beneficiaries. By using the values of the Table 4, the number of EnDev beneficiaries is calculated.
SBSIn the case of the SHS +PUE, just the household which owns the system is considered as an EnDev beneficiary. There is no category for the beneficiaries of
Sandra Chavez
73
the PUE. Using the default value of 5 people10 = household with the system 5 people can benefit.
EnDevbeneficiary =1 SHS( 5 peoplehousehold
)=5 beneficiaries
SBCSThe beneficiaries of the BCS are counted as 2/3 as stated in the Table 4.
Energy available=580 Wh( 4 chargesmonth
)(12 monthyear
)
Energy available=28 kWh/year
This is the available energy per household and assuming 1 household=5 peopleEnergy available=(28 kWh/year)((1 household)/(5 people)) = 6 kWh/year
The energy covers the conditions form the partial service level.
EnDevbeneficiary =9 batteries( 5 peoplehousehold
)( 23
)
EnDevbeneficiary = 30 beneficiaries = 6 households
MHPP BCS
EnDevbeneficiary =7 batteries ( 5 peoplehousehold
)( 23
)
EnDevbeneficiary =23 beneficiaries
4.5 Preliminary results from the analysis
After performing a technical and economical analysis of the 3 different setups under the conditions before, it can be concluded that:
Technical• If the batteries are owned by the operator, the advantage is that an electronic
over discharge circuit can be included to potentially extend the lifetime of the battery. Nevertheless, is not clear exactly how this circuit can be manufactured with the current R&D conditions of Mozambique. The technical feasibility of this part is questionable.• It is recommended to use a 70 Ah lead acid battery for the SHS and the battery
to be rented. The energy generated by the PV system is enough for the operator personal consumption and the PUE assuring a high SOC of the battery at every moment.
Battery charging station in Mozambique
74
10 5 households, standard value when any significant evidence of other value is provided.
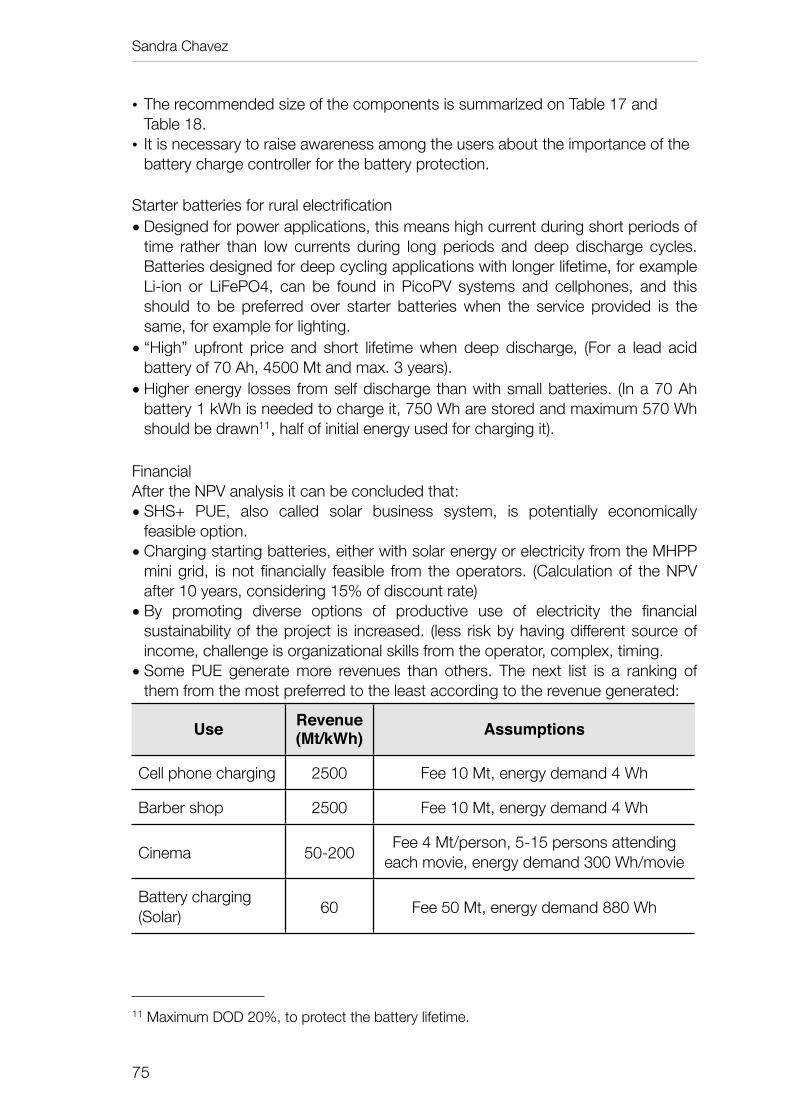
• The recommended size of the components is summarized on Table 17 and Table 18.• It is necessary to raise awareness among the users about the importance of the
battery charge controller for the battery protection.
Starter batteries for rural electrification• Designed for power applications, this means high current during short periods of
time rather than low currents during long periods and deep discharge cycles. Batteries designed for deep cycling applications with longer lifetime, for example Li-ion or LiFePO4, can be found in PicoPV systems and cellphones, and this should to be preferred over starter batteries when the service provided is the same, for example for lighting.
• “High” upfront price and short lifetime when deep discharge, (For a lead acid battery of 70 Ah, 4500 Mt and max. 3 years).
• Higher energy losses from self discharge than with small batteries. (In a 70 Ah battery 1 kWh is needed to charge it, 750 Wh are stored and maximum 570 Wh should be drawn11, half of initial energy used for charging it).
FinancialAfter the NPV analysis it can be concluded that:• SHS+ PUE, also called solar business system, is potentially economically
feasible option.• Charging starting batteries, either with solar energy or electricity from the MHPP
mini grid, is not financially feasible from the operators. (Calculation of the NPV after 10 years, considering 15% of discount rate)
• By promoting diverse options of productive use of electricity the financial sustainability of the project is increased. (less risk by having different source of income, challenge is organizational skills from the operator, complex, timing.
• Some PUE generate more revenues than others. The next list is a ranking of them from the most preferred to the least according to the revenue generated:
Use Revenue (Mt/kWh) Assumptions
Cell phone charging 2500 Fee 10 Mt, energy demand 4 Wh
Barber shop 2500 Fee 10 Mt, energy demand 4 Wh
Cinema 50-200 Fee 4 Mt/person, 5-15 persons attending each movie, energy demand 300 Wh/movie
Battery charging (Solar) 60 Fee 50 Mt, energy demand 880 Wh
Sandra Chavez
75
11 Maximum DOD 20%, to protect the battery lifetime.

Use Revenue (Mt/kWh) Assumptions
Battery charging (MHPP) 55 Fee 50 Mt, energy demand 940 Wh
Table 28: Revenue from different PUE
Revenue produced is not the only parameter considered for the selection of the type of PUE to be implemented, but I considered it to be one of the most important. It is also necessary to consider the demand of the service offered, the ways to get clients and the resources necessary to start the productive use (tools, skills necessary for example know how to cut hair, etc).
Considering this, cellphone charging is the best economically ranked (Table 28), it has high demand, good acceptance and charging a cell phone does not require any special skills, is just a matter to have right the charger.
For existing PV installations that have “surplus” energy a PUE can be performed. Keeping in mind the importance of having the battery always at a high SOC, this is controlled by the BCU.
One typical example are the governmental buildings, in Portuguese “Postos Administrativos”, which does not operate during the weekend. Then a barber shop or a cinema can be operated when there is no consumption from the governmental building.
It is necessary to keep in mind that this time where no energy is demanded from the system, the energy produced charges the battery and assures a high SOC, and this is positive for the installation.
It is recommended to evaluate in detail every specific case, the basic guidelines to calculate the energy produced are presented in section 4.2.7 and the energy consumption and revenue from PUE is presented in Table 28.
From EnDev’s counting point of view the number of beneficiaries is higher in the starter battery charging options (SBCS and MHPP-BCS). My recommendation is that the financial feasibility is prioritized.
From the operators point of view SBS is the only economically feasible option. In the case of the starter battery charger station either powered by the sun or by electricity from a mini grid of the MHPP, is not enough to financially compensate for the high cost of the installations and the batteries.
Battery charging station in Mozambique
76

From the project point of view it need to be decided weather to increase more rapidly the number of EnDev beneficiaries at the expense of financial feasibility or not.
In conclusion, the recommendation under the assumptions of this study to start an electrification program in Manica is to promote solar business systems and productive use of electricity over starter battery charging stations.
Additional remarks for setting up a solar business system are provided in the next chapter.
Sandra Chavez
77

5. Solar business systemThis chapter provides extra information for setting up a SBS. For the operator financing options are evaluated. At the end a SWOT analysis as well as a list of the risks and mitigations for this project are presented.
5.1 Financing options
A “high” upfront cost, 26 700 Mt, is a challenge for the implementation of solar business systems, for this reason financing possibilities with Funae and commercial banks are explored.
Funae, Energy fund, is a public institution with the objective of:“Development, production and use of different forms of low cost power as well as to promote the conservation, rational and sustainable management of power resources” (Funae 2011)
They supply financial aid and guarantees for economically and financially viable projects that are in tune with FUNAE stated objectives.The solar business system is a suitable candidate for this financial aid.
The proposal is to lend 80% of the upfront cost and pay it in 3 years at an interest rate of 12%. (Similar values from other renewable energy projects in Mozambique).
From the 26664 Mt, Funae will pay 80% which is equivalent to 21331 Mt and the operator will pay 6333 Mt.
The monthly payment is calculated as:
P= iA1-(1+i)n
=0.01*213311-(1+0.01)36
= 708.5 Mtmonth
After 3 years the cumulative payment is 25506 Mt and the total interest paid 4175 Mt. The NPV is calculated under the same assumptions that the SBS, (Discount rate of 15%, 10 years and the 75% scenario)
Battery charging station in Mozambique
78

Figure 25. Cash flow-SBS - Funae
The NPV is 90236 Mt, which is even higher than when the upfront cost was paid by the operator. This is because the discount rate is bigger than the interest rate.
In the case that the is lend from a commercial bank then the conditions are (Typical conditions of commercial banks in Mozambique):Loan for 80% of the investment costPay in 2 yearsInterest rate of 25%
P= iA1-(1+i)n
=0.0208 *213311-(1+0.0208)24
= 1140 Mtmonth
The NPV is calculated with 15% discount rate and 10 years.
Figure 26. Cash flow- SBS-Comercial Bank
Under the commercial bank conditions the monthly payment is higher and the NPV is lower. One of the reasons is the interest, overall after the 2 years of the
Sandra Chavez
79

loan 5 980 Mt are payed just as interest in comparison with the 4 175 Mt paid for the Funae case.
The most attractive option for the operator is to borrow money from Funae because this will maximize his NPV. The procedure of how to apply for the loan and the payment mechanism needs to be further developed. The fact is that it is necessary to look for cheaper financing options than commercial banks that will help the operator to purchase a SBS.
5.2 Implementation
In short term it is important to answer the question, How to kick start a SBS in Mozambique?
The main idea is to promote the SBS as an economically attractive business opportunity for the operator, it is necessary to communicate the competitive advantages of this setup (Refer to SWOT analysis section). Also information and help to access to a cheap financing option will be provided.
To promote the systems SolarMoz workshops are key events where the SBS can be promoted among retailers and entrepreneurs. During these sessions demonstration kits can be presented and lend to the interested people, after a week if they like the system they keep it other wise they can return it free of charge. The participants of the workshops are retailers who have the opportunity to promote the systems by themselves in rural areas. Since they receive training in basic technical skills that make them potentially qualified technicians to repair the systems.
To promote the SBS in the rural communities “Road shows” can be organized. By inviting the people for an exhibition of the system the interest is created, then the participants will have the opportunity to take a system and if they like it they buy it12, just like during the SolarMoz workshops.
Furthermore, the operators ideal profile is a small shop owner with his own shop and with experience in running a business, and then the SBCS is a parallel business and not the main source of income. These kind of shops are found in almost every town and village, giving a wide scope for the operator selection.
In middle term, to assure the operation of the systems is necessary to:• Procure quality of components and specially quality spare parts.
Battery charging station in Mozambique
80
12 This selling strategy was successful for other EnDev projects in Africa.

• Operator awareness for cleaning the panel and the poles of the battery, as well as not to disconnect the BCU.
• Qualified technical support in case of breakdown.
5.2.1 SWOT analysis
Is essential to clearly identify the strengths, weaknesses, opportunities and threats of the project to define the implementation strategies. In this case, the SWOT, analyses the situation of the SBS promoted by EnDev compared to the the existing informal cell phone charing stations.
Strengths Weaknesses
Quality components. Optimal sizing of the
components.Longer lifetime of the
components.
Higher upfront cost compared with second hand components.
Lack of technical knowledge of the operator (maintenance).
Operator use the energy only for self consumption.
Opportunities Threats
High demand for cell phone charging.
Low electrification rate (11%).
Grid extension.Informal charging competitors.
Vandalism.Misuse of the system.
Figure 27. SWOT analysis STRENGTHSQuality components, This can be assured by using components from the retailer partners of SolarMoz, by looking for components that offer warranty. In further stages for solar products to be sold in the SBS, PicoPV lanterns certified by Lighting Africa should be preferred over the other possibilities. Optimal sizing of the components, Follow the recommendations of Table 17 and 18.Long lifetime of the components,The components are new and the battery is protected with the BCU, therefore the lifetime is expected to be longer than when using second hand components.
WEAKNESSESTo over come the weaknesses the next actions are suggested:Higher upfront cost compared with second hand components, then it is recommended to look for financing options were the money are borrowed at lower rate than the banks, for example Funae.Lack of technical knowledge of the operator, then cooperate with participants from SolarMoz workshops, which have basic technical skills.
Sandra Chavez
81

If the operator uses the energy for personal consumption, then inform the operator the limitations of the system (Refer to the maximum capacity of the system in Table 8).
OPPORTUNITIES High demand for cell phone charging, Increasing number of cellphones subscriptions also in rural areas without electricity. Low electrification rate, in Manica province 11% of the users are connected to the national grid, in the rural areas this number is even lower.
THREATSGrid extension, Like in any other rural electrification project it is a risk that the grid reaches the community where the project is implemented. Electricity from the grid provides a higher energy service level, and if possible should be preferred. Informal charging competitors, that the costumers prefer charge his cellphones somewhere else. By including seasonal promotions this threat can be reduced.Vandalism, The system or part of the system could be damaged or stolen. The BCU and the battery will be well protected inside the Shop making the PV module the vulnerable part.
5.2.3 Risks and mitigation
For the implantation of a SBS for EnDev a list risks and proposed mitigation strategies are summarized in Table 29.
Risk Description Mitigation
Financial Operator does not pay for the loan Collateral
Market Low demand More intensive marketing
“Market spoiling” Disappointed users Quality products and offer warranty.
Operation System brakes down Training to the user, quality spare parts.
Over operation Not enough energy for productive use of energy
Explain the user the system limitations
Table 29. Qualitative risk assessment
Financial, according to the incoming flow calculation the operator will have the money to pay for the loan. The risk is that the operator might use the money for another purpose, to assure that he will pay a collateral will be required.
Battery charging station in Mozambique
82

Low demand, one reason is that the people do not know about the services offered in the SBS. The operator needs to do extensive marketing and offer some seasonal promotions, for example,if you charge your cell phone 10 times then the 11th is for free, to give an incentive to the people.
Marketing spoiling, when the system does not meet the service level that was offered to the user it results in disappointed users. It is necessary to be clear during the road shows about the potential and also limitations of the system
Operation, during operation the system can break down. The risk is that the system can not be repaired due to lack of skilled technicians, as a consequence the system will stop operation until someone can repair it. One possible way to mitigate this risk is by having quality components and what is specially important is having available quality spare parts.
Over operation, the so called “rebound effect”, when the operator has access to energy, this can increase his energy consumption, and reducing the share of available energy for PUE. The mitigation measurement proposed is to clearly explain to the user the capacity of the system and letting him decide between self consuming the electricity or using is for PUE.
Sandra Chavez
83

6. Conclusion and RecommendationsThe aim of this study was to evaluate the technical and economical feasibility from different set ups to start a battery charging station in the Manica province, Mozambique.
The setups compared were, a Solar and MHP battery charging stations, for starter battery charging, and a SHS plus productive use of energy, also known as SBS.
Starter battery charing stations (solar and MHP) are neither economically nor technologically feasible in Mozambique, under the assumptions of this study. The main limitation is the high price of the starter batteries and their short lifetime.
In contrast, SBS are economically and technically feasible13, being the use PUE being one of the key strategies for making the SBS an economically attractive business opportunity.
The two options are not directly comparable because the energy service offered by a starter battery is higher than the one from the PUE presented,but when the starter battery is compared with the SBS the energy service from the SBS is higher as well.
The service level offered needs to be aligned with the service level demand, in the case of Mozambique cellphone charging is a major demand. In this case, the same service can be provided with the SBS and with the starter battery, therefore SBS is preferred.
The recommendation is to promote SBS as a business opportunity for the people in rural areas, raising awareness of the potential of PUE for income generation. Additionally quality solar components should be promoted in the SBS, such as PV systems14, DC LED lights, DC radios whit the expectation that at some point operate the complete system operates in DC.
To kick start the project it is crucial to cooperate with the training activities from Solarmoz in order to promote the systems, find potential buyers and potential technicians. Then it is necessary to facilitate financing with cheaper options than the commercial banks, Funae being a very attractive possibility.
Battery charging station in Mozambique
84
13 Under the assumptions of this study.
14 Products certified by Lighting Africa and GIZ.

For next steps is necessary to evaluate individual cases of PV systems for social infrastructure and see if there is a market for starting a low power PUE such as cellphone charging.
As an overall conclusion it can be said that SBS are a promising business option to provide access to modern energy to the people in Mozambique, emphasizing the benefits from including PUE activities. Definitely the energy service provided from PUE activities has many limitations but it is just one step to the way of electrification.
Sandra Chavez
85

7. ReferencesAdelmann, P. P. (2010). Modular concept for Battery charging stations.!Alliance for Rural Electrification, A. Rural Electrification with renewable
technologies: quality standards and business models. .! !Battery University (2010). "How to prolong lead acid battery ". from http://
batteryuniversity.com/learn/article how_to_restore_and_prolong_lead_acid_batteries.
! Access date: 12 Oct 2011!BBC "Mozambique profile." BBC.! Access date: 18 Oct 2011
Brüderle, Anna. (2011). Productive Use of Energy-PRODUSE. A Manual for Electrification Practitioners.!
Climatedata.eu (2011). "Clima Data Chimoio-Manica."! Access date: 18 Oct 2011!Clough, L. (2011). Marketing challenges and strategies for Micro and Small
Energy Enterprises in East Africa. G. international.!Collings, S. (2011). Phone Charging Micro-businesses in Tanzania and Uganda.
D. E. Africa: 31.
Dunlop, James. (1997). Batteries and Charge Control in Stand-Alone Photovoltaic Systems Fundamentals and Application, Sandia National Laboratories!
E.quinox (2011). "equinox." from http://www.e.quinox.org/.! Access date: 21 Oct 2011
Estadistica (2011). "Mozambique, O Pais." Retrieved 04 November 2011, from http://www.ine.gov.mz/o_pais/.
! Access date: 13 Oct 2011!Geyer, F. (2011). Chimukono proposal operator tariff. S. Chavez!GIZ (2010). "http://www.giz.de." Retrieved November 2011.! Access date: 18 Oct 2011
Group, T. W. B. (2011). "Mozambique." Retrieved 22 Octubre 2011, from http://data.worldbank.org/.
!GSMA, G. p. f. M. (2009). Bi-annual report International finance corporation
IFC.
Battery charging station in Mozambique
86

!Gunther, B. (2010). Energy usage and socio-economic conditions in
Mozambique, RWI Materialen.!
Gustavsson, Mathias. (2004). "Lead-acid battery capacity in solar home systems—Field tests and experiences in Lundazi, Zambia." Solar Energy 79
Huacuz, Jorge. (1995). "Field performance of Lead-Acid batteries in Photovoltaic rural electrification kits." Solar Energy 55(No. 4): 287-299.
Hankins, M. (2009). A Renewable Energy, Plan for Mozambique, Justiça Ambiental.
!Heidtmann, Caroline (2011). Burundi Country Situation. Energypedia.
Heidtmann, Caroline (2011). Cooperation EnDev Burindi and EnDev Mozambique. S. Chavez.
!Hellpap Carsten, G. F. (2011). Mozambique country situation. Energypedia.! Access date: 02 Nov 2011
Hellpap, Z., van Eijk (2011). Mozambique Country Situation. Energypedia. Energypedia.
! Access date: 02 Nov 2011
Hermann, S. (2006). Desing of a Micro-Hydro powered battery charging system for rural village electrification, University of Oldenburg. Master of Science.
Holtrof, Hans. (2012). BCC configuration for SBCS. S. Chavez.
IEA (2009). "World energz outlook 2009."!IEA (2011). Trends in Photovoltaic applications.!INEM, Instituto Nacional de Estadisticas de Mozambique. (2007). "Censo
2007."!Invetors.about. "Battery." Retrieved 10. January. 2012, from http://
inventors.about.com/od/bstartinventions/ss/How-A-Battery-Works.htm.! Access date: 10 Nov 2011!João Junior, Z. A. (2011). Estudo Basico Sobre o Mercado PV em Moçambique.! !Klaus (2005). " Geração decentralizada de energia para o desenvolvimento
rural na Província de Manica.Chimoio."!LigthingAfrica (2010). Lighting Africa Quality Test Method (LA-QTM).!
Sandra Chavez
87

Madeira, A. C. P. (2011). RELATÓRIO SOBRE O FUNCINAMENTO DE PEQUENOS SISTEMAS SOLARES CASEIROS NA PROVÍNCIA DE SOFALA-SSHS.
!Mair, G. (2010). "OSRAM Off-grid project in Kenya." Energypedia. from https://
energypedia.info/index.php/OSRAM_Off-grid_project_in_Kenya.! Access date: 02 Nov 2011
Michael, Andreas, Roman Grüner (2011). Solar Battery Charging Stations. Energypedia.
! Access date: 09 Nov 2011
NASA, R. (2011). "NASA surface meteorology and Solar Energy: RETscreen data." Retrieved 05 Decemeber, 2011, from eosweb.larc.nasa.gov/cgi-bin/sse/[email protected].
! Access date: 24 Nov 2011
Natascha, A. (2011). Mali Country situation. Energypedia.! Access date: 02 Nov 2011
Nieuwenhout, F (2001). Life-Cycle Analysis and Optimisation of Solar Home Systems.
Raabe Tim (2010). EnDev Mail. Energypedia.! Access date: 02 Nov 2011!Raabe Tim, C. H. (2011). Rules for measuring outcomes Energypedia.! Access date: 16 Nov 2011
Raylite. "Lead Acid battery SouthAfrica." from http://www.raylite.co.za/.! Access date: 23 Nov 2011!
UNDP (2011). Human development index trends 1980-2011.!Varaghese, A. (2010). Rural Energy Kiosks for Lighting up Kenya
Rural Energy Centres for Business Promotion Lighting africa conference.
! UNIDO’s experience in Decentralized Power Generation for Productive activities
Wahlglobal. "Hair cuter." from http://www.wahlglobal.com/united-kingdom/wahl/professional-hairdressing/corded-clippers/super-taper.html.
! Access date: 07 Dec 2011
Wikkipedia (2011). "Mozambique." ! Access date 04 November 2011.!Zana, C. (2011). Access to Modern Energy Service in Mozambique.!
Battery charging station in Mozambique
88
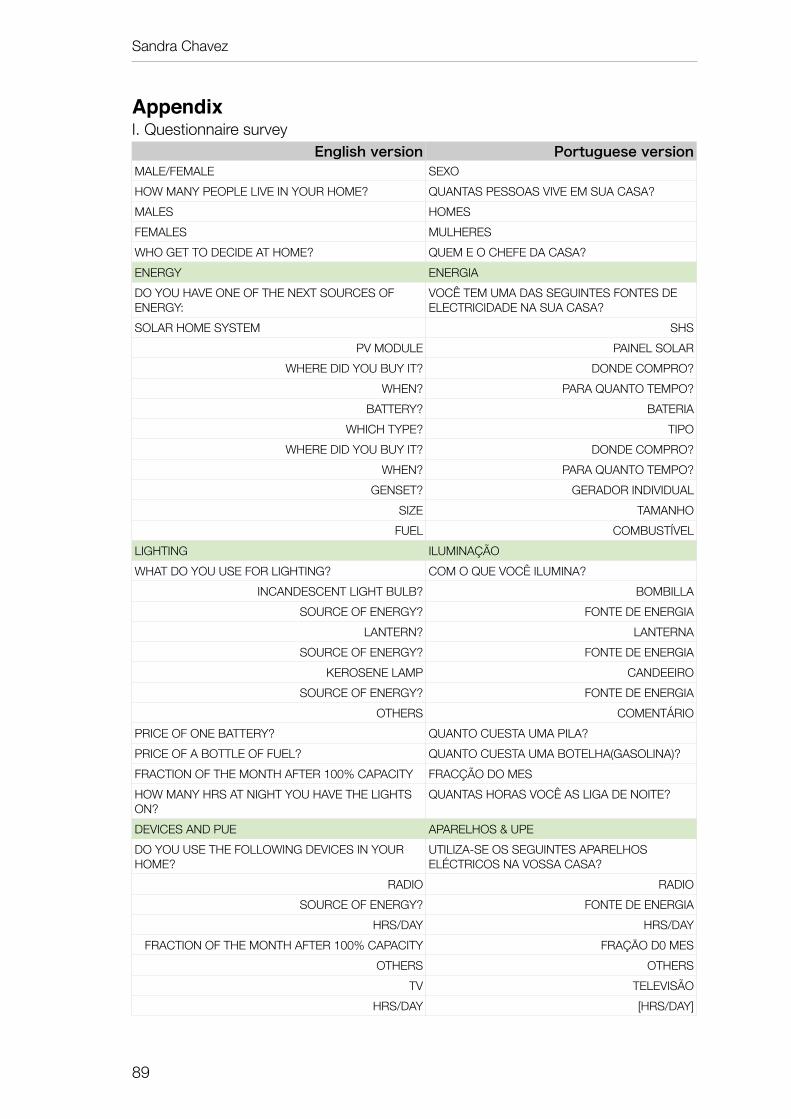
AppendixI. Questionnaire survey
English version Portuguese versionMALE/FEMALE SEXO HOW MANY PEOPLE LIVE IN YOUR HOME? QUANTAS PESSOAS VIVE EM SUA CASA?MALES HOMESFEMALES MULHERESWHO GET TO DECIDE AT HOME? QUEM E O CHEFE DA CASA? ENERGY ENERGIADO YOU HAVE ONE OF THE NEXT SOURCES OF ENERGY:
VOCÊ TEM UMA DAS SEGUINTES FONTES DE ELECTRICIDADE NA SUA CASA?
SOLAR HOME SYSTEM SHS PV MODULE PAINEL SOLAR
WHERE DID YOU BUY IT? DONDE COMPRO?WHEN? PARA QUANTO TEMPO?
BATTERY? BATERIA WHICH TYPE? TIPO
WHERE DID YOU BUY IT? DONDE COMPRO?WHEN? PARA QUANTO TEMPO?
GENSET? GERADOR INDIVIDUALSIZE TAMANHO
FUEL COMBUSTÍVELLIGHTING ILUMINAÇÃOWHAT DO YOU USE FOR LIGHTING? COM O QUE VOCÊ ILUMINA?
INCANDESCENT LIGHT BULB? BOMBILLASOURCE OF ENERGY? FONTE DE ENERGIA
LANTERN? LANTERNASOURCE OF ENERGY? FONTE DE ENERGIA
KEROSENE LAMP CANDEEIROSOURCE OF ENERGY? FONTE DE ENERGIA
OTHERS COMENTÁRIOPRICE OF ONE BATTERY? QUANTO CUESTA UMA PILA?PRICE OF A BOTTLE OF FUEL? QUANTO CUESTA UMA BOTELHA(GASOLINA)?FRACTION OF THE MONTH AFTER 100% CAPACITY FRACÇÃO DO MESHOW MANY HRS AT NIGHT YOU HAVE THE LIGHTS ON?
QUANTAS HORAS VOCÊ AS LIGA DE NOITE?
DEVICES AND PUE APARELHOS & UPEDO YOU USE THE FOLLOWING DEVICES IN YOUR HOME?
UTILIZA-SE OS SEGUINTES APARELHOS ELÉCTRICOS NA VOSSA CASA?
RADIO RADIOSOURCE OF ENERGY? FONTE DE ENERGIA
HRS/DAY HRS/DAYFRACTION OF THE MONTH AFTER 100% CAPACITY FRAÇĀO D0 MES
OTHERS OTHERSTV TELEVISÃO
HRS/DAY [HRS/DAY]
Sandra Chavez
89

DVD DVDHRS/DAY [HRS/DAY]
WHERE YOU CUT YOUR HAIR? DONDE VOCÊ CORTA SEU CABELO?HOW MUCH DO YOU PAY? QUANTO PAGA?
OTHERS COMENTÁRIOMOBILE CELULARDO YOU HAVE NETWORK COVERAGE AT HOME? TEM COBERTURA DE REDE DE CELULAR EM
CASA?HOW MANY TELEPHONES YOUR FAMILY HAS? HA QUANTOS TELEFONES NA SUA CASA?HOW MUCH YOU PAY TO CALL (MONTH)? QUANTO VOCÊ PAGA PARA TELEFONAR? (MES)WHERE DO YOU CHARGE THE BATTERY OF YOUR MOBILE?
VOCÊ RECARREGA A BATERIA DO CELULAR EM CASA?
DO YOU CHARGE OTHER CELLPHONES? RECARREGA OUTROS CELULARES? HOW MUCH YOU CHARGE? QUANTO COBRA?HOW MANY MOBILES YOU CHARGE (DAY)?HOW FAR IS LOCATED THE PLACE WHERE YOU CHARGE YOUR CELL PHONE?
A QUE DISTANCIA SE LOCALIZA O LUGAR DONDE VOCÊ RECARREGA?
HOW MUCH YOU PAY TO RECHARGE THE BATTERY OF YOUR CELL PHONE?
QUANTO VOCÊ PAGA PARA RECARREGAR?
IF YOU COULD CHARGE IT IN TOWN HOW MUCH WOULD YOU PAY?
SI VOCE TIVESE POSSIBILIDADE DE CARREGAR SEU TELEFONO AQUI PAGARIA...
OPINION OPINAO WITH ELECTRICITY WHICH ARE THE 2 DEVICES YOU WOULD LIKE TO BUY
QUAIS SAO OS 2 ALVOS QUE. VOCÊ COMPRARIA SI TIVESE ENERGIA?
WHAT IS THE MAXIMUM PRICE YOU WOULD PAY FOR HAVING ELECTRICITY AT HOME?
QUE VALOR MAXIMO VOCE ESTA PRONTO A PAGAR POR MES PARA A ELECTRICIDADE?
Battery charging station in Mozambique
90
III. Financing options for SBS

II. Financial Analysis
Sandra Chavez
91

Battery charging station in Mozambique
92

Sandra Chavez
93
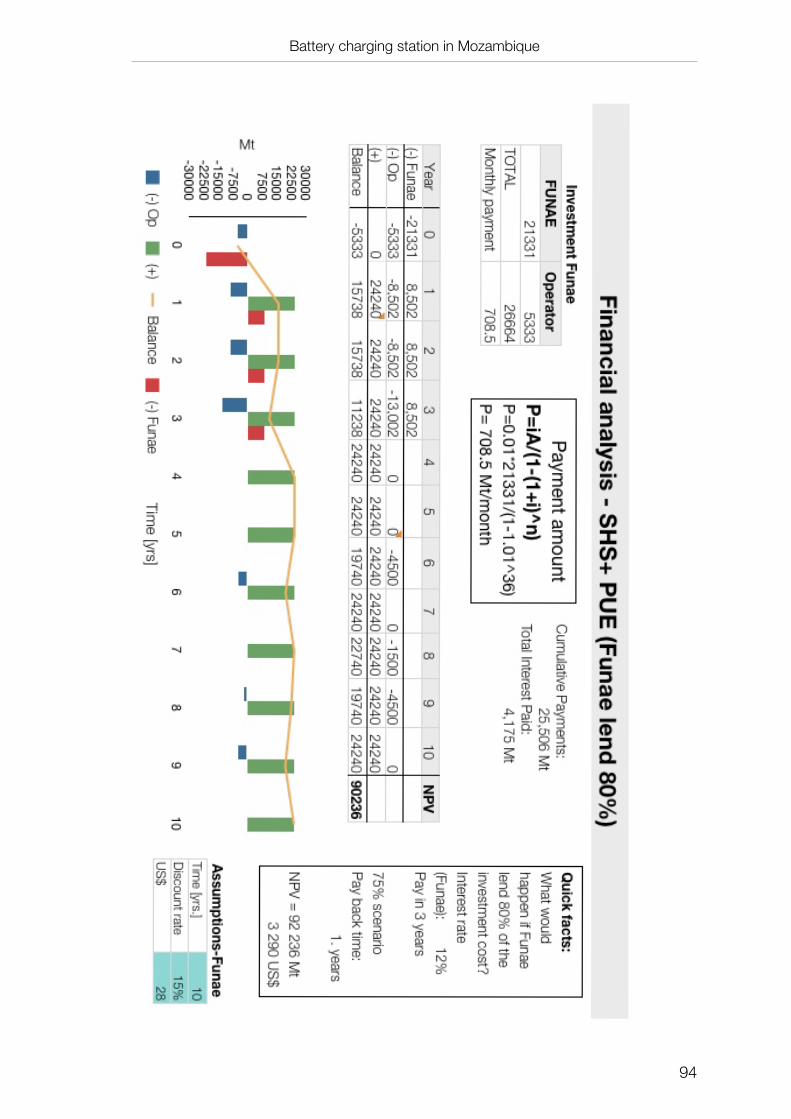
Battery charging station in Mozambique
94

Sandra Chavez
95