
Design for Six Sigma: Approach for reliability and low ...
22
Six Sigma Design & Low Cost Manufacturing InnOvaciOnes de NegOciOs 9(18): 319 - 340, 2012 © 2012 UANL, Impreso en México (ISSN 2007-1191) Design for Six Sigma: Approach for reliability and low-cost manufacturing (Diseño para Seis Sigma: Enfoque para la fiabilidad y fabricación de bajo costo) Jesús Gerardo Cruz Álvarez Universidad Autónoma de Nuevo León, Facultad de Contaduría Pública y Administración, San Nicolás de los Garza, N.L., México. Email: [email protected] Keywords: analysis of variance (ANOVA), design for Six Sigma, DMAIC, industrial experimentation, robust design Abstract. The aim of this study is to discuss new product development based on a traditional stage-gate process and to examine how new product development [NPD] tools, such as lean design for Six Sigma, can accelerate the achievement of the main goals of NPD: reliable product quality, cost-effective implementation, and desired time-to-market. These new tools must be incorporated into a new approach to NPD based on the Advanced Product and Quality Planning methodology. Palabras clave: análisis de varianza, diseño para seis sigma, diseño robusto, experimentación industrial, metodología DMAIC Resumen. El objetivo de la presente investigación es la promoción de una discusión teórica y practica sobre el enfoque tradicional de lanzamiento de nuevos productos bajo la metodología por fases. Una revisión a profundidad cómo las nuevas herramientas del desarrollo de nuevos productos en lo particular el diseño para seis sigma puede acelerar el tiempo de respuesta al mercado de forma exitosa y a una relación atractiva de costo – beneficio. Las nuevas herramientas pueden ser incorporadas dentro de la estrategia de desarrollo de nuevos productos bajo el enfoque de planeación avanzada de la calidad de nuevos productos. bro itation and similar papers at core.ac.uk provided by Repositor
Transcript of Design for Six Sigma: Approach for reliability and low ...
Six Sigma Design & Low Cost Manufacturing
InnOvaciOnes de NegOciOs 9(18): 319 - 340, 2012 © 2012 UANL, Impreso en México (ISSN 2007-1191)
Design for Six Sigma: Approach for reliability and low-cost manufacturing
(Diseño para Seis Sigma: Enfoque para la fiabilidad y fabricación de bajo costo)
Jesús Gerardo Cruz Álvarez
Universidad Autónoma de Nuevo León, Facultad de Contaduría Pública y Administración, San Nicolás de los Garza, N.L., México.
Email: [email protected]
Keywords: analysis of variance (ANOVA), design for Six Sigma, DMAIC, industrial experimentation, robust design Abstract. The aim of this study is to discuss new product development based on a traditional stage-gate process and to examine how new product development [NPD] tools, such as lean design for Six Sigma, can accelerate the achievement of the main goals of NPD: reliable product quality, cost-effective implementation, and desired time-to-market. These new tools must be incorporated into a new approach to NPD based on the Advanced Product and Quality Planning methodology. Palabras clave: análisis de varianza, diseño para seis sigma, diseño robusto, experimentación industrial, metodología DMAIC
Resumen. El objetivo de la presente investigación es la promoción de una discusión teórica y practica sobre el enfoque tradicional de lanzamiento de nuevos productos bajo la metodología por fases. Una revisión a profundidad cómo las nuevas herramientas del desarrollo de nuevos productos en lo particular el diseño para seis sigma puede acelerar el tiempo de respuesta al mercado de forma exitosa y a una relación atractiva de costo – beneficio. Las nuevas herramientas pueden ser incorporadas dentro de la estrategia de desarrollo de nuevos productos bajo el enfoque de planeación avanzada de la calidad de nuevos productos.
brought to you by COREView metadata, citation and similar papers at core.ac.uk
provided by Repositorio Academico Digital UANL

J.G. Cruz
320 Introduction
In today’s market and business environment, new product development is one of the key operations of a firm. Evolving market dynamics require new products to be innovative and competitively priced and to use sustainable technologies; meanwhile, firms require NPD to be cost-effective and to have an optimal time-to-market cycle.
NPD performance from a global perspective is most easily measured as the number of patents obtained per country and the amount of investment in R&D (research and development). (OCDE, 2012), the top ten economies in terms of the number of patents granted are almost identical to the top ten in terms of R&D investment (see Figs. 1 and 2).
NPD follows a traditional approach that begins with identifying a new idea or concept for a new product and continues with design, industrialization, testing, validation and sales. However, due to increasing market competitiveness, firms must incorporate advanced processes for new product development, such as APQP (advanced product quality planning) and LDFSS (Lean Design for Six Sigma).
Figure 1. New Granted Patents.
Note: Adapted from: OCDE. (2012). Global Competitiveness Report 2011-2012. Retrieved from:
http://reports.weforum.org/global-competitiveness-2011-2012/-
0
50
100
150
200
250
300
350
400
Taiw
an
Japa
n
Unite
d Stat
es
Israe
l
Kore
a
Finlan
d
Switz
erlan
d
Swed
en
Germ
any
Cana
da

Six Sigma Design & Low Cost Manufacturing
321
Figure 2. R&D Spending
Note: Adapted from: OCDE. (2012). Global Competitiveness Report 2011-2012. Retrieved from:
http://reports.weforum.org/global-competitiveness-2011-2012/-
Methodology
This research paper is based on the theoretical background presented in peer-reviewed scientific research papers during the period 1990–2012. In the second section of this study, the author provides examples of the proposed tools and of advanced techniques to show evidence that validates the hypothesis.
New product development framework
In terms of its function and process, NPD represent a key strategic area for every firm. NPD is related to business intelligence; R&D, marketing, product phase in and phase out strategy, and innovation, among other capabilities (see Fig. 3).
0
1
2
3
4
5
6
7 Ja
pan
Swed
en
Switz
erlan
d
Finlan
d
Germ
any
Unite
d Stat
es
Denm
ark
Israe
l
Taiw
an
Sing
apor
e
J.G. Cruz
322
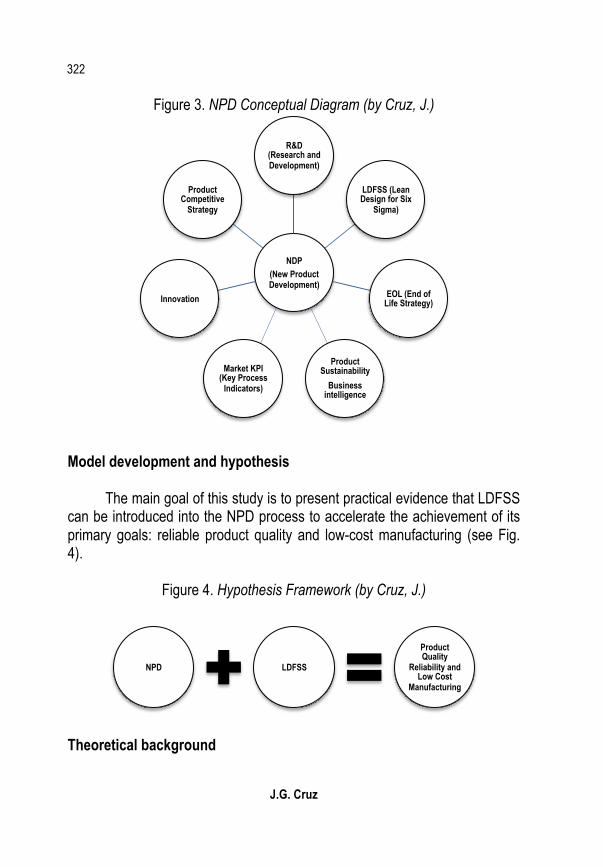
Figure 3. NPD Conceptual Diagram (by Cruz, J.)
Model development and hypothesis
The main goal of this study is to present practical evidence that LDFSS can be introduced into the NPD process to accelerate the achievement of its primary goals: reliable product quality and low-cost manufacturing (see Fig. 4).
Figure 4. Hypothesis Framework (by Cruz, J.)
Theoretical background
NDP (New Product Development)
R&D (Research and Development)
LDFSS (Lean Design for Six
Sigma)
EOL (End of Life Strategy)
Product Sustainability
Business intelligence
Market KPI (Key Process
Indicators)
Innovation
Product Competitive
Strategy
NPD LDFSS
Product Quality
Reliability and Low Cost
Manufacturing

Six Sigma Design & Low Cost Manufacturing
323
Some organizations have reported NPD to be one of the top three that
have received the most attention, as proposed by Goetsch, D.L. and Davis, S.B. (2010), and have suggested that its success depends on design expertise and research and development capabilities in addition to the necessary input from different functional areas, as mentioned by Afonso, P., et al. (2008), Handfield, R.B., et al. (2008) and Plambeck, N. (2012). Typically, different functional areas work simultaneously during this process.
In the early stages of new product development, a cross-functional team must provide feedback on the design and help the firm to achieve a cross-validated industrial design. The key parties involved in this step include suppliers, manufacturing, and process, quality and design engineers, as discussed by Rasli Muslimen, A.S.Z.A., et al. (2012).
Communication between R&D and marketing has a highly significant effect on the final conceptual design, as does the engineers’ expertise in finalizing the industrial design, as confirmed in a previous study by Chang, H.C. (2011) that examined 138 high-technology Taiwanese firms and found interaction between NPD teams. Similar theories and discussion are presented by Griffin, J. (1996), Henderson, S., et al. (2005), and Fernandez, B.I. (2001).
There are some theoretical studies that describes the relationships and business synergy associated with well-designed, customer-oriented products: Kano, N. (2001), Su, C. (2006), Fornell, C. (1987), and Cristiano, J., et al. (2000). Firms can also use web-based technology as a powerful tool that can bring them closer to customers and determine their perceptions (both positive and negative) of a product. Pioneering web-based technology focused on consumer perceptions was developed by Park, Y. (2011).
New product development requires customer input, and this knowledge can be extracted and analyzed using a variety of marketing and customer-driven tools, such as QFD (Voice of Customer and House of Quality) and customer profile studies.
New product development should be considered a powerful strategy for meeting customer preferences through customer-focused products. QFD (Quality Function Deployment) is a customer-driven approach that transforms customer expectations into engineering requirements and manufacturing process parameters. According to Pang, J., et al. [16], QFD is extremely
J.G. Cruz
324 important during the product design stage. Working papers and empirical research proving the effectiveness of QFD during a design gate include Govindalruri, S.M, Cho, B.R. (2007), Freiesleben, J. (2010) and Sharma, J.r., Rawani, A.M. (2007).
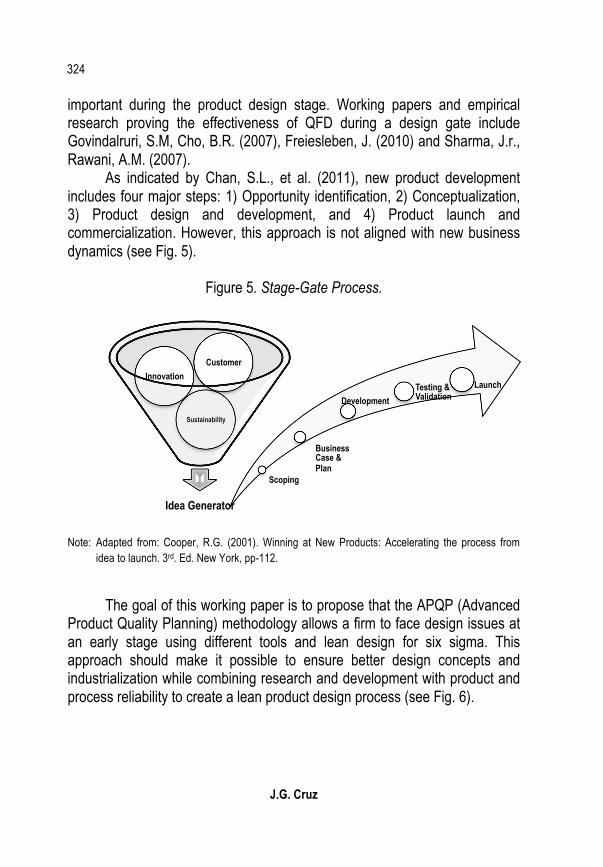
As indicated by Chan, S.L., et al. (2011), new product development includes four major steps: 1) Opportunity identification, 2) Conceptualization, 3) Product design and development, and 4) Product launch and commercialization. However, this approach is not aligned with new business dynamics (see Fig. 5).
Figure 5. Stage-Gate Process.
Note: Adapted from: Cooper, R.G. (2001). Winning at New Products: Accelerating the process from
idea to launch. 3rd. Ed. New York, pp-112.
The goal of this working paper is to propose that the APQP (Advanced Product Quality Planning) methodology allows a firm to face design issues at an early stage using different tools and lean design for six sigma. This approach should make it possible to ensure better design concepts and industrialization while combining research and development with product and process reliability to create a lean product design process (see Fig. 6).
Idea Generator
Sustainability
Innovation Customer
Scoping
Business Case & Plan
Development Testing & Validation
Launch

Six Sigma Design & Low Cost Manufacturing
325
Figure 6. Advanced Product Quality Planning.
Note: Adapted from: APQP. (2007). Advanced Product Quality Planning. AIAG, 6,. Retrieved from:https://www.aiag.org/source/Orders/index.cfm?section=orders&activesection=AiagPubs&task=0
Product design and lean product design are two different concepts.
Product design is a traditional approach to new product development that involves obtaining an idea, making an industrial design, validating the design and launching the product. In contrast, lean design focuses on reducing the overall product development cost and time to design as well as ensuring a cost effective product launch, as outlined by Azharul, K., et al. (2011).
Previous discussions by Ulrich, K. (1995), Karim, M.A., et al. (2009), and Cloke, B. (2000) focus on the idea that organizations compete with regard to product innovation, time-to-market, and research and development. To remain on the cutting edge, companies must emphasize quality, cost, productivity and bringing the product to the market. Research and development, in addition to a focus on reliable product quality, enables lean product design development. According to Cloke, B. (2000), any type of investment made during the design stage will be lower than any type of improvement made during the product manufacturing phase.
Research and development, product quality and process reliability are not the only factors in new product development; speed to market, product quality and cost are alternative priorities. Recent empirical research by Rodriguez, P., et al. (2005) revealed that consumers are more influenced by product quality than speed to market; these results are consistent with previous research by Barker, W.E., and Sinkula, J.M. (2008), and Grinstein, A. (2005).
This customer perspective demands more from organizations, which must conceptualize, design and launch high-quality products with better
I. Marketing & Business Case V. Product and
Process Validation Run at Rate
IV. Process Design PFMEA
DOE & SPC Process Simulation
III. Product Design
DFMEA, FEA DOE & SPC
GD & T
II. Planning Project management
Quality Function Deployment

J.G. Cruz
326 process manufacturing reliability than those of their competitors, according to Kirca, A. and Jayachandran, S., et al. (1995) and Atuahene, K. (2011).
According to Heinzen, M. and Höflinge, N. (2010) the competitiveness of successful firms is based on their ability to balance product quality and innovation with cost-effective NPD and reduced time-to-market cycle time. To achieve cost-effective NPD and a short time-to-market, firms must implement concurrent LPD (Lean Product Design) strategies. According to Schulze, A., et al. (2010), Womack, J., & Jones, D. (1996) and Walton, M. (1999), LPD can be understood as integrating the following steps: 1) specifying customer value; 2) identifying the value stream; 3) making the value flow; 4) letting the customer pull; and 5) ensuring continuous improvement.
Competing organizations facing these difficult business dynamics must identify their technological and human capabilities to determine and achieve key market objectives: increasing end-product quality and shortening the time-to-market cycle. Heinzen, M. and Höflinge, N. (2011) found that on-the-job training contributes significantly to the efficiency of NPD processes and enhances the motivation and skills of the new development team.
Another approach to the NPD process is explained by Grunert, K., et al. (2011), who suggested that NPD involves key process activities such as 1) consumer insight into the new product development process; 2) quality perception as a focal construct; 3) market opportunities and idea generation; 4) consumer acceptance of technology; 5) screening, concept development and concept testing; and 6) prototype testing. However, this approach does not consider process design or product and process validation to be part of an advanced focus on product quality planning.
NPD is mainly driven by cost-effective implementation and profitability. However, for optimal results, NPD must balance economics, design and ecology. The new eco-design approach impacts the overall concept of product design and the selection of manufacturing processes, as highlighted by Grunert, K., et al. (2011).
An alternative to the traditional approach to NDP that is presented by Baril, C., et al. (2011) and Breyfogle, F. (1999) employs the concept of Six Sigma as a quality philosophy that involves the use of statistical tools within a structured methodology to obtain the knowledge needed to out-compete other firms in terms of the quality, time-to-market and price of their products and

Six Sigma Design & Low Cost Manufacturing
327
services. In addition to the Six Sigma approach, Baril, C., et al. (2011) presents the key steps in the DFSS (Design for Six Sigma) process: 1) identify, 2) design, 3) optimize, and 4) validate.
Design for six sigma uses tools such as CTQ (critical to quality) analysis, GD&T (geometrical design tolerance), FEA (finite element analysis) and process design simulation to ‘poke-yoke’ the planned design and promote a robust manufacturing process. In addition, previous studies by Yu, J.-C. & Ishii, K. (1998), Taguchi, G. (1993), Chen, W., Wiecek, M. M., & Zhang, J. (1999), and Eggert, R. J. (1991) link the use of design for six sigma to increased product robustness.
CTQ is a common terminology that identifies a critical feature or component of quality. Once a component is defined as critical to quality, different process control activities must be conducted to ensure that the component meets the defined specifications; otherwise, the product may fail the customer.
GD&T is used to define the components’ and features’ required dimensions for perfect assembly; on the other hand, it also defines the allowable variation between components in terms of their linear dimensions or datum references.
FEA is an engineering approach used to develop robust engineering products and process configurations to design to fail-free or fail-safe specifications. According to Afazov, S.M. (2012), FEA can be used to identify stressed and weakened areas and improve them accordingly based on the manufacturing process or customer use. The FEA methodology and its applications to new product development have been discussed by Pietrzyk, M., et al. (2008) and Jahansson, H. (2004).
The aim of the process design phase is to configure the manufacturing process to suit the new product design intent; as proposed by Zhenyuan, J., et al. (2011), process design can be time - and cost - effective when the organization uses special tools and techniques to develop the manufacturing process, such as the following: layout simulation, experimental design, expert systems, and the intelligent manufacturing approach, among others.

J.G. Cruz
328 Results: LDFSS tools applied into APQP Process for NPD
Based on the theoretical background presented in the earlier section, we can focus on key elements of lean design for six sigma tools that can be introduced into the advanced product quality planning process for new product development (see Fig. 7).
Figure 7. Lean Design for Six Sigma Key Tool (by Cruz, J.)
The full APQP process includes five stages or gates for the NPD process, with each step contributing to the main goal of increasing cost effectiveness and optimizing the length of the time-to-market cycle. Each step in the process includes specific tools, such as project management, quality function deployment, finite element analysis, design of experiments, and failure mode and effect analysis. The aim of this APQP case study is to present evidence of the introduction of key tools from lean design for six sigma into NPD and indicate the influence of these tools on product quality and reliability.
The following figure (see Fig. 8) contains a waterway for a commercial faucet or service sink that is composed of three main elements: a brass waterway, a water spout and an o-ring. To further analyze the potential failure modes while making the product design gate a useful tool, failure mode and effect analysis can be used (see Table. 1). The FMEA process can be used in the design gate to identify the RPN (risk priority number). In this example, the failure mode that triggers an RPN 240 occurs when the system begins leaking
I. Marketing & Business Case
• Project Management
• QFD
II. Planning • Design Review • DFMEA • FEA • DOE & SPC • GD & T
III. Product Design
• PFMEA • DOE & SPC • Process Simulation
IV: Process Design • Run at Rate
V. Product and Process Validation
Six Sigma Design & Low Cost Manufacturing
329
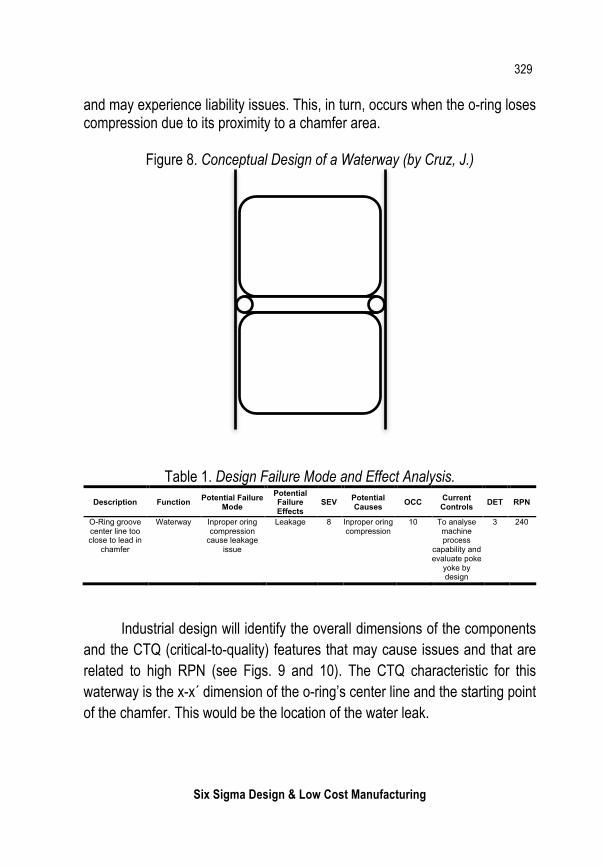
and may experience liability issues. This, in turn, occurs when the o-ring loses compression due to its proximity to a chamfer area.
Figure 8. Conceptual Design of a Waterway (by Cruz, J.)
Table 1. Design Failure Mode and Effect Analysis. Description Function Potential Failure
Mode Potential Failure Effects
SEV Potential Causes OCC Current
Controls DET RPN
O-Ring groove center line too close to lead in
chamfer
Waterway Inproper oring compression
cause leakage issue
Leakage 8 Inproper oring compression
10 To analyse machine process
capability and evaluate poke
yoke by design
3 240
Industrial design will identify the overall dimensions of the components and the CTQ (critical-to-quality) features that may cause issues and that are related to high RPN (see Figs. 9 and 10). The CTQ characteristic for this waterway is the x-x´ dimension of the o-ring’s center line and the starting point of the chamfer. This would be the location of the water leak.

J.G. Cruz
330
85.C
Figure 9. Critical Dimensions Related to Industrial Design (by Cruz, J.)
Figure 10. Spout Tube and O´ring Leak Free Feature (by Cruz, J.)
CTQ 41.A
43.B

Six Sigma Design & Low Cost Manufacturing
331
Industrial design based on GD&T (geometrical design and tolerance) and DFMEA can be used to determine the tolerance for each design reference (see Eq. 1). The following calculation produces the upper and lower limits for the key dimensions.
A = 0.125 + - 0.006. (nominal value) (1)
USL = 0.131.LSL = 0.119.
B = 0.750 + - 0.006. (nominal value) (2)
USL = 0.756.LSL = 0.744.
C = 0.625+−0.020. (nominal value) (3)
USL = 0.645.LSL = 0.605.
DOE and SPC are state-of-the-art techniques for simulating product
performance through manufacturing (see Fig. 11). A process capability study shows evidence of the occurrence of failure when the system begins to leak. Statistical analysis yields sufficient evidence to confirm that the key dimension “c” is at a minimum according to the probability plot analysis, and 3D software can be used to recalculate the minimum “c” (see Fig. 12). To calculate the delta, it is necessary to take the “c” mean sample value and the standard deviation (see Eq. 2) to calculate the natural upper limit and subtract from it the nominal “b” critical delta. The delta can also be shown in a normal histogram plot (see Fig. 13).

J.G. Cruz
332
CTQ
Figure 11. Machine Process Probability Analysis (by Cruz, J.).
0,80,70,60,50,40,30,20,1
99
95
90
80
7060504030
20
10
5
1
Data
Cum
Perc
enta
ge
0,1249 0,001665 30 0,594 0,1120,7503 0,001839 30 0,440 0,2730,6251 0,02203 30 0,366 0,412
Media Desv.Est. N AD P
ABC
Variable
Normal - 95% de ICProbability Plot Analysis for Key Variables: A, B and C.
Figure 12. Waterway Leak Free Compromised - Failure Mode Occurrence (by Cruz, J.)

Six Sigma Design & Low Cost Manufacturing
333
Figure 13. CTQ Condition Based on Random Sampling Analysis (by Cruz, J.)
0,760,720,680,640,60
18
16
14
12
10
8
6
4
2
0
Data
Frec.
BC
Variable
Histogram for Key Variables: B and C.
Once the machine process capability is known, it can be input into a
stack-up tolerance analysis to calculate the process drift in addition to a safety factor (see Fig. 14 and Eq. 3). The process drift is 1.63. sigma in addition to a safety factor of 15% to create a larger space from the upper natural limit of “c” to the lower natural limit of “b”.

J.G. Cruz
334 Figure 14. Tolerance Analysis for Key Dimension C (Based on CTQ condition,
by Cruz, J.).
0,680,660,640,620,600,580,56
No paramétrico
Normal
0,680,660,640,620,600,580,56
0,680,660,640,620,600,580,56
99
90
50
10
1
Porc
entaj
e
N 30Media 0,625Desv.Est. 0,022
Inferior 0,569Superior 0,681
Inferior 0,590Superior 0,682
AD 0,366Valor P 0,412
Estadísticas
Normal
No paramétrico
Prueba de normalidad
Tolerance Interval Analysis for Key Variable C.Intervalo de tolerancia de 95%
Al menos 95% de la población cubierto
Gráfica de probabilidad normal
This approach focuses on the downsizing strategy of RPN while
reducing the opportunity of failure occurrence; following this approach, RPN decreases from 240 to 48 (see Table 2).
Table 2. DFMEA Revaluation (Effect on RPN).
Actions Recommended Resp. Actions
Taken SEV OCC DET RPN
To incorporate a safety factor on feature to eliminate the risk of failure mode
Design Eng. Safety factor implemented
8 2 3 48
The new “c” dimension can be calculated accordingly (see Eq. 4) and
theoretical new cross section of “c”. An illustrative histogram plot of the new redesigned “c” versus old “c” is shown on Fig. 16.

Six Sigma Design & Low Cost Manufacturing
335
CTQ
UNL = 0.625+3 0.022( ) = 0.691. (4)
Δ = 0.750− 0.691. = 0.059.
PD =0.645− 0.681
0.022"
#$
%
&'=1.63σ . (5)
PDsf 15% =1.63σ *1.15=1.87σ .
C* = 0.625−1.87σ (6)
C* = 0.625−1.87(0.022) = 0.583.
C* = 0.583+−0.02
C*USL = 0.603.C*LSL = 0.563.
Figure 15. Conceptual Design for Revised Key Variable Dimension of C (by Cruz, J.)

J.G. Cruz
336
Figure 16. Theoretical Analysis for Revised Key Variable Dimensions of C (by Cruz, J.)
0,760,720,680,640,60
18
16
14
12
10
8
6
4
2
0
Data
Frec
.
BC
Variable
0,750,720,690,660,630,600,570,54
30
25
20
15
10
5
0
Data
Frec
.
BNew C
Variable
Histogram for Key Variables: B and C. Histogram for Key Variables B and C*.
Discussion
This study presented the theoretical background on the NPD process and related functions in today’s organizations as it relates to competition. NPD was identified as one of the top priorities of every firm, which is why the NPD process must be optimized and oriented toward customers to ensure the quality and reliability of products while minimizing manufacturing costs. To fully deploy all NPD tools requires basic steps such as the following: marketing and planning, design, process, product process validation and the integration of operations from a concurrent engineering standpoint.
Lean design tools can easily be introduced into the advanced product quality planning process to ensure the implementation of cost-effective new product development processes intended to ensure product and process reliability and minimize failure during the design stage. This approach will

Six Sigma Design & Low Cost Manufacturing
337
significantly impact goals regarding product quality and reliability and customer expectations.
The effect on timing and cost is greatly appreciated by top management, and it is well known throughout the firm when a strong, reliable product is launched that it is flawless. All departments involved in the introduction of new products are aligned with the top priorities: 1) safe launch, 2) reliable product quality, 3) timing, and 4) budget. Although these four priorities appear to be opposing, they that must be met concurrently to ensure a successful NPD launch.
The case study presents a typical, straightforward design. Even when the design and development stages are complete, there is are opportunities for improvement when the new product enters the manufacturing process, as it is possible to address the potential for failure due to leaks. This case study shows the application of the traditional stage-gate process, which employs a very basic concept of a safe NPD launch, but not the application of the advanced product quality planning framework, which aims for a flawless and cost-effective NPD launch.
The NPD tool kit integrates DFMEA, CTQ, FEA, DOE, and simulation, among others, which are used in the advanced product quality planning framework. In the case study, the RPN decreased from 240 to 48. Although the potential for failure remains, the occurrence of failure was reduced to a parts per million measure in the single digits, which indicated that excellence in manufacturing and reliable product quality had been achieved in addition to low-cost manufacturing. The tools work, and the knowledge is there; top management must simply support the use of this approach to ensure successful NPD launches. Using this approach will earn firms high recognition among end consumers due to their product quality and readiness for manufacturing.
References Afazov, S.F., Becker, A.A., Hyde, T.H. (2012). Development of a Finite Element Data
Exchange System for chain simulation of manufacturing processes. Advances in Engineering Software, 47(1), 104-113.

J.G. Cruz
338 Afonso, P., Nenus, M., Paisana, A., and Braga, A. (2008), The Influence of Time to Market
and Target Costing in the New Product Development Success. International Journal Production Economics, 115(2), 559-568.
APQP. (2007). Advanced Product Quality Planning. AIAG, 6. Retrieved from: https://www.aiag.org/source/Orders/index.cfm?section=orders&activesection=AiagPubs&task=0.
Atuahene-Gima, K. (1995). An exploratory analysis of the impact of market orientation on new product performance: A contingency approach. Journal of Product Innovation Management, 12(4), 275-293.
Azharul, K., M., Marcel, E., Amin, Md. Al. (2011). A method for evaluating lean assembly process at design stage. In The 9th Global Conference on Sustainable Manufacturing, 28-30 September 2011, LENEXPO Exhibition Center, St. Petersburg, 22-27.
Baker, W. E., & Sinkula, J. M. (2005). Market orientation and new product paradox. Journal of Product Innovation Management, 22(6), 483-502.
Baril, C., Soumaya, Y., Clément, B. (2011). Design for Six Sigma through collaborative multiobjective optimization. Computers & Industrial Engineering, 60(1), 43-55.
Breyfogle, F. W. III, (1999). Implementing six sigma: Smarter solutions using statistical methods. New York: Wiley-Interscience.
Chan, S.L., Ip, W.K., Kwong, C.W. (2011). Closing the Loop Between Design and Market for New Product Idea Screening Decisions. Expert Systems with Applications, 38(6), 7729-7737.
Chang, H.C., Tsai, M.T., Tsai, C.H. (2011). Complex Organizational Knowledge Structures for New Product Development Teams. Knowledge-Based Systems, 24(5), 652-661.
Chen, W., Wiecek, M. M., & Zhang, J. (1999). Quality utility – A compromise programming approach to robust design. Journal of Mechanical Design, 121(2), 179-187.
Cloke, B. (2000). Lean products start with lean design. Advanced Manufacturing, 2(2), 35-39. Cooper, R.G. (2001). Winning at New Products: Accelerating the process from idea to launch.
3rd. New York [etc.]: Basic Books. Cristiano, J. J., Liker, J. K., & White, C. C. III, (2000). Customer-driven product development
through quality function deployment in the US and Japan. Journal of Product Innovation Management, 17(4), 286-308.
Eggert, R. J. (1991). Quantifying design feasibility using probabilistic feasibility analysis. In ASME Advances in Design Automation, 1991, New York, N.Y: American Society of Mechanical Engineers, 235-240.
Six Sigma Design & Low Cost Manufacturing
339
Fernandez, B.I., Sabherwal, R. (2001). Organizational knowledge management: a contingency perspective, Journal of Management Information Systems, 18(1), 23-25. Kano, N., Seraku, N., Takahashi, F., & Tsuji, S. (1984). Attractive quality and must be quality. Quality, 14(2), 39-48.
Fornell, C., & Wernerfelt, B. (1987). Defensive marketing strategy by consumer complaint management: A theoretical analysis. Journal of Marketing Research, 24(4), 337-346.
Freiesleben, J. 2010. Proposing a new approach to discussing economic effects of design quality, International Journal of Production Economics, 124(2), 348-359.
Goetsch, D. L., and Davis, S. B. (2010), Quality Management for Organizational Excellence: Introduction to Total Quality, New Jersey: Pearson Education.
Govindaluri, S.M.; Cho, B.R. (2007). Robust design modeling with correlated quality characteristics using a multicriteria decision framework, International Journal of Advanced Manufacturing Technology, 32(5-6), 423-433.
Griffin, J., Hauser, R. (1996). Integrating R&D and marketing: a review and analysis of the literature, Journal of Product Innovation Management, 13(3), 191-215.
Grinstein, A. (2008). The effect of market orientation and its components on innovation consequences: A meta-analysis. Journal of the Academy of Marketing Science, 36(2), 166-173.
Grunert, K., Verbeke, W., Kügler, J., Saeed, F., Scholderer, J. (2011). Use of consumer insight in the new product development process in the meat sector. Meat Science, 89(3), 251-258.
Handfield, R. B., Ragatz, G. L., Petersen, K. J., and Monczka, R. M. (1999), Involving Suppliers in New Product Development. California Management Review, 42(1), 59-82.
Heinzen, M., Höflinger, N. (2011). Engineers in R&D: The impact of human resource practices on combining lean product development and continuous innovation, Karlsruhe Institute of Technology, 49(2), 30-51.
Henderson, S., Bhalla, A., Chang, H.C., Huang, C.M. (2005). Initial study of R&D marketing interface theory within Taiwanese hi-tech industry, in: Conference of 2005 Technology Management ROC, Tainan, Taiwan.
Jahansson, H., Astrom, P., Orsborn, K. (2004). A system for information management in simulation of manufacturing processes, Advanced Engineering Software, 35(10-11), 725-733.
Karim, M.A., Karim, M. A. Samaranayake, P. Smith, A. J. R. Halgamuge, S. K. (2009). An on-time delivery improvement model for manufacturing organizations. International Journal of Production Research, 99(1), 1-22.

J.G. Cruz
340 Kirca, A. H., Jayachandran, S., & Bearden, W. O. (2005). Market orientation: A meta-analytic
review and assessment of its antecedents and its impact on performance. Journal of Marketing, 69(2), 24-41.
OCDE. (2012). Global Competitiveness Report 2011-2012. Retrieved from: http://reports.weforum.org/global-competitiveness-2011-2012/-
Pang, J., Zhang, G., Chen, G. (2011). Application of aggregate analysis for product design quality using QFD model and TOPSIS. MECHANIKA, 17(6), 661-664.
Park, Y., Sungjoo, L. (2011). How to design and utilize online customer center to support new product concept generation. Expert Systems with Applications, 38(8), 10638-10647.
Pietrzyk, M., Madej, L., Weglarczyk, S. (2008). Tool for optimal design of manufacturing chain based on metal forming. CIRP Ann – Manufacturing Technology, 57(1), 309-312.
Plambeck, N. (2012). The development of new products: The role of firm context and managerial cognition. Journal of Business Venturing, 27(6), 607-621.
Rasli Muslimen, A. S. Z. A., Norzima Zulkifli, R. M. Y., Md. Ismail, Y. (2012). An Exploratory Study on the Critical Success Factors for Design Capabilities Development. Operations and supply chain management, 5(1), 14-26.
Rodríguez, J., Carbonell, P., Rodríguez, A. (2011). Speed or quality? How the order of market entry influences the relationship between market orientation and new product performance. International Journal of Research in Marketing, 28(2), 145-154.
Schulze, A., Heinzen, M., Mayrl, P., Schmitt, P., Heller, D., & Boutellier, R. (2010). Managing Lean Product Development: Mapping the literature. Unpublished Working Paper.
Sharma, J.R.; Rawani, A.M. 2007. Ranking customer requirements in QFD by factoring in their interrelationship values, Quality Management Journal, 14(4), 53-60.
Su, C., Chen, Y., & Sha, D. Y. (2006). Linking innovative product development with customer knowledge: A data-mining approach. Technovation, 26(7), 784-795.
Taguchi, G. (1993). Taguchi on robust technology development. New York: ASME Press. Ulrich, K. (1995). The role of product architecture in the manufacturing firm. Research policy.
24(3), 419-440. Walton, M. (1999). Strategies for Lean Product Development. Massachusetts Institute of
Technology Working Paper Series, WP99-01-91, 91p. Womack, J., & Jones, D. (1996). Lean thinking. Simon & Schuster: New York. Yu, J.-C., & Ishii, K. (1998). Design for robustness based on manufacturing variations
patterns. Journal of Mechanical Design, 120(2), 196-202. Zhenyuan, J., Xiaohong, L., Wei, W., Defeng, J., Lijun, W. (2011). Design and Implementation
of Lean Facility Layout System of a Production line, 18(5), 260-269.