DESIGN FOR LIVEABLE CITIES 2017 -...
155
Sustainable and Resilient Cities: The Way Forward 2 nd International Conference on SUSTAINABLE URBAN DESIGN FOR LIVEABLE CITIES 2017 In conjunction with UTMRS 1 st INTERNATIONAL CONFERENCES IN ADVANCED TECHNOLOGY 2017 (UTMRS-ICAT 2017) 10 TH October 2017 l Renaissance Hotel, Kuala Lumpur Editors Khairul Hisyam Kamarudin Wan Nurul Mardiah Wan Mohd Rani Mohammad Hussaini Wahab Rohayah Che Amat Tuti Haryati Jasimin PROCEEDINGS
Transcript of DESIGN FOR LIVEABLE CITIES 2017 -...

1
Sustainable and Resilient Cities:
The Way Forward
2nd International Conference on SUSTAINABLE URBAN
DESIGN FOR LIVEABLE CITIES 2017 In conjunction with
UTMRS 1st INTERNATIONAL CONFERENCES IN ADVANCED TECHNOLOGY 2017
(UTMRS-ICAT 2017)
10TH October 2017 l Renaissance Hotel, Kuala Lumpur
Editors Khairul Hisyam Kamarudin
Wan Nurul Mardiah Wan Mohd Rani Mohammad Hussaini Wahab
Rohayah Che Amat Tuti Haryati Jasimin
PROCEEDINGS

2
Published by:
UTM RAZAK SCHOOL of Engineering and Advanced Technology
Universiti Teknologi Malaysia Kuala Lumpur
Jalan Semarak, 54100 Kuala Lumpur
Malaysia
Tel: (6)03-2180 5138 l Fax: (6)03-2180 5380
Email: [email protected] / [email protected]
ISBN 978-967-15384-1-8
Printed in Malaysia
First Print 2017
Perpustakaan Negara Malaysia
Proceedings of the 2nd International Conference on Sustainable Urban Design for Liveable Cities
(SUDLiC) 2017
Copyright © 2017 UTM Razak School Kuala Lumpur
All rights reserved.
No parts of this publication may be reproduced, stored in retrieval system, or transmitted in any
form or by any means, electronic, mechanical, photocopying, recording, or otherwise, without the
written permission of the publisher.
3
PREFACE
In line with UTM vision of “Being Center for Academic Excellence and World Class
Technology through Creativity”, this 2nd international conference aims to be an international
platform for sharing the latest ideas and technology between industry and universities. This
conference hopes to improve an understanding and research in the field of sustainable urban
design and livable cities as well as from other related themes. Hence, this conference will
establish the superiority of UTM as a university that pioneered the field related to urban design
and urban planning, sustainability and architecture in Malaysia. Five sub themes of the
conference are; 1) Sustainable urban design, planning and development; 2) Safe and liveable
cities; 3) Resilient and healthy cities; 4) Sustainable architecture and design, and; 5) Asset and
facilities management.
With the line of invited distinguished keynote speakers, and paper presenters, the conference
will become the platform to gather experts, researchers, academicians, and students in various
fields involving sustainable urban design, architecture and urban planning as well as other areas
in the built environment.
It is our hope that through the presentation and discussions during the conference, participants
will gather new knowledge and discover latest updates and development on the issues and topics
related to sustainable urban design, planning and development, as well as on other aspects of
liveable and resilient cities agenda. All papers which have been included in this proceeding
were subject to a blind peer review process to ensure good quality papers and presented in the
conference as well as in this proceedings.
Khairul Hisyam Kamarudin
Wan Nurul Mardiah Wan Mohd Rani
Mohammad Hussaini Wahab
Rohayah Che Amat
Tuti Haryati Jasimin
Editors
Proceedings of “the 2nd International Conference on Sustainable Urban Design for Liveable
Cities (SUDLiC) 2017”

4
CONTENTS
Copyright page 2
Preface 3
Table of Content 4-6
Theme: Sustainable Urban Design, Planning and Development
Papers
1 Bonus Zoning as Zoning Regulation Tool to Provide Public Space in Bandung
Tika S. D. Hasan, Denny Zulkaidi
7
2 Comfort Character for Traditional Street Users: A Case Study of Rainbow
Street, Amman
Saja Jamil Alamoush, Nor Haslina Ja'afar, Elina Mohd Husini, Wan
Norisma Wan Ismail
10
3 The Viability of an Integrative Framework for Urban Design and Regional
Environmental Justice
Stephen T. F. Poon
14
4 Preliminary Examination of Design Characteristics of a Pedestrian Friendly
Shopping Street in Kuala Lumpur
Ishaq Faheem Mushtaq Ahmed, Khairul Hisyam Kamarudin, Ungku Norani
Sonet Ungku Abdul Rahman
17
5 Revitalization of Role of Mosque as Node in Urban Area
Ungku Norani Sonet Ungku Abdul Rahman, Khairul Hisyam Kamarudin,
Ishaq Faheem Mushtaq Ahmed
21
6 Sustainability Assessment for Higher Education Institutions (HEI): A Literature
Study
Nadzirah Zainordin, Syuhaida Ismail
26
7 Experiential Virtual Urban Environments: A Preliminary Investigation
Izham Ghani, Norhafizah Abdul Rahman, Azrul Bahaluddin, Nadiyanti
Mat Nayan
31
8 Development of Urban Market Spatial for Highest and Best Used of Land
Productivity and Sustainability
Christiono Utomo, Yani Rahmawati, Cahyono Bintang Nurcahyo, Iman
Krestawan
34
9 Identity and the Malaysian City: Dichotomies and Realities of Creating an Urban
Language of the Modern Malay Palace
Puteri Shireen Jahn Kassim, Tengku Anis Qarihah Raja Abdul Kadir,
Nurul Syala Abdul Latip
38
10 Sense of Community and Social Sustainability: The Role of Public Open Spaces
Abu Bakar Siddiq Usman
42
11 Morphological Patterns of the Shaded Urban Space: An Evolution of Pre-to
Post-Colonial Configurations of Malay Urban Tropicality
Puteri Shireen Jahn Kassim, Nor Zalina Harun, Shaiful Nadzri Samsuddin
45
12 Governance of Urban Heritage – A Review on Adaptive Reuse of Heritage
Buildings
Mohd Shakir Tamjes, Wan Nurul Mardiah Wan Mohd Rani, Mohammad
Hussaini Wahab, Rohayah Che Amat, Syuhaida Ismail
51
13 The Urban River and the Historic Riverfront Townscape of Kuala Lumpur
Mohd Zafarullah Rozaly, Mohammad Hussaini Wahab, Mohamad Asri
Ibrahim
54

5
Theme: Safe and Liveable Cities
Papers
1 The Impact of Freight Vehicle Access Restriction on the Sustainability of
Jakarta Intra Urban Toll Way System
Nahry Yusuf
60
2 The Impact of Road Gradient and Truck Composition on the Toll Road Traffic
Performance
Nahry Yusuf
67
3 Investigation on the Willingness to Walk and Accessibility to Bus Stops in
Penang
Nur Sabahiah Abdul Sukor, Wan Nadhira Wan Zauki, Siti Fadhlina
Muhammad Fisal
72
4 The Influence of Walkability towards Urban Street Design in Kuala Lumpur
Hamizan Ridzuan Johar Razali, Siti Uzairah Mohd Tobi, Siti Fatimah
Ilani Bilyamin, Mohammad Hussaini Wahab
76
5 Physical Characteristics of a Public Square in Malay Royal Town
Sharyzee Mohmad Shukri, Mohammad Hussaini Wahab, Mohamad Asri
Ibrahim, Mohd Zafarullah Rozaly
81
6 Regenerating Pudu Marketplace and Urban Identity
Mohamad Asri Ibrahim, Mohammad Hussaini Wahab, Mohamad Shahryzee
Shukri, Mohd Rifzal Mohd Sharif
87
7 Physical Design of Street that Affect Safety Perception
Suhaila Abdul Rashid, Mohammad Hussaini Wahab, Wan Nurul
Mardiah Wan Mohd Rani, Syuhaida Ismail
94
8 The Key to be a Walkable City
Siti Fatimah Ilani Bilyamin, Mohammad Hussaini Wahab,
Khairul Hisyam Kamarudin
99
9 The Challenges of Urban Development in Iran, Focusing on the City of
Kermanshah
Kayoumars Irandoost, Hooshmand Alizadeh, Mohammad Rasouli
106
Theme: Resilient and Healthy Cities
Papers
1 An Assessment of Quality of Space through the User’s Perception to Improve
Physical Environment
Janjira Sukwai, Nobuo Mishima
113
2 Social Capital among Ageing Residents of Housing Complexes in Suburban
Tokyo: The Case of Haraichi-Danchi and Oyamadai-Danchi in Ageo City
Nadhirah Nordin, Hitoshi Nakamura
120
3 Malaysia Efforts in Transforming Melaka into Resilient City
Intan Syafinar Jamaludin, Noralfishah Sulaiman
123
4 The Influence of Needs in the Shelter Design of the Extreme Poor: Case Study
of Padang Jawa, Selangor and Butterworth, Penang
Iryani Abdul Halim Choo, Zaharah Yahya, Suzana Said, Nazrul Helmy
Jamaludin
127
5 Climate and Disaster Resilient Cities: Challenges for Malaysia
Wan Nurul Mardiah Wan Mohd Rani, Khamarrul Azahari Razak,
Khairul Hisyam Kamarudin, Rozaimi Che Hassan
133

6
Theme: Sustainable Architecture and Design
Papers
1 Measuring the Sway of Imperceptible Factors in Shaping the Distinct Character
of Ancient Indian Architecture and City Planning
Tamara Kelly
137
2 Architectural Practices of Project Communication Management in Iraq
Hala Taleb, Syuhaida Ismail, Mohammad Hussaini Wahab, Wan Nurul
Mardiah Wan Mohd Rani, Rohayah Che Amat
142
Theme: Asset and Facilities Management
Papers
1 Understanding the Role of Facility Management and Facility Manager in
Solving Poor Indoor Air Quality
Nur ‘Afiqah Jaini, Noralfishah Sulaiman
147
2 An Overview of Implementation Outsourcing Services of Facilities
Management in Malaysian Private Hospitals
S.S. Kadir, S.U. Mohd Tobi, T. H. Jasimin
150

7
UTM Razak School of Engineering and Advanced Technology
Kuala Lumpur, Malaysia
10 October 2017
SD 3 - BONUS ZONING AS ZONING REGULATION TOOL TO
PROVIDE PUBLIC SPACE IN BANDUNG
Tika S. D. Hasan*1 and Denny Zulkaidi2
1, 2 School of Architecture, Planning, and Policy Development Institut Teknologi Bandung,
Bandung, INDONESIA.
([email protected], [email protected])
ABSTRACT
Despite the common practice of Bonus Zoning in other countries, it is still relatively new
in Indonesia. Bonus Zoning is a zoning regulation tool that allows developers to get more
density in exchange for public facilities improvement or provision. Bandung in particular
has already set it out within their Local Regulation No.10/2015 on Detailed Spatial Plan
and Zoning Regulation. However, the mechanism of Bonus Zoning application in Bandung
is not yet clear. This research aims to investigate: a) The rationale behind application of
Bonus Zoning in Bandung; b) Assessment of the carrying capacity of the area to be applied
for as well as the consequences of implementation in said area; and c) Requirement for
Bonus Zoning implementation and calculation method for the accompanying compensation.
A qualitative method will be used to review literatures, legal documents regarding planning
and development in Bandung as well as related issues such as heritage/conservation
building and tourism for each matter has its own legal consideration. This is an on going
research that expect to see result on which area are actually suitable to implement Bonus
Zoning and its compensation in order to become the basis for sustainable planning in
Bandung that is not only benefit the developers but also the public as user.
Key words: zoning regulation, bonus zoning, public space
INTRODUCTION
Bonus Zoning is one of the alternative of Bandung zoning regulation tools that is contained
in Local Regulation No. 10/2015 on Bandung Detailed Spatial Plan and Zoning Regulation,
in addition to other regulatory techniques namely transfer of development rights, growth
control, and overlay regulations. In that Local Regulation, Bonus Zoning is listed in Article
310 which directs its application at City Centres (Pusat Pelayanan Kota/PPK), Sub-City
Centres (Sub Pusat Pelayanan Kota/SPPK), City Strategic Area based on economic
interests, integrated area with transit oriented development (TOD) concept, public service
center with functions comprising traditional buildings and other functions, as well as the
construction site of public housing flats for low-income communities constructed by private
parties or in cooperation with private parties. Bonus Zoning or in some literature referred
to as Incentive Zoning is a preventive measure of development and improvement provided
to the developer with provision of public facilities such as arcade, plaza, pedestrian ways,

8
loading and unloading space off the street to avoid congestion, etc in accordance with
applicable regulations. The practice of Bonus Zoning has been formally done in New York
USA since 1961 where public plazas were built by the developers in exchange for
supplementary Floor Area Ratio (FAR) for buildings in high-rise areas (Smithsimon, 2008).
Although there are some drawbacks in its practice, incentives like this can be a beneficial
alternative for the public and the developer because it can meet the needs of both sides that
will support the development of the city.
MAIN RESULTS
When analyzed in more detail according to the, the status of land carrying capacity for urban
development is spatially uneven. Based on the study of Bandung Carrying Capacity in 2012, it
showed that in 2010 most of the sub-districts have experienced deficit of land carrying capacity.
Among 30 sub-districts, only 7 surplus sub-districts (Lengkong Subdistrict, Gedebage,
Panyileukan, Cinambo, Sumur Bandung, Bandung Wetan and Cidadap). Later in 2031, all
districts are projected to experience deficit except for Bandung Wetan Sub-District whose ratio
is still surplus. This means that intensification of land use needs to be done in all sub-districts,
in addition to urban development expansively in the suburbs of Bandung especially in the
eastern part.
Even though there are 23 designated area for Bonus Zoning has been set out in the Local
Regulation, there are still limitations to consider in order to grant Bonus Zoning which are:
1) Conditions carrying capacity of Bandung city leading to the development of the eastern part
of the city; 2) Main infrastructure conditions such as road network and road class; 3) The
objection of development; 4) Designated area for flight safety operation (KKOP); and 5) The
impact of development such as traffic generation, air and sound pollution, waste, etc. Based on
these concerns, we rank the priority level for Bonus Zoning application with green indicates the
highest priority and red being the lowest priority for additional development intensity.
Figure 1. Bonus Zoning Priority Level

9
CONCLUSION
In addition to the proposed development site to obtain additional density, the location of the
compensated public space is also important to take into account. Conditions of the compensated
public space must: a) Meet the area carrying capacity; b) Not located within heritage
conservation area/building; c) Not violate any established Zoning Regulations on Local
Regulation; d) Not reduce the minimum Green Coverage Ratio; e) Consider the availability and
capacity of public infrastructure and utilities; f) Consider the standards for public facilities and
infrastructure needs; g) Not located within allocated protected green area. As this is an on going
research, further output are still being investigated such as how to calculate the compensation
based on priority level shown on Figure 1. We also expect to discover the index based on this
priority level.
Acknowledgment: Researchers would like to acknowledge Ministry of Research Technology
and Higher Education of Republic Indonesia for their funding under Higher Education Research
of Excellent scheme that made this research possible.
REFERENCES
[1]. Barnett, J., 1974. Urban design as public policy. New York: Architectural Record and McGraw-Hill
[2]. Benson, N., 2009. A tale of two cities: Examining the success of inclusionary zoning ordinances in Montgomery County, Maryland and
Boulder, Colorado. J. Gender Race & Just., 13, p.753. [3]. Costonis, J.J., 1972. The Chicago Plan: Incentive Zoning and the Preservation of Urban Landmarks. Harvard Law Review, pp.574-634.
[4]. Dijkstra, Lewis. 2000. Public spaces: A comparative discussion of the criteria for public space. In Constructions of public space:
Research in urban sociology. Vol. 5, edited by Ray Hutchinson, 1—22. Stamford, CT: JAI. [5]. Ellickson, R.C., 1973. Alternatives to zoning: covenants, nuisance rules, and fines as land use controls. The University of Chicago Law
Review, 40(4), pp.681-781
[6]. Ellickson, R.C., 1980. Irony of Inclusionary Zoning, The. S. Cal. L. Rev., 54, p.1167. [7]. Glassford. 1988. Regulating Appearance in Solnit et al.. The Job of The Practicing Planner. Washington DC: Planners Press
[8]. Kohn M, 2004 Brave New Neighborhoods: The Privatization of Public Space (Routledge, New York)
[9]. Lang, J.T., 2005. Urban design: a typology of procedures and products. Routledge
[10]. Lees, Loretta. 1998. Urban renaissance and the street: Spaces of control and contestation. In Images of the street: Planning, identity and
control in public space, edited by Nicholas R. Fyfe, 236—53. New York: Routledge
[11]. Punter, J., 2002. Urban design as public policy: evaluating the design dimension of Vancouver's planning system. International planning studies, 7(4), pp.265-282
[12]. Németh, J. and Schmidt, S., 2011. The privatization of public space: modeling and measuring publicness. Environment and Planning B:
Planning and Design, 38(1), pp.5-23. [13]. Roeseler & McClendon, 1986. Making Zoning Districts More Effective. Journal of the American Planning Association Vol.52
No.1/Winter 1986, pp.83-86
[14]. Scheer, 1994. Design Review: Challenging Urban Aesthetic Control. New York: Chapman & Hall [15]. Seyfried, W.R., 1991. Measuring the feasibility of a zoning bonus. Journal of the American Planning Association, 57(3), pp.348-356
[16]. Smithsimon, 2008. Dispersing the Crowd Bonus Plazas and the Creation of Public Space. Urban Affais Review Vol.43 No.3 pp.325-
351

10
UTM Razak School of Engineering and Advanced Technology
Kuala Lumpur, Malaysia
10 October 2017
SD 7 - COMFORT CHARACTER FOR TRADITIONAL STREET
USERS, A CASE STUDY OF RAINBOW STREET, AMMAN
Saja Jamil Alamoush*1, Nor Haslina Ja'afar 2, Elina Mohd Husini 3, Wan Norisma Wan
Ismail 4
1, 2 Architecture Department, Secretariat of National Identity,
Faculty of Engineering and Built Environment,
Universiti Kebangsaan Malaysia (UKM) Bangi Selangor.
[email protected], [email protected] 3,4 Department of Architecture, Faculty of Engineering and Built Environment
Universiti Sains Islam Malaysia. Kampung Baharu Nilai, Negeri Sembilan. [email protected],[email protected]
ABSTRACT
Comfort in an urban environment includes pleasant state of physiological, psychological and
physical harmony between a human being and the environment, it is about the users’
satisfaction of the place. Fast expanding of urban development changes the street function and
gives priority for vehicles, which effects in the urban fabric and cultural life of the city. It makes
the walking environment in the street difficult and uncomfortable. Hence, the main aim of this
paper is to explore the appearance of physical elements that contribute towards the comfortable
character of a successful traditional street environment. The case study was conducted on
Rainbow Street in Amman the capital city in Jordan. Mixed-method was used in this study
which involved direct observation (visual and behavioral) and user perception (questionnaires
and in-depth interviews). The result shows that physical elements that contribute the comfort
character can be categorized into two main categories: landscape (pedestrian amenities and
sidewalk) and building (building condition and building opening), therefore these elements
must be taken into account in designing new street to increase the level of comfort for the street
users.
Key words: Comfort character, Traditional street, Public spaces.
INTRODUCTION
Streets described as the main significant part of the urban open space they also defined as the
bones of the city (Rahmana et al., 2015; Alfrey, 2010). Streets serve as a venue for social
interaction via different types of human behavior, including talking, playing, observing, and
lingering. They are a gathering space for families and friends and sometimes a living room or
a dining room for city dwellers (Oranratmaneea & Sachakul, 2014). According to Carr et al
(1992), there are five major reasons why people go to public places. The reasons include
comfort, relaxation, passive engagement with the environment, active engagement with the
environment and discovery (Carr et al., 1992). Rahmana et al (2015) identified comfort as the
most basic of needs and the most important design criterion for a livable street as it has a direct

11
effect on place satisfaction (Rahmana et al. 2015). Comfort is not just offering protection from
the sun, the wind, and rain, but also providing a physiologically suitable setting at the street
environment to support a convenient environment where various activities and outdoor culture
events can occur in open public spaces (Hajmirsadeghi, 2015; Mehta, 2006). It’s about
providing safe, accessible, convenience and pleasant place for people to spend their time and
having their social activities (Zakaria & Ujang, 2015). Thus, it’s the pleasant feel for people
when they interact with the environment.
In this regard, the level of comfort could be determined by the length of time people would
spend in the public space (Carmona et al., 2003; Essoh, 2010). Consequently, comfort is a
characteristic that should be considered when designing a convenient, safe, and friendly street
environment which is one of the basic human needs in urban spaces (Rahmana et al., 2015; Carr
et al., 1992; Carmona et al., 2003; Jacobs, 1996). Thus, comfort is defined as the pleasant state
of physiological, psychological and physical harmony between the human body and the
environment (Zakaria & Ujang, 2015). In modernist urban planning, more attention is paid to
requirements of cars rather than pedestrians’ needs. (Jalaladdini & Oktay, 2012; Ja’afar et al.,
2014). According to Gehl (2015), Public spaces as street become unattractive, unwelcoming
and uninspiring, it’s discouraging people from using it, enjoying their surroundings or having
social activities. These changes can be observed in newly designed buildings and landscapes
that transform discouraging people from using public spaces.
Thus this paper is focused on the physical elements (landscape and building) that contribute
towards comfort on the traditional street. Rainbow Street in Amman capital city of Jordan was
chosen as a case study according to its cultural and historical value identities and characters
(Essoh, 2010), also it’s described as prime spots for socializing especially from mixed-use and
place for different activities (Essoh, 2010).
MAIN RESULTS
The study shows that building and landscape are the main elements that contribute toward
comfort character when walking on the traditional street as shown below in (Table 1).
Table 1. Elements that contribute towards comfort in street
Elements User perception Visual
survey Interview n =21
Yes No £
Survey
n=330
Building
Building openings
20 1 21
200 (60%)
/
Building condition 18 3 21 218 (66%) /
Landscape
Pedestrian amenities
Public toilet 21 - 21 /
Seating
Sidewalk
18 3 21
14 7 21
175 (53%)
194 (58%)
/
/
Building
The analysis of qualitative and quantitative data of this study revealed that building is one of
the main elements that contribute towards comfort character in the traditional street. The

12
analysis shows that building elements that influence comfort character in street are divided into
building condition and opening of a commercial building illustrated as follows:
Building condition: the condition of the building is essential in the traditional street in
contributing to the comfort and safe environment to pedestrians when walking because it
creates visual aesthetic, safe feeling and thus, creating a sense of comfortable welcoming
characters.
Opening of a commercial building: the opening design of the ground floor for commercial
buildings is very important to generate activities, enjoyable and comfortable atmosphere. It
also generates interactions between activities inside and outside the building which
contribute to the comfort character of the traditional street.
Landscape
The analysis of qualitative and quantitative data of this study revealed that landscape features
contribute towards comfort character in the traditional street. These features divided into
pedestrian amenities and Sidewalk illustrated as follows:
Pedestrian Amenities: pedestrian amenities according to this study include public toilet and
seating described as follows:
I. Public Toilet: toilet facilities are essential to provide a comfortable environment. Hence,
the facilities should be clean, well maintained and accessible for all type of users.
II. Seating: seating is intended to ensure the comfortable environment through the (1)
location of seating along the street, (2) suitability of the location e.g. oriented towards
interesting point and shaded area, (3) variety types with different designs such as
benches with backrests or changeable benches to meet all users’ needs and (4) sufficient
number of seating.
Sidewalk: comfortable sidewalk should have a clear distance with sufficient minimum
width to meet the pedestrians’ needs, and this would contribute to the comfort character of
the traditional street. These characters must be taken into account in the design of the new
street through the following approaches: (1) The design of the pedestrian sidewalk with a
minimum size (1.8 m) (2) The sidewalk must be free from any holes or obstacles to ensure
the safety of the pedestrian.
CONCLUSION
This study found that building condition, opening of commercial building, pedestrian amenities
(public toilet and seating), and sidewalk should be taken into account in the design of the new
streets in order to create a comfortable environment for street users because if streets are alive,
comfort pleasant and exciting spaces can attract more people (Mehta, 2006). As in modernist
urban planning, more attention is paid to requirements of cars rather than pedestrians’ needs.
So providing comfortable environment helps in giving back the main role of streets as it
described as “river of life of the city, the place where we come together” (Whyte, 1960,
Shahideh, 2013). Future research should focus on the influence of cultural activities by
observing pedestrian of Rainbow street. Hence, it will provide a more comprehensive
understanding in designing streets.
Acknowledgment: We acknowledge the Faculty of Engineering and Built Environment at
Universiti Kebangsaan Malaysia (UKM) for supporting this research under Fundamental
Research Grant Scheme project (FRGS/1/2015/SSI11/UKM/02/2) and (KOMUNITI-2014-
013).

13
REFERENCES
Alfrey, J. (2010). Studying Urban Character. Aboutwales Buildings • People • Places Studying Urban Character,
(march), 15–18.
Carr,S. et al. (1992 ). Public Space. Cambridge university press, New York.
Carmona, M., Heath, T., Oc, T. and Tiesdell, S. (2003) Public Places, Urban Spaces: The Dimensions of Urban
Design. Amsterdam: Architectural Press.
Essoh , Rai’d.(2010) (Correlation study: the impact of the physical characteristic on success of urban spaces in
Amman.)
Gehl, J. (2015, Dec 18). In Search of the Human Scale | Jan Gehl | TEDxKEA. [Video File]. Retrieved from
https://www.youtube.com/watch?v=Cgw9oHDfJ4k&t=530s
Hajmirsadeghi, Reihaneh.Sadat.(2015) (Design factors that influence the effective use of public square for social
interaction in Iran).
Ja’afar Nor Haslina, N., Usman, I. M. S., Sulaiman, A. B., Husini, E., & Arabi, F. (2014). Urban Street Design
and Character : a Scenario Facing, (April), 1–12.
Jacobs, A. B. (1996). Great streets. Cambridge, Massachusetts: The MIT Press
Jalaladdini, S., & Oktay, D. (2012). Urban public spaces and vitality: a socio-spatial analysis in the streets of
Cypriot towns. Procedia-Social and Behavioral Sciences, 35, 664-674.
Mehta, V. (2006). Lively Streets: Exploring the relationship between built environment and social
behavior (Doctoral dissertation).
Oranratmanee, R., & Sachakul, V. (2014). Streets as public spaces in Southeast Asia: Case studies of Thai
pedestrian streets. Journal of Urban Design, 19(2), 211-229.
Rahmana, N. A., Shamsuddin, S., & Ghani, I. (2015). What makes people use the street?.: Towards a liveable
urban environment in Kuala Lumpur city centre. Procedia-Social and Behavioral Sciences, 170, 624-632.
Shahideh, S. (2013). Analyzing the quality of pedestrian street in the case of İstiklal Street in walled city of
Famagusta (Doctoral dissertation, Eastern Mediterranean University (EMU)-Doğu Akdeniz Üniversitesi
(DAÜ)).
Zakaria, J., & Ujang, N. (2015). Comfort of walking in the city center of Kuala Lumpur. Procedia-Social and
Behavioral Sciences, 170, 642-652.

14
UTM Razak School of Engineering and Advanced Technology
Kuala Lumpur, Malaysia
10th October 2017
SD 9 - THE VIABILITY OF AN INTEGRATIVE FRAMEWORK FOR
URBAN DESIGN AND REGIONAL ENVIRONMENTAL JUSTICE
Stephen T.F. Poon
School of Media, Arts & Design Asia Pacific University of Technology & Innovation
INTRODUCTION
The purpose of this paper is to critically evaluate the factors that have contributed to the
development of urban design importance for Malaysia‟s key urban population, and how local
role players have essential roles in establishing stronger environmental justice by encouraging
adoption of green technologies and urban liveability concepts. To discuss this complex issue
from architectural, economic, educational, social, ecological and sustainable design
perspectives, the framework of policies guiding global sustainable development strategies will
be reviewed (Nassauer and Raskin, 2014; Washburn, 2013; Wolch, Byrne and Newell, 2014).
Urban design is the interdisciplinary fields incorporating systematic scientific inquiry, research
and practices to observe, identify, validate and solve issues and problems relating to urban
planning, environmental sustainability and cultural landscape development (Carmona, 2013;
Dovey and Pafka, 2016).
Inevitably, ideological clashes occur within urban design scope of practice: political and
economic investment priorities, extent of natural resources and energy dependence, and the
appropriation of cultural capital representing diverse socioeconomic, sociocultural and
ecological interests, makes urban design a natural site of place-making discussions and in
particular, the environmental justice movement. Theoretical validation of urban design
consists of a breadth of literature debating the viableness of empirical assessment of urban
design quality (Carmona, 2013), while subjective interpretations of urban design functions have
provoked equally fierce debates in academic and practical domains (Dovey and Pafka, 2016).
In between these argumentations, the question of equity for the uses and allocation of public
spaces in terms of economic viability, environmental impact and diversity inclusion and how
they affect the broader social environment, remains a contested concept. By weaving a range
of interdisciplinary fields from architecture, construction, designing, engineering,
environmental and geological sciences, finance, surveying, technologies, and politics, urban
design is intended to provide cities and townships a sustainable thrust in equitable place-
planning, since diversity of various stakeholders‟ views is important: affected citizens are
invited to debate, review, critique, state objections and present alternative opinions to planning
guidelines (Washburn, 2013). The process of designing spaces in urban centres is seldom
acknowledged as explicitly just: design itself, being often “slippery in nature”, features
considered the best solution for the greater good could merely be advantageous and convenient

15
for state planners, land developers or other dominant stakeholder parties (Carmona and
Tiesdell, 2007: pp. 348-9).
The policies and mechanisms applicable in Malaysia’s urban development strategies including
long term initiatives to promote conservation and sustainability agendas, as well as industries‟
and consumers‟ access and participation in initiatives such as low-carbon technologies,
renewable energy, urban farming and place planning diversity will be examined to understand
how local communities, planners and institutions of policy research work collaboratively to
contribute necessary knowledge in urban preservation and the creation of liveable cities.
METHODOLGY
The research offers a uniquely Malaysian insight on the concept of environmental justice, one
that has evolved from localised, community-based sustainability initiatives, all claiming to align
to the framework of objectives as stated under Malaysia’s National Green Technology Policy
(KeTTHA, 2009). These goals aim to inculcate widespread commitment of local stakeholders
to sustainability by reducing energy dependency, promoting ecological awareness, and
encouraging the adoption of green technology innovations in four key areas: energy, buildings
and infrastructure, water and waste management, and transportation. This paper examines
these four aspects through descriptive analysis of three Malaysian case studies: (i) Low-Carbon
Community, (ii) River of Life Project, (iii) Local Agenda 21 Petaling Jaya. The qualitative
mapping of urban design concepts such as adaptiveness, resilience, wellbeing, security, and
liveability enables better understanding of urban phenomena such as randomness and
emergence of urbanisation as this process frames practical components of knowledge, where
assessments of current urban design practices enable further inquiries in the science of design
thinking in urban identity management, as a complementary component of empirical studies
(Dovey and Pafka, 2016).
MAIN FINDINGS
Results of these descriptive case exemplars of urban design planning in Malaysia’s urban
communities significantly demonstrate the importance public-private sector collaborative
dimensions in improving environmental justice outlook for the medium and long term. Specific
focus of urban design analysis is the Iskandar Low-Carbon Blueprint 2025, the River of Life
Project (RoL), and the implementation of Local Agenda 21 (LA21) in the urban transformation
of Petaling Jaya city in the state of Selangor. Qualitative analysis found that several urban
design characteristics which indicate liveability of urban cities fulfil the basic concept of
resilience and adaptive living, but while the understanding of sustainability has increased in the
Malaysian public domain, conflicting questions of socioeconomic and sociocultural value to
stakeholders, linger on. Despite the existence of national policies fostering socially sustainable,
ecologically sound options, an integrative framework that facilitates the growth of liveable
urban cities with socioeconomic and cultural development fundamentals, is still under-
implemented and weak.
For Malaysia, this was found to be due to several reasons, including a lack of support from local
businesses, prohibitive costs of sustainability investments, a lack of awareness about the value
of ecological resources and customary cultural attitudes towards heritage preservation. The
difficulty is compounded with over-urbanisation that creates haphazard infrastructural
aesthetics, resulting in attitudinal dichotomies, indifference and a sense of disconnect between

16
the goals of larger national economic development agenda, and the preservation of artefacts of
community heritage value.
CONCLUSION
Environmental justice goals can be integrated into urban sustainability frameworks through
design planning equity, but these goals will not be achievable without the involvement of action
groups and both public and private sector participants on decision making. Analysing
prevailing or established attitudes and perceived expectations about cooperation in
sustainability planning is crucial as civic engagement and community input assures authorities
that sustainability should be the core to enhancing environmental conditions, but the final
decisions for urban development plans must integrate more community friendly and valuable
heritage features (Mohammad, 2014). Efforts to reduce environmental injustice to low-income
and minority groups must provide mechanisms which promote social equity goals by using
taxation systems linked to energy efficiency initiatives (C40, 2016). Aside from regulatory
considerations, training and awareness for officers and taskforces will be required to build
stronger social capital networks and links between authorities, local community stakeholders
and the media. Proper, decisive and rigorous enforcement of existing urban planning laws and
anti-pollution policies would ensure communities are responsible for their own urban lifestyle
management in aiming for better personal health and social wellbeing.
REFERENCES C40 [Cities Climate Leadership Group] (2016) 100 Solutions for Climate Action in Cities. Copenhagen, Denmark:
Sustainia.
Carmona, M. (2013) „The Place-Shaping Continuum: A Theory of Urban Design Process‟ in Journal of Urban
Design, 19(1): pp. 2-36.
Carmona, M. and Tiesdell, S., eds. (2007) Urban Design Reader. Burlington, MA: Architectural Press/Elsevier.
Dovey, K. and Pafka, E. (2016). The Science of Urban Design? ‟in Urban Design International, 21(1): pp. 1-10.
KeTTHA [Kementerian Tenaga, Teknologi Hijau dan Air / Ministry of Energy, Green Technology and Water]
(2009) National Green Technology Policy. Putrajaya, Malaysia.
Mohammad. N, 2014, „An overview of the environmental justice system in Malaysia and Bangladesh‟,
International Journal of Academic Research, 6, 2, pp. 293-298.
Nassauer, J. and Raskin, J. (2014) „Urban vacancy and land use legacies: A frontier for urban ecological research,
design, and planning‟, Landscape & Urban Planning, 125.
Wolch, J., Byrne, J. and Newell, J. (2014) 'Urban green space, public health, and environmental justice: The
challenge of making cities „just green enough', in Landscape & Urban Planning, 125.

17
UTM Razak School of Engineering and Advanced Technology
Kuala Lumpur, Malaysia
10th October 2017
SD 13 - PRELIMINARY EXAMINATION OF DESIGN
CHARACTERISTICS OF A PEDESTRIAN FRIENDLY SHOPPING
STREET IN KUALA LUMPUR
Ishaq Faheem Mushtaq Ahmed, Khairul Hisyam Kamarudin1 and Ungku Norani Sonet Ungku
Abdul Rahman
UTM Razak School of Engineering and Advanced Technology, Universiti Teknologi
Malaysia Kuala Lumpur Campus, Jalan Sultan Yahya Petra, 54100 Kuala Lumpur
([email protected]; [email protected]; [email protected])
INTRODUCTION
Urbanisation has a tremendous influence on urban spaces, generally, and streets, particularly. One of
the influences, according to Shamsuddin et al. (2010) is the erosion of the street as a public space, which
also influences the relationship between the urban users and social space’s, especially the streets. Streets
are a vital component of the urban form and in the city centres (Rahman, 2014). According to Tibbalds
(1992), streets are where the greatest amount of human contact and interaction takes place. Streets have
traditionally served three main purposes i.e. for mobility, commerce and social interaction (UN Habitat,
2013). The street, normally defined as a public space with residential houses, commercial buildings and
other structures on one or each side, therefore, has social and economic functions that are integral to
urban life (UN Habitat, 2013). Streets are public spaces for people as well as corridors for movement,
marking a shift away from a functional classification of streets categorized only according to their ability
to move traffic and provide vehicular access (NACTO, 2013).
However, in Malaysian cities, it is hard to find examples of street environments that are friendly and
accommodating to pedestrian users especially in the advent of motorised transportation (Rahman, 2014).
The unfriendly street environment for pedestrian in urban spaces is mentioned as one among the most
critical urban issues addressed in the Kuala Lumpur City plan 2020 (DBKL, 2004). This statement was
supported by Shamsuddin (2011) that mentioned one of the dilemmas in the Malaysian townscape today
is that the streets are overrun by vehicles and unfriendly to pedestrians. The effect of rapid urbanization
in Kuala Lumpur city centre has compromised the priorities of pedestrians in the city centre to depend
on both private and public transportation (Shamsuddin et al., 2010). According to UN Habitat (2013),
Kuala Lumpur has low to moderate level of land allocated to street - Between 15% and 20%. In this
light, this review paper will examine the design characteristic of pedestrian friendly street and the extent
to which these characteristics may be implemented in shopping streets of Kuala Lumpur and making it
more pedestrian friendly and sustainable.
1 Corresponding author: [email protected]

18
REVIEW OF CONCEPT OF PEDESTRIAN FRIENDLY SHOPPING STREET
Streets are the main public space in urban areas (Lynch, 1960; Krier, 1992; Moughtin, 1992). Streets
constitute a significant part of the public open space and are seen as the most important symbols of the
public realm (Jacobs, 1961; Appleyard, 1981; Carmona et al., 2003). Streets are the most important part
of the towns and cities where the greatest amount of human contact and interaction take place (Tibbalds,
1992). Streets not only act as access but also an important arena for social expression (Moughtin, 1992).
Therefore, streets are important public place in urban centre that need to be designed to allow all users
with different abilities.
Lynch (1960) defines street as a path enlivened by a series of nodes where other paths meet it or where
activities intensity to such extent that places and rest for dominance with function pathways and
movement. In a latter definition by Moughtin (1992), a street can be defined as an enclosed, three-
dimensional (3D) space between two lines of adjacent buildings. From an engineering perspective, street
is a walkable, low speed (25mph) in urban areas primarily serving abutting property (Institute of
Transportation Engineer, 2006). The role of the street in urban design as a public place need to consider
the way in which they are arranged, designed and detailed. Moughtin (1992) suggests the primary
function of streets is to provide access to abutting properties and for a street to function as a place; it
must possess the qualities of enclosure like a square. The success of pedestrian areas is dependent on
the variety of the attractions they offer so that pedestrians in large numbers have a reason for remaining
and good access from both private and public transport (Moughtin, 1992). There are three functional
types of street which are great civic streets that nominated by public institution, commercial streets with
their commercial establishment and residential street (Sulaiman, 2000). For many urbanites, it is the
streets that represent the outdoors (Jacobs 1993). People depend on streets for functional, social, and
leisure activities; for travel, shopping, play, meeting, and interaction with other people; and even for
relaxation (Jacobs, 1961; Carr et al., 1992).
Davies (2000) in the Urban Design Compendium suggests that if the street is a shopping street, the
design should enable the users to get to the shop, to cross the road and have other static and leisure
activities such as chatting and lingering in front of the windows. According to Mehta (2007), commercial
street is a physically well-designed street for people, with generous sidewalks, ample seating and other
street furniture, tree cover and other landscape elements. Furthermore, articulated street façades of
buildings built to the sidewalk should become much more useful and meaningful for people when there
are community gathering places and a variety of activities-supporting stores and other land uses at the
street, and vice versa (Mehta, 2007). Therefore, concept of pedestrian friendly street is important in
commercial street to support activities embracing all forms of the purchase and sale of goods and
services which involved social relations and exchange of opinions or attitudes.
The traditional commercial street in Malaysia is unique where Shamsuddin (2011) discussed in the
character of the streets in Malaysian town is much influenced by the type of retail activities that occur
on the street and the ethnicity of the groups engaged in such trading. That activity is the most influential
quality that attracts shoppers to the traditional street in Kuala Lumpur (Norsidah, 2010). The shopping
streets in Kuala Lumpur city centre are identified and characterised by name, location, the people or
users who mostly use and occupy the street, the user’s cultural background and the main uses and
activities held in the area (Shamsuddin et al, 2004). One of the major attractions in Kuala Lumpur
traditional commercial street is the street activities that create a sense of festivity due to the nature of
trading operations, where bargaining is still practiced. During festive seasons, crowds of shoppers are
seen patronizing the shops along the street. On the older part, the streets still respond to the tropical
climate where the outdoors is being used as part of the spill over space for displaying the merchandise.
Besides, there are sidewalks that provide the opportunity for pedestrians to perform their activities in a
safe and comfortable environment. Their presence encouraged people to walk to do their shopping
routine and increase pedestrian freedom in the city centre and contribute to the sense of vitality in the
townscape (Shamsuddin, 2011). Therefore, the traditional commercial street that reflects the culture and
climate is the best street to represent Kuala Lumpur. The study on pedestrian friendly element in

19
commercial street is important to enhance the built environment for the users’ needs and furthermore
contribute towards sustainable development.
Proposed Design Characteristics of a Pedestrian Friendly Shopping Street
Review of literature suggests the following characteristics of pedestrian friendly street on physical
design factors that aim for the quality improvement (Table 1).
Table 1: Proposed design characteristics of a friendly pedestrian shopping street by literature review Proposed design characteristics
1 Linkages to a variety of land uses / regional connectivity - Pedestrian circulation and access are provided
to shopping malls, transit, downtown, schools, parks, offices, mixed-use developments and other
community origins and destinations
2 Continuous systems/connectivity - A complete system of interconnected streets, pedestrian walkways and
other pedestrian facilities will increase pedestrian travel
3 Shortened trips and convenient access - Connections are provided between popular origins and
destinations, between dead-end streets or cul-de-sacs or as shortcuts through open spaces
4 Continuous separation from traffic - Minimised or eliminated street and driveway crossings are provided
and well defined. Buffers from motor vehicles and separation of uses are provided
5 Designated Space - Pedestrian facilities should be well delineated, signed and marked
6 Security and visibility - It is important to design a safe and secure environment for pedestrians. Lighting
increased visibility, open sight-lines, access to police and emergency vehicles and locating pedestrian
facilities adjacent to businesses can increase safety
7 The automobile is not the only consideration - Streets are designed for all modes of transportation. Parking
supply is reduced or managed using methods that encourage walking
8 Traffic calming - Narrowed streets lined with trees, traffic circles, curb bulbs, neck-downs and other
techniques that can lower vehicle speeds and create safer conditions for pedestrians
9 Accessible and appropriately located transit - Siting of transit facilities adjacent to work, residential areas,
shopping and recreational facilities encourages pedestrian trips. Transit stops and centres should typically
be located in areas of supporting densities. Development of adequate pedestrian facilities to access transit
is essential to the success of pedestrian travel as an alternative mode
10 A lively public space - Secure, attractive and active spaces provide focal points in the community where
people can gather and interact such as pedestrian pocket parks and plazas
11 Character - Preservation of important cultural, historic and architectural resources strengthens community
heritage and character
12 Scenic opportunities - Attractive environments and scenic views encourage pedestrian use, particularly
when facilities are oriented toward them
13 Pedestrian furnishings - Providing amenities such as benches, restrooms, drinking fountains, artwork and
other elements that creates a more attractive and functional environment for pedestrians
14 Street trees and landscaping - Street trees bring human scale to the street environment. Landscaping and
flowers in planting strips, containers and other areas soften surrounding hard edges of buildings and
parking lots and add life, colour, and texture to the pedestrian’s field of vision
Source: adapted from Georgia Department of Transportation (GDT) (2003)
As stated in the above table, the concept and physical characteristics of pedestrian friendly streets is
very broad. Gehl (2007) argues that in many cities, the qualities of the streets for pedestrians in many
cases are unpleasant. The qualities of pedestrian movement, such as free of obstacles, sidewalk
interruptions, curbs appalling of street crossing, fences are left on the narrow sidewalk (Gehl, 2007).
Therefore, the concept of pedestrian friendly which have been proposed by various scholars and
development agencies refers to the quality of the street that provides safety and comfort to its users.
CONCLUSION
This paper reviews the literature relevant to the physical design characteristics of pedestrian friendly
shopping street and pointed out in brief how the proposed characteristics may be applicable to revitalise
shopping streets in Kuala Lumpur to becoming more pedestrian friendly in future. The significance of

20
this study aims to create a better understanding on the theories and principle of pedestrian friendly streets
which are safe, comfortable and creates a healthy living environment. With Kuala lumpur aiming to be
World class city, it is of prime importance to analyse the existing infrastructure, understand the existing
problems and issues to build a city which is on par with cities across the world.
REFERENCES
Appleyard, D. (1981). Liveable Streets. Berkeley: Univ. Of California Press
Carmona, M., Heath, M. T., Oc, T. and Tiesdell, S. (2003). Public Spaces Urban Spaces. New York: The
Architectural Press.
Carr, S., M. Francis, L. G. Rivlin, and A. M. Stone. (1992). Public Space. New York: Cambridge University
Press.
Davies, L. (2000). Urban Design Compendium. United Kingdom: English Partnership.
DBKL (2004). Kuala Lumpur Structure Plan 2020. City Hall of Kuala Lumpur
Gehl, J. (2007). Public Space for Changing Public Life. In Ward Thomson and Trovlou, P (Ed), Open Space:
People Space. London: Taylor and Francis Group.
Georgia Department of Transportation (2003). Pedestrian and Streetscape Guide. Oregon: Otak, Inc.
Institute of Transportation Engineers, (ITE) (2006). Context Sensitive Solutions In Designing Major Urban
Thoroughfares for Walkable Communities. Wisconsin, USA. p.128
Jacobs, A. (1993). Great Streets. Cambridge, Massachusetts: MIT Press.
Jacobs, J. (1961). The Death and Life of Great American Cities. New York: Vintage Books.
Krier, L. (1992). Architecture and Urban Design, 1967–1992. New York: St. Martin’s.
Lynch, K. (1960). The Image of the City. Cambridge: Massachusetts, MIT Press.
Mehta, V. (2007). Lively Streets Support Social Behaviour. Journal of Planning Education and Research, pp.
165-187.
Moughtin, C. (1992). Urban Design: Street and Square. Oxford: Butterworth-Heinemann Ltd.
National Association of City Transportation Officials –(NACTO) (2013). Urban Street Design Guide. New York:
Island Press.
Norsidah, U. (2010). Place Attachment and Continuity of Urban Place Identity. Malaysia: Universiti Putra
Malaysia.
Rahman, N.A. and Shamsuddin, S. (2014). A User-Friendly Street in The Context of Malaysia. Sustainable
Urban Design for Liveable Cities (SUDLIC 2014). 11-12 November. UTM: Kuala Lumpur. p.144.
Shamsuddin, S. (2011). Townscape Revisited: Unravelling the Character of the Historic Townscape in
Malaysia. Johor Darul Ta'zim, Malaysia: Penerbitan UTM Press.
Shamsuddin, S. Sulaiman, A. B. Jaafar, H & Mad Noor, M. (2004). Kriteria Kejayaan Jalan Membeli Belah
Tradisional Di Malaysia: Kajian Kes Kuala Lumpur. Fakulti Alam Bina. Malaysia, Universiti
Teknologi Malaysia. Retrieved From Http://Eprints.Utm.My/2969/1/Norhaslinamb023004d07ttp.Pdf
Shamsuddin, S., Abdulrahman, N., and Sulaiman, A.B. (2010). How walkable is our city? Its influence in
creating sustainable city centre design. In Proceeding of the 1st International Conference on
Sustainable Architecture and Urban Design (ICSAUD 2010). 3-4th March. Universiti Sains Malaysia,
Malaysia.
Sulaiman,A.B. (2000). Urban Design Method -Theory and Practice, a Case Study in Malaysia. Doctor
Philosophy, University of Nottingham, United Kingdom.
Tibbalds, F. (1992). Making People-Friendly Towns: Improving the Public Environment
U.N. Habitat (2013). Streets as public spaces and drivers of urban prosperity. Nairobi: UN Habitat.

21
UTM Razak School of Engineering and Advanced Technology
Kuala Lumpur, Malaysia
10th October 2017
SD 14 - REVITLISATION OF THE ROLE OF MOSQUE AS NODE
IN URBAN AREA
Ungku Norani Sonet Ungku Abdul Rahman, Khairul Hisyam Kamarudin2 and Ishaq Faheem
Mushtaq Ahmed
UTM Razak School of Engineering and Advanced Technology, Universiti Teknologi
Malaysia Kuala Lumpur Campus, Jalan Sultan Yahya Petra, 54100 Kuala Lumpur
([email protected];[email protected]; [email protected])
INTRODUCTION
In designing a city, there are core elements to be taken into consideration. One of these core elements,
as mentioned by Setiadi (2015) and Hiller &Hanson (1984) is the cultural elements, in particular religion
elements which plays an important role in the foundation of human existence. It shapes moral code,
ethic, perception, spirit, and institutions for human life (Setiadi 2015). Other than being the most
important element in a city design, religion not only as a course or source of faithful messages, but also
as a foundation for a civilization, or as stressed by Setiadi (2015) and Polanyi (1968), city is also a
product of civilisation. Within the context of a Muslim majority country and majority of Muslim
population, religion places particularly a mosque (in this context of study) should be strengthening its
role as a node or central of the city or any urban area. In an urban elements theory, a node is one of the
factors that contributed towards the legibility of the urban area (Lynch, 1960). Legibility means the
extent to which the cityscape can be ‘read’ (Lynch, 1960). Therefore, the role of node is very important
as the legibility of an urban area will lead to a better environmental image of the city (Lynch, 2009).
Lynch (1960) argues that people in urban situations orient themselves by means of mental maps. The
role of mosque in majority Muslim community is very important, as it is the unity element of the
surrounding community. Therefore, a mosque should become a node of an urban setting as it would lead
to the generalized mental map among the people who move through the city as they engage the way-
finding (Lange, 2009).This review paper will examine issues related to forgotten function of mosque as
node in urban area. Followed by brief explanations of the concept of node and the extent to which a
mosque in urban area could be strengthening its physical elements to becoming an urban node.
FORGOTTEN FUNCTIONS OF MOSQUE AS URBAN NODE
This section briefly discuss two main issues relating to forgotten functions of mosque as urban node as
gathered from review of literature. These issues are: (1) mosque which is not strategically located to
become a node in urban area and; (2) misconception of role of mosque in urban area.
2 Corresponding author: [email protected]
22
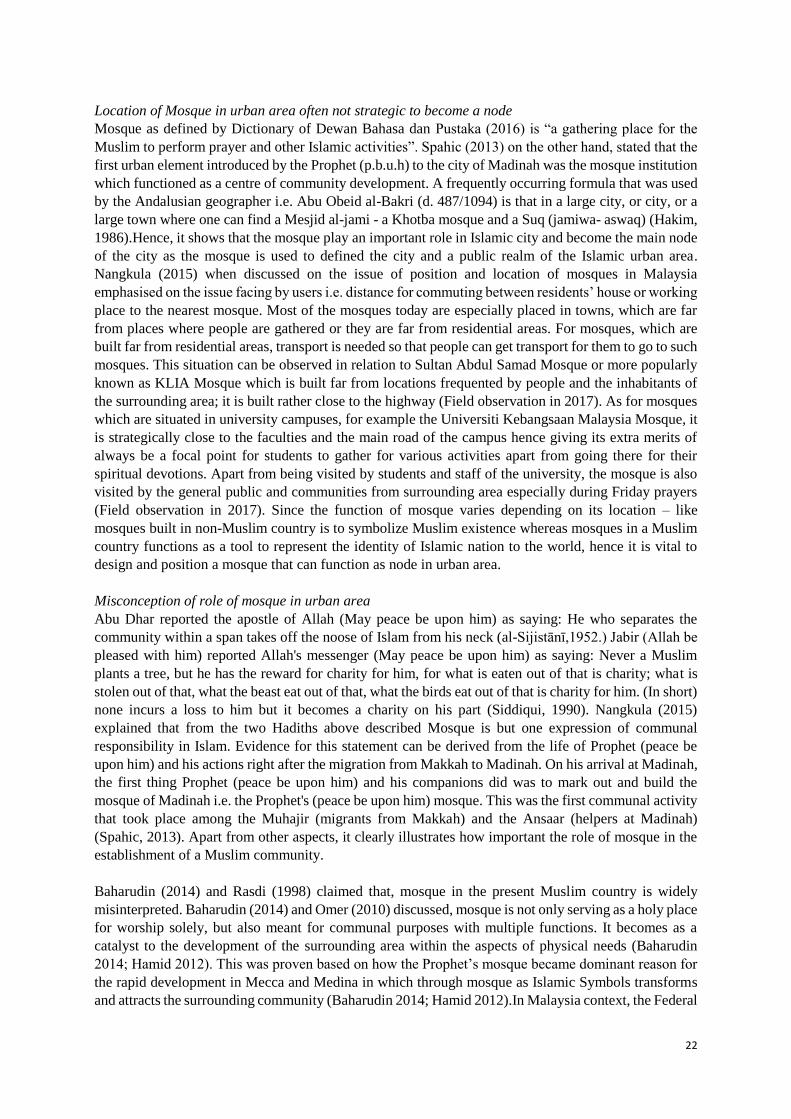
Location of Mosque in urban area often not strategic to become a node Mosque as defined by Dictionary of Dewan Bahasa dan Pustaka (2016) is “a gathering place for the
Muslim to perform prayer and other Islamic activities”. Spahic (2013) on the other hand, stated that the
first urban element introduced by the Prophet (p.b.u.h) to the city of Madinah was the mosque institution
which functioned as a centre of community development. A frequently occurring formula that was used
by the Andalusian geographer i.e. Abu Obeid al-Bakri (d. 487/1094) is that in a large city, or city, or a
large town where one can find a Mesjid al-jami - a Khotba mosque and a Suq (jamiwa- aswaq) (Hakim,
1986).Hence, it shows that the mosque play an important role in Islamic city and become the main node
of the city as the mosque is used to defined the city and a public realm of the Islamic urban area.
Nangkula (2015) when discussed on the issue of position and location of mosques in Malaysia
emphasised on the issue facing by users i.e. distance for commuting between residents’ house or working
place to the nearest mosque. Most of the mosques today are especially placed in towns, which are far
from places where people are gathered or they are far from residential areas. For mosques, which are
built far from residential areas, transport is needed so that people can get transport for them to go to such
mosques. This situation can be observed in relation to Sultan Abdul Samad Mosque or more popularly
known as KLIA Mosque which is built far from locations frequented by people and the inhabitants of
the surrounding area; it is built rather close to the highway (Field observation in 2017). As for mosques
which are situated in university campuses, for example the Universiti Kebangsaan Malaysia Mosque, it
is strategically close to the faculties and the main road of the campus hence giving its extra merits of
always be a focal point for students to gather for various activities apart from going there for their
spiritual devotions. Apart from being visited by students and staff of the university, the mosque is also
visited by the general public and communities from surrounding area especially during Friday prayers
(Field observation in 2017). Since the function of mosque varies depending on its location – like
mosques built in non-Muslim country is to symbolize Muslim existence whereas mosques in a Muslim
country functions as a tool to represent the identity of Islamic nation to the world, hence it is vital to
design and position a mosque that can function as node in urban area.
Misconception of role of mosque in urban area
Abu Dhar reported the apostle of Allah (May peace be upon him) as saying: He who separates the
community within a span takes off the noose of Islam from his neck (al-Sijistānī,1952.) Jabir (Allah be
pleased with him) reported Allah's messenger (May peace be upon him) as saying: Never a Muslim
plants a tree, but he has the reward for charity for him, for what is eaten out of that is charity; what is
stolen out of that, what the beast eat out of that, what the birds eat out of that is charity for him. (In short)
none incurs a loss to him but it becomes a charity on his part (Siddiqui, 1990). Nangkula (2015)
explained that from the two Hadiths above described Mosque is but one expression of communal
responsibility in Islam. Evidence for this statement can be derived from the life of Prophet (peace be
upon him) and his actions right after the migration from Makkah to Madinah. On his arrival at Madinah,
the first thing Prophet (peace be upon him) and his companions did was to mark out and build the
mosque of Madinah i.e. the Prophet's (peace be upon him) mosque. This was the first communal activity
that took place among the Muhajir (migrants from Makkah) and the Ansaar (helpers at Madinah)
(Spahic, 2013). Apart from other aspects, it clearly illustrates how important the role of mosque in the
establishment of a Muslim community.
Baharudin (2014) and Rasdi (1998) claimed that, mosque in the present Muslim country is widely
misinterpreted. Baharudin (2014) and Omer (2010) discussed, mosque is not only serving as a holy place
for worship solely, but also meant for communal purposes with multiple functions. It becomes as a
catalyst to the development of the surrounding area within the aspects of physical needs (Baharudin
2014; Hamid 2012). This was proven based on how the Prophet’s mosque became dominant reason for
the rapid development in Mecca and Medina in which through mosque as Islamic Symbols transforms
and attracts the surrounding community (Baharudin 2014; Hamid 2012).In Malaysia context, the Federal

23
Town and County Planning, FDTCP (2003) introduced The Universal Planning Development Doctrine
with noble purpose to integrate between the urban structure and relationship between human and God,
human and human, and human and nature. Each community must be developed in reflect the concept of
‘Taqwa’ (good governance). ‘Taqwa' is an arabic word and translated as Good Governance which
associated with close relationship between human and nature. However, the current role of mosque in
Malaysia, not just misinterpret the role of mosque, in Malaysia city context, the mosque does not reflect
the concept of 'Taqwa' as established by FDTCP as it is did not comply and implement the order of
creator, does not meet the human welfare and living condition and does not demonstrate the care to
creatures and environment.
REVIEW OF LITERATURE: BRINGING BACK THE ROLE OF MOSQUE AS NODE
Based on review of literature, this section should discuss in brief suggestions for bringing back the role
of mosque as node in urban area.
Strengthening the location of mosque to become a node
Saoud (2004), explained that based on his study of the urban morphology of the Muslim North African
City, he described that the organization and land use of the city reflected its Islamic social and cultural
values. As shown in Figure 1, the city is ordered around the main mosque.
Figure 1a: Model of modernized Islamic City. Source: Saoud (2004)
Figure 1b: Mosque position and orientation. Source: Garis Panduan Perancangan Masjid danSurau (2011)
Mosque in Malaysia, play an important role as stated by Planning Guideline for Mosque and
Musholla2011 (FTCP, 2011). In a new development, the height of the minarets also be used as a
landmark of an area where height control must be imposed on buildings around the mosque so as not to
exceed the height of minarets. Lynch (1960), explained that landmarks are another type of point
reference. They are usually a rather simply defined physical object: building, sign, store or mountain.
Landmarks, the point references considered to be external to the observer, are simple physical elements
which may vary widely in scale (Lynch, 1960).
Improving the design components of the mosque
The influential factors for mosque to become the node in urban area related to the components within
the mosque plaza itself and how it is respond to the urban context. Kahera (2009) explained that the
term ‘urban mosque’refers to the representative religious edifice constructed by Muslims who reside
primarily within urban locales in the western world; often described as an Islamic center (markaz), it is
where the faithful gather to engage in communal worship, spiritual retreat, matrimony, education, and
other significant socio-cultural activities.One of the primary design objective as proposed by Kahera
Figure 1a Figure 1b

24
(2009) to help establish the quality and character of an urban mosque is “if you build it they will come”
– i.e. the urban designer should create a master plan with a controlled variety of uses and flexibility
allowing for future expansion in relation to the mosque site context. Furthermore, the urban designer
should establish a clear pattern of land use and urban forms, which includes the prominent placement of
entrances, ancillary structures, and parking to heighten the contrast of the urban setting. Kahera (2009)
explained in his research on urban mosque, listed criteria for a smart design and site planning urban
mosque as follows:
Create opportunities for mixed land uses.
Take advantage of compact building design.
Create design opportunities and choices for the larger community.
Create walkable opportunities for social spaces for gathering.
Make design decisions that are predictable, fair, and costeffective.
Create opportunities for social spaces for gathering adapted from Environment Protection
Agency guidelines for smart growth.
CONCLUSION
As a conclusion, this review paper explains thatthe key factors in designing an urban mosque that might
potentially become a node is very much depending on our (urban designer) interpretation of the broad
range of aesthetic, liturgical requirements and site planning considerations, hence to be coexist or co-
substantiated within a given urban setting. Bringing back the function of a mosque as the major node of
an urban setting in the other hand, would be best to be within majority Muslim community resident area.
In Malaysia context, Mosque does not meant for public utilise as for public urban spaces including for
interaction and recreational activity. Therefore, the challenge would be to first establish the definition
of urban mosque and to improve its role and physical elements to enable mosque for becoming a node
particularly in urban area.
REFERENCES
al-Sijistānī, A.D.S. ibn al-A., (1952). Sunan Abī Dā'ūd, Volume 2. Sharikat Maktabat wa Matbaʻat
Mustafa al-Babi al- Halabi wa Awlaḍuh. Retrieved from:
https://books.google.com/books?id=o6O3AAAAIAAJ &pgis=1.
Baharudin N.A. Ismail A. S. (2014) Communal Mosques: Design Functionality Towards The Development of
Sustainability for Community. Procedia-Social and Behavioral Sciences V153 Pg106-120 Elsevier
Dictionary of Dewan Bahasa dan Pustaka (2016) Kamus Dewan. Dewan Bahasa dan Pustaka. Kuala Lumpur
FTCP (2011) Manual Garis Panduan dan Piawaian Perancangan Negeri Selangor. Jabatan Perancangan Bandar
dan Desa. Selangor
Federal Town and County Planning (2013) Garis Pandian Perancangan Kemudahan Masyarakat. Jabatan
Perancangan Bandar dan Desa. Kuala Lumpur
Hakim B. (1986) Arabic-Islamic Cities: Building and Planning Principles. Kegan Paul International. USA
Hiller B and Hanson J. (1984) The Social Logic of Space, Cambridge: Cambridge University Press.
Kahera A. I., (2010), Deconstruction the American Mosque: Space, Gender, and Aesthetics, University
of Texas Press, United State.
Lynch. K, (1960), The Image of The City, MIT Press, Cambridge Massachussette.
Nangkula U, Ismail N. A, Yazid M. Ismail S. (2015). Malaysia Going Greens: A Study on Community
Commitement Towards a Greener Urban Living Environment. JAdv. Environ. Biol V9 I95 Pg498-503
Omer, S., (2010). Some Lessons from Prophet Muhammad ( SAW ) in Architecture: The Prophet‟s Mosque in
MadÊnah, 115-140.
Polanyi, K. (1968). Essays Primitive, Archaic and Modern Economies: Essays of Karl Polanyi. George Dalton.
Garden City, N.Y.

25
Rasdi, M.T.H.M., (1998). The mosque as a community development centre: Programme and architectural
design guidelines for centemporary muslim societies. UK: Penerbit UTM. Retrieved from:
http://eprints.utm.my/29825/2/MohamadTajuddinMohamad1998_TheMosqueAsACommunityDevelopme
ntCentreProgrammeSYN.pdf
Saoud J M, (1999), The urban design of Mosque, College of Architecture and Planning, King Saud University,
Saudi Arabia.
Setiadi H (2015), Islam and Urbanism in Indonesia: The Mosque as Urban Identity in Javanese Cities, Springer
Science + Business Media Dordrecht, S.D Brunn (ed), The Changing World Religion Map, DOI
10.1007/978-94-017-9376- 6_127.
Siddiqui, A.H., (1990). Sahih Muslim, Being Traditions of the Sayings and Doings of the Prophet Muhammad as
Narrated by His Companions and Compiled Under the Title Al-Jamiʻ-us-sahih (p. 1613). Sh. Muhammad
Ashraf. Retrieved from Omer, S., (2013). Studies in the Islamic Built Environment. Retrieved
November 11, 2014, from http://iiumpress.iium.edu.my/bookshop/wwwgooglecom-18.

26
UTM Razak School of Engineering and Advanced Technology
Kuala Lumpur, Malaysia
10 October 2017
SD 18 - SUSTAINABILITY ASSESSMENT FOR HIGHER
EDUCATION INSTITUTIONS (HEI): A LITERATURE STUDY
Nadzirah Zainordin*1, Syuhaida Ismail2
1, 2 School of Built Environment, University College of Technology Sarawak, Sibu, MALAYSIA.
[email protected] 2 UTM Razak School of Engineering and Advanced Technology, Kuala Lumpur, MALAYSIA.
ABSTRACT
Sustainability assessment for Higher Education Institutions’ assessment progressively famous
with increasing number of universities had shown their initiative in addressing sustainability.
A number of higher education institutions need get to be included over embedding reasonable
advancement under their academic framework. However, the preservation of international
university ranking system remains controversial and under-utilized due to the subjective and
objective concept of sustainability to higher education institutions and less broadly
acknowledged framework and criteria ranking. Thus, the purpose of this paper is to present a
conceptual framework to aid in understanding and explaining the conceptual element of Higher
Education Institutions assessment. İt analyses if such duty prompts more maintainable
advancement execution inside the academic institutions. Those investigate might have been
performed by using a survey about 20 relevant peer-review papers.
Key words: Higher Education institutions, sustainability assessment, and sustainability framework
INTRODUCTION
The attaches of the reasonable advancement particular idea utilized within Brutland Report to
be followed back in 1974 when the concept of Sustainable Societies, in view of equitable
distribution, was first used in World Council of Church (Lozano R., 2008; Reid 1995). Those
fundamental accomplishment of the Brutland Report have been on bring maintainable
advancement of the standard universal political agenda, and straightforward meaning that get
broadly cited world-wide (Lozano R., 2008; Reid 1995). There are two main issues in Higher
Education Institutions relating to the environmental factors; which are reducing energy
consumption and waste and turn the curriculum into green syllabus (Roy et al., 2008).
According to Ritzen (2006), there are many countries starting to attempt and improving their
competitiveness of macro policies particularly in education components this its due to Higher
Education Institutions it’s the most insignificant indicators of global competitiveness (Schwab,
2013).
Universities play a vital role in conducting and promoting sustainability principles and should
contribute to a paradigm shift towards a more sustainable society (Christian R. et al, 2015). A

27
growing interest in sustainability (or SD) and, more recently, the approaches regarding
strategies, cleaner production, pollution control, eco-efficiency, environmental management,
social responsibility, industrial ecology, ethical investments, green economy, eco-design, reuse,
sustainable consumption, zero waste among many other terms (Lukman, 2007). The emergence
of sustainable development as a political and social project of humanity has promoted the
orientation of efforts in order to find ways for sustainable societies (Salas Z. et al., 2011). Since
then, there has been lot of literature devoted to the subject, and no doubt a blurring of focus.
But before universities can really promote and drive sustainable development, their
sustainability activities must extend a still prevailing narrow perception of sustainability,
limited to environmental issues or the simple integration of sustainability topics into existing
curricula (Wals 2014; Leal Filho 2009). To incorporates sustainable development into daily
practices in universities, sustainability has to become mainstream and cannot be simple
implemented without serious planning. According to Lozano (2006), the mainstreaming or
institutionalizing only can be achieved when the idea’s of sustainable development fully
accepted and integrated with universities’ daily routine of management. Without a whole
approach in universities, the aims of real change and approach, universities are caught in green
washing, reductionist models and the increasing demand to produce knowledge (Christian R.
et al, 2015).
This paper is divided into the following section; Literature review to provide an underpinning
understanding of how higher education has been assess to fulfill the sustainable approach. Next
sections proceed into the conclusion of the topic with recommendations for refining the
university sustainability assessment framework.
LITERATURE REVIEW
Higher education institutions (HEIs) are uniquely positioned in the society to nurture and to
prepare the leaders of the future society. Therefore sustainability is not limited to the
demonstration of a sustainable campus but also a cornerstone in the education practice for HEIs
(Dawe et al., 2005). The ultimate objective of university sustainability is to infuse sustainability
literacy into both academic programs and daily campus operations. In this context, a growing
number of declarations, charters, and networks for sustainable development of HEIs were
established with the aim to advance sustainability over the last two decades (Lozano et al.,
2013). The first official statement made by university presidents and chancellors on the
commitment is the Talloires Declaration signed in Talloires, France in 1990 (ULSF, 1990). It
is a ten-point action plan for incorporating sustainability and environmental knowledge in
teaching, research, operations and outreach at HEIs. 440 university leaders in over 50 countries
as of May 2012 have signed the Talloires Declaration. Despite an increasing number of
universities having embraced their vital role in fostering the society to become more sustainable
since the publication of the seminar Brundtland Commission report in 1987, most HEIs remain
conservative, slow to incorporate and institutionalize sustainable development (Lozano et al.,
2013). To change the slow uptake of sustainability in universities worldwide, a few HEI
networks of sustainable development have championed the application and extension of
university sustainability ranking systems given the profound impact of university ranking
practices on the strategic direction and transformation of the HEIs as a whole. According to
Vettori and Rammel (2014), the process of mainstreaming sustainable development could be
enhanced by bridging the quality culture concept and reframe sustainability principles as part
of a university’s overall quality goals and procedures.
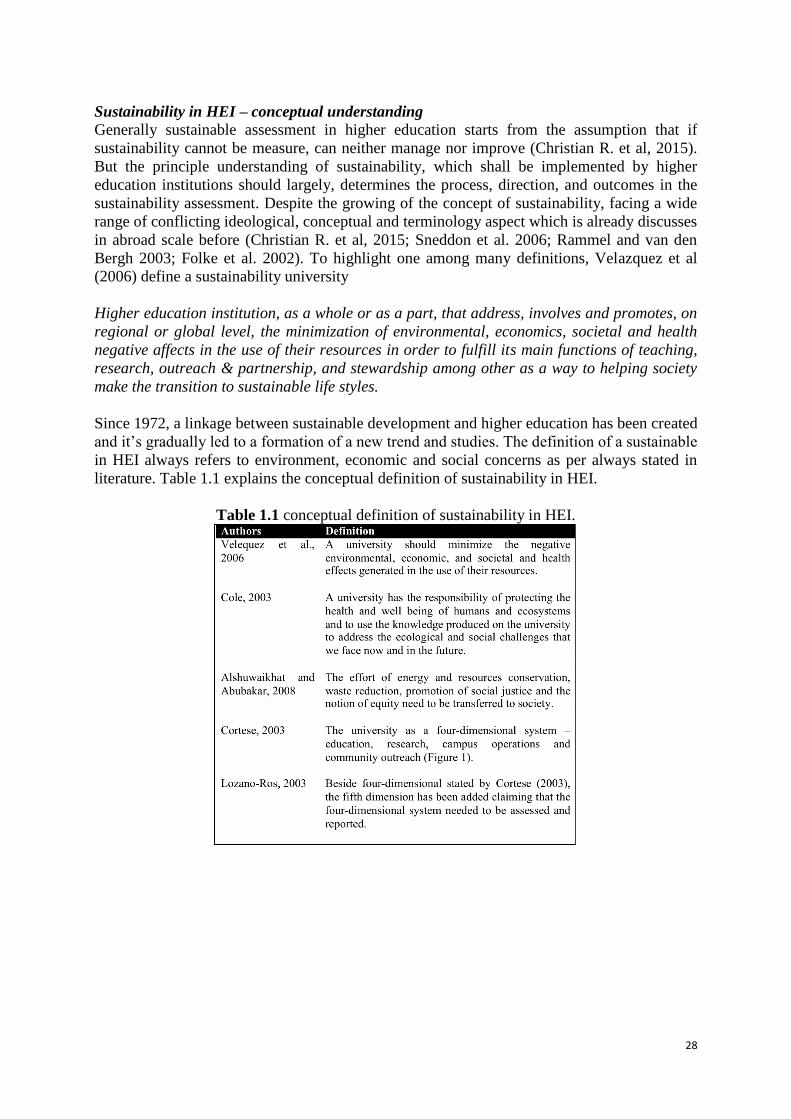
28
Sustainability in HEI – conceptual understanding
Generally sustainable assessment in higher education starts from the assumption that if
sustainability cannot be measure, can neither manage nor improve (Christian R. et al, 2015).
But the principle understanding of sustainability, which shall be implemented by higher
education institutions should largely, determines the process, direction, and outcomes in the
sustainability assessment. Despite the growing of the concept of sustainability, facing a wide
range of conflicting ideological, conceptual and terminology aspect which is already discusses
in abroad scale before (Christian R. et al, 2015; Sneddon et al. 2006; Rammel and van den
Bergh 2003; Folke et al. 2002). To highlight one among many definitions, Velazquez et al
(2006) define a sustainability university
Higher education institution, as a whole or as a part, that address, involves and promotes, on
regional or global level, the minimization of environmental, economics, societal and health
negative affects in the use of their resources in order to fulfill its main functions of teaching,
research, outreach & partnership, and stewardship among other as a way to helping society
make the transition to sustainable life styles.
Since 1972, a linkage between sustainable development and higher education has been created
and it’s gradually led to a formation of a new trend and studies. The definition of a sustainable
in HEI always refers to environment, economic and social concerns as per always stated in
literature. Table 1.1 explains the conceptual definition of sustainability in HEI.
Table 1.1 conceptual definition of sustainability in HEI.

29
Figure 1. University’s system and its four dimensions
Source: Adopted from Cortese (2003)
A numbers of declarations and treaties highlight the conceptual principles of sustainability in
the context of HEI (Lozano et al. 2013, Disterchief et al. 2013). In 1992, more than 100 heads
of countries met in Rio de Janeiro, Brazi for the United Nations Conference on Environment
and Development (United Nations Conference, 2013). In this context, HEI is developed and
signed array of declaration, charters and initiative (DCIs) to provide guidelines or framework
for HEI to demonstrate their commitment and better embedding sustainability HEI concept in
their system (Calder and Clugston, 2003; Wright, 2004; Lozano et al., 2013). The declaration
its importance in order to fostering transformation and as evidenced stated more 1000
universities’ head who declare their commitment towards this concept by committing into DCIs
(Calder and Clugston, 2002; Cole and Wright, 2005).
Figure 3. Sustainability in HEI system- literature comparison
By referring to figure 3, based on the literature review from 20 different authors, the highest or
the majority focusing on education element and follow by campus operation. Less focusing and
reviewing for on-campus experiences and institutional framework element for HEI
sustainability where these can be use as focus for deep-study towards these two elements.
CONCLUSION
Higher Education Institutions should play a vital role in turning society sustainable through
their power to producing and education the heirs’ generations. Broadly speaking, the capability
ad a research center should be enhancing in regards to sustainability agenda. The conceptual
and philosophy of sustainable should be teach to the student so that the student can embrace
their knowledge once they are start their career life. And in organizational perspective,
sustainability concept should be embrace within daily routine task in organizational
management. Furthermore, it was seen that as sustainable HEI should refer to four-dimension

30
system –education, research, community outreach and campus operation, therefore, as a
sustainable HEI all dimension must be fully adopted even the fifth dimension recommended by
Lozano, as sustainability performance should be assessed and reported. The all three main
pillars of sustainable development (economics, social and environmental) should be
implemented and in line with sustainability in HEI concepts. Basically, to acknowledge the
implementation of this concept, the higher management in HEI itself must walking on adoption
and embedded in their management, even sometimes economic its one of the crucial issues need
to be considered. The concepts of sustainable development and sustainability offers an
alternative way to understand and perhaps this concept still unfamiliar or misunderstanding by
many people and societies worldwide, especially when its to narrow down into sustainability
in HEI. Modern ideologies perhaps may helped all the relevant parties whom involve directly
and indirectly in HEI to be clearly understand to sustain their HEI and how to practices
sustainability in their organization.
REFERENCES
Christian Rammel, Luis Velazquez, Clemens Mader (2015). Sustainability Assessment in Higher Education
Institutions. Rout;edge Hbook of Higher Education for Sustainable Development. Pg. 331.
Cortese, A.D., 2003. The critical role of higher education in creating sustainable future. Planning for Higher
Education. Vol. 31 No. 3, pp.15-22.
Folke, C. Carpenter, S., Elmqvist, T., Gunderson, L., Holling, C. S. and Walker B., 2002. Resilience and
Sustainable Development: Building Adaptive Capacity in a World of Transformations, Ambio, 31(5), 473-
40.
Lozano, R., 2004. A tool for easy benchmarking sustainability reports in universities. Environmental Management
Sustainable University Monterrey, Mexico.
Lozano, R. (2006). A tool for a Graphical Assessment of Sustainability in Universities (GASU). Journal of Cleaner
Production, 14(9-11), 963–972. http://doi.org/10.1016/j.jclepro.2005.11.041
Lozano, R., Ceulemans, K., Alonso-Almeida, M., Huisigh, D., Lozano, F., Tom Waas, Huge, J., 2014. A review
of commitment and implementation of sustainable development in higher eductaion: results from a
worldwide survey. Journal of Cleaner Production. 1-18.
Ritzen, J., 2006. Scenarios for Higher Education, 2020 or when Will China Invade Iran?. In: Keynote Address
during the OECD Ministerial Meeting. Paris. Rosenberg.
Roy, R., Potter, S. & Yarrow, K. (2008). Designing low carbon higher education systems Environmental impacts
of campus and distance learning systems. International Journal of Sustainability in Higher Education, Vol.
9, 116-130.
Schwab, K., 2013. The Global Competitiveness Report 2013e2014.World Economic Forum, Switzerland.
Shi, H., & Lai, E. (2013). An alternative university sustainability rating framework with a structured criteria tree.
Journal of Cleaner Production, 61, 59–69. http://doi.org/10.1016/j.jclepro.2013.09.006
Sneddon, C., Howarth, R. and Norgaard, R., 2006. Sustainable Development in a Post Brutland World, Ecological
Economics. 57(2), 253-68.
Wals, A., 2014. Sustianbility in Higher Education in the Context of the UN DESD: A Review of Learning and
instutionalization Process. Journal of Cleaner Production, 62, pg 8-15.
Vettori, O. and Rammel, C., 2014. Linking Quality Assurance and ESD: Towards a Participative Quality Culture
of Sustainable Development in Higher Education. Houndsmill: Palgrave Macmillan, 49-65.

31
UTM Razak School of Engineering and Advanced Technology
Kuala Lumpur, Malaysia
10 October 2017
SD 19 - EXPERIENTIAL VIRTUAL URBAN ENVIRONMENTS: A
PRELIMINARY INVESTIGATION
Izham Ghani*1, Norhafizah Abdul Rahman2, Azrul Bahaluddin3 and Nadiyanti Mat
Nayan4
1, 2, 3, 4 Department of Landscape Architecture, Universiti Teknologi MARA Cawangan Perak, Seri
Iskandar, MALAYSIA.
[email protected], [email protected], [email protected],
ABSTRACT
Virtual reality (VR) technologies enable users to be virtually immersed in reconstructed cities
and streets from around the globe. Immersive technologies could provide users a suggestive
sensation of “being there” in a reconstructed virtual urban environments (VUE). Disseminating
suitable contents through a VR platform is crucial to provide an experiential walkthrough in a
VUE. The aim of this paper is to analyse and compare the relevant methods from relevant VUE
projects to seek the practicality and functionality of the offered interactions and user experience
via its contents. This paper examines three virtual urban environments (VUE) case studies that
offer real-time navigation via a 3D virtual environment platform. Although preliminary
investigations have shown some promising results in real-time virtual city walkthroughs, there
are still some issues that still need to be addressed. Findings from the case studies would assist
and identify specific elements suitable for future development of more meaningful and
experiential VUE in the Malaysian context.
Key words: virtual reality, virtual urban environment, experiential, urban design
INTRODUCTION
This paper examines three virtual urban environments (VUE) case studies that offer real-time
navigation via a 3D virtual environment platform. The examination of the case studies was
conducted to analyse the relevant methods in VUE contents and developments. A comparative
case study method was employed for the purpose of the investigation. The aim of the case study
is to analyse and compare the relevant methods from published VUE projects to seek the
practicality and functionality of the offered interactions and user experience via its contents. A
qualitative review and analysis method were adopted for the case studies analysis. Findings
from the case studies would assist and identify specific elements suitable for future
development of VUE contents in the Malaysian context. Relevant issues and limitations of
current published VUE are also identified to support future developmental phase. The case

32
studies are selected from various publically accessible projects consisting of 3D representations
of cities and streetscape from around the globe. The projects selected are; Virtual Old Prague,
Barcelona in Gothic and Mysteries of Notre Dame de Paris.
MAIN RESULTS
The qualitative review focuses on the structure of the VUE that was used to represent and
visualize the city’s streets. The elements selected for the review are extracted from studies
in virtual environment (VE) design, virtual place and presence, and game-style interactions.
The selected elements are adapted from a related study by Bostan and Ogut (2011) based
on the design requirements for presence in computer games.
The selected review elements are:
1. Contextual setting: This would be a significant aspect of all VUE contents as this
would signify the level of authenticity of the city’s model based on how the virtual
representation recreates the actual city and street environment. It includes
representations of the location and place of the architectural elements and ambience.
2. Navigation: The navigational factors would determine the fluidity of the virtual
walkthrough and will be reviewed on its flexibility, easiness, and others.
3. Interactivity: An important aspect of the VUE contents as it would influence the
user’s attentiveness in the VUE especially those that seek to disseminate specific
knowledge or to trigger cognitive interactions.
Some of the issues identified from the case studies are the lack of animated and interactive
avatars. Dynamic and interactive avatars could add an extra liveliness factor in the VUE
especially for VUE contents that represent places with cultural heritage importance.
CONCLUSION
Preliminary findings from the case studies have provided some insights on the current trends in
VUE contents particularly those that offered real-time walkthrough experience. One of the
common findings is the use of game engine for its content development. There has been an
increase in popularity and preference towards game engine based development especially those
related to mobile applications content dissemination. Further development is necessary to suit
the current VR hardware for an enhanced urban experience.
REFERENCES
Bostan, B., & Ogut, S. (2011). Presence in computer games: Design requirements. Paper presented at the
GAMEON'2011, National University of Ireland, Galway, Ireland.
Ghani, I., Rafi, A., & Woods, P. (2016). Sense of place in immersive architectural virtual heritage environment.
Proceedings of the 22nd International Conference on Virtual System & Multimedia (VSMM) 2016 (pp. 1-8).
Kuala Lumpur, Malaysia: IEEE.
Ghani, I., Rafi, A., & Woods, P. (2013). Modelling place elements in virtual heritage environment. Proceedings
of the 2013 International Conference on Informatics and Creative Multimedia ICICM 2013 (pp. 186-190).
Kuala Lumpur, Malaysia: IEEE.

33
Ioannides, M., Athanasiou, V., Chatzigrigoriou, P., Papageorgiou, E., Leventis, G., Nikolakopoulou, V., & Sovis,
C. (2016). Immersive digital heritage experience with the use of interactive technology. In M. Ioannides, E.
Fink, A. Moropoulou, M. Hagedorn-Saupe, A. Fresa, G. Liestøl, V. Rajcic, & P. Grussenmeyer (Eds.),
Digital heritage. Progress in cultural heritage: Documentation, preservation, and protection: Springer.
Rahman, N. A., Ghani, I., Bahaluddin, A., & Hussain, N. H. (2017). The need for good social behavior through
people friendly urban streets. Environment-Behaviour Proceedings Journal, 2(5), 469-477.
Shiralkar, S. W. (2016). IT through experiential learning: Learn, deploy and adopt IT through gamification. New
York: Apress.
Thwaites, K., & Simkins, I. (2007). Experiential landscape: An approach to people, place and space. Oxon:
Routledge.

34
UTM Razak School of Engineering and Advanced Technology
Kuala Lumpur, Malaysia
10th October 2017
SD 20 - DEVELOPMENT OF URBAN MARKET SPATIAL FOR
HIGHEST AND BEST USED OF LAND PRODUCTIVITY AND
SUSTAINABILITY
Christiono Utomo1, Yani Rahmawati1, Cahyono Bintang Nurcahyo1, Iman Krestawan2
1Institut Teknologi Sepuluh Nopember, INDONESIA
[email protected] 2Magister Management of Technology ITS
ABSTRACT
No less than 40% of the approximately 70 traditional retail markets in Surabaya are located in
the downtown area. Although the market location has high economic value as a commercial
property area but its existence has not been utilized optimally. The concept of sustainable
planning of a region can be achieved if the area is not only able to stand and grow by itself but
also contribute to the economic growth of the region and the surrounding trade sector. Based
on its potential, then in the planning of urban spatial development and market area, the most
appropriate land use analysis is needed to produce the highest property value in the area and its
surroundings. This research develops adaptive and collaborative concepts on spatial
configuration design and market economy value in urban area, so it is found the best regional
planning concept to support sustainable economic achievement. These objectives can minimize
the failure of market development in urban areas in support of the success of the process of
structuring the city. Triangulation method is applied through qualitative and quantitative
approach, and using Highest and Best Use (HBU) analysis technique. The analysis process
begins with an explorative study of the determination of alternative types of land use. The five
stages of the analysis are carried out resulting in a model of land productivity to meet the best
land use criteria that include determination of alternative use, regulatory compliance and
permits, the possibility and affordability of construction, financial feasibility and maximum
productivity of land.
Keywords: Urban, market, highest and best use, productivity, sustainability
INTRODUCTION
The scope of market services has a significant impact on the decrease in the quality of space
and the carrying capacity of the surrounding environment. These impacts, among others, are
caused by the increasing number of traders and agricultural commodities that are unloaded and
then impact on the occurrence of congestion. The condition has been partially addressed by the
Surabaya City Government in the 1980s by standardizing the design and market modernization

35
that is oriented on the quantity of supply of stalls without looking at the behavior and character
of traders and consumers in the market location which resulted in a large number of empty
traders stalls and did not complete Spill problems of merchant activity on the road and border.
The existence of the urban market as a traditional market plays an important role as part of the
logistics distribution network in the city of Surabaya, especially for the fulfillment of food needs
of the citizens of the city. Noting that the relocation effort is not a wise step that can be taken
by the City Government. The solution that can be taken is to make efforts to revitalize urban
markets. Because in general there is no balance between the ages of the building, physical
condition and not maximal building function with a strategic location. The goal is to increase
the value of land and buildings as well as is expected to solve problems in urban market areas
to support the development of the region and the development of the property sector in the
region.
METHODS
This research uses quantitative method with the principle of highest and best use (HBU).
Determination of alternative building functions through stakeholder analysis that begins with
the determination of key stakeholders, among others Representatives of Property management,
Surabaya City Government, urban experts and 20 traders Traditional Market set randomly as
sample research.
FINDINGS AND ARGUMENT
Stage 1: Determination of Alternative Use
The analysis phase for determining the alternative of this type of land use is done through
interviews and questionnaires to stakeholders directly involved in the utilization of traditional
market land. From the result of stakeholder analysis, it is found that stakeholder who have
influence and interest to traditional market development plan (Property management,
Government, Urban Observer) and stakeholders who actively and actively engaged in
traditional market choose alternative of market development with building parking, market with
diversification or market with affordable rental housing as an alternative development of the
traditional market.
Stage 2: Legal Acceptance Analysis
The legal acceptance test is a selection process for all possible use alternatives involving
requirements that are in principle the prevailing regulations in the area whether they are and
still apply or temporary regulations are planned. These criteria are private restriction, zoning,
building codes, environmental regulation. Table 1 shows the result of legal aspect
Table 1. Result of legal aspect
No Legal aspect criteria Alternatives
Market and
diversification
Market and
affordable housing
Market and building
parking
1 Private restriction Allowed Allowed Allowed 2 Zoning Allowed Allowed Allowed 3 Building Codes Allowed Allowed Allowed 4 Environmental regulation Allowed Allowed Allowed

36
Stage 3: Physical Acceptance Analysis
A selection process for alternative land use involving requirements related to the physical
condition of the soil. This physical characteristic will greatly influence the highest and best use
of a plot of land. A piece of land may reach its highest and best use on a particular usage
alternative but not suitable for other alternative uses. The range of physical characteristics that
must be considered include size, shape, terrain, and the availability and capacity of public
facilities. With the KDB (Building coefficient ) is 60% and the KLB (Coefficient of building
floor) is 300% or equivalent to 5 floors, so the total area of the effective building floor allowed
is 19,770.39 m2, subsequently minus the main activity development plan on the effective floor
space in the market plan of 9,478.23m2 (Without calculation of effective building floor space)
the effective floor area of the building that can be used for the development of alternative
facilities to be combined with the market (market diversification facility, rental housing,
parking building) is 10,292.16m2. Based on the results of physical tests with the land area ±
7537.9 m2 and with the KLB / effective floor area ± 19,770.39 m2, then the three alternative
plans for traditional market land development is physically possible to be developed (Table 2).
Table 2. Result of physical aspect No Physical aspect criteria Alternatives
Market and
diversification
Market and
affordable housing
Market and building
parking
1 Size, shape, contour of the land Possible Possible Possible 2 Accessibility and public facilities Possible Possible Possible
Stage 4: Financial Acceptance Analysis
Analyze the investment by taking into account the cost of land preparation, construction costs
(building costs and fixed equipment costs), professional service fees, administration fees, and
other costs. From the calculation on the financial feasibility test is obtained internal rate of
return (IRR) value of 44% which can be used as capitalization rate of own capital. The
capitalization rate of loan capital equal to 10.75%. It is assumed that the basic lending rate does
not increase every year. The results of financial revenue analysis are presented in Table 3.
Table 3. Result of financial aspect
Alternatives Criteria of Capital Budgeting Priorities Feasibility
BCR NPV IRR
Market and diversification 2.41 IDR 6.7 Billion 28% 1st Feasible
Market and affordable housing 1.87 IDR – 18.4 Billion 22% 2nd Feasible
Market and building parking 1.59 IDR – 29.3 Billion 19% 3rd Feasible
Stage 5: Maximum Productivity Analysis
Based on the analysis of the determination of the highest and best land use type, the market
value for traditional property if it is developed without the addition function is equal to (+)
Rp.2.910.294,57/m2, while if there is addition of market diversification function, the property
value is Rp.10.528. 379.68/m2.
CONCLUSIONS
The long-term goal of this research is to develop the application of adaptive and collaborative
concepts on the design of spatial configuration and market economic value in urban areas, to
obtain the best planning and development concepts of the region that support the achievement
of economic value of sustainable urban development. These goals can minimize failures in
preserving and developing urban markets. This research is based on the need of developing

37
approaches that can be applied in support of the process of planning, development, and
structuring the city.
ACKNOWLEDGMENT
The authors appreciate the recognition and awards in forms of research grant and fellowship
from “Penelitian Unggulan Perguruan Tinggi (PUPT) 2017 based on contract number
563/PKS/ITS/2017”
REFERENCES Chen. D. “Macroeconomic control, political costs and earnings management: evidence from
Chinese listed real estate companies”. China Journal of Accounting Research, vol.4, no 3
(2011): 91-106.
Dotzour, M.G., Grissom, T.V., and Liu, C.H. “Highest and best use: the evolving paradigm”.
The Journal of Real Estate Research, vol.5, no.1 (1990): 17-32.
Grissom, T.V. “The semantic debate: highest and best use vs most probable use”. The Appraisal
Journal, January (1983): 45-57.
Krause, A.L. and Bitter, C. “Spatial economics, land values and sustainability: trends in real
estate valuation research”. Cities, vol.29, no.2 (2012): 19-25.
Mou. J.G., Peng, H.Z. and Yan, J.J. “Quantitave evaluation of real estate’s risk based on AHP
and simulation”. System Engineering - Theory & Practice, vol.27 no.9 (2007): 77-81.
Rattermann, M.R. “Highest and best use problems in market value appraisals”. The Appraisal
Journal, Residential Appraising, winter (2008): 23-25.
Reed, L. and Kleynhans, T. “The highest and best use of agricultural land in a multifunctional
land market - evidence from South Africa”. Journal of Modern Accounting and Auditing,
vol.7, no.3 (2011): 276-288.
Roberts, J.R. and Roberts, E. “A no-nonsense approach to highest and best use”. The Appraisal
Journal, (1993): 269-272.

38
UTM Razak School of Engineering and Advanced Technology
Kuala Lumpur, Malaysia
10 October 2017
SD 35 - IDENTITY, SUSTAINABILITY, AND THE CITY:
DICHOTOMIES AND REALITIES OF CREATING AN URBAN
LANGUAGE OF THE MALAY PALACE
Puteri Shireen Jahn Kassim1, Tengku Anis Qarihah Raja Abdul Kadir2, Nurul Syala
Abdul Latip3
1, 2, 3 Kulliyah of Architecture and Environmental Design, IIUM
([email protected]; [email protected]; [email protected])
ABSTRACT
The paper reports on the progressive research into the evolution and development of an
urbanized grammar and language on using traditional forms to instigate sustainable urban
design and green city goals. The case study is the Istana Negara Palace; based on the issues
triggered within the design process, and alternatives from the South East Asian area, issues
were explored as a basic forerunner and form giver, yet the final design language was taken
from Arab Islamic vocabulary. There exist difficulties and realities of transmuting local
intentions into configuring urban buildings and several key elements eventually reverted to an
Arab Islamic language rather than projecting a strong Malay tectonic form. As an icon for the
city, the palace must reconcile the scale and masonry nature of large buildings with clear
vocabulary in order to execute the symbolic nature of palatial design. Attempts were made to
express and infuse Malay identity traditional vocabulary. Architectural design conflicts and
dichotomies encountered included three major aspects: 1) Islamic dome vs. pitch form as the
iconic impact for the city (from afar) of the roof silhouette 2) the lack of local grammar and
language in the architrave vocabulary and pedestal/ plinth elements 3) the difficulty of
proportionate design to fulfil national objectives and agenda. The research points to the
necessity and urgency of developing a set of compositional rules and elements of language of
Malay urban architecture derived from the essences of traditional form.
INTRODUCTION
In his critique of the monuments of Putrajaya, (King 2007) observes that ‘…there is nothing
identifiably Malay in the styling and its antecedents. There is no trace of the (Malay) Southeast
Asian Great Mosque tradition with its tiered pyramidal roof forms, open walls and
preoccupation with air movement’. King was an external observer that a local modern city and
master plan at the heart of the Malay world, had no discernible,dominant and recognizable
identity and language characteristic in a South East Asian city - particularly in this large
master development. As the core of Malay settlements and as part of its manifestation of tropical
cities of the past, the Malay palace is, as described by (Yuan 1997), ‘… the heightened
refinement of Malay cultural form, traditions and language and the ‘urban’ and monumental

39
version of the Malay vernacular house, being the first building built before the settlement
grows.' In the past, the palace represents both the ruler’s domain and the administrative building
for the people of a region or area. It is the expressive aesthetic derivation of the Malay house
archetype;with ‘distillations’ of traditions and efflorescence’s of space, form, along with
embellishments. The rich variations of the Malay identity are a representation of Malay cultural
conditions hence the palace reflects distinct rules of space and order, based on a generic
archetypical form – which has represented the notion of the kampong in Malay literature and
nationalist discourse.
Figure 1: Front Elevation of Istana Negara, Kuala Lumpur
Sources: Kumpulan Senireka ( Dotted line by authors)
While Malay palaces have a richness of language, meanings, and styling of columns, roof styles,
decorations of facades and ways of being lifted up from the ground, the universal language and
rules of the order have yet to be established. The difficulty is in defining universal rules due
to the complexity and variation due to the influencing factors such as neighboring countries,
through trades, origins of the owner or influences the character of the different states. The
multivariate characters of the traditional palace are complex with the present scenario of
translating this element in large and complex modern scale of essentially masonry elements.
The National Palace (Jalan Duta, Kuala Lumpur) (Figure 1) is such an example where
difficulties were found based on morphological (frontage) and stylistic analysis. The difficulties
arise in the essential elements of architectural language such as 1) roof form, (2) architrave and
(3) base or pedestal.
FINDINGS AND ARGUMENT
The Istana Negara – dichotomy and design process
While the common expectation is to surmount the masonry body with an iconic Malay pitch
roof, there were essential dichotomies in a symmetrical domed structure exposed in the middle
due to the scale and size of the Istana Negara, the official residence of Yang Dipertuan Agong
As quoted in (Sherif 2015), ‘…The systems of proportions governing the elevation of this
building…dimensions of the building elements are all governed by simple division of the basic
grid.’ Rescaling the roof would make it disproportionately large as the scale and size must be
proportionate to the body. Hence ultimately a series of Arab-Islamic domes was used to express
the symbolic nature of the roof for National Palace too. Refer to Figure 2.
Arab / Islamic Architecture Style
Classical/ Neo Classical/ English Style
Malay Architecture Style

40
Figure 2: Domes at the Main Block Figure 3: Architraves and Façade pedestals
Sources: Kumpulan Senireka ( circle by authors) Sources: K, Senireka Sdn. Bhd. ( dotted lines by authors)
Similarly, as there is no immediate resource of architrave and pedestal designs and motifs, -
pedestals are particularly crucial in façade design as they make the façade look less ‘empty.'
(Figure 3.) Hence while many have criticised the Arab-eclectic nature of the Istana Negara,
similar to Ross King’s criticism of Putrajaya monumental buildings, there is an essential
difficulty in the direct translation, transposition, and transmutation of Malay-based vocabulary
onto modern construction and materials and the rescaled composition is not immediately
apparent and resolvable due to the size of the project.
Figure 4: Infusion of Classical, and Palladian Language of Architecture of
Istana Negara
These dichotomies are related to the formality needed and in this case, these are resolved
through the infusing Classical, Neo Classical and Palladian Language of architecture. Figure
4 shows how 1) the triangular pediment was fused with Malay roof language (to adorn the
roofscape), 2) to embellish the frontage the use of Classical ‘orders’ was slightly mutated but
based on the tripartite system of the base, column, and capital. A distinctly organized and
compositional system was cultivated.
Triangular Pediment
Classical Orders
Pedestal
5 6 7 8
Figure 5 : Classical Column (8th- 9th B.C) Figure 6 : Column of Istana Jahar, Kota Bharu (1855)
Figure 7 : Column of Istana Negara, Kuala Lumpur (2013)
Figure 8 : Column of Istana Baitul Rahmah, Perak (1911)

41
The distillations of Malay architectural language are urgently needed as these would eventually
affect urban buildings, language, and form, without which, there is a tendency to evoke
Western or Arab elements in administrative buildings. This tendency (Moser 2012), was
apparent in Putrajaya‘…rather than vernacular design traditions, the state recently adopted a
fantasy Middle Eastern style for secular national buildings in Putrajaya.’ There is no
immediate Malay-based vocabulary for masonry elements like pedestals,yet local vocabulary
can found in theMalay-Classcical form and functions known as ‘lapik tiang’ in 1800’s era at
Istana Jahar, Kota Bharu and Baitul Rahmah, Perak. Figure 5, 6, 7 and 8 compares the different
columns - which illustrates how designers Istana Negara attempted to evoke tradition by
mutating a variation of the column.
CONCLUSION
As summarized, there is still a gap that exists in the context of an urban language derived from
traditional Malay palatial architecture, and its principles and vocabulary. Some may think that
the traditional Malay architecture rooted in timber may not be relevant or fashionable enough
to the modern world. Hence, there are examples related to the urban language and sustainability
which requires an in-depth study of tectonic elements and the intrinsic values of traditional
architecture in urban contexts. Secondly, efforts of deriving national identity at national and
international levels should be studied and understood. The issues for Malaysian architects,
clients and government bodies are the application of Malay architecture values and design in
contemporary administrative buildings. More analysis needs to be done on masonry elements
of traditional palaces such as to pave the path forward. The resolution of Malay architecture
language is crucial for the stability, identity, socio culture development and maturity of the
nation.
Acknowledgment: The authors would like to acknowledge the Transdisciplinary Research
Fund (TRGS)from Ministry of Higher Education for the support of this research.
REFERENCES
Azreena Binti Abu Bakar, Nangkula Utaberta. “Motif-Motif Ukiran Pada Rumah Tiang Dua
Belas Di Kelantan Dan Terengganu.” Journal Design + Built, 2013: Volume 6- 1-11.
King, Ross. “Re- writing the City: Putrajaya as Representation.” Journal of Urban Design,
2007: 117-138.
Moser, Sarah. “Circulating Visions of ' High Islam': The Adoption of Fantasy Middle Eastern
Architecture in Constructing Malaysian National Identity.” SAGE Journals, 2012: 12.
Nasir, Abdul Halim. Warisan Senibina Melayu. Bangi: Universiti Kebangsaan Malaysia,
1997.
Rasdi, Mohamad Tajuddin Mohamad. Warisan Senibina. Selangor: Univision Press Sdn.
Bhd., 2012.
Sherif, Md Nizam Md. The national Palace of Malaysia; A symbol of Sovereignty and
Majestic of The Malay Sultanates. Kuala Lumpur: Maya Maju (M) Sdn. Bhd., 2015.
Shireen Jahn Kassim, Norwina Mohd Nawawi, Noor Hanita Abdul Majid. The Resilience of
Tradition. Penang: Areca Books, 2017.
Yuan, Lim Jee. The Malay House: Rediscovering Malaysia's Indigenous Shelter System.
Pulau Pinang: Institut Masyarakat, 1997.

42
UTM Razak School of Engineering and Advanced Technology
Kuala Lumpur, Malaysia
10 October 2017
SD 38 - SENSE OF COMMUNITY AND SOCIAL SUSTAINABILITY:
THE ROLE OF PUBLIC OPEN SPACES
Abubakar Siddiq Usman *1, 2
1 Department of Urban and Regional Planning, Faculty of Built Environment, Universiti Teknologi
Malaysia, Johor Bahru, Johor, MALAYSIA. 2 Department of Urban and Regional Planning, Faculty of Environment Design, Ahmadu Bello
University, Zaria, NIGERIA.
ABSTRACT
Although there is a growing interest in how the sense of community impact on sustainability,
little empirical study has been done regarding the sense of community and local facilities
relationship, especially urban public open space in promoting sustainability. The study,
therefore, seeks to determine the contribution of public open space in promoting sustainability
through a sense of community in developing countries. Two public open spaces – the traditional
and modern - in Kano metropolis, Nigeria, were selected, primarily based on their physical and
functional characteristics, and historical significance. It is a comparative analysis and data were
collected using questionnaire survey and analysed quantitatively using linear regression. The
study revealed that the perceived quality of public open spaces such as crime, safety and
security, community involvement and, interaction were significant. However, the study
findings revealed that sense of community is positively associated with the traditional open
spaces. The findings indicate that sustainability especially social can be promoted by enhancing
the sense of community. This is believed will be achieved through the design of public open
spaces based on the enduring traditional concepts and values. The study will serve as important
settings for the promotion of social sustainability in developing countries.
Key words: Sense of Community, Social Sustainability, Public Open Space
INTRODUCTION
Sense of community defined as “a feeling that members have of belonging, a feeling that
members matter to one another and to the group, ..... ” (McMillan & Chavis, 1986, p. 9), has
been associated with the concept of social sustainability, such as crime, safety and security,
community involvement and interaction, stability and well-being (Bramley et al, 2006). Several
studies have lent credence to these assertions that there exists a relationship between sense of
community and social sustainability (Wilkerson et al, 2012). For example, Kuo et al. (1998)
posit that common space usage by the community promotes social ties, while Coleman & Iso-
Ahola, (1993) indicates that leisure activities especially social facilitate the development of
social networks or group. According to Mesch & Manor, (1998), community social
involvement is “the most consistent and significant source of attachment to place” (p. 507).

43
and that the existence of strong social networks promotes community involvement (Warde, et
al, 2005). While Kuo & Sullivan, (2001) relate fewer crimes, violence and intra-family
aggression with high quality green open spaces; these criteria reflect those of many established
theories, which propagate that sense of community has a profound influence on social
sustainability.
Although the theoretical and phenomenological overlap between social sustainability and sense
of community (Middleton, 2010) has been gaining momentum within the wider urban built
environment (Healey, 1996), there is dearth of empirical research that examine how sense of
community enhances social sustainability through Public Open Space (POS) especially those
of developing countries like Nigeria. This paper is an attempt in that direction. It is a
comparative analysis, that seeks to investigate how the quality of two different POS (the
traditional and modern POS) enhance social sustainability.
These POS types differed in their physical, socio-functional characteristics, and historical
significance. While the traditional POS, found within the traditional neighbourhood, developed
organically without planning intervention, the modern POS was the outcome of modern
planning found within the planned urban neighbourhood. The main focus is on the effects of
POS on sense of community. Regarding method, the mixed method was adopted for the study.
Specifically, data were obtained and analysed quantitatively through numerical measures but
the interpretation of the analysis is qualitative. Data for the analysis were obtained through the
use of questionnaire survey and POS audit. Both the physical and social environmental factors
of POS were examined. Although the study is mainly on subjective aspects, the objective aspect
of POS was also considered to enhance study reliability.
MAIN RESULTS
The study revealed that the quality of POS in terms of both physical and social
environmental factors is an important correlate of sense of community and that social
interaction, correlate more with the quality of the public space than size and number. It also
revealed that perceived POS characteristics such as crime reduction, safety, security and
sense of community are more positively associated with the traditional POS. Though the
sense of community is statistically associated with the presence of high-quality POS, as the
study indicates, traditional POS was more correlated than modern POS, especially with
social environmental factors. The study means score was 8.59 with a standard deviation
(SD) of 2.46. In terms of demographic factors, the study indicates that mean score was
higher for traditional POS, especially among married and self-employed participants.
Education appears to be less significant with an overall p-value of 0.11.
Among the physical environmental factors, both subjective quality (positive associations)
of, and distance (negative associations) to POS were found to be significantly associated
with sense of community. The study also revealed that it is the perceived distance
(proximity), rather than the frequency of usage of POS that is relevant. Mean score for a
sense of community as regards to proximity was higher for the traditional than the modern
public open space, with R ¼ 0.22 and p < 0.001 values for people living within less than 5
minutes from POS respectively.
As regards the social environmental factors, sport and recreational activities appear
significant within the modern public open space while perceived neighbourhood crime and
involvement in neighbouring activities were found to be significant for the traditional public
open space. Though all the POS quality were moderately correlated with a value of R ¼

44
0.12 and p < 0.001, they were significantly associated with a sense of community. However,
using POS for social recreation indicate that mean score was higher for traditional POS
participants (p < 0.05). This is due to the fact the traditional POS can be adapted to a
multiple of functions (commerce, social gathering, a variety of children activities etc) all
involving some form of social interactions, unlike its modern counterpart.
CONCLUSION
The study examines the potential of two different POS in promoting social sustainability, with
emphasis on the quality and attributes of POS. The enhancing of social sustainability by
encouraging a stronger sense of community through POS are numerous, such as increased
community participation and social networks, community stability through a reduction in crime
and place attachment. The aforementioned POS have been developed with different sets of
priorities and yet still share certain viable and vital characteristics that are fundamental to
sustainability. Therefore urban planning and design policies that support a strong sense of
community by providing high-quality POS are desirable if sustainable development is to be
promoted, the study recommends. The fact that the study findings indicate that traditional POS
were more significantly associated than modern suggest that traditional POS was more relevant
to participants’ lifestyle. The study posits that urban sustainability, especially its social
dimension, can be promoted by enhancing the sense of community promoted by traditional
POS. This can be achieved through the design of POS that reflect traditional concepts and
values. Nevertheless, the study concludes by advocating for further research on the possibility
of incorporating the concept and principles (governing the success of the traditional POS in
promoting a stronger sense of community) in planning and designing of urban neighbourhoods.
REFERENCES
Bramley, G., Dempsey, N., Power, S., & Brown, C. (2006, April). What is ‘social sustainability’, and how do our
existing urban forms perform in nurturing it. In Sustainable Communities and Green Futures’ Conference,
Bartlett School of Planning, University College London, London.
Coleman, D., & Iso-Ahola, S. (1993). Leisure and health: The role of social support and self-determination. Journal
of Leisure Research, 25, 111-128.
Healey, P. (1996). The communicative turn in planning theory and its implications for spatial strategy formation.
Environment and Planning B: Planning and Design, 23(2), 217-234.
Kuo, F. E., & Sullivan, W. C. (2001a). Aggression and violence in the inner city – effects of environment via
mental fatigue. Environment and Behavior, 33, 543-571.
Kuo, F. E., & Sullivan, W. C. (2001b). Environment and crime in the inner city – does vegetation reduce crime?
Environment and Behavior, 33, 343-367.
Kuo, F. E., Sullivan, W. C., Coley, R. L., & Brunson, L. (1998). Fertile ground for community: Inner-city
neighbourhood common spaces. American Journal of Community Psychology, 26, 823-851.
McMillan, D. W., & Chavis, D. M. (1986). Sense of community: A definition and theory. Journal of Community
Psychology, 14, 6-23.
Mesch, G. S., & Manor, O. (1998). Social ties, environmental perception, and local attachment. Environment and
Behavior, 30, 504-519.
Middleton, J. (2010). Sense and the city: exploring the embodied geographies of urban walking. Social & Cultural
Geography, 11(6), 575-596.
Warde, A., Tampubolon, G., & Savage, M. (2005). Recreation, informal social networks and social capital. Journal
of Leisure Research, 37, 402-425.
Wilkerson, A, Carlson N. E., Yen I. H, & Michael Y. L (2012). Neighborhood Physical Features and Relationships
With Neighbors: Does Positive Physical Environment Increase Neighborliness? Environment and Behavior,
44(5), 595- 615.

45
UTM Razak School of Engineering and Advanced Technology
Kuala Lumpur, Malaysia
10th October 2017
SD40 - MORPHOLOGICAL PATTERNS OF THE SHADED URBAN
SPACE: AN EVOLUTION OF PRE- TO POST-COLONIAL
CONFIGURATIONS OF MALAY URBAN TROPICALITY
Puteri Shireen Jahn Kassim1, Nor Zalina Harun2 and Shaiful Nadzri Samsuddin3
1 Associate Professor, Kulliyyah of Architecture and Environmental Design, International
IslamicUniversity Malaysia, [email protected] 2 Associate Professor , Institute of the Malay World andCivilizations, Universiti Kebangsaan
Malaysia, [email protected] 3 Postgraduate student, Kulliyyah of Architecture and Environmental Design, International
IslamicUniversity Malaysia, [email protected]
ABSTRACT
Urbanists have long expressed concern how the traditional conceptualisations of urban spaces
have been slowly eroded in modern cities as modernisation continue its rapid course. In tropical
Asian cities, urban policy have emphasised shaded spaces such as the five-foot ways to infuse
identity, yet the situation can be improved by cultural mapping of past urban forms in terms
of shaded spaces. Tropical regions, historically, have nurtured its own forms and ‘mutation’ of
public open spaces in the form of shaded structures and its morphological extensions. Amidst
an intense climate , these shaded spaces are ‘socio-economic’ and ‘socio-cultural’ activators
and hence the analysis geometric shapes related to shade – founded upon Rob Krier’s
morphological studies - represents a resource of cultural forms of urban design which often
constitute,as seen throughout history, the seeds and nexus of ‘activated’ urban life,. Shaded
extensions include open-air unshaded squares, walkways, pathways and spiritual spaces are part
and parcel of the tropicality of the Malay world –which engenders its own syntax with ‘mass-
to-void’ relationship of socio-cultural ‘charged’ urban spaces. Through an exploratory reviews
of shaded urban spaces of the Malay world, their morphologies highlight the dynamism of their
forms and their contributiob to the urban-architectural and aesthetic form of the city.
Key words: shaded spaces, cultural-mapping, figure-ground abstractions, walkability, tropical urban
regionalism
INTRODUCTION
Publicly accessible open spaces are crucial to the city, Campos (2000) in his PhD, had
investigated key spatial properties that make successful public urban spaces, and had linked
the vibrancy and active character of public spaces to key factors such as the permeability
of surroundings and visual connections. Leotandis (2011) in her research proposal,
highlighted the significance of urban syntax which can be characterized by a boundary and
the feeling of enclosure. However, these are studies primarily sited in cities and urban
centers in temperate climates, while in the hot, humid context, Lepawsky and Jubilado
(2014) show that in the ‘geohistories’ of the street in tropical Malaysia, other elements
46
becomes crucial – the shaded walkway- which is not only a functioning part of city but
which is increasingly linked to the notion of the authenticity of a city. There is an
increasing realization of such public shaded spaces are crucial in evoking cultural
familiarization and climatic comfort that is crucial as the source-activators of a tropical
city, and its significance to initiate, sustain and affect the patterns of vibrancy and ‘static
distribution’ within the tropical urban spaces. Campos (2000) had concluded , in a temperate
climate, that crucial key spatial properties that make successful public urban spaces can be
found in traditional historical urban squares. Hence Krier (1979) in ’Urban Space’ had
analyzed and compiled a resource of morphologies and typology using simplified standard
figure -ground conventions (see Figure 1).
Locally, such mapping in South-East Asian tropics has yet to be significantly achieved ,
but Yeang (1987) highlighted potential shaded urban language in the modern tropics while
Talib and Ariffin (2000), show the extent of cultural mapping of forms (of Perak Kutai
architecture) can unearth categories of typologies. Such analysis of form is useful as it
visualises the typological and morphological character of urban spaces and thus, urban
designers and design processes can grasp quickly and manipulate the relationship
between mass and void, to generate character of urban spaces and create a localized and
potentially activated ‘fabric’. Yet Krier’s diagrams relate to the climatic character of
temperate climate, in which the ‘void’ or the ‘empty’ parts are linked to climatic comfort
in a region in which sunlight and daylight is welcomed outdoors and indoors. In the tropics,
open space are ‘dead’ in the heat of the day, while open, unobstructed space, mainly
consisting of squares and streets is desirable in a temperate climate, in tropical climates,
such manipulation and insertion of empty, open air spaces produce urban spaces that are
unable to function as generators of activity and increased static distribution in the middle
of the day. In this study, a cultural mapping and analysis based on a figure-ground or mass
to void that emphasizes shade is utilized. Using historical documents, lithographs and visual
evidence, spaces under shade are represented as the ‘mass’ while the buildings themselves
appear as ‘voids’ and empty. These abstracted forms and patterns that can be used to induce
a walkable and shaded city, ultimately reducing potential long term carbon emission from
private vehicles, and create zones for walking and socializing while in the long term,
creating a healthy urban society.
METHODOLOGY
The literature was drawn from research articles published in old manuscripts, books and journal
papers accessible through online databases. The scope of the review is limited to international
and local articles that were published between 1979 and 2016. The criteria for inclusion in the
review include the articles that relate particularly to the topics on traditional open spaces like
gardens, orchards and palace gardens, traditional Malay urban design and architecture. A
critical assessment on the existence of urban spaces and shaded devices recorded from the 15th
century to 19th century of the Malay world by focusing on the urban and garden description by
examining nine selected well-known classical Malay manuscripts that were written during the
blossoming of literary period in the 13th century until 17th century. The main manuscripts
reviewed are Sulalatus al-Salatin (Malay Annals), Bustan al-Salatin (The Garden of Kings),
Hikayat Merong Mahawangsa, Hikayat Hang Tuah (The Myth of Hang Tuah) and Hikayat
Inderaputera (The Myth of Inderaputera).
The aim of the analysis is to expand understanding on the plethora of research that explored
this relationship. The topic is transdisciplinary in nature. The articles were analysed and

47
categorised based on key parameters and significant themes. They are presented in a table
format, and the discussions are further elaborated in the result section.
RESULTS
The findings revealed that the typology of urban spaces and shaded devices of traditional Malay
towns can be classified into nine categories presented in Table 1.
Figure 1. Rob Krier’s visualization of urban spaces using the conventional figure gorund
abstract analysis.
These categories prove that the Malay cities existed with their own distinctive identities and
had dynamically evolved throughout eras. The analysis of typology of Malay open-shaded
spaces and surrounding buildings also include extensions of public buildings such as
palaces and public official houses , which are used as public gathering space and extend
into pavilions and bazaars centered around the river. Malay civilization is known for its
economic activities surrounding rivers which thrived from the 15th to late 19th century and
for symbolically-charged fields between the palace and the mosque.. Before the Colonialist
inserted a road to break the urban ‘padang’ in early 20 th centuries, many towns such as
Kedah and Kelantan, during the 18th to 19th century, had the river, mosque and Audience
hall (Balai Besar) as one continous symbolically –charged public zone with shaded
extensions facing each other. These held functions related to government, and were centers
of quasi-urban life exhibiting traditional archetypical forms of open-air squares and shaded
porticos courtyards ( Figure 2). The folowing table presents the profiles of a series of
shaded forms begining with a 16th century open air pavillion the Melakan empire - which
borders the bridge and had functioned activated nodes near river connections, of the 16 th
century ( which had been eventiually burnt down by the invading Portuguese). The ‘shade -
to-void’ analysis include a ‘waqf’ structure of ‘aristocratic houses ’ which saw this
pavilion at the center of an open space with an overlooking ‘serambi’ acting as a
community focus in the heyday of Perak’s history.

48
The impact of the colonial British, Dutch and Porteguese forces, eventually led to the
erasure of such memory of urban shade yet some cases, these cultural symbols remain (
Figure 2ª) , e.g Sultan palace in Alor Setar still has its public halls were in fact, public
extensions of community spaces in the past Such public halls, heightened the role of open
air structures, which then linked to the symbolically charged open space with that of the
mosque on the opposite side of a field. The Ruman Penghulu Ghani, Melaka, and its shaded
extensions had served as a magistrate court and townhall of community from the 18 th
centuries.
Padang between
administrative buildings
Extended open space in front
of palace
Pavillion
Portico of a mosque
Verandah/porticos
Royal jetty
Figure 2. Shaded open air
extensions of public spaces
into an open ‘padang’ before
Colonial incursion

49
Timber wakaf
Tower/ minaret
Open court
Table 1 : Anatomy of the typology of built shaded areas and devices in the tropical Malay
urban setting
CONCLUSION
The study concludes that at different stage of history, we may have seen different types of urban
spaces and tropicalized version of mass to void elements in the Malay twons all of which
enhance the quality of life experiences, spatial planning techonology and development. Both
are essential part of urban heritage which is of ecological and social significance. Not only it
has important role in providing leaisure for the community but also administrative needs
amongst the rulers and administer. Analysis using a ‘tropicalised’ version of the mass- to void
relationship inverts the typical figure ground analysis which consider shade as the activated
open space and which represent social and economic potential. These can create a rich resource
of urban language , but such diagrams of solid and void can better depict socially active spaces
and can be manipulated and used as a basis of different urban morphologies of the city, and if
the ‘shaded hatch’ mass is greater than the internal ‘void’spaces, it could be lquantified with
other urban indices such as walkability index, low urban heat island and carbon emission index
and energy index. A higher shaded index will mean a mixed-use environment that will foster
social cohesion, vibrancy and pedestrian activity and the morphology of shade from past to
present, support in creating a richer topical urban experience, which are culturally and
climatically indigenized.
Acknowledgment: The authors wish to acknowledge the Trandisciplinary Research fund from
Ministry of Higher Education support on this research.
REFERENCES
Ali Ahmad (editor) (2000). Hikayat Inderaputera, Kuala Lumpur, Dewan Bahasa dan Pustaka.
Campos (2000), Urban public spaces : a study of the relation between spatial configuration and
use patterns, Unpublished PhD Thesis UCL.
Evers H.-D., Korff R. (2000) Southeast Asian Urbanism: The Meaning and Power of Social
Space. Singapore: Institute of Southeast Asian Studies
Jelani Harun (editor) (2004). Bustan al-Salatin, Kuala Lumpur: Dewan Bahasa dan Pustaka.
Krier, Rob (1979). Typological and morphological elements of the concept of urban space,
Architecture Design, London.

50
Leotandis. P, ( 2011), The architecture of public open spaces: How to define a syntax in the
contemporary urban environment, , PhiDAC, published in Onference Procedding, PhiDac
International Symposium, Serbia, 2011, p 144to 148.
N. Arifin , A Talib , Perak ( Malay) architecture : A methodological approach in extensive
survey and analysis.
Samad Ahmad (editor) (1996). Sulalatus Salatin – Sejarah Melayu, Kuala Lumpur, Dewan
Bahasa dan Pustaka.
Siti Hawa Salleh (1998), Hikayat Merong Mahawangsa. Yayasan Karyawan dan Penerbit
Universiti Malaya, Kuala Lumpur.
Siti Hawa Salleh (editor) (1992), Bustan al-Salatin, Kuala Lumpur: Dewan Bahasa dan Pustaka.
Siti Hawa Salleh (editor) (1992). Hikayat Merong Mahawangsa, Kuala Lumpur, Yayasan
Karyawan dan Penerbit Universiti Malaya.

51
UTM Razak School of Engineering and Advanced Technology
Kuala Lumpur, Malaysia
10th October 2017
SD 22 - GOVERNANCE OF URBAN HERITAGE – A REVIEW ON
ADAPTIVE REUSE OF HERITAGE BUILDINGS
Mohd Shakir Tamjes 1, Wan Nurul Mardiah Wan Mohd Rani1*, Mohammad Hussaini
Wahab1, Rohayah Che Amat1, Syuhaida Ismail1
1, UTM Razak School of Engineering and Advanced Technology, Kuala Lumpur, MALAYSIA.
*Corresponding Author [email protected], [email protected]
ABSTRACT
Heritage sites and buildings are currently facing a great threat from new urban development
particularly in developing countries as a result of population growth, physical development, as
well as economic growth and this including Malaysia. The scarce of land supply in the heart of
Kuala Lumpur city for instance has exposed this modern heritage cities to severe from
commercialization pressure because of its land price. Whether to preserve or not are still in
great debate among the policymakers, stakeholder and academician. The notion of economic
value of conservation has been outlined by the government on its document namely economic
transformation programme indirectly. The values lies on the conservation site offers important
recognition not only to the people of the community and country concerned, also income
regeneration from tourism. The importance of conservation comprised a significant impact on
the 3 pillars of sustainability namely; social, economy and environmental. This research will
examine the gap in between Rancangan Malaysia ke-11 (RMK11), Rancangan Fizikal Negara
3 and 2, Dasar Perbandaran Negara and relating current by-laws to interpret the hindrance to
built heritage conservation activity in Malaysia. Hence, the focus of this paper is to review and
identify the present governance and legislations weaknesses to protect such buildings from
being demolished and destroyed. Subsequently, the paper will identify several best practice
strategies towards better governance of urban heritage and adaptive reuse of heritage buildings.
Key word: Built Heritage, Conservation, Governance, Framework, adaptive reuse, heritage buildings
INTRODUCTION
Built heritage conservation can move from a passive and aesthetic component, to a move active
and assertive one, proposing visions and strategies for future development that combine
conservation and ‘modernity’. It provides a continuity lesson from scientific and technology to
human survival skills as a sustainable form of development offering cohesive social
relationships, human scales and successful adaptation to the physical environment, such as by
vernacular buildings that use local materials and technique. Built heritage conservation also

52
increasingly considered as a resource supporting economic development, social welfare and of
course environmental.
Even though conservation has largely become a positive option among stakeholder as new
development approach, unfortunately according to Robiah (2016) that there are enormous
numbers of historic buildings falling and neglected because of deterioration after conservation.
On the other hand, the value of historical building is not something that can be defined directly
into a number or price. So that the threat of new development take place as the land value
increased in the prime area particularly in Kuala Lumpur (Bavani M, 2017). From these
scenarios, there is lack in enforcement and policy outlined by the government and related bodies
regarding this issue. Current legislation; National Heritage Act 2005 need to be completed by
the certain by-laws or guidelines as a manual to the related parties involved (Harun, 2011). The
post-conservation works has become a major issue as maintenance practice among the
Malaysian come to second in priority and leave a gap as good maintenance management
strategies (Mohd-Isa, 2011; Bavani M, 2017). The lack of understanding and awareness among
Malaysian particularly on the related legislation can be seen recently on the issue of revocation
of one heritage site status in Kuala Lumpur. The revocation notification in the New Straits
Times on 28 December 2016 was from Jabatan Warisan Negara (JWN). The existing law on
National Heritage Act 2015 does not provide any provision regarding the revocation of heritage
site which is means the current legislation need to be amended (Cardosa, 2016). Jabatan
Warisan Negara was the government agency which is responsible for exploring and preserving
heritage treasures in Malaysia as identify and economic regenerations.
DISCUSSION
This study expected to gain local context understanding with regards to the regulations,
implementations and enforcements of conservation particularly on adaptive reuse of built
heritage. This research will adopt a mixed method (qualitative and quantitative method) to
answer each of the research objectives. In-depth interview as primary data will be conducted
among the stakeholders i.e. architects, conservator, planner and policymakers to capture
information and the gap within. Data from secondary sources as government publication i.e.
national policy document, reports and current conservation project will be evaluated and
observed. The main government’s physical planning document; Rancangan Malaysia ke-3, 2
and 1 was a continuity doctrine to spur national physical planning and strengthen the physical,
social and economic development system. RFN3 emphasizes on 4 main attributes of spatial and
physical development namely, growth, liveability, resiliency and sustainability. According to
RFN3, the sustainability of land management and development control are crucial for
economic, social, culture and environment including heritage area as stated in its 3 main cores.
Even in Dasar Perbandaran Negara ke-2 (DPN2) heritage site or buildings has come to picture
as liveability and resiliency character for urban planning. Yet none of these documents highlight
specifically regarding how the operation and maintenance activity take place particularly on
heritage site or buildings. However, there are a provision in National Heritage Act (NHA) 2005
(Act 645) which is mentioned the needs of conservations works and maintenance activity to be
done as compulsory process for the landlord to safeguard the heritage asset or buildings. Local
authority such as Kuala Lumpur City Hall (DBKL) play role as an implemental agency has
outlined its own policy and regulation to enforce and carry out conservation work. The
questions rose whether the current DBKL or others local authorities practice specifically to
safeguard the heritage buildings is adequate compared to UNESCO heritage site practices such
as Malacca and Georgetown. As mentioned by Bavani M (July 11, 2017) heritage buildings

53
required a regular upkeep and constant inspection to keep it as close as possible to its original
state. And in Kuala Lumpur itself, heritage building facing a great threat from our ignorance
and slowly deteriorating. Improved regulation and enforcement helps in protecting the heritage
buildings from vanished to the next generation as it written in history.
CONCLUSION
Malaysia aspires to become a developed country by the year 2020, which it plans to achieve in
3 years through a set of 5-year strategic plans namely; Rancangan Malaysia ke-11 (RMK11)
tentatively started 2016 till 2020. This research examines the current legal / policy behind
protection of built heritage sites in Malaysia that lacked the qualities of world heritage sites.
This research seeks to explore legislation through a desk-based analysis complemented and the
establishment of framework and guideline to help the government and stakeholder for making
decision and improve current practice. In the end, it helps to understand the integration aspects
of heritage law, as well as the degree of community involvement that is necessary in the
protection of heritage.
REFERENCES
Abbas, M. Y., Said, S. Y., Aksah, H., & Ismail, E. D. (2013). Heritage Conservation and Regeneration of
Historic Areas in Malaysia. Procedia - Social and Behavioral Sciences, 105, 418–428.
https://doi.org/10.1016/j.sbspro.2013.11.044
Ashworth, G. J., ho kah Chun, Mohamed, B., Ahmad, a G., Badarulzaman, N., & Ashworth, G. J. (2002).
Challenges of Historic Cities in the New Millennium: Lessons from Malaysia. Universiti Sains Malaysia,
Pulau Pinang, Malaysia, 8(1), 1–14. https://doi.org/10.1080/13527250220119901
Azhari, N. F. N., & Mohamed, E. (2012). Public Perception: Heritage Building Conservation in Kuala Lumpur.
Procedia - Social and Behavioral Sciences, 50, 271–279. https://doi.org/10.1016/j.sbspro.2012.08.033
Bavani M, (2017, July 11). Broken Pieces of History. The Star Online. Retrieved from URL
http://www.thestar.com.my/metro/community/2017/07/11/broken-pieces-of-history-dozens-of-heritage-
buildings-in-the-capital-are-at-risk-of-irreversible-dam/#Xx7vUOcrOSJHYE6D.01
Cardosa, E. (2016, December 31). Statement by Badan Warisan Malaysia on the Revocation of Heritage Site
Status of MaTIC by Jabatan Warisan Malaysia. Retrieved from URL
https://badanwarisanmalaysia.org/2016/12/31/statement-by-badan-warisan-malaysia-on-the-revocation-of-
heritage-site-status-of-matic-by-jabatan-warisan-malaysia/
Harun, S. N. (2011). Heritage building conservation in Malaysia: Experience and challenges. In Procedia
Engineering (Vol. 20, pp. 41–53). https://doi.org/10.1016/j.proeng.2011.11.137
Mohd-Isa, A. F., Zainal-Abidin, Z., & Hashim, A. E. (2011). Built heritage maintenance: A Malaysian
perspectives. In Procedia Engineering (Vol. 20, pp. 213–221).
https://doi.org/10.1016/j.proeng.2011.11.158
Omar, S. S., Sakip, S. R. M., & Akhir, N. M. (2016). Bringing the New to the Old: Urban Regeneration through
Public Arts. Procedia - Social and Behavioral Sciences, 234, 515–524.
https://doi.org/10.1016/j.sbspro.2016.10.270
Robiah (2017, September 3). Preserving Our Heritage New Straits Times. Retrieved from URL
https://www.nst.com.my/news/2016/09/170483/preserving-our-heritage
Yusoff, Y. M., Dollah, H., & Kechot, A. S. (2013). Perlindungan harta warisan : Keberkesanan usaha
pemuliharaan dan pemeliharaan dalam pembangunan negara National development and the protection of
heritage property : An appraisal of the Malaysian experience. GEOGRAFIA OnlineTM Malaysian Journal
of Society and Space, 9(2), 64–77.

54
UTM Razak School of Engineering and Advanced Technology
Kuala Lumpur, Malaysia
10th October 2017
SD 41 - THE URBAN RIVER AND THE HISTORIC RIVERFRONT
TOWNSCAPE OF KUALA LUMPUR
Mohamad Zafarullah Mohamad Rozaly1, Mohammad Hussaini Wahab2, Mohamad Asri
Ibrahim3, Sharyzee Mohmad Shukri4
1Taylor’s University
2Universiti Teknologi Malaysia 3Universiti Teknologi Malaysia, SPACE 4Infrastructure University Kuala Lumpur
([email protected]; [email protected]; [email protected];
ABSTRACT
This study examines the relationship of the urban river of Kuala Lumpur as a significant
geographical setting in the often-neglected historic townscape; the notion of the river being the
genius loci that determines the townscape’s image, identity and sense of place. For a city with
a direct reference to its riverine origin, its rivers for far too long have been dirty, polluted, an
open sewer for pollutants and effluents and in a state of neglect. The city in return, backs onto
the river, refusing to address it and this sets the quest for “a world class city” back a few decades.
The Malaysian government acknowledged that rivers are natural, untapped assets and over the
years has been keen to revive the dead rivers back to life, the latest of which is the River Of
Life launched in 2012 as one of the nine Entry Point Projects under the Economic
Transformation Plan. The River of Life project is the government’s recent effort at cleaning
and beautifying the river after many nationwide campaigns which have failed miserably, such
as the ‘Love Our Rivers’ campaign. Having faced with such challenges, this study aims to
propose the urban design of a historic riverfront district via two objectives; firstly to identify
what causes the failure of the Kuala Lumpur historic townscape to integrate with its urban
rivers, and secondly to establish the urban design factors to be proposed to contextually
integrate such river and townscape so as to retain its sense of place through identifying the
applicable theories and principles.
Key words: urban riverfront, historic townscape, contextual integration, sense of place, River Of Life.
INTRODUCTION
Kuala Lumpur or “muddy river confluence”, has a name that identifies with its geographical
setting. It began as a tin-trading post at the confluence of the historic Klang and Gombak Rivers
and later, in 1919, became the seat of the British administration (Gullick, 1983). Instead of

55
being the dominant geographical identity of Kuala Lumpur, both rivers are dirty, polluted, an
open sewer for storm water run-offs and effluents; neglected at every single turn and in turn,
setting the quest for “a world class city” (KLCP2020) back a few decades. The Malaysian
government’s reform agency, PEMANDU acknowledged the challenges besetting the city and
listed both rivers as “natural assets remain untapped...deliver(ing) little of their potential, either
commercially or as destinations that can add to the city’s vitality.” (ETP Handbook, 2010:128).
In an effort to counter such challenges, the River Of Life project waslaunched in 2012 under
the Economic Transformation Plan whereby the Klang and Gombak riverfronts are identified
and recognised as Kuala Lumpur most under-utilised natural assets (ETP Handbook, 2010).
The ROL, a tripartite mission of river cleaning, beautification and land development to spur
economic investment (ROL Master Plan Report, 2014), is work-in-progress coming under a lot
of scrutiny due to its huge budget amounting to RM4.4 billion which has met with scepticism,
as many large-scale nationwide efforts to clean up Malaysian rivers over the decades failed to
take off such as the ‘Love Our Rivers’ campaign, 1993 which was declared a total failure as it
did not meet its objectives of being sustainable and pollution-free (AFP, 2007). Ong (2015a)
observed from a kayaking expedition carried out, that while river cleaning is work in progress,
large amounts of solid waste from connecting monsoon drains being discharged into the rivers
by factories and other large scale polluters have resulted in the ROL to be a questionable
exercise, despite its expensive budget. Ong also observed that the ROL master plan is still
undisclosed, with public access to riverfronts not made into a priority. In light of the cleaning
process, the effectiveness of the beautification strategy remains to be seen. The threat of
undisclosed, market-oriented private land development and its apparent lack of transparency
may have the conflicting effect of further restricting “public access and enjoyment” to the
riverfronts (Ong, 2015a).
Nearly all major cities in Malaysia lack contextual integration of river and townscape (Latip et
al, 2011; Shamsuddin et al, 2013), with certain infrastructure development blocking physical
and visual access altogether to the riverfront. A sad fact indeed, considering many early Malay
peninsular towns grew up along rivers, river valleys or coastal areas with 11 out of 13 state
capitals in Malaysia having great proximity by river or seafronts (Shamsuddin et all 2013,
Andaya & Andaya, 2016). The lack of contextual integration continues to threaten the fabric of
our historic townscape because the river, the place where all the cities began, is in a state of
perpetual decline. Borrowing from the textile metaphor of the urban fabric (Tibbalds, 2002;
Cullen, 1961), our rivers, as it were, are in a state of ‘unwoven’ from their respective historic
townscape. These scenarios described above would probably have suggested a lack of river
policies and guidelines. The truth is, Malaysia is not short of them; but that they are used in
isolation of each other, ungazetted, very general, not specifically focused on the riverfront and
yet to be revised (Latip et al 2010). Latip et al (2010) conclude that with all the various laws,
policies and guidelines notwithstanding, waterfront developments were still not contextually
integrated with the river, let alone piecemeal in nature. Latip asserts that the success of
waterfront regenerations are not because of the design end product, but rather, the incremental,
balanced and comprehensive development process involving communities. At present, there is
an apparent absence of a single body with overall responsibility for devising, coordinating and
implementing the much-needed urban design policies yet to be adjusted by the authorities which
are variously divided among the architectural, landscaping, conservation and urban transport
departments (Latip et al, 2010).
There are tremendous pressures for speculative development that may not only threaten the
historic urban fabric, but also displace the original community affecting both physical and social
aspects of Malaysian townscape. Shamsuddin (2011) identified factors such as the lack of

56
design guidance, skilled personnel, political will, and inadequate conservation policies or
guidelines, all combine to displace the historic riverfront townscape with “totally
unsympathetic development”. As locals are unwittingly being driven away, old city centres are
either fast turning into historic theme parks, (Shamsuddin, 2011:141-142) or fast regressing
into neglected havens for foreign workers (Cheng, 2015). All these have translated the historic
riverfront district into an image of townscape in disarray, a large part of which is due to planning
policies and guidelines, or rather, the lack of it (Latip et al, 2010); and should townscape be
likened to a piece of fabric (Cullen, 1961), all the elements in it would have been in tatters and
unwoven.
METHODS
Having faced with such challenges, this study aims to propose the urban design of a historic
riverfront district via two objectives; firstly to identify what causes the failure of the Kuala
Lumpur historic townscape to integrate with its urban rivers, and secondly to establish the urban
design factors to be proposed to contextually integrate such river and townscape so as to retain
its sense of place through identifying the applicable theories and principles. A case study
approach in which a qualitative method in data collection and analysis is adopted through three
techniques; firstly, a literature review that evaluatively reports information found in scholarly,
expert opinions and current knowledge based on substantive findings on the historic riverfront.
These are found in esteemed literature in order to establish a theoretical base of what is already
known in determining the design nature for the master’s project (Fink, 2013).
Secondly, a field observation documented and conducted through two main techniques firstly
a visual survey; an analysis of the city structure and framework, and secondly a townscape
appraisal; an analysis of the visual and experiential content and fabric of the town and the art
of relationship between elements of urban form that gives the town its personality and character
(Relph, 1987; Spreiregen, 1964; Shamsuddin, 2011). Thirdly, a content analysis of a body of
communicated materials analysed to gather in-depth knowledge (Rosengren, 1981) on existing
design policies and guidelines regarding the historic riverfront. The scope of research is limited
to firstly, the physical and functional character of historic riverfront and less on its
psychological depth and meanings. Secondly, the historic riverfront concerns only urban rivers
and thirdly, the focus on the application of contextually integrative theory and principles on a
selected area of case study with the aim to retain the sense of place.
FINDINGS AND ARGUMENTS
Using the Integrative Theory (Sternberg, 2000), the main findings revealed that the largest
contributor toward contextual non-integration between river and townscape is the utter lack of
the comfort factor in the walkable environment, as referred to in fig.1 below. This is attributable
to the lack of design coherence, poor physical linkage and spatial characters due to poor
connectivity between key focus areas, the lack of structural clarity where poor pedestrian
permeability and the lack of clear physical direction to the river affects navigation, orientation
and interconnectivity of the nodes and paths of the city’s imageability all of which contribute
to poor river legibility in the townscape. Finally, the Klang River as an urban form and element
in townscape fails to become a setting for activities to allow for any kind of possible water-
related or -dependent human activities, simply because there aren’t any form of activities in the
water body nor are there settings for such activities to help incite greater vitality to create
contextual integration.
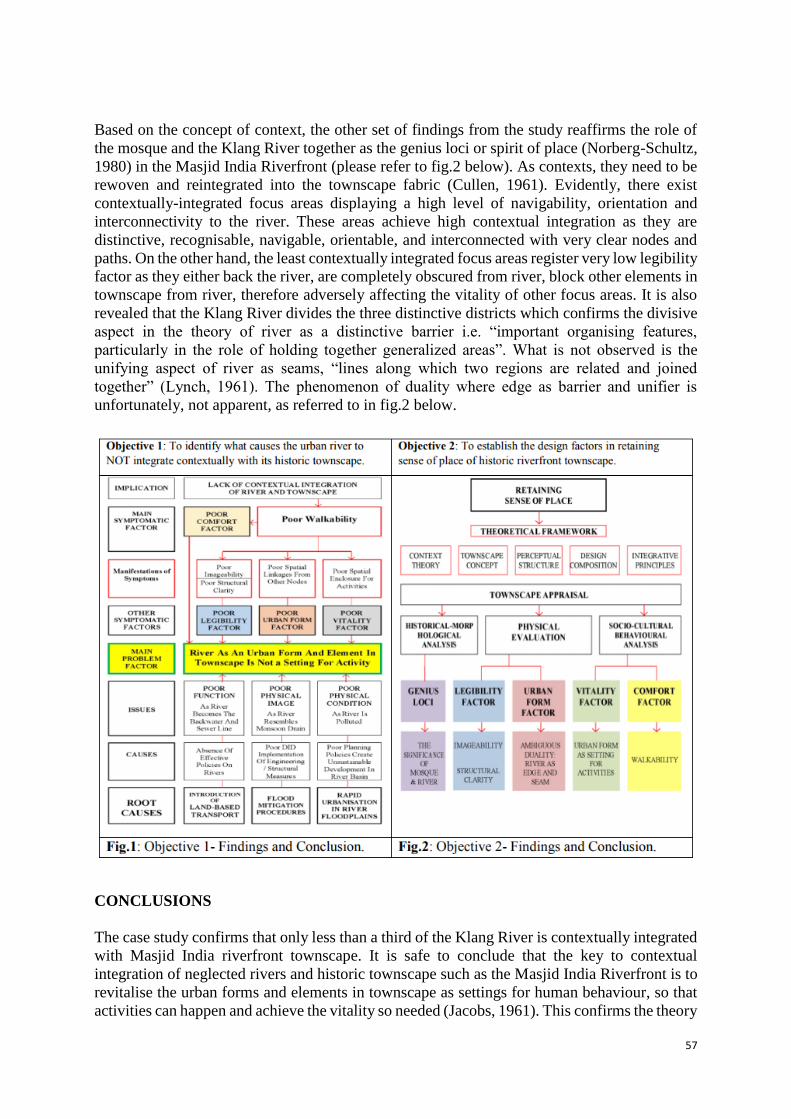
57
Based on the concept of context, the other set of findings from the study reaffirms the role of
the mosque and the Klang River together as the genius loci or spirit of place (Norberg-Schultz,
1980) in the Masjid India Riverfront (please refer to fig.2 below). As contexts, they need to be
rewoven and reintegrated into the townscape fabric (Cullen, 1961). Evidently, there exist
contextually-integrated focus areas displaying a high level of navigability, orientation and
interconnectivity to the river. These areas achieve high contextual integration as they are
distinctive, recognisable, navigable, orientable, and interconnected with very clear nodes and
paths. On the other hand, the least contextually integrated focus areas register very low legibility
factor as they either back the river, are completely obscured from river, block other elements in
townscape from river, therefore adversely affecting the vitality of other focus areas. It is also
revealed that the Klang River divides the three distinctive districts which confirms the divisive
aspect in the theory of river as a distinctive barrier i.e. “important organising features,
particularly in the role of holding together generalized areas”. What is not observed is the
unifying aspect of river as seams, “lines along which two regions are related and joined
together” (Lynch, 1961). The phenomenon of duality where edge as barrier and unifier is
unfortunately, not apparent, as referred to in fig.2 below.
CONCLUSIONS
The case study confirms that only less than a third of the Klang River is contextually integrated
with Masjid India riverfront townscape. It is safe to conclude that the key to contextual
integration of neglected rivers and historic townscape such as the Masjid India Riverfront is to
revitalise the urban forms and elements in townscape as settings for human behaviour, so that
activities can happen and achieve the vitality so needed (Jacobs, 1961). This confirms the theory

58
put forward in the canon of classic urban design about settings and human behaviour (Tugnut
and Robertson, 1987; Appleyard, 1969; Rapoport, 1990; Transik, 1986). By making the
environment legible and comfortable, walkability -the reason and the acid test by which
townscape and cities are contextually integrated- must be made to happen. All these findings
confirm the integrative theory (Sternberg, 2000). Likewise to design in order to contextually
integrate the city with its genius loci -which were lost in plain sight after years of neglect- will
very much likely be done in the same manner; by applying the integrative principles which are
unsurprisingly, already inherent as part of the canon of classic urban design (Carmona &
Tiesdell, 2007).
From the study carried out, walkability is the factor to consider to make cities better integrated.
To enhance it by creating purposes for people to walk will help integrate the city to its context.
Making the walkable city a step more legible, more comfortable is, in effect, making one more
bold step, towards the vision of a world class city. Ultimately, it is imperative to acknowledge
that the right decision must be based on the right reason; and achieving sense of place is right
there at the top of that reason. In retaining its sense of place, a proposed recommendation for
the design of the Masjid India Riverfront through a more integrative urban design framework
is seen as necessary in producing a master plan that will ensure the ‘art of weaving’ is applied
onto the urban fabric with varying pattern, grain and texture (Cullen, 1961). Five major goals
are identified in achieving contextual integration based on this study. The first goal is to
establish a vision of a contextually-integrated river and mosque as genius loci in a walkable,
heritage riverfront townscape for everyone. Secondly, to increase legibility factor of river to the
mosque and strengthen its centre of meaning with river presence. Thirdly, to establish the river
as a living element of townscape and a legitimate setting for activities. Fourthly, to create
comfortable walking environment throughout the entire townscape; and finally to create unique
focus areas around the river and unify them with the interconnectivity of the river as both a
barrier and a seam.
REFERENCES
1. Andaya, B. W. and L. Y. Andaya (2016). A History of Malaysia, Palgrave Macmillan.
2. Appleyard, D. (1969). City Designers and the Pluralistic City. Institute of Urban and Regional
Development.
3. Carmona, M and Tiesdell, S. (Ed.) (2007). Urban Design Reader. Taylor & Francis.
4. Cheng, N. (2015, Jan 11). Over 200 immigrants arrested in massive dragnet. The Star Online,
Retrieved May 2, 2016, from http://www.thestar.com.my/news/nation /2015/01/11/crimeimmigrant-
hauled-up/
5. Cullen, G. (1961) The Concise Townscape. Architectural Press.
6. ETP Handbook, (2010). Retrieved Nov 15, 2016, from
http://etp.pemandu.gov.my/download_centre.aspx
7. Fink, A. (2013). Conducting Research Literature Reviews: From the Internet to Paper: From the
Internet to Paper. SAGE Publications.
8. Gullick, J. M. (1983). The Story of Kuala Lumpur, 1857–1939. Eastern Universities Press (M).
9. Jacobs, J. (1961). The Death and Life of Great American Cities. Random House.
10. Latip, N. S. A. and S. Shamsuddin (2012). Kuala Lumpur Waterfront: A Public Place for All?
International Transaction Journal of Engineering, Management, & Applied Sciences &
Technologies.:311-331.
11. Latip, Nurul Syala Abdul. (2011). Contextual Integration In Waterfront Development. PhD thesis,
University of Nottingham.

59
12. Latip, N. S. A., Heath, T., Shamsuddin, S., Liew, M. S., & Vallyutham, K. (2010). The Contextual
Integration And Sustainable Development Of Kuala Lumpur's City Centre Waterfront: An Evaluation
Of The Policies, Law And Guidelines. Paper Presented At The World, Engineering, Science And
Technology Congress (ESTCON 2010). (15-17 June 2010). Kuala Lumpur Convention Centre,
Malaysia.
13. Latip, A., et al. (2009). A Morphological Analysis Of The Waterfront In City Centre. Kuala Lumpur.
Inta-Sega 2009:Bridging Innovation, Technology And Tradition. 2-4th December 2009, Grand Mercure.
(Unpublished)
14. Lynch, K. (1960). The Image of the City. M.I.T. Press.
15. Malaysian Effort To Clean Up Rivers a 'Failure'. (2007, April 24). Associated Press. Retrieved June
4, 2016 from http://www.unep.org/cpi/briefs/2007April25.doc
16. Norberg-Schulz, C. (1980). Genius Loci: Towards a Phenomenology Of Architecture. Academy
Editions.
17. Ong, K. M. (2015a, Dec 17). Why Care About ‘River Of Life’? Try Rm4.4b For Size.
Malaysiakini.com News. Retrieved June 5, 2016, from https://www.malaysia - kini.com/news/323635
18. Rapoport, A. (1990). History and Precedent in Environmental Design. Plenum Press.
19. Relph, E. C. (1987). The Modern Urban Landscape: 1880 to the Present. Johns Hopkins University
Press.
20. River Of Life. (2014). Kuala Lumpur: DBKL & AECOM.
21. Rosengren, K. E. (1981). Advances in Content Analysis. SAGE Publications.
22. Shamsuddin, S., Abdul Latip, N. S., Ujang, N., Sulaiman, A. B., & Alias, N. A. (2013). How a City
Lost Its Waterfront: Tracing The Effects Of Policies On The Sustainability Of The Kuala Lumpur
Waterfront As a Public Place. Journal of Environmental Planning and Management. 56(3), 378-397.
23. Shamsuddin, S. (2011). Townscape Revisited: Unravelling the Character of the Historic Townscape
in Malaysia. Penerbit UTM Press, Universiti Teknologi Malaysia.
24. Shamsuddin, S., et al. (2010). Regeneration of the historic waterfront of world heritage sites in
Malaysia–the case of Penang and Melaka. Uk-Ireland Planning Research Conference 2010. Diversity
And Convergence: Planning In a World Of Change, 7-9th April 2010, Chelmsford, Essex.
(Unpublished)
25. Spreiregen, P. D. (1965). Urban Design: The Architecture of Towns and Cities, McGraw-Hill.
26. Sternberg, E. (2000). An Integrative Theory Of Urban Design. Journal of American Planning
Association. Vol.66, No.3, pp. 265-278
27. Tibbalds, F. (2002). Making People-Friendly Towns: Improving the Public Environment in Towns
and Cities. Taylor & Francis.
28. Trancik, R. (1986). Finding Lost Space: Theories of Urban Design. John Wiley & Sons.
29. Tugnutt, A. and M. Robertson (1987). Making Townscape: a Contextual Approach To Building In
An Urban Setting, Mitchell.
ABBREVIATIONS
1. PEMANDU Performance Management and Delivery Unit
2. KLCP2020 KUALA LUMPUR CITY PLAN 2020
3. ROL River Of Live Project
4. EPP Entry Point Projects
5. ETP Economic Transformation Programme

60
UTM Razak School of Engineering and Advanced Technology
Kuala Lumpur, Malaysia
10th October 2017
SD 2 - THE IMPACT OF FREIGHT VEHICLE ACCESS RESTRICTION
ON THE SUSTAINABILITY OF JAKARTA INTRA URBAN TOLL
WAY SYSTEM
Nahry Yusuf
Department of Civil Engineering, Universitas Indonesia, Kampus UI Depok, Jawa Barat, Indonesia
ABSTRACT
Freight vehicle access restriction policy in 2011 has had an impact on the performance of
Jakarta Intra Urban Toll way (JIUT) system. The purpose of this study is to analyze the impact
of the policy on JIUT system before and after its implementation and to analyze the impact that
occurs without the implementation of this policy by using the sustainable transportation
indicators as the research parameters. The assessment results of the parameters (speed, amount
of fuel consumption, cost of fuel consumption, fatality rate, cost of accident victim, amount of
CO2 emissions, cost of carbon pollution, and noise level) indicate that freight vehicle access
restriction policy has a positive impact on traffic smoothness and safety but does not support
overall urban sustainable transportation in JIUT system. In addition, if the policy was not
implemented, its impact was worse than the current condition. It implies that the
implementation of the policy is a right decision though some parameters should be improved
to attain sustainable transport system.
Keywords: Freight vehicle, access restriction, sustainable transportation, toll way system.
INTRODUCTION
The increase of truck traffic has a large impact on highways transportation in many cities. In
congested cities, increased truck traffic worsens the delay, safety, energy use, and emissions.
Local transport authority of some cities has proposed a number of strategies to overcome these
problems, including combinations of infrastructure, regulatory, and economic mechanisms [1].
From different viewpoint, Munuzuri et al [2] classified the strategies into those related to public
infrastructure, land use management, access conditions, traffic management, enforcement and
promotion.
Restricting truck traffic to off-hours is one commonly used strategy in many cities all over the
world. It provides a methodology to remove truck traffic from the rush hour periods through a
co-operative approach amongst road operators and the industry [3]. From several studies it is
shown that this strategy has a positive impact on some of the parameters studied. Aschauera [3]

61
who simulated trucks schedule who can save time and costs and also reduce emissions argued
that off-hour delivery has made more efficient use of road capacity, and capital expenditure for
road construction can be avoided or at least postponed. Furthermore, the elimination or
bottlenecks lead to competitive advantages for industry, business parks, and the entire urban
area and also benefits the environment. Shi Qiu [4] prove that nighttime-only truck traffic
regulation would produce less pavement distresses and better pavement performance due to the
contribution of the lower temperature at nighttime.
Dablanc [5] studied the implementation of this regulation in some northern European cities
(Amsterdam, Copenhagen, Stockholm, Goteborg), which apply truck access restrictions based
on environmental criteria. It is found that only recent trucks, or fully loaded trucks, are
permitted to enter the city centre. These new standards tend to replace former weight and size
restrictions, which are now considered quite irrelevant [5].
Even though this strategy has been adopted in many cities worldwide, it still needs supporting
policies to foster the shifting of urban freight delivery traffic to the off-hours [6],[7]. The
implementation of the off-hour delivery regulation still has some problems to be solved to come
to the optimal results to the all stakeholders of city logistics, namely shippers, receivers,
carriers, administrators, and impactees [8].
As the increased activity of truck trips in Jakarta, the access restriction policy for the trucks was
implemented in June , 2011 on part of the Jakarta Intra Urban Tollway (JIUT) system, where
trucks are prohibited to access the Cawang–Tomang–Pluit segment (as statutory segment)
during 05.00 am to 22.00 pm (Figure 1). JIUT is a ring road in the central of Jakarta, which
connects the intercity highway from the south, east and west. The alternative segment for trucks
movement during this access restriction time is Cawang–Tanjung Priok–Pluit segment (as
advisory segment). As a result of this access restriction, the advisory segment suffered severe
congestion at the time of restriction, while the statutory segment improved its speed
performance.
In terms of JIUT as a whole system, this policy needs to be evaluated whether this access
restriction has a positive impact on the JIUT system as a unified system rather than each
segment individually, especially with respect to the sustainability of the urban transport system.
Evaluation is needed since JIUT is located in the central of Jakarta and becomes the main road
connecting the movement of people and goods to / from east, west and south of Jakarta. This
paper discusses the impact of truck access restriction regulation in part of JIUT on important
parameters that representing the sustainability of JIUT system.
Figure 1. Jakarta Intra Urban Tollway System

62
METHODS
Sustainable transportation should provide resources for a safe and satisfying future for all
people. Some of the definitions adopted reflect that sustainable transport systems must be
effective and efficient in providing safe and fair access to basic economic and social services,
promoting economic development and supporting environmental integrity [9]. In this context,
development must be characterized by the definition of economic, environmental, and social
sustainability [10].
Based on this concept, in this study the parameters used to represent sustainability of JIUT
system are: speed and fuel consumption (for economic indicators); fatality rate (for social
indicators); CO2 emissions and noise level (for environmental indicators). To integrate these
parameters the integrated cost is applied, and it incorporates fuel consumption costs, the accident
cost and the costs of carbon pollution. The impact of truck access restriction regulation is
illustrated in terms of changes in these parameters before and after the implementation
(represented by 2010, 2011, and 2012), as well as the differences in the parameters between the
conditions of with and without the policy (represented by 2011 and 2012). Each is calculated
for the statutory segment and advisory segment, as well as a whole system. The latter is to
describe the overall performance of the JIUT system, while the former ones described the
performance of each segment individually.
The data are obtained from the operator of JIUT system, i.e PT Jasa Marga (Persero) Tbk and
PT Citra Marga Nusaphala Persada Tbk. They include data road length, the average speed, road
capacity, traffic volume, the number of accidents and accident victims. Calculation of the fuel
consumption and its associated cost is using Guidelines for Calculation of Vehicle Operating
Cost [11] and Indonesian Highway Capacity Manual [12]; the costof casualty victims refers to
the Guidelines for the Calculation of Traffic Accident Cost [13]; CO2 emissions refer to the
Guidelines for the Implementation of National Greenhouse Gas Inventory [14]. The noise level
prediction uses the empirical equations of Hajek and Krawczyniuk [15] and Guidelines of
Ministry of Public Works [16]. To estimate the parameters of 2011 and 2012 in case of the
access restriction policy is not implemented, the regression technique is applied on data of
traffic volume in 2008-2010.
RESULT AND DISCUSSION
Table 1 indicates the change on sustainable transport indicators of before and after the
implementation of the truck access restriction regulation.
TABLE 1. “BEFORE AND AFTER” ASSESSMENT Indicators Parameters Assessment Segment % Change Description
Economy
Speed Positive Statutory Increased
(41.3%)
Increased the average speed at
statutory segment to 53.95 km/hr in
2012.
Fuel
consumption Negative
Statutory Decreased
(0.1%) Increased amount of fuel consumption
at advisory segment to 12% in 2012
when compared to 2010.
Increased amount of fuel consumption
at JIUT system to 5.9% in 2012 when
compared to 2010.
Advisory Increased
(12.0%)
JIUT
system
Increased
(5.9%)
Social Fatality rate Positive Statutory Decreased
(22.5%)

63
Advisory Decreased
(4.8%) Decreased fatality rate at statutory
segment to 22.5% and advisory
segment to 4.8% in 2012 when
compared to 2010.
Decreased fatality rate at JIUT system
to in 16.8% in 2012 when compared to
2010.
JIUT
system
Decreased
(16.8%)
Environment
CO2
emission Negative
Statutory Decreased
(2.2%) Increased amount of CO2 emission to
13.1% at advisory segment to 13.1%
in 2012 when compared to 2010.
Increased amount of CO2 emission to
13.1% at advisory JIUT system to
5.4% in 2012 when compared to 2010.
Advisory Increased
(13.1%)
JIUT
system
Increased
(5.4%)
Noise level Negative
Statutory Increased
(2.0%) Increased noise level to 2% at
statutory segment and 4.1% at
advisory segment in 2012 when
compared to 2010.
Increased noise level to 2.9% at JIUT
system in 2012 when compared to
2010.
Noise levels at statutory segment and
advisory segment always exceed 65
dBA during 2010-2012.
Advisory Increased
(4.1%)
JIUT
system
Increased
(2.9%)
Integration
Cost of fuel
consumption,
cost of
accident
victim, cost
of carbon
pollution
Negative
Statutory Increased
(0.2%) Increased integrated cost to 0.2% at
statutory segment and 12.5% at
advisory segment in 2012 when
compared to 2010.
Increased integrated cost to 6.4% at
JIUT system and 12.5% at advisory
segment in 2012 when compared to
2010.
Advisory Increased
(12.5%)
JIUT
system
Increased
(6.4%)
From Table 1 it can be seen that there is a decrease in the speed required to travel statutory
segment in 2012 compared to 2010. This condition can occur due to a decrease in the number
of freight vehicles passing through the statutory segment and it is replaced by the increase of
non-truck vehicles, given the characteristics of large trucks seen as slow-moving vehicles and
impeding the movement of traffic, especially during peak hours. This indicates that the policy
has a positive impact on the speed at statutory segment and decrease its fuel consumption. As
consequence, freight vehicles switchs their route to the advisory segment. It results in the
contrary situation at the advisory segment, at which its fuel consumption increased. As a total
system, JIUT faces the increase of fuel consumption.
In term of traffic accident, the fatality rate at both segments decreased, and it may be caused by
the establishment of the National Road Safety General Plan in 2011 which has a mission to
make road safety a national priority. The analysis of CO2 emission shows that the CO2
emissions at statutory segment decreased, but it is not occurred at the advisory segment. As a
whole system, JIUT faces the increase of CO2 emissions. Surely, it is caused by the direct
relationship between the amount of CO2 emissions and the amount of fuel consumption.
Analysis of noise level parameters in safe noisy area shows the increase in noise level at
statutory segment, the increase at advisory segment, and an increase in total JIUT system. Safe
noisy area is an area of 30 meters wide from the edge of the road pavement that has noise levels
of less than 65 dBA [17]. The noise level at both segments in 2010-2012 are always above the
recommended value of 65 dBA. Overall, the policy has negative impact on the noise level on

64
the JIUT system. Overall, in term of integrated cost, the policy negatively impacts the overall
sustainable transport indicators represented by the integrated cost of each indicator (economic,
social, and environment), namely the cost of fuel consumption, the cost of casualties, and the
cost of carbon pollution on the JIUT system.
Furthermore, Table 2 indicates the difference on parameters for the condition of with and
without the truck access restriction regulation in 2011 and 2012.
TABLE 2. “WITH AND WITHOUT” ASSESSMENT IN 2011 AND 2012
Indicators Parameters Assessment Segment % of Difference
Description 2011 2012
Economy Fuel
cunsumption Positive
Statutory Smaller
(3.1%)
Smaller
(3.6%)
Fuel consumption at
statutory segment was 3.1%
smaller in 2011 and 3.6%
smaller in 2012 compared to
without implementation of
policy.
Fuel consumption at JIUT
system was 0.6% smaller in
2011 and 1.0% smaller in
2012 compared to without
implementation of policy.
Advisory Greater
(0.6%)
Greater
(1.0 %)
JIUT
system
Smaller
(1.2%)
Smaller
(1.2%)
Social Fatality rate Negative
Statutory Smaller
(51.8%)
Greater
(220.5%) Fatality rate at statutory
segment was 220.5% greater
in 2012 and fatality rate at
advisory segment was
57.4% greater in 2012
compared to without
implementation of policy
Fatality rate at JIUT system
was 144.0% greater in 2012
compared to without
implementation of policy
Advisory Smaller
(69.4%)
Greater
(57.4%)
JIUT
system
Smaller
(60.4%)
Greater
(144.0%)
Environment CO2
emission Positive
Statutory Smaller
(4.2%)
Smaller
(5.8%) CO2 emission at statutory
segment was 4.2% smaller in
2011 and 5.8% smaller in
2012 compared to without
implementation of policy.
CO2 emission at JIUT
system was 1.5% smaller in
2011 and 1.8% smaller in
2012 compared to without
implementation of policy.
Advisory Greater
(1.1%)
Greater
(2.0%)
JIUT
system
Smaller
(1.5%)
Smaller
(1.8%)
Integration
Cost of fuel
consumption,
cost of
accident
victim, cost
of carbon
pollution
Positive
Statutory Smaller
(3.2%)
Smaller
(3.8%) Integrated cost at statutory
segment was 3.2% smaller in
2011 and 3.8% smaller in
2012 compared to without
implementation of policy.
Integrated cost at JIUT
system was 1.3% smaller in
2011 and 2012 compared to
without implementation of
policy.
Advisory Greater
(0.6%)
Greater
(1.1%)
JIUT
system
Smaller
(1.3%)
Smaller
(1.3%)
From Table 2 it can be seen that the application of policy has more positive impact on total fuel
consumption than if the policy is not implemented. It is in contrary with the accident analysis

65
result that shows that the application of policy impacts on the decrease of fatality rate in JIUT
system in 2011, but increased fatality rate on JIUT system in the 2012. Overall, the
implementation of the policy in 2011 has a more negative impact on the fatality rate than if the
policy is not implemented.
The analysis of CO2 emission shows that the CO2 emissions at advisory segment with the
application of policy is bigger compared to the absence of policy. While the amount of CO2
emissions at statutory segment, as well as JIUT system, is smaller compared to the absence of
policy. Overall, the policy has a more positive impact on the amount of CO2 emissions
compared to if the policy is not implemented.
Analysis on the combined parameters of fuel consumption costs, casualty costs, and carbon
pollution costs (i.e. integrated cost indicator) shows that the integrated cost at advisory segment
by the application of policy is bigger compared to no application of policy. While the parameter
at statutory segment and whole JIUT system is smaller compared to no application of policy.
Overall, the implementation of the access restriction policy has a more positive impact on the
overall sustainable transport indicators as represented by the integrated cost of each indicator
(economic, social and environmental) on the total JIUT system compared to the situation of the
absence of the policy.
CONCLUSION Based on the trend of changes in sustainable transport indicators associated to the
implementation of freight vehicle access restriction policy on JIUT, it is important to note that
prior to implement certain restriction policy it is required to well prepare the advisory routes
that the freight vehicles can be taken in order to control the impact of the policy to the whole
system, not only to the statutory system. Moreover, the regulator should also consider the other
sustainable transport indicators rather than only the travel time as a single determinant.
REFERENCES [1] Cherry, Christopher R. and Adelakun, Adebola A. “Truck driver perceptions and preferences: Congestion and
conflict, managed lanes, and tolls,” Transport Policy 24 (2012) : 1-9.
[2] Munuzuri, J., Larraneta, J., Onieva, L. and Cortés, P. “Solutions applicable by local administrations for
urban logistics improvement,” Cities, vol. 22, no. 1 (2005) : 15-28.
[3] Aschauera, Gerald J. and Starkl, F., “Time4trucks - cooperative time regulation of road freight transportation
in urban areas for reducing bottlenecks,” Procedia Social and Behavioral Sciences 2 (2010) : 6242–6250.
[4] Qiu, S., Xiao, Danny X., Wang, Kelvin C. P., Wang, W. , and Moravec Mike M., “Impacts of Nighttime-Only
Truck Traffic Regulation on Pavement Performance,” Journal of Infrastructure System (2015) 21(1):
04014032
[5] Dablanc, L., “Goods transport in large European cities: difficult to organize, difficult to modernize,”
Transportation Research Part A: Policy and Practice 41,(2007): 280–285.
[6] Veras, Jose H., “Necessary conditions for off-hour deliveries and the effectiveness of urban freight road
pricing and alternative financial policies in competitive markets,” Transportation Research Part A 42 (2008) :
392–413.
[7] Domíngueza, A., Veras, Jose. H., Ibeas A. and Olioa, Luigi dell’, “Receivers’ response to new urban freight
policie” Procedia-Social and Behavioral Sciences 54 (2012) : 886 – 896.
[8] Taniguchi, Eiichi. City Logistics. Network Modelling and Inteligent Transport Systems. Pergamon, 2001.
[9] Jeon, S. W., Amekudzi, A. A. and Vanegas, J. Transportation System Sustainability Issues in High-, Middle-,
and Low-Income Economies: Case Studies from Georgia (U.S.), South Korea, Colombia, and Ghana. ASCE,
2006
[10] Russo, F. and Comi, A. “Measures for Sustainable Freight Transportation at Urban Scale: Expected Goals and
Tested Results in Europe,” Journal of Urban Planning and Development (2011), ASCE.
[11] Ministry of Public Works, “Calculation of Vehicle Operating Costs Part I: Unpaid Costs (Running Cost),”
Construction and Building Guidelines No. Pd T-15-2005-B, 2005.
[12] Directorate General of Highways, “Indonesia Road Capacity Manual,” 1997

66
[13] Ministry of Public Works, “Calculation of Traffic Accident Amount by Using The Gross Output Method
(Human Capital),” Construction and Building Guidelines No. Pd T-02-2005-B., 2005
[14] Ministry of Environment, “Methodology for Calculating Greenhouse Gas Emissions, Procurement and Use
of Energy,” Guidelines for the Implementation of National Greenhouse Gas Inventory. Book II vol. 1, 2012
[15] J. J. Hajek and R. Krawczyniuk, “The Accuracy of Highway Traffic Noise Predictions,” Canadians Acoustics,
vol. 12, no.2 (1984) : 29-38.
[16] Ministry of Public Works (DPU), “Noise Prediction Due to Traffic,” Construction and Building
Guidelines, No. Pd T-10-2004-B, 2004

67
UTM Razak School of Engineering and Advanced Technology
Kuala Lumpur, Malaysia
10th October 2017
SD 36 - THE IMPACT OF ROAD GRADIENT AND TRUCK
COMPOSITION ON THE TOLL ROAD TRAFFIC PERFORMANCE
Nahry Yusuf
Department of Civil Engineering, Universitas Indonesia, Kampus UI Depok, Jawa Barat, Indonesia
ABSTRACT
Jakarta Outer Ring Road (JORR) is a toll road system that circles the outskirts of Jakarta, where
the purpose of this road is to reduce congestion on the streets of the city center of Jakarta.
However, the high composition of trucks in JORR resulted in congestion, and it is hypothesized
attributed to the gradient of this road. This study aims to evaluate the impact of road gradient
on truck and the overall traffic performance. Using the data obtained from 24-hour traffic
recording on selected JORR section, a VISSIM model was constructed to simulate traffic
performance on some combinations of traffic and gradient conditions. In term of macroscopic
view point of traffic stream, the simulations show that road gradient affects the truck speed, as
well as the overall traffic speed insignificantly. The trucks composition has more effect on the
traffic speed rather than the gradient. Certain composition of trucks does not make significantly
different effects on the traffic speed in different gradients. It implies that any policy to restrict
the truck access to toll road should depend mainly on the composition of truck itself, not the
gradient of the road.
Keyword: Road Gradient, Heavy Vehicle, Vissim, Toll Road
INTRODUCTION
Toll road is generally built to provide a service that is better than the arterial road. Jakarta Outer
Ring Road is a toll road system that circles the outskirts of Jakarta, where the purpose of
constructing JORR is to reduce congestion on the city center of Jakarta. In fact, due to the
increasing volume of JORR, its current level of service is less satisfactory. As an alternative
toll road circling the city of Jakarta, JORR currently becomes the main road of freight transport
to and from southern, western and eastern part of Jakarta. Therefore, the composition of heavy
vehicles in JORR is quite high throughout the day. With the increasingly poor performance of
JORR, heavy vehicles (i.e. trucks) are deemed to have an enormous share on such condition
due to their large dimensions and their relatively slow speeds. Therefore, JORR operator is
planning to restrict trucks to use some segments of JORR for certain time window. At the other
side, the logistics users are aggrieved and the aim of constructing the toll road, namely to
improve the efficiency of goods distribution becomes questionable. Prior to enforcing the

68
access restriction system to trucks to use JORR, a review should be conducted to look into other
causes of the congestion to find the better solution to solve the problem. Theoretically, one
thing that can degrade performance of JORR is vehicle composition, where high heavy vehicle
composition can reduce overall speed of the traffic, especially when it is coupled with steep
slopes conditions.
Review on the traffic performance associated to the road geometry condition, particularly the
road gradient, has been widely done. Bornes et al [1] developed a model for calculating speed
profile for a heavy vehicle uphill in a grade. It is mainly used to decide start and end of passing
lanes depending on speed difference between a typical heavy vehicle and passenger cars, and
to estimate the influence of grades on the speed and travel time for heavy vehicles on rural roads
for use in navigation systems, cost-benefit analysis etc. The model is based on utilized engine
power needed to overcome the total running resistance for a specific vehicle. The model is in
principle based on physical laws, but there are several factors which make a theoretical
description different from real life. The calibration and validation process was carried out using
detailed observations of instrumented heavy vehicles where all input data were known.
Habtemichael et al [2] studied that the speed profile will always contain some noise depending
on driver behavior, power utilization, engine specifications, road geometry, accuracy of
observations, etc. Driver behavior concerning choice of speed, gear, torque, rpm, etc will
usually be difficult to model in a realistic way.
Most of prior studies are based on the microscopic observation on the performance of individual
trucks in a traffic flow in passing through a certain road gradient. On the other hand, the
presence of trucks in traffic flows may have different effects on traffic performance due to the
gradient of the road. In this case the composition of trucks in traffic flows may have different
effects on the performance of the overall flows in different gradients. This research is intended
to investigate the impact of road gradient on the traffic performance in JORR in macroscopic
way. This research is expected to get a rationale of route shifting or climbing line for the truck
to avoid a steep gradient that can cause disruption to the overall traffic performance.
METHODS
Using the data obtained from 24-hour traffic recording on selected JORR section, a preliminary
VISSIM model was constructed. VISSIM is a microscopic simulation software package which
can be used to simulate traffic [3]. In order to test the validity of the model, traffic performance
measure results of the model were compared with the observed results which came from the
data recording [4]. In this study, the traffic performance measures were the flow along segment
under consideration. Hence, GEH statistics were applied to compare two sets of traffic volumes
with the criteria shown in Table 1. Using the valid VISSIM model, simulations were done to 5
(five) conditions of road gradient and 2 (two) types of truck composition to estimate the average
speed of the overall traffic, non-trucks and trucks for some combinations of those three
variables.
Table 1 GEH Criteria
Criteria Decision
GEH < 5,0 Model accepted
5,0 GEH 10,0 Model is possibly error or poor quality of
data
GEH > 10,0 Model rejected

69
RESULT AND DISCUSSION
To validate the Vissim model, the data is grouped into 5 (five) sets with various randomly
selected conditions. Table 2 shows the results of validation test with GEH method.
Table 2 GEH of validation test
No. Time
GEH
Vehicle Total Average Speed
LV MHV LB LT LV MHV LB LT
km/hr km/hr km/hr km/hr
1 3:00 0.50 2.08 0.65 0.08 0.11 0.02 0.09 0.03
2 6:00 1.13 1.13 0.70 0.07 2.07 1.87 1.60 1.08
3 12:00 1.17 0.96 0.96 0.24 3.41 1.62 1.95 1.37
4 15:00 2.79 1.59 0.20 0.10 3.49 1.90 2.13 1.42
5 18:00 6.30 1.80 0.35 0.55 2.35 2.37 2.72 1.96
From calibration and validation process it was found that most of GEH values were less than 5,
hence it implied that the driving behavior parameters that were applied in our model could
represent the actual condition of JORR traffic.
In order to see the effect of gradient on the speed of both trucks and non-truck, simulations were
done on 10 (ten) sets of traffic conditions for 5 (five) types of road gradients, i.e. 0%, 2%,
4%,6% and 8% with two conditions of truck composition, namely 0% and 20%.
Figure 1a shows the result of simulation on truck speed in which all the inputs related to traffic
condition for each of simulation are similar but the gradient. Figure 1b shows the result for non-
truck speed. They indicate that the speeds tend to decrease as the road gradient increased. The
effect of gradient on speed seems more stable on non-trucks rather than trucks.
Figure 1a Truck Speed on various gradients Figure 1b Non-Truck Speed on various gradients
Furthermore, Figure 2 shows the speed-density diagrams derived from simulation. Regression
technique was applied to find the best-fit speed-density model for 0% of truck and 20% of
trucks. Table 3a and 3b shows the mathematical model as well as its coefficient of
determination.

70
Figure 2 Speed-Density Model for various gradients and % of truck
Tabel 3a Speed-Density Model for various
road gradients and 0% of Trucks Gradient Speed-Density Model R2
0% u = 74.05e-0.003k 0.9790
2% u =75.78e-0.003k 0.9874
4% u =75.36-0.003k 0.9965
6% u =74.96e-0.003k 0.9855
8% u =73.53e-0.003k 0.9919
Tabel 3b Speed-Density Model for various
road gradients and 20% of Truck Gradient Speed-Density Model R2
0% u = 65.646e-0.003k 0.9913
2% u =67.924e-0.003k 0.9915
4% u =66.301e-0.003k 0.9937
6% u =65.831e-0.003k 0.9847
8% u =63.755e-0.003k 0.9901
In order to assess the significance of the difference among the models, Pearson correlation test
was done with a significance level α=0.05. The test indicated that there was very strong
correlations among the models, and there was almost no difference of the models for various
types of gradient. It implied that the gradient have no effect on the traffic performance, namely
speed-density relationship, for both low and high composition of trucks. In addition to the
statistically correlation test, the mathematical difference among the speeds of various gradients
and various densities was done and the results are shown in Table 4a and 4b.
Those simulations confirm the law of relationship of speed-density at which the higher the
density, the lower the speed is. They also confirm that the more trucks on traffic stream, the
lower the speed of the overall traffic. Regarding the road gradient, the simulation indicated that
for certain density the higher the gradient (the steeper the road) the lesser the speed is, and it is
valid for low and high composition of trucks. However, the effect of gradient on speed seems
not significant. It may be caused by the view point of this Vissim simulation, that is macroscopic
viewpoint of traffic stream rather than microscopic one. The results of simulation represent the
characteristics of the overall traffic rather than individual or group of individual vehicles.

71
CONCLUSION
In term of macroscopic view point of traffic stream, the Vissim model simulation results
show that the road gradient affect the speed of groups of truck, as well as speed of the overall
traffic insignificantly. The trucks composition has more effect on the traffic speed rather
than the gradient, particularly on low to medium density situation. Certain composition of
trucks does not make significantly different effects on the traffic speed in different gradients.
It implies that any policy to restrict the truck access to toll road should depend mainly on
the composition of truck itself, not the gradient of the road. .
REFERENCES
[1] Børnes , V. and Aakre, A. “Description, Validation and Use of a Model to Estimate Speed Profile of Heavy
Vehicles in Grades,” Procedia Social and Behavioral Sciences 16 (2011) 409–418.
[2] Habtemichael, Filmon G., and Luis, P. S. “Sensitivity Analysis of Vissim Driver Behavior Parameters on
Safety of Simulated Vehicles and Their Interaction with Operations of Simulated Traffic,” the 92nd
Annual Meeting of the Transportation Research Board (2012).
[3] VISSIM 5.30-05 User Manual. (2011). Germany: PTV AG.
[4] Park, B., and Schneeberger, J. D. “Microscopic Simulation Model Calibration and Validation Case Study
of VISSIM Simulation Model for a Coordinated Actuated Signal System.” In Transportation Research
Record: Journal of theTransportation Research Board, No. 1856, Transportation Research Board of
the NationalAcademies, Washington, D.C.(2003)
Table 4a Speed differences for various
densities and road gradients and 0% of truck
Density
(pcu/km)
Speed Difference (compare to
speed of 0% gradient) (km/hr)
2% 4% 6% 8%
10 1.677 1.274 0.879 0.509
100 1.280 0.973 0.671 0.389
200 0.948 0.721 0.497 0.288
300 0.703 0.534 0.368 0.213
400 0.521 0.396 0.273 0.158
500 0.386 0.293 0.202 0.117
600 0.286 0.217 0.150 0.087
700 0.212 0.161 0.111 0.064
Table 4b Speed differences for various densities
and road gradients and 20% of truck
Density
(pcu/km)
Speed Difference (compare to
speed of 0% gradient) (km/hr)
2% 4% 6% 8%
10 2.211 0.636 0.180 1.835
100 1.688 0.485 0.137 1.401
200 1.250 0.359 0.102 1.038
300 0.926 0.266 0.075 0.769
400 0.686 0.197 0.056 0.570
500 0.508 0.146 0.041 0.422
600 0.377 0.108 0.031 0.313
700 0.279 0.080 0.023 0.232

72
UTM Razak School of Engineering and Advanced Technology
Kuala Lumpur, Malaysia
10th October 2017
SD 37 - INVESTIGATION ON THE WILLINGNESS TO WALK AND
ACCESSIBILITY TO BUS STOPS IN PENANG
Nur Sabahiah Abdul Sukor, Wan Nadhira Wan Zauki, Siti Fadhlina Muhammad
Fisal
Universiti Sains Malaysia
([email protected], [email protected], [email protected])
ABSTRACT
This study was conducted to investigate the walking accessibility of pedestrian toward the
Rapid Penang bus services in Penang Island. Several parameters such as socio-demographic,
walking distance, time travel and satisfaction level of users were examined to determine the
significant factors that influence the walking accessibility toward public bus services.
Within two weeks period, the questionnaire surveys of 400 respondents were recorded. The
collected data were analysed using descriptive analysis and statistical analysis through
Statistical Package for the Social Science (SPSS). Multiple regression analysis was used in
statistical analysis to determine factors that significantly influenced pedestrian willingness
to walk to access the public bus services according to current and future improvement
environmental and infrastructure condition. From the results acquired through the multiple
regression analysis, type of bus stops, socio-demographic, distance of walking, time of
walking, the satisfaction level of users and trip purpose were factors that contribute to
pedestrian willingness to walk to access the public bus services. The outcome of this study
also had identified the maximum, minimum and average distance walked by the pedestrian
to reach the bus stops as well as the time travel taken.
Keywords: pedestrian, accessibility, walking distance, public bus
INTRODUCTION
A study on walking accessibility to public transport in Penang is carried out to identify
factors that affect the willingness to walk to access public transport in Penang that is Rapid
Penang buses and to determine the level of satisfaction of public bus users toward current
public bus services. SRS Consortium had outlined an integrated transit network with the
appropriate long-term capacity to increase public transport adaptation in Penang. The
proposed transit lines are; Bayan Lepas LRT, Ayer Itam monorail, Tanjung Tokong
monorail and tram services in Georgetown heritage area. Parallel links between the future
development of Bayan Lepas LRT and Rapid Penang bus routes are investigated and the
most parallel route is route 303 from Weld Quay Port to Persiaran Mayang Pasir. Hence, the
study of walking accessibility to public transport was done on route 303.

73
The objective of the study is to identify the acceptable walking distance to the bus stops.
The walked distances were measured from origin location of respondents to their
destination. Secondly is to evaluate the walking accessibility to the bus stops including the
surrounding environment of the bus stops and the pedestrian walkway. The evaluation is
based on the condition of bus stops whether the bus stops are shaded and benched or
otherwise. Type of pedestrian walkways such as roofed and paved walkway is observed as
well as its surrounding environment. Thirdly is to analyse the factors that are affecting bus
users’ willingness to walk to the bus stops. The factors affecting bus users’ willingness to
walk to the bus stops are analysed based on observation and evaluation conducted. The
factors are socio-demographic of respondents such as age, gender, and income, the trip
purpose of respondents and level of satisfaction of respondents toward condition of bus stops
and pedestrian walkway. Socio-demographic of Rapid Penang bus users is one of the factors
that affect the mode choice. Daniels and Mulley (2013) claimed that the impact of socio-
demographic factors has mostly been studied in the context of differentiating factor in the
choice of travel behaviour. Gender, age, marital status, income, the level of education and
vehicle ownership are the factors included in socio-demographic. Corpuz et al. (2005) found
that in Sydney females walk more than male, older and younger age groups walk more and
people with low car ownership walk more. Moreover, in research conducted by Freeland et
al. (2013) in the United States, people are more likely to transit walk if they are from lower
income households, are non-White, and live in large urban areas with access to rail systems.
MAIN RESULTS
The data collection was conducted during weekdays of Tuesday, Wednesday, and Thursdays
within working hour from 8 o’clock in the morning until 6 o’clock in the evening. The
questionnaire was designed parallel to the aim that is to determine the willingness to walk
of public bus users to the nearest bus stop in term of distance travel and time travel. The
respondents were also asked about their perception toward the condition of bus stops and
the pedestrian walkway that they took to arrive at the bus stop. The data collected were
computed into Microsoft Excel and analysed using SPSS software.
The frequency of respondents using the Rapid Penang buses were identified with a frequent
usage of everyday (45.4%), only 4 to 6 days a week (19.6%), less than 4 days a week
(14.5%), only a few days in a month (15.1%) and others (5.4%). The others’ frequency due
to unexpected situation happened to the respondents such as their vehicle broke down, there
was no taxi available or they want to avoid driving in heavily congested traffic. The farthest
distance walked by the respondents to reach the bus stops was only for 200m to 400m
(37.2%) or less. This is because the distance between the bus stops with the area at which
people lived or worked at was only 100 m to 500m apart. It is a short distance to walk to
reach the bus stops. Besides that, most respondents only took 10 minutes to 20 minutes
(47.2%) to arrive to the nearest bus stops to access the public bus services in Penang.
Based on Table 1, the minimum willingness distance to walk by respondents is 50m while
the maximum distance is 2000m (2km). While the shortest willingness time taken for them
to walk to the nearest bus stops is 3 minutes, and the longest is 90 minutes with an average
time of 13 minutes. A multiple regression analysis was conducted to understand whether the
distance walked by the respondents to access the public bus services and the time travel to
reach the bus stop can be influenced by the socio-demographic factors.

74
Table 1. Descriptive Statistic of Willingness Distance and Time travel to Walk to Bus Stops
Infrastructure
Condition Current Condition Future Improvement
Willingness
distance to walk
(m)
Willingness time
taken to walk (min)
Willingness
distance to walk
(m)
Willingness time
taken to walk (min)
Mean 423.04 13.24 543.62 17.58
Std. Deviation 314.150 10.105 348.449 11.285
Minimum 50 3 50 5
Maximum 2000 90 2000 90
The dependent variable used for the multiple regression analysis is the respondents’
willingness to walk to reach the bus stops in present condition, while the independent
variables for the analysis are the socio-demographics; age, gender, nationality, race, status,
level of education, monthly income, vehicle ownership, license ownership, weightage of
satisfaction level, frequency of using bus, distance from home to bus stop, time travel from
home to bus stop, existence of pedestrian walkway and home based trip purpose. Walking
distance, nationality, bus stop signage and home-based trip purpose are the independent
variable that affect the dependent variable the most based on the significant value of 0.000,
similar to the constant value. Thus, these variables affect the willingness to walk to the bus
stop. Whereas, shaded bus stop, walking distance, nationality, pedestrian walkway, bus stop
signage, status, and weightage satisfaction level toward pedestrian walkway are the
independent variable that influence the dependent variable the most based on the significant
value of and nearest to 0.000, similar to the constant value. Thus, these variables affect the
willingness of time travel to the bus stop.
CONCLUSION
The average walking distance accepted by respondents to walk to bus stops to access the
public bus services is 600m while the average time travel is about 20 minutes. The factors
that affect the willingness to walk of respondents to reach the bus stops are the type of bus
stop either shaded or unshaded, bus stop signage, gender, nationality, status, walking
distance, walking time, the existence of pedestrian walkway and home based trip purpose.
Several recommendations are suggested to further enhance the data obtained for better
analysis in the future. Firstly, to investigate human perception, opinion and decision, a
frequent survey should be conducted to determine and understand the pattern of a person
thinking. This is because each individual has their own unique way of thinking and it
changes from time to time. Next, it is recommended to apply a method of using global
positioning systems (GPS) to get a more accurate measurement of distance walked by
respondents. Besides conducting survey to collect data, a more approachable and easier
method such an online survey might be more effective. This method can reduce human error
and makes it easier and faster to organize and analysis the collected data.

75
REFERENCES
Corpuz, G., Hay, A. and Merom, D., (2005), September. Walking for transport and health:Trends in Sydney
in the last decade. In 28th Australasian Transport Research Forum (pp. 1-15).
Daniels, R. and Mulley, C., (2013). Explaining walking distance to public transport: The dominance of public
transport supply. Journal of Transport and Land Use, 6(2), pp.5-20.
Freeland, A.L., Banerjee, S.N., Dannenberg, A.L. and Wendel, A.M., (2013). Walking associated with public
transit: moving toward increased physical activity in the United States. American journal of public
health, 103(3), pp.536-542.

76
UTM Razak School of Engineering and Advanced Technology
Kuala Lumpur, Malaysia
10 October 2017
SD 24 - THE INFLUENCE OF WALKABILITY TOWARDS URBAN
STREET DESIGN IN KUALA LUMPUR
Hamizan Ridzuan Johar Razali1, Siti Uzairah Mohd Tobi2, Siti Fatimah Ilani
Bilyamin3, Mohammad Hussaini Wahab4
1,2,3,4Universiti Teknologi Malaysia
[email protected], [email protected], [email protected], [email protected]
ABSTRACT
Automobiles have been the main driving factor of urban planning in recent decades. As a
result, the automobile has started to become an ironic icon of travel pattern within the city
centre. This has caused a lot of issues, but the main issue covered in this research paper is
to examine the physical characteristics which contribute towards the walkability of a street
in Kuala Lumpur. Streets in Kuala Lumpur have been prioritized for automobiles and this
causes issues in the general walkability of the city. For the research to gauge the perception
of walkability, a case study was conducted in a district that provided an opportunity to
analyse the walking behaviour of pedestrians in a variety of urban built environment.
Kampung Baru, one of the districts of Kuala Lumpur, Malaysia was taken up for a primary
case study as it functioned like an urban laboratory with both traditional and modern
settlements in the same vicinity. The street selected for the research is a minor one, however
it acts as a shortcut between two of the main roads within the district. The selected street is
based on usage by pedestrians was studied through behavioural observation and public
surveys to understand the underlying factors that led to how a street should be designed. The
results showed that the most important factors affecting pedestrians’ perception of
walkability were related to the built envelop on either side of the streets. Factors relating to
urban morphology like enclosure block length and edge conditions were found crucial in
creating perception of a walkable street.
Key Words: Walkability, street design, behavioural observation, social life, public domain
INTRODUCTION
Walking is the oldest form of urban transport, and until the advent of major
transformations in transport technology in the nineteenth century, most cities were
structures in ways that support walkability (Newman et al., 1999). As individual private
car transport became widespread during the twentieth century (Siti Fatimah Ilani
Bilyamin, 2014), public transport and urban walkability became less apparent as major

77
priorities of transport planning and urban design. As concern for future urban
sustainability increases, walking is again being recognised as an important mode of
urban transport. Much of the renewed attention on urban walkability is associated with
concerns that car dependent cities will not be sustainable in the future, due to energy
costs, fuel availability, congestion, air pollution and other environmental impacts. The
reported benefits of walking are not new; it is common knowledge that people benefit
physically when they are active. It is a free activity that can increase personal well-being
and longevity of good health.
According to Rafiemanzelat et al., (2016), walking is generally recognised as a
movement which is one type of transportation. Generally in the urban context, walking
is defined as short distance movement from one point to another point. Walkability is a
concept which is known as a measurement of the pedestrian-friendly degree of a certain
area. The Victoria Transport Planning Institute (VTPI) stated “walkability reflects the
overall conditions in an area” (VTPI, 2005). This takes into consideration the quality of
pedestrian facilities, road conditions, land use patterns, community support, security and
comfort of walking (VTPI in Hanani, 2009). At the same time, Southworth (2005)
defined walkability as the extent to which the built environment supports and encourages
walking by providing pedestrian comfort, convenience and safety, connecting people
with varied destinations within a reasonable amount of time and effort, and offering
visual interest in the journeys throughout the network. This term has recently been
focused by urban designers and planners to make a sustainable environment for
communication, recreation, and shopping by pedestrian base.
Leyden (2003) has stated that pedestrian oriented neighbourhoods also increase
individual and collective social capital. Social capital is an umbrella term that measures
things like involvement in local government and community trust. Greater social capital
has been linked with better community health, decreased crime rates and even increased
economic activity. In pedestrian oriented communities that are highly walkable,
residents are likely to walk to places such as corner markets, restaurants, schools, places
of worship, public parks and other establishments necessary for life. While walking
about their neighbourhood, residents can interact with their surroundings more regularly
and thus feel more connected to and responsible for their physical community.
Furthermore, residents will also interact more frequently with their neighbours, creating
a denser community network which can increase individual peace of mind, community
trust and may decrease crime rates (Zhu et al., 2008). In the traditional settlements
buildings opened out directly on the streets as there were no major setbacks. People took
the ownership of the whole street on which they lived. All the windows looked on to the
streets making it even safer. As Jane Jacobs (2016) said it, putting “Eyes on the Street.”
This morphology acted like a catalyst in promoting street activity (Hanson et al., 2016).
Through literature review and also through empirical study, this paper is to investigate
the concept of walkability by trying to understand the different ways the built
environment influences walking. The knowledge that this paper is to produce is not only
whether or not, but more on how and why the built environment influences walking
behaviour.
Walking in an urban place level is considered as walking between communities in an
urban place that makes a walkable city. Walkable urban place measures through density,
connectivity, land-use mix and net retail area to examine the association between
neighbourhood walkability. Christopher and Leinberger (2007) stated that walkable in

78
urban place is most prevalent on per capita basics, located within the metro area and
extent to which rail transit service is associated with urban development. Walkable urban
place is located in high density (0.8-40.0 floor area ratio) area which is mixed use
(residential, office, retail, cultural, educational at regions or international level) and
assessable for multiple transportation including walking, car, transits and bikes. The
function of walkable urban place includes local serving (for daily needs such grocery)
and regional serving for higher service such as retail, medical, entertainment and
education (Christopher and Leinberger, 2007). The higher levels of mixed land-use,
residential density, street connectivity, accessibility to recreational facilities, and
aesthetic attributes are more conducive to walking and, hence, more ‘walkable’.
Therefore, this study focuses on walking in urban place that considers the physical
factors which are influencing the walkability towards urban street design.
MAIN RESULTS
According to a study conducted by Shamsuddin, et al., (2013), which included Kampung
Baru as an area of study, the results show that more than half of the respondents would prefer
to use their vehicles to move from one place to another, and would only walk to their
destinations if it is inconvenient for them to use their vehicles with factors like road
construction or maintenance, crime or the cost of using public transportation compared to
paying for the parking of their vehicles. This can be supported by Arvidsson et al., (2012),
which showed that individuals in neighbourhoods with objectively assessed high walkability
and who also perceived it to be high maintained their level of walking to a higher degree
than those who perceived the walkability to be low. This means that when an area is
perceived to be highly suitable for walking, then walking to their destinations would be the
best choice.
According to a public opinion survey by Seranta Awam (2014), “Greater KL/KV is not a
pedestrian-friendly city, as it currently has inefficient design, poor maintenance and poor
accessibility. Locals and visitors often find that there are no linkages between buildings,
poor continuity in pedestrian walkways and lack of access for the physically challenged and
elderly”.
This can be observed as that some parts of Kuala Lumpur city are yet to be designed as more
pedestrian friendly streets, these problems may hinder the opportunity for visitors to
experience the city with a greater sense of enjoyment and ease by walking (Ujang, 2015).
However, providing a comfortable pedestrian environment in the city centre is a challenge
due to the problems of traffic congestion and limited spaces for pedestrian movement. As
such, it has affected the development scenarios as there are no integrated functions between
the physical elements through permeability and legibility in the city. The higher the
permeability and legibility, the more continuity and connectivity the city offers in terms of
walkability (Carmona, 2003). This also indicates that without human scale activities that are
oriented to human needs and streets filled with people, the large blocks in the city will face
problems with high traffic volume, and heavy pollution that destroys the connectivity needed
to be a walkable city.
The approach done by the Urban Transportation Department of Dewan Bandaraya Kuala
Lumpur, which leads EPP 8, upgraded 12.7km of non-covered pedestrian walkways in
Kuala Lumpur, exceeding the annual KPI of 12km. The upgraded walkways include those

79
along Jalan Tun Ismail, Jalan Tun Razak, Changkat Bukit Bintang and Changkat Raja
Chulan. However, the end goal of the pedestrian network EPP is to create a barrier free,
handicapped friendly pedestrian network that also encompasses the safe city concept for
42km pedestrian network within Kuala Lumpur 2020.
Kampung Baru in the centre is not without problems of walkability. As with most other parts
of Kuala Lumpur, the streets in case study are dominated by cars and is a hazard for
pedestrians who use them, although in some areas motorists give priority to pedestrians
given the situation of the street (Kampung Baru Comprehensive Development Plan, 2016).
CONCLUSION
A good pedestrian network with ease of access to public transit, linkages between buildings,
priority given to the pedestrians, and also a concern given towards the human scale will
ensure a city to be walkable. In relation to that, this study will be focusing on addressing the
issue of walkability in the city centre area, followed by the determination of the
characteristics of walkability to overcome the problems faced by pedestrians. With such
information, the physical aspects of walkability in a city can be harnessed to suit the
proposed plan by the Local Authority.
REFERENCES
Jacobs. J. (1961). The Death and Life of Great American Cities. New York: Random House.
Shamsuddin. S., Rahman. N.A. and Izham. G. (2014). What Makes People Use the Street?: Towards a liveable
urban environment in Kuala Lumpur city centre. Asian Conference on Environment-Behaviour Studies
Chung-Ang University, Seoul, S. Korea, 25-27 August 2014.
Newman, (1996); Creating Defensible Space. US Department of Housing and Urban Development, Office of
Policy Development and Research, Washington, DC, USA.
Leyden. K. M. (2003). Social Capital and the Built Environment: The Importance of Walkable Neighbrhoods.
American Journal of Public Health.
Kanigel. R. (2016). Eyes on the Street: The Life of Jane Jacobs. New York: Vintage Books, a division of
Penguin Random House LLC.
Rafiemanzelat. R., Emadi. M.I. and Kamali. A.J. (2016). City sustainability: the influence of walkability on
built environments. Proceedings of 3rd Conference on Sustainable Urban Mobility, 3rd CSUM 2016, 26
– 27 May 2016, Volos, Greece.
Singh. R. (2015). Factors affecting walkability of neighborhoods. Urban Planning and Architecture Design for
Sustainable Development, UPADSD 14- 16 October 2015.
Zhu. X. and Lee. Chanam. (2008). Walkability and Safety Around Elementary Schools:Economic and Ethnic
Disparities. American Journal of Preventive Medicine, 34(4), 282-290.
Hanson. S., Cross. J. and Jones. A. (2016). Promoting physical activity interventions in communities with poor
health and socio-economic profiles: A process evaluation of the implementation of a new walking group
scheme. Social Science & Medicine, 169, 77-85
Ujang. N. and Zakaria. J. (2014). Comfort of Walking in the City Center of Kuala Lumpur. Asian Conference
on Environment-Behaviour Studies Chung-Ang University, Seoul, S. Korea, 25-27 August 2014.
Carmona, M., Heath, M. T., OC, T. & Tiesdell, S. (2003) Public Spaces Urban Spaces, New York, The
Architectural Press.
Kampung Baru Comprehensive Development Plan, (2016).
Economic Transformation Plan: Greater Kuala Lumpur/ Klang Valley, (2014).
VTPI (2005) Walkability Improvements: Strategies to Make Walking Convenient, Safe and Pleasant. TDM
Encyclopedia.

80
VTPI (2007a) Accessibility. TDM Encyclopedia.
VTPI (2007b). Community Livability: Helping to Create Attractive, safe, Cohesive Communities. TDM
Encyclopedia.
VTPI (2007c). Roadway Connectivity: Creating More Connected Roadway and Pathway Networks. TDM
Encyclopedia.
VTPI (2007d). Smart Growth: More Efficient Land Use Management. TDM Encyclopedia.
VTPI (2007e). Strong Commercial Centers: Creating Vibrant Downtowns, Business Districts, Urban Villages
and Other Accessible, Mixed-use Activity Centers. TDM Encyclopedia.
Nur Hanani. (2009). Evaluating the walkaility features of Malaysia Cities a case study of Kuala Lumpur City
Cente. Fakulti Alam Bina. Malaysia, Universiti Teknologi Malaysia.
Southworth Michael (2005), Designing The Walkable. J.Urban Plng. And Devel. Vol 131, issues 4, pp.246-
2657
Christopher and Leinberger (2007). Metropolitan Policy Programme.
Siti Fatimah Ilani Bilyamin (2014). Factors influencing the walkability of kuala lumpur city centre. Fakulti
Alam Bina. Malaysia, Universiti Teknologi Malaysia.

81
UTM Razak School of Engineering and Advanced Technology
Kuala Lumpur, Malaysia
10 October 2017
SD 26 - PHYSICAL CHARACTERISTICS OF A PUBLIC SQUARE IN
MALAY ROYAL TOWN
Sharyzee Mohmad Shukri1, Mohammad Hussaini Wahab2, Mohamad Asri Ibrahim3, Mohd
Zafarullah Rozaly4
1Infrastructure University Kuala Lumpur
[email protected] 2Universiti Teknologi Malaysia
[email protected] 3Universiti Teknologi Malaysia
[email protected] 4Tylor’s University
ABSTRACT
In a time of rapid development and urbanization, many cities are threatened with an
irreversible transformation of their form and character and perhaps in turn, with loss of
identity especially public squares in urban areas. In Malaysia, most prominent public squares
are located at the town centers and they in addition, happen to be in the historic areas which
were designated by the local authority. Medan Bandar in Alor Setar, Kedah is one of the
examples of an urban square which has a vibrant image, but getting to lose their function in
meeting people’s needs towards the places. However, being the vibrant square as it is,
Medan Bandar also had undergone to a certain extent a transformation. The transformation
has changed the overall look of Medan Bandar to make it completely unfamiliar. With all
the changes and transformations, the issue now is whether image, identity and function of
Medan Bandar Alor Setar can withstand the process of change and transformation but need
to remain the character of Malay Royal town itself. Medan Bandar in Alor Setar is not fully
utilized as a meeting and gathering space. Public open spaces have to succumbed to a new
projects, which this results in the loss of their social and cultural functions. In fact, the loss
of public open spaces in the city centers stigmatizes place identity and characters of the city
that negatively affects people’s. In light of all mentioned above, issues concerning about the
public square and the current studies mainly objective to investigate the design factors of
public square in a Malay Royal town that is not attractive to the public and to propose design
public square in Malay Royal town.
Key words: Malay Royal town, public square
82
INTRODUCTION
A city without old places is like a man without memory. Many cities have quarters that
confer on them a sense of place and identity through the historic and cultural associations
they provide. They are often an integral part of the city's charm and appeal, and their visual
and functional qualities are important elements of the city's image and identity (Ayob. 2010).
The quarters which are also defined as historic areas are evidences of our past civilization
and act as living museums. Since a historic area is a part of the economic dynamism for the
city, it should be able to maintain even be more interesting with the rest of the city. Public
squares, urban parks and public open spaces are common elements in Malaysia's urban form
and development (Ayob, 2010). The emergence of urban squares, urban parks and public
open spaces draw back since the Colonial era. One of the most notable features of British
Colonial towns was the padang, a large field set against a backdrop of imposing
administrative buildings.
Historically, it is proven that the padang (square) can have strong features or elements in
shaping the image of the cities. Urban public open spaces have been of a prime importance
in the urban development in Malaysia ever since the colonial era (Melasutra, 2004; Ayob,
2010). Undoubtedly, an outstanding element of British Colonial towns in Malaysia was
‘Padang’ or square that historically proven has been influencing the images of cities (Ayob,
2010). This signifies the important place of public open spaces in urban design and planning
to the extent that such spaces might strikingly be influential on the structure of cities.
Calhoun (1986, p. 341) asserted that one of the most socially magnificent features of a city
is the creation of public open spaces where various groups of people socialize, ‘interact and
observe each other, debate and learn politically, and grow psychologically from diverse
contacts’ (as cited in Aurigi & Graham, 1997). Public squares, within the context of public
spaces, are essential components of cities because they provide spaces for social interaction.
This helps to sustain the humanization of the society through gathering, lingering, wandering
through and engaging together into various human activities and can make significant
contributions to the cultural development of communities.
Public square play a major role as a catalyst for social change and provide a place for
gathering different community groups (Hajjari, 2009; 1998). A public space is an urban form
that draws people together for passive enjoyment (Jackson JB, 1994). Public square is
intended as an activity focus, at the heart of some intensive urban area. Typically, it will be
paved, enclosed by high density structures, and surrounded by streets, or in contact with
them. It contains features meant to attract groups of people and to facilitate meetings (Lynch,
K. 1984). This study will show the importance of a public square in a Malay Royal town
where the primary concern is to identify the physical characteristics in a public square that
will contribute to the successful public square in the heart of the city. This chapter presents
the research problems, research questions, research aim, research objectives, the scope and
limitation of the study and the research design process to establish the physical
characteristics of a public square in Malay Royal town.

83
Parks, streets and squares are typically considered as public open spaces and generally
accessible to all people. Public open spaces are the bed in which human activities are formed,
and human social and cultural relations are established. Urban spaces are part of cities, open
and public areas that are somehow the identity crystallization of collective life, where
citizens attend. The social importance of a public open space that defines it as a meeting
space for people has been aggravated time by time (Sieverts, 2003). The reason why parks,
street and squares have been downgraded, abandoned or disappeared might be due to the
heavy rapid development and urbanization in most cities around the world. This rapid
development has caused public open spaces to turn into leftover spaces in cities all over the
world (Pasaogullari and Doratli, 2004). In fact, this causes public open space to lose their
function in meeting people’s needs towards the places (Özsoy and Bayram, 2007). In certain
area, unrecognizable has become main issues to the public spaces such as parks, street and
squares. Not just losing natural and physical attributes, major effect has led to the changes
on the loss of traditional urban form and localized identity (Mohammad, 1998).
Green (1999) and Rogan et al. (2005) have found out that once the character of a town has
been threatened, the sense of attachment, continuity, identity and permanence may also be
lost. Medan Bandar in Alor Setar is not fully utilized as everyday meeting and gathering
space. Harun and Said (2009) asserted that in most cities in Malaysia, public square have
succumbed to new projects, which this results in the loss of their social and cultural
functions. In fact, the loss of public open spaces in the City Center stigmatizes place identity
and the characters of city that negatively affects people’s life (Harun and Said, 2009). In
light of all above mentioned issues concerning about the public square, the current studies
mainly objective to enhancing the quality of public square through upgrading and redesign
the existing Medan Bandar and to make Medan Bandar as a successful public square in
Malay royal town.
METHODS
The method of the study is case study which adopted a qualitative and quantitative method
in data collection and analysis that been derived by the research objectives and research
questions. Literature review that discusses, published current information by accredited
scholars and researches on the subject matter of public square and a sense of place to
establish a theoretical framework that would be used to propose a design scheme for public
square that creates a sense of place. Meanwhile field observation will involve a visual survey
and townscape appraisal to record visual elements such as quality of views, fabric and space
that contributes to the physical characteristics of a public square in Malay Royal town.
Visual survey consists of a photographic record, annotations and sketches during the field
observations. Questionnaire survey will be carried out during the data collection period. An
open-ended questionnaire survey will be used in this study to discover physical
characteristics in the chosen public square that it become so importance and influences in
their perceptions.

84
FINDINGS AND ARGUMENT
Findings of this study reveal that the design factors of public square in Medan Bandar Alor
Setar are not attractive to the public on the physical linkages. The findings also shown that
Medan Bandar is not having a good connectivity and continuity to the other elements that
influence the identity of a Malay Royal town itself. Each have their own contributions to the
urban fabric and form of the Malay Royal town. On the physical barriers aspect, it is
discovered that Medan Bandar Alor Setar is not a user friendly. Major factors such as of less
public amenities, insufficient width of sidewalk on a certain area and bad quality of surface
along the pedestrian and pavement at Medan Bandar that influence to the unuser friendly at
Medan Bandar. This shows that Medan Bandar does not apply the universal design concept
that considers a wide range of people with different abilities and remove or reduce the
physical barriers. The finding on the amenities also shows that Medan Bandar Alor Setar is
not friendly in terms of lack of seating and rest areas, inadequate public toilet, insufficient
lighting during the night and no clear signages for legibility that raised by JPBD (2011) on
the user friendly public amenities at accessible location.
Another finding also demonstrates that users agree to the current unpleasant design factors
of the Medan Bandar Alor Setar. Majority of them agreed that the current public square has
no physical barriers, not enough seating, rest areas and public toilet, does not have a clear
signages and lighting for easy accessibility in the day and night, and also the current private
parking space are not sufficient. However, when finally it is brought to their attention, the
findings show that they acknowledge on the unpleasant design factors of public square. This
suggests the theory of environmental numbness by Gifford (1976) where the adaptation and
familiarity with certain environment make the users lack of awareness. This may happen
because the users are exposed to the environment and are very responsive to unfriendly

85
environment. It is discovered that the difference of personal characteristics such as gender,
age and experience contribute towards different perception on the environment that are
suggested by Carmona et al. (2003).
CONCLUSIONS
In achieving the aim to to propose design public square in Malay Royal town, this study has
looked into the literature on the concept of Malay Royal town, concept and theories of public
square and also assess the response from the users in the Medan Bandar Alor Setar. From
this study, it is discovered that there are several design factors in the Medan Bandar Alor
Setar that is not have a connection to Malay Royal town which are the connectivity and
continuity, factors of barriers and obstruction, universal design and change of level. In
addition, it reveals that the users in Medan Bandar are exposed to the environment and are
very responsive to unfriendly environment. This may due to the usual condition of Medan
Bandar Alor Setar where people just get used to whatever they have but in the same time
they care what is going around them. However, when the concept of public square in Malay
royal town is brought to their attention, they actually acknowledge on the unpleasant factors.
Therefore, if the government takes this issue seriously and provide a better built environment
in terms of friendly public square and inject some character of Malay Royal town inside, the
users will feel the difference and increase the awareness towards the concept and appreciate
it. Besides, it will contribute to users’ sensitivity towards how they perceived and concern
for the built environment. Accessibility in a public square environment is the concept for all
parameters that influence human functioning in the environment that suggest by Preiser and
Smith (2011) and accessibility for everyone will increase the existing proposed whole
citizens’ quality of life (Evcil, 2012). Therefore, the implementation of public square in
Malay Royal town will provide better quality of life towards all the users which will
contribute towards a Malay Royal town of Kedah.
REFERENCES
1. Ayob, Z. (2010). The Legibility of Urban Square in Shaping City image of Historical Cities in Peninsular
Malaysia. Unpublished master's thesis, Universiti Teknologi Mara, Malaysia.
2. Aurigi, A., & Graham, S. (1997). Virtual cities, social polarization and the crisis in urban public space.
Journal of Urban Technology, 4(1), 19-52.
3. Calhoun, C. (1986). Computer Technology, Large-Scale Social Integration and the Local Community.
Urban Affairs Quarterly, 22(2), 329-349.
4. Carmona, M., Heath, M. T., Oc, T. and Tiesdell, S. (2003). Public Spaces Urban Spaces. New York: The
Architectural Press.
5. Evcil, A.N (2012) “Raising Awareness about Accessibility” Procedia - Social and Behavioral Sciences, Vol.
47, pp. 490-494
6. Green, R. (1999). Meaning and form in Community Perception of Town Character. Journal of
Environmental Psychology, 19(4), 311–329.
7. Gifford, R. (1976). Environmental Numbness in The Classroom. Journal Of Experimental Education, 44, 4-
7.
8. Hajjari, M. (2009). Improving urban life through urban public spaces: a comparison between Iranian and
Australian cases. Paper presented at Universitas 21 International Graduate Research Conference: Sustainable
Cities for the Future, Melbourne & Brisbane.
9. Harun, N. Z. (2011). Place Attachment and Meaning of Padang as a Public Space in Historic Cities of
Malaysia. Unpublished doctoral dissertation, University Technology Malaysia, Johor, Malaysia.

86
10. Harun, N. Z., & Said, I. (2008a). Morphology of Padang: A case study of Dataran Merdeka, Kuala Lumpur.
Paper presented at International Seminar in Sustainable Environment & Architecture (SENVAR), UiTM, Shah
Alam, Malaysia.
11. Harun, N. Z., & Said, I. (2008b). Role and fate of 'Padang' in Malaysian historical cities. Paper presented
at the 5th Great Asian Street Symposium, National University of Singapore, Singapore.
12. Harun, N. Z., & Said, I. (2009). The changing roles of public spaces in Malaysia. Habitat Magazine, Special
Edition.
13. Jackson JB. (1994). A Sense of Place, A Sense of Time. New Haven, CT: Yale University Press.
14. JPBD (2011) Garis Panduan Perancangan Rekabentuk Sejagat (Universal Design). Malaysia: KPKT.
15. Lynch, K. (1984). Good city form. Cambridge, Mass.: MIT Press.
16. Melasutra, M. D. (2004). Urban Open Spaces Uses as a Function of Lifestyle and Space Characteristics:
the Malaysian Context. Paper presented at the International Conference on Open Space: People Space,
Edinburgh, United Kingdom.
17. Özsoy, A., & Bayram, B. (2007). The Role Of Public Art For Improving The Quality Of Public Spaces In
The Residential Environment. Paper presented at International Conference on Sustainable Urban Areas,
Rotterdam.
18. Pasaogullari, N., & Doratli, N. (2004). Measuring accessibility and utilization of public spaces in
Famagusta. Journal of Cities, 21(3), 225–232.
19. Preiser, W. F., & Smith, K. H. (2011). Universal Design at the Urban Scale. In W. F. Preiser, & K. H.
Smith (Eds.), Universal Design Handbook (2 ed., pp. 20.1- 20.8). New York: Mcraw-Hill.
20. Rogan et al. 2005. Nowhere to hide: Awareness and perceptions of environmental change, and their
influence on relation with place. Journal of environmental psychology 25, 147-158.
21. Sieverts, Th. (2003). Cities Without Cities: An Interpretation of the Zwischenstadt. London: Spon Press.

87
UTM Razak School of Engineering and Advanced Technology
Kuala Lumpur, Malaysia
10th October 2017
SD 32 - REGENERATING PUDU MARKETPLACE AND URBAN
IDENTITY
Mohamad Asri Ibrahim1, Mohammad Hussaini Wahab2, Mohamad Shahryzee Shukri3, Mohd
Rifzal Mohd Sharif4
1University of Technology Malaysia, Kuala Lumpur
([email protected]) 2University of Technology Malaysia, Kuala Lumpur
([email protected]) 3Infrastructure University Kuala Lumpur
([email protected]) 4International Islamic University Malaysia
ABSTRACT Recent rapid development in through urban regeneration in Kuala Lumpur has transformed
places into new setting thus changing the meaning and identity of an area. As a city, Kuala
Lumpur needs to create a distinctive city identity and image with a unique character if it is
to achieve its bigger goal of becoming a World-Class City by 2020. Within the Kuala
Lumpur City Centre, in particular, there is a rich diversity of identity areas, and it is
important that these should be knit together into a vibrant, coherent and high imageability
of city form. Today, urban marketplaces that have aged are vulnerable to the threats of
gentrification and modernization. At some point in time, the existing urban marketplaces
will eventually be renovated or redeveloped in parallel with the city growth. The process of
regenerating existing urban marketplaces should be considering the components that make
them special, as not to lose the delicate characters that give each marketplace distinctive
identity and sense of place. The identity of a place is closely related to the presence of
distinct elements, and the character is recognised and remembered by people. Areas with an
attractive character and strong sense of identity must be maintained and enhanced and, where
practicable, other areas are upgraded to provide an improved sense of identity and place.
This paper focuses on the identifying and evaluating of an urban marketplace by reviewing
the definitions and concept of physical characters and the experiential qualities in attributes
to the identity of a place. As the identity of a place is closely related to the presence of
distinctive elements, this characteristic must be identifiable, recognised and remembered by
people.
Key words: regeneration, urban marketplace, identity of a place, physical and experiential
qualities

88
INTRODUCTION
The rapid development which has left Kuala Lumpur, in many respects, disjointed and
lacked in visual and physical coherence. The street level has been neglected with
inconsistency and piecemeal development has adversely affected the quality of streetscapes
that is the overall physical character and continuity of streets as represented by pavements,
building frontages, street lighting and other forms of street furniture. (KLCP2020, 2008: 667
Urban Design & Landscape). Consequently, there has been a decrease in the legibility of the
city structure together with a certain loss of historical continuum and sense of identity. The
character and distinctiveness of districts and local precincts are important in providing
interest, texture and structure to the urban form as well as increasing the sense of belonging.
Recent development in through urban regeneration has transformed places into new setting
thus changing the meaning and identity of the area (Norsidah et al, 2014).The lack of
harmony and awkward juxtaposition of buildings is particularly noticeable at street level and
currently in suppressing the image and identity of the place in city centre.
This paper focuses on the evaluating of an urban marketplace by reviewing the definitions
and concept of physical characters and the experiential qualities in attributes to the identity
of a place. As the identity of a place is closely related to the presence of distinctive elements,
this characteristic must be identifiable, recognised and remembered by people. To achieve
the study aim, two objectives have been formulated as follows: to identify the physical
characteristics and the experiential qualities that defined the urban marketplace and to
outline the design criteria for a distinctive, recognisable and meaningful identity for an urban
marketplace. The scope and limitation of the study will be based on the following aspects of
the suitability of the study, time and the availability of the information. The identity of the
urban marketplace will be evaluated based on the town structure, the urban pattern, the
townscape and the human activities and behaviour.
Marketplace
Throughout history, cities have been founded and exist for many reasons, and the diversity
of urban forms can be traced to the complex functions that cities perform. Cities also grew
up around marketplaces and it is considered as one of the fundamental urban typologies.
Qamaruz-Zaman et al. (2014) advocates that a city without a marketplace might function,
but still lacking in the platform where layers of the community could gather and socialise
where tangible and intangible culture could be felt in its sense of place. It is vital, healthy,
diverse place where all the most valued dynamics of an urban life untold. A successful and
vibrant marketplace is the heart and soul of the city itself as it infused new energy and social
and economic activity as according to Shuhana (2011), it has more to offer to the urban
environments. Marketplaces are where rich cultural ideas were displayed in the activities of
the peoples and are the best place where social interaction to happen.
Identity
Identity means to distinguish an object from other objects and accept that one as a part object
(Lynch, 1960). In other words, the identity is the completeness of the characteristics
separating or combining the individual or the society from others, the identification of an
identicalness or dissimilarity. The identity of a place is closely related to the presence of
distinct elements, and the character is recognised and remembered by people (Shuhana,
2011). A strong image and identity of a place depend on the careful design and interaction
between the three elements; districts, streets & square and that space, where life occurs, are
places and these places are the result of relationships between actions, conceptions and
89
physical attributes. A place must have its identity as meaning create a sense of attachment
(Norsidah, 2009). Ahmad Bashri et al., (2007) asserted that a place (city/town) must have a
strong character and identity so that it is known to the people. Places play a vital role in
developing and maintaining self-identity and group identity of the people as the place is an
experiential process that forms the identity and distinctive place character (Norsidah and
Zakariya, 2014).
Case Study Area
A single study area has been selected to represent an urban marketplace in the city. The
selected case study area is based on one of the oldest surviving marketplaces in Kuala
Lumpur city centre. Pudu or previously known as Pudoh is one of the earliest districts in
Kuala Lumpur. The development of the area started as a small village and Pudu Road was
built as a part of a linkage to all the different mines in Kuala Lumpur stretching from Jalan
Ampang to Jalan Petaling. Based on the morphology, the formation and the development of
Kuala Lumpur have been supported by the nearby districts such as Pudu, where tin mines
are the prime asset of the place. Pudu once holds a few important and historical place
markers are now losing its importance due to the wrong reason and bad perception. In 1890,
Kuala Lumpur had three markets, namely Central Market, Pudoh Market and North Market
Street (Mohd Rus, 2005). The marketplace activities in the study area have been around for
more than a decade as it started as a small outdoor open market until the existing market
building which was built in 1956. The market building was complete on the 7th January 1957
and was identified as Pasar Road Municipal Market.
METHODS
According to Ahmad Bashri and Shuhana (2005), in the “Typology of Cities in Malaysia”,
there are three elements that contribute to the main city form. The three elements are the
structure of the city, the urban morphology and the townscape as the appearance of the city.
The five elements which had been used by Kevin Lynch (1960) as the path, edge, district,
nodes and landmark will also be used to determine the structure of the place through visual
survey method. Visual studies through townscape appraisal technique is an art into
establishing links between the elements that make up the urban fabric (Cullen, 1961). The
attributes of the physical characters are based on the physical qualities and the experiential
qualities. The physical qualities are studied based on the distinctiveness and recognisable
elements, and the experiential qualities are based on meaning and association of the place.
The distinctiveness of physical qualities can be identified through six criteria namely; the
urban structure, the urban form & pattern; the building; the street and urban street block; the
spaces between and the landscape & natural element. The recognisable of physical qualities
are identified as familiarity; historical significant; nostalgic memory; affinity; special quality
of a place; dislikes; and association. The meaning and association of experiential qualities
are measured by the vista; the human scale; the activity on the ground level; the mixture of
activities; the historical significance; the aesthetic appreciation of kinesthetic experience;
and the quality of the view.
FINDINGS AND ARGUMENT
As in describing the identity of the place, the presence of distinct elements must be
recognised and remembered by people (Shuhana, 2011). Human activity is the second
component of the identity of the place. Physical environment provides the setting for the

90
activity to take place. Thus this leads to how people response physically and mentally in
term their behaviour pattern towards the activities within the area.
Physical and Experiential Qualities
The paths within the marketplace must be universally accessible and fully connected to
increase the permeability. The physical character of the edges and district must be distinctive
to create the character of sameness within the marketplace thus resulting in a clear legibility
of the area. The physical setting of the marketplaces which are the nodes of the area need to
be improved as the robustness of the area will support the main activities of the place. The
setting of variety activities wills increases the vibrancy and vitality to the marketplace. The
existing landmark needs to be an increase of its legibility as it will enhance the marketplace
identity. Installation of portals to clarify the legibility of the marketplace area can also help
in structuring the area by increasing the visibility and create a sense of welcoming.
The variety of user within the community of the marketplace will also foster the sense of
belonging or place attachment of the area. The existing old significant shophouses, the place
of worship and civic buildings that have distinctive and recognisable character need to be
retained, and upkeep as the local community have memory and association with them.
Increasing the permeability, legibility and robustness of the physical setting will eventually
support the marketplace activities. A better physical setting is needed to add robustness and
richness to the marketplace as it will support the variety of activities for social interaction
day and night. The legibility of the streets around the market square needs to increase by
having a distinctive character as it contributes to helps people to recognise and remember
the areas within the marketplace. The hierarchy of the street layout is also will be improved
by having the distinctive unifying character of streetscapes. The unique “kaki-lima”
elements are one of the recommendations as unifying elements for the marketplace area.
The networking of side lanes and back lanes is identified as an alternative place of activities
on ground level as increasing the permeability within the marketplace. The legibility of the
marketplace will be influenced by the solid and void character. A new open public space
will increase the vitality of the area in supporting the alternate activities. Nevertheless, new
activities within the different time frame will add vibrant to the marketplace. The new
activity will create a new small node in supporting to temporary activities on a temporal
pattern that can give a distinctive character to the marketplace.
The building facade within the marketplace helps in creating visual appropriateness and
distinctive character in creating the identity. The differences of building frontage will create
variety and redefined the grain. The building height must be improved to compose the visual
quality of the marketplace ‘skyline and focusing to the market square. The roofscapes,
façade treatment and material usage of the existing building can be used to increase the
harmonic visual experiences by applying the sense of rhythm and pattern. The sensitivity to
the harmonic relationship which concerns the relationship between the parts and how the
material fit together to form a coherent whole that can create a strong identity of places. The
visual orientation can be used in achieving a visual balance of the elements within the
marketplace. Colours are one of the syntheses of unifying elements that increase the
distinctive visual identity. Unity within variety needs to be addressed in identifying the
sameness in character. The effect of visual experience of place recognition is very important
for identification of an area. A visual stop will be introduced within the marketplace area by
promoting vista on architectural detailing. The selected building will be the visual stop for
cultural, place of worship and community function and these building carry meaning and
association to the place. The sense of enclosure of marketplace area needs to increase as to

91
enhance the spatial volume of the square which can determine the quality of perspective
view of the area. The unique character of the deflection effect on Jalan Pasar needs to be
emphasised as the curvature softens the gridiron of the urban fabric. Distinctive streetscapes
elements and landscaping of the “Angsana” will enhance the deflection effect and increase
the imageability of the street. The streetscape and natural elements of trees can be used to
facilitate the legibility of the marketplace with distinctive unifying character. The selection
of planting can be used to maintain and improve the visual continuity and also contribute to
the tropical setting.
The familiarity of people’s perception regarding Pudu is the marketplace activities. The old
market building and its surrounding place act as a frequent sighting of physical elements and
carry along the historical significance strata. As the familiarity with physical elements in the
area is closely related to the historical significance of the surrounding building within the
marketplace is considered distinctive, and places become recognisable. The distinctiveness
of streets is increased with the presence of old buildings where these buildings are a reminder
of old and/ past time even though not because of its physical characters just of their presence
will evoke the nostalgic memories. As people tend to have an affinity towards those place
due to their special role in the past lives.As meaning is evoked by the physical form, the
visual simulation in experiencing the place needs to be highlighted in the design
recommendation. The creation of vista and emphasising on visual stimulation and
appreciation will increase the visual memory of the place. The visual continuity of the
activities between buildings and spaces will increase the sensory experience.
The main criteria that determined the experiential quality are how the activity occurs within
the physical setting. The unique character of the street or square can be enhanced by
introducing a high degree of sensory experience and the transparency of the activities. The
physical setting for the temporal activities also must be able to support as in result will
increase vitality and add vibrant to the marketplace. The increase in permeability within the
marketplace and creating spatial zoning of activities will also influence in vitality and
vibrant as the successful place is identified if there are a steady flow of people, a high degree
of visibility and mixture types of activities and different age groups of people. The interplay
of physical elements in human kinesthetic sense and exploitation of levels can be created by
maximizing the impact of views and emotions in moving to space within the marketplace
area. The marketplace activities that relate to what is happening in the place are an element
which is associated with the town centre’s identity as people remember a place due to the
activities that occur in the place. The name has a strong influence in identity as it can lead
to the loss of identity if the name is changed. According to Shuhana (2011), when names
and cognitive schemata coincide with its physical equivalents, the environment becomes
particularly clear and forceful. The model of experience can be enhancing if the original
physical elements are a presence within the place. The name of Pudu was originally known
as “Pudoh”; means in the Hokkien dialect is a practice describing the ancestral worship of
the Chinese while in the Cantonese dialect “Pudoh” describes the fruit scientifically from
“Artocarpus integer” or locally known as “chempedak”. The usage of indigenous planting
that relates to the origin of the place name will add the sensory experience and create
historical linkage.
The marketplace activities will be more prominent when the physical forms and character
of sameness eventually enhance the manifestations of these activities. People’s participation
and involvement within the physical setting of the marketplace is limited due to lacks of
physical setting that can support the alternative community or public related activities. The

92
sense of the vitality of the marketplace can be increased by improving the physical setting
for the intended activities to take place base on the different timeframe. This study through
the townscape appraisal, historical, morphology and content analysis, has acknowledged that
the presence of the old market building is one of the elements that can foster and strengthen
the identity of Pudu Marketplace as shown in Figure 1 and Figure 2.
CONCLUSIONS
In defining the identity of a place, urban designers are mainly focusing on appearance and
imageability of the physical elements but fall short in integrating place meanings as
indicators for place distinction. The social value of urban public spaces makes them
significant within the cities due to people needs (Norsidah and Zakariya, 2014). Identity is
the sameness of character that can be seen from the physical and experiential qualities of a
place. As the identity of a place carries the image of what people perceived; the visual and
other senses stimulation through the physical and experiential qualities of the place is being
evaluated to create meaning and association to the place. Without an identity, the place is
“placelessness” (Relph (1976).
Marketplace holds a significant importance in an urban area as it helps to develop the three
corners of sustainability. The marketplace can balance the act of economic, social and
environmental aspect. Marketplace reveals that a successful urban place is more than its
building and its bottom line is the interaction between people and a place. The process of
regenerating existing urban marketplaces should be considering the components that make
them special, as not to lose the delicate characters that give each marketplace its identity and
sense of place. Therefore, the identity of the marketplace will be emphasised through the
quality of physical and experiential elements for marketplaces.
As most of the areas in Kuala Lumpur embrace the longing for latest development, the
master plan of the Pudu Marketplace should be the datum and the balancing the act of
preserving the place’s identity for any reasons either for historical or for a sense of
attachments. Pudu Marketplace locates in one of the earliest settlement; directly involved in
the making of “Kuala Lumpur”. The area that is presently locked with attractive characters
and a strong sense of identity is waiting to be enhanced; to increase the legibility of the place
and need to be knit together into a vibrant, coherent and highly imageable city form through
the regeneration of urban marketplace’s identity.
Figure 1. The Pudu Marketplace’s identity is
defined Figure 2. Regenerating the Old market
building as by regenerating the visual
structure of the a square in enhancing the
identity of Area.

93
REFERENCES Ahmad Bashri, S., Shuhana, S. 2007: Conceptual New Model of City/Town Based On The
Traditional Urban Form. UTM
Ahmad Kamal Ariffin Mohd Rus, 2005, Institusi Pasar dalam Sejarah: Analisis terpiih
mengenai peranan pasar di bandar Kuala Lumpur sehingga tahun 1914. Seminar Sejarah
Sosial Malaysia
Cullen, G. 1971: The Concise Townscape. Architectural Press
Kuala Lumpur City Hall. 2008: Kuala Lumpur City Plan 2020. Kuala Lumpur, Malaysia:
Percetakan Nasional Malaysia Berhad.
Lynch, K. 1960. The Image of the City. Mass: MIT Press
Nurulhusna Qamaruz-Zaman, et al, 2014: Functional Dimension of Spillover Activities
towards the Liveliness of Sungai Besi Market, Kuala Lumpur. Volume 153, 16 October
2014, Pages 629–638 AMER International Conference on Quality of Life,
Relph, E. 1976. Place and Placelessness. London: Pion.
Shuhana, S. 2011: Townscape Revisited: Unravelling the Character of the Historic
Townscape in Malaysia. Penerbitan UTM Press: Johor Darul Ta'zim, Malaysia.
Norsidah, U. 2009: Place Attachment and Continuity of Urban Place Identity. 1nCEBS 2009
Shah Alam
Norsidah, U., Khalilah, Z. 2014: The Notion of Place, Place Meaning and Identity in Urban
Regeneration. AcE-Bs2014Seoul.

94
UTM Razak School of Engineering and Advanced Technology
Kuala Lumpur, Malaysia
10 October 2017
SD 23 - PHYSICAL DESIGN OF STREET THAT AFFECT SAFETY
PERCEPTION
Suhaila Abdul Rashid*1, Mohammad Hussaini Wahab2, Wan Nurul Mardiah Wan
Mohd Rani3, and Syuhaida Ismail4,
1, 2, 3, 4 UTM Razak School of Engineering and Advanced Techonology, Universiti Teknologi
Malaysia, Kuala Lumpur, MALAYSIA.
([email protected], [email protected], [email protected], [email protected])
ABSTRACT
Increasing and expanding of c are significant where many new buildings and mega project
are concentrated in the city centre due to accessibility and connectivity to public transport.
In developing new buildings or structure, the creation of street as public spaces should be
part of the agenda. In order to achieve a sustainable city, many aspects of urban design need
to be consider not only for new development but also the existing urban landscape. Streets
are important for public life, social coherent and economic value and it’s design should
consider user’s comfort and safety. Feeling safe is important for human wellbeing especially
woman where they are vulnerable group in the society. Feeling unsafe will affect behaviour
as well as quality of life. This study is focusing on safety perception on the street in Kuala
Lumpur. A mixed methodology study were conducted with questionnaire survey and
structured observation to obtain an in-depth scenario of the problem. 120 respondent were
selected randomly on the case study area. Finding shows that the design of the street and
spatial structure of the cities is effecting on safety perception. Therefore it is crucial to create
a safe urban environment.
Key words: safety perception, street design, urban design, sustainable urban design,behaviour.
INTRODUCTION
The scope of this study is focusing on physical design of street that affect safety perception
from women’s perspective on the streets of Kuala Lumpur as perception is important due to
its effect on behavior. The objective is to explore the relationship between manmade built
environment, psychological and behavioural aspect of human being on the street especially
women.
Historically, public spaces are important spaces in the city for many activities from
economic, social and political. Public space is an outside space that people should be able
to enjoy and express themselves. It should be able to enhance quality of life. In order to
95
achieve this objective, public space needs to perceive as safe especially for women.
Development in the city centre are led by economic pressure (Mellor, 2010) in Buckingham
(2013). Due to this, public space creation become thoroughfare rather than public realm. A
space that belongs to pedestrian now dominated by vehicular. The overall setting of public
space especially the street are affected by the design and planning of the building, landscape,
maintenance, activities as well as social aspects which is the demographic changes.
There are global concerns and effort at international level pertaining to urban users in public
spaces at local context, concern over safety is increasing with the incremental crime rates
statistic. Malaysia’s ranking in the order and security sub index of the World Justice Project
(WJP) Rule of Law Index to improve from 16th position out of 97 countries in 2012/2013
to 12th position out of 99 countries in 2014. However, based on the Safety Perception Index
survey series under the National Key Result Area, the number of respondents who felt safe
decreased from 47.5% in 2011 to 39% in 2014.
Safety perceptions are decreasing especially in the city where lifestyle and pattern are
different from rural area. City spaces are occupied day and night, therefore it should be safe
enough as safety is fundamental of human rights (UN, 2005) & Roberts (2013). With the
rapid urbanization, crime rates are increasing and safety is a major concern especially for
women. Women are vulnerable group of user and their needs and expectations are different
compared to men. The way women perceive the environment are also different, therefore it
is important for urban development to consider gender planning.
There are several research carried out at international level that focused on the factors that
influenced safety perception in public spaces. Brown (2013) measured the perception,
gendered fear of crime in public spaces and the relationship of built environment as well as
situational crime prevention. Her research findings shows that there had been some but not
full integration of crime prevention through design principles in the design. Brown
suggested that there is a need to extent a research on the effect of safety perceptions on user
among women or general public. Sideris (2013 & 2008) measured how physical elements
affect safety perception among women traveller and suggested that gendered view need to
be adopt at design stage. Hong et al (2014) studied the role of the environment on perceived
safety from crime and walking.
Public spaces comprises of street and square, and street is more significant in local context.
The word ‘street’ is derived from the Latin sternere, to pave, and so relates to all Latin-
derived words with the str root that are connected with buildings, with construction
(Rykwert, (1978) in Anderson 1978). The very word street, as its etymology suggest,
denoted a delimited surface-part of urban texture, characterised by an extended area lined
with buildings on either side (Rykwert, 1978). Street has been considered as a ‘symbol’ of
public space and always been the centre of attention. Jacobs (1961) recognised the important
of street and according to Jacobs (1993) the best streets are comfortable to walk along with
leisure and safety.
Physical design of street is an important aspect to explore and to make it safe as it is the
backbone of a city and a space where people use on daily basis. Poorly design and maintain
street might affect safety perception as well as creating a negative environment and stimulate
negative behavior which leads to crime. There are eight elements of street that was studied
which are; visibility, mixture of land use, lighting, accessibility, orientation, signage, vibrant
activities and provision of CCTV.

96
METHODS
In order to evaluate the phenomenon, a mixed method study was conducted. A combination
of both quantitative and qualitative method is to strengthen and to get an in-depth view of
the problem. A case study approach were employed with questionnaire survey and structured
observation. 120 respondent were selected in the case study area and were randomly
selected. Structured observation were conducted at interval time for seven days to explore
the pattern of behaviour of the pedestrian in the area. Data from both methods were
combined and analysed in order to verify the analysis and to improve accuracy and
validation. Triangulation has vital strengths and encourages productive research and to
develop a comprehensive understanding of phenomena (Patton, 1999). Triangulation also
has been viewed as a qualitative research strategy to test validity through the convergence
of information from different sources. This approach is adopted as it offer a better
understanding of the research problem than either method on its own (Plano & Creswell,
2007 in Xerex (2011).
Figure 1. Case study area covering four street (source:google.com)
MAIN RESULTS
Findings from both data shows that physical elements does affect safety perception. Data
from questionnaire shows that respondents agree that physical elements affect their
perception of safety. Physical elements are important towards women’s safety where
majority over 70 percents agree on all variables that has been asked in the questionnaire.
Table 1. Matrix of physical elements Elements/
Location
Jalan Melayu Jalan Melaka Jalan Tun Perak Jalan Benteng
Visibility Obstructed Fully visible Fully visible Obstructed
Mixture of
land use
Variety of uses Less variety Variety of uses Less variety
Lighting Poor Good Fair Poor
Accessibility Accessible Accessible Accessible Accessible
Orientation Fair Good Good Poor
Signage Lack of signage Lack of signage Lack of signage Lack of signage
Vibrant
activities
Vibrant Less vibrant Vibrant Less vibrant
Provision of
CCTV
Lack Moderate Lack Lack

97
The above table shows that two street are obstructed and low visibility and both streets are
also poor in terms of lighting and lack of signages. Visibility is important when walking on
the street especially at night. The situation is worst when the street is obstructed and there is
not enough lighting provided.
Figure 2 Jalan Melayu Jalan Benteng
Visibility at both street are obstructed by activities and at Jalan Benteng due to it’s design
where blank wall is facing the street. Due to this condition, it creates and attract social
incivilities such as homeless and mentally ill people.
Figure 3. Jalan Melayu Jalan Benteng
The above photos from observation shows poor lighting at both street. Women were
found using this street at night heading to the nearest LRT station and other public
transportation.
Figure 4. Modification of behaviour by changing walking route
According to survey, 90 percents of respondents agree that they will change their route
whenever they feel unsafe in certain area, followed by 8 percents who
remain walking on the same street as their route because they do not want to let their fear
overcome or disturb their routine. The above findings reveals that the built environment does
affect safety perception among women.
90%
8%
2%
Percentage
Feeling unsafe makes women avoid certain route
Don’t Know Disagree Agree
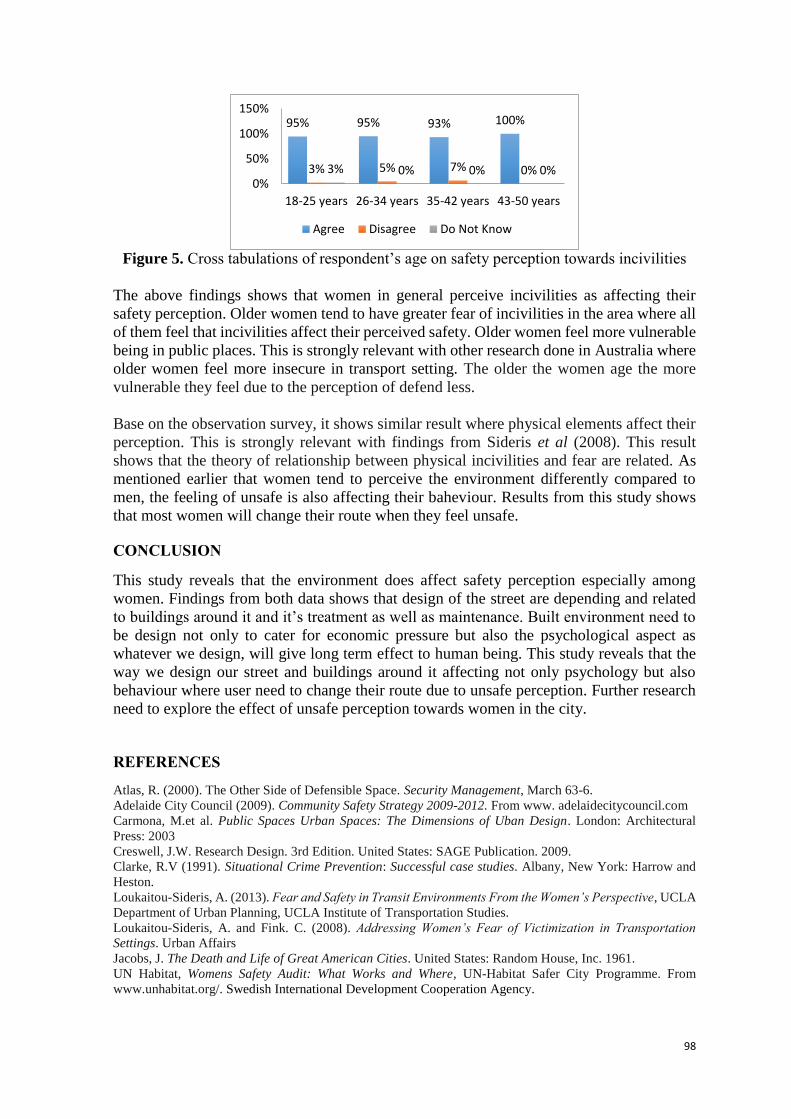
98
Figure 5. Cross tabulations of respondent’s age on safety perception towards incivilities
The above findings shows that women in general perceive incivilities as affecting their
safety perception. Older women tend to have greater fear of incivilities in the area where all
of them feel that incivilities affect their perceived safety. Older women feel more vulnerable
being in public places. This is strongly relevant with other research done in Australia where
older women feel more insecure in transport setting. The older the women age the more
vulnerable they feel due to the perception of defend less.
Base on the observation survey, it shows similar result where physical elements affect their
perception. This is strongly relevant with findings from Sideris et al (2008). This result
shows that the theory of relationship between physical incivilities and fear are related. As
mentioned earlier that women tend to perceive the environment differently compared to
men, the feeling of unsafe is also affecting their baheviour. Results from this study shows
that most women will change their route when they feel unsafe.
CONCLUSION
This study reveals that the environment does affect safety perception especially among
women. Findings from both data shows that design of the street are depending and related
to buildings around it and it’s treatment as well as maintenance. Built environment need to
be design not only to cater for economic pressure but also the psychological aspect as
whatever we design, will give long term effect to human being. This study reveals that the
way we design our street and buildings around it affecting not only psychology but also
behaviour where user need to change their route due to unsafe perception. Further research
need to explore the effect of unsafe perception towards women in the city.
REFERENCES
Atlas, R. (2000). The Other Side of Defensible Space. Security Management, March 63-6.
Adelaide City Council (2009). Community Safety Strategy 2009-2012. From www. adelaidecitycouncil.com
Carmona, M.et al. Public Spaces Urban Spaces: The Dimensions of Uban Design. London: Architectural
Press: 2003
Creswell, J.W. Research Design. 3rd Edition. United States: SAGE Publication. 2009.
Clarke, R.V (1991). Situational Crime Prevention: Successful case studies. Albany, New York: Harrow and
Heston.
Loukaitou-Sideris, A. (2013). Fear and Safety in Transit Environments From the Women’s Perspective, UCLA
Department of Urban Planning, UCLA Institute of Transportation Studies.
Loukaitou-Sideris, A. and Fink. C. (2008). Addressing Women’s Fear of Victimization in Transportation
Settings. Urban Affairs
Jacobs, J. The Death and Life of Great American Cities. United States: Random House, Inc. 1961.
UN Habitat, Womens Safety Audit: What Works and Where, UN-Habitat Safer City Programme. From
www.unhabitat.org/. Swedish International Development Cooperation Agency.
95% 95% 93% 100%
3% 5% 7% 0%3% 0% 0% 0%0%
50%
100%
150%
18-25 years 26-34 years 35-42 years 43-50 years
Agree Disagree Do Not Know

99
UTM Razak School of Engineering and Advanced Technology
Kuala Lumpur, Malaysia
10th October 2017
SD 33 - THE KEY TO BE A WALKABLE CITY
Siti Fatimah Ilani Bilyamin, Mohammad Hussaini Wahab,
Khairul Hisyam Kamarudin
University of Technology Malaysia, Kuala Lumpur
([email protected]; [email protected]; [email protected])
Abstract:
For more than half a century, most countries have experienced rapid urban growth. The
process of urban growth has slowly changed from fineness to coarseness of urban form.
Unfortunately, this has also changed the travel patterns from the traditional mode of
transportation to automobile mode of transportation. Widespread ownership of automobiles
has transformed with a range of environmental, social lifestyle and economic consequences.
Therefore, the travel pattern had to change from automobile mode of transportation (vehicle-
oriented transportation mode) to sustainable transportation approach (people-oriented
transportation mode). People-oriented transportation mode is also known as walking.
Walking is the most sustainable mode of transportation and one which has the least impact
on the environment. It is also function as one of the major contributing factor to the creation
of successful urban space for human interaction. The ‘tsunami’ from numbers of vehicles
has destroyed the pedestrian. Lack of pedestrian is identified as one of the urban design
issues concerning the city of Kuala Lumpur. Hence, this paper investigates the factors that
influence people choose to walk in the city centre of Kuala Lumpur. The city centre of Kuala
Lumpur is chosen as a case study because it plays a significant role and function as a major
activity setting in Kuala Lumpur. This study adopts mixed method approach through
questionnaire survey, combined with the qualitative method through field observation to
investigate the phenomena in the study area, and content analysis of written documents. The
findings show that the psychological factor is the main influential factor towards those who
walks in Kuala Lumpur city centre. However, the physical factor also plays a pivotal role in
moulding the urban environment to become more walkable. As a conclusion, the Kuala
Lumpur city centre will achieve the concept of “walkable city” when these two influential
factors are applied.
Keywords: Psychological Factor, Physical Factor, Walkable City

100
INTRODUCTION
Urbanization refers both to a condition at a point in time and to a process occurring over
time. The condition of urbanization, referred to as the level of urbanization. It is indicated
by the percentage of a population that is living in urban areas (United Nations, 2015). These
include migration from rural areas to urban areas, absolute growth in the urban population
(urban growth). Urban growth that is faster than rural growth. Globally, more people live
in urban areas than in rural areas. In 1950, 30 per cent of the world’s population was urban,
54 per cent of the world’s population residing in urban areas in year 2014, and by year 2050,
66 per cent of the world’s population is projected to be in urban areas (refer Table 1).
Locally, 67 per cent of the population in Malaysia live at the Kuala Lumpur city centre area
in year 2020 (ETP, 2012). Kuala Lumpur is one of the world’s key hubs for Islamic finance
and has one of the faster growing economies in the world in the Asian city (Business Insider,
2016). It is shows that Malaysia has a steady increase in GDP per capita (United Nations,
2015) as people moved to Kuala Lumpur city centre. City centre plays important role
especially in generating economic activity. The accessibility component is a main factor in
achieving a successful economic development, population growth and others activities. A
good accessibility in city centre can develop a more high-quality economic development in
the city centre.
Table 1. Percentage of World’s Population Residing in Urban Areas
Year World’s Population Residing in Urban Areas (%)
1950 30
2014 54
2050 66
Reference: United Nations, 2015
Since the 19th century, streets in Malaysia give more priority to the automobiles circulation
(ETP, 2010). Instead of more people utilising the public transport in city centres, the
opposite is true when compared to the use of personal cars (Shuhana et. al, 2012). People
started to become dependent on the car or automobile as an alternative to move in the city
centre. In the 20th century, travel patterns have changed from the traditional mode of
transportation to automobile transportation. The travel patterns in most developed countries
are increasingly dependent on the car (Banister, 2005; Shuhana, 2011; Shafii and Shareh
Musa, 2011). As a result, in the mid-21st century, the automobile has started become an
ironic icon travel pattern in the city centre. Walking is our oldest and most basic form of
transportation which is now being forgotten. Recently, people seem to prefer to drive rather
than walking even for short distances. Currently, Kuala Lumpur City Plan 2020 has
promoted to be walkable city in the future. This is because the increased population in the
cities create traffic congestion, negative impacts on the quality of life. At the same time,
Kuala Lumpur has also committed to achieve a ‘World Class City” through a walkable city.
There are several problems that are important to highlight on the significance of walkability
in cities, such as (1) rapid urbanisation creates city centre design that gives little priority for
pedestrian; (2) pedestrians being deprived of having walkable streets; and (3) lack of
understanding of the factors that influence walkability. The Victoria Transport Planning
Institute (VTPI) stated “walkability reflects the overall conditions in an area and this takes
into consideration the quality of pedestrian facilities, road conditions, land use patterns,
community support, security and comfort of walking (VTPI, 2005). Southworth (2005)
defined walkability as the extent to which the built environment supports and encourages

101
walking by providing pedestrian comfort, convenience and safety, connecting people with
varied destinations within a reasonable amount of time and effort, and offering visual interest
in the journeys throughout the network. Meanwhile, according to World Bank (2009), “there
are many different ways to consider ‘walkability’. In many developed countries, walkability
discussions focuses on encouraging mode shift from motorized to non-motorized vehicles
for short trips, walking is often considered in terms of providing mobility for low income
resident. Some urban planners tend to think of walkability in terms of a city’s spatial land
use arrangement, favouring mixed-use zoning over segregated uses. Despite all of these
possibilities, the project would consider walkability only at its most basic sense: the safety,
security, economy and convenience travelling by foot”. Litman (2011) mentions the
walkable principle is slower modes such as walking continue to be important even as faster
modes are developed based on automobile travel such walk + train + bus + car + airplane +
walk again to make more trips over longer distance by a combination of walking and public
transport. There are different interpretation definitions of walkability. However, this paper
considers walkable city as a walkable urban environment has encouraged public to walk in
the city centre.
Figure 1: Theoretical Framework on Factors Influencing the Walkability Characteristic
Source: Alley (2005), World Bank (2009), Weller (2008), Krambeck (2006), NZ Transport
Agency (2009)
Case Study Area
The study area is located in the city centre of Kuala Lumpur. It is chosen as the setting of
investigation. Kuala Lumpur is the capital of Malaysia. According to the Kuala Lumpur
Structure Plan 2020, the population target in the year 2020 is 2,200,000 populations with
243km2 land area. The Kuala Lumpur City Hall has defined Kuala Lumpur into six areas
which are known as strategic zones as shown in Figure 1. The strategic zones are; City
Centre (Study Area), Wangsa Maju – Maluri, Sentul – Manjalara, Damansara – Penchala,

102
Bukit Jalil – Seputeh and Bandar Tun Razak – Sungai Besi. The main focus of the case study
is the City Centre strategic zone with 1,813 hectare of land area and the target population by
2020 is 245,600 people. With the significant number of population and employment rate
which are, 438,000 employees by 2020, traffic congestion may become a major problem if
the walkability aspects are not taken into the development consideration. Due to the KLCP
2020, the vision to become a developed country by the year 2020 as liveable environment
that could balance all development aspects will also serve as a factor in contributing to the
success of the country.
The Selection Criteria of Study Areas
The case study area is located in the city centre of Kuala Lumpur. The place is selected based
on the physical, functional and social-cultural characteristic that present the character of
Kuala Lumpur city centre. According to the theoretical study, these places commonly share
the following characteristics: (a) Located within the main commercial nodes within Kuala
Lumpur city centre; (b) Located within diverse economic activity (commercial or land marks
or shopping area/historical area/ mixed use development); (c) Located within transportation
transit area; (d) Receive concentration of pedestrian, shoppers and tourists.; (e) Population
increase in three times in year 2020; (f) Pollution in Kuala Lumpur is polluted by vehicle
movement or travel pattern; and (g) Main development impact on urban environment.
METHODS
This study adopts mixed method approach through questionnaire survey, combined with the
qualitative method through field observation to investigate the phenomena in the study area,
and content analysis of written documents. This study applies 4 series Likert-scale from
‘strongly disagree’ to ‘strongly agree’ (National pedestrian Survey, 2002); Chua (2008);
Norsidah (2008); and Norafizah (2011). It is important to describe the factors that influence
respondent to choose to walk. Based on Table 4.6, there are scale and measurement that will
be analysed into analysis part.it is because, according to Chua (2006), odd numbers will
increase the reliability than using even numbers that will force the respondent to agree or
disagree. It is important to avoid bias from the researcher. Therefore, Likert-scale with 5
points is used to grade the scale of their perception. However, Chua (2006) stressed that
Likert-scale with 5 points results mostly pointed to neutral point. The result is unreliable. In
this study, the target group of respondent is public or main user within the Kuala Lumpur
(KL) city centre area. The main user in this study includes the static users who are involved
(daily) office workers and mobile user involving pedestrian in weekday was selected as the
sample. Based on the issues highlighted, therefore the subject in this research is the public
mostly, who use and whose lifestyle is exposed directly to the impact of development. This
study involved probabilistic sampling involving randomly chosen sample with a certain
characteristic to represent a large population (Creswell, 2007). Besides, National Survey of
Pedestrian (2002) used this technique to conduct the survey. It is because the random
approach also can reduce the biasness from researcher (Chua, 2006).
Therefore, this study applied stratified of the population with the character and then select
randomly the respondent from the proportioned characters based on the types of respondent.
this study also used the cluster sampling in the case of multiple setting so that each sample
area has the same sample size (Norsidah, 2008). Cluster sampling is almost similar to
stratified sampling except that the clusters are normally divided on geographical basis.
According to Norsidah (2008), each cluster or sub-division in cluster sampling is able to
represent the population for each place chosen as representative sample for the city centre

103
of Kuala Lumpur. Besides, the sample represents the same sample size in each cluster and
is broadly divided into the static and mobile users so that multistage stratified (proportioned)
cluster sampling was adopted to ensure that the resulting sample would be distributed in the
same way as the population in terms of the stratifying criteria (National pedestrian Survey,
2002; and Bryman, 2001).
The research is concerned with the publics’ problems, factors and walkability characteristic
that influence them to choose to walk in the Kuala Lumpur City Centre. In this case,
multistage stratified (proportioned) cluster probability sampling procedure will ensure that
the selection respondents reflect the dominant characteristics of the users of the study area.
Since the population involved is varied, the key users of the public need to be identified
within clustered as samples to represent whole population of Kuala Lumpur City Centre.
Therefore, the survey is divided into five zones within Kuala Lumpur City Centre which are
Ampang Zone, Bukit Bintang Zone, Kampung Baru Zone, Pudu Zone and Raja Laut Zone.
There are 80 respondents (20%, static user; 80% mobile user) within each zone (refer also
Figure 4.4).
FINDINGS AND ARGUMENT
The majority of respondents in this research are employed but not residing in the Kuala
Lumpur City Centre area. It shows that there is a need to travel almost every day in the city
centre. Nevertheless, the respondents prefer to travel using private transport to get to the
office because they prefer to travel in a comfortable condition i.e. do not have to crowd with
other passengers. The situation happens when they are influenced by the psychological
factor to choose to walk in the centre area. This study suggests that the majority of
respondents have negative impression to walk in the Kuala Lumpur City Centre and practice
less active lifestyle. They prefer to depend on private transport to travel in the city centre.
The respondents are able to walk for less than 5 minutes which limits their ability to walk
long distance and able to keep practices less active life style. Rapid urbanisation creates a
city centre design that gives little priority for pedestrian will be extended as an issue in the
future. Based on the findings, streets in Malaysia today give priority to vehicular circulation
and no longer function as an urban space for human interaction. Indeed, the respondents also
depend more on private vehicle compared to the public transportation. Yet, the
psychological factor is also interpreted by the physical factor. As mentioned earlier, there
are strong relationships between the psychological and physical factors. The people are
motivated by a hierarchy of needs at different group levels. These are also related to the
psychology and physical environment factors that people consider when making decision on
whether to walk.
It is not one way but two-way consideration of factors. The key factor that influences the
public to choose to walk in the city centre is the psychological factor. The physical factor is
influenced by the psychological factor and the physical factor shapes the walkable
environment that encourages walkability to the level of walkable city. As stated before, there
are two main factors that influence the public to choose to walk in the city centre. However,
in order to identify and examine the psychological and physical factors in choosing to walk
in the city, there must also be ‘upgrading’ in the publics’ awareness (psychological or
motivation) and perception (physical factors) towards a walkable city. Therefore, there are
six (6) factors that consist of psychological factors and six (6) physical factors identified
from the theoretical framework. These constraints are attributed to various factors that are

104
summarized under the 6 key factors outlined. The main problem is that the public has no
motivation to walk in the city and awareness at the individual level.
Lack of motivation to walk Even though the majority of respondents agree that walking is a meaningful routine, the
majority of respondents prefer to drive to get to the office. It is also discovered that the
respondents are able to deal with traffic congestion during peak hours along with the long
journey time. This preference is also because there are good facilities to park private
transport and the willingness to spend an amount of money for parking facilities compared
to the lack of pedestrian facilities. Other than time, the respondents also prefer to drive
private transport to get to the office in the KL city centre. This relates to the public
motivation or self-awareness, where the respondents state that walking makes they tired,
sweaty and they do not consider it as light or recreational activity. The respondents also
choose to walk within 5 minute walking duration. The result shows that the respondents are
lazy to walk as life is made easier to depend on machines and people do not need to move.
It is certainly an issue when passive lifestyle dominates and obesity level increases. As
mentioned in the problem statement, it is not only the Health Ministry or doctor’s
responsibility to address this issue but this role is also shared by the urban designer to design
proper urban space.
Figure 2: Factors İnfluencing The Public to Choose to Walk in The City Centre
CONCLUSIONS
This paper provides integrative theoretical and experiential approaches that are crucial to the
practice of walkable city that consist of the problem, factor and characteristics of the public
in the Kuala Lumpur city centre. There are two factors that influence the public to choose to
walk in the Kuala Lumpur city centre. The main factors that influence the public to choose
to walk are the psychological factors that are perceived as the components of the physical
factor. However, there are significant factors to each other. In promoting walking and the
aspiration to become a walkable city stems from the recognition that attractive and
economically thriving cities are those that encourage public life and recreation. Kuala
Lumpur City Centre has many attributes which contribute to making a city walkable. One
of the most important attributes is the quality of public and physical environment, the way
it contributes to character, promotes pedestrian activity and connectivity and encourages
people to spend time within the city centre. Consequently, a walkable city comes when the
public and walkable urban environment are readily to walk.
WALKABLE CITY
Physical
Environment
Psychological
Factors +

105
REFERENCES
Alley, S (2005). Walkabiltity Scopping Paper. New Zealand.
Banister, D. (2005). Unsustainable Transport. New York: Taylor & Francis Group.
Bryman, A. (2001). Social Research Methods. Oxford: Oxford University Press.
Business Insider (2016).
Chua Yan Piaw (2006). Kaedah dan Statistik Penyelidikan: Kaedah Penyelidikan, Buku 1,
McGRaw-Hill (Malaysia) Sdn. Bhd.
Chua Yan Piaw (2008) Kaedah dan Statistik Penyelidikan: Asas Statistik Penyelidikan,
Analisis Data Skala Ordinal dan Skala Nominal, Buku 3, McGRaw-Hill (Malaysia) Sdn.
Bhd.
Creswell, J. W. (2007). Research Design: Qualitative, Quantitative and Mixed Methods
Approaches. Thousand Oak, CA: Sage Publications Inc..
DBKL (2008b). Kuala Lumpur Structure Plan 2020. Kuala Lumpur. Dewan Bandaraya
Kuala Lumpur.
Economic Transformation Programme (2012). Annual Report 2011. Prime Minister’s
Department Putrajaya.
Haryati Syafii dan Sharifah Meryam Shareh Musa (2011). Isu-isu Kualiti Hidup Masyarakat
di Bandar. UTHM
Krambeck, H. (2006). The global walkabiliity Index. Washington D.C: Urban Land Institute.
Litman, T. (2011). Measuring Transportation: Traffic, Mobility and Accessibility. ITE.
Journal , 73 (10), 28-32. Retrieved from http:// www.vtpi.org.
National Survey of Pedestrian (2002). Highlighted Report. US Department of
Transportation.
Norsidah Ujang (2008). Place Attachment Towards Shopping District in Kuala Lumpur City
Center. Fakulti Alam Bina. Malaysia: Universiti Teknologi Malaysia.
Norhafizah Abdul Rahman (2011). User Friendly Street in Malaysia. University of
Nottingham.
NZ Transport Agency. (2009). Pedestrian Planning and Design Guide. New Zealand.
NZ Transport Agency. (2009). The Principle of Pedestrian Planning. New Zealand
Shuhana Shamsuddin, Siti Fatimah Ilani Bilyamin, (2011).Walkable City Centre as a
Sustainable Approached to Vehicle Free. ICUDBE.119-137
Shuhana Shamsuddin, Siti Fatimah Ilani Bilyamin, Nur Rasyiqah Abu Hassan (2012).
Walkable Environment in Increasing the Liveable of a City. CiE 001 105-106
Southworth Michael (2005). Designing The Walkable. J.Urban Plng. And Devel. Vol 131,
issues 4, pp.246-2657
VTPI (2005). Walkability Improvements: Strategies to Make Walking Convenient, Safe and
Pleasant. TDM Encyclopedia.
Weller, B (2008). Slides for a presentation and discussion about roundabouts, naked streets,
walkability indices, the “walkability challenges cup” and other ideas,
https://www.healthy_communities, June [Accessed: 2010]
World Bank (2009). Improving pedestrian infrastructure and service in Bangkok.
United Nations (2015). World Urbanization Prospects: The 2014 Revision. Department of
Economic and Social Affairs, Population Division. New York.

106
UTM Razak School of Engineering and Advanced Technology
Kuala Lumpur, Malaysia
10th October 2017
SD 39 - THE CHALLENGES OF URBAN DEVELOPMENT IN IRAN,
FOCUSING ON THE CITY OF KERMANSHAH
Kayoumars Irandoost1 Hooshmand Alizadeh2, Mohammad Rasouli3
1Associate Professor (PhD), University of Kurdistan, Iran, Sanandaj
E-mail: [email protected] 2Associate Professor (PhD), University of Kurdistan, Iran, Sanandaj
E-mail: [email protected], corresponding author 3PhD Student of Urban Planning, Islamic Azad University Tehran North Branch, Tehran, Iran
E-mail: [email protected]
ABSTRACT
After Industrial Revolution and changes in the world's manufacturing connections, the
relationship between human and environment has dramatically been changed. Being in a
strategic status, the rural population met the proper capacity to be placed in another concept
of living called "the city". Like many other developing countries, the changes in Iran's
urbanization process were formed after the land reform and emergence of assembly
industries, particularly with the increasingly prominent role of the oil industry which
fundamentally changed the rural-urban relationships and caused an unbalanced distribution
of urban-rural revenues and pushed more the rural-urban migrations. Kermanshah, as one of
the provincial cities in the western part of Iran, has been selected as the case study of this
research to study the challenges of urban development in Iran through documents analysis.
The results show that Kermanshah faced major challenges of spatial inequality in urban
development as the results of rapid urbanization, rising urban poverty and lack of well-
governed and managed urban areas
Keywords: Challenges of Urban development, Urbanization, informal settlements, Iran,
Kermanshah
INTRODUCTION
Today, the largest urban agglomerations in the world are mainly in the South. More
importantly, based on the UN-Habitat, cities in the developing world will absorb 95% of
urban growth in the next two decadesi. This growth is mainly in line with large and
megacities, where major consumers of energy and generators of pollution were resided.
Within these cities, the major problem of developing countries is the division between rich
and poor which continue to widenii. One in six people live in disgraceful conditions in
overcrowded urban slumsiii. Like many other developing countries, the changes in Iran's
urbanization process were initiated by modernization policy adopted under Reżā Shah
(1925-41) and later on by the land reform and emergence of assembly industries, particularly
with the increasingly prominent role of the oil industry which fundamentally changed the

107
rural-urban relationships and caused an unbalanced distribution of urban-rural revenues and
pushed more the rural-urban migrations. This transformed the urban areas to the engines of
growth and beacons of opportunity and, thus, they account for the vast majority of economic
output. The apparent outcome of this change was the extension of urbanization, a trend is
still rapidly continuing in Iran.
Kermanshah, as a provincial city in the western part of Iran had been a city of considerable
historical importance (figure 1). Due to its location along the Silk Road, the city has had a
strong link with Iranian plateau and the plains of Mesopotamia. However, this situation and
its role have been diminished due to the course of time and changes happened in the last
century with the advent of modernization in Iran. After the Islamic Revolution of 1979 and
particularly the eight-year war with Iraq, Kermanshah suffered from major challenges of
migration and rapid population growth caused by the war and its proximity to the border of
Iraq. In addition, it faced with investment recession and high rate of unemployment which
still suffers from it. Although Kermanshah is now a metropolitan city in Iran and the main
hub for southwest and west migrants, especially new arrivals, it is also a city of emigration
to more economically vital cities in Iran. The result of these changes particularly high rate
of migration to the city has been an inability of urban services to keep pace with the
population growth and the consequent spread of informal settlements and spatial inequality.
Considering these points, this article aims to identify the key forces and processes underlying
the economic, social and physical changes happened in the course of time and to examine
the major challenges of contemporary and future of urban growth of Kermanshah. To do
these, the article first review the city's historical development, an account of contemporary
conditions, and then a critical review of its socio-spatial challenges through document
analysis, and finally the concluding remarks.
HISTORICAL BACKGROUND
The Zagros region, as the geophysical context of Kermanshah, had been an area for the
development of multiple human communities and different lifestyles due to its geographical
conditionsiv. Most “historians and archaeologists attribute the origin and foundation of
Kermanshah city to the Sassanid era” (224–651 AD)v. After Islam, “Kermanshah was still
military and economically important because of its location at the intersection of the great
highway linking Baghdad to Khurasan with trade route to Tabriz and Ardabil”vi. Due to the
Mongol invasion in the 12th century, the city was heavily damaged and its habitants
massacred and “what had been a medium-size town was merely a village”vii. In the later
centuries of the Islamic era, Kermanshah suffered from frequent ups and downs and the city
was destroyed and re-established many timesviii. In the Qajar period (1785 to 1925),
Kermanshah experienced a relatively flourishing time due to its location along the road from
Tehran to Karbalaix. In this period, the city wall was enlarged by new fortress, and it
contained caravansaries and houses for merchantsx. In Pahlavi period (1921-1941) a series
of political, economic and social changes such as the settlement of the tribes (Takhteh Qapu),
the development of infrastructures, the formulation of new laws including the Law of
Compulsory Military Service and the familiarity of rural young people with urban life, the
development of governmental centers, the formation of industries significantly influenced
the process of urbanization. Beside all the difficulties the city faced, the decade from 1956
to 1966 can be considered as the years of urban rapid growth. Nowadays, the city of
Kermanshah has become a metropolis in the west of Iran that faces with a variety of socio-
spatial problems and issues, particularly the growth of informal settlements.

108
DEMOGRAPHIC CHANGES
In the first population and housing census in 1956, the population of Kermanshah city was
recorded as 125,439 people and in the last census in 2011, this reached to 851,405 (table 1).
In the period 1956-1966, it experienced a highest rate of population growth which was 6.5
per cent (table 2). This rate can be linked to the rural migrations from the region and war
refugees from the border areas. On the contrary, this population rate reduced to 2.14 per cent
in the period 1985-1995. Based on the population and housing census of 2011, the city of
Kermanshah as the largest population center in Kermanshah province contained 43 percent
of the total population of the province. Also considering the last census, Kermanshah city is
the second most populous city in the West and North West of Iran after Tabriz, and is ranked
eighth in Iran’s population ranking.
Table 1. The demographic changes of Kermanshah city and its province during seven
periods of the national population and housing census (1956-2011).
1956 1966 1976 1986 1996 2006 2011
City 125439 187930 297315 560514 692986 794863 851405
Provincexi 1376989 776409 1042268 1474257 1778569 1879385 1945227
Source: General population and housing census results, 1956-2011
Table 2. Annual population rate (in percent) of Kermanshah city and its province during
six periods of national population and housing census (1956-2011).
1956-
1966
1966-
1976
1976-
1986
1986-
1996
1996-
2006
2006-
2011
City 4/69 4/69 6/55 2/14 1/38 1/38
Province 5/57- 2/87 3/65 1/97 0/55 0/69
Source: General population and housing census results, 1956-2011
URBAN ECONOMY
As the city was located on the strategic commercial and pilgrimage travel route linking
Mesopotamia to the Iranian plateau, most of the traditional bazaar facilities and
infrastructures are the results of such location. Moreover, the city was also a regional center
for the collection and distribution of commercial commodities. Both these functions
contributed to the prosperity and flourishing of the market economy, and consequently to
the urban development of Kermanshah. From 1920 onwards, the beginning of the Iran’s
modernization and “the construction of new streets led to an organizational review of the
distribution of commercial activities and consequently gave rise to the extension of
commercial, economic and social activities in the city”xii.
Kermanshah’s development process declined after the coup of 28 Mordad (18 August, 1953)
due to the political conditions and the economic recession of the first decade of 1952.
However, from the 1961 onwards, the social and economic modernization process of the
country and consequently that of the Kermanshah was intensified due to the sudden increase
in oil prices and oil revenues, and the city enjoyed considerable growth in terms of industrial
and economic activities and services.

109
URBAN DEVELOPMENT
The earliest map of the city dates back to 1850 drawn by Russian surveyors. Based on this
map, the old city of Kermanshah contained seven gates (figure 2) which show its commercial
privileged location along the Silk Road towards Iranian plateau and the plains of
Mesopotamia. The second visual document of the city was provided by English
expeditionary forces involved in Mesopotamia in 1919 (figure 3). This map is a good basis
for the delimitation of the old town and the city’s growth in the period of modernization.
Figure 2: Seven Gates of Kermanshah in 1850 and its map in 1919
Sources, left: Mehriar, Shamil et al., 1998xiii, middle: Gharavi et al., 2009, left: and
Clarke and Clarke, 1969: 29
In the first Pahlavi dynasty (1921-1941), the epic of modernization, which brought forward
the western style of urban planning and design, transformed the traditional face of the city
by imposing new network of wide streets based on axially in 1935. This replaced the twisted
and organic alleys and thoroughfares which changed the morphology of the city’s entire
urban area. In this period, the main square of Kermanshah (Sabzeh Maidan) disappeared and
the bazaar divided into several parts and the new three parallel streets became the backbone
of urban traffic. Today, these three streets (Javanshir, Modarres, and Jalili) formed the
backbone of city structure for urban transportation.
From 1921 to 1966, the city experienced relatively a slow growth. More importantly, the
main feature of this period was extensive intervention in the old fabric of the city to upgrade
the city’s traffic network to ease the flow of vehicles. At the end of this period, the conditions
gradually changed due to the city growth resulted from migration of the people from rural
areas to the city particularly “to the assembly industries”xiv. During 1966-1976, the city
growth was mainly influenced by the oil economy and the changes happened in the national
economy. City’s physical growth occurred in the north side of the city particularly in the
farmlands. They were quickly turned into residential districts. In this period, based on the
guidelines of the comprehensive plan, urban sprawl with low-density patterns of physical
development became the dominant mode of urban development. In the period 1976-1986,
the city rapid growth continued, and several new towns with new planning style founded
based on the grid pattern, and the spaces between developed sites and old neighborhoods
gradually filled. Due to the transition period of revolution and the start of Iran-Iraq war, the
uncontrolled and unauthorized growth led to the construction of informal settlements and
the most important parts of them created in this period.

110
In the recent decades, in total, the rapid growth of the city was associated with formal
housing and urban planning policies, and the informal trend of housing construction. This
rapid growth has faced the city with serious problems. On the southern and northern parts,
the topographic constrains, and on the eastern and western parts, the military and industrial
sites limited the city’s horizontal expansion. Although the land development projects are
still underway on the western and eastern parts, the excessive horizontal growth of the city
created great problems regarding the approach of sustainable city. For this reason, increasing
building density is a new policy for city’s authorities to cope with the housing needs. In
recent years, following the Mehr housing policy lunched by the government to provide
housing for poor and low-income social groups, city growth continued on the suburb,
particularly on the steep slopes as a fragmented patchwork of suburban districts.
URBAN CHALLENGES
Like other Iranian cities, Kermanshah experienced an accelerating growth of urbanization
in recent decades. This growth was to such an extent that the city’s authorities were unable
to provide the required infrastructure and facilities. Therefore, many problems emerged and
a major part of the city’s capital and resources invested to reduce or eliminate these problems
in the past few decades.
Although the city council established in 1999 to pave the way for local government, a unified
local government remained unsolved due to the weak and restricted function of city council
and mayor’s office in the provision of water, sewerage, electricity, education, and so on, all
of which are directly managed by other lines of governmental ministries. From people’s
point of view, the mayor’s office is still a part of the government and its budget should be
provided by the government. Due to such problems and the dependency of urban
management system, particularly the mayor’s office, on oil revenues, the mayor is more
accountable to the government than the council and thus the participation of local
communities has become very low. In addition, due to the unstable of governmental funding
and weak economic base of the city and its financial sustainability, the Kermanshah
municipality faced another problem in relation to the inefficient employees.
According to the resent research, there are twenty three impoverished neighborhoods in
Kermanshah which contained more than 280000 peoples in 2011xv. This means that about
34 per cent of Kermanshah Population are living in such settlements namely as informal
settlements. Apart from the problems associated with quantitative and qualitative aspects of
housing, the main challenges of informal settlements can be related to unemployment, low
income and social problems such as drug, crime and domestic violence. These issues, in
turn, would result in reproduction of poverty and thus acceleration of informal settlement
expansion within the city or in suburb.
The city center of Kermanshah is still suffering from traffic problems associated with the
capacity of urban streets network. Although city authorities tried to do some changes and
reconstruction on some of the streets to ease the car movement to the city center, the
challenge has not as yet been resolved due to the lack of enough budget for property
acquisition, innovative participatory plans and that the Kermansha is still a car-dominated
city. Air pollution is another problem in the city of Kermanshah. The most common sources
of air pollution include the burning of fossil fuels in factories, automobiles and other forms

111
of transportation. In the resent years, however, dust storms became a major source of air
pollution in the city.
According to data provided by Kermanshah Organization of Revitalization and Renovation,
the old and dilapidated areas of the city contained 1228 ha which covers almost 11 percent
of Kermanshah city area. This part of the city can be recognized based on the three factors
of instability, problems of accessibility and impermeability. In addition to the physical
problems, this part also contained some major socio-economic problems including high rate
of unemployment and economic recession, the concentration of low-income and mostly
immigrant households, immigration of original inhabitants, pollution, traffic problems, and
lack of safety and security.
CONCLUDING REMARK
In this article, we have tried to set out the main challenges that the city of Kermanshah faced
in terms of urban development. What it highlights is that Kermanshah faced major
challenges of spatial inequality, lack of a strong formal economic base drove the great
majority of people to live in informal slums and survive in the informal economy, traffic and
urban transportation issues, air pollution and environmental deterioration in urban
development as the results of rapid urbanization, rising urban poverty and lack of well-
governed and managed urban areas. This is mainly exacerbated by the lack of a unified local
government due to the weak and restricted function of the city council and mayor’s office
in the provision of water, sewerage, electricity, education, and so on, all of which are directly
managed by other lines of governmental ministries. This requires visionary leadership with
the ability to adapt to change, skilled management, new sources of funding and financing
for infrastructure and services, strong governance, and long term investment in basic
services to generate sustainable urban environments. This means that the city leader should
goes beyond the duration of their term with a capable urban management team, clear
performance metrics and accountabilities as well as alliances with civil society and business
stakeholders. For fiscal resources, the local government should rely on the local
communities' participation and its capacity by increasing their transparency, responsibility
and accountability. Apart from these, as Hall stated, the technological approach will be
another way to cope with the problem of informal economy which allow poor citizens to get
access to phones, internet and to the outside world for culture and business purposesxvi. The
increased connectivity also improve the capacity of civil society to monitor the governance
of their elected officials while reaching out and discovering best practicesxvii. In addition,
the informal economy should be progressively formalized by strengthening the relationships
with the mainstream economy.
REFERENCES 1 UN-Habitat. Urbanization and Development: Emerging Futures. Nairobi, Kenya, 2016. 1 Alizadeh, Hooshmand. The Challenge of Sustainable Urban Development in Third World Countries.
Designing Soundscape for Sustainable Urban Development. Edited by Östen Axelsson. Stockholm, Sweden:
Environment and Health Administration City of Stockholm, 2010. 1 Ubale, Mohammed Yahaya, David Martin, and Seow Ta Wee. "Examining and Suggesting Remedy to the
Effects of Urban Informal Sector in Urban Residential Property Market in Bauchi, Nigeria." International
Journal of Physical and Human Geography 1, no. 2 (2013): 31-46 1 Majidzadeh, Y. The Beginning of Civilization Ship in Iran. Tehran: University public center, 1998. 1 Mostofi, H. Nazhal Gholob, by the Effort of Mahmoud Dabir Siaghi. Tehran: Tahori library, 1957. 1 Lambton, Ann KS. "The Internal Structure of the Saljuq Empire." The Cambridge History of Iran 5, no .
227 (1968 :)635 ff.

112
1 Mostofi, Nazhal Gholob, 1957. 1 Clarke, John Henrik and Brian Drummond Clarke. Kermanshah: An Iranian Provincial City. University of
Durham, Department of Geography, 1969. 1 The city, best known as the location of the Battle of Karbala (680), is believed to be as holy a city for Shia
Muslims. 1 Calmard, Jean. "Kermanshah Iii: History to 1953." In Encyclopedia Iranica, edited by Ehsan Yarshater .
Columbia University: online edition., 2015. 1 In 1966, the population of Kermanshah Ostan has diminished markedly since the establishment of the separate
Farmandari of Hamadan and Ilam (Clarke & Clarke: 1969: 8). 1 Clarke and Clarke. Kermanshah: An Iranian Provincial City, 1969: 38-39. 1 Mehriar, Mohammad, Shamil Fatholayouf, Farhad Fakhari Tehrani, and Bahram Qaderi. Asnad-E-Tasveri
Shahrha-E Irani (the Old Maps of Iranian Cities). Tehran: Shahid Beheshti University Press, 1998. 1 Clarke and Clarke. Kermanshah: An Iranian Provincial City, 1969: 51. 1 Irandoost, Kayoumars, Hooshmand Alizadeh, and Roholah Tavallaii. "Analyzing the Level of
Development in Rural Areas Using Factor and Cluster Analysis, Case Study: Kurdistan Province." Journal of
Housing and Rural Environment 32, no. 144 (2014): 107-23. http://jhre.ir/article-1-257-en.html. 1 Hall, Peter. Land, Shelter and Transport: The Latin America Way World Bank/IPea Urban Research
Symposium. Brasilia, April, 2005. 1 Freire, Mila. Urban Planning: Challenges in Developing Countries. International Congress on Human
Development, Madrid, 2006.

113
UTM Razak School of Engineering and Advanced Technology
Kuala Lumpur, Malaysia
10th October 2017
SD 5 - AN ASSESSMENT OF QUALITY OF SPACE THROUGH THE
USER’S PERCEPTION TO IMPROVE PHYSICAL ENVIRONMENT
Janjira Sukwai1, Nobuo Mishima2
1Master Student, Graduate School of Regional Design in Arts and Economics, Saga University, Saga, Japan
[email protected] 2Professor Dr, Graduate School of Science and Engineering, Saga University, Saga, Japan
ABSTRACT The user-centered approach has been changing the way of the city and urban planning today. Unlike
a traditional one, this approach begins with an investigation of the place usage and expectation of
the end-users. As the users perceive an environment different from the architectural creators, their
perception depends on purposes and how it could be utilized so that the real needs could be found
there and could lead to efficient solutions. The principal aims of this study including identification a
potentiality of an existing campus environment for further development and suggestion to improve
its quality. This study investigated the perception of campus environment on users with diverse
cultures and backgrounds. A drawing participation method was used to collect data of users’
expectation of the actual physical condition. The result shown campus spaces were used in various
ways. Furthermore, the needs more open and green spaces for studying, recreation, and leisure
activities were reflected. When comparing with an existing physical condition, its quality was
revealed which viewing and accessibility to the spaces should be considered for the improvement.
Further study could explore in more depth and a wide range of users.
Keywords: The user-centered, Environmental perception, A drawing participation method, Quality
of space
INTRODUCTION
People are using and perceiving spaces differently regard to their cultures and experiences
(Loukaitou-Sideris 1995; Fraser et al. 2013) and since people do not directly recognize,
rather they indirectly perceive its quality through the outcome which means to them (Gifford
2002) results in perceiving physical environment in different ways according to different
desires of people. However, the environmental perception of people is useful and can
become more dynamic when considering human activity which could impact on the
environment. Since it can indicate causes, means, and results of the action which relates to
an actual situation of the environment as well as desires and needs for a future situation (Hynek 1985, 174).
In recent day, better approaches to gain ideas and knowledge have been sought from various
fields in order to enhance efficiency in design and planning physical environment. On the
one hand, it has been done by evaluating quality of existing physical conditions through

114
various tools and assessments in many studies such as visual assessment, field survey, etc.
(see Wells and Evans 2003; Ulrich 1984) while many studies have moved beyond
knowledge of scholars to gain ideas from the user through participatory approach in order
to reassure that the real and mutual needs are reached. As people are living there and using
its resources, they know how to use and organize resources through the perception of
utilization from the past (Whyte 1977, 14). Thus, it could be achieved with a dialogue of the
inhabitants since cities are best to understand by its people and people know what and how
their city can serve them. As Jacobs (1961) asserted in her famous book ‘The death and life
of great American cities’ – “City have the capability of providing something for everybody,
only because, and only when they are created by everybody.” (p. 238). As the result, the
efficiency of design and planning should be based on people and it is necessary to understand
users’ perceptions, preferences, and images of themselves and other users in their present
and desired environment because this reflection of the end user can indicate the efficiency
of planning (Aitken et al. 1989 cited in Fenster 2014). Moreover, associating with physical
condition assessment may lead a significant determinant to become more explicitly.
As a community, ‘Campus’ is like a small city. It is sharing a similarity of city’s socio-
physical system, consisting physical elements; buildings, roads, and spaces, and providing
functions of living and working as cities. Nowadays, an academic institution has gone
beyond a place of teaching and learning facilities to considering on campus life by providing
physical spaces for their diverse inhabitants to use in order to make them feel they
experience a good quality of life. However, the place usage may not just occur alone since
it has a strong relationship with quality of physical environment which is consist of;
Accessibility, Availability, Safe and Comfort, and Viewing (Gehl 1996; Whyte 2004; Lang
2005). In a logical sense, the place usage is directly influenced by the quality of a physical
environment, for instance, people will attempt to use a particular place more frequently if
they perceive it's a better quality. As the result, the perception of the user should be
understood due to it is essential and it can produce useful information which could reflect
the real needs of the user and could be incorporated into design and decision-making in order
to improve the physical condition of the environment. In this paper, the physical conditions
assessment will be performed simultaneously with an art participatory drawing of students
(the predominant user of a place) to determined and compared the quality of space as the
environmental perception in the campus environment.
METHODS
Site of Study
In this paper, we used Saga University, Honjo campus, located in Saga Prefecture, Japan as
a site of study. In the campus area, consists of various buildings for education and
administration, outdoor spaces, and natural greenspace. For greenspace area, there are
different size of green spaces scattering all over the campus area. However, there is only one
large greenspace located in the middle of the campus area. This greenspace is adjacent to
the main cafeteria and the main road and has a small canal pass along at one side which the
canal serves as a boundary line separate the area with a tennis court. This greenspace
performs as the main green area providing space for leisure, recreation, and social activities
for campus inhabitants while providing greenery vision for the passerby. In terms of the policy of the university, like other universities, its policy of
internationalization has brought students from all over the world living together in one place.
As the policy has brought multicultural atmosphere into campus, it is beneficial to all
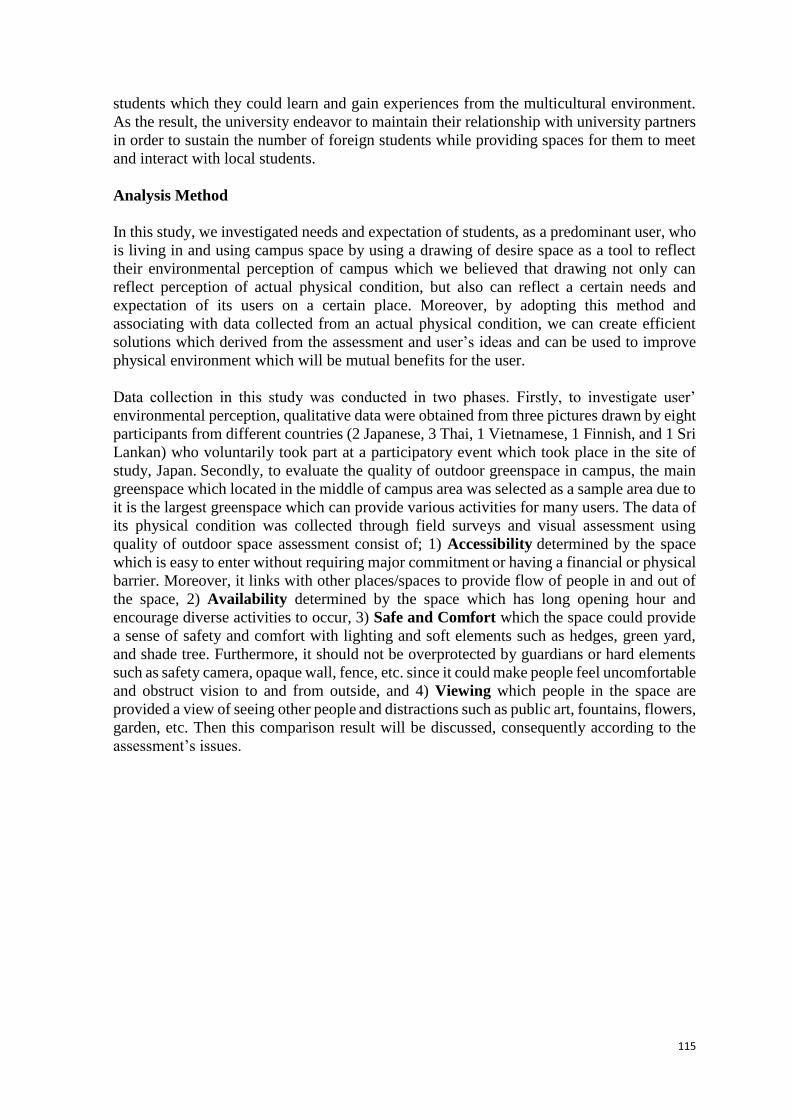
115
students which they could learn and gain experiences from the multicultural environment.
As the result, the university endeavor to maintain their relationship with university partners
in order to sustain the number of foreign students while providing spaces for them to meet
and interact with local students.
Analysis Method
In this study, we investigated needs and expectation of students, as a predominant user, who
is living in and using campus space by using a drawing of desire space as a tool to reflect
their environmental perception of campus which we believed that drawing not only can
reflect perception of actual physical condition, but also can reflect a certain needs and
expectation of its users on a certain place. Moreover, by adopting this method and
associating with data collected from an actual physical condition, we can create efficient
solutions which derived from the assessment and user’s ideas and can be used to improve
physical environment which will be mutual benefits for the user.
Data collection in this study was conducted in two phases. Firstly, to investigate user’
environmental perception, qualitative data were obtained from three pictures drawn by eight
participants from different countries (2 Japanese, 3 Thai, 1 Vietnamese, 1 Finnish, and 1 Sri
Lankan) who voluntarily took part at a participatory event which took place in the site of
study, Japan. Secondly, to evaluate the quality of outdoor greenspace in campus, the main
greenspace which located in the middle of campus area was selected as a sample area due to
it is the largest greenspace which can provide various activities for many users. The data of
its physical condition was collected through field surveys and visual assessment using
quality of outdoor space assessment consist of; 1) Accessibility determined by the space
which is easy to enter without requiring major commitment or having a financial or physical
barrier. Moreover, it links with other places/spaces to provide flow of people in and out of
the space, 2) Availability determined by the space which has long opening hour and
encourage diverse activities to occur, 3) Safe and Comfort which the space could provide
a sense of safety and comfort with lighting and soft elements such as hedges, green yard,
and shade tree. Furthermore, it should not be overprotected by guardians or hard elements
such as safety camera, opaque wall, fence, etc. since it could make people feel uncomfortable
and obstruct vision to and from outside, and 4) Viewing which people in the space are
provided a view of seeing other people and distractions such as public art, fountains, flowers,
garden, etc. Then this comparison result will be discussed, consequently according to the
assessment’s issues.
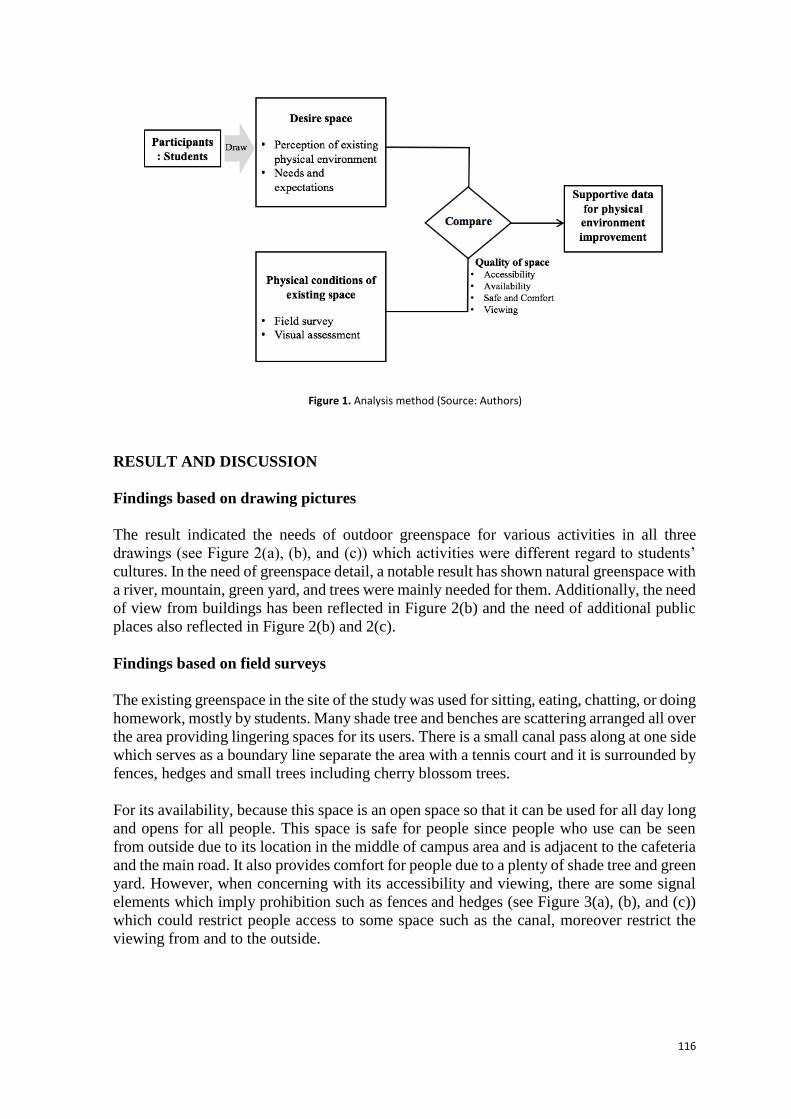
116
RESULT AND DISCUSSION
Findings based on drawing pictures
The result indicated the needs of outdoor greenspace for various activities in all three
drawings (see Figure 2(a), (b), and (c)) which activities were different regard to students’
cultures. In the need of greenspace detail, a notable result has shown natural greenspace with
a river, mountain, green yard, and trees were mainly needed for them. Additionally, the need
of view from buildings has been reflected in Figure 2(b) and the need of additional public
places also reflected in Figure 2(b) and 2(c).
Findings based on field surveys
The existing greenspace in the site of the study was used for sitting, eating, chatting, or doing
homework, mostly by students. Many shade tree and benches are scattering arranged all over
the area providing lingering spaces for its users. There is a small canal pass along at one side
which serves as a boundary line separate the area with a tennis court and it is surrounded by
fences, hedges and small trees including cherry blossom trees.
For its availability, because this space is an open space so that it can be used for all day long
and opens for all people. This space is safe for people since people who use can be seen
from outside due to its location in the middle of campus area and is adjacent to the cafeteria
and the main road. It also provides comfort for people due to a plenty of shade tree and green
yard. However, when concerning with its accessibility and viewing, there are some signal
elements which imply prohibition such as fences and hedges (see Figure 3(a), (b), and (c))
which could restrict people access to some space such as the canal, moreover restrict the
viewing from and to the outside.
Figure 1. Analysis method (Source: Authors)
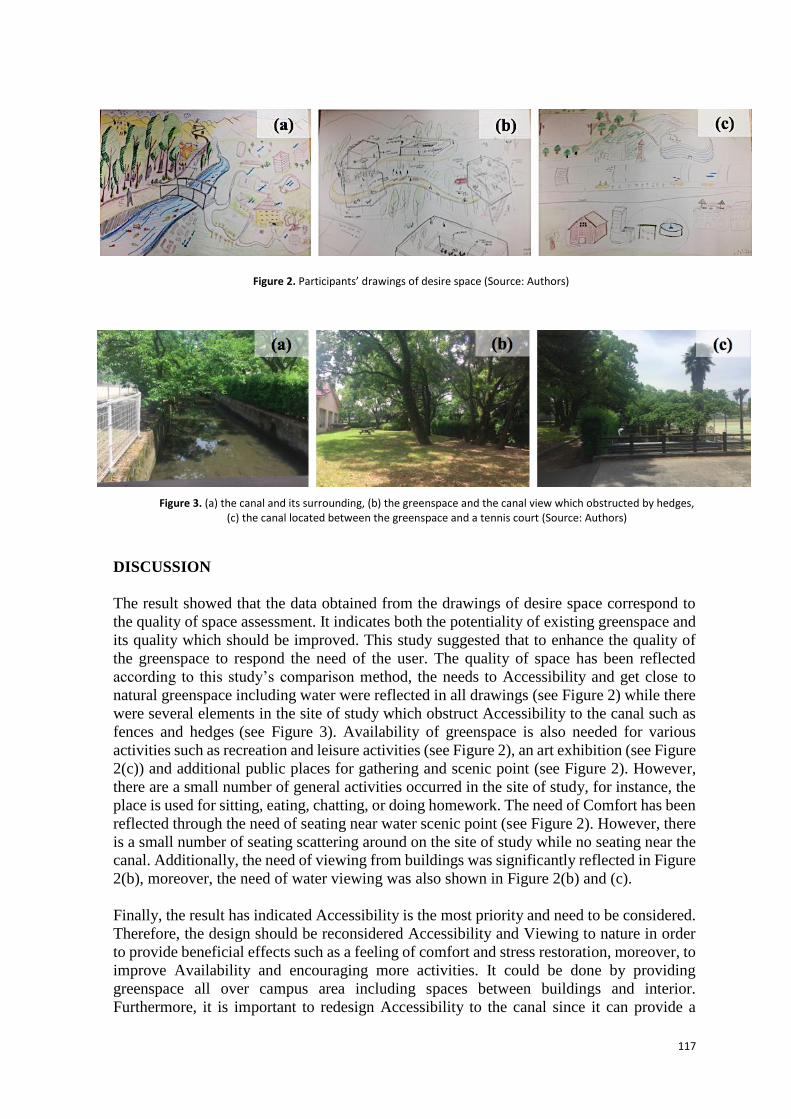
117
DISCUSSION
The result showed that the data obtained from the drawings of desire space correspond to
the quality of space assessment. It indicates both the potentiality of existing greenspace and
its quality which should be improved. This study suggested that to enhance the quality of
the greenspace to respond the need of the user. The quality of space has been reflected
according to this study’s comparison method, the needs to Accessibility and get close to
natural greenspace including water were reflected in all drawings (see Figure 2) while there
were several elements in the site of study which obstruct Accessibility to the canal such as
fences and hedges (see Figure 3). Availability of greenspace is also needed for various
activities such as recreation and leisure activities (see Figure 2), an art exhibition (see Figure
2(c)) and additional public places for gathering and scenic point (see Figure 2). However,
there are a small number of general activities occurred in the site of study, for instance, the
place is used for sitting, eating, chatting, or doing homework. The need of Comfort has been
reflected through the need of seating near water scenic point (see Figure 2). However, there
is a small number of seating scattering around on the site of study while no seating near the
canal. Additionally, the need of viewing from buildings was significantly reflected in Figure
2(b), moreover, the need of water viewing was also shown in Figure 2(b) and (c).
Finally, the result has indicated Accessibility is the most priority and need to be considered.
Therefore, the design should be reconsidered Accessibility and Viewing to nature in order
to provide beneficial effects such as a feeling of comfort and stress restoration, moreover, to
improve Availability and encouraging more activities. It could be done by providing
greenspace all over campus area including spaces between buildings and interior.
Furthermore, it is important to redesign Accessibility to the canal since it can provide a
Figure 2. Participants’ drawings of desire space (Source: Authors)
Figure 3. (a) the canal and its surrounding, (b) the greenspace and the canal view which obstructed by hedges, (c) the canal located between the greenspace and a tennis court (Source: Authors)

118
feeling of comfort and people can get benefit from it by just looking or touching of the nature
(Whyte 2004).
CONCLUSION
This paper presents the correspondence between data obtained from field surveys of quality
of outdoor greenspace in the campus environment and the data drawings of participants’
desire space which can reflect the users’ perception of the physical environment and their
needs and expectation. This can be used in improving existing physical conditions according
to the assessment.
The result from the drawings has also shown the human needs of the natural environment
and accessible to the greenspace. As they can perceive benefits from nature which can
strengthen their physical and mental health. In addition, its beneficial effect to reduce stress
from working and studying and recovery from fatigue (Ulrich 1984; Kaplan 1989) so that
an explanation of the need of natural environment can be explained here.
The result from this study reflected the requirement of people who live in the same
environment which may help planner and designer to pursuit the real need of the community.
This requirement may very simple and could derive from the dialogue of the end users.
When associating with the assessment of actual physical condition, it can help to identify a
significant determinant with more precisely and leads to better solutions to improve its
quality. Therefore, to enhance design achievement, it is important to facilitate user
participation in order to ensure that it could meet the real needs and virtually utilize the users.
Our analysis reveals how the perception of users can reflect their real needs which are useful
and can be used to support in designing and planning process. However, there are various
participation methods which could combine with the visual assessment to achieve this goal.
Further studies should be done in more depth and a wide range of users which will benefit
and be meaningful for all.
ACKNOWLEDGEMENT
We would like to thank the cohort of students who took part in the participatory event for
their time and agree to participate in this study. We sincerely appreciate with their
collaboration and supportive data.
REFERENCES
Fenster, Tovi. 2014. The Global City and the Holy City: Narratives on Planning Knowledge and
Diversity. New York: Routledge.
Fraser, Danae Stanton, Tim Jay, Eamonn O’Neill, and Alan Penn. 2013. "My Neighbourhood:
Studying Perceptions of Urban Space and Neighbourhood with Moblogging." Pervasive
and Mobile Computing (ELSEVIER) 9: 722-737.
Gehl, Jan. 1996. Life Between Buildings: Using Public Space. Translated by Jo Koch. Copenhagen:
Arkitektens Forlag.
Gifford, Robert. 2002. Environmental Psychology: Principles and Practice. 3rd Edition. Optimal
Books.
Hynek, A. 1985. "Environmental Perception." SCRIPTA FAC. SCI. NAT. UNIV. PURK. BRUN. 15
(3): 171-180.
Jacobs, Jane. 1961. The Death and Life of Great American Cities. New York, Harmondsworth:
Random House.

119
Kaplan, Stephen. 1995. "The Restorative Benefits of Nature: Toward an Integrative Framework."
Journal of Environmental Psychology (Academic Press Limited) 15: 169-182.
Lang, Jon. 2005. Urban Design: A Typology of Procedures and Products. Oxford: ELSEVIER.
Loukaitou-Sideris, Anastasia. 1995. "Urban Form and Social Context: Cultural Differentiation in
the Uses of Urban Parks." Journal of Planning Education and Research (SAGE) 14: 89-
102.
Lynch, Kevin. 1960. The Image of the City. London: The MIT Press.
Ulrich, Roger S. 1984. "View through a window may influence recovery from surgery." Science
(American Association for the Advancement of Science) 224 (4647): 420-421.
Wells, Nancy M, and Gary W Evans. 2003. "Nearby Nature: A Buffer of Life Stress Among Rural
Children." ENVIRONMENT AND BEHAVIOR (Sage Publications) 35 (3): 311-330.
Whyte, Anne V.T. 1977. Guidelines for Field Studies in Environmental Perception. Paris: The
United Nations Educational, Scientific and Cultural organization.
Whyte, William H. 2004. The Social Life of Small Urban Spaces. 3rd Edition. Michigan: Project
for Public Spaces.
120
UTM Razak School of Engineering and Advanced Technology
Kuala Lumpur, Malaysia
10th October 2017
SD 15 - SOCIAL CAPITAL AMONG AGEING RESIDENTS OF
HOUSING COMPLEXES IN SUBURBAN TOKYO – THE CASE OF
HARAICHI-DANCHI AND OYAMADAI-DANCHI IN AGEO CITY
Nadhirah Nordin*, Hitoshi Nakamura
Division of Architecture and Civil Engineering, Graduate School of Engineering and Science,
Shibaura Institute of Technology, Tokyo, JAPAN.
([email protected], [email protected])
ABSTRACT
Globally, developed nations such as Japan are currently facing an ageing population. The
health and social care system in the living environment for the elderly population in Japan
is important to develop strong social ties and social networks that can connect the elderly
people and promote active ageing. This paper aims to identify the extent of social capital
among the ageing population in Haraichi-danchi and Oyamadai-danchi, which are housing
complexes located in Ageo City, a suburb of Tokyo. The people in the 60s and 70s age
groups are focused on in this paper. A questionnaire survey, divided into three parts; the
basic attributes of the residents, the elements of bonding social capital and bridging social
capital was conducted. Then, cross-tabulations were done between age groups and both the
social capital categories. Next, chi-square and further post-hoc analyses were conducted to
determine the strongest association between the variables. The results show significant
association between the 60s and 70s age groups for both bonding and bridging social capital.
The variation of results may be influenced by the physical environment of the housing
complexes that they are living in now. Future research on the physical environment of
housing complexes that influences the community’s social capital will be conducted.
Key words: Super-aged society, active ageing, social capital, housing complexes, suburban
INTRODUCTION
Japan, as one of the world’s developed nations, has seen the percentage of its elderly
population (aged 65 and older) increase from 19.8% in 2005 to 26.3% in 2015 (World Bank,
2016), thus making it the country with the highest ratio of ageing population, against the
country’s total population in the world. To cater to this trend, a shift towards focusing on
planning for the ageing population in all sectors of development is needed such as social,
health and even the physical built environment. This study will focus on the extent of social
capital among the ageing population in Haraichi-danchi and Oyamadai-danchi, which are
housing complexes located in Ageo City, a suburb of Tokyo. Social capital in the ageing
society is important to promote active ageing (Aminjafari et al., 2016). Thus, it is important
to create a strong social capital, which can be further understood by the three main domains
by Putnam (2000), which are bonding, bridging and linking social capital. Bonding is
associated with the relationship between the community members with the same

121
demographic characteristics and socio-financial positions (Babaei et al., 2012), which often
includes family and friend relationships (Twigger-Ross et al., 2003). Bridging social capital,
is based on the connections between community members that do not have similar
characteristics such as age, socio-economic status, ethnicity; and education (Szreter &
Woolcock, 2004). Babaei et al. (2012) defined linking social capital as the linking
relationship among groups or individuals with power, authority, and access to key resources,
especially in situations such as formal decision-making processes. This paper focuses only
on two elements of social capital which are bonding and bridging. Table 1 below shows the
detailed classification.
Table 1. Classification of bonding and bridging social capital context Bonding Social Capital Bridging Social Capital
Presence of reliable person
Relationship with neighbours
Communication exchanges between
neighbours
Necessity for communication exchanges in
housing complexes
Participation in neighbourhood association
Recognition on neighbourhood association activities
Necessity to join neighbourhood association
Experience of stairs committee*
Participation in volunteering activities
Participation in disaster prevention training
Awareness on voluntary disaster prevention training
*Stairs committee: A small informal floor committee in each blocks of the housing
complexes
Two housing complexes, Haraichi-danchi and Oyamadai-danchi, were chosen as the
research sites; these are public housing complexes constructed and managed by the Urban
Renaissance (UR) agency in Japan. Located in Ageo City of Saitama Prefecture, currently
there are approximately 2,781 residents and 1,532 households in Haraichi-danchi and
approximately 3,005 residents and 1,741 households in Oyamadai-danchi. The two housing
complexes were chosen as research site because the percentage of elderly residents out of
the total residents was quite high in both, about 35.3% and 41.2%, respectively. Danchi
means housing complex in Japan, and the main feature of the 5-storey housing complexes
was that no elevators were provided in them. Hence, there was no need for outer or inner
corridors connecting all apartment units on a floor, so outer staircases were built to connect
two apartment units on one floor.
For this paper, the age groups involved are the 60s and 70s age groups which are considered
as young-old and old-old age groups, respectively. The age group of 80s is not included
because of the limited number of respondents in this age group in both the housing
complexes. A questionnaire survey was conducted and divided into three parts; the basic
attributes of residents, the elements of bonding social capital and bridging social capital. In
the analysis stage of the study, cross-tabulation was done between the two variables of the
elderly age group and the social capital attributes, bonding and bridging. Then, chi-square
analyses were conducted to know whether the two attributes were associated. The next step
involves further post-hoc analyses, which obtain the adjusted residuals to know which
combination in the cross-tabulation has the strongest association.
MAIN RESULTS
From the analyses, significant associations were found for both bonding and bridging among
the 60s and 70s age groups in both the housing complexes. For bonding social capital, the
people in the 60s age group tended to have at least one person to rely on. They greeted their
neighbours on a daily basis. The people in the 70s age group tended to have several people
to rely on and tended to chat with their neighbours on a daily basis.

122
For bridging social capital, those in the 60s age group joined the neighbourhood association,
participated in volunteer activities, had experienced being members of the stairs committee
and had the desire to participate in disaster prevention training if it was convenient for them
to spare time. For those in the 70s age group, even though there was no significant
association found for joining the neighbourhood association, they tended to know very well
about the activities conducted by the association and they thought that it was necessary to
join the association. Similar to the people in the 60s age group, the people in the 70s age
group also had experienced being members of the stairs committee. From the main results
obtained, it is understood that most people in their 60s and 70s tended to show some
significant bonding and bridging social capital; however this was not always the case for
both Haraichi-danchi and Oyamadai-danchi.
The major similarities among adults in the two housing complexes were that the people in
their 60s tended to participate more in bridging activities and those in their 70s tended to
have several people to rely on for bonding social capital. On the contrary, the major
differences between the two housing complexes is that the people in their 70s in Haraichi-
danchi tended to be aware of the community activities conducted, even though they did not
join the association, whereas the people in their 70s in Oyamadai-danchi did not show any
significant association for bridging social capital.
CONCLUSION
In conclusion, this research has achieved its purpose of distinguishing the distinct features
of elderly groups in Haraichi-danchi and Oyamadai-danchi. From the significant similar
findings observed in Haraichi-danchi and Oyamadai-danchi, further investigation on how to
strengthen the bonding and bridging social capital, especially among the groups of people
in their 60s and 70s, in both housing complexes by looking in terms of physical
neighbourhood environment can be conducted. Thus, future research on the physical
neighbourhood environment that influences the community’s social capital especially
among the ageing population needs to be conducted.
REFERENCES
Aminjafari, B., Aghajani, H. & Hashemianfar, A., (2016). A Sociological Explanation of Active Aging with
Emphasizing on Social Capital in Isfahan City. International Journal of Social Sciences, Vol. 6, No. 3,
15-25.
Babaei, H., Ahmad, N. & S.Gill, S., (2012). Bonding, Bridging and Linking Social Capital and Empowerment
among Squatter Settlements in Tehran, Iran. World Applied Sciences Journal 17 (1), 119 – 126.
Putnam, R. (2000) Bowling Alone: The Collapse and Revival of American Community, New York, Simon &
Schuster.
Szreter, S. and Woolcock, M. (2004). Health by Association? Social Capital, Social Theory and the Political
Economy of Public Health. International Journal of Epidemiology, 33 (4), 650 – 670.
Twigger-Ross, C., Bonaiuto, M., & Breakwell, G. (2003). Identity theories and environmental psychology. In
Bonnes, M., Lee, T., Bonaiuto, M. (eds) Psychological theories for environmental issues. Ashgate:
Aldershot.
World Bank (2016). Data on population ages 65 years and above in Japan.
123
UTM Razak School of Engineering and Advanced Technology
Kuala Lumpur, Malaysia
10 October 2017
SD17 - MALAYSIA EFFORTS IN TRANSFORMING MELAKA INTO
RESILIENT CITY
Intan Syafinar Jamaludin, Noralfishah Sulaiman
KANZU Research: Resilient Built Environment (RBE), Department of Real Estate, Faculty of
Technology Management & Business, University Tun Hussein Onn Malaysia (UTHM), 86400,
Johor, Malaysia
([email protected], [email protected])
ABSTRACT
Asia experienced 70% of all the disaster in the world and there is no indication that this will
decrease in the future. The disaster experienced by a city mostly caused by combination and
collision of climate change, urbanization, social-economic instability, terrorism, natural
disaster, cyber-attack, poverty, endemic outbreak and etc. Subsequently the disasters faces
by a city can be further divided into acute shocks where sudden disaster happen
unexpectedly and threaten the city, and chronic stresses where tension situations occur on
daily basis and weaken the city operation. The crisis stumbled upon a city has captured
attention of many audiences, thus in order to conquer the issues, city needs to be resilient in
order to face and overcome the situation. Government and state government are responsible
to manage city in order to prepare the city capacity so it will be able to endure, adapt, recover
and grow despite of any shock and stress it encountered. This paper will discuss the efforts
taken by Malaysia in transforming and preparing Melaka into resilient city.
Key words: Climate change, Urbanization, Resilience city, Malaysia, Melaka
INTRODUCTION
Resilience has appeared as a new buzz word and one of the most important research topics
in the context of achieving sustainability (Kates et al., 2001; and Foley et al., 2005) in the
development of organisations to withstand upcoming uncertainty of the world. As described
in the oxford dictionary, resilience is “ability to withstand or recover quickly from difficult
condition” (Oxford, 2016). The concept of resilience for urban environment or city
development as defined by The Rockefeller Foundation is “the capacity of individuals,
communities, institutions, businesses, and systems within a city to survive, adapt, and grow
no matter what kinds of chronic stresses and acute shocks they experience”
(100ResilientCities, 2016).
In the context of cities, resilience has helped to bridge the gap between disaster risk reduction
and climate change adaptation. It moves away from traditional disaster risk management,
which is founded on risk assessments that relate to specific hazards. Instead, it accepts the
possibility that a wide range of disruptive events – both stresses and shocks – may occur but
are not necessarily predictable. Resilience focuses on enhancing the performance of a system

124
in the face of multiple hazards, rather than preventing or mitigating the loss of assets due to
specific events (100ResilientCities, 2016).
As recorded in the Global Risks report (2016), the world we are living on facing issues of
climate change, social instability, unmanageable inflation, large scale involuntary migration,
biodiversity loss, terrorism, and so forth. It is forecasted that countries like Asia are likely
to experience major natural catastrophes with extreme weather events (World Economic
Forum, 2016). The most shocking issues Melaka facing are depleting environmental
resource as it is being jeopardized to accommodate with the urban expansion. Melaka urban
development has brought consequences associated with coastal erosion, flash flood,
landslide and air pollution (Gary et al., 2014); and another issue is air pollution resulting
from transportation sector, industrial emission and open burning (ASEAN, 2012).
The series of natural disaster take place in Malaysia have prepares Malaysia Government to
embark into resilience concept. Cities such as Putrajaya, Melaka and Wilayah Persekutuan
Kuala Lumpur were nominated as part of role model cities in Making Cities Resilient
Campaign (MCRC) (UNISDR, 2011). The MCRC was launched by The United Nations
Office for Disaster Risk Reduction (UNISDR) together with local partners (local
governments and authorities) with aims to raise awareness of resilience and disaster risk
reduction among the local governments and communities (UNISDR, 2005).
In this paper the researcher will discuss on the efforts taken by Malaysian government to
transform Melaka into a resilient city in particular to analyse the initiatives taken by local
authority of Melaka in making Melaka a resilient city. The output of the research would be
beneficial to the state of Melaka redundant in the context of local authority in preparing for
integrated strategy plans and to manage Melaka urban development in becoming resilient
from any future disaster risks.
MATERIALS AND METHODS
This study used qualitative analysis. Data collected are based on document analysis. The
document being used includes government policies, Malaysia national plans, newspaper and
relevant previous research.
FINDING
The government of Malaysia has taken the initiatives toward resilient approach by
participating and involving in a series of international sustainable action plan and disaster
mitigation plan such as Millennium Development Goals (MDGs), Sendai Framework for
Disaster Risk Reduction 2015-2030, 2030 Agenda for Sustainable Development, Hyogo
Framework for Actions (HFA), and etc. (EPU, 2016).
In the national level, as shown in Table 1, Malaysia has initiated parallel operation with
Malaysia Plan by executing policies and action plans. It is to improve nation’s readiness in
managing, preparing and mitigating issues of overpopulation, environmental degradation,
structural failures and natural disaster in order to increase nation’s resiliency against the
unforeseen impacts.
Table 1: Malaysia’s Initiatives towards Resilient City

125
No. Initiatives Involved Year
1. Third – Eleven Malaysia Plan 1976 - 2020
2. National Climate Change Policy 2009
3. KL Action Plan 2009
4. National Green Technology Policy (NGTP) 2009
5. Low Carbon Cities Initiatives (LCCI) 2010
6. Land Use Planning Appraisal for Risk Areas 2005
7. National Physical Plan 2005 - current
8. National Security Council Directive no. 20 2005
Among the policies National Green Technology Policy and Low Carbon Cities Initiatives
are initiated with main objectives to reduce carbon emissions by promoting low carbon
transport, infrastructure and green technology in order to conserve environment, enhance
national economy and improve quality of life (MNRE, 2009). While National Climate
Change Policy integrate national plans and policies to strengthen the resilience of
development from the climate change impact and to reduce adverse effect of climate change
(MNRE, 2009). In all the previous (2006 – 2015) Malaysia Plan, government emphasized
on managing environmental distress due to climate change, and in the latest Eleventh
Malaysia Plan (2016-2020) government strengthening environment for climate resilient
development and resilience development against climate change and natural disasters (EPU,
2016).
The launching of MCRC in 2011 has also brought the adoption of Melaka Declaration on
Disaster Risk Reduction (DRR) by state government of Melaka with main objectives to
incorporate climate change adaptation and reduction of disaster risk, communities’
involvement, and build resilience at the local level. That embarked the journey of Melaka
development toward resilient development. Later on in 2014, Melaka engaged and consult
with International Council for Local Environmental Initiatives (ICLEI) – Local Council
for Sustainability (shown in Table 2) in order to promote local action for sustainability and
sustain cities in becoming resilient. While in 2016, Malacca was chosen to participate in the
100 Resilient Cities Programme organized by Rockefeller Foundation, of which the program
will prepare and help cities to build resilience to the economic, social and physical
challenges encountered by cities (100RC, 2016).
As shown in Table 2, Melaka also initiated series of green initiatives such as Green
Technology City Blueprint, Melaka Green City Action Plan and Green House Emission
Inventory Report with the purpose mainly to assess city performance, educate public about
climate change, global warming, green technology and green practices (Gary et al., 2014).
Table 2: Melaka’s Initiatives toward Resilient City
No. Initiatives Involved Year
1. Melaka Declaration on Disaster Risk Reduction (DRR) 2011
2. Green Technology City Blueprint 2011
3. United Nations Urban Environmental Accords 2012
4. Melaka Green City Action Plan 2012
5. ICLEI – Local Council for Sustainability 2014
6. Green House Emission Inventory Report 2015
7. 100 Resilient Cities 2016
CONCLUSION
126
Melaka was listed as UNESCO heritage site. However with the current urban expansion and
development has jeopardize the state with resource depletion, flooding, water borne
diseases, coastal erosion and ecological disruptions. Therefore Melaka government has
initiated resilient development programme by adopting series of strategies such as disaster
risk reduction programme, ICLEI – Local Council for Sustainability, 100 Resilient Cities,
and local plans and policies. The main interest is to bring the context of resilient city into
Melaka by reducing the gap between disaster risk reduction and climate change adaptation.
Even though there are series of initiatives taken by Melaka Government, there is still a need
for resilient city framework that integrate urban system in a holistic manner which includes
governance, health and wellbeing, economic and social, and infrastructure and environment.
The resilient city framework will then assist Melaka to assess the extent of their resilience,
ascertain areas of weaknesses and to classify plans to enhance Melaka urban resiliency.
REFERENCES
100ResilientCities (2016). Retrieved November 2, 2016 from http://www.100resilientcities.org/
ASEAN (2012). Clean air for smaller cities in the ASEAN region – Melaka clean air road map. Retrieved July
27, 2017, from www.citiesforcleanair.org
Federal Town and Country Planning Department of Peninsular Malaysia (2015). Initiatives and policy
directions in making cities resilient. Retrieved April 20, 2016, from www.mip.org.my/doc/Dahlia.pdf
Foley, J. A., R. DeFries, G. P. Asner, C. Barford, G. Bonan, S. R. Carpenter, F. S. Chapin, M. T. Coe, G. C.
Daily, H. K. Gibbs, J. H. Helkowski, T. Holloway, E. A. Howard, C. J. Kucharik, C. Monfreda, J. A.
Patz, J. C. Prentice, N. Ramankutty, and P. K. Snyder (2005). Global consequences of land use.
Science 309:570-574.
Gary Krishnan, Sonia Chand Sandhu and Amit Prothi (2014). Green city action plan: A framework for green
actions. Retrieved on January 7, 2017, from
https://www.adb.org/sites/default/files/related/41571/imt-gt-green-city-action-plan-melaka-april-
2014.pdf
Kates, R. W., W. C. Clark, R. Corell, J. M. Hall, C. C. Jaeger, I. Lowe, J. J. McCarthy, H. J. Schellnhuber, B.
Bolin, N. M. Dickson, S. Faucheux, G. C. Gallopin, A. Grübler, B. Huntley, J. Jäger, N. S. Jodha, R.
E. Kasperson, A. Mabogunje, P. Matson, H. Mooney, B. Moore III, T. O’Riordan, and U. Svedin
(2001). Sustainability science. Science 292:641-642
Ministry of Natural Resources and Environment Malaysia. (2009). National policy on climate change.
Retrieved April 3, 2016, from http://www.nre.gov.my/ms-
my/PustakaMedia/Penerbitan/Dasar%20Perubahan%20Iklim%20Negara.pdf
Oxford Dictionary (2016). Retrieved April 2, 2016, from https://en.oxforddictionaries.com/definition/resilient
The United Nation Office for Disaster Risk Reduction (2011). Malaysia commits to maintain safety of cities,
schools and hospitals in lead-up to 2011 Global Platform on Disaster Risk Reduction. UNISDR.
Retrieved October 30, 2016, from http://www.unisdr.org/files/18058_brf20110219fin.pdf
The United Nations Office for Disaster Risk Reduction (2005). Retrieved October 31, 2016, from
http://www.unisdr.org/campaign/resilientcities/home/about
World Economic Forum (2016). Global Risks 2016. Retrieved on 26 December, 2016 from www.weforum.org

127
UTM Razak School of Engineering and Advanced Technology
Kuala Lumpur, Malaysia
10th October 2017
SD 21 - THE INFLUENCE OF NEEDS IN THE SHELTER DESIGN OF
THE EXTREME POOR: CASE STUDY OF PADANG JAWA,
SELANGOR & BUTTERWORTH, PENANG
Iryani Abdul Halim Choo*1, Zaharah Yahya2, Suzana Said1, Nazrul Helmy
Jamaludin1
Department of Architecture, Faculty of Architecture, Planning and Surveying, Universiti Teknologi MARA
Perak
([email protected]; [email protected]; [email protected]) 2 Department of Architecture, Faculty of Architecture, Planning and Surveying, Universiti Teknologi MARA
Kampus Puncak Alam, Selangor
ABSTRACT One of the dilemma that has been clouding over the issue of low cost housing in Malaysia
nowadays is concerning the space design. The space layout had been solely designed to only
emphasize on minimizing the area. Regardless of space quality, this design caters only to a
standard space requirement & area without considering the real needs of this “constraint”
poor family. This research attempts to identify the basic needs of the extreme poor in
influencing the existence and layout of spaces in their self-built home. The strategy adopted
for this research is the case study. Three sample cases were selected at three different houses
and the study was conducted through observations and interviews in generating the data.
This research concluded with the finding that the evolution and distribution of spaces in the
house centered towards occupying the most basic needs, where each space has been fully
maximized and manipulated in function purely to cater the two utmost basic needs of the
households, which are– shelter and food. Hybrid space of the living area evolves due to
space constraint and financial limitation. Each space and layout of the house have a strong
connection between one space to another, making it meaningful and functional. Driven by
the rule of need, home is modestly self-built using recycled materials adapted from various
sources. Keywords: space layout, extreme poor, role of needs, self-built, evolution, hybrid space
INTRODUCTION
Cambridge dictionary defines poverty as “the condition of being extremely poor” (Poverty,
n.d). As to the current global poverty rate, Globalissuenetwork, reported that there are 1.2
billion people living in abject poverty that live on less than $1(MYR 4.41) a day
(Globalissuenetwork, 2017). Poverty or abject poverty is a problem faced by almost all
developing countries around the globe. Malaysia is not exceptional in facing this problem.

128
According to the Implementation Coordination Unit, (2011) based on National Poverty
Information System (e-kasih), poverty status in Malaysia is based on Poverty Line Index
(PLI) and PGK per kapita isi rumah that were set by Economic Planning Unit (EPU). Razali,
(2015) explained further in his article that Povery Line Index (PLI) is defined as sufficient
income that enables the household to occupy basic needs such as food. Poverty is
categorized into three(3) categories as per table below :
Table 1.0(1) : Poverty category based on Poverty Line Index (PLI).
No. Category Guideline
1. Abject Poor (Miskin Tegar)
Group that earns less :
MYR 430 for east peninsula
MYR 540 for Sabah
MYR 520 for Sarawak
2. Poor (Miskin)
Group that earns less :
MYR 720 for east peninsula (MYR 163 per capita)
MYR 960 for Sabah (MYR 184 per capita)
MYR 830 for Sarawak (MYR 180 per capita)
3. Easy Poor (Mudah Miskin)
Group that earns more than PLI below than threshold :
MYR 1500 for urban area
MYR 1000 for rural area
Sources : Implemenation Coordination Unit, (2011)
One of the effort extended by the government to help the poor is through providing low cost
housing. One of the dilemma that have been over the issue of low cost housing nowadays is
concerning the space design. The space layout had been solely designed to only emphasize
on minimizing the area. A recent study shows that a low cost flat sized at only 600sqft,
(Hajizan, 2015). Regardless of space quality, this design caters only to a standard space
requirement & area without considering the real needs of this “constraint” poor family.
Hajizan stated that due to this insensitivity, this has eventually become a catalyst towards
uncountable social problems that cause by the incommodious, tight space (Hajizan 2015).
This paper focuses on the study of space of the dwellings/ shelter of the abject poor. The
main aim is to study the relationship between the basic needs of this group in determining
space where home is self-built utilizing the recycled and natural materials in sustaining a
living. According to this basis, spaces within the shelter are crafted according to the basic
needs, the hierarchy of the needs, the priority of each of these needs in their everyday life,
the needs of having a shelter and other basic needs such as food, living and sleeping. The
research focuses on strengthening a methodological approach in order to establish a
framework that becomes a comprehensive tool in understanding the influence of needs
towards the layout of spaces and the hierarchy of space importance.
Significance and the Role of Needs in Influencing the existence of spaces
Needs play an important role in formation of spaces as people order their daily activities and
interaction within the built forms that they have created. Kovtun emphasizes that needs are
the cause of human activities which contribute to the formation of function and features of
a usable architectural space (Kovtun, 2014). Architecture is as well a form of happiness, a
reminder of cultural values and spatial values is purely about the awareness of needs (de
Botton A., The Architecture of Happiness,2007 cited in Kovtun, 2014). Humans satisfy their
needs in the hope of becoming better than before. In association with architecture, needs can
be categorized into 2(two) categories which are primary needs and higher needs (Kovtun,
2014). Primary needs cover the aspect of physiological and biological needs – the needs of
preservation of life and procreation. Preservation of life means protection from external

129
dangers imposed by natural disasters and enemies. Analysis by Kovtun (Kovtun, 2014)
highlights that domestic space/ house involves less attentive activities whilst a more
sensitive activities such as sleep, sexual intercourse, birth and care for children. Architecture
provides material conditions to meet these physiological needs. This influences the
distribution and organization of space and protection. “Recognition of space is not a
privilege of some talented people, but a biological function” stated L.Mohoi-Nad, cited in
(Kovtun, 2014). Higher needs are the human needs of love, identification and participation
in a group. This refers to the dependency of a person towards the other which refers to food
and protection. This dependency extends to the interaction between one’s actions depending
on other people’s behavior. In architecture, it refers to the need of having a place of
communication (Kovtun, 2014). An Analysis of Mangolian tent, by Caroline Humphrey
(1974) cited in (Waterson, 1990) analyzed that a Mongolian tent is a tightly ordered
microcosm of the social world. Spatial division of the tent is used to place people according
to social positions, seniority and gender. The study of Atoni, archipelago’s house
(Cunningham’s 1964, cited in (Waterson, 1990), the internal spaces is ordered around fixed
point which is the door, water jar, hearth and the platform. The platform is hybrid (multi
uses) in terms of its function as it acts as sitting places, eating and sleeping area, and also as
storage of utensils, foods and other goods. The smaller platform located on the left acts as a
sleeping platform for the elders of the household. On the left, there is the third platform, for
food preparation and where women may give birth. From this, Cunningham illustrates the
interweaving of both lateral (right/left) and concentric principles where contrast between
male and female are the important part of the arrangement. It is obvious from many of the
examples across the literature that needs is the most important aspect in influencing the
layout, the hierarchy and the relation between one space to another.
Self-build House
Self-build house is a condition where a house is self-built by the owner. As been discussed
by Kamau (Kamau, 2005), these are due to high standard of living and the poor economic
factors of the occupant. This group tries to fit their living by building their own house in
meeting their need in having a living space as a basic need of shelter. Figure 2.1(1) explains
the relation between adaptability, affordability and suitability in the existence of the self-
build house. This group prefers to build their own house due to the design flexibilities of the
house, to be extended or contracted depend on needs. A study of public housing in Nairobi,
Shihembetsa and Olima, (2000) cited in (Kamau, 2005) noted that households prefer self-
build home ownership due to the opportunity to make improvements based on their needs.
As for the Masai people in Kenya, they set up their dwelling hut in circle. Masai women
build and maintain their hut themselves (Laffon, 2004). They gather cob and branches to
build their hut. This typical Masai structure supports a covering of several layers of dried
grass held together by a mixture of mud and dung. The door is made of animal skin and the
campfire is located in the middle of the hut and it separates the men and the women.
METHODS
This research employed case study as the main method. This method is divided into three
case studies to establish the data collection and the analysis of the study. Case study of this
research were mainly located at the squatter areas. The first case study was conducted at
Butterworth, Penang. The second case study was conducted at Padang Jawa, Klang and the
third case study was also conducted there but at a different location. Each of the case studies
took 21/2 hours to complete along with the observation and interviews. Owners were

130
Figure 4.0(1): House 1, Butterworth, Pulau
Pinang, (Author,2016).
interviewed with a look through tour from the exterior to the interior part of the house.
Several pictures were taken to further explain and clarify the issues.
FINDINGS & ARGUMENTS
The priority hierarchy of each spaces – relation between spaces & function.
The priority of each space is demarcated according to the importance and the necessity of
the space to the owner. Each space available inside the house is the most necessary space
to the owner.
Table 3.0(1): Analysis of the space layout of all the case studies. Sources: (Author,2016).
Based on the 3(three) case studies, there are 2(two) main needs which become the main
reason of the existence of these 2(two) main spaces. This result determines the basic needs
of the owners which are:
Space layout Analysis of the space layout
- Living room 1 is the most important space and functions as a
multifunctional space for almost all indoor activities of the
family which include sleeping, resting, eating and studying.
- Living room 2 functions as a multifunctional area for the
owner’s wife and son.
- Kitchen is the next important space to prepare food which is a
basic need of humans.
- Backyard functions to connect the son’s house with the
mother’s house.
- Chicken hut situated next to the kitchen provides meat supply.
- Living room is the most important area and functions as a
multifunctional space for almost all indoor activities of the
family which include sleeping, resting, eating and studying.
- Room functions as a private storage area which stores owner’s
private belongings.
- The size of the kitchen is adequate enough for the owner to
cook his daily meal.
- Both storage areas store the owner’s working tools.
- Chicken hut located at the back provides meat supply to the
owner.
- Living 1 area is the most important area as it is a multipurpose/
hybrid area which in the daytime functions not only as a family
area, but also as resting and eating area, whilst at night it
functions as a sleeping quarter.
- Living area 2 is the extension of the house for the eldest son.
- Kitchen is the next important space to prepare food which is a
basic need of humans.
- Both of rooms function as a wardrobe area(storage). Only one
of the rooms is still used for sleeping(adult).
- Washing area and toilet are located outside of the house.
Figure 4.0(2): House 2, Padang Jawa, Klang,
(Author,2016).
Figure 4.0(3): House 3, Padang Jawa, Klang,
(Author,2016).
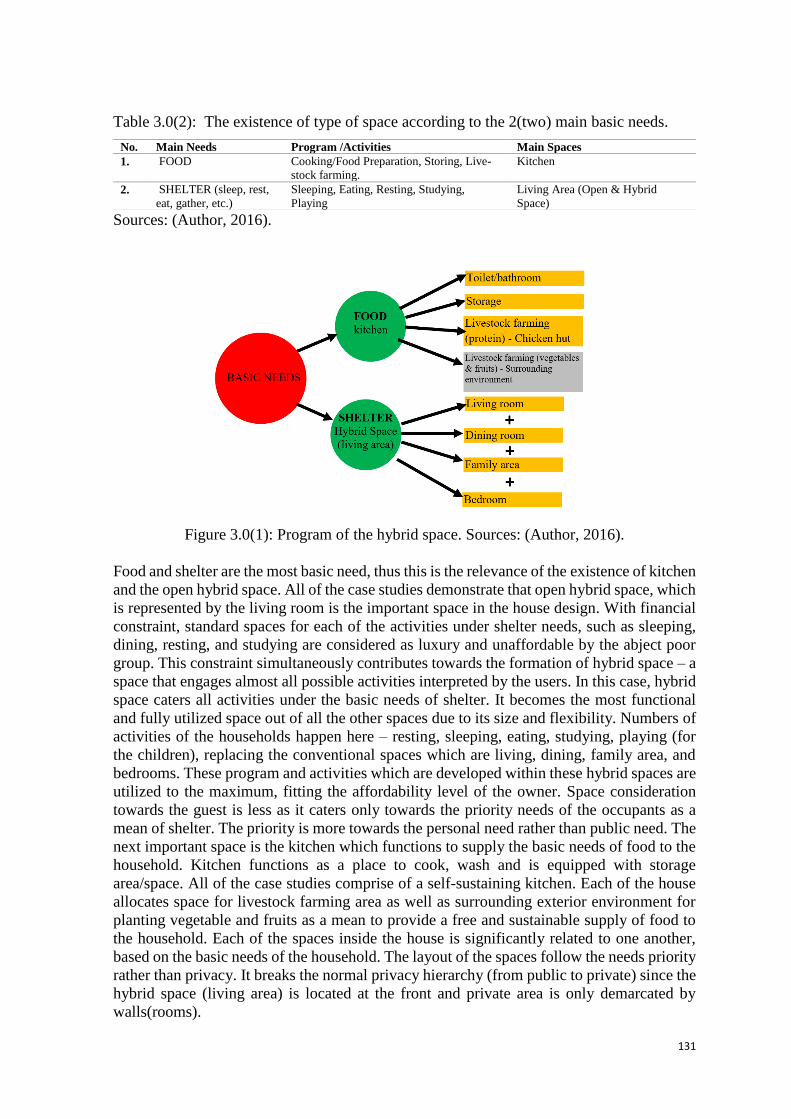
131
Table 3.0(2): The existence of type of space according to the 2(two) main basic needs.
Sources: (Author, 2016).
Figure 3.0(1): Program of the hybrid space. Sources: (Author, 2016).
Food and shelter are the most basic need, thus this is the relevance of the existence of kitchen
and the open hybrid space. All of the case studies demonstrate that open hybrid space, which
is represented by the living room is the important space in the house design. With financial
constraint, standard spaces for each of the activities under shelter needs, such as sleeping,
dining, resting, and studying are considered as luxury and unaffordable by the abject poor
group. This constraint simultaneously contributes towards the formation of hybrid space – a
space that engages almost all possible activities interpreted by the users. In this case, hybrid
space caters all activities under the basic needs of shelter. It becomes the most functional
and fully utilized space out of all the other spaces due to its size and flexibility. Numbers of
activities of the households happen here – resting, sleeping, eating, studying, playing (for
the children), replacing the conventional spaces which are living, dining, family area, and
bedrooms. These program and activities which are developed within these hybrid spaces are
utilized to the maximum, fitting the affordability level of the owner. Space consideration
towards the guest is less as it caters only towards the priority needs of the occupants as a
mean of shelter. The priority is more towards the personal need rather than public need. The
next important space is the kitchen which functions to supply the basic needs of food to the
household. Kitchen functions as a place to cook, wash and is equipped with storage
area/space. All of the case studies comprise of a self-sustaining kitchen. Each of the house
allocates space for livestock farming area as well as surrounding exterior environment for
planting vegetable and fruits as a mean to provide a free and sustainable supply of food to
the household. Each of the spaces inside the house is significantly related to one another,
based on the basic needs of the household. The layout of the spaces follow the needs priority
rather than privacy. It breaks the normal privacy hierarchy (from public to private) since the
hybrid space (living area) is located at the front and private area is only demarcated by
walls(rooms).
No. Main Needs Program /Activities Main Spaces
1. FOOD Cooking/Food Preparation, Storing, Live-
stock farming.
Kitchen
2. SHELTER (sleep, rest,
eat, gather, etc.)
Sleeping, Eating, Resting, Studying,
Playing
Living Area (Open & Hybrid
Space)

132
CONCLUSION
In conclusion, this paper reveals, that the layout of the house, spaces, function and size of
each space, hierarchy of spaces and relation between one space to another are strongly based
and according to the hierarchy of basic needs of the occupants/owners. Space is defined by
the function and the importance of the owner’s/occupant’s everyday activities. Hybrid area
is the most needed area. Living area becomes a hybrid space and the most utilized space by
the household, catering activities such as sleeping, resting, eating, studying and playing
throughout the day. Spaces for continuous supply of meats, farming fruits and vegetable are
among the needed spaces to sustain the household. With further research and
implementation, these findings can as well help to improve and optimized the design of the
current low-cost housing design and scheme. Corresponding to this, it is suggested that
future research should cover on making the space needs and its significant to the poor group
relevant with the new housing design and scheme for the poor group.
REFERENCES
Globalissuenetwork. 2017. Poverty. March 1st. http://globalissuesnetwork.org/learn-about-our-global-
issues/poverty/.
Hajizan, Nizam. 2015. "Masalah Kemasyarakatan Dan Budaya." Slide Share. December 9th.
https://www.slideshare.net/mohdnizammohdzan/bab-2-masalah-kemesyarakatan-dan-budaya-
55967549.
Kamau, Peter Kariuki. 2005. Factors that affect Self-build housing in Nairobi Kenya Ph.D Thesis, Policy
and Planning Sciences. Japan: University Tsukuba.
Kovtun, Iulia. 2014. "Fulfilment of Individual Needs." suw.biblos.
https://suw.biblos.pk.edu.pl/downloadResource&mId=1374206.
Laffon, Martine & Caroline. 2004. A Home In The World,Houses and Cultures. New York: Harry N.
Abrams,Inc.
Poverty. n.d. poverty. March 1st. http://dictionary.cambridge.org/dictionary/english/poverty.
Razali, Mohd Khairuddin Aman. 2015. Kemiskinan: Takrif semula, tangani punca. Kuala Lumpur, June 16.
Unit Pelarasan Perlaksanaan, Jabatan Perdana Menteri. 2011. "Sistem Maklumat Kemiskinan Negara (e-
kasih)." Kenyataan Akhbar. Putrajaya, Wilayah Persekutuan Putrajaya: ICU JPM, January 24th.
Waterson, Roxana. 1990. The Living House, An Anthropology of Architecture in South East Asia. Singapore:
Oxford University Press.
133
UTM Razak School of Engineering and Advanced Technology
Kuala Lumpur, Malaysia
10th October 2017
SD11 – CLIMATE AND DISASTER RESILIENT CITIES:
CHALLENGES FOR MALAYSIA
Wan Nurul Mardiah Wan Mohd Rani1*, Khammarul Azhari Abd. Razak1,
Khairul Hisyam Kamarudin1 and Rozaimi Che Hassan1
1UTM Razak School of Engineering and Advanced Technology, Universiti Teknologi Malaysia,
Jalan Sultan Yahya Petra, 54100, Kuala Lumpur, Malaysia
*Corresponding author [email protected]
ABSTRACT
The notion of disaster resilient cities have gained much attention and interest over recent
years. The increase in the occurrences of natural and man-induced disasters have led to
higher awareness on the need to move towards disaster and climate resilient cities. Cities
and its entire system are vulnerable to the impacts of climate change and calamities that may
occur naturally or man-made. The recent occurrence of disasters have highlighted that cities
are not prepared to face disasters and climate related events. However, in any condition,
cities need to continuously maintain its function to provide protection to the people and the
facilities. Previous studies have stated that the process of making a disaster resilient cities is
complex due to its nature of multidisciplinary and multi-level approach. The collaboration
and input of various stakeholders are crucial to ensure that the goals of disaster resilient
cities are achieved. This paper aims to review the concept of disaster resilient cities and its
challenges focussing on the context of Malaysian cities. Subsequently, the paper proposes
several strategies to address the challenges towards achieving disaster and climate resilient
cities.
Keywords: Disaster Resilience, cities, urbanization, and climate change
INTRODUCTION
The concept of disaster resilient cities has gained interest and attention over recent years.
This is directly related with the increase on the occurrences of natural and man-induced
disasters. According to Davoudi et al. (2012), the term resilience can be categorized into
two types- engineering resilience and ecological resilience. It is described that engineering
resilience refers to the ability of a system to return to a state after a catastrophe. The
catastrophe in this context maybe caused by natural disaster or a social disruption such as
economic crises or wars. The quicker the system return to its normal states indicates greater
resilient. On the other hand, ecological resilience is referred as the “the magnitude of the
disturbance that can be absorbed before the system changes its structure” (Folke et al.
2002). However, the definition of resilience may vary according to field of interest and
context-specific. Based on the OECD (2013) definition, resilience is the ability of

134
individuals, communities and states and their institutions to absorb and recover from
shocks, whilst positively adapting and transforming their structures and means for living in
the face of long-term changes and uncertainty”. The use of resilience concept has been
associated with the agenda on addressing the impact of climate change. Among them include
the publication of document by the World Bank (2012). In recent year, the notion of
resilience or resilient have been included in various level such as in policy development,
urban planning and development policies and city administrations (Davoudi et al., 2017).
Hassler et al., (2017) explained that an array of risks identified through the themes of
resilience, sustainable development, disaster planning and climate change adaptation has led
to the notion of resilience to enter the general public discourse and has gained attention to
increasingly use the term. Globally, to achieve urban resilience, efforts were made through
the implementation of the 2030 Sustainable Development Agenda, the Sendai Framework
for Disaster Risk Reduction, the Paris Agreement on Climate Change, and the New Urban
Agenda (ICLEI 2016). Measuring and mapping the level of resilience of cities is the key
step that enables stakeholders to understand the current situation. This process allows the
decision-makers and other stakeholder to assess the current and future potential climate-
related risks that their city faces. The outcome of the process will lead to developing a
baseline measurement of the current level of resilience (UNISDR 2015). This is important
to identify priorities for the development of policies, strategies and actions. According to
OECD (2016), resilient cities are characterized as cities that have the ability to absorb,
recover and prepare for future shocks. Four sectors that consist of the economy, society,
environment and institutions are the main drivers of resilient cities (OECD 2016). These
drivers have become the key variables in measuring and assessing the climate disaster
resilience level of cities prior to the establishment of strategies that addresses the current
situation and context (Shaw et al. 2010). Hence, this paper focussed on to review the concept
of climate and disaster resilience. Alongside, challenges of Malaysian cities towards
becoming a climate and disaster resilient nation are also discussed.
ACHIEVING CLIMATE AND DISASTER RESILIENCE IN MALAYSIA
In general, disaster can be classified into two categories; man-made disaster and natural
disaster (Mohamed Shaluf and Ahmadun 2006). Based on the definition outlined by the
United Nations Office for Disaster Risk Reduction (UNISDR), the term disaster refers to “a
serious disruption of the functioning of a community or a society involving widespread
human, material, economic or environmental losses and impacts, which exceeds the ability
of the affected community or society to cope using its own resources. Disasters are often
described as a result of the combination of: the exposure to a hazard; the conditions of
vulnerability that are present; and insufficient capacity or measures to reduce or cope with
the potential negative consequences. Disaster impacts may include loss of life, injury,
disease and other negative effects on human physical, mental and social well-being, together
with damage to property, destruction of assets, loss of services, social and economic
disruption and environmental degradation ”(UNISDR, 2007) (Peel and Fisher 2016). As a
result of global warming and the effect of climate change, Malaysia has been exposed to the
increase of hazard potenial in most areas. The Malaysian government has taken strong
initiatives to address the problem. In the Eleventh Malaysia Plan, efforts toward achieving
disaster resilient nation have been higlighted through green growth that incorporates climate
change adaptation measures and disaster risk management. Thirty-five high-risk area maps
have been developed to guide the development planning within high-risk areas. Specifically,
the main objective specified is to strengthen the disaster risk management through
prevention, mitigation, preparedness, action and recovery. Other related policy documents

135
that spell out policies and strategies towards achieving disaster resilience in Malayia are as
follows:
(i) National Physical Plan (II & III,
(ii) National Urbanisation Policy (I & II)
(iii) State Structure Plan, and
(iv) Various Planning Guidelines and Policies, Federal Department of Town and
Country Planning, Peninsular Malaysia.
THE CHALLENGES
Previous studies have reported that among the main challenges to achieve disaster resilient
cities are lack of regulatory framework, unplanned cities and urbanisation, old building
stocks and high-risk infrastructure, inadequate capacities of local authorities, lack of
funding, inadequacy of qualified human resources, uncoordinated information, corruption
and unlawful activities (Malalgoda, Amaratunga, and Haigh 2014) (Jabareen 2013). On the
other hand, in Malaysia, a previous research reported that at the planning level, non-
compliance of development plans and planning guidelines at state and local level, lack of
data for detail assessment, ineffective implementation of development policies, lack of
support, commitment and funding from stakeholders including the local and state planning
authorities are the issues that restrain Malaysia to progress rapidly towards achieving climate
and disaster resilience (Mohamad Amin and Hashim 2014) (Mohamed Jamil 2008).
Resilience mapping is one of the important processes towards understanding the current
status before preceding to developing the suitable policies and strategies. To date, the best
practice in measuring the level of resilience is through the application of Climate and
Disaster Resilience Index (CDRI) initiated by Kyoto University in collaboration with
CITYNET, Tokyo Distance Learning Centre of the World Bank Sustainable Environment
and Ecological Development Society and UNISDR (Shar et al. 2010). However, the process
of mapping the current status of resilience is a challenge for Malaysia as it requires
commitment and collaboration of various stakeholders. Lack of coordinated data and
information are also an issue because of the bureaucratic and multi-level of different
agencies.
CONCLUSION
Despite the impact of disasters and climate change, Malaysian cities need to continuously
maintain its function to protect the people and the facilities. Previous studies have stated that
the process of achieving disaster resilience cities is complex due to its nature of the
multidisciplinary and multi-level approach. The collaboration and input of various
stakeholders are crucial to ensure the goals of disaster resilient cities are achieved. Drawing
from cases of developed countries with advanced DRR practices, among the best strategies
to apply by the Malaysian agencies towards achieving disaster and climate resilience are to
ensure the incorporation of disaster risk and climate risk assessments into the planning and
management, revision of existing development policies to include measures of DRR,
continuously monitor and assess developments in high-risk areas and finally to ensure
successful collaboration of various stakeholders involved. Also, an educated population with
high awareness on disaster and climate resilience is essential to enable a more holistic
approach to build a culture of safety and resilience at all levels within the city.
Acknowledgment:

136
The authors would like to express sincere gratitude to the Federal Department of Town and
Country Planning, Peninsular Malaysia (PLANMalaysia), Environmental Planning Group
Sdn. Bhd. (EPG) for the opportunity to be part of the research team in the preparation for
the Planning Guidelines for Disaster Resilient Cities. The authors would also like to
acknowledge Ministry of Education Malaysia, Universiti Teknologi Malaysia (UTM) and
the researchManagement Centre (RMC) of UTM for providing the financial support for this
paper to be published. This paper is financed by the Grant of UTM Razak School for research
funding under Cost Centre No. Q.K130000.2640.12J00.
REFERENCES
Folke, C., S. Carpenter, T. Elmqvist, L. Gunderson, C. S. Holling, and B. Walker. 2002. 'Resilience and
sustainable development: Building adaptive capacity in a world of transformations', Ambio, 31: 437-
40.
ICLEI. 2016. "Resilient Cities Report:; Global developments in urban adaptation and resilience." In, edited by
ICLEI - Local Government for Sustainability.
Jabareen, Yosef. 2013. 'Planning the resilient city: Concepts and strategies for coping with climate change and
environmental risk', Cities, 31: 220-29.
Malalgoda, Chamindi, Dilanthi Amaratunga, and Richard Haigh. 2014. 'Challenges in Creating a Disaster
Resilient Built Environment', Procedia Economics and Finance, 18: 736-44.
Mohamad Amin, I. A, and H. S Hashim. 2014. 'Disaster Risk Reduction in Malaysian Urban Planning',
Planning Malaysia: Journal of the Malaysian Institute of Planners, XII: 35-58.
Mohamed Jamil, Ahmad. 2008. "Management of Geohazards Through Spatial Planning." In Second National
Conference on Extreme Weather and Climate Change: Understanding Science and Risk Reduction
Putrajaya, Malaysia
Mohamed Shaluf, Ibrahim, and Fakhru'l‐Razi Ahmadun. 2006. 'Disaster types in Malaysia: an overview',
Disaster Prevention and Management: An International Journal, 15: 286-98.
OECD. 2016. "RESILIENT CITIES POLICY HIGHLIGHTS OF THE OECD REPORT (PRELIMINARY
VERSION)." In.
Peel, Jacqueline, and David Fisher (ed.)^(eds.). 2016. The Role of International Environmental Law in Disaster
Risk Reduction (Brill, Nijhoff).
Shaw, Rajib, Yukiko Takeuchi, Jonas Joerin, Glenn Fernandez, Tjandradewi, Bernadia Irawati;, Chosadillia;,
Eiko; Wataya, Bob; McDonald, Ryu; Fukui, Anshu; Sharma, Etsuko; Tsunozaki, and Yuki
Matsuoka. 2010. "Climate and disaster resilience initiative capacity-building program." In.: United
Nations Office for Disaster Risk Reduction (UNISDR).
UNISDR. 2015. "Disaster Resilience Scorecard for Cities." In, edited by United Nations Office for Disaster
Risk Reduction.

137
UTM Razak School of Engineering and Advanced Technology
Kuala Lumpur, Malaysia
10 October 2017
SD 4 - MEASURING THE SWAY OF IMPERCEPTIBLE FACTORS
IN SHAPING THE DISTINCT CHARACTER OF ANCIENT INDIAN
ARCHITECTURE AND CITY PLANNING
Tamara Kelly
1, 2College of Engineering, Abu Dhabi University, Abu Dhabi, U.A.E.
(tamara.kelly.adu.ac.ae)
ABSTRACT
In India, great obey to nature is evident in architecture and the essence of life is fairly apparent in
city planning, human kind reflects his perception of life in architecture by locating the spaces within
the dwelling in particular order to ensure great harmony with positive and negative forces of the
cosmos. Modern Architecture shaped by political and economic factors resulted in sameness among
most of contemporary capitals or developments and ignoring farming and human needs caused
decays in urban fabric and gas emissions level reaches high figures in Mega cities. By contrast
ancient architecture in India connects the occupants with surrounding environment and ensure
harmony between humans and nature through many aspects and scale is great element considered in
space and city planning leading into the Mandala graph. In Indian philosophy, disproportion and
detachment of mankind from nature and surrounding environment lead to disaster hence the Mandala
diagram addresses all the existences taking into account farming, human scale and needs. The
purpose of this paper is to examine the impact of intangible factors such as traditional belief and
religion in shaping the astonishing character of Indian architecture furthermore I shall study many
metaphysic theories to test their influence on evolving the Mandala diagram and the logic behind the
distribution of functions within its parts.
Key words: Mandala diagram, Vastu Purusha, five element, the Vedika, responsive architecture,
INTRODUCTION
Nowadays cities are similar building and skyscrapers in Dubai, Singapore and Kuala
Lampur are alike and plants, trees or finishing materials may only look different in
contemporary capitals. Mega cities diminished human peace and generated many problems
for societies, traffic jam pollutions and high level of crime furthermore harmony between
individuals vanished whereas ancient cities recognized human scale and sustainable as all
building materials are local and settlements safer with great harmony between settlers.
Indian cities meet most of resident’s needs addresses social cultural customs, the character
of the blocks are different in Indian towns but premises are in great harmony and the
atmosphere is positive as villagers interact with each other’s moreover everything can be
reached within short distances. In India many philosophies inspired scientists thinking and
led to form distinct norms, among those principles is the appreciation of nature Indian
architects believe that nature is crucial factor and affects mankind in various ways it can
influence us internally – spiritually and psychology or externally –Physically. Likewise
Mankind shares the earth with many other existences including animals, plants and different
forces effect his cognizance hence architecture should reflect every aspect of our universe,
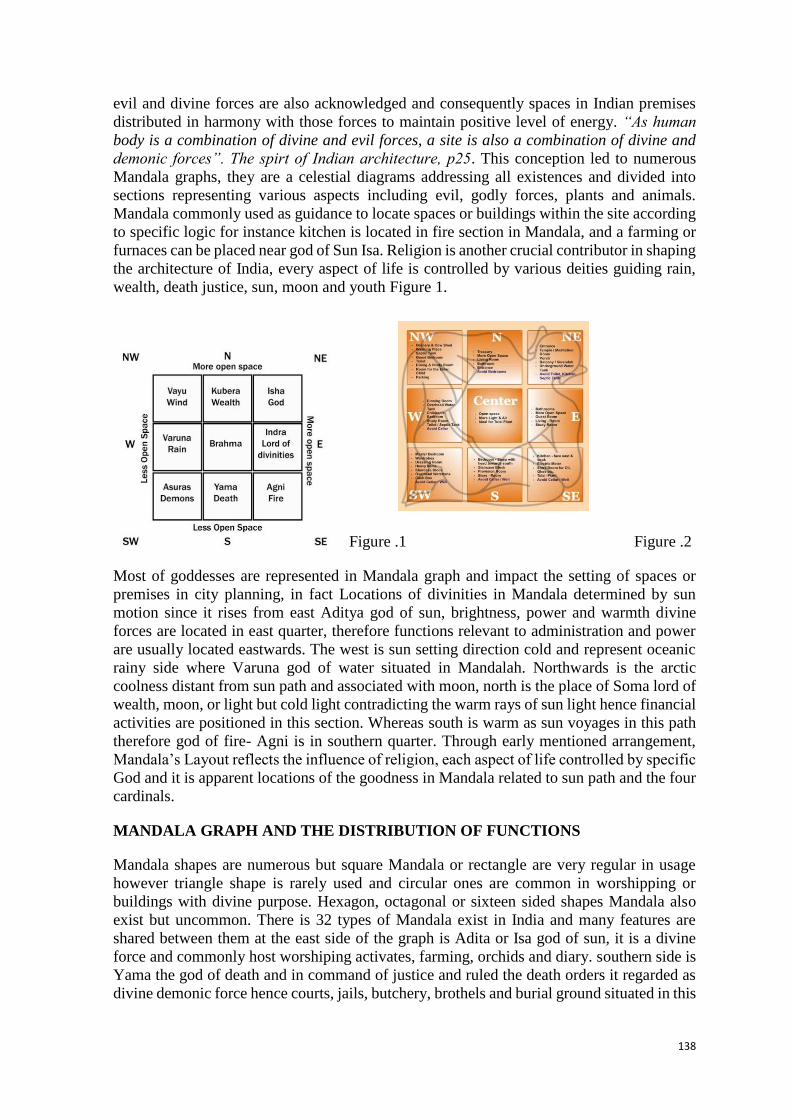
138
evil and divine forces are also acknowledged and consequently spaces in Indian premises
distributed in harmony with those forces to maintain positive level of energy. “As human
body is a combination of divine and evil forces, a site is also a combination of divine and
demonic forces”. The spirt of Indian architecture, p25. This conception led to numerous
Mandala graphs, they are a celestial diagrams addressing all existences and divided into
sections representing various aspects including evil, godly forces, plants and animals.
Mandala commonly used as guidance to locate spaces or buildings within the site according
to specific logic for instance kitchen is located in fire section in Mandala, and a farming or
furnaces can be placed near god of Sun Isa. Religion is another crucial contributor in shaping
the architecture of India, every aspect of life is controlled by various deities guiding rain,
wealth, death justice, sun, moon and youth Figure 1.
Figure .1 Figure .2
Most of goddesses are represented in Mandala graph and impact the setting of spaces or
premises in city planning, in fact Locations of divinities in Mandala determined by sun
motion since it rises from east Aditya god of sun, brightness, power and warmth divine
forces are located in east quarter, therefore functions relevant to administration and power
are usually located eastwards. The west is sun setting direction cold and represent oceanic
rainy side where Varuna god of water situated in Mandalah. Northwards is the arctic
coolness distant from sun path and associated with moon, north is the place of Soma lord of
wealth, moon, or light but cold light contradicting the warm rays of sun light hence financial
activities are positioned in this section. Whereas south is warm as sun voyages in this path
therefore god of fire- Agni is in southern quarter. Through early mentioned arrangement,
Mandala’s Layout reflects the influence of religion, each aspect of life controlled by specific
God and it is apparent locations of the goodness in Mandala related to sun path and the four
cardinals.
MANDALA GRAPH AND THE DISTRIBUTION OF FUNCTIONS
Mandala shapes are numerous but square Mandala or rectangle are very regular in usage
however triangle shape is rarely used and circular ones are common in worshipping or
buildings with divine purpose. Hexagon, octagonal or sixteen sided shapes Mandala also
exist but uncommon. There is 32 types of Mandala exist in India and many features are
shared between them at the east side of the graph is Adita or Isa god of sun, it is a divine
force and commonly host worshiping activates, farming, orchids and diary. southern side is
Yama the god of death and in command of justice and ruled the death orders it regarded as
divine demonic force hence courts, jails, butchery, brothels and burial ground situated in this

139
area. Western side is Varuna god of water or ocean a celestial force and lodge traveling
trading activates, treasury, industrial and defenses academics.
Finally Soma the moon is in northern side whereas central part is dedicated to goddess of
earth and open to sky. There are Mandala for site planning and other ones for dwellings for
instance Pitha is simplest and first sample consist of 3x3 sections with core open to sky and
other parts are dedicated to divine forces such as fire, water, wind, ancestress, justice or
death god and this basic diagram is suitable for domestic and public buildings furthermore
its layout was inspiration for other sophisticated Mandalas. In fact any site is amalgam of
positive and negative aspects hence Indian architects developed the Mandala to deal with
such opposite forces and consequently the layout of the building reflects ecological forces
and other balances.
The five element theory of life air, fire, water and earth are recognized in Mandala layout
and occupy the corners for instance the northwest corner indicated Vayavya-air force
symbolizing movement hens preferable transit activity in this area a gust room, unmarried
person room or a finished material storages can also be located in this section where the
items are subject to movement or deliver shortly. Vayu is lord of wind and located adjacent
to air’s god it represent divine forces thus northwest quarter commonly occupied by
activities reflect law enforcement, distilleries and professional. Northeast corner dedicated
to Isan - Sun and worshiping activates or buildings are favorited whereas southeast corner
represent Agneya- fire and commonly a kitchen, boiler room or bread furnace shop is ideal
in east angle and southeast corner.
Finally is the west south spot where Nairutya earth force exist and commonly physical
functions a massage room, dining or dressing, maternity room, hospital, jail or slaughter
rooms are common in this side Figure 2. Worshipping, ancestors deity take place in two
different sections southwest corners or northeast this variety allow the designer
flexibility to locate the spaces according to site condition. Even the location of main
entrance determined reference to specific theory the door can be in one of the four
directions, north, east, south or west. If the door is placing in north it underscores the
intellectual aspect and east for administrative while west for business and south for
workers.
POSTURE OF VASTU PURUSH MODEL
As mentioned earlier the Mandala takes into account the five element; fire, water, earth,
wind, plants, animals, ancestors, demonic and divine forces and these elements should
be balanced within the dwellings to enhance the flow of energy and consequently the
occupant’s health. Nature is in the core of Indian architecture in various ways it
influences dwellings layout and represented by a figure known as Vastu Purusha set
within the mandala graph and according to this notion the torso of the figure is in the
middle of the diagram and should be free from pain thus center of dwelling free of
columns and open to sky Figure.2 “Nature, the governing power of the cosmic processes
in the universe, is omnipresent. Nature govern every piece of land and every dwelling.
The scriptures refer to this as the presiding spirt. This spirit, in architectural parlance,
is called the Vastu Purusha.” The spirt of Indian architecture, Page 37.
Location of court yard commonly in the middle but it can also occupies the corners or
the sides, the court yard accommodates Vedika (sacrificial alter) for worshiping and
family gathering or celebrating events “while designing, due care must be taken to

140
ensure that the nerve centers or the vulnerable points of the Purusha are not put to pain
therefore structural members like columns, walls, Fire places or anything that can cause
pain to the Vasta Purusha must be avoided.”The spirt of Indian architecture, p39.
Another crucial idea is the offering or oblation to fire which normally occurs in the court
yard, fire maintain good eyesight and is life giving energy similar to sun should not be
extinguished or wane. Later the Vedika replaces by basil leaf or different types of
medical plans which can be used to heel against diseases. The beauty of nature apparent
in mountains, flowing water features and frosts may not be available in every site hence
the court yard compensate deficiencies of natural features and commonly accommodates
plants and water element. In fact having an open space for gathering is replicated in city
planning in ancient Indian cities, commonly settlements accommodates numerous open
zones woven within the every district allowing people from same background to
socialize Figure 3.
Likewise, Settlements in India shaped by particular rationality, Indian philosophers think
that every society is usually divided into four sectors, first part represents thinkers or
planers who carried the intellectual work and called Brahmin Cuna, they assist in
maintaining the literary culture of society and when the intellectual falls it leads into
corruption and the nation will ruin. Second segment in charge of administrat ion and
governing mission therefore they are politicians or rulers known as Kashatriya Guna
while third part Vaishya Guna consists of traders and farmers and finally comes the
labors who assist the other three parts they are Shuda Guna and blue –collar workers
Figure 4. Ancient Indians were against admixture they believe it mess up the values in
society and caused adverse progeny and create deep psychological tensions people of
same rank should live together and admixture can cause fear among settlers for instance
mother of children doesn’t feel safe letting her children socialize and play with other
youngsters coming from different caste hence segregating is evident in Indian city
planning and reflects social culture.
Ancient nations were aware of energy level radiating from earth and planned their
buildings to benefit from positive energy, in China proposed location of any settlement
investigated carefully by the ruler’s officers and commonly cities were built at foot of
mountains and nearby water body or frost to benefit from the energy radiating from
natural landscape. Greeks took into consideration the earth energy field and designed
their city Agors to benefit from such energy and similarly the ancient Greek urban
planner Hippodamus of Miletus known by his methodology of using the grid iron
patterns in city planning. The spaces within the grid lines are in the positive energy
therefor blocks are laid whereas the intersections of grids lines are within the negative
or low energy of earth and human activates are not placed in the nods. Every object
radiate energy and the Lecher Antenna can be used to measure the radiation of energy
and also the gems have powerful effect on energy level of humans.
Similarly the Mandalas lower the effect of negative energy of existing site and create or
accentuate positive energy level of the setting therefore the Mandala was a key factor in
city planning or designing the buildings internally and externally. In fact D K Bubbar in
his book the spirt of Indian architecture stated that an experiments took place in a flat
located in Mumbai reveled how certain elements can reverse the negative energy to
positive energy. According to D K Bubbar a geo biological test carried out in the flat in
certain zone showed high level of negative energy, then a Conch cell was placed in the
area and the test repeated surprisingly the reading shows positive energy level .the same

141
was repeated but with a lit lamp and gave same outcomes and in particular when the
lamp is located in Northern corner Isan the negative energy changed to positive therefore
the conch shell and lamp are fundamental elements in worshiping in India, the flame can
diminish negative energy and turn it into positive hence the temple is commonly
recommended in negative energy field to reveres it.
Figure 3 Figure 4
In general there are many graphs employed to design Indian settlements however the city
preferable to be established near water body, mountain or frost to utilize the energy
coming from natural terrain. There are common features shared between those various
Mandala, the city should follow grid layouts, roads are perpendicular and the core of the
city is open to sky for public, temples commonly in northeast in Isan corner, then the
city accommodate many open areas for as a public meeting points and matching ranked
citizens gathered in certain zones according to early mentioned arrangement.
CONCLUSION
The ancient Indian architecture is an amalgam of religion and a traditional interpretation on
how the decrees of nature affect mankind, Indian architect develop the Mandala graph which
recognizes the principle of five elements and within its components the five elements are
distributed according to sun path, four cardinals and location of India in the planet earth.
Among many planets in our Galaxy earth is the only sphere consist of these primary
elements necessary to establish life thus they are dominant in Mandala layout, the
environment and occupants wellbeing in any building or settlement can be enhanced by
distributing the function in certain direction according to Mandala suggestion, It takes
advantage of the benefits conferred by the five elements of nature to create a genial living
and working environment thus facilitating spiritual well-being and paving the way to
enhanced health, happiness , prosperity and wealth.
The acknowledgment of Indian norms and beliefs led into such distinct architecture which
lasted since thousands of years and can be great inspiration for the coming generation.
Furthermore reviving our ancestor approach is a great tool to diminish similitude layout of
nowadays capitals and creating long lasting architecture that never fade away over centuries.
REFERENCES
D K Bubbar, 2005, the Spirit of Indian Architecture Published by Rupa &Co.
Michael Fazio, Marian Moffett, Lawrence Wodehouse, 2008, a World History of Architecture, Laurence
King Publisher.
G. H. R. Tillotson, 1998, Paradigms of Indian Architecture, Curzon press

142
UTM Razak School of Engineering and Advanced Technology
Kuala Lumpur, Malaysia
10th October 2017
SD 10 - ARCHITECTURAL PRACTICES OF PROJECT
COMMUNICATION MANAGEMENT IN IRAQ
Hala Taleb, Syuhaida Ismail, Mohammad Hussaini Wahab, Wan Nurul Mardiah Wan Mohd
Rani, Rohayah Che Amat
UTM Razak School of Engineering and Advanced Technology, UTM Kuala Lumpur
([email protected]; [email protected]; [email protected]; [email protected];
ABSTRACT Architects are significant initiators for the built environment projects, while architecture is
all about communicating effectively with clients. Yet, some problems occur in regards to
the mutual transfer of project information between those two parties. Thus, it is essential to
enrol a proper system for managing project communication through the communication
management discipline. Communication management is a notable part of the project
management body of knowledge that coordinates and manages the process of exchanging
information of the designing project. However, studies confirmed that practices of
communication management are often underestimated and overlooked. This paper discusses
communication management from architect’s perspectives and aims to determine the current
practice in Iraq, where few studies were engaged in this field. This paper follows the
quantitative methods of research, whereas an online questionnaire survey is utilised and
structured via surveymonkey.com and sent to 100 architects working in private firms in
Basra city, southern of Iraq. The collected data are further analysed with SPSS version 23.
The analysis shows that Iraqi architects have little information and knowledge in project
communication management, where standards and methodologies are not followed. Thus,
this paper concludes to the necessary need to introduce communication management as an
evolving knowledge area to the architects in Iraq, and raise its implementation that attempts
to fulfil clients’ requirement and aspirations in regards to the architectural design.
Keywords: communication management, architects, practice, clients, Iraq.
INTRODUCTION
Architects are the first initiators of the direct communication process with the clients during
the designing phase. Moreover, communication has an influential impact on the architecture
practice among individuals and project teams (Shen 2011). As to Charvat (2003),
communication is the backbone of project success, and if it was missed, it causes unpleasant
consequences of delays that lead to project failure. Thus, researchers indicated the
significant need of commencing an adequate communication management system that helps

143
to solve occurred problems (Foley and Macmillan 2005). Communication management is a
fundamental part of the project management field, as it controls the systematic information
exchange among the involved parties of the project (Muszynska 2015). However, it was
claimed through the literature that little attention was paid to the significance of
communication management, and project management studies were a lack of this part
(Dainty, Moore, and Murray 2007). Therefore, Samáková, Sujanová, and Koltnerová (2013)
highlighted the necessity of major changes and improvement in communication plans, as
well as in managing the required communication. Subsequently, it is a demanding call to
assist architects to set exquisite guidelines of communication management methods that
ensure effective communication and correspondence with the features and environment of
the project (Muszynska 2015).
Iraqi studies in regards to project communication management were little and limited. This
was proven after going through the Iraqi Academic Scientific Journals, where only two
studies were found. This paper aims to launch an in-depth investigation to determine the
current level of communication management knowledge and practices, especially among the
architecture practices in Iraq.
This paper follows the quantitative approach of research methods, in the form of a self-
administrated closed-ended online questionnaire survey, that was initially structured by
surveymonkey.com and sent to the respondents. Prior to this, a pilot study was conducted
for testing the reliability of the research instrument through Cronbach’s alpha coefficient of
internal consistency. This paper targets the architects working in the private sector in the
city of Basra, Southern of Iraq, with a minimum of two years of experience. This paper has
concluded to the little attention given to the project communication management in Iraq,
where the practices among architects are considered weak. It is further recommended to raise
the knowledge of this significant part of the project management context in architectural
practices as a vital part of the construction projects.
METHODS
Since this paper aims to determine how communication management is currently practised
in Iraq, it is an obvious need for a relevant method of sampling. Literature mentioned the
two types of sampling: probability and non-probability sampling. Thus, this paper follows
the non-probability sampling which respondents are basically chosen with no probabilities
of selection, as it used when researchers plan to study among a particular group of
respondents (Lemeshow, Hosmer, Klar and Lwanga 1990). Results can be further
generalised to the bigger population. Therefore, among the 150 architects in Basra, and
according to Krejcie and Morgan (1970), the sample size for this population is 108
architects. Subsequently, some researchers consider setting some criteria for the sample is a
necessity to increase adequacy of the study (Muhwezi, Acai, and Otim 2014). Thus, the
respondents of this paper need to own at least two years of experience of designing and
dealing with clients within their practice.
Data collection for this paper was performed through an online self-administrated closed-
ended questionnaire survey, which was structured via surveymonkey.com, and distributed
through e-mails. However, after setting the sample respondents of this paper, a pilot study
was conducted to test the reliability of the instrument. As to Connelly (2008), 10 percent of
the sample size is sufficient for conducting a pilot study, this equals almost 11 respondents.
Moreover, Cronbach’s alpha of internal consistency was calculated according to George and

144
Mallery (2003), where it was suggested that range between 0.7-0.79 is acceptable.
Cronbach’s alpha for this paper was 0.845, which is considered good. Thus, the data
collection process through the online survey is proceeding. The online questionnaire surveys
are getting more attention by the researchers, due to the ease of reaching respondents, less
costly as well as high response levels and flexibility (McDonald and Adam 2003). These
features are further confirmed by Baruch and Holtom (2008) who stated that the response
rate achieved by the online surveys could be equal or higher than those by emailing surveys.
The online data collection for this paper was conducted in the period between 22nd January
and 14th March 2017. Total questionnaires sent to respondents were 115, only 100
questionnaires were sent back, and 89 of them are completed and accepted. This gives a total
response rate of 82 percent, which is higher than the 70 percent response rate set by Nulty
(2008) to be accepted. The questionnaire survey consisted of questions with 4 Likert scale
measurement options for agreement. A Likert scale is a group of items with an equivalent
number of likely and unlikely statements, answered by respondents according to their levels
of agreement (McIver and Carmines 1981). Likert scale options are given values range from
1 to 4 as it refers to 1=strongly disagree, 2=disagree, 3=agree, 4=strongly agree. Although
studies are commonly using five responding options of Likert scale with the neutral option,
this paper follows Nemoto and Beglar (2014) who demonstrated that having a Likert scale
of four or six measurement option can be more reliable. Similarly, Garland (1991) stated
that removing the neutral option helps to increase the reliability of responses.
Furthermore, collected data are analysed using Statistical Package for the Social Sciences
(SPSS) software version 23. Descriptive data analysis was used in this paper, where it gives
a comprehensive summary of respondents’ data (Greasley 2007). For this paper, descriptive
data includes calculating one of the central tendency measurements, the mean, as well as the
standard deviation (SD). The mean is the most common used measure of the central
tendency, as it refers to the scores’ average which summarises the interval scores (Patel
2009). For this paper, scales of mean that range between 1.00 to 2.99 are considered low,
whilst values ≥ 3.00 are high and accepted. On the other hand, the standard deviation is the
value of average distance for each element from the mean value (Patel 2009).
FINDINGS AND ARGUMENT
The general demographic information of the respondents is depicted in Figure 1, which
includes the age, gender, affiliation according to the Iraqi Engineers Union and years of
experience. Results show that majority of the respondents are 25 to 34 years old, which
demonstrates that the architects in Basra mostly belongs to the Y generation. Y generation
is the cohort of the population that was born between 1981 and 2001 (Brosdahl and
Carpenter 2011) and considered to be one of the biggest cohorts among the workforce
(Nightingale 2011). Subsequently, this causes the years of experience of the respondents to
be between 2 and 10 years. Thus, the most common affiliation is the assistant and
practitioner engineers, as architects in Iraq follow the engineers’ affiliation under the Iraqi
Engineers Union. Finally, results show an almost equality of genders in architectural practice
in Basra.
On the other hand, responses to the presented 13 questions show that architects have an
agreed opinion of the weak current practice of communication management. Moreover, they
confirmed the little attention is given to the practices of communication management, and
the international standard and methodologies are not followed. Additionally, architects find
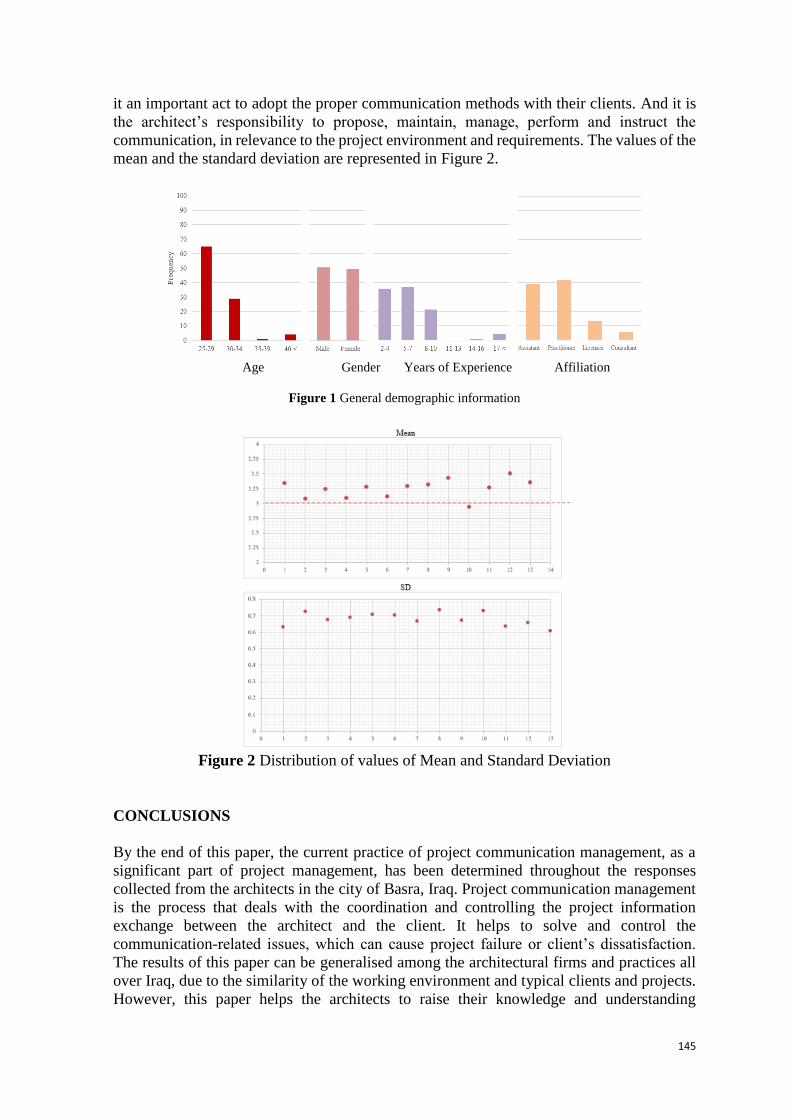
145
it an important act to adopt the proper communication methods with their clients. And it is
the architect’s responsibility to propose, maintain, manage, perform and instruct the
communication, in relevance to the project environment and requirements. The values of the
mean and the standard deviation are represented in Figure 2.
Age Gender Years of Experience Affiliation
Figure 1 General demographic information
Figure 2 Distribution of values of Mean and Standard Deviation
CONCLUSIONS
By the end of this paper, the current practice of project communication management, as a
significant part of project management, has been determined throughout the responses
collected from the architects in the city of Basra, Iraq. Project communication management
is the process that deals with the coordination and controlling the project information
exchange between the architect and the client. It helps to solve and control the
communication-related issues, which can cause project failure or client’s dissatisfaction.
The results of this paper can be generalised among the architectural firms and practices all
over Iraq, due to the similarity of the working environment and typical clients and projects.
However, this paper helps the architects to raise their knowledge and understanding

146
regarding the project communication management, as it will increase the client-architect
mutual understanding level. Finally, as an architect has agreed on the need for
communication management, this paper recommends for future researches to be conducted
on the architects’ competency and strategies to the convenient improvements.
ACKNOWLEGMENT
The authors would like to express their sincere gratitude to the Ministry of Education
Malaysia, Universiti Teknologi Malaysia (UTM) and the research Management Centre
(RMC) of UTM for providing the financial support for this paper to be published. This paper
is financed by the Grant for Research University (GUP) Tier 2 of UTM for research funding
under Cost Centre No. Q.K130000.2640.11J98.
REFERENCES
Baruch, Yehuda, and Brooks C Holtom. 2008. "Survey response rate levels and trends in organizational
research." Human relations 61 (8):1139-1160.
Brosdahl, Deborah JC, and Jason M Carpenter. 2011. "Shopping orientations of US males: A generational
cohort comparison." Journal of Retailing and Consumer Services 18 (6):548-554.
Charvat, Jason. 2003. Project management methodologies: selecting, implementing, and supporting
methodologies and processes for projects: John Wiley & Sons.
Connelly, Lynne M. 2008. "Pilot studies." Medsurg Nursing 17 (6):411-413.
Dainty, Andrew, David Moore, and Michael Murray. 2007. Communication in construction: Theory and
practice: Routledge.
Foley, Jason, and Sebastian Macmillan. 2005. "Patterns of interaction in construction team meetings."
CoDesign 1 (1):19-37.
Garland, Ron. 1991. "The mid-point on a rating scale: Is it desirable." Marketing bulletin 2 (1):66-70.
George, Darren, and M Mallery. 2003. "Using SPSS for Windows step by step: a simple guide and reference."
Greasley, Pete. 2007. Quantitative data analysis using SPSS: An introduction for health & social science:
McGraw-Hill Education (UK).
Krejcie, Robert V, and Daryle W Morgan. 1970. "Determining sample size for research activities." Educ
psychol meas.
Lemeshow, Stanley, David W Hosmer, Janelle Klar, and Stephen Kaggwa Lwanga. 1990. "Adequacy of
sample size in health studies."
McDonald, Heath, and Stewart Adam. 2003. "A comparison of online and postal data collection methods in
marketing research." Marketing Intelligence & Planning 21 (2):85-95.
McIver, John, and Edward G Carmines. 1981. Unidimensional scaling: Sage.
Muhwezi, L, J Acai, and G Otim. 2014. "An assessment of the factors causing delays on building construction
projects in Uganda." International Journal of Construction Engineering and Management 3 (1):13-
23.
Muszynska, Karolina. 2015. "Communication Management in Project Teams-practices and Patterns ".
Nemoto, T, and D Beglar. 2014. "Developing Likertscale questionnaires." jalt2013 Conference Proceedings.
Tokyo: jalt.
Nightingale, Anthony 2011. "Millennial at Work, Reshaping the Workplace." URL: http://www. pwc.
ru/en_RU/ru/hr-consulting/publications/assets/millenials-survey. pdf (дата обращения.
Nulty, Duncan D. 2008. "The adequacy of response rates to online and paper surveys: what can be done?"
Assessment & evaluation in higher education 33 (3):301-314.
Patel, Parina. 2009. "Introduction to Quantitative Methods." Empirical Law Seminar.
Samáková, Jana, Jana Sujanová, and Kristína Koltnerová. 2013. "Project communication management in
industrial enterprises." European Conference on Information Management and Evaluation.
Shen, Weilin. 2011. "A BIM-based Pre-occupancy Evaluation Platform (PEP) for facilitating designer-client
communication in the early design stage." The Hong Kong Polytechnic University.

147
UTM Razak School of Engineering and Advanced Technology
Kuala Lumpur, Malaysia
10th October 2017
SD 16 - UNDERSTANDING THE ROLE OF FACILITY
MANAGEMENT AND FACILITY MANAGER IN SOLVING POOR
INDOOR AIR QUALITY
Nur ‘Afiqah binti Jaini and Noralfishah Sulaiman
Department of Real Estate, Faculty of Technology Management & Business, Universiti Tun
Hussein Onn Malaysia
([email protected]; [email protected])
ABSTRACT
According to the World Health Organization Committee on 1984, more than 30% of new
and remodeled building throughout the world become subject to excessive complaints
related to the Indoor Air Quality (IAQ). In many cases conducted, it show that the level of
indoor pollution is higher than the contaminants contained in the external environment. The
poor IAQ will have adverse effect on human health and lifestyle. This effect known as Sick
Building Syndrome (SBS) and its effect on human health as a problem threatening public
health and more. Even though SBS does not threat life, but it still uncomfortable and can
causes loss of labor force and efficiency and may lead to serious health problem. This paper
will explain how facility management and facility manager role and help solve the impact
of Sick Building Syndrome.
Keywords: Indoor Air Quality, Facility Management, Facility Manager.
INTRODUCTION TO INDOOR POLLUTION
Research conduct by American Environment Protection Agency (EPA) (1991) shows that
the poor level of indoor air quality in a modern building isolated from the external
environment is more dangerous than the external outdoor air quality itself. The Indoor
Environment Quality (IEQ) plays an important role in determining the comfort and
productivity level and efficiency of building occupant (Salleh, Kamaruzzaman, Riley,
Zawawi, & Sulaiman, 2015). Salleh et al., (2015) also said that physical comfort affecting
the occupants refers to meeting the basic needs of residents such as adequate lighting for all
occupants, space suitable to the number of occupants, psychological comfort that will affect
the level of satisfaction of the occupants of colleagues as well as management, and fun
feeling for work. According to Greenpoint Building Technologies (2015), IEQ refers to the
interior of a building. It is not only specific to air quality, but covers all aspects that affect
the quality of the environment as shown in Figure 1 below.

148
FACILITY MANAGEMENT
According to Kooij (2012), Facility Management was first introduced in 1984 in Europe.
Several years later, Facility Management has begun to gain attention from outside the
country and is growing rapidly. The actual definition of Facilities Management is still
difficult to set because concepts and definitions are still growing and are always influenced
by world trends. P.Rondeau, Brown, & D.Lapides (2006) give definition for Facility
Management as a practice and profession that provide management services that meet
strategic long-range and short-term corporate requirements and will continuing to evolve.
P.Rondeau et al. (2006) also describe Facility Management as a proven and innovative
methods and techniques with the most current technical knowledge to achieve humane,
productive and cost-effective work environments.
Figure 2. Definition derived from International Facility Management
Association (IFMA)(2017) and approved by European Facility
Management Network (EuroFM)(2017) about four major elements in
Facility Management which is Place (space), Technology (infrastructure),
People and Process (organization).
Atkin & Brooks (2015) stated that the management of the facility serves to create a
conducive environment. A conducive environment is needed to implement the core
operations of an organization. An organization can implement core operations through an
integrated approach to infrastructure services and delivery for customer satisfaction and
value-added money through support for further business development.
FACILITY MANAGER ROLE
As a result of the partnership acquired by Lorenz (2016) with ten energy managers, there
are several methods that can be applied by other energy managers that can help reduce the
Space & Infrastructure
Customer demand for work / space through services such as
space planning, workplace, design, construction, leasing,
residential building management operations, maintenance,
furniture, equipment, technical infrastructure, services and so on.
People & Organization
Customer demand for health services, catering, event
management, ICT, hospitality, security, human resource
management, logistics, office supplies, document management, accounting, marketing and so on.
Indoor Environment
Quality (IEQ)
Indoor Air Quality
Access to natural
daylight and view
Comfortable acoustic
condition
Control system against
lighting and heat
comfort by occupants
Figure 1. Factors contribute to Indoor Environment Quality

149
energy consumption of a facility. This method can be categorized into ten major categories
which can be simplified in Table 1 below.
Table 1. Energy manager role for reducing energy management in facility methods Energy manager Method of reducing energy consumption
Mark Sanderson, Operations Manager, EMCOR
Facilities Services;
Reduce the use of nightlight systems
Don Amuzie, Program Manager Supervisor, PG & E; Review of facilities
Gary Stark, Assistant Director Facilities, North Idaho
College;
Participation of local communities in order to
reduce the cost of energy consumption
James Vetter, Vice President & Account Manager,
Grubb & Ellis Management Services;
Off vending machines vending lamp
Robert A. Flores, Lockheed Martin STS; Establish more zones within a level to maximize
escalation
Michael Schulz, Profit Improvement Manager, Hyatt
Hotels;
Use the latest process to reduce energy consumption
in kitchen
Dean Gerstein, Profit Improvement Manager, Hyatt
Hotels;
Reduce the heat absorption of solar energy at certain
hotels
David Black, Director of Facilities, John Muir Health; Reduce the energy used for cooling
John Christoffersen, Project Manager, Chukchansi Gold
Resort and Casino and Dean Gerstein, Profit
Improvement Manager, Hyatt Hotels;
Setting the cooling temperature to the appropriate
temperature
Doug Snell Sr, Vice President of Facilities & Purchasing,
D & E Communication Inc.
Bring your own transformer
CONCLUSION
From all aspects covers in this paper, it can be concluded that if the facility have great and
systematic facility management system and facility manager, the total energy consumption
for this facility can be reduced. The combination of facility manager and responsible
occupant will also give positive impact on working space. Further research about the effect
of poor Indoor Environment Quality (IEQ) which is Sick Building Syndrome (SBS) and
Building Related Illness (BRI) can be a recommendation for this study.
REFERENCE
Atkin, B., & Brooks, A. (2015). Total Facility Management. WILEY Blackwell.
E. P. A. (1991). Indoor Air Facts No. 4 Sick Building Syndrome. EPA - Air & Radiation (6609J), Research and
Development (MD-56), 1–4. https://doi.org/10.1136/oem.2003.008813
European Facility Management Network. (2017). EuroFM. Retrieved from Defining European Facility
Management: http://www.eurofm.org/index.php/what-is-fm?showall=&start=2
Greenpoint Building Technologies. (2015). Greenpoint Technologies, Inc. Retrieved from Indoor Air Quality &
Indoor Environmental Quality: http://greenpointbuilding.com/ieq-iaq/
International Facility Management Association (IFMA). (2017). www.ifma.org. Retrieved from What is Facility
Management: http://www.ifma.org/about/what-is-facility-management/what-is-fm-fm
Japan Facility Management Association (JFMA). (2006). Japan Facility Management Association. Retrieved from
What is FM?: http://www.jfma.or.jp/en/whatsFM/index.html
Kooij, M. (2012). Facility Management Education Across the Atlantic, Exploring Exchange Opportunities
Between NSCC and the Hanze University. Hanze University of Applied Sciences.
Lorenz, B. (2016). www.facilitiesnet.com. Retrieved from Ten Tips for Facilities Managers to Cut Energy Costs:
http://www.facilitiesnet.com/energyefficiency/article/Ten-Tips-For-Facility-Managers-To-Cut-Energy-
Costs-Facilities-Management-Energy-Efficiency-Feature--11191
P.Rondeau, E., Brown, R. K., & D.Lapides, P. (2006). Facility Management (Second Edi). John WiIley & Sons.
Salleh, N. M., Kamaruzzaman, S. N., Riley, M., Zawawi, E. M. A., & Sulaiman, R. (2015). A quantitative
evaluation of indoor environmental quality in refurbished kindergarten buildings: A Malaysian case
study. Building and Environment, 94, 723–733. https://doi.org/10.1016/j.buildenv.2015.11.002

150
UTM Razak School of Engineering and Advanced Technology
Kuala Lumpur, Malaysia
10th October 2017
SD 29 - AN OVERVIEW OF IMPLEMENTATION
OUTSOURCING SERVICES OF FACILITIES MANAGEMENT
IN MALAYSIAN PRIVATE HOSPITALS
S.S Kadir*1, S.U Mohd Tobi2 and T.H Jasimin3
1, 2 Lee Kong Chian Faculty of Engineering & Science Universiti TUnku Abd. Rahman (UTAR)
UTM Razak School of Engineering and Advanced Technology KL
[email protected], [email protected] 3 UTM Razak School of Engineering and Advanced Technology KL
ABSTRACT Malaysian private health care faces a problem in the implementation of outsourcing
facilities management. Due lack of benchmark standards and data, as well as lack of
transparency in processing of contracts there are misconceptions about the practice of
FM. The effectiveness of FM outsourcing design practice should meet the standard of
Ministry of Health. Private hospital support services play a vital role in order to
understand a customer’s needs by defining the performance of outsourcing in FM. This
paper comprehensively analyses the articles and journals in reviewing the definitions and
concepts and discussing the implementation of outsourcing of FM in private hospitals.
quality services of outsourcing in FM healthcare highly depends on trained, motivated
and competent staff, which have been highlighted and recommended by researchers. This
article will emphasize successful factors in the implementation of outsourcing FM in Private
Hospitals.
Key words: health care; outsourcing; facilities management; private hospitals
INTRODUCTION
Facilities management (FM) has started growing from property and construction into a
new industry sector since the late 1980s and early 1990s (Meng, 2015). “Facilities” include
buildings, grounds, utilities, and equipment, and typically represent majority of an entity’s
capital assets. Facilities management concerns range from expansion or reductions in the
size of a physical plant to the manner in which the quality of the workplace affects
employee and/or user productivity. Outsourcing facility services can be a monumental
challenge for organizations that perform those functions using in -house staff. However,
as even the most routine tasks become more complex, facility executives search for
innovative ways to improve services and save cost. Despite a steep learning curve, hiring
service contractors is a logical business decision that, if implemented properly, can benefit

151
an organization for years. The strategy can be in -house and out-source strategy. Both
strategies have their own benefits and their disadvantages. It depends on an organization
and the nature of its business to determine its strategy. The facilities management strategy
reflects the organization’s business objectives, needs and policies, as well as
practicalities. Outsourcing strategy means transfers made by an organization on one of its
support functions or the facilities management service to a third party service provider,
thus this brings the concept of hiring outside professional service to meet the in-house
need. The subsequent section will highlight some of the Facilities Management in
Malaysian private hospitals.
FACILITIES MANAGEMENT IN MALAYSIAN PRIVATE HOSPITALS
Malaysia is a multi-ethnic society of more than 24 million people including Malays,
Chinese, Indians and numerous indigenous communities living together harmoniously.
Despite the country’s astonishing economic growth in the last two decades, the Malaysian
healthcare sector is still developing. Currently there are 117 public and 224 private
hospitals in this country. The Malaysian government has spent around three per cent (3%)
of its Gross Domestic Product (GDP) on healthcare, considerably lower than other
developing countries in the region (Butt and Run, 2009). Although the Malaysian
government continuously allocates funds to improve its public healthcare infrastructure,
others have alleged that government officials indirectly encouraged the private sector by
allocating insufficient funds for the public sector healthcare (Ramesh and Wu, 2008). In
comparison to neighboring countries such as Thailand, with highly state funded public
health sector, the Malaysian government has managed to maintain a balance between
private and public healthcare. Malaysia has achieved this balance mainly through gradually
reducing public hospital funds, while avoiding any political backlash (Ramesh and Wu,
2008). This has resulted into significant private healthcare provider growth particularly in
urban areas. Nowadays, private healthcare plays a significant role in the overall Malaysian
healthcare sector growth. This is also evident by recent growth projections that Malaysian
private health care will be responsible for half its needs by 2020. These trends indicate that
a highly competitive healthcare industry is emerging in Malaysia, where private healthcare
will face competition from the existing public healthcare facilities and the growing private
enterprise. The private hospitals need to maintain the facilities provided to achieve their
goals and to make their patrons satisfied. As discussed earlier, certain facilities in
Malaysian private hospital has been outsourced. Thus, hiring maintenance team to
maintain the facilities provided in private hospitals is unavoidable. Malaysia has a mixed
public-private healthcare system, where the private sector is particularly strong in the urban
areas. In the public sector, the Ministry of Health (MOH) is the main healthcare provider
through its extensive network of primary care clinics, and hospitals ranging from small
district hospitals without specialists to large hospitals at state capitals providing specialist
and subspecialty services. Besides MOH, University Hospitals under the Ministry of
Higher Education are also important providers while the Ministry of Defense has two
hospitals for military personnel and their families. Table 2.1 shows the distribution of
hospital beds in the country by sector and major providers.

152
While the public sector community or health clinics are the major primary care
providers in the rural populations, private general practitioners operating as solo or group
practices, are major providers in the urban areas where several clinics can be found in
a housing area or commercial area. Malaysia’s total health expenditure constituted 3.8%
of its GDP in 2002 where 56% were in the public sector. The Ministry of Health (MOH) is
the largest source of health expenditure within the public sector (86%) that has been funded
through general taxation. Household out-of-pocket spending accounted for the largest
source in the private sector (74%). Supporting services for healthcare are like hospital
infrastructure, HR managing, research development, procurement and facilities management
meanwhile the primary activities are operation, services and managing and sales. (Kadir,
2014)
Over the years, there have been many definitions of Facilities Management based on its
specific objectives and scope. Facilities Management includes the services and
performance toward organizational improvement, and these involve people, process,
environment, health and safety which are the responsibilities in Facilities Management and
the focus of Facilities Management in the workplace appears to be a commonality
(Madding, 2011). The authors have added workplace in this article. It refers to a place
where work of any nature is carried out. Thus, it is not limited to commercial office
buildings of the private sector only but also includes other types of workplace such as
hospital, educational and industrial workplaces in the public sector ; ( R u z a l l i ,2013)
defined Facilities Management as the process which the provision of a total work
environment including building, office equipment and services of the highest acceptable
standards are of value for money. This definition enables an organization to optimize its
core skills and focuses more on the profit of the core product. The fundamentals of this
disciple are constantly being rethought with new ideas and theoretical approaches in order
to build its image and to ensure that it is planned, organized and implemented to match the
organizational needs.
The Facility Management Association of Australia (FMAA) defines facilities management
as 'a business practice that optimises people, process, assets and the work environment to
support the delivery of the organization’s business objective'. Although facilities
management centres on the triad of people, process, and place, the element of people is
incomplete without recognition and consideration from different generations that make up
today’s workforce and the differences between these groups. Furthermore, the concept of
core and non-core competencies (Waheed and Fernie, 2009) is logically the starting point
for understanding what facilities management is not perceived to be at the moment. The
authors describes core organisational capabilities as those capabilities that are directly
added for the benefits of customers, are not easy for competitors to imitate, and can be
leveraged for competitiveness across products and markets. Non-core capabilities, simply
put, are those that are not critical to the company’s revenue stream. Unfortunately,

153
facilities management currently falls into the latter category. The next section will discuss
some of the outsourcing services in facilities management perceived by private hospitals in
Malaysia.
OUSOURCING SERVICES IN FACILITIES MANAGEMENT
Facilities Management outsourcing may lead to a leaner, more efficient organisation that
can concentrate on core business and reduce operating costs. Organisation explores
outsourcing options for a variety of reasons where are to reduce the cost, the potential to
convert fixed costs to variable costs, insufficient management time available for the in-
house operation or its improvement and difficulty in retaining sufficiently qualified staff,
(Young,2007), those services which are not seen as basic (core services) are more disposed
to be outsourced. However, the most complex and professional areas are more difficult
to outsource due to the power owned by workers and to the difficulty in measuring and
controlling the specifications related to services. Outsourcing the Facilities Management to
an external specialist enables the customer to retain control of services strategy and policy
whilst simultaneously delegating the management of the premises and related functions.
This allows customer to focus their management resources toward their own core business,
whatever it may be with careful planning and management, organisations can achieve
substantial gains by efficiently contracting out their facilities management service
(Ruzalli,2013). Outsourcing is transferring business process from one company to another.
A parent company uses outside firms to provide a business function that could have been
done in house. The aim of outsourcing is to make the business or organization more
competitive by staying focused on its core competencies. However, the motivations for
outsourcing remain largely the same and have traditionally centred on cost reduction
although the advantages of outsourcing in terms of access to scare expertise, faster time
to market, and higher quality products and services, are now also being recognised as key
drivers. The authors have added a decision to outsource based on achieving better ‘‘scale’’
or being able to ‘‘specialise’’ in certain business areas which is considered functional.
However, a decision to ‘‘sell’’ or ‘‘surrender’’ the IT function to an external vendor either
for short-term gain or to extricate the organisation from IT responsibility is considered
dysfunctional. Meanwhile, with a rapidly expanding outsourcing industry in the 1990s, the
scope and nature of outsourcing began to attract more research attention. The authors also
have focused on the performance of outsourcing arrangements. In particular, the relationship
between client and vendor is seen as a critical determinant of outsourcing success.
(Gonzalez et.al.,2013) Concepts, principles, practices and theories demonstrate their true
value when they can be tied to positive or negative results, and as such, the practice-
performance link is of considerable interest to researchers and practitioners alike. As a
general rule, “performance” in the supply chain-related literature has focused upon financial
and operational measures of performance (Ketokivi and Schroeder,2004) which is
supported by (Brewer ,2011).
CONCLUSION
This article reviews the literature on outsourcing in the healthcare sector with aggregated view.
Available information regarding the importance of implementation outsourcing services in
Malaysia private hospitals, and also advantages and opportunities that turned out sourcing
in this sector has been summed up. It is crucial to highlight that prior to having facilities

154
management it is essential to understand the outsourcing services in the private sector.
Therefore, this article categorizes the literature and does a critical review on the information
according to outsourcing facilities management functions in private hospitals. To do this,
10 articles on the issues pertaining to outsourcing facilities management have been
reviewed critically. To highlight the importance of the implementation of outsourcing
FM and its criteria, a primary data collection method using survey or interview can be
conducted in future.
Acknowledgement: I would like to express my gratitude to my supervisor and co-
supervisors for their assistance in this research. I would also like to thank UTM Razak School
of Engineering and Advanced Technology and Universiti Tunku Abdul Rahman (UTAR) for
the opportunity and support that they have given to me in conducting this research.
REFERENCES
Barry Brewer (2011) Connecting strategy-linked outsourcing approaches and expected
performance
Mikko Ketokivi, Roger Schroeder, (2004) "Manufacturing practices, strategic fit and
performance: A routine-based view", International Journal of Operations & Production
Management, Vol. 24 Iss: 2, pp.171 – 191
Mohsin Muhammad Butt and Ernest Cyril de Run, 2009, Private healthcare quality:
applying a SERVQUAL model.
Muhammad Yusri Zubair b.Ruzali (2013) Risk associated with facilities management
outsourcing and its mitigation strategies.
Norimah Binti Madding,(2011) The effectiveness of facilities management outsourcing in
public hospital building.
Ramesh, M. and Xu Wu (2008), “Realigning public and private healthcare in southeast
Asia”, The Pacific Review, Vol. 21 No. 2, pp. 171-87.
Reyes Gonzalez, Juan Llopis and Jose Gasco (2013) Outsourcing and strategy in Spanish
town halls: a field study
Siti Solehah Binti Kadir (2014) Assessing Implementation of Outsourcing Facilities
Management in Private hospital Buildings
Suzanne Young,(2007). “Outsourcing: uncovering the complexity of the decision”,
International Public Management Journal, 10(3), pp. 307-325.
Xianhai Meng, (2015) Facilities Management; Tracing its development trajectory property
management,Vol.33 Issue,PP.212-223
Zehra Waheed and Scott Fernie (2009) Knowledge based facilities Management-School of
the Built Environment, Heriot-Watt University, Edinburgh, UK

155
i UN-Habitat. Urbanization and Development: Emerging Futures. Nairobi, Kenya, 2016.
ii Alizadeh, Hooshmand. The Challenge of Sustainable Urban Development in Third World Countries. Designing
Soundscape for Sustainable Urban Development. Edited by Östen Axelsson. Stockholm, Sweden: Environment and Health
Administration City of Stockholm, 2010.
iii Ubale, Mohammed Yahaya, David Martin, and Seow Ta Wee. "Examining and Suggesting Remedy to the Effects of
Urban Informal Sector in Urban Residential Property Market in Bauchi, Nigeria." International Journal of Physical and
Human Geography 1, no. 2 (2013): 31-46 iv Majidzadeh, Y. The Beginning of Civilization Ship in Iran. Tehran: University public center, 1998. v Mostofi, H. Nazhal Gholob, by the Effort of Mahmoud Dabir Siaghi. Tehran: Tahori library, 1957. vi Lambton, Ann KS. "The Internal Structure of the Saljuq Empire." The Cambridge History of Iran 5, no :)1968( 227 .
635ff. vii Mostofi, Nazhal Gholob, 1957. viii Clarke, John Henrik and Brian Drummond Clarke. Kermanshah: An Iranian Provincial City. University of Durham,
Department of Geography, 1969. ix The city, best known as the location of the Battle of Karbala (680), is believed to be as holy a city for Shia Muslims. x Calmard, Jean. "Kermanshah Iii: History to 1953." In Encyclopedia Iranica, edited by Ehsan Yarshater .Columbia
University: online edition., 2015. xi In 1966, the population of Kermanshah Ostan has diminished markedly since the establishment of the separate Farmandari of Hamadan
and Ilam (Clarke & Clarke: 1969: 8). xii Clarke and Clarke. Kermanshah: An Iranian Provincial City, 1969: 38-39. xiii Mehriar, Mohammad, Shamil Fatholayouf, Farhad Fakhari Tehrani, and Bahram Qaderi. Asnad-E-Tasveri Shahrha-E
Irani (the Old Maps of Iranian Cities). Tehran: Shahid Beheshti University Press, 1998. xiv Clarke and Clarke. Kermanshah: An Iranian Provincial City, 1969: 51. xv Irandoost, Kayoumars, Hooshmand Alizadeh, and Roholah Tavallaii. "Analyzing the Level of Development in Rural
Areas Using Factor and Cluster Analysis, Case Study: Kurdistan Province." Journal of Housing and Rural Environment
32, no. 144 (2014): 107-23. http://jhre.ir/article-1-257-en.html. xvi Hall, Peter. Land, Shelter and Transport: The Latin America Way World Bank/IPea Urban Research Symposium.
Brasilia, April, 2005. xvii Freire, Mila. Urban Planning: Challenges in Developing Countries. International Congress on Human Development,
Madrid, 2006.