DESIGN, DEVELOPMENT, AND VERIFICATION OF AN …
126
DESIGN, DEVELOPMENT, AND VERIFICATION OF AN AUTOMATED PAIN MEASUREMENT DEVICE by Morgan L. Hill B.S. University of Colorado, 2012 A thesis submitted to the Faculty of the Graduate School of the University of Colorado in partial fulfillment of the requirement for the degree of Master of Science Department of Mechanical Engineering 2013
Transcript of DESIGN, DEVELOPMENT, AND VERIFICATION OF AN …

DESIGN, DEVELOPMENT, AND VERIFICATION OF AN AUTOMATED PAIN
MEASUREMENT DEVICE
by
Morgan L. Hill
B.S. University of Colorado, 2012
A thesis submitted to the
Faculty of the Graduate School of the
University of Colorado in partial fulfillment
of the requirement for the degree of
Master of Science
Department of Mechanical Engineering
2013

This thesis entitled:
Design, Development, and Verification of an Automated Pain Measurement Device
Written by Morgan L. Hill
has been approved for the Department of Mechanical Engineering
Mark Rentschler, Ph.D.
Daria Kotys-Schwartz, Ph.D.
Date
The final copy of this thesis has been examined by the signatories, and we find that both the content
and the form meet acceptable presentation standards of scholarly work in the above mentioned
discipline.
IRB Protocol # 07-0354

iii
Morgan L. Hill (B.S. /M.S., Mechanical Engineering)
Design, Development, and Verification of an Automated Pain Measurement Device
Thesis directed by: Professor Mark Rentschler, Ph.D. Collaborators: Vikas Patel, M.D., Emily Lindley, Ph.D.
Abstract
The focus of this study is the redesign, development, fabrication, and initial evaluation of an
automated pain measurement device. The redesign will focus on improving the original
Computer Controlled Pressure Algometer, designed by Zimkowski in 2010. Pain
measurement is very difficult to accurately accomplish, and current methods are limited to
subjective techniques such as pain rating scales and handheld algometry. These subjective
methods of pain measurement have many shortcomings that render them inadequate at
reliably assessing an individual’s pain. Large variability has been shown with these testing
methods, which can be prone to error due to test administrator, environmental and
psychological conditions, and individual patient factors. This study hypothesizes that by
creating an automated device, these sources of variability may be minimized. The improved
automated pain measurement device enhances usability, functionality, and aesthetics
compared to the original device – these improvements will enable more practical clinical
studies. Furthermore, the addition of biometrics could introduce an objective measure of
pain. By creating an automated pain measurement device with integrated biometrics, both
subjective and objective pain response data could be collected for each patient, eventually
establishing a personalized pain scale for each patient. These personalized pain scales
could then be used to better assess, diagnose, and treat ailments which cause chronic and
acute pain.

iv
Acknowledgements
Thanks to Dr. Mark Rentschler for his wonderful advising throughout my Master’s Degree
experience – his guidance and support were invaluable. Thanks also to Dr. Vikas Patel and
Dr. Emily Lindley for their vision and creation of this project.
Without the assistance from colleagues, this work would not have been the same. Thanks to
Levin Sliker, who was so generous to help with the LabView control system – the
knowledge he imparted on me was crucial to the functioning of the AmP-MeD. I would also
like to thank Michael Zimkowski who laid the groundwork for this research. His
development of the original CCPA enabled the AmP-MeD to be developed, and greatly aided
in the progress and research of this project.
The support and encouragement from my family have made this endeavor possible. They
have always encouraged me to pursue my dreams and believed that I would achieve them,
and for that I am so grateful.

v
Table of Contents
Abstract .................................................................................................................................................................... iii
Acknowledgements ............................................................................................................................................. iv
Chapter 1 ................................................................................................................................................................. 1
Introduction ............................................................................................................................................................ 1
Chapter 2 ................................................................................................................................................................. 4
Background and Motivation ............................................................................................................................. 4
2.1 Current Pain Measurement Methods................................................................................................. 5
2.1.1 Verbal Rating Scale .......................................................................................................................... 6
2.1.2 Visual Analog Scale .......................................................................................................................... 6
2.1.3 Numeric Rating Scale ...................................................................................................................... 7
2.1.4 Faces Rating Scale ............................................................................................................................ 7
2.1.5 Oswestry Disability Index ............................................................................................................. 8
2.1.6 Behavioral Pain Scale ...................................................................................................................... 8
2.1.7 Quantitative Sensory Testing Method ...................................................................................... 9
2.2 Pressure Algometers ............................................................................................................................. 10
2.2.1 Market Algometers ....................................................................................................................... 11
2.2.2 Devices Developed for Research Purposes.......................................................................... 16
2.3 Limitations of Current Pain Measurement Techniques .......................................................... 17
2.3.1 Application Rate ............................................................................................................................. 18
2.3.2 Test Administrator Psychological and Environmental Effects .................................... 18
2.3.3 Other Sources of Error ................................................................................................................. 19
2.4 Physiological Signals Correlated to Pain Response .................................................................. 19
2.4.1 Relationship between Blood Pressure and Pain Response ........................................... 20
2.4.2 Heart Rate ......................................................................................................................................... 20
vi
2.4.3 Skin Impedance .............................................................................................................................. 21
2.4.4 Pupil Dilation ................................................................................................................................... 21
2.4.5 Respiratory Rate ............................................................................................................................ 21
2.4.6 Body Mass ......................................................................................................................................... 21
2.5 Towards an Ideal Pain Measurement Device .............................................................................. 22
Chapter 3 .............................................................................................................................................................. 24
Pain Measurement Device Design ............................................................................................................... 24
3.1 Zimkowski CCPA ..................................................................................................................................... 24
3.2 Overall CCPA Design .............................................................................................................................. 28
Chapter 4 .............................................................................................................................................................. 29
AmP-MeD Design ............................................................................................................................................... 29
4.1 AmP-MeD Goals ....................................................................................................................................... 29
4.2 Geared-Motor Actuation System ...................................................................................................... 30
4.2.1 Load Cell ............................................................................................................................................ 34
4.2.2 Application Tip ............................................................................................................................... 34
4.3 Electronics ................................................................................................................................................. 36
4.4 Software (Actuation and Control Methods) ................................................................................. 37
4.4.1 Data Acquisition ............................................................................................................................. 37
4.4.2 LabVIEW Software ........................................................................................................................ 38
4.5 Frame Design ........................................................................................................................................... 41
4.6 Safety and Emergency Stops .............................................................................................................. 44
4.7 Physiological Data Integration .......................................................................................................... 46
4.8 Test-Administrator Interface ............................................................................................................. 47
4.9 Patient Interface ..................................................................................................................................... 48
4.10 Overall AmP-MeD System................................................................................................................. 49

vii
Chapter 5 .............................................................................................................................................................. 51
Results .................................................................................................................................................................... 51
5.1 AmP-MeD in comparison to Wagner and CCPA Devices ......................................................... 51
5.2 Engineering Experimental Results .................................................................................................. 54
5.2.1 Load Cell Calibration .................................................................................................................... 54
5.2.2 Control Loop Evaluations ........................................................................................................... 55
5.3 Subject Experimental Results ............................................................................................................ 58
5.3.1 Initial Study Results ...................................................................................................................... 58
5.3.2 Study Results ................................................................................................................................... 62
Chapter 6 .............................................................................................................................................................. 70
Discussion ............................................................................................................................................................. 70
6.1 Difference in PPT Magnitude between Automated and Handheld Devices ..................... 70
6.2 Less Variation in Measurements with Automated versus Handheld Device .................. 72
6.3 AmP-MeD versus CCPA ........................................................................................................................ 72
6.4 Participant and Test Administrator Feedback ............................................................................ 73
Chapter 7 .............................................................................................................................................................. 77
Future Directions ............................................................................................................................................... 77
Chapter 8 .............................................................................................................................................................. 78
Conclusion............................................................................................................................................................. 78
Chapter 9 .............................................................................................................................................................. 79
Bibliography ......................................................................................................................................................... 79
Chapter 10 ........................................................................................................................................................... 80
References ............................................................................................................................................................ 80
Chapter 11 ........................................................................................................................................................... 85
Appendices ........................................................................................................................................................... 85
Appendix 11.1 Oswestry Disability Index ............................................................................................ 85
Appendix 11.2 Load Cell Datasheet ........................................................................................................ 87

viii
Appendix 11.3 LabVIEW Code .................................................................................................................. 91
11.3.1 Motor Encoder Reset, Button and Load Cell Control .................................................... 91
11.3.2 Automatic Control (Case 0) ..................................................................................................... 92
11.3.3 Automatic Control (Case 1) ..................................................................................................... 92
11.3.4 Automatic Control (Case 2) ..................................................................................................... 93
11.3.5 End of Control Loop – Integration with Mechanical Safety Stop .............................. 94
Appendix 11.4 SolidWorks Part Drawings for Frame Fabrication ............................................. 95
Appendix 11.5 AmP-MeD Testing Procedure ................................................................................... 104
Appendix 11.6 Minitab Results Analysis ............................................................................................ 111

ix
Table of Tables
Table 1: CCPA versus Wagner ForceOneTM Results [8] .................................................................... 25
Table 2: Main Hardware Components Associated with CCPA ......................................................... 27
Table 3: Pololu Motor Specifications ......................................................................................................... 31
Table 4: CCPA versus AmP-MeD Component and Total Weights ................................................... 42
Table 5: AmP-MeD components .................................................................................................................. 49
Table 6: Average Device Setup Time summary of Wagner, CCPA, and AmP-MeD devices .. 53
Table 7: Average recording time per test and simplicity levels of test-administrator and
patient interfaces compared between Wagner, CCPA, and AmP-MeD devices.......................... 53
Table 8: Descriptive Statistics Summary. Mean and Standard Deviation (StDev) PPT
measurements made on all (grouped) test participants by AmP-MeD and Wagner devices.
................................................................................................................................................................................... 66
Table 9: Descriptive Statistics Summary. Mean and Standard Deviation (StDev) PPT
measurements made on each (separated) test participant by AmP-MeD and Wagner
devices. ................................................................................................................................................................... 66

x
Table of Figures
Figure 1: Verbal Rating Scale........................................................................................................................... 6
Figure 2: Visual Analog Scale........................................................................................................................... 6
Figure 3: Numeric Rating Scale ...................................................................................................................... 7
Figure 4: Faces Rating Scale [A] ..................................................................................................................... 8
Figure 5: Behavioral Pain Scale [B] ............................................................................................................... 9
Figure 6: Wagner "Pain Test" FPK Algometer, Force Dial [C] .......................................................... 12
Figure 7: Wagner "Pain Test" FPX Algometer, Force Ten [C] ........................................................... 12
Figure 8: Wagner "Pain Test" FPIX Algometer, Force One [C] ......................................................... 13
Figure 9: Somedic Algometer [D] ............................................................................................................... 13
Figure 10: JTech Commander Algometer [E] ......................................................................................... 14
Figure 11: JTech Tracker Freedom Wireless Algometry Device [E] ............................................. 14
Figure 12: Koo et al. Automated Deformation-Controlled Indentation Algometer – testing
performed on erector spinae muscles ........................................................................................................ 17
Figure 13: Zimkowski CCPA Design –load frame with patient control remote, physiological
data monitoring equipment, laptop computer and control box. Photo omits air compressor
and all electrical connections (wiring). ..................................................................................................... 25
Figure 14: Pololu Motor used in AmP-MeD motorbox ....................................................................... 31
Figure 15: Linear Actuator Gearing Assembly used for AmP-MeD Actuation System .......... 32
Figure 16: Location of AmP-MeD test site - Tibialis Anterior [F] ................................................. 35
Figure 17: Application Tip Connection Assembly to Rack for AmP-MeD Actuation .............. 35
Figure 18: AmP-MeD Power Supply .......................................................................................................... 36
Figure 19: Motorbox with Wired Arduino Control Boards – photo of interior ........................ 37
Figure 20: LabVIEW User Graphical Interface – User Inputs Area ................................................ 40
Figure 21: LabVIEW User Graphical Interface - User Visualization Area ................................... 41
Figure 22: AmP-MeD Frame - Structural and Adjustable Assemblies ......................................... 43
Figure 23: ECG Signal Monitor (Left) and Finapress BP Monitor (Right)................................... 46
Figure 24: AmP-MeD Patient Interface - Handheld Remote ............................................................ 48
Figure 25: Complete AmP-MeD Test Setup ............................................................................................ 50
Figure 26: QFD Analysis of AmP-MeD in comparison to the CCPA and Wagner devices ..... 52

xi
Figure 27: Load Cell Calibration in AmP-MeD Device ........................................................................ 54
Figure 28: Force Feedback control on participant - characteristic example. Graph is of force
applied (in kgf units) versus time. The white line follows the force-application path over
time, while the red line is the force limit safety cutoff. The green threshold and tolerance
lines have been added to indiate where the participant indicated PPT and PPTol,
respecively, during this test run. .................................................................................................................. 56
Figure 29: Force Feedback control on participant – characteristic example. The top plot
represents motor position in revolutions per time. The white line is the position of the
motor, and the red line is the zero position of the motor. The bottom plot represent motor
speed in revolutions per minute per time. The white line is the motor speed and the red
line is the set point speed. The motor is operating at set point speed until the participant
presses the remote the second time (indicating PPTol), then the motor rapidly backs out
and shoots toward a 0 rpm speed, with significant overshoot (to maximize retraction speed
of the rubber application tip). ....................................................................................................................... 57
Figure 30: Top-down view of setup for AmP-MeD testing ............................................................... 59
Figure 31: Initial Study Results Boxplot – separated by participant (1-9, dashed lines
between) and device (green boxes indicate AmP-MeD and blue boxes indicate Wagner).
White squares in individual boxes represent median values of that test group. ...................... 60
Figure 32: Trimmed Data from Initial Study – Patient 5 omitted to view magnitude and
variation within and between groups more closely. Separated by participant (1-9, omitting
5, dashed lines between) and device (green boxes indicate AmP-MeD and blue boxes
indicate Wagner). White squares in individual boxes represent median values of that test
group. ...................................................................................................................................................................... 61
Figure 33: Test Locations for the Study, modified from [F] ............................................................. 63
Figure 34: Study Results – Separated by participant (1-10, dashed lines between) and
device (green boxes indicate AmP-MeD and blue boxes indicate Wagner). White squares in
individual boxes represent median values of that test group, individual data points marked
by black circles. Participant 8 includes an outlier, marked by the black circle with a red
cross on one Wagner measurement. .......................................................................................................... 64
Figure 35: Study Results - Separated by participant (1-10, dashed lines between), device
(green boxes indicate AmP-MeD and blue boxes indicate Wagner), and test location (A, B,
xii
and C, as depicted in Figure 33). White squares in individual boxes represent median
values of that test group. ................................................................................................................................. 65
Figure 36: Probability Plots for Normally Distributed Data: separated into PPT
measurements made by the AmP-MeD and the Wagner Devices. .................................................. 67
Figure 37: ANOVA Results of PPT measurements made by Wagner and AmP-MeD show
that there is a significant difference in PPT measured with Wagner versus AmP-Med
(P=0.000) and that the Wagner measurements are significantly higher (groups A and B). 68
Figure 38: Test for Equal Variance of PPT Measurements made by AmP-MeD and Wagner
devices. The low ratio of variance and the low P-values indicate that the Wagner device
made measurements with significantly higher variance than the AmP-MeD Device. ............ 69
Figure 39: Wagner Handheld Device Testing Position ...................................................................... 74
Figure 40: Wagner Testing, with Test Administrator's Right Hand Making Contact with
Participant ............................................................................................................................................................ 74
Figure 41: Deflection of AmP-MeD Arm at High Forces .................................................................... 76
Figure 42: LabVIEW Code - Motor Encoder Reset, Button and Load Cell control ................... 91
Figure 43: LabVIEW Automatic Control (Case 0) ................................................................................. 92
Figure 44: LabVIEW Automatic Control (Case 1) ................................................................................. 92
Figure 45: LabVIEW Automatic Control (Case 2) ................................................................................. 93
Figure 46: LabVIEW End of Control Loop - Integration with Mechanical Safety Stop .......... 94
Figure 47: Patient Positioning with AmP-MeD ................................................................................... 104
Figure 48: Proper Height adjustment for test location .................................................................... 105
Figure 49: Proper angular adjustment for leg size ............................................................................ 105
Figure 50: Test Administrator Interface - Test Setup steps have been highlighted in green
................................................................................................................................................................................. 107
Figure 51: Manual Control - Manual reverse steps are highlighted in green .......................... 108
Figure 52: Force (left column) and Position (right column) data from AmP-MeD test. First
two rows are from program initiation. 3rd and 4th row are from the "practice test". Rows
5-10 are test data, alternating between threshold and tolerance measurements. ................ 109
Figure 53: Data copied into Patient's Excel File ................................................................................. 109

xiii
Glossary
Term Definition
Algometer A device used to measure sensitivity to an applied pain stimulus
Pressure Algometer An algometer that applies pressure as the applied pain stimulus
Pressure Pain Threshold (PPT)
The moment a patient begins to perceive pain and not just pressure
Pressure Pain Tolerance (PPTol)
The moment the applied pain is perceived to be intolerable
AmP-MeD The Automated Pain Measurement Device developed and discussed in this paper
CCPA The Computer Controlled Pressure Algometer developed by M. Zimkowski in 2010

1
Chapter 1
Introduction
Pain is extremely difficult to accurately measure, as is evidenced by the lack of sufficient
pain measurement tools used today. The subjective nature of pain poses the primary
challenge in pain measurement, as subjective responses vary depending on the patient and
how he/she reacts to environmental, psychological, physical, and physiological influences.
Current pain measurement methods include visual, numerical, verbal, and behavioral pain
rating scales as well as the use of handheld algometers. Typically, a physician will use a
pain rating scale to assess a patient’s pain level (see Section 2.1 Current Pain Measurement
Methods for an outline of how each pain rating scale is used). The use of algometers is
restricted mostly to research but does exist sparingly in clinics. While pressure algometers
present an advantage over pain rating scales since they enable a clinician to establish a
more precise pain scale of an individual patient, they have significant shortcomings as well.
The most noteworthy shortcoming of existing pain measurement techniques is that both
pain rating scales and pressure algometers are limited to the measurement of a patient’s
subjective response to pain and do not allow any objective measures. This limits the
clinician to interpreting the patient’s mental response to the pain stimulus (either clinically
applied pain or accidental acute or chronic pain) rather than his/her bodily response.
Pain measurement techniques also lack accuracy, precision, and repeatability. Pain rating
scales have as few as four markers for patients to choose from, which can result in very

2
imprecise pain perception approximations. Pressure algometers increase the precision of
pain measurement by allowing the patient to indicate his/her threshold and tolerance at
any time. However, the clinician is then responsible for quickly stopping the pain stimulus.
The delay between patient indication and test administrator recognition can cause vast
discrepancies in the load readings provided by the pressure algometers. The accuracy,
precision, and repeatability of handheld pressure algometers can also be compromised by
test administrator techniques such as angle and rate of pressure application.
Finally, it is evident that environment can play a large role in pain perception. A human test
administrator can influence a patient’s perception, and the use of multiple clinicians on one
patient can introduce large variability. For example, if a unique clinician visits a patient
every hour to assess his/her pain, the patient may respond differently to each clinician.
This shortcoming is applicable to both pain rating scales as well as handheld pressure
algometer readings.
To improve upon the shortcomings exhibited by current pain measurement techniques, an
automated pressure algometer has been developed. It is hypothesized that an automated
pressure algometer maintains the benefits of a handheld algometer (creating an individual
patient pain scale by recording threshold and tolerance) while introducing novel pain
measurement techniques. The automated pressure algometer developed will integrate the
patient’s subjective pain response (threshold and tolerance) with objective pain response
(physiological signals linked to pain). The combination of both subjective and objective
data paired with the ability to consistently test patients using the same method and device

3
(thus minimizing variability caused by environmental discrepancies) could be a significant
advance in pain measurement.
Improvements in pain measurement could lead to exciting clinical benefits such as
improved pain diagnosis, more accurate pain medication dosing, pain management and
treatment, and measurement of chronic and acute pain for both communicative and non-
communicative patients alike.
An individual pain scale could be developed per-patient and measured in the clinic at the
same time as other vital signs such as blood pressure and pulse. This individual pain scale
would facilitate the dosing of pain medications in the future for the patient, improve the
assessment of pain, and quantify the success of treatments prescribed to alleviate said pain.
In a clinical sense, an automated pressure algometer would improve clinicians’ abilities to
better treat patients – thus improving the quality of life of pain-sufferers around the world.
In an academic sense, the use of this automated pressure algometer could enable accurate
research of the relationship of psychological and physiological responses to pain. This
understanding would be a significant advance in psychology, physiology, and medicine that
could lead to exciting new frontiers.

4
Chapter 2
Background and Motivation
Pain is defined by the International Association for the Study of Pain as an unpleasant
sensory and emotional experience associated with actual or potential tissue damage [1]. This
unpleasant sensory and emotional experience is extremely difficult to measure, and presents
a significant challenge to researchers and clinicians alike.
There are many contributing factors that render pain such a difficult entity to measure.
Different patients perceive pain differently depending on race, sex, ethnicity, and between
individuals [1]. Pain perception can furthermore depend on an individual’s conditioning,
personality, past experiences, present experiences, and training [1]. Additionally, patients
express their pain perception differently through facial expressions, verbal communication,
vocalization, and physical expression [2]. To add to the challenge, certain patients do not
respond to pain normally (e.g. those that are critically ill, those with brain and spinal cord
injuries, and those with mental illness) but the need to assess these patients’ pain levels
remains essential [3].
The difficulty of pain measurement is certainly an interesting challenge, but it is extremely
important to pursue a solution. The Medical Expenditure Panel Survey of 2008 studied 100
million Americans, and determined that additional health care costs due to pain ranged
from $261 to $300 billion in the USA, amounting to an average increase in healthcare cost
per-person of 6.6%. These substantial costs are greater than the average costs due to heart
disease, cancer, and diabetes [4]. Clearly the considerable cost of pain treatment and the
5
significant decrease of quality of life caused by inadequate pain treatment calls for a better
method to measure and diagnose pain. Because of this clear need, the Joint Commission on
Accreditation of Healthcare Organizations recognized pain as a fifth vital sign in addition to
pulse, blood pressure, temperature, and respiration [5]. This recognition of the importance
of pain further emphasizes the need to develop an adequate pain measurement technique.
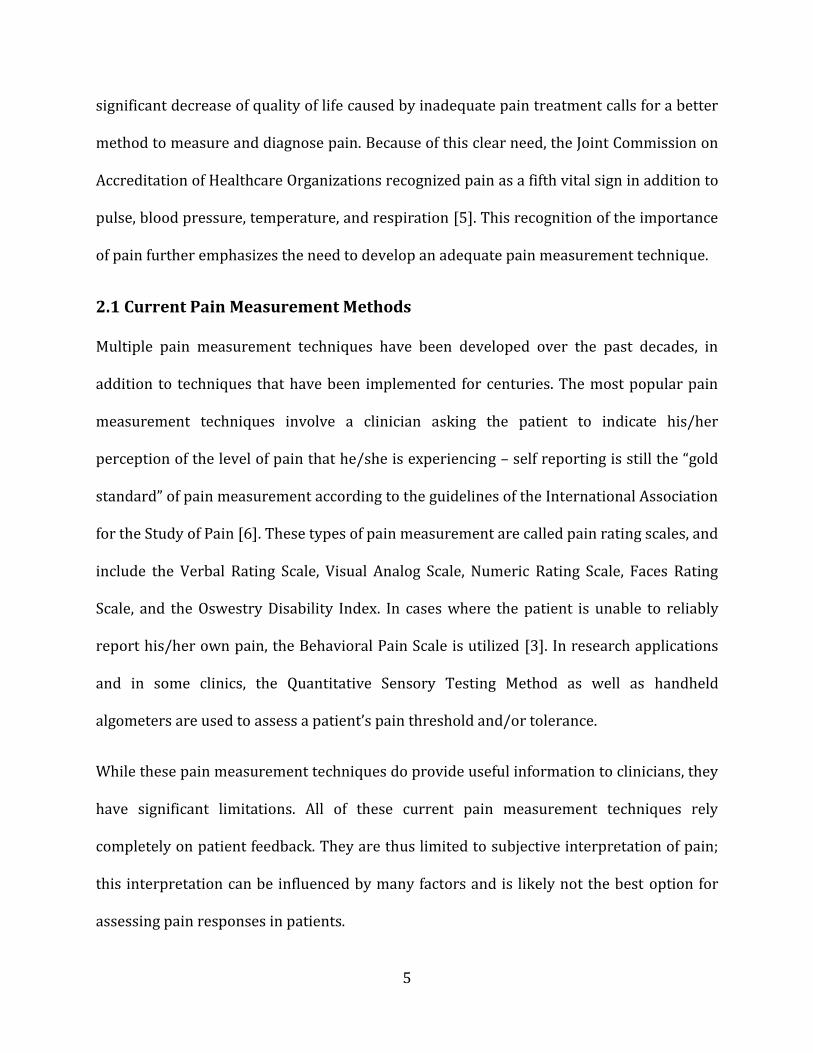
2.1 Current Pain Measurement Methods
Multiple pain measurement techniques have been developed over the past decades, in
addition to techniques that have been implemented for centuries. The most popular pain
measurement techniques involve a clinician asking the patient to indicate his/her
perception of the level of pain that he/she is experiencing – self reporting is still the “gold
standard” of pain measurement according to the guidelines of the International Association
for the Study of Pain [6]. These types of pain measurement are called pain rating scales, and
include the Verbal Rating Scale, Visual Analog Scale, Numeric Rating Scale, Faces Rating
Scale, and the Oswestry Disability Index. In cases where the patient is unable to reliably
report his/her own pain, the Behavioral Pain Scale is utilized [3]. In research applications
and in some clinics, the Quantitative Sensory Testing Method as well as handheld
algometers are used to assess a patient’s pain threshold and/or tolerance.
While these pain measurement techniques do provide useful information to clinicians, they
have significant limitations. All of these current pain measurement techniques rely
completely on patient feedback. They are thus limited to subjective interpretation of pain;
this interpretation can be influenced by many factors and is likely not the best option for
assessing pain responses in patients.
6
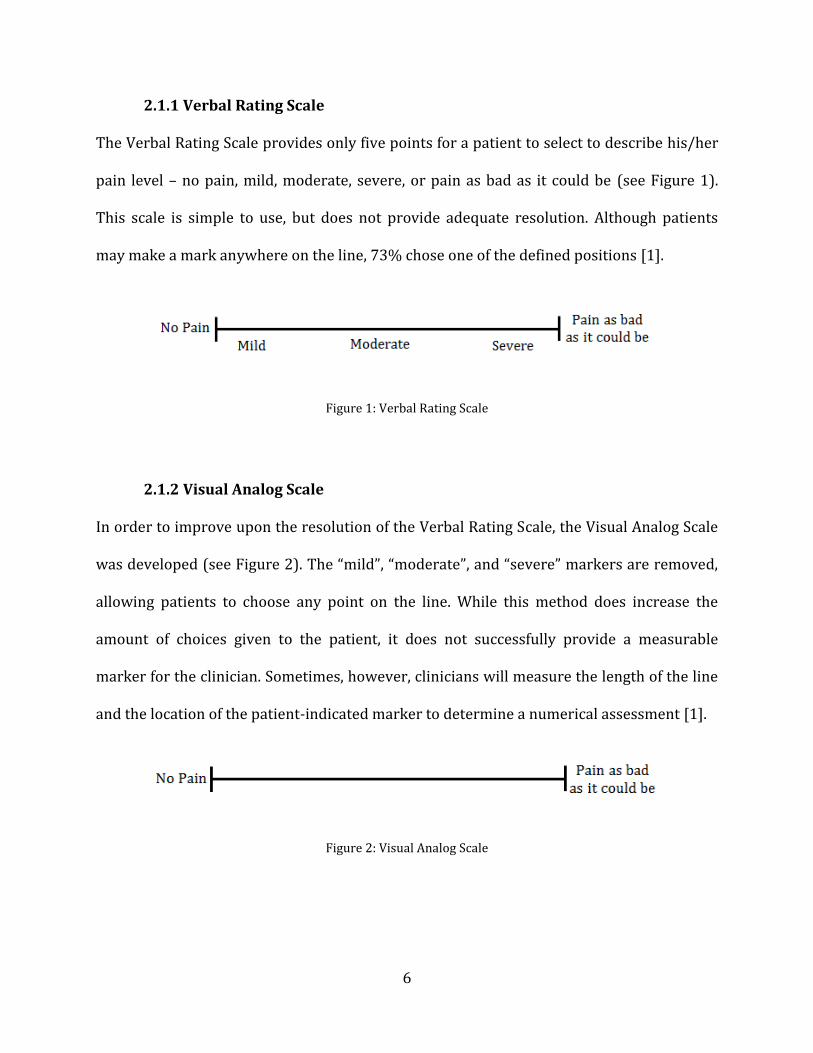
2.1.1 Verbal Rating Scale
The Verbal Rating Scale provides only five points for a patient to select to describe his/her
pain level – no pain, mild, moderate, severe, or pain as bad as it could be (see Figure 1).
This scale is simple to use, but does not provide adequate resolution. Although patients
may make a mark anywhere on the line, 73% chose one of the defined positions [1].
Figure 1: Verbal Rating Scale
2.1.2 Visual Analog Scale
In order to improve upon the resolution of the Verbal Rating Scale, the Visual Analog Scale
was developed (see Figure 2). The “mild”, “moderate”, and “severe” markers are removed,
allowing patients to choose any point on the line. While this method does increase the
amount of choices given to the patient, it does not successfully provide a measurable
marker for the clinician. Sometimes, however, clinicians will measure the length of the line
and the location of the patient-indicated marker to determine a numerical assessment [1].
Figure 2: Visual Analog Scale
7
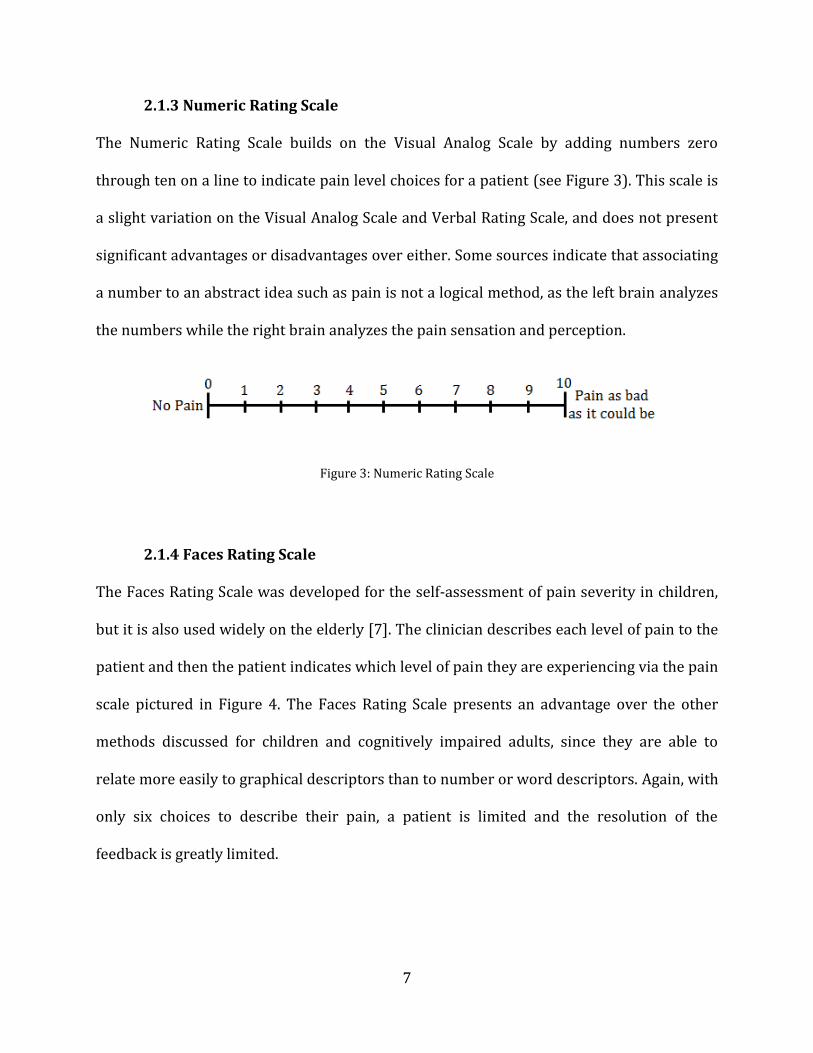
2.1.3 Numeric Rating Scale
The Numeric Rating Scale builds on the Visual Analog Scale by adding numbers zero
through ten on a line to indicate pain level choices for a patient (see Figure 3). This scale is
a slight variation on the Visual Analog Scale and Verbal Rating Scale, and does not present
significant advantages or disadvantages over either. Some sources indicate that associating
a number to an abstract idea such as pain is not a logical method, as the left brain analyzes
the numbers while the right brain analyzes the pain sensation and perception.
Figure 3: Numeric Rating Scale
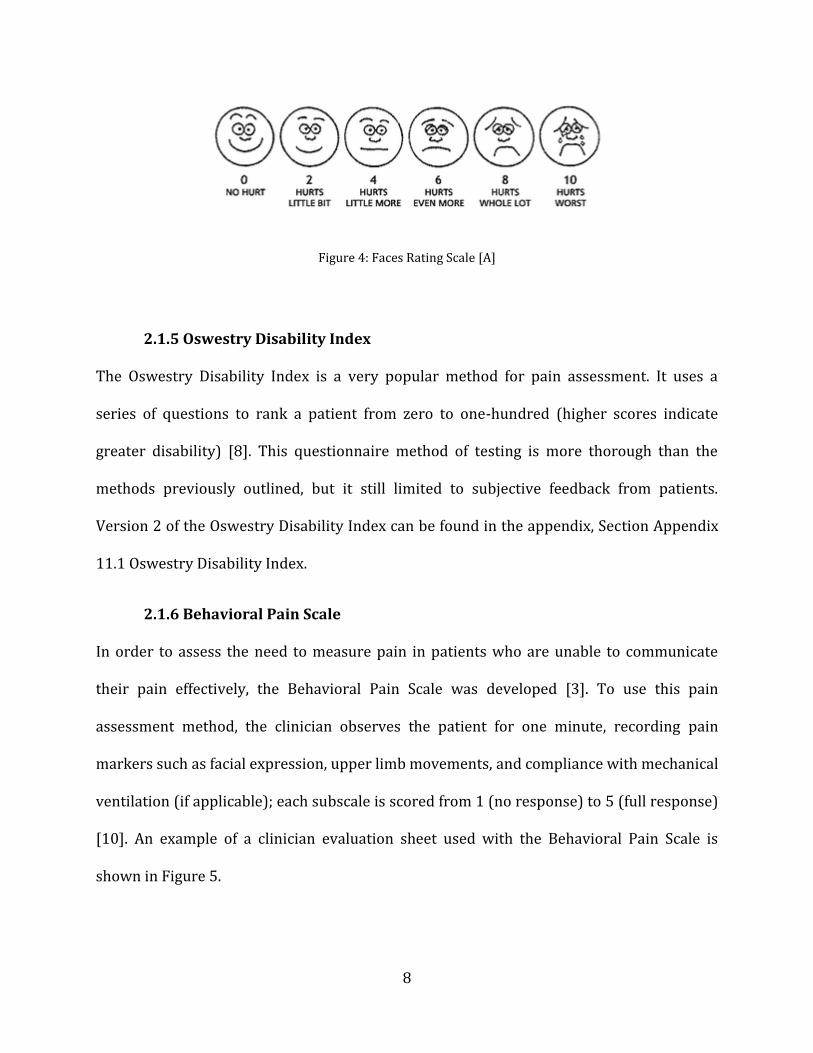
2.1.4 Faces Rating Scale
The Faces Rating Scale was developed for the self-assessment of pain severity in children,
but it is also used widely on the elderly [7]. The clinician describes each level of pain to the
patient and then the patient indicates which level of pain they are experiencing via the pain
scale pictured in Figure 4. The Faces Rating Scale presents an advantage over the other
methods discussed for children and cognitively impaired adults, since they are able to
relate more easily to graphical descriptors than to number or word descriptors. Again, with
only six choices to describe their pain, a patient is limited and the resolution of the
feedback is greatly limited.
8
Figure 4: Faces Rating Scale [A]
2.1.5 Oswestry Disability Index
The Oswestry Disability Index is a very popular method for pain assessment. It uses a
series of questions to rank a patient from zero to one-hundred (higher scores indicate
greater disability) [8]. This questionnaire method of testing is more thorough than the
methods previously outlined, but it still limited to subjective feedback from patients.
Version 2 of the Oswestry Disability Index can be found in the appendix, Section Appendix
11.1 Oswestry Disability Index.
2.1.6 Behavioral Pain Scale
In order to assess the need to measure pain in patients who are unable to communicate
their pain effectively, the Behavioral Pain Scale was developed [3]. To use this pain
assessment method, the clinician observes the patient for one minute, recording pain
markers such as facial expression, upper limb movements, and compliance with mechanical
ventilation (if applicable); each subscale is scored from 1 (no response) to 5 (full response)
[10]. An example of a clinician evaluation sheet used with the Behavioral Pain Scale is
shown in Figure 5.

9
Figure 5: Behavioral Pain Scale [B]
2.1.7 Quantitative Sensory Testing Method
The Quantitative Sensory Testing Method (QST) was developed to assess clinical pain by
defining the stimulus type and the response. This test is psychophysical and typically
implements a thermal pain stimulus, but other types of pain stimulus such as pressure, pin
pricks, and electrical signals are used as well. With a gradual increase of the stimulus, the
10
patient can indicate his/her pain threshold and pain tolerance [11]. With these measures, a
more quantifiable indication of perceived pain is available.
A result of the QST methods, the introduction of pain threshold and pain tolerance was an
important advancement in pain measurement. Pressure Pain Threshold (PPT) and
Pressure Pain Tolerance (PPTol) have been used to collect meaningful data from pain
patients in many studies. The data collected has been shown to be reliable and has
provided important clinical value. However, one criticism of PPT and PPTol measurements
is that they are not valid unless the patient is fully cooperative [12]. These important
markers are used with pressure algometry, and will be discussed in depth in Section 2.2
Pressure Algometers.
2.2 Pressure Algometers
The pressure algometer was first developed by Keele and Fisher in 1954, and has been
used widely in research since then. Preliminary research investigated standard values of
pressure thresholds as well as their validity and reproducibility in healthy patients [13].
Subsequent studies have evaluated standard values of pressure pain threshold and/or
pressure pain tolerances in healthy versus unwell patients [3], [7], [10]. Studies have also
been conducted on the difference of pain response according to body location and body
side [14], [15], [16]. The use of pressure algometers is mainly limited to a 1cm2 (and
sometimes a 0.5cm2) rubber tipped probe. The pressure application tip makes
perpendicular contact with the skin and applies pressure to induce deep muscle pain in the
subject [17].
11
As the body of research on pressure algometers has grown, these devices have also been
improved and evaluated. Some studies evaluate the variability of patient response of
pressure threshold and/or tolerances over multiple trials in the same location – some of
these studies have found minimal variability while others have found significant
differences between tests [17]. Other studies have evaluated the efficacy of pressure
algometers by using them in conjunction with traditional pain measurement techniques
such as the techniques described in Section 2.1 Current Pain Measurement Methods [17].
Many of these studies acknowledge the possibility that test administrator differences
introduce variability in results [18], [19], [20], [21]. Few sources indicate that reasonable
reliability may be maintained between test administrators after sufficient training,
although they acknowledge that if multiple test administrators are used, complete
randomization within testing should be used [19]. This evidence supporting inter-test-
administrator differences in pressure pain thresholds and/or tolerances supports the
hypothesis presented in this thesis that an automated pressure algometer could greatly
reduce the variability introduced by multiple test administrators.
2.2.1 Market Algometers
Wagner Instruments is a principal provider of both digital and analog algometers, along
with Fisher and US Neurologicals. Figure 6 through Figure 11 show typical handheld
algometers on the market today.

12
Figure 6: Wagner "Pain Test" FPK Algometer, Force Dial [C]
Figure 7: Wagner "Pain Test" FPX Algometer, Force Ten [C]

13
Figure 8: Wagner "Pain Test" FPIX Algometer, Force One [C]
Figure 9: Somedic Algometer [D]

14
Figure 10: JTech Commander Algometer [E]
Figure 11: JTech Tracker Freedom Wireless Algometry Device [E]

15
The Wagner algometers pictured (as well as the Somedic Algometer) utilize both digital
and analog methods of force sensing. The test administrator uses the handheld algometer
to apply pressure to the patient, who then verbally marks his/her pressure pain threshold
and/or tolerance. Upon the patient’s notification, the test administrator then “immediately”
notes the pressure reached at the point of notification and releases pressure. The Force One
algometer is capable of storing the maximum force read, and thus the test administrator
does not have to note this force until the test is complete. The Somedic Algometer offers
pressure application rates as an additional metric.
The JTech Commander operates similarly to the Wagner and Somedic Algometers, but
incorporates its own data analysis tool which facilitates statistical analysis of tests. The
most advanced option listed on the market is arguably the JTech Tracker Freedom Wireless
Algometer. This tool automatically collects data via wireless communication with a
personal computer. To address the variability introduced due to test administrator
inconsistency of pressure application rate, the software displays “pressure pacer”
technology to assist the test administrator in using constant pressure application rates.
Furthermore, since the software is displayed real time on a personal computer, the patient
can directly press “enter” to indicate that he/she has reached the pain threshold and/or
tolerance.
While these options are widely used in clinics and generally accepted methods of pain
measurement, they still have major shortcomings. Even the JTech Tracker Freedom
Wireless Algometer which takes measures to resolve identified issues lacks a true solution
to test administrator discrepancy and inaccuracy in application rates.

16
2.2.2 Devices Developed for Research Purposes
The literature provides an interesting and diverse basis of novel pain measurement
techniques. Xiong et al. developed a device to study measurement reliabilities associated
with pressure thresholds while determining the effects of stimulus characteristics such as
stimulus area and indentation speed [22]. They also evaluated how the mechanical
properties of the tissue tested (in this case, the foot) is important for measurement of pain
threshold [23]. Extensive studies have been documented which investigate test-retest
repeatability and/or reliability of pressure algometers [24], [25], [26], [27], [28], [29], [30].
Furthermore, studies have been developed to better understand the relationship between
pain responses in tender versus non-tender areas of the body, between different locations
in the body, and between patients suffering from chronic pain versus healthy patients [27],
[31], [32], [33], [34], [35], [36], [37].
Perhaps the most relevant to this research is an experiment comparing an automated
pressure algometer to a handheld algometer [38]. Koo et al. developed a computer
controlled pressure algometer and tested it in comparison with a handheld algometer to
determine reliability, repeatability, and sensitivity. The device used is pictured in Figure
12. The group investigated the hypothesis that an automated algometer could reduce the
effects of operator reaction time, operator anticipation, indenter alignment error, and
variation in indentation rate on pain-pressure threshold [38]. Surprisingly, the group
discovered more reliable results with the handheld algometer despite the advantages
offered by the automated algometer. They hypothesize two reasons for the unexpected
results: that the loading rate and loading mode between the two algometers differed in
their experiment, and that deformation control and load control are not equivalent.

17
Furthermore, they acknowledge that “load-controlled indentation protocol appears to be
better than deformation-controlled protocol for PPT measurements” [38].
Figure 12: Koo et al. Automated Deformation-Controlled Indentation Algometer – testing performed on erector spinae muscles
2.3 Limitations of Current Pain Measurement Techniques
As has been mentioned briefly, handheld algometers are prone to inconsistency and
inaccuracy due to application rate, test administrator psychological effects, and other
sources of error. Like pain rating scales, handheld algometers are easy to use, relatively
inexpensive, and do not require extensive training or time to administer. However, the
shortcomings shared by all current pain measurement techniques provide significant and
noteworthy limitations to pain measurement and analysis.

18
2.3.1 Application Rate
Application rate is perhaps one of the dominating sources of error seen with handheld
algometers. Research reports a large range of pressure application rates (normally
between 0.05 to 20 N/s) [17]. Higher PPT scores are often correlated with higher
application rates, since the patient has less time to react and thus a “false” or “exaggerated”
PPT is recorded [17]. Handheld algometers offer little to no control over application rate.
While some models like the JTech Tracker Freedom Wireless Algometer offer visual
feedback to the test administrator, it is still largely dependent on administrator tendencies
and training.
2.3.2 Test Administrator Psychological and Environmental Effects
Environmental, cultural, psychological, and emotional factors play significant roles in a
patient’s pain response. These factors are difficult to identify and even more difficult to
measure. It is understood that pain responses differ between males and females, with
males consistently reporting higher PPT values [39]. Research also acknowledges that
“gender warrants much more thoughtful attention in healthcare and in pain research not as
a demographic variable but as a factor that may significantly affect all aspects of clinical
pain experience” [39]. Pain responses between men and women are not the only gender-
related cause of discrepancy – interactions between male patients and female test
administrators may result in skewed findings [18]. Furthermore, examiner expectancy of
inflicted pain may significantly affect findings – Ohrbach et al. hypothesize that
measurement order and knowledge of measurement site characteristics can influence
obtained PPT measurements [18].

19
2.3.3 Other Sources of Error
It is widely acknowledged that test administrator training is essential to providing reliable
and repeatable results [40]. While some research indicates that sufficient training yields
reliable and repeatable results between test administrators, other research indicates that
test administrator variability is significant [38]. These conflicting results may indicate that
the specific test administrator may have more influence on repeatability and reliability
than the effect of training on any individual. Furthermore, interactions between patients
and test administrators may contribute to psychological influences on reported PPT or
PPTol. Finally, habituation may play a large role in a patient’s subjective response to pain,
and many studies have documented the effects of repeated measurements of PPT and
PPTol [41], [42], [43], [44].
2.4 Physiological Signals Correlated to Pain Response
Perhaps the most important shortcoming of current pain measurement techniques is that
they lack a method to objectively quantify pain. Relying only on a patient’s subjective
response to pain introduces a number of psychological factors that are impossible to
measure and control, and which may drastically influence his/her pain response.
In order to introduce an objective measure of pain, one may measure physiological signals
that have been correlated with pain response via research. There are a number of
physiological signals with documented relationships to pain – blood pressure, heart rate,
skin impedance, pupil dilation, and respiratory rate to name a few.
20
2.4.1 Relationship between Blood Pressure and Pain Response
A direct correlation between blood pressure and pain response has been established in
humans. Hypertension is linked to a decreased sensitivity to pain, and hypotension is
linked to an increased sensitivity to pain [45]. Furthermore, systolic blood pressure may
be inversely related to pain ratings in normotensive male patients [46]. Because of the
established relationships between blood pressure and pain response, this physiological
signal could be used to predict pain.
2.4.2 Heart Rate
The relationship between heightened states of arousal and sympathetic nervous system
activity has been clearly documented and is well understood. Since the sympathetic and
parasympathetic nervous systems control heart rate, it is obvious to assume that a pain
stimulus (which raises arousal) would increase sympathetic nervous system action and
thus increase heart rate. Tousignant-Laflamme and Marchand investigated this hypothesis
and confirmed that a relationship exists between pain and heart rate variability in low back
pain patients [47]. They also confirmed that heart rate increases as pain stimulus is applied
and increased, but if the stimulus remains constant over time (approximately 30 seconds)
the heart rate drops presumably to due to parasympathetic nervous system activity [47].
This research indicates that heart rate may be used to identify pain stimuli in patients, but
only if the pain stimuli is increasing or recently begun.

21
2.4.3 Skin Impedance
Skin impedance is essentially the fall of resistance caused by sweat gland activity.
Measurement of skin impedance is commonly used to measure peripheral sympathetic
responses to stress and pain [8]. Fujita et al. observed a strong correlation of strain on a
joint (pain stimulus) to decreased skin impedance proportional to baseline skin impedance
[48].
2.4.4 Pupil Dilation
Bertrand et al. studied the relationship between pupil dilation, anxiety, and pain
stimulation in ninety-six healthy patients. They found that there was a significant increase
in pupil diameter upon pain stimulation, and that this increase was greater in patients who
reported anxiety before testing, regardless of gender [49]. Pupil dilation may be an easy-to-
measure physiological response to pain, and could be used to indicate an objective
response to pain and to evaluate anxiety levels before pain stimulation.
2.4.5 Respiratory Rate
It is commonly assumed that respiratory rate increases with pain. This assumption is
backed up in literature, but is not widely studied as it may be considered “obvious”.
Borgbjerg et al. determined that pain stimulation does act as a respiratory stimulant in
humans [50]. Respiratory rate is easily monitored and could be an indicator of objective
pain response in humans.
2.4.6 Body Mass
Although body mass is not a physiological signal, it has been shown to be an indicator of a
patient’s pain scores. Wood et al. reported that in a study of nearly 200 patients (1/3 of

22
whom were obese), the relationship between pain as a continuous variable and BMI
approached significance (P=0.098) [45]. They found that the BMI of persons with lower
pain scores was significantly different than those with higher pain scores [45]. This could
mean the relationship of high BMI and increased pain level among patients with chronic
pain could be an important indicator, along with the other physiological bio-indicators
discussed above.
2.5 Towards an Ideal Pain Measurement Device
Current market algometers provide significant advantages when compared to traditional
pain assessment techniques, and when used in conjunction with these techniques. They
provide a quantifiable measure of pressure pain threshold (PPT) and pressure pain
tolerance (PPTol). However, these systems are inherently reliant on subjective patient
feedback and are susceptible to many sources of error such as application rate and angle,
psychological effects, test-administrator variability and dependence on training, etc.
The ultimate pain measurement device would combine the strengths that currently exist in
handheld pressure algometers and pain assessment techniques (i.e. easy, inexpensive,
clinic-friendly, etc.) while eliminating or greatly reducing the downfalls of these devices.
First, the device should be automated to reduce the variability in application rate and angle
performed by human test administrators. Application rates should be precisely controlled
and monitored – both displacement/time and pressure/time are important markers and
can influence a patient’s response [38]. The slower the application rate, the more time the
patient has to react, resulting in more sensitive and precise PPT and PPTol readings [17].
23
Furthermore, the automated control of pressure application creates a possibility to further
study the relationship between perceived pain and pain application method. Pressure
algometers are typically used with a ramped pressure/time application. An automated
device could explore this relationship with other pressure/time application modes such as
step functions, sine or square waves, etc. Relationships between perceived pain and
application modality could potentially lead to a better understanding of pain.
If an understanding of the relationship between biometrics (blood pressure, heart rate,
skin impedance, pupil dilation, or respiratory rate) and pain response was developed, a
future automated algometer could rely solely on these inputs and require no subjective
feedback from the patient. Therefore a pain scale per patient could be easily measured in
conjunction with vital sign measurement.
The ultimate pain measurement device would successfully measure a personal pain scale
per patient to determine that patient’s response to pain stimulus. This personalized pain
scale could be used to properly dose pain medications, aid in treatment options decision
making (surgery versus therapy versus medication), and better diagnose ailments
associated with pain. The advantages offered by an idealized pain measurement device
would ultimately lead to an important increase in quality of life and quality of care for
patients worldwide.
24
Chapter 3
Pain Measurement Device Design
3.1 Zimkowski CCPA
In 2010, Michael Zimkowski designed, developed, fabricated and evaluated an initial
prototype of a computer-controlled pressure algometer (CCPA) [9]. The CCPA created was
an important proof-of-concept that a computer controlled device could eliminate or greatly
reduce the variability factors given to a hand-held device, thus improving sensitivity and
reliability. In collaboration with Dr. Patel and Dr. Lindley (principal and co-investigators,
respectively) the following specifications were outlined for the device: it must be at least
as accurate as hand-held algometers but allow the integration of heart rate, blood pressure,
and any other useful physiological measures. The device must also work seamlessly with
QST and Numerical Rating Scale methods [8].
The final Zimkowski design incorporated a load frame, laptop computer and data
acquisition, control box, air compressor, algometer actuator assembly, 24 Volt DC power
supply, and a physiological data collection system as pictured in Figure 13. The load frame
was made to be placed on a clinic bed with the patient’s legs over the foam-padded base.
The laptop computer was used as actuator control and data acquisition. The control box
housed the pneumatic control mechanisms such as air regulators, release valves, etc. and
was used in combination with a large industrial air compressor to power the pneumatic
mechanism. The actuator assembly was custom built and housed on the top arm of the

25
load-frame. Physiological data was integrated from standard monitoring equipment to a
DAQ which relayed the information to the laptop.
Figure 13: Zimkowski CCPA Design –load frame with patient control remote, physiological data monitoring equipment, laptop computer and control box. Photo omits air compressor and all electrical connections
(wiring).
As reported in Zimkowski’s thesis, the device was tested on human patients and displayed
slightly lower and more variable PPT results as compared to the Wagner FPIX Digital
Algometer. When tested on ten patients in the absence of physiological data integration, the
CCPA recorded average threshold pressure as compared to the recorded PPT using the
handheld Wagner device (summarized in Table 1).
Testing Phase CCPA Results Wagner Results Open Loop Testing - PPT 4.42 ± 1.65 kg 6.20 ± 2.02 kg
Closed Loop Testing - PPT 3.90 ± 1.12 kg 4.50 ±1.04 kg Table 1: CCPA versus Wagner ForceOneTM Results [8]

26
While the Zimkowski CCPA did provide useful clinical data and introduced the ability to
correlate patient pain threshold and tolerance to physiological markers (blood pressure
and heart rate), it did have significant shortcomings. Firstly, the patient and user-interfaces
with the device were cumbersome and intimidating. The machine was not transportable or
easily used in a clinical setting (weighing over 144 lbf). Setup and takedown were intricate
processes and often required repair before and between tests.
Secondly, the device had some mechanical issues. In using pneumatically powered
actuation, the CCPA sacrificed the ability to measure application tip displacement – an
important measure correlated with patient pain response [38]. The load cell used did not
provide adequate accuracy at low forces, and the laptop control would sometimes time out,
resulting in loss of data and possibly unnecessary patient discomfort.
Finally, the design of the device was not streamlined. This resulted in an intimidating
appearance to the patient as well as an unreliable setup (due to oversized wiring, controls,
and interfaces). Table 2 summarizes the hardware used in the CCPA device design, and can
later be compared to Table 5 which summarizes the hardware used in the AmP-MeD
design. Many of the hardware components used in the design of the CCPA are not ideally
fitted to the device. This causes over-complication, unnecessary amount of parts, and an
overall loud, bulky, and cumbersome appearance.

27
Part # Hardware Use/Description Comments 1 Laptop Computer Computer control Antivirus software
caused timeouts 2 USB-6008 Data Acquisition
System Computer control
3 Normally Retracted Spring Return Air Cylinder
Actuator Impossible to measure displacement
4 Load Cell Force Measurement and Feedback
Lack of resolution at lower forces
5 Air Solenoid Emergency Stop Simple emergency stop system that works well to automatically kill applied pressure upon activation
6 Electronic Pressure Regulator Control of air pressure actuator
7 Operational Amplifier Facilitates Operation Electronic Pressure Regulator
8 Electronic Pressure Gauge Pressure Feedback to computer
9 Momentary Switches PPT and PPTol marker buttons
Cumbersome and potentially confusing for patient to use multiple buttons
10
Two Automotive Switches Test administrator and patient emergency stop
Cumbersome and potentially confusing for patient to use multiple buttons
11 24V DC Power Supply Main power source Cumbersome, bulky, and heavy
12 Air Compressor Supplies air to Normally Retracted Spring Return Air Cylinder
Loud, cumbersome, bulky, heavy, and intimidating to patient
13 Load Frame Supports Actuation System and Patient
Large and difficult to adjust
Table 2: Main Hardware Components Associated with CCPA

28
3.2 Overall CCPA Design
Overall, the CCPA accomplished important achievements but also had significant
shortcomings. Most importantly, the CCPA succeeded in integrating blood pressure and
heart rate measurements from medical equipment through the LabView interface. The
integration of these physiological signals to the automated device is a huge
accomplishment, and the strategy used to accomplish this will be used on the AmP-MeD.
The shortcomings of the CCPA led to the goals of the AmP-MeD development, which are
discussed in Section 4.1 AmP-MeD Goals.
29
Chapter 4
AmP-MeD Design
4.1 AmP-MeD Goals
A new device has been developed to address the shortcomings of the CCPA and to add
additional benefit over both the Zimkowski CCPA and handheld pressure algometers on the
market today – it will be referred to throughout this document as the AmP-MeD, or the
Automated Pain Measurement Device. The primary goal of the AmP-MeD is to improve
sensitivity and reliability. This is accomplished by eliminating variability due to a human
test administrator, increasing sensitivity by controlling pressure application rates, and
minimizing psychological effects on the patient experience. While the Zimkowski CCPA
made significant steps towards achieving these goals (as compared to a hand-held pressure
algometer), the primary goals may still be refined. Important secondary goals of the AmP-
MeD (as compared to the Zimkowski CCPA) are to improve usability, functionality, and
aesthetics.
The design of the AmP-MeD with regards to usability will focus on improving the user
interface, the actuation method usefulness, transportability, and adjustability. The
improved user interface will provide the test administrator with a streamlined, intuitive
platform in which to conduct the test with minimal variability caused by complex test
administration. The actuation method will be simple, effective, and efficient. The device will

30
be easily transported as it may be used in multiple clinics or multiple rooms of one clinic.
Finally, the device will be simple and easy to adjust for different patients.
The design of the AmP-MeD with regards to functionality will focus on improving the
reliability, safety, accuracy, and precision of the device. This will be accomplished in the
physical structure of the device, the actuation mechanism, and the control mechanism.
The design of the AmP-MeD with regards to aesthetics will focus on minimizing the size and
weight of the device, improving upon the administrator and patient interfaces, and
providing comfort to the patient (with the exception of the intentional induced pain).
Patient intimidation, expectation, and fear of pain have been strongly correlated with
patient pain responses [51]. Thus, multiple steps will be taken to both reduce the device’s
intimidation level and control the variability of perceived “fear” between patients. This will
be achieved by reducing the size of the device, increasing patient comfort and perception of
safety, and streamlining all human interfaces.
4.2 Geared-Motor Actuation System
A geared-motor approach to pressure-actuation was chosen because it is more precisely
and accurately controlled, and it offers the ability to measure displacement as well as
applied load/pressure. Furthermore, the geared-motor approach drastically decreases the
size and weight of the device. In the CCPA, the pneumatic actuation system involved custom
built piston housing, air tubing, a large control box, and an industrial air compressor. This
setup was cumbersome, complicated to setup, prone to breaking, and intimidating to the
patient. It did, however present a significant advantage – in the case of a power outage or a
short in the system, the pressure would automatically diminish, discontinuing any applied
31
pressure to the patient. The geared motor approach, however, needs a signal to retract the
piston (as the motor must be powered to reverse). For this reason, three levels of safety
have been implemented, and are explained in Section 4.6 Safety and Emergency Stops.
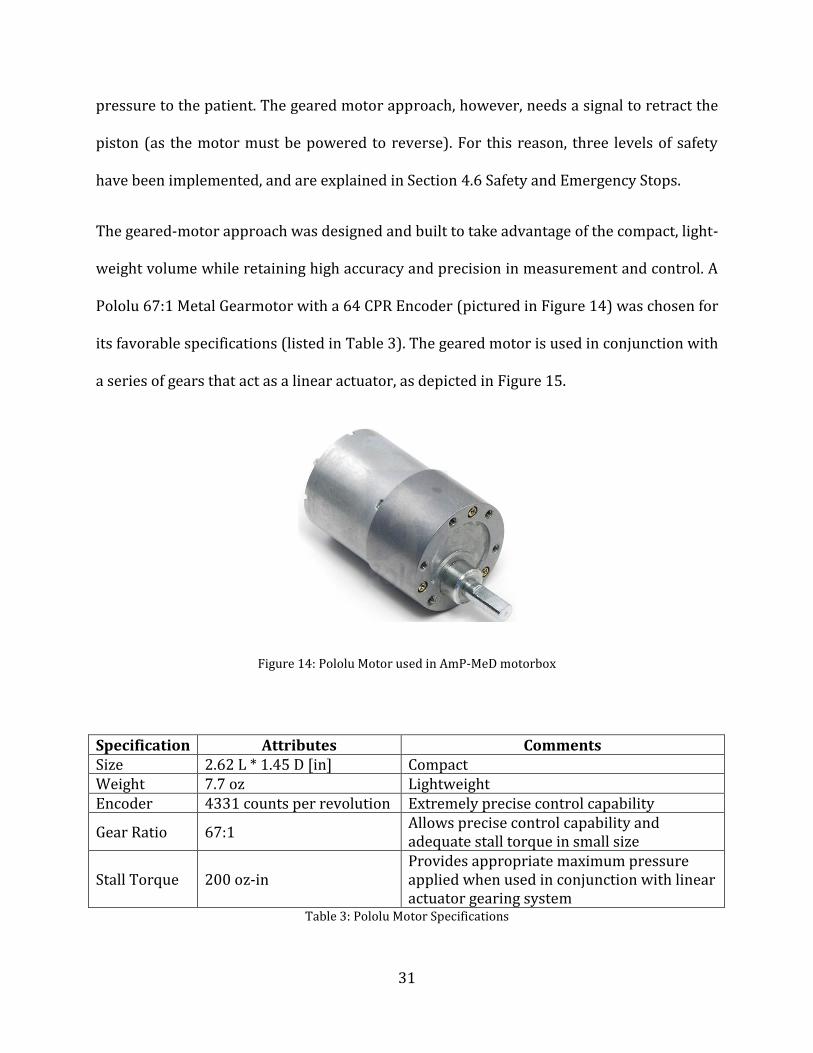
The geared-motor approach was designed and built to take advantage of the compact, light-
weight volume while retaining high accuracy and precision in measurement and control. A
Pololu 67:1 Metal Gearmotor with a 64 CPR Encoder (pictured in Figure 14) was chosen for
its favorable specifications (listed in Table 3). The geared motor is used in conjunction with
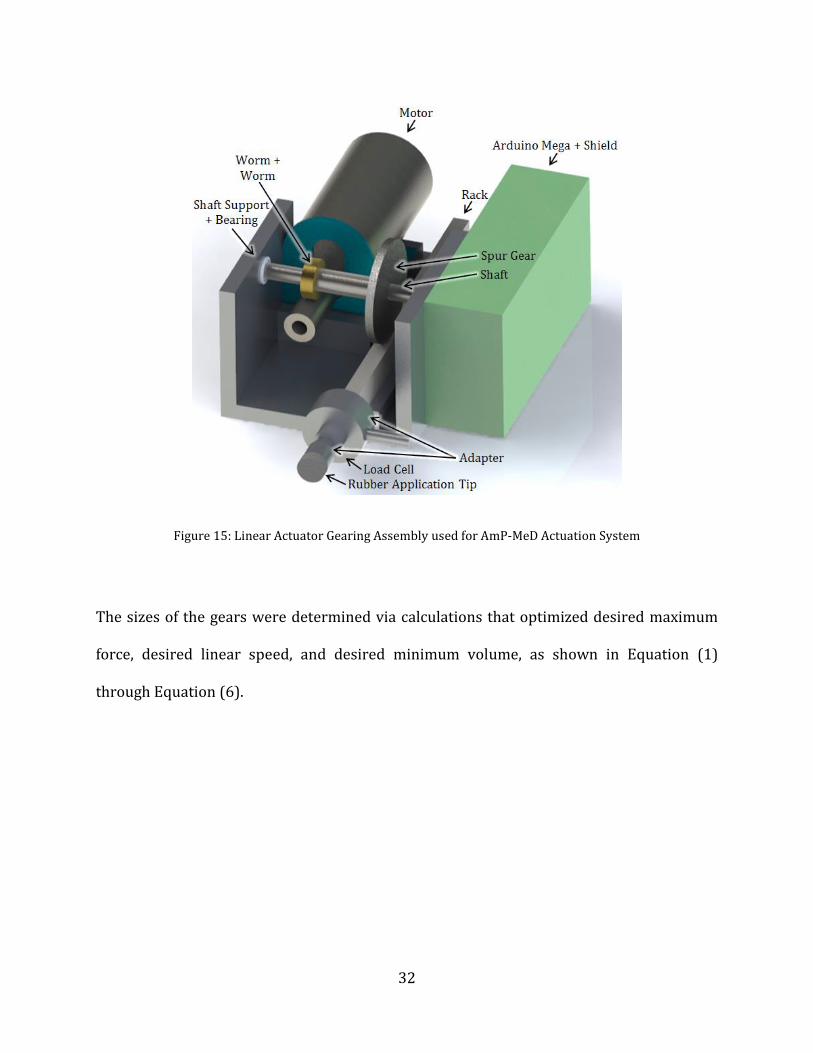
a series of gears that act as a linear actuator, as depicted in Figure 15.
Figure 14: Pololu Motor used in AmP-MeD motorbox
Specification Attributes Comments Size 2.62 L * 1.45 D [in] Compact Weight 7.7 oz Lightweight Encoder 4331 counts per revolution Extremely precise control capability
Gear Ratio 67:1 Allows precise control capability and adequate stall torque in small size
Stall Torque 200 oz-in Provides appropriate maximum pressure applied when used in conjunction with linear actuator gearing system
Table 3: Pololu Motor Specifications
32
Figure 15: Linear Actuator Gearing Assembly used for AmP-MeD Actuation System
The sizes of the gears were determined via calculations that optimized desired maximum
force, desired linear speed, and desired minimum volume, as shown in Equation (1)
through Equation (6).

33
(1)
(
)
(2)
(3)
(4)
(5)
(
) (6)
The input parameters were chosen based on future testing needs. Linear speeds as low as
0.1 cm/s and as high as 10 cm/s are desired for future testing (for investigations of the
relationship between application rate and pain response). An output force of 160 N was
chosen for these calculations, though the practical use case will employ a maximum of 80 N
for safety and average use case parameters. The 80 N safety cutoff will be employed to
ensure no tissue damage (bruising) occurs during testing. In previous tests conducted by
Zimkowski, few patients could tolerate forces exceeding 80 N (unpublished results).
However, the AmP-MeD will be designed so that patients with PPTol marks above 80 N
may choose to undergo additional testing that will apply up to 160N (this way, the PPTol
on patients exceeding 80 N of force may be recorded).

34
4.2.1 Load Cell
A 100 lbf force load cell was chosen for force measurement and force feedback. The load
cell uses a Wheatstone Bridge sensor and implements a threaded force sensing tip which
enables an easy and secure fit with the rubber application tip. Furthermore, the load cell is
compact yet accurate (See the Appendix, Section Appendix 11.2 Load Cell Datasheet).
4.2.2 Application Tip
In order to maintain correlation to previous studies, a 1cm2 rubber application tip
(identical to that in the Wagner ForceOneTM and to the CCPA) is used to apply pressure to
the patient’s tibialis anterior (shown in Figure 16). This rubber application tip is attached
to the rack via a simple linear assembly, as depicted in Figure 17. A load cell adapter was
machined to mount the load cell flush to the end of the rack. The rubber application tip is
then mounted flush to the load cell via the threaded force sensing tip on the load cell (the
attachment does not affect load measurements).

35
Figure 16: Location of AmP-MeD test site - Tibialis Anterior [F]
Figure 17: Application Tip Connection Assembly to Rack for AmP-MeD Actuation

36
4.3 Electronics
The electronic components included in the device design consist of the power supply,
Arduino Mega with Motor Driver Shield, and Tablet PC. The power supply used is a
lightweight, compact 100V-240V to DC 12V 5A Switching Power Supply Adapter (pictured
in Figure 18). This power supply is based off of a “laptop charger” system, and provides
power to the Arduino which regulates power delivery to the other hardware. Power is
supplied to the load cell and motor. This system streamlines power supply and regulation
via the Arduino, which facilitates the simple (and easy to repair or modify), compact design,
as seen in Figure 19.
Figure 18: AmP-MeD Power Supply

37
Figure 19: Motorbox with Wired Arduino Control Boards – photo of interior
4.4 Software (Actuation and Control Methods)
An Arduino Mega 2560 R3 with a Pololu Dual VNH5019 Motor Driver Shield for Arduino is
used as the input and output for the control system (see Figure 19). The physiological data
will be collected via a DATAQ DI-720. All data and testing is controlled by LabVIEW
software, which also acts as the graphical user interface.
4.4.1 Data Acquisition
The Arduino Mega plus Motor Driver Shield provide both digital and analog inputs and
outputs. The analog inputs are used for the load cell and motor, and the analog outputs
provide linear 0-5V output control for the motor. The digital inputs provide the threshold
and tolerance markers.
38
Although physiological input has not been implemented at this time, the Zimkowski design
will be outlined in this paper, as it was a robust design that will work well for the AmP-MeD
[8]. The DATAQ DI-720 will have three channels for analog input from the physiological
measurements for input into LabVIEW.
4.4.2 LabVIEW Software
The use of LabVIEW in the AmP-MeD system enables control from any Windows based
computer. The LabVIEW program consists of three case scenarios which control the motor
via force feedback from the load cell. First, the code resets the encoder to determine the
zero position. The user may then control the system manually or use the automatic control
by setting parameters such as the rate of the piston, the safety cutoff, etc. The desired speed
is linked to the position measurements, as each rotation of the motor equates to exactly the
same displacement of the piston.
The automatic control consists of three cases – motor is not activated, motor is activated
and test is running, and motor is in full reverse to initial position. When the motor is not
activated, it will sit at the last position it was stopped at unless instructed to “return to
home”. When a test is running, the motor will meet its desired speed (slowing as it
approaches the cutoff force to avoid an overshoot) and continue as the patient presses the
“threshold” button. When the patient presses the “tolerance” button, the motor will back up
at high speed to stop any applied pressure to the patient; this is the third case. When the
patient presses the button the first time (indicating he/she has reached his/her threshold),
LabVIEW writes the load and position to a specified file. When the patient presses the
button the second time (indicating he/she has reached his/her tolerance), LabVIEW writes
39
the load and position to the specified file and immediately reverses the motor back to its
starting position. Copies and screenshots of the LabVIEW code can be found in the
Appendix, Section Appendix 11.3 LabVIEW Code.
The force feedback works through a PID (Proportional-Integral-Derivative) controller
within LabVIEW. The PID control has been tuned to work with very good accuracy and
precision. A linear control is implemented currently, but ramped and stepped functions
would be simple to implement for future testing.
The user manipulates the front panel, where the controls are located. In the manual control
area, the user may move a knob from 0-100% of motor speed in either the forward or
backward position. The user may also reset the encoder (override the automatically set
zero position which works with a mechanical stop within the motorbox) and return the
motor to “home”. In the automatic test area, the user may set a desired speed (mm/s), a
maximum return speed (% of full speed), and a load cutoff (kg) before enabling the control
and starting the test. During the automatic control test, the user can see an indicator which
shows whether the patient has pressed the button zero, one, or two times. The user is also
able to visualize the position of the pressure application tip, the speed at which it is
travelling, and the force it is exerting on the patient through graphs (as shown in Figure 20
and Figure 21).
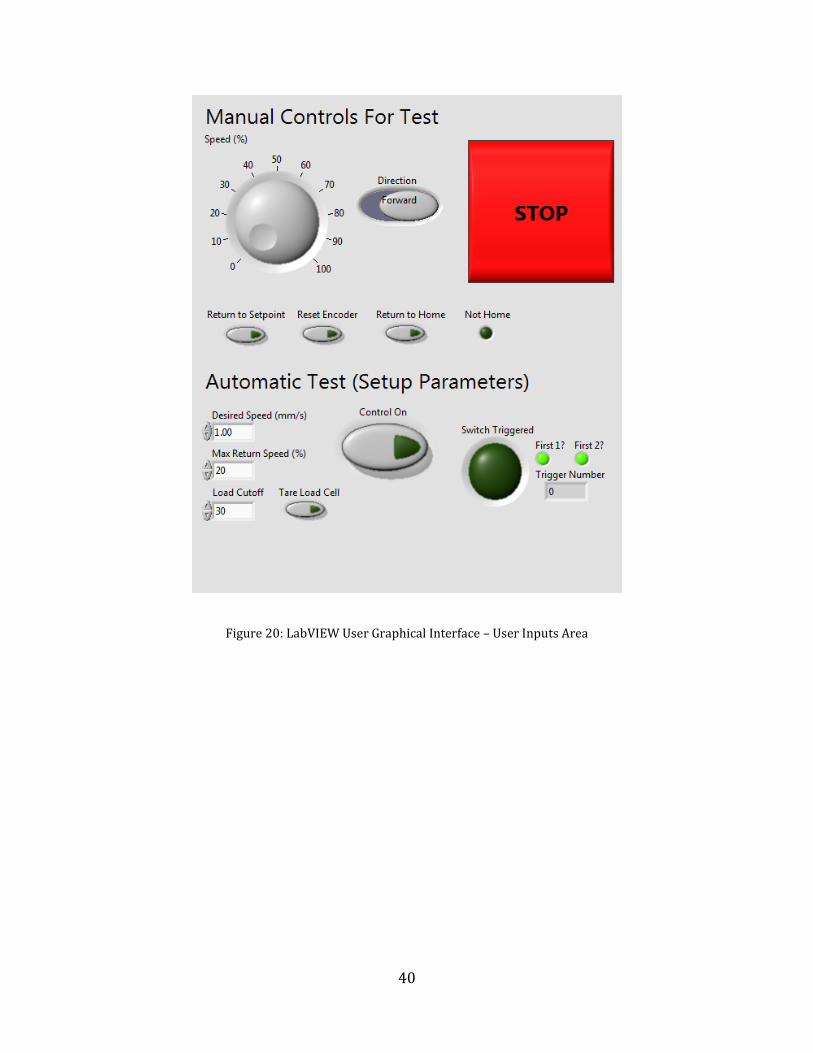
40
Figure 20: LabVIEW User Graphical Interface – User Inputs Area

41
Figure 21: LabVIEW User Graphical Interface - User Visualization Area
4.5 Frame Design
The AmP-MeD device has an improved custom-built frame that allows the patient to sit in a
chair rather than lay in a clinic bed. The primary advantage of this change is that not all
clinics have beds available, but nearly every medical clinic has a chair in every room. These
chairs are usually used to take the patient’s vital signs; of which “pain scale” will eventually
be supplemented. Secondly, the new frame is drastically smaller than the previous CCPA
frame, and weighs significantly less. The CCPA weight is compared to the AmP-MeD weight
in Table 4 below, which shows that the AmP-MeD weighs roughly 11% the weight of the
CCPA. This compacted design presents the advantage of easy transportation from clinic
room to clinic room, or even from clinic to clinic. Thirdly, a sedentary patient is thought to
be more at-ease than a patient made to lie in a bed. His/her sense of security and control is

42
elevated in a sedentary position as opposed to a prone patient. Fourthly, the AmP-MeD
frame is modular, and could easily be modified to test other locations on a patient - the
motorbox is easily removed, and could be used on frames made for testing other areas of
the body such as the erector spinae muscles or other locations often documented in
literature. Finally, the AmP-MeD frame, although custom built at this stage of research,
would be easily and inexpensively manufactured in larger volumes as it is mainly
comprised of simple planar aluminum parts (see Appendix Section Appendix 11.4
SolidWorks Part Drawings for Frame Fabrication).
CCPA (lbf) AmP-MeD (lbf) Air Compressor 54.08 N/A Control Box 17.74 2.58 Frame 40.04 11.00 Laptop 6.96 1.92 Power Supply 25.00 0.60 TOTAL 143.82 16.10
Table 4: CCPA versus AmP-MeD Component and Total Weights
The frame consists of a structural assembly and an adjustable assembly. The main
structural assembly is made up of the base, back, and front parts, while the adjustable
assembly is made up of the rod, ring, and arm. The assembly of the frame is shown in
Figure 22.
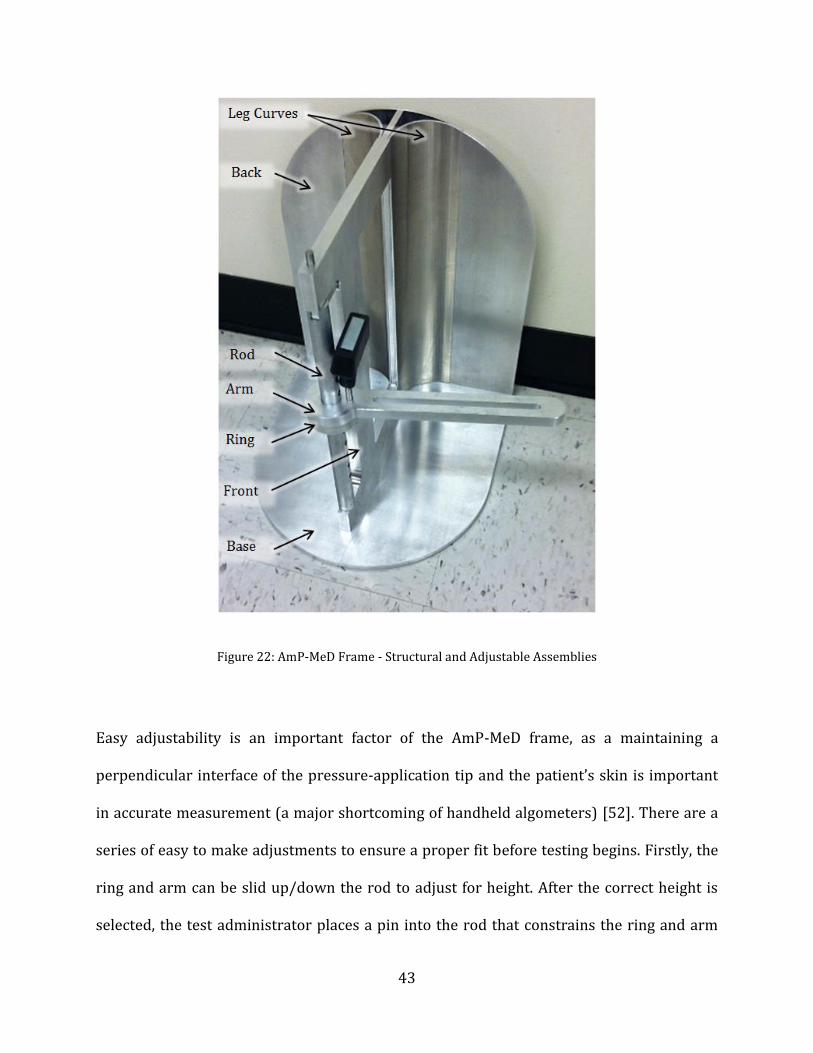
43
Figure 22: AmP-MeD Frame - Structural and Adjustable Assemblies
Easy adjustability is an important factor of the AmP-MeD frame, as a maintaining a
perpendicular interface of the pressure-application tip and the patient’s skin is important
in accurate measurement (a major shortcoming of handheld algometers) [52]. There are a
series of easy to make adjustments to ensure a proper fit before testing begins. Firstly, the
ring and arm can be slid up/down the rod to adjust for height. After the correct height is
selected, the test administrator places a pin into the rod that constrains the ring and arm

44
from falling. Secondly, the rotational position of the arm is adjusted by rotating the arm
about the rod and ring (the ring and rod do not rotate – they are constrained by key slots).
Once the proper angular position of the arm is found (placing the motor box in proximity to
the tibialis anterior), the emergency release pin is placed into the ring and arm,
constraining any rotation. Finally, the motorbox may be adjusted linearly and angularly by
sliding it along the trough of the arm. After the correct position is found (the pressure-
application tip is touching the patient’s leg perpendicularly), the wing nut is tightened to
secure the motorbox to the arm. Proper adjustment is an easy three step process, and
requires zero effort from the patient and minimal effort from the test administrator. This is
a significant improvement from the original CCPA, where the patient needed to “scoot” up
or down the bed, aid in medial and/or lateral rotation of the lower leg, and the test
administrator needed to exert significant strength to move the forty-pound frame under
the patient for new test locations.
4.6 Safety and Emergency Stops
The AmP-MeD was designed for patient safety. A maximum level of the pressure pain
stimulation is set based on published data- an automatic motor-reversal mechanism will be
switched on through feedback control if the pressure exceeds this set limit. The patient
input is the first safety stop, and if the patient exceeds the set limit, the device will also
retract.
During testing, the subject has immediate access to a simple emergency stop switch. The
patient only has one button to press – he/she is instructed to press the button the first time
when the pain threshold is experienced and a second time when the tolerance is reached.
45
When the button is pressed the first time, pressure data is logged and the test continues,
but when the button is pressed for the second or subsequent times, the motor will
automatically reverse at full speed, retracting the rubber pressure application tip and rod
into the motorbox housing and away from the patient. This simplified mechanism reduces
risk of patient confusion or panic. In previous testing with the CCPA, patients became
confused as to which button to press at what time, and if they pressed a button more than
once, a malfunction would possibly occur.
Furthermore, there is a mechanical emergency release designed into the AmP-MeD in the
instance of a panicked patient or a power outage. The test administrator simply needs to
reach down and turn the wing-nut securing the motor, which will disengage the motor’s
connection to the arm and thus to the patient. The motorbox may then be rotated or lifted
away from the patient. This will stop the pressure applied to the patient, and allow the
patient to stand up and remove their legs easily from the device.
This triple redundant safety system uses feedback control to limit the pressure applied, a
patient input to stop the pressure when they reach a tolerance, and a mechanical stop in
the case of an “all-else-fails” incident. The three implemented safety systems ensure patient
safety at all times and release all applied loads within milliseconds of triggering.
Additionally, in most cases the patient would be able to simply remove his/her leg, since
the patient is sedentary and able to stand and/or move the leg laterally out of the machine.
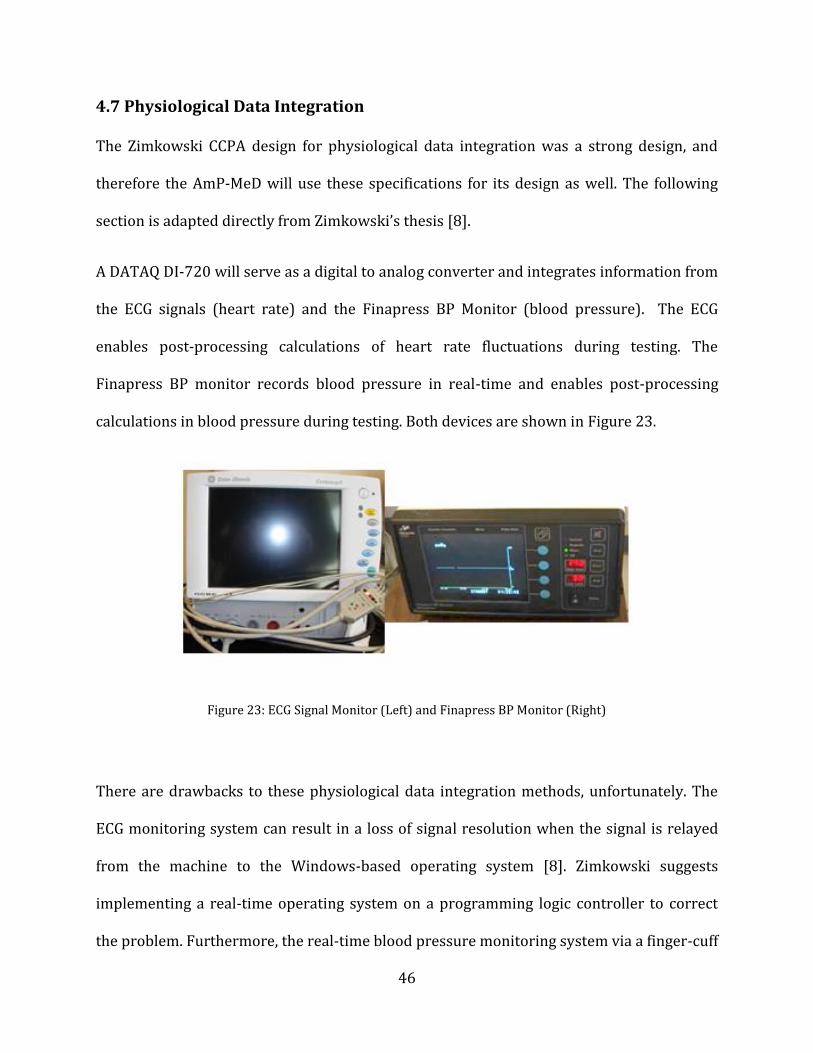
46
4.7 Physiological Data Integration
The Zimkowski CCPA design for physiological data integration was a strong design, and
therefore the AmP-MeD will use these specifications for its design as well. The following
section is adapted directly from Zimkowski’s thesis [8].
A DATAQ DI-720 will serve as a digital to analog converter and integrates information from
the ECG signals (heart rate) and the Finapress BP Monitor (blood pressure). The ECG
enables post-processing calculations of heart rate fluctuations during testing. The
Finapress BP monitor records blood pressure in real-time and enables post-processing
calculations in blood pressure during testing. Both devices are shown in Figure 23.
Figure 23: ECG Signal Monitor (Left) and Finapress BP Monitor (Right)
There are drawbacks to these physiological data integration methods, unfortunately. The
ECG monitoring system can result in a loss of signal resolution when the signal is relayed
from the machine to the Windows-based operating system [8]. Zimkowski suggests
implementing a real-time operating system on a programming logic controller to correct
the problem. Furthermore, the real-time blood pressure monitoring system via a finger-cuff

47
can be highly unreliable due to arm position with relation to the heart [8]. Unfortunately
the best way to accurately measure blood pressure real-time is with an arterial
measurement line – this not a practical solution for this study [8].
In order to mitigate these drawbacks, practical solutions are implemented that are within
scope of this study. The real-time processing issues related to the ECG monitor will be
minimized by using the PC Tablet which runs Windows software, but without any antivirus
or background checks – this will enable data integration to be more streamlined without
timeouts that can result in lost data. The real-time blood pressure monitoring system will
be calibrated with a traditional blood pressure cuff before testing begins for each patient.
This quick calibration will enable the test administrator to position the patient’s hand (and
finger) in a desirable location (likely on the chair’s armrest) which will result in accurate
blood pressure measurements for the duration of the test.
4.8 Test-Administrator Interface
The test administrator interface has been drastically simplified from the CCPA design. Test
setup is completed by following the simple instructions (see Section Appendix 11.5 AmP-
MeD Testing Procedure). Once testing has been set up, the test administrator uses the
tablet to conduct testing, by simply pressing the START TEST button. Parameters like rate
of pressure application (mm/s) and maximum force (lbf) may also be adjusted prior to
testing.
A tablet computer was chosen in order to simplify the test-administrator interface. The
tablet will not be equipped with any internet capabilities, and therefore will not have the
time-out issues presented with the first CCPA due to antivirus software. Furthermore, the
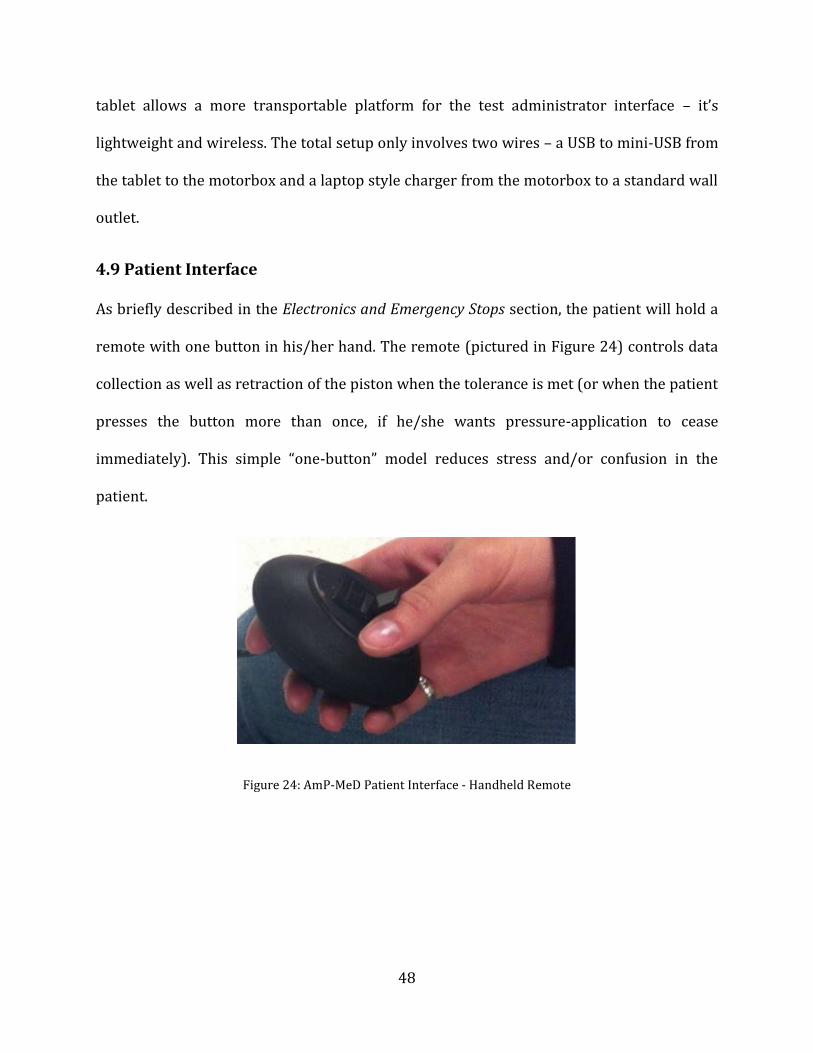
48
tablet allows a more transportable platform for the test administrator interface – it’s
lightweight and wireless. The total setup only involves two wires – a USB to mini-USB from
the tablet to the motorbox and a laptop style charger from the motorbox to a standard wall
outlet.
4.9 Patient Interface
As briefly described in the Electronics and Emergency Stops section, the patient will hold a
remote with one button in his/her hand. The remote (pictured in Figure 24) controls data
collection as well as retraction of the piston when the tolerance is met (or when the patient
presses the button more than once, if he/she wants pressure-application to cease
immediately). This simple “one-button” model reduces stress and/or confusion in the
patient.
Figure 24: AmP-MeD Patient Interface - Handheld Remote

49
The patient will also be connected to physiological data collection devices. The
physiological data collection methodology is based on Zimkowski’s design [8], and is
described more fully in Section 4.7 Physiological Data Integration. ECG leads will be
adhered to the patient’s torso, and the blood pressure monitor will be a finger-cuff on the
opposite hand used to operate the handheld remote.
4.10 Overall AmP-MeD System
The AmP-MeD has been designed for simplicity. The level of complication, number of parts,
and setup processes have all been streamlined and minimized, as is evidenced in Figure 25,
a photo of the complete test setup. Table 5 summarizes all components required in the
AmP-MeD.
Part # Hardware Use/Description Comments 1 PC Slate Tablet Computer control No antivirus software 2 Arduino Mega + Motor
Controller Shield Computer control Simple, compact
interface 3 Motorbox Actuator Displacement and
force easy to control and accurately measure
4 Load Cell Force Measurement and Feedback
Accurate and precise measurement
5 Patient Remote Switch PPT and PPTol marker buttons
One-switch design introduces more simplicity for the patient
6 100V-240V to DC 12V 5A Switching Power Supply Adapter (laptop charger)
Main power source Compact and lightweight
7 AmP-MeD Frame Supports Actuation System and Patient
Easily transported and adjusted
Table 5: AmP-MeD components
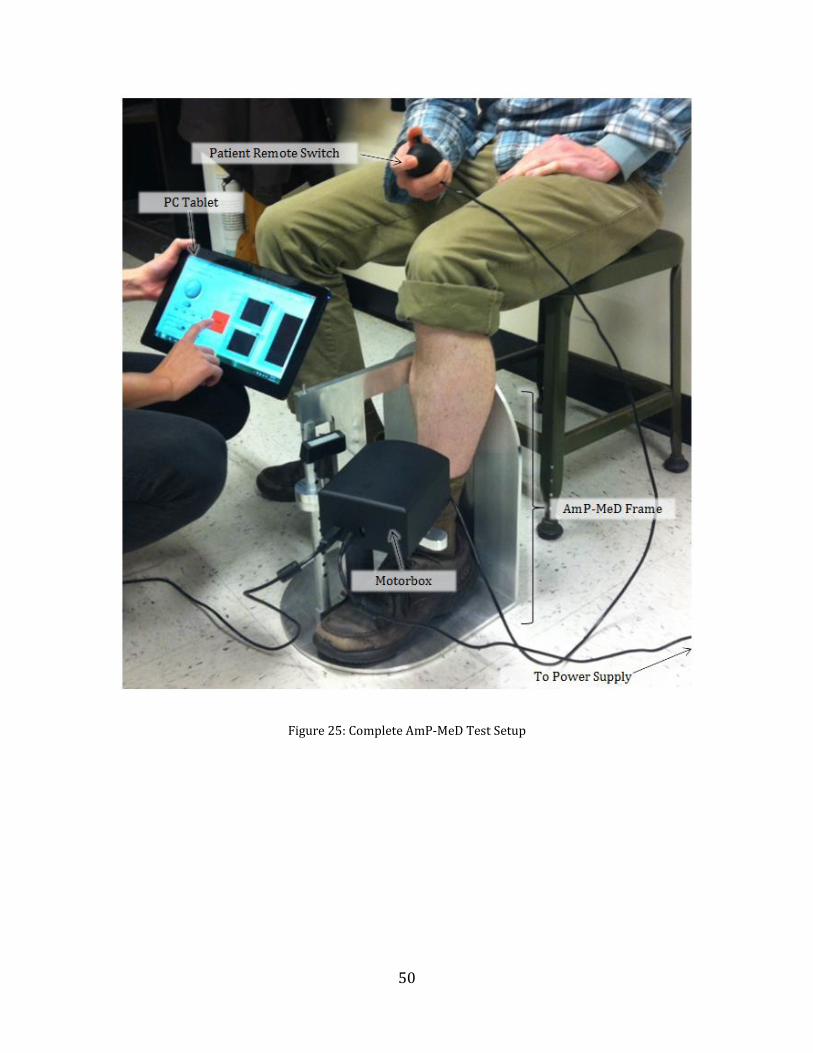
50
Figure 25: Complete AmP-MeD Test Setup

51
Chapter 5
Results
5.1 AmP-MeD in comparison to Wagner and CCPA Devices
In order to assess the design of the AmP-MeD testing platform in comparison to the CCPA
and Wagner ForceOneTM (the chosen market device), a series of methods may be used. To
standardize and simplify the comparison, a Quality Function Deployment (QFD) was used.
User interface (ease of setup and use, cost, weight, and size of the device), patient interface
(comfort and safety), and data capabilities (usefulness, accuracy, precision and reliability of
data), and were analyzed in the QFD. While the Wagner ForceOneTM presents advantages in
simplicity and ease of use, it does not provide adequate results. The CCPA provides the
advantages of an automated device, but is not streamlined or user-friendly. The AmP-MeD
provides a combination of advantages between the handheld and automated designs,
incorporating simplicity and usability with high data capabilities. Figure 26 shows a
summary of the QFD performed.

52
Figure 26: QFD Analysis of AmP-MeD in comparison to the CCPA and Wagner devices

53
In order to more specifically assess the strengths and shortcomings of each device, some
metrics may be analyzed. While the Results Chapter assesses the data capability of the
AmP-MeD device, the ease of setup and ease of use may be compared between the three
devices. The average time to setup each device was chosen as a metric that would
adequately describe the ease of setup. This metric is compared in Table 6, where it is
evident that the AmP-MeD device setup is vastly minimized compared to the CCPA and
comparable to the Wagner handheld device.
Device Average Setup Time Wagner 3 minutes
CCPA 30-45 minutes AmP-MeD 5 minutes
Table 6: Average Device Setup Time summary of Wagner, CCPA, and AmP-MeD devices
In order to assess ease of use, the time necessary to record data and cycle through one test
may be used as a metric, in combination with the simplicity level of the test-administrator
and patient interfaces with the machines. Table 7 summarizes the assessment of ease of
use between the three devices.
Device Average Data
Recording Time per Test
Test-Administrator Interface Simplicity
Level
Patient Interface Simplicity Level
Wagner 5 minutes Medium Simple CCPA Automatic Complex Complex
AmP-MeD Automatic Simple Simple Table 7: Average recording time per test and simplicity levels of test-administrator and patient interfaces
compared between Wagner, CCPA, and AmP-MeD devices.
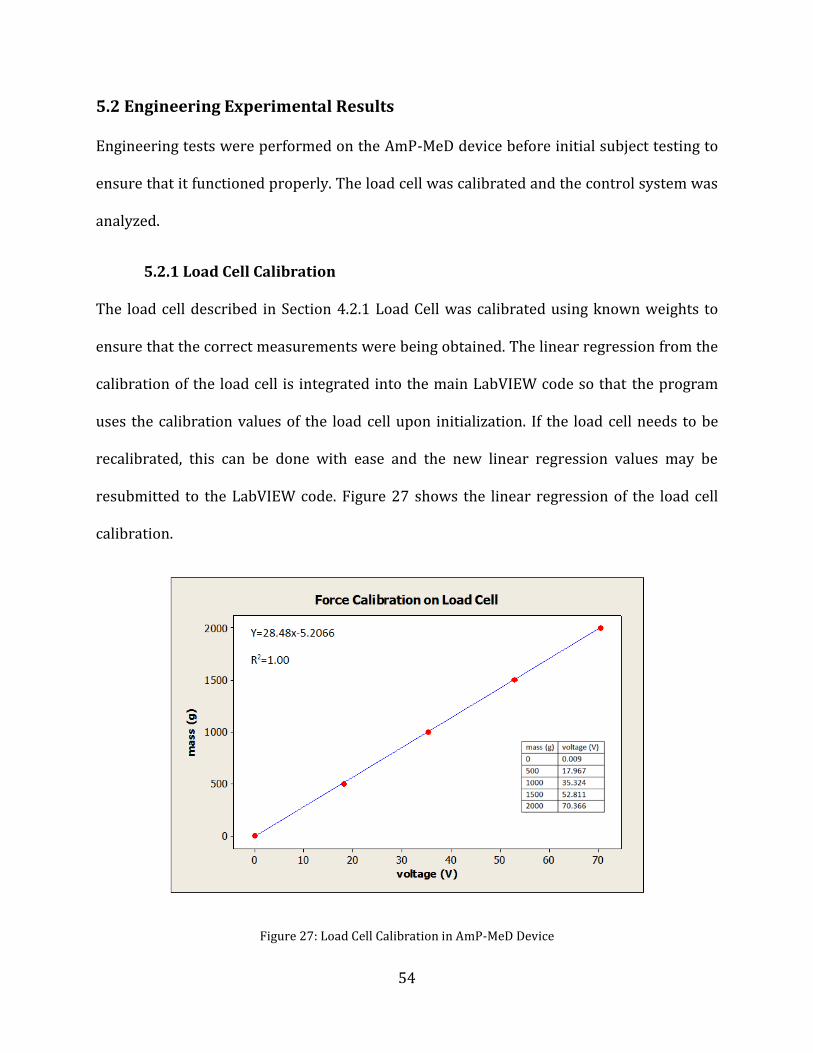
54
5.2 Engineering Experimental Results
Engineering tests were performed on the AmP-MeD device before initial subject testing to
ensure that it functioned properly. The load cell was calibrated and the control system was
analyzed.
5.2.1 Load Cell Calibration
The load cell described in Section 4.2.1 Load Cell was calibrated using known weights to
ensure that the correct measurements were being obtained. The linear regression from the
calibration of the load cell is integrated into the main LabVIEW code so that the program
uses the calibration values of the load cell upon initialization. If the load cell needs to be
recalibrated, this can be done with ease and the new linear regression values may be
resubmitted to the LabVIEW code. Figure 27 shows the linear regression of the load cell
calibration.
Figure 27: Load Cell Calibration in AmP-MeD Device

55
5.2.2 Control Loop Evaluations
The control loop implemented in the code was evaluated both on a synthetic leg and in
testing on study participants. The initial testing was performed using a padded aluminum
tube roughly the same diameter of a human leg. The AmP-MeD was used on this synthetic
leg to ensure that the control system behaved properly during human testing. After this
initial stage, participants from the test-group were tested. Figure 28 shows an example of a
force control loop on a test participant. The vertical green lines have been added after
testing analysis to indicate when the participant pressed the trigger to indicate his PPT and
PPTol. The white line is the ramped force from the pressure application tip (measured by
the load cell), and the red line is the safety cutoff. When the participant pressed the
tolerance button, the pressure application was immediately ended.
The force and position control is also evidenced in Figure 29, depicting the position and
application speed graphs. When the participant pressed the tolerance button, the piston
automatically retracted at full speed to the initial set-point position. The PID control system
is tuned for maximum retraction speed, which results in some overshoot. This explains the
oscillations seen in the bottom plot of the figure. The PID could be tuned to minimize these
oscillations, but that would mean a slower retraction speed, and this is considered less
desirable for safety reasons.

56
Figure 28: Force Feedback control on participant - characteristic example. Graph is of force applied (in kgf units) versus time. The white line follows the force-application path over time, while the red line is the force limit safety cutoff. The green threshold and tolerance lines have been added to indiate where the participant
indicated PPT and PPTol, respecively, during this test run.
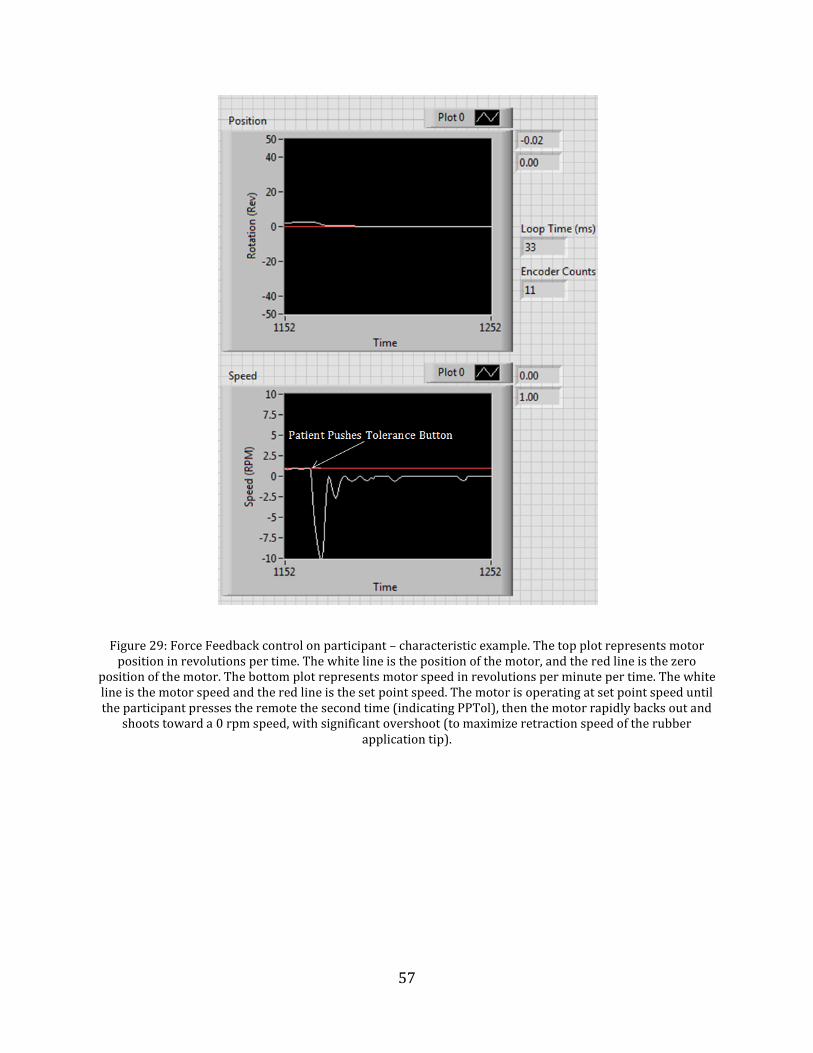
57
Figure 29: Force Feedback control on participant – characteristic example. The top plot represents motor position in revolutions per time. The white line is the position of the motor, and the red line is the zero
position of the motor. The bottom plot represents motor speed in revolutions per minute per time. The white line is the motor speed and the red line is the set point speed. The motor is operating at set point speed until the participant presses the remote the second time (indicating PPTol), then the motor rapidly backs out and
shoots toward a 0 rpm speed, with significant overshoot (to maximize retraction speed of the rubber application tip).
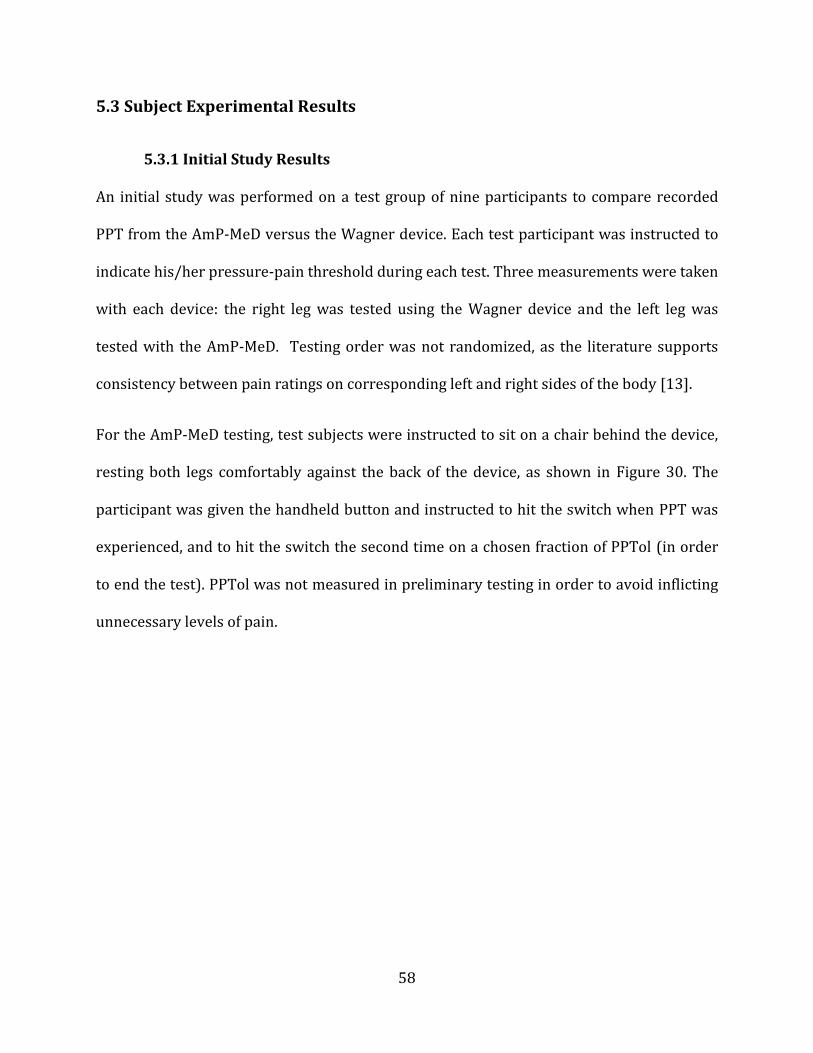
58
5.3 Subject Experimental Results
5.3.1 Initial Study Results
An initial study was performed on a test group of nine participants to compare recorded
PPT from the AmP-MeD versus the Wagner device. Each test participant was instructed to
indicate his/her pressure-pain threshold during each test. Three measurements were taken
with each device: the right leg was tested using the Wagner device and the left leg was
tested with the AmP-MeD. Testing order was not randomized, as the literature supports
consistency between pain ratings on corresponding left and right sides of the body [13].
For the AmP-MeD testing, test subjects were instructed to sit on a chair behind the device,
resting both legs comfortably against the back of the device, as shown in Figure 30. The
participant was given the handheld button and instructed to hit the switch when PPT was
experienced, and to hit the switch the second time on a chosen fraction of PPTol (in order
to end the test). PPTol was not measured in preliminary testing in order to avoid inflicting
unnecessary levels of pain.
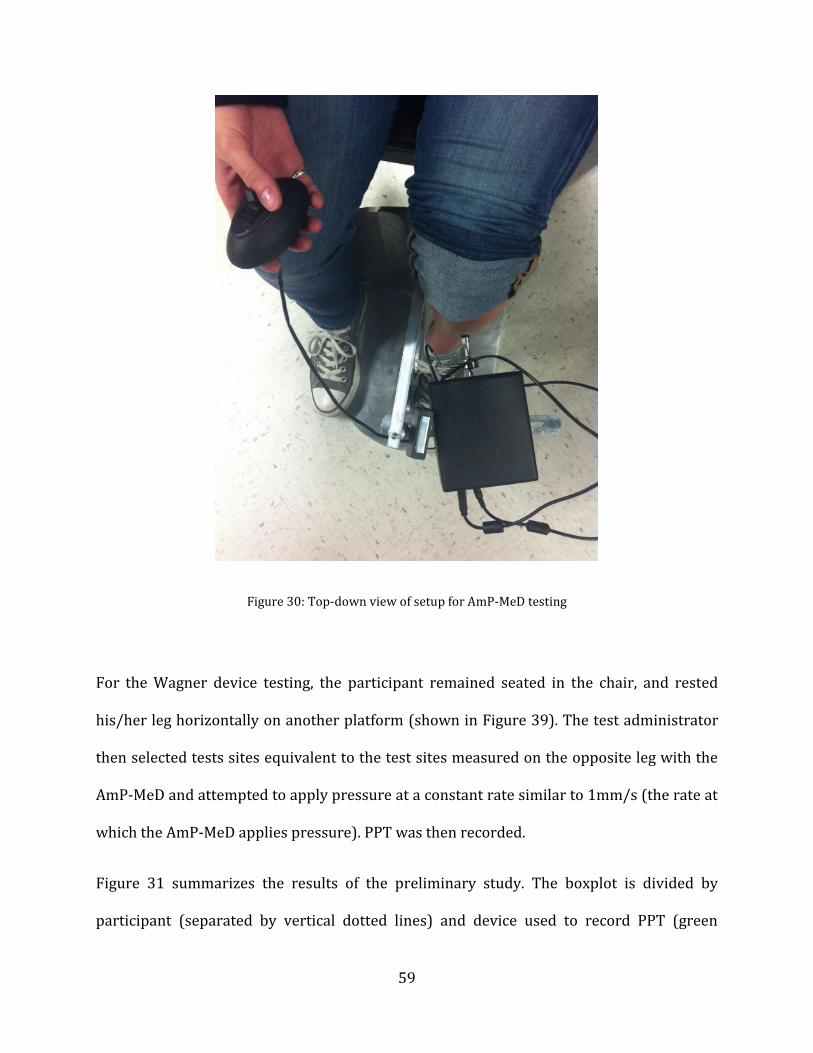
59
Figure 30: Top-down view of setup for AmP-MeD testing
For the Wagner device testing, the participant remained seated in the chair, and rested
his/her leg horizontally on another platform (shown in Figure 39). The test administrator
then selected tests sites equivalent to the test sites measured on the opposite leg with the
AmP-MeD and attempted to apply pressure at a constant rate similar to 1mm/s (the rate at
which the AmP-MeD applies pressure). PPT was then recorded.
Figure 31 summarizes the results of the preliminary study. The boxplot is divided by
participant (separated by vertical dotted lines) and device used to record PPT (green
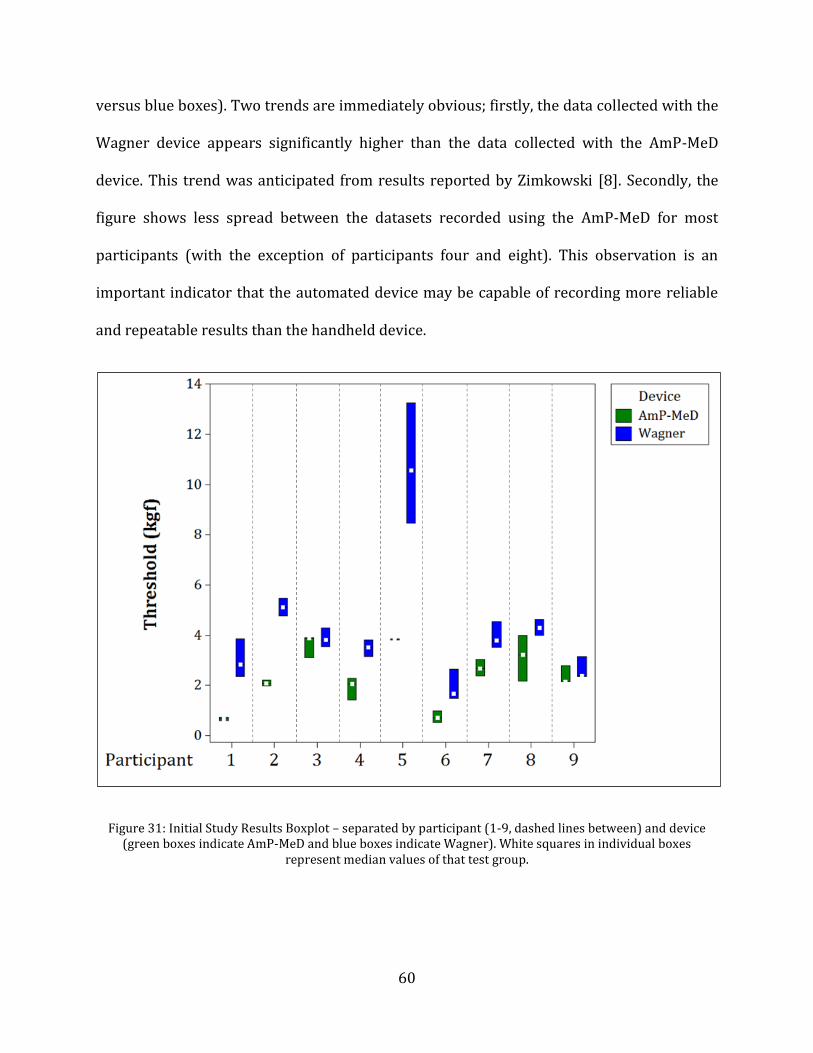
60
versus blue boxes). Two trends are immediately obvious; firstly, the data collected with the
Wagner device appears significantly higher than the data collected with the AmP-MeD
device. This trend was anticipated from results reported by Zimkowski [8]. Secondly, the
figure shows less spread between the datasets recorded using the AmP-MeD for most
participants (with the exception of participants four and eight). This observation is an
important indicator that the automated device may be capable of recording more reliable
and repeatable results than the handheld device.
Figure 31: Initial Study Results Boxplot – separated by participant (1-9, dashed lines between) and device (green boxes indicate AmP-MeD and blue boxes indicate Wagner). White squares in individual boxes
represent median values of that test group.
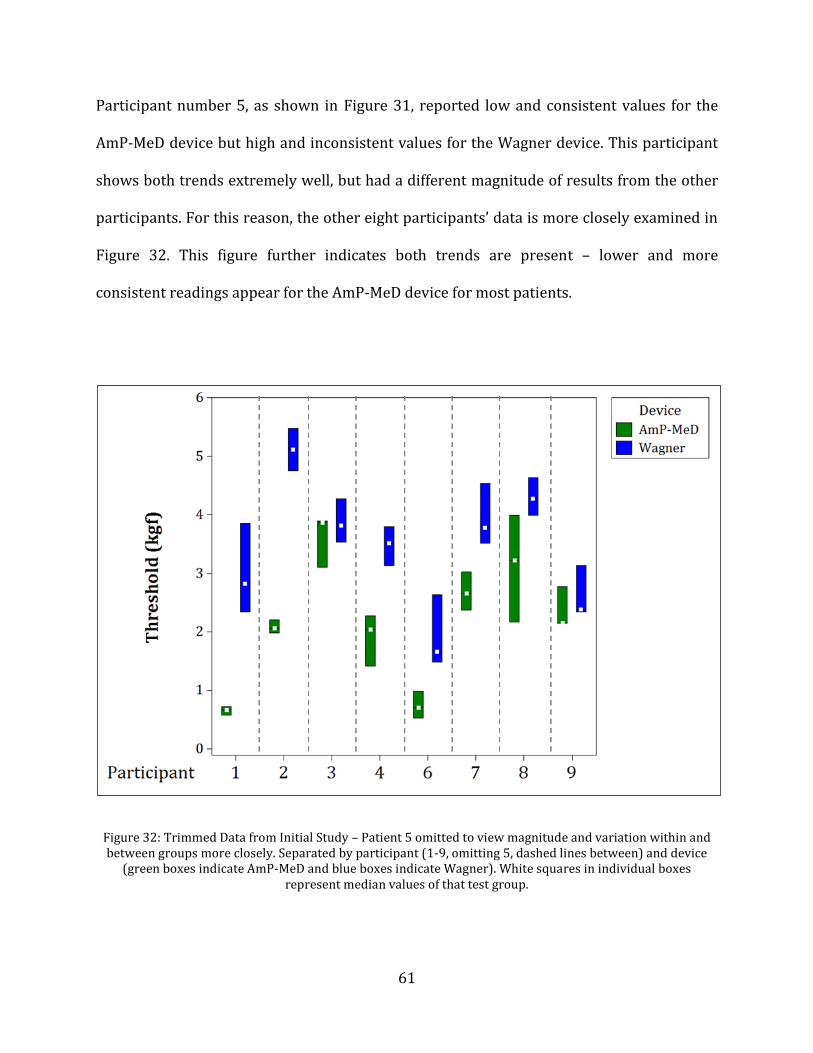
61
Participant number 5, as shown in Figure 31, reported low and consistent values for the
AmP-MeD device but high and inconsistent values for the Wagner device. This participant
shows both trends extremely well, but had a different magnitude of results from the other
participants. For this reason, the other eight participants’ data is more closely examined in
Figure 32. This figure further indicates both trends are present – lower and more
consistent readings appear for the AmP-MeD device for most patients.
Figure 32: Trimmed Data from Initial Study – Patient 5 omitted to view magnitude and variation within and between groups more closely. Separated by participant (1-9, omitting 5, dashed lines between) and device
(green boxes indicate AmP-MeD and blue boxes indicate Wagner). White squares in individual boxes represent median values of that test group.

62
5.3.2 Study Results
While the initial study was valuable in that it provided trends and added evidence to the
existing hypotheses, it only incorporated three data points per device from each
participant. In order to increase the power of the results, a second study was performed.
This study used the same test setup and instructions as outlined in the initial study (Section
5.3.1 Initial Study Results), but nine data-points were measured and recorded for PPT
using each device. Therefore, a total of 18 PPT measurements were recorded for each of the
10 participants. Participants were tested on the right leg using the Wagner device first,
then on the left leg using the AmP-MeD device. Each participant was tested in three
locations, with three measurements recorded at each location for each measurement
technique - Figure 33 diagrams the test locations on each leg. The test locations on the left
and right leg were considered equivalent, as supported by literature [13]. Furthermore, the
three test locations (A, B, and C, not distinguished per leg) were not randomized, as
literature supports that test site sensitivity does not vary in the muscle belly [53].
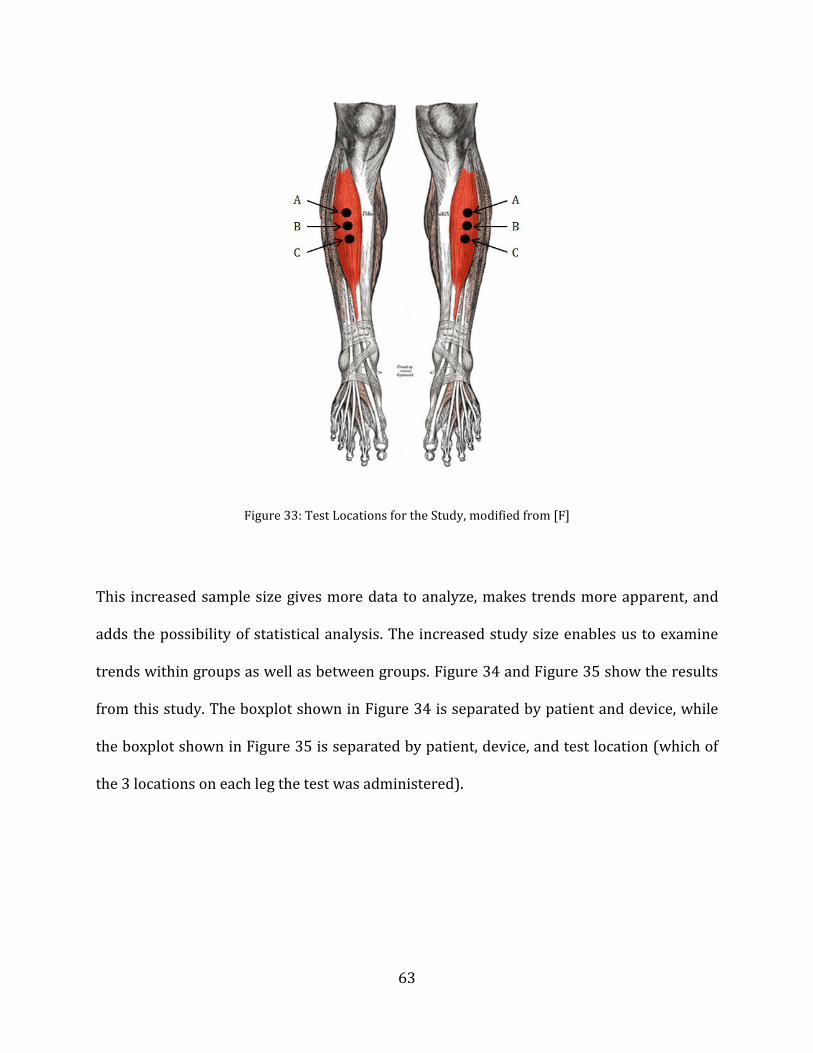
63
Figure 33: Test Locations for the Study, modified from [F]
This increased sample size gives more data to analyze, makes trends more apparent, and
adds the possibility of statistical analysis. The increased study size enables us to examine
trends within groups as well as between groups. Figure 34 and Figure 35 show the results
from this study. The boxplot shown in Figure 34 is separated by patient and device, while
the boxplot shown in Figure 35 is separated by patient, device, and test location (which of
the 3 locations on each leg the test was administered).

64
Figure 34: Study Results – Separated by participant (1-10, dashed lines between) and device (green boxes indicate AmP-MeD and blue boxes indicate Wagner). White squares in individual boxes represent median values of that test group, individual data points marked by black circles. Participant 8 includes an outlier,
marked by the black circle with a red cross on one Wagner measurement.
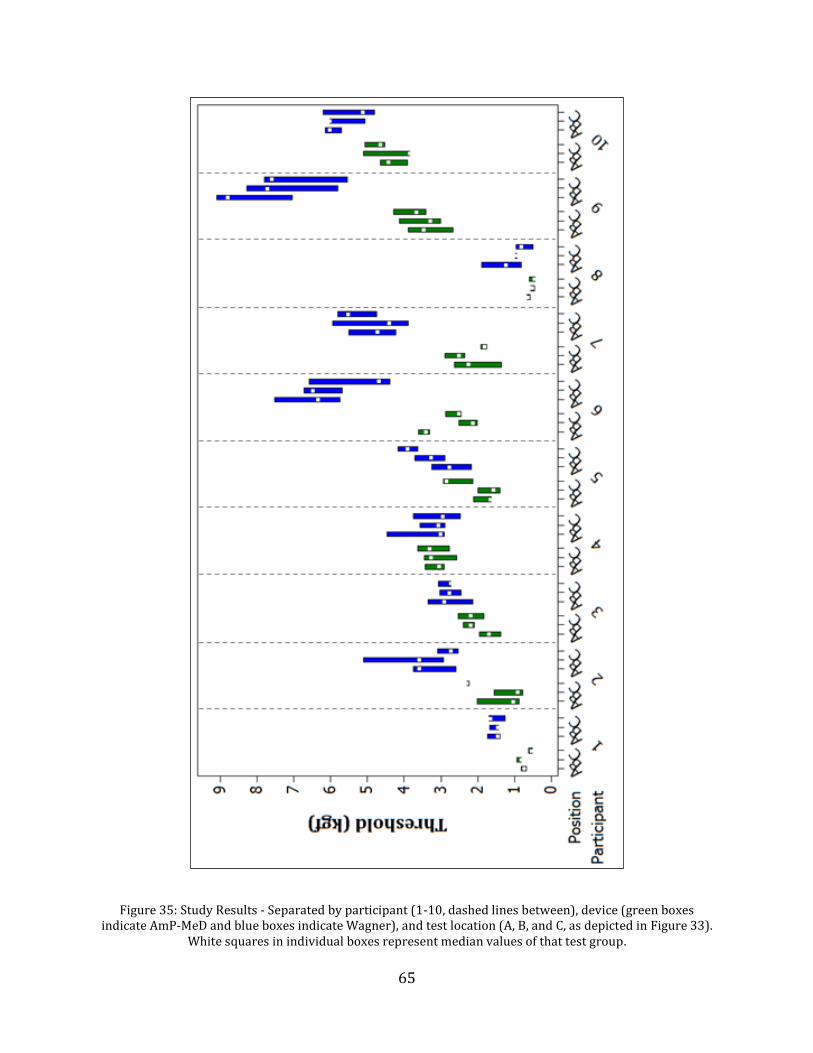
65
Figure 35: Study Results - Separated by participant (1-10, dashed lines between), device (green boxes indicate AmP-MeD and blue boxes indicate Wagner), and test location (A, B, and C, as depicted in Figure 33).
White squares in individual boxes represent median values of that test group.
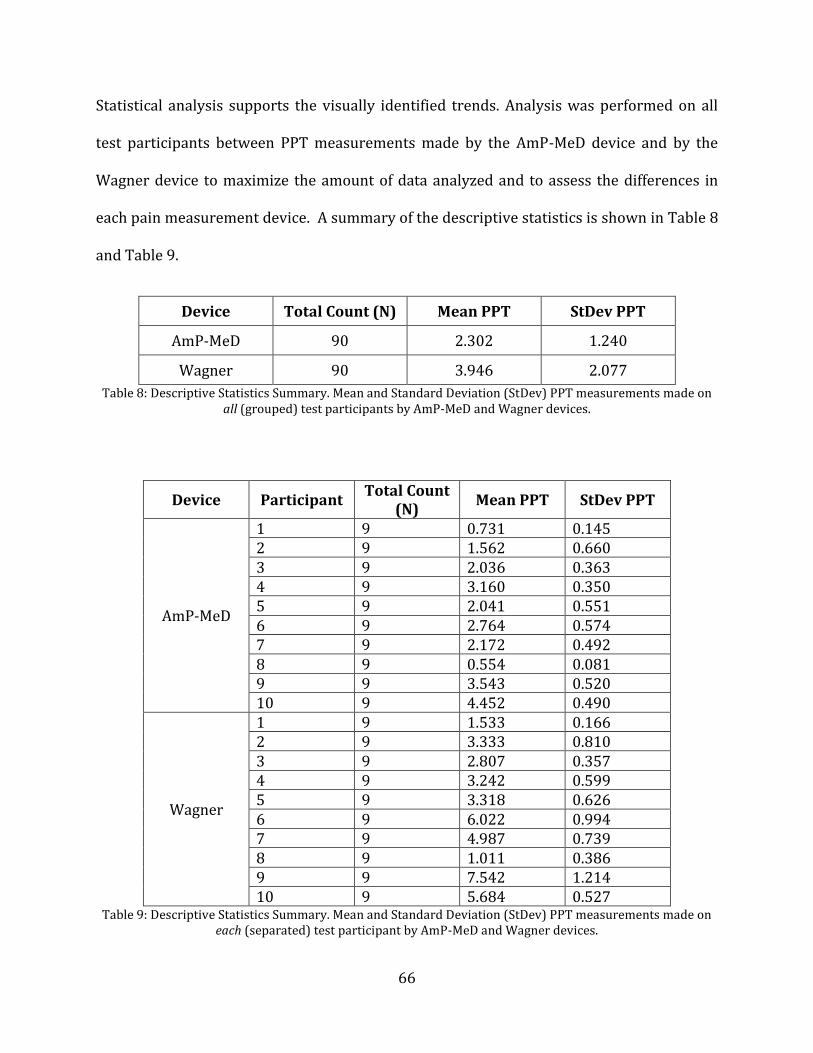
66
Statistical analysis supports the visually identified trends. Analysis was performed on all
test participants between PPT measurements made by the AmP-MeD device and by the
Wagner device to maximize the amount of data analyzed and to assess the differences in
each pain measurement device. A summary of the descriptive statistics is shown in Table 8
and Table 9.
Device Total Count (N) Mean PPT StDev PPT
AmP-MeD 90 2.302 1.240
Wagner 90 3.946 2.077
Table 8: Descriptive Statistics Summary. Mean and Standard Deviation (StDev) PPT measurements made on all (grouped) test participants by AmP-MeD and Wagner devices.
Device Participant Total Count
(N) Mean PPT StDev PPT
AmP-MeD
1 9 0.731 0.145 2 9 1.562 0.660 3 9 2.036 0.363 4 9 3.160 0.350 5 9 2.041 0.551 6 9 2.764 0.574 7 9 2.172 0.492 8 9 0.554 0.081 9 9 3.543 0.520 10 9 4.452 0.490
Wagner
1 9 1.533 0.166 2 9 3.333 0.810 3 9 2.807 0.357 4 9 3.242 0.599 5 9 3.318 0.626 6 9 6.022 0.994 7 9 4.987 0.739 8 9 1.011 0.386 9 9 7.542 1.214 10 9 5.684 0.527
Table 9: Descriptive Statistics Summary. Mean and Standard Deviation (StDev) PPT measurements made on each (separated) test participant by AmP-MeD and Wagner devices.

67
First, a test for normality was performed on the two groups to assess the assumptions of an
ANOVA test. A Ryan-Joiner Test for normality produces a correlation coefficient near 1, so
the populations of each group are likely to be normal. However, an Anderson-Darling test
produces a P-value below 0.05 for each group. Figure 36 displays the probability plots for
each test group, where it is seen that the data deviates from normal at the front-end.
Because of the relatively small sample sizes and variations between test participants, this
deviation from normality will be considered minimal, and the data will be assumed normal
for statistical analysis.
Figure 36: Probability Plots for Normally Distributed Data: separated into PPT measurements made by the AmP-MeD and the Wagner Devices.

68
In order to statistically assess the trends that were determined with visual analysis, two
tests were performed. First, an ANOVA was performed to assess the difference in mean PPT
measurements made by either the AmP-MeD or the Wagner device. A P-Value of 0.000 was
determined, strongly indicating that there is a significant difference in the mean PPT
measurements between devices. Subsequently, a Tukey Test was performed to assess
which device measured higher PPT measurements. The test confirmed the visual analysis
that the Wagner device measured significantly higher PPT values for all patients than the
AmP-MeD. Figure 37 summarizes these statistical results.
Figure 37: ANOVA Results of PPT measurements made by Wagner and AmP-MeD show that there is a significant difference in PPT measured with Wagner versus AmP-Med (P=0.000) and that the Wagner
measurements are significantly higher (groups A and B).
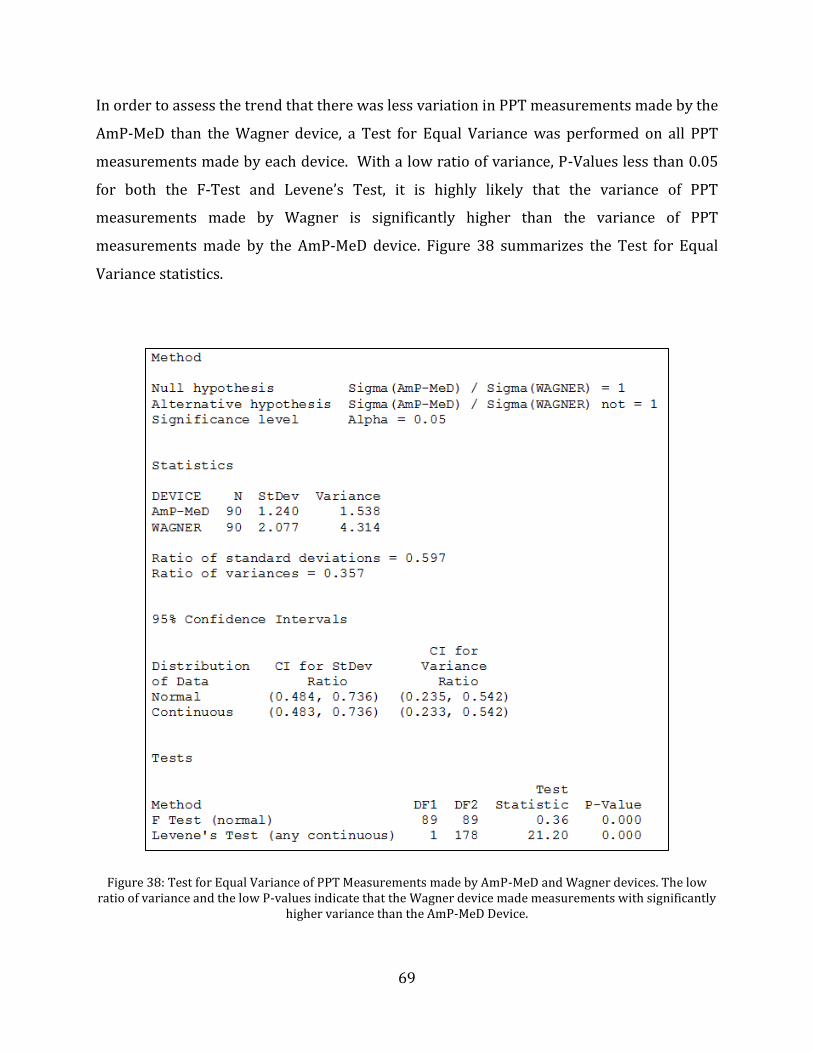
69
In order to assess the trend that there was less variation in PPT measurements made by the
AmP-MeD than the Wagner device, a Test for Equal Variance was performed on all PPT
measurements made by each device. With a low ratio of variance, P-Values less than 0.05
for both the F-Test and Levene’s Test, it is highly likely that the variance of PPT
measurements made by Wagner is significantly higher than the variance of PPT
measurements made by the AmP-MeD device. Figure 38 summarizes the Test for Equal
Variance statistics.
Figure 38: Test for Equal Variance of PPT Measurements made by AmP-MeD and Wagner devices. The low ratio of variance and the low P-values indicate that the Wagner device made measurements with significantly
higher variance than the AmP-MeD Device.

70
Chapter 6
Discussion
From both the initial study and the expanded study, evident trends are observed which
support original hypotheses that an automated device may be more desirable than a
handheld device.
6.1 Difference in PPT Magnitude between Automated and Handheld Devices
It is clear that the measurements made with the AmP-MeD device are significantly
(P=0.000) and systematically lower than the measurements made with the Wagner
handheld device. There are multiple reasons for this result which introduce interesting
hypotheses that further indicate the advantages of an automated device. Firstly, it is
hypothesized that patients trust a human test administrator more than a machine, and
since there is a sense of distrust with an automated device, a patient will indicate a PPT or
PPTol value earlier than with a handheld device, thus buying time to “escape” or stop the
test if the machine does not respond as expected. This psychological effect could play a role
in the magnitude discrepancy between the measurement results. However, all participants
tested thus far have been Mechanical Engineering students who are familiar with the
device and research– thus they have reported little intimidation or “fear” of the device, and
certainly less than a non-technical, less informed participant may be.
While this psychological effect may still be present, it is consistent throughout all ten
participants tested – this may indicate that the psychological effects of the automated
71
device are more consistent from participant to participant than the psychological effects of
the handheld device. This hypothesis is further backed by the observations that the
automated device is exactly the same in every test – the testing environment can be closely
controlled, and the patient-machine interface remains constant in every test with the AmP-
MeD. However, a handheld device may be operated in many different environments with
many different test administrators. This inconsistency in testing environment creates large
variation between testing sessions, which makes psychological and psychosocial factors
virtually impossible to monitor, and thus impossible to minimize. With the consistent
testing environment provided by an automated device, psychological and psychosocial
factors are still present, but they are constant between testing sessions and between
patient and test administrators; thus, they are more easily monitored and minimized, and
variation of these factors between tests is nearly eliminated.
Secondly, and very importantly, the difference in magnitude between the PPT
measurements is likely due to sensitivity of the automated device. When the participant
indicates PPT or PPTol by a button press during an automated-device test, the machine
immediately records the applied force within a millisecond. When the participant indicates
PPT or PPTol by verbal communication with the test administrator during a handheld
device test, the time between the participant’s decision that s/he has reached PPT or PPTol,
the participant’s verbalization of this information, the test administrator’s recognition of
the information, and the test administrator’s action of stopping the test and recording the
force at that time is significant. This lost time results in increased PPT and PPTol
measurements with handheld measurements, as the pressure is still being applied while
72
this time is lost. For these reasons, we may hypothesize that the AmP-MeD device
successfully increases measurement sensitivity.
6.2 Less Variation in Measurements with Automated versus Handheld Device
It is observed that there is less variation in measurements made by the AmP-MeD versus
the handheld Wagner device. Minitab analysis determined that there is a significant
difference in the variances between measurements made by the AmP-MeD and Wagner
devices, with the AmP-MeD measurements showing significantly less variance than the
Wagner measurements. This smaller variance indicates that measurements made using the
automated device are more reliable and more repeatable than measurements made using
the handheld device – a significant improvement which could lead to improved
understanding of pain measurement.
6.3 AmP-MeD versus CCPA
As discussed in Section 5.1 AmP-MeD in comparison to Wagner and CCPA Devices, the
AmP-MeD device offers significant benefits over the original CCPA. Namely, the usability,
functionality, and aesthetics have been drastically improved. This goal was further
validated by the testing, where it was evident that the improvements featured in the AmP-
MeD make an enormous difference in both the test administrator and patient experience. A
second test administrator was briefly trained for this testing to assess the ease of use of the
device. The simplicity of the setup and ease of use of the operating system were
immediately apparent. The data recording and analysis was also perceived as streamlined
and clear. The size/weight/aesthetics of the device each contribute to the ease of use, as
well as the multiple safety mechanisms (outlined in Section 4.6 Safety and Emergency
73
Stops). Overall, the streamlined design improves the usability, functionality, and aesthetics
of the device such that all users are positively impacted.
6.4 Participant and Test Administrator Feedback
Many of the participants from the study provided feedback which may enable future
enhancements of the device and test methods. Firstly, a couple of participants commented
that that outstretched, horizontal testing position for the handheld device test, pictured in
Figure 39, stretched his/her hamstring. This may have introduced a secondary source of
pain, which has been shown to affect pain measurement. Secondly, some participants
reported that they felt more sensitive on the third PPT measurement in one location than
on the first or second. This increased sensitivity could be attributed to sensitization,
although the opposite (habituation) is also thought to occur simultaneously. Participants
also reported the different test locations to feel more/less sensitive than others, although
the test locations were separated by one inch and were all along the belly of the tibialis
anterior (as pictured in Figure 33). One participant noted that if the pressure application
tip was angled upward, it may produce a more perpendicular contact with the tibialis
anterior, as the leg diameter increases the more proximal to the body. This feedback will
be considered in the future work of the device in order to improve the device and testing
methods. Finally, one participant remarked that if the test administrator touched him in
another location close to the test site (in the handheld device testing), he became confused
as to which sensation was which for PPT measurements. This situation is pictured in
Figure 40, where the test administrator may rest a hand on the participant’s leg to stabilize
the testing.

74
Figure 39: Wagner Handheld Device Testing Position
Figure 40: Wagner Testing, with Test Administrator's Right Hand Making Contact with Participant
75
One participant that was tested was involved in the CCPA testing with Zimkowski, and had
valuable comments on the differences between the two test experiences. Firstly, it was
noted that the AmP-MeD device was much less intimidating than the CCPA because of size,
design, and actuation method (the loud air compressor used with the CCPA was
intimidating and bulky). Secondly, it was noted that safety enhancements were obvious
with the AmP-MeD and the testing seemed much more reliable. Thirdly, the ease of use for
the operator and the participant were noted as being vastly improved. The fact that the
participant was not required to help with leg positioning (as in the CCPA where scooting up
and down in the frame with internal/external rotation of the leg was necessary) and that
the testing setup was short and simple made the testing experience easier on the
participant. However, some shortcomings were noted that could contribute to future work
goals. First, it was noted that the test administrator must bend down to adjust the device
before and between tests. While this is not an issue for a young and able-bodied test
administrator, some individuals may find this uncomfortable and inconvenient. Secondly, it
was observed that the arm of the device can deflect away from the participant at higher
forces (this was observed with PPTol measurements only), as shown in Figure 41, which
may result in inaccurate displacement measurements. This observation will be taken into
account if a second-generation AmP-MeD is created, and if PPTol measurements are made.

76
Figure 41: Deflection of AmP-MeD Arm at High Forces

77
Chapter 7
Future Directions
Now that a successful device has been designed, developed, and validated, it must be
integrated with physiological data measurements in order to conduct larger studies. The
integration with physiological data was not a focus of this project, as it has already been
achieved by Zimkowski [9]. The physiological data integration will follow the methodology
outlined in Zimkowski’s thesis and other documentation, and no significant changes are
anticipated.
Once physiological data is successfully measured with the AmP-MeD, a larger study will be
possible. If ~50 participants were tested using the device, research analysis could be
performed to investigate the correlation of the objective physiological data with the
subjective participant input data.
If the relationship between objective and subjective pain responses is established, it will be
possible to measure a personalized pain scale at any clinic using typical vital sign
measurement devices. Although this relationship may be difficult to fully understand,
personalized pain scales may still be easily measured in any clinic using the AmP-MeD in
addition blood pressure and heart rate measurement equipment. The integration of the
AmP-MeD device into a clinic could be streamlined easily, as vital signs are typically
already measured at the beginning of any clinic exam. With the data collected on blood
pressure and heart rate, the pain data would be easily integrated into digital medical
records, establishing a pain scale over time for each patient.

78
Chapter 8
Conclusion
Although future work is necessary to accomplish a better understanding of pain, the work
described in this thesis takes us one step closer to accomplishing improved pain
measurement techniques. The design, development, and verification of the AmP-MeD
summarized in this thesis shows that the device is a novel tool for pain research that may
provide insight into the understanding of pain.
Using the AmP-MeD device in the future to enable personalized pain scales to be measured
in clinics would help clinicians to better understand pain, more accurately diagnose it, and
more appropriately treat it. With the improved understanding and treatment of pain,
millions of people around the globe would experience less hardship due to chronic and
acute pain; resulting in higher qualities of life, lower costs of healthcare, a reduced burden
of pain and pain medications in the daily lives of people around the world.

79
Chapter 9
Bibliography
[A] Chronic Pain http://pain.about.com/od/testingdiagnosis/ig/pain-scales/Wong-Baker.htm Image Retrieved 10/22/2013
[B] Behavioral Pain Scale http://assessingpaininventedpatients.blogspot.com/2011/07/assessing-pain-in-mechanically.html Image Retrieved 11/8/2013
[C] Wagner Instruments Greenwich, CT http://www.paintest.com/index.php Image Retrieved 10/25/2013
[D] Somedic Sales Stockholm, Sweden http://en.somedic.com/default.asp?pid=27 Image Retrieved 10/25/2013
[E] JTech Medical Salt Lake City, UT http://www.jtechmedical.com/Products-and-Solutions/ Image Retrieved 10/25/2013
[F] Gray’s Anatomy (faithful reproduction of a lithograph plate from Gray’s Anatomy) http://commons.wikimedia.org/wiki/File:Tibialis_anterior_2.png Image Retrieved 11/08/2013

80
Chapter 10
References
[1] Huskisson, E. C. "Measurement of Pain." The Lancet 304 (1974): 1127-1131.
[2] Merskey, H. "Logic, Truth, and Language in Concepts of Pain." Quality of Life Research 3 (1994): 569-576.
[3] Ahlers, Sabine JGM, Laura Van Gulik, Aletta M. Van Der Veen, Hendricus PA Van Dongen, Peter Bruins, Svetlana V. Belitser, Anthonius De Boer, Dick Tibboel, and Catherijne AJ Knibbe. "Comparison of Different Pain Scoring Systems in Critically Ill Patients in a General ICU." Critical Care 12.15 (2008): 16-24.
[4] Gaskin, Darrell J., and Patrick Richard. "The Economic Costs of Pain in the United States."The Journal of Pain 13.8 (2012): 715-724.
[5] Phillips, D. M. "JCAHO Pain Management Standards Are Unveiled." Journal of the American Medical Association 284 (2000): 428-429.
[6] Merskey, H., and N. Bogduk. "Classification of Chronic Pain: Descriptions of Chronic Pain Syndromes and Definitions of Pain Terms." Pain 3 (1994): 1986-1996.
[7] Rodriguez, C. "Pain Measurement in the Elderly: A Review." Pain Management Nursing 2 (2001): 38-46.
[8] Zimkowski, Michael M. Design and Preliminary Evaluation of a Computer Controlled Pressure Algometer for Measuring Pain Sensitivity. Thesis. University of Colorado at Boulder, 2010.
[9] Zimkowski, Michael M., Emily M. Lindley, Vikas V. Patel, and Mark E. Rentschler. "Design and Evaluation of a Computer-Controlled Pressure Algometer." ASME Journal of Medical Devices. 5(2011): 1-6.
[10] Chanques G, Jaber S, Barbotte E, Violet S, Sebbane M, Perrigault PF, Mann C, Lefrant JY, Eledjam JJ “Impact of systematic evaluation of pain and agitation in an intensive care unit” Crit Care Med 34 (2006):1691-1699.

81
[11] Gruener, G., and Per Dyck. "Quantitative Sensory Testing: Methodology, Applications, and Future-Directions." Journal of Clinical Neurophysiology 11 (1994): 568-583.
[12] Zaslansky, R., and D. Yarnitsky. "Clinical Applications of Quantitative Sensory Testing (QST)." Journal of the Neurological Sciences 153 (1998): 215-238.
[13] Fischer, A. "Pressure Algometry Over Normal Muscles - Standard Values, Validity, and Reproducibility of Pressure Threshold." Pain 30 (1987): 115-126.
[14] Ylinen, Jari, Matti Nykanen, Hannu Kautiainen, and Arja Hakkinen. "Evaluation of Repeatability of Pressure Algometry on the Neck Muscles for Clinical Use." Manual Therapy 12 (2007): 192-197.
[15] Persson, A., B. Brogardh, and B. Sjolund. "Tender or Not Tender: Test-Retest Repeatability of Pressure Pain Thresholds in the Trapezius and Deltoid Muscles of Healthy Women." Journal of Rehabilitation Medicine 36 (2004): 17-27.
[16] Rolke, R., K. Campbell, W. Magerl, and R. Treede. "Deep Pain Thresholds in the Distal Limbs of Healthy Human Subjects." European Journal of Pain 9 (2005): 39-48.
[17] Ylinen, J. "Pressure Algometry - Commentary." Australian Journal of Physiotherapy 53 (2007): 207-208.
[18] Ohrbach, Richard, Heidi Crow, and Angela Kamer. "Examiner Expectancy Effects in the Measurement of Pressure Pain Thresholds." Pain 74 (1998): 163-170.
[19] Antonaci, F., T. Sand, and G. Lucas. "Pressure Algometry in Healthy Subjects: Interexaminer Variability." Scandinavian Journal of Rehabilitation Medicine 30 (1998): 3-8.
[20] Aslaksen, Per M., Ingvild N. Myrbakk, Ragnhild S. Hoifodt, and Magne A. Flaten. "The Effect of Experimenter Gender on Autonomic and Subjective Responses to Pain Stimuli." Pain 129 (2007): 260-268.
[21] Dundee, J. W., and J. Moore. "Alterations in Response to Somatic Pain Associated with Anesthesia." British Journal of Anesthesia 32 (1960): 396-406.
[22] Xiong S, Goonetilleke RS, Jiang Z. “Pressure thresholds of the human foot: measurement reliability and effects of stimulus characteristics.” Ergonomics 54 (2011): 282-293.
[23] Xiong S, Goonetilleke RS, Witana CP, Rodrigo WD. “An indentation apparatus for evaluating discomfort and pain thresholds in conjunction with mechanical properties of foot tissue in vivo.” Journal of Rehabilitation Research and Development 47 (2010): 629-641.

82
[24] Koo TK, Cohen JH, Zheng Y. “A mechano-acoustic indentor system for in vivo
measurement of nonlinear elastic properties of soft tissue.” Journal of Manipulative Physiological Therapies 34 (2011): 584-593.
[25] Reeves JL, Jaeger B, Graff-Radford SB. “Reliability of the pressure algometer as a measure of myofascial trigger point sensitivity.” Pain 24 (1986): 313-21.
[26] Persson AL, Brogardh C, Sjolund BH. Tender or not tender: test-retest repeatability of pressure pain thresholds in the trapezius and deltoid muscles of healthy women. Journal of Rehabilitation Medicine 36 (2004): 17-27.
[27] Cathcart S, Pritchard D. “Reliability of pain threshold measurement in young adults.” Journal of Headache Pain 7 (2006): 21-26.
[28] Kosek E, Ekholm J, Nordemar R. “A comparison of pressure pain thresholds in different tissues and body regions. Longterm reliability of pressure algometry in healthy volunteers.” Scandinavian Journal Rehabilitation Medicine 25 (1993): 117-124.
[29] Pontinen PJ. “Reliability, validity, and reproducibility of algometry in the diagnosis of active and latent tender spots and trigger points.” Journal of Musculoskeletal Pain 6 (1998): 160-169.
[30] List T, Helkimo M, Falk G. “Reliability and validity of a pressure threshold meter in recording tenderness in the masseter muscle and the anterior temporalis muscle.” Journal of Cranio-Maxillofacial Surgery 7 (1989): 223-229.
[31] Ashina S, Babenko L, Jensen R, Ashina M, Magerl W, Bendtsen L. “Increased muscular and cutaneous pain sensitivity in cephalic region in patients with chronic tension-type headache.” European Journal of Neurology 12 (2005): 543-549.
[32] Granges G, Littlejohn G. “Pressure pain threshold in pain-free subjects, in patients with chronic regional pain syndromes, and in patients with fibromyalgia syndrome.” Arthritis Rheumatism 36 (1993): 642-646.
[33] Fischer AA. “Pressure threshold meter: its use for quantification of tender spots.” Archives of Physical Medicine and Rehabilitation 67 (1986): 836-838.
[34] Hogeweg JA, Langereis MJ, Bernards AT, Faber JA, Helders PJ. Algometry. “Measuring pain threshold, method and characteristics in healthy subjects.” Scandinavian Journal of Rehabilitation Medicine 24 (1992): 99-103.
[35] Johansson L, Kjellberg A, Kilbom A, Hagg GM. “Perception of surface pressure applied to the hand.” Ergonomics 42 (1999): 1274-82.

83
[36] Jensen K, Andersen HO, Olesen J, Lindblom U. “Pressure-pain threshold in human temporal region. Evaluation of a new pressure algometer.” Pain 25 (1986): 313-23.
[37] Ohrbach R, Gale EN. “Pressure pain thresholds in normal muscles: reliability, measurement effects, and topographic differences.” Pain 37 (1989): 257-263.
[38] Koo, Terry K., Jing-yi Guo, and Cameron M. Brown. "Test-Retest Reliability, Repeatability, and Sensitivity of an Automated Deformation-Controlled Indentation on Pressure Pain Threshold Measurement." Journal of Manipulative and Physiological Therapeutic36 (2013): 84-90.
[39] A. Unruh, “Gender variations in clinical pain experience,” Pain 65 (1996): 123-167.
[40] L. Chesterton, J. Sim, C. Wright, and N. Foster, “Interrater reliability of algometry in measuring pressure pain thresholds in healthy humans, using multiple raters,” Clinical Journal of Pain. 23 (2007): 760-766.
[41] Wolff BB. “Behavioral measurement of human pain.” The psychology of pain (1978): 129-168.
[42] Arntz A, Merckelbach H, Peters M, Schmidt AJ. “Chronic low back pain, response specificity and habituation to painful stimuli.” Journal of Psychophysiology 5 (1991): 177-188.
[43] Ernst M, Lee MH, Dworkin B, Zaretsky HH. “Pain perception decrement produced through repeated stimulation.” Pain 26 (1986): 221-31.
[44] Peters ML, Schmidt AJ, Van den Hout MA. “Chronic low back pain and the reaction to repeated acute pain stimulation.” Pain 39 (1989): 69-76.
[45] Wood, Derek, Siera Goodnight, Adnrew J. Haig, and Tareto Nasari. "Body Mass Index, but Not Blood Pressure Is Related to the Level of Pain in Persons with Chronic Pain." Journal of Back and Musculoskeletal Rehabilitation 24 (2011): 111-115.
[46] S. Bruehl, C. Carlson, and J. McCubbin, “The Relationship between Pain and Blood Pressure in Normotensives.” Pain 48 (1992): 463-467.
[47] Y. Tousignant-Laflamme and S. Marchand, “Sex differences in cardiac and autonomic response to clinical and experimental pain in LBP patients,” European Journal of Pain 10 (2006): 603-614.
[48] T. Fujita, Y. Fujii, S. Okada, A. Miyauchi, and Y. Takagi, “Fall of skin impedance and bone and joint pain,” Journal of Bone and Mineral Metabolism 19 (2001): 175-179.
84
[49] Bertrand, Adriana L., Garcia J. Batista, Erica B. Viera, Alcione M. Santos, and Romero H. Bertrand. “Pupillometry the influence of gender and anxiety on pain response” Pain Physician 16 (2013): 257-66.
[50] Borgbjerg, Molke F., Kurt Nielsen, and Jan Franks. "Experimental Pain Stimulates Respiration and Attenuates Morphine-induced Respiratory Depression: A Controlled Study in Human Volunteers." Pain 2878 (1995): 123-28.
[51] Kirwilliam, S. S., and S. WG Derbyshire. "Increased Bias to Report Heat or Pain following Emotional Priming of Pain-related Fear." Pain 137 (2008): 60-65.
[52] Greenspan JD, McGillis SL. “Thresholds for the perception of pressure, sharpness, and mechanically evoked cutaneous pain: effects of laterality and repeated testing.” Somatosensory and Motor Research 11 (1994): 311–317.
[53] Andersen, Helle, Lars Arent-Nielsen, Bente Danneskiold-Samsoe, Thomas Graven-Nielsen. "Pressure Pain Sensitivity and Hardness along Human Normal and Sensitized Muscle." Somatosensory and Motor Research 23 (2006): 97-109.

85
Chapter 11
Appendices
Appendix 11.1 Oswestry Disability Index
Section 1: Pain Intensity □ I can tolerate the pain I have without having to use pain killers. [0 points]
□ The pain is bad but I manage without taking pain killers. [1 point]
□ Pain killers give complete relief from pain . [2 points]
□ Pain killers give moderate relief from pain. [3 points ]
□ Pain killers give very little relief from pain. [4 points]
□ Pain killers have no effect on the pain and I do not use them. [5 points]
Section 2: Personal Care □ I can look after myself normally without causing extra pain. [0 points]
□ I can look after myself normally but it causes extra pain. [1 point]
□ It is painful to look after myself and I am slow and careful. [2 points]
□ I need some help but manage most of my personal care. [3 points]
□ I need help every day in most aspects of self care. [4 points]
□ I do not get dressed wash with difficulty and stay in bed. [5 points]
Section 3: Lifting □ I can lift heavy weights without extra pain. [0 points]
□ I can lift heavy weights but it gives extra pain. [1 point]
□ Pain prevents me from lifting heavy weights off the floor but I can manage if they are conveniently positioned for
example on a table. [2 points]
□ Pain prevents me from lifting heavy weights but I can manage light to medium weights if they are conveniently
positioned. [3 points]
□ I can lift only very light weights. [4 points]
□ I cannot lift or carry anything at all. [5 points]
Section 4: Walking □ Pain does not prevent me walking any distance. [0 points]
□ Pain prevents me walking more than 1 mile. [1 point]
□ Pain prevents me walking more than 0.5 miles. [2 points]
□ Pain prevents me walking more than 0.25 miles. [3 points]
□ I can only walk using a stick or crutches. [4 points]
□ I am in bed most of the time and have to crawl to the toilet. [5 points]
Section 5: Sitting □ I can sit in any chair as long as I like. [0 points]
□ I can only sit in my favorite chair as long as I like. [1 point]
□ Pain prevents me sitting more than 1 hour. [2 points]
□ Pain prevents me from sitting more than 0.5 hours. [3 points]
□ Pain prevents me from sitting more than 10 minutes. [4 points]
□ Pain prevents me from sitting at all. [5 points]
Section 6: Standing

86
□ I can stand as long as I want without extra pain. [0 points]
□ I can stand as long as I want but it gives me extra pain. [1 point]
□ Pain prevents me from standing for more than 1 hour. [2 points]
□ Pain prevents me from standing for more than 30 minutes. [3 points]
□ Pain prevents me from standing for more than 10 minutes. [4 points]
□ Pain prevents me from standing at all. [5 points]
Section 7: Sleeping □ Pain does not prevent me from sleeping well. [0 points]
□ I can sleep well only by using tablets. [1 point]
□ Even when I take tablets I have less than 6 hours sleep. [2 points]
□ Even when I take tablets I have less than 4 hours sleep. [3 points]
□ Even when I take tablets I have less than 2 hours of sleep. [4 points]
□ Pain prevents me from sleeping at all. [5 points]
Section 8: Sex Life □ My sex life is normal and causes no extra pain. [0 points]
□ My sex life is normal but causes some extra pain. [1 point]
□ My sex life is nearly normal but is very painful. [2 points]
□ My sex life is severely restricted by pain. [3 points]
□ My sex life is nearly absent because of pain. [4 points]
□ Pain prevents any sex life at all. [5 points]
Section 9: Social Life □ My social life is normal and gives me no extra pain. [0 points]
□ My social life is normal but increases the degree of pain. [1 point]
□ Pain has no significant effect on my social life apart from limiting energetic interests such as dancing. [2 points]
□ Pain has restricted my social life and I do not go out as often. [3 points]
□ Pain has restricted my social life to my home. [4 points]
□ I have no social life because of pain. [5 points]
Section 10: Travelling
□ I can travel anywhere without extra pain. [0 points]
□ I can travel anywhere but it gives me extra pain. [1 point]
□ Pain is bad but I manage journeys over 2 hours. [2 points]
□ Pain restricts me to journeys of less than 1 hour. [3 points]
□ Pain restricts me to short necessary journeys under 30 minutes. [4 points]
□ Pain prevents me from traveling except to the doctor or hospital. [5 points]

87
Appendix 11.2 Load Cell Datasheet

88
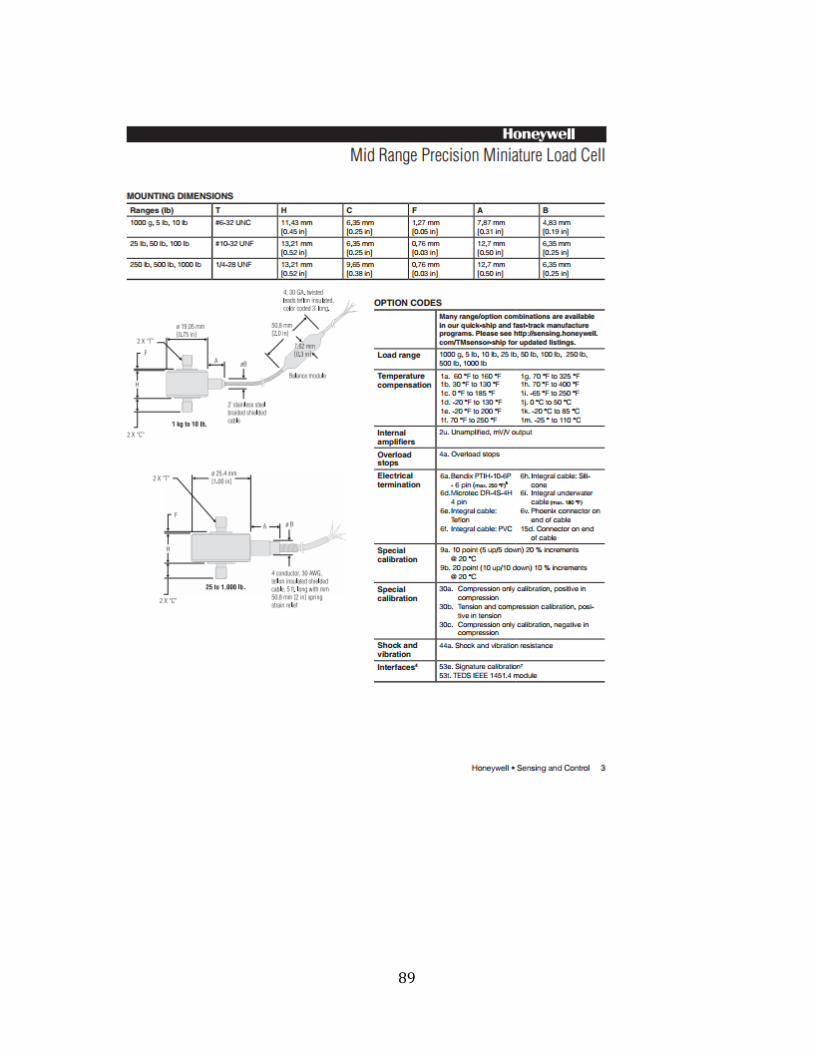
89
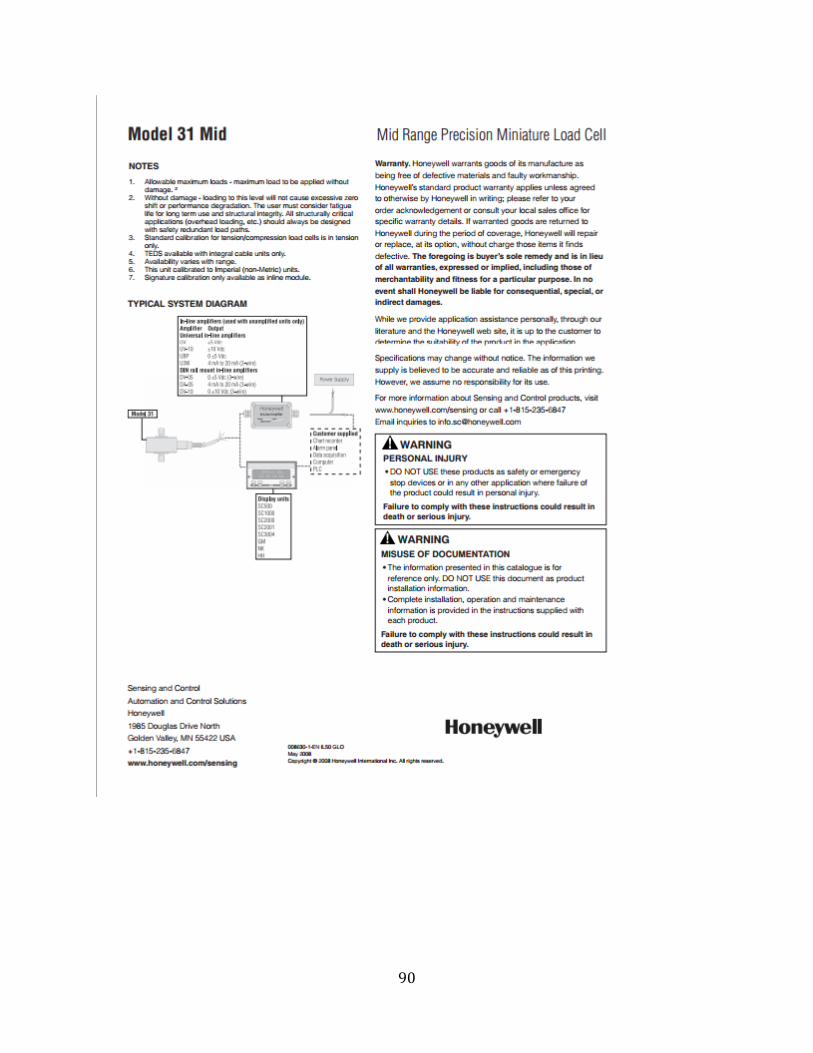
90

91
Appendix 11.3 LabVIEW Code
AmP_MeD.lvproj
11.3.1 Motor Encoder Reset, Button and Load Cell Control
Figure 42: LabVIEW Code - Motor Encoder Reset, Button and Load Cell control

92
11.3.2 Automatic Control (Case 0)
Figure 43: LabVIEW Automatic Control (Case 0)
11.3.3 Automatic Control (Case 1)
Figure 44: LabVIEW Automatic Control (Case 1)
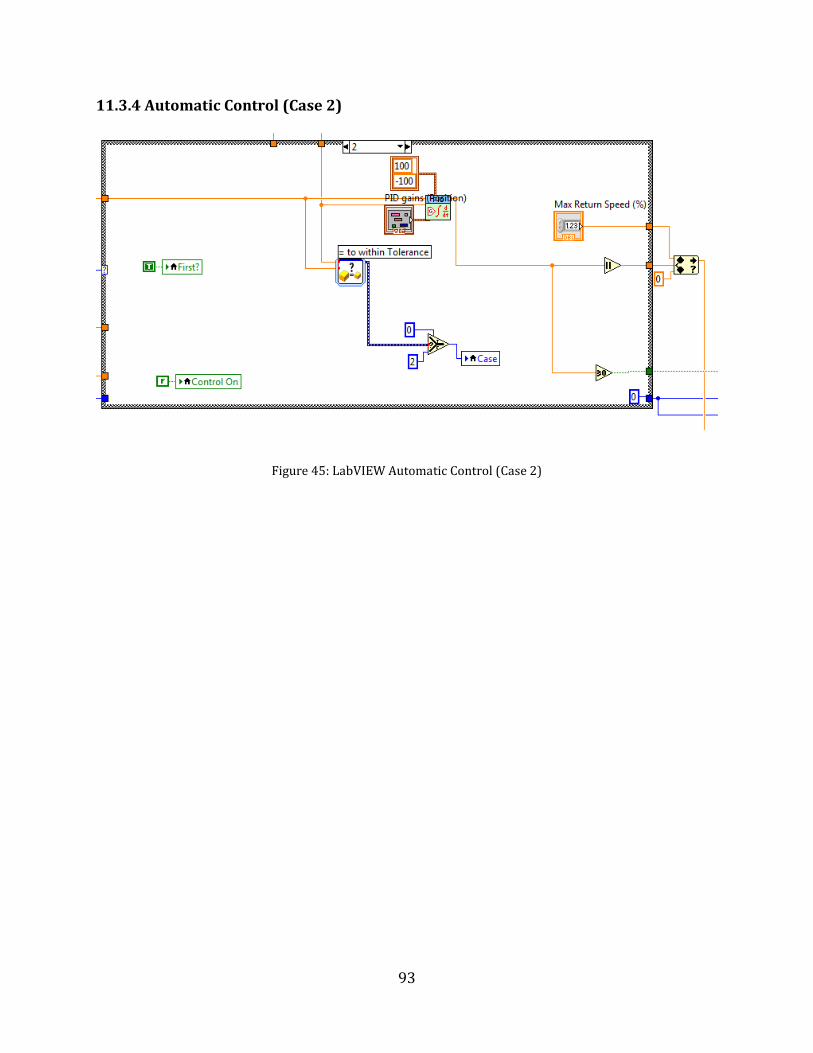
93
11.3.4 Automatic Control (Case 2)
Figure 45: LabVIEW Automatic Control (Case 2)
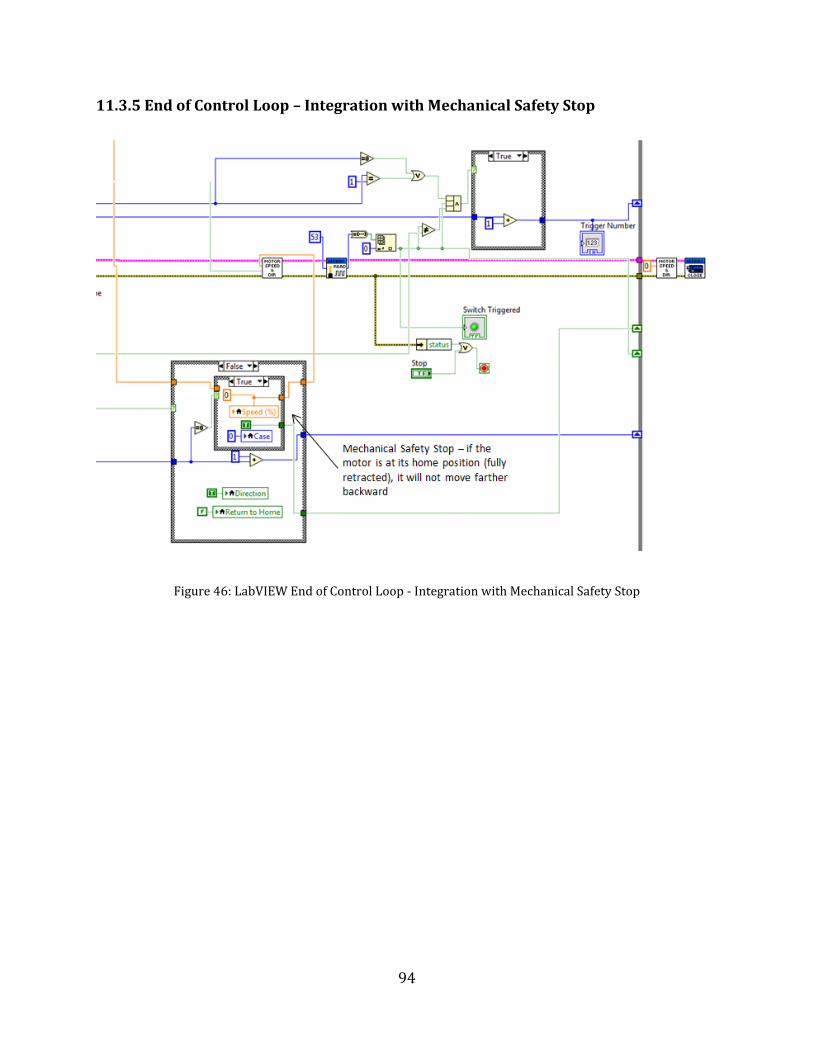
94
11.3.5 End of Control Loop – Integration with Mechanical Safety Stop
Figure 46: LabVIEW End of Control Loop - Integration with Mechanical Safety Stop
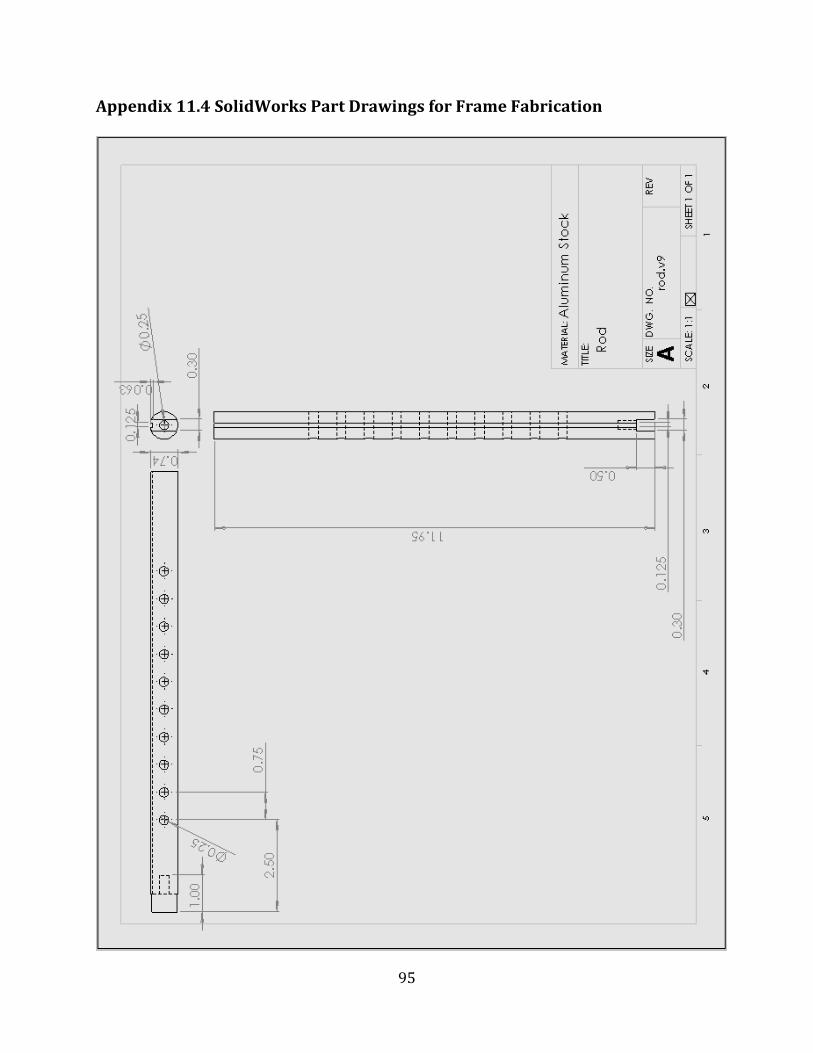
95
Appendix 11.4 SolidWorks Part Drawings for Frame Fabrication
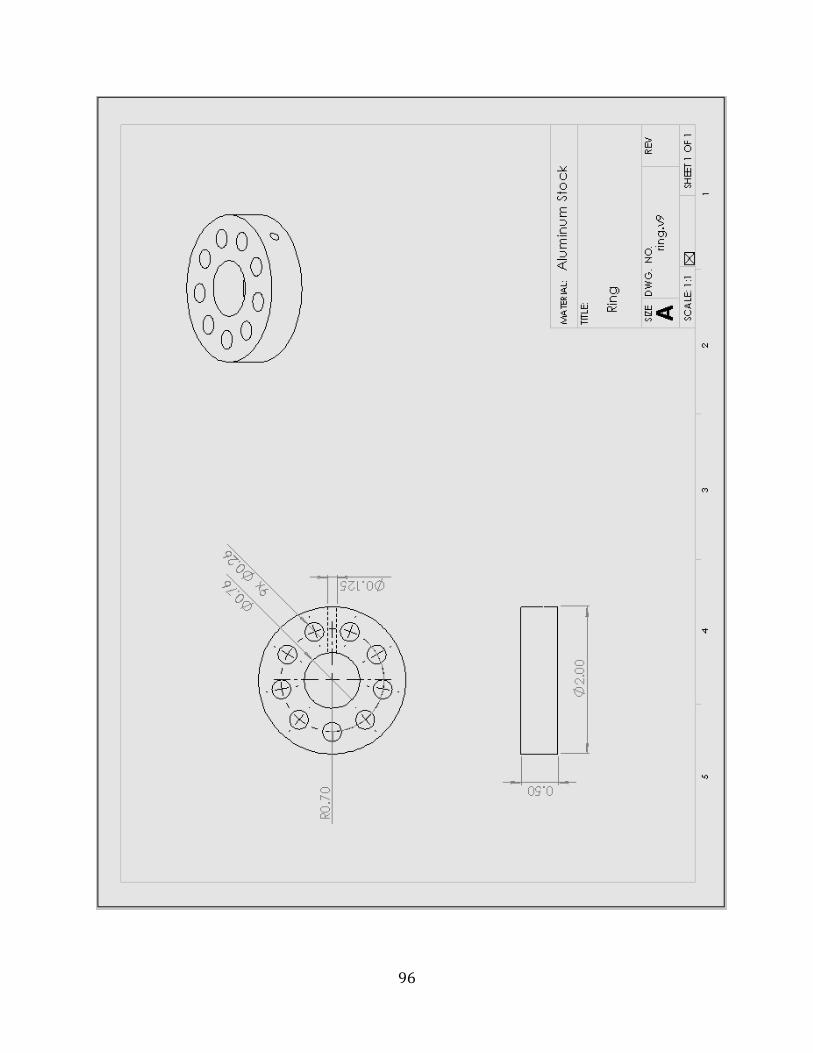
96
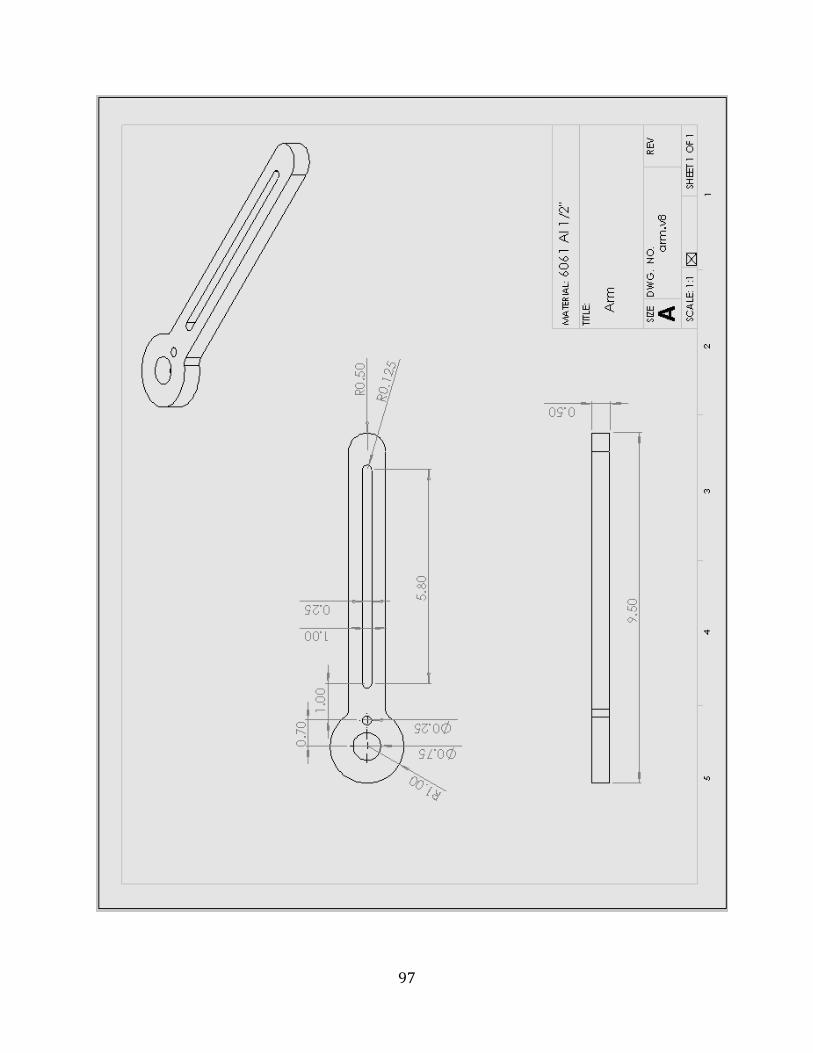
97
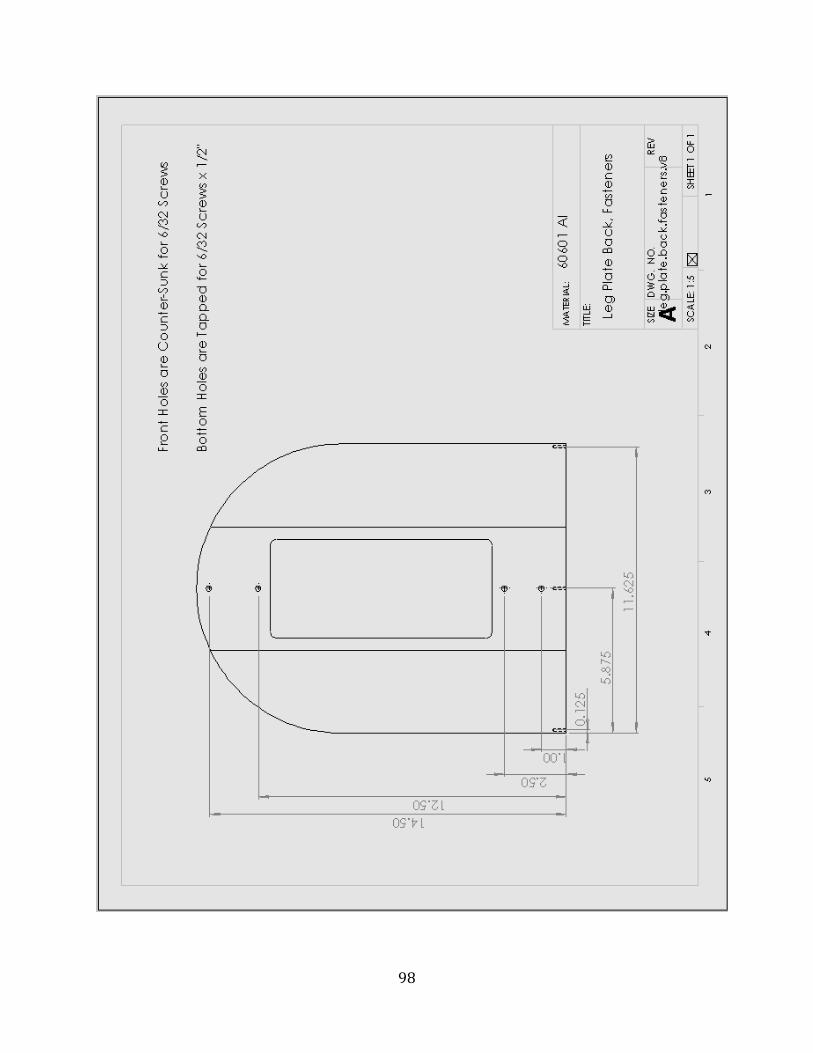
98
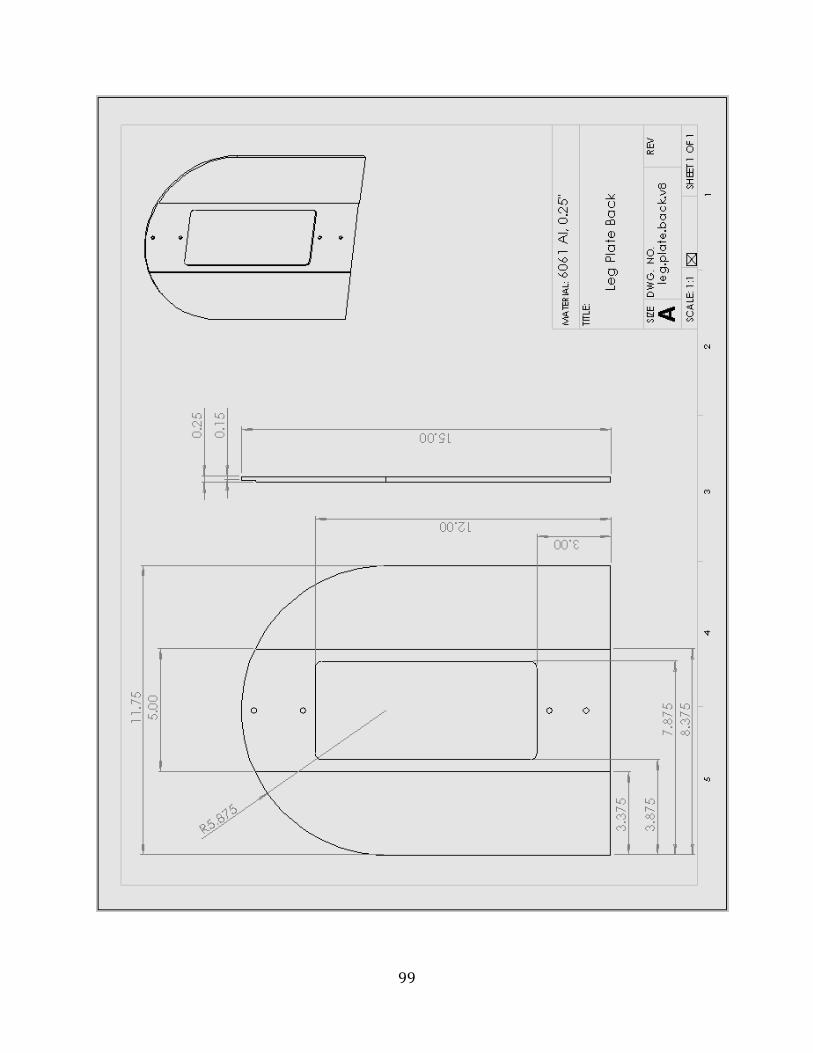
99
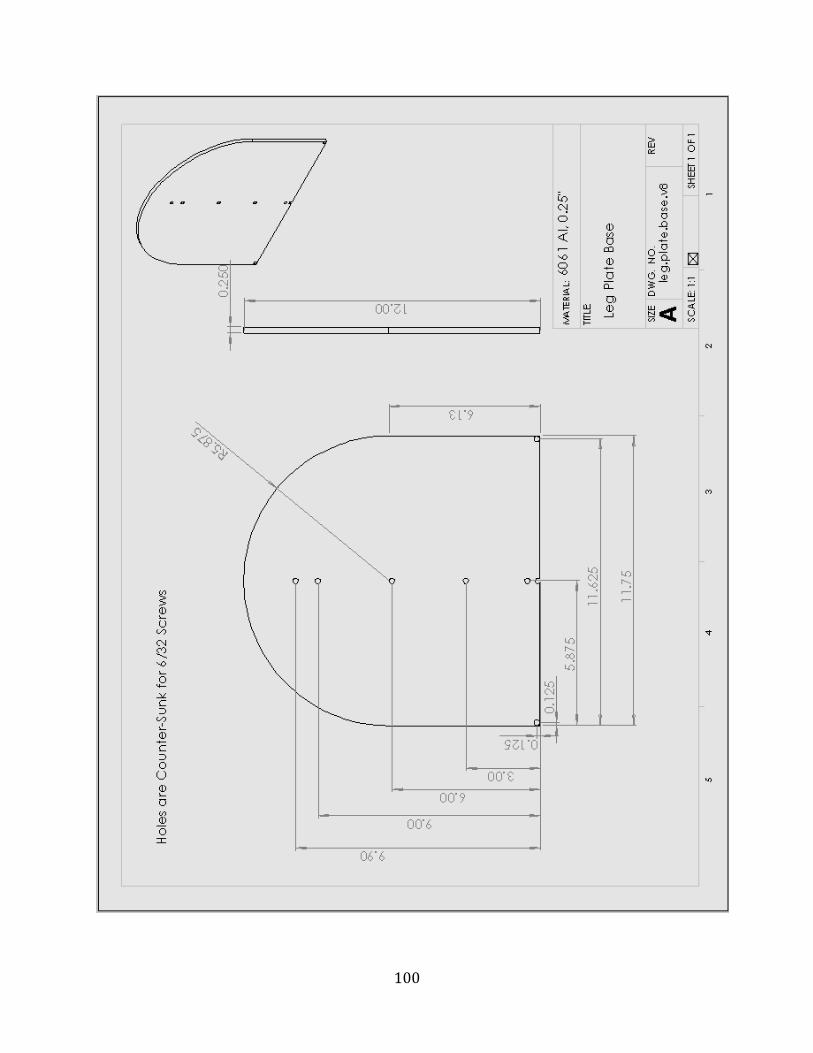
100
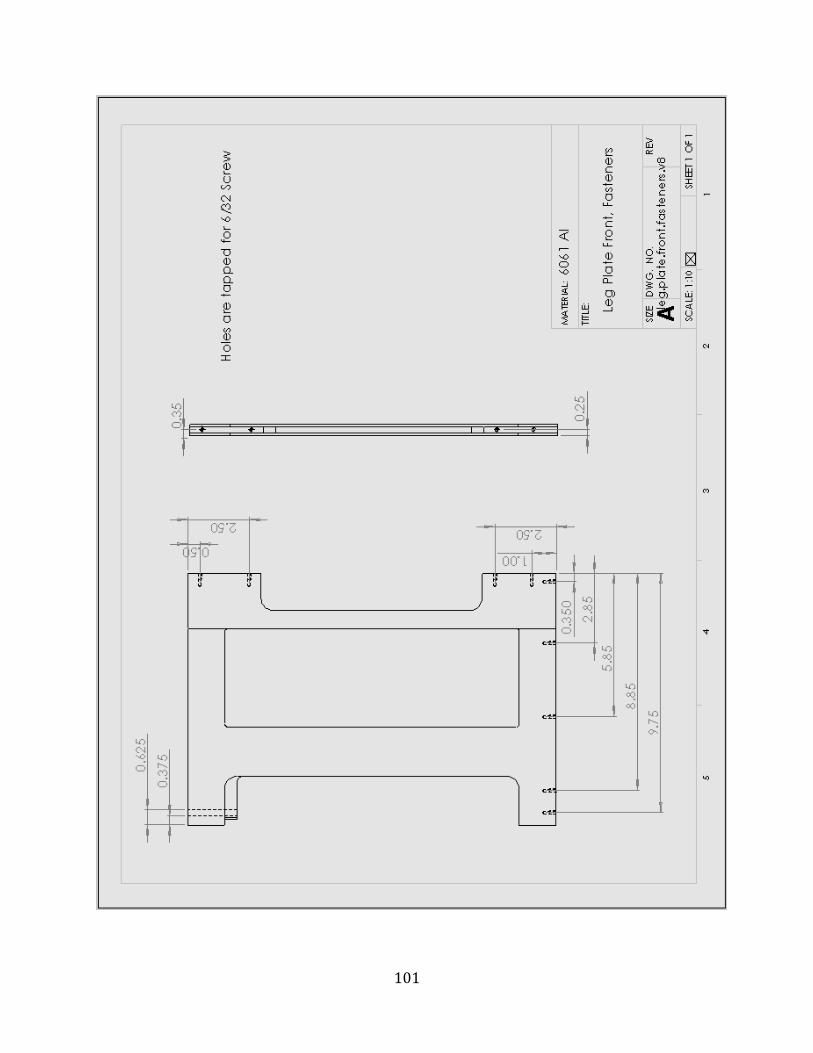
101

102

103
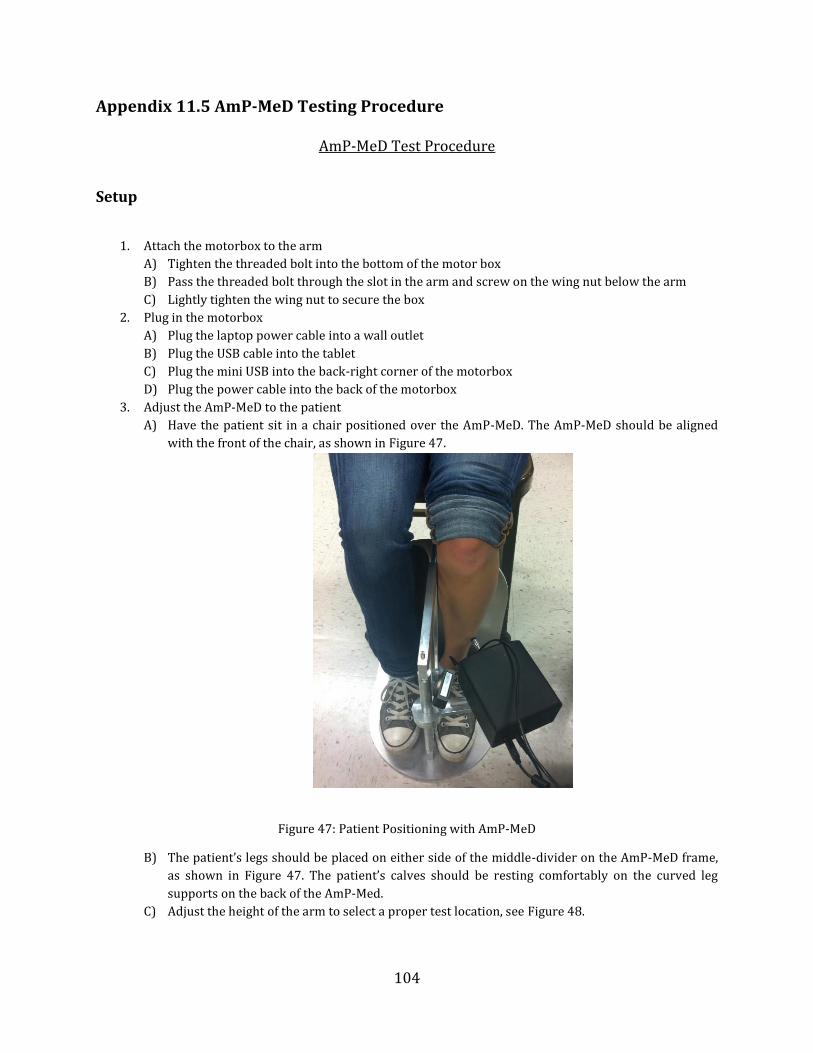
104
Appendix 11.5 AmP-MeD Testing Procedure
AmP-MeD Test Procedure
Setup
1. Attach the motorbox to the arm
A) Tighten the threaded bolt into the bottom of the motor box
B) Pass the threaded bolt through the slot in the arm and screw on the wing nut below the arm
C) Lightly tighten the wing nut to secure the box
2. Plug in the motorbox
A) Plug the laptop power cable into a wall outlet
B) Plug the USB cable into the tablet
C) Plug the mini USB into the back-right corner of the motorbox
D) Plug the power cable into the back of the motorbox
3. Adjust the AmP-MeD to the patient
A) Have the patient sit in a chair positioned over the AmP-MeD. The AmP-MeD should be aligned
with the front of the chair, as shown in Figure 47.
Figure 47: Patient Positioning with AmP-MeD
B) The patient’s legs should be placed on either side of the middle-divider on the AmP-MeD frame,
as shown in Figure 47. The patient’s calves should be resting comfortably on the curved leg
supports on the back of the AmP-Med.
C) Adjust the height of the arm to select a proper test location, see Figure 48.

105
Figure 48: Proper Height adjustment for test location
i) Slide the ring and arm together up/down the rod until the preferred height is found.
ii) Insert a horizontal pin through the rod to support the ring and arm.
D) Adjust the angle of the arm to select a proper fit for the patient’s leg size, see Figure 49.
Figure 49: Proper angular adjustment for leg size
a) Lateral of tibial ridge b) Perpendicular contact with skin on
tibialis anterior

106
i) Swing the arm toward/away from the patient’s leg so that the pressure application tip is
close to touching the patient’s leg
ii) Place the emergency release pin vertically through the arm and ring to select a proper arm
angle for the patient’s leg size
E) Adjust the angle and position of the motorbox to acquire a perpendicular fit at the tibialis
anterior (see Figure 49).
i) The motorbox may pivot about the threaded bolt in the arm slot
ii) The motorbox may slide horizontally along the arm slot
iii) Tighten the wing nut when the proper location is determined. The rubber application tip
should be resting very close to the patient’s skin at a perpendicular angle.
Data Recording Setup
1. Open the Template.xls file from the AmP-MeD Testing Data folder, and save a copy for the specific
patient, in the format
Patient Initials_PatientNumber_Date.xls
2. Run the AmP-MeD program
A. On the desktop, select the AmP-MeD folder
B. Run the AmP_MeD project
C. Run the PID.ArduinoMega.Main.vi
D. Start the .vi by clicking on the white arrow in the top left corner
E. Provide a filename for the results to be stored. Use the format:
Patient Initials_PatientNumber_Date.txt
3. Set the Desired Speed to 1.00 mm/s
4. Set the Load Cutoff to 4 lbf for preliminary testing
5. Ensure that the Max Return Speed is set at 50%
6. Tare the Load Cell by clicking the tare load cell button
7. Observe that the patient’s switch has is not activated (the large switch triggered indicator should be
dim, and both small first 1? and first 2? indicators should be lit). If this is not the case, physically
activate the switch (remote patient held button) once or twice to reset the test.
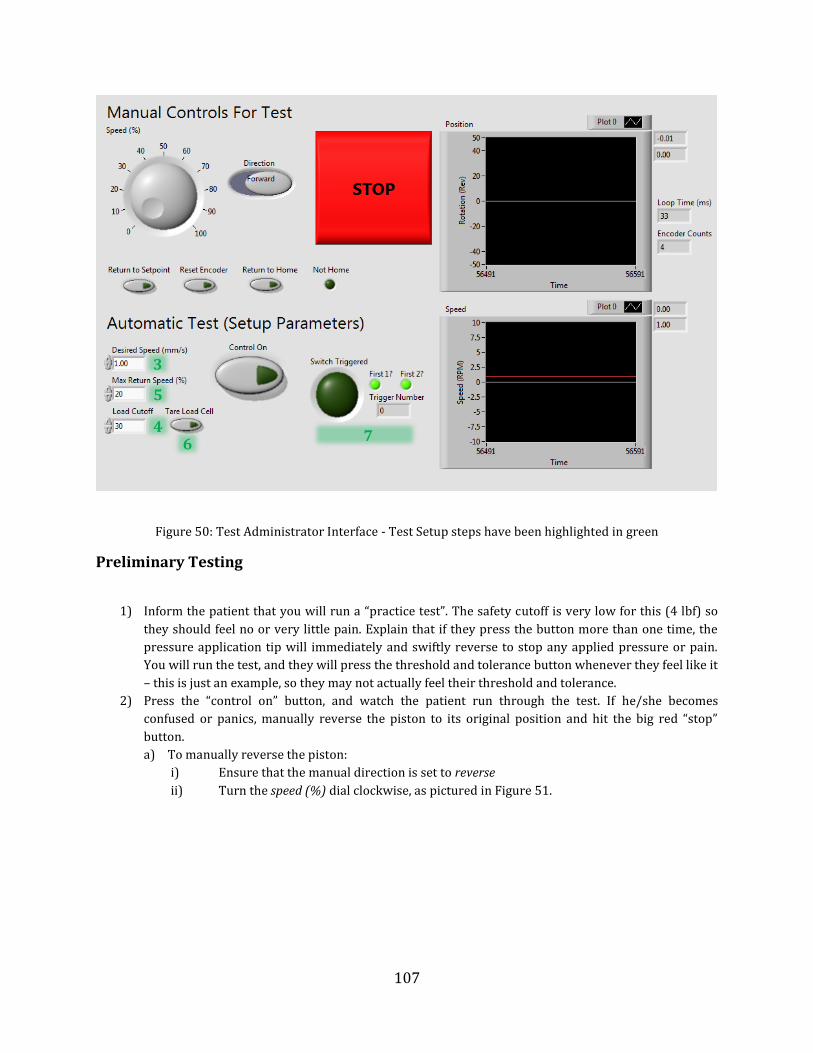
107
Figure 50: Test Administrator Interface - Test Setup steps have been highlighted in green
Preliminary Testing
1) Inform the patient that you will run a “practice test”. The safety cutoff is very low for this (4 lbf) so
they should feel no or very little pain. Explain that if they press the button more than one time, the
pressure application tip will immediately and swiftly reverse to stop any applied pressure or pain.
You will run the test, and they will press the threshold and tolerance button whenever they feel like it
– this is just an example, so they may not actually feel their threshold and tolerance.
2) Press the “control on” button, and watch the patient run through the test. If he/she becomes
confused or panics, manually reverse the piston to its original position and hit the big red “stop”
button.
a) To manually reverse the piston:
i) Ensure that the manual direction is set to reverse
ii) Turn the speed (%) dial clockwise, as pictured in Figure 51.
3
4
5
6 7
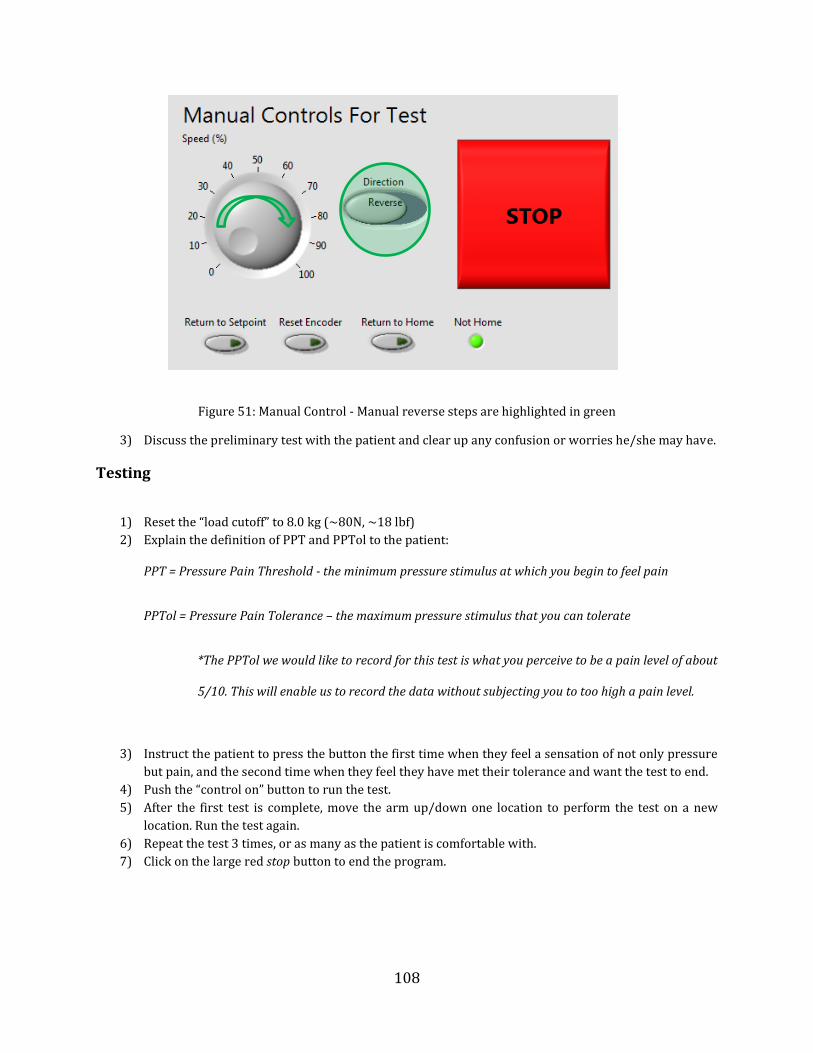
108
Figure 51: Manual Control - Manual reverse steps are highlighted in green
3) Discuss the preliminary test with the patient and clear up any confusion or worries he/she may have.
Testing
1) Reset the “load cutoff” to 8.0 kg (~80N, ~18 lbf)
2) Explain the definition of PPT and PPTol to the patient:
PPT = Pressure Pain Threshold - the minimum pressure stimulus at which you begin to feel pain
PPTol = Pressure Pain Tolerance – the maximum pressure stimulus that you can tolerate
*The PPTol we would like to record for this test is what you perceive to be a pain level of about
5/10. This will enable us to record the data without subjecting you to too high a pain level.
3) Instruct the patient to press the button the first time when they feel a sensation of not only pressure
but pain, and the second time when they feel they have met their tolerance and want the test to end.
4) Push the “control on” button to run the test.
5) After the first test is complete, move the arm up/down one location to perform the test on a new
location. Run the test again.
6) Repeat the test 3 times, or as many as the patient is comfortable with.
7) Click on the large red stop button to end the program.

109
Recording
1) You should keep notes as the test is conducted to record any observations.
2) After the test is complete, record this info in the patient’s .xls file.
a) Open the patient’s .txt file, and copy the data into the .xls file, as shown in Figure 52 and Figure
53.
Figure 52: Force (left column) and Position (right column) data from AmP-MeD test. First two rows are from program initiation. 3rd and 4th row are from the "practice test". Rows 5-10 are test data, alternating between
threshold and tolerance measurements.
Figure 53: Data copied into Patient's Excel File
Threshold
Force (kg) Position (mm)

110
Wagner Device Testing Procedure
1) Turn on the Wagner device, and scroll through the “peak” button until you reach the option where
maximum force remains displayed on the screen.
2) Ensure that the units are in kgf (kilogram-force)
3) Have the patient rest his/her leg on a chair or platform so that it is relaxed and horizontal.
4) Notify the patient that you will first measure threshold, record the data, and then measure tolerance
in the same location.
5) Select a test location on the tibialis anterior lateral to the tibial ridge.
6) Apply steady, slow pressure until the patient notifies you that he/she has reached his/her threshold.
7) Record this data in the patient’s excel file.
8) Zero the recorded max force on the Wagner device, and measure tolerance in the same location.
9) Repeat steps 5-8 on a new location for 3 trials (or as many as the patient is comfortable with).
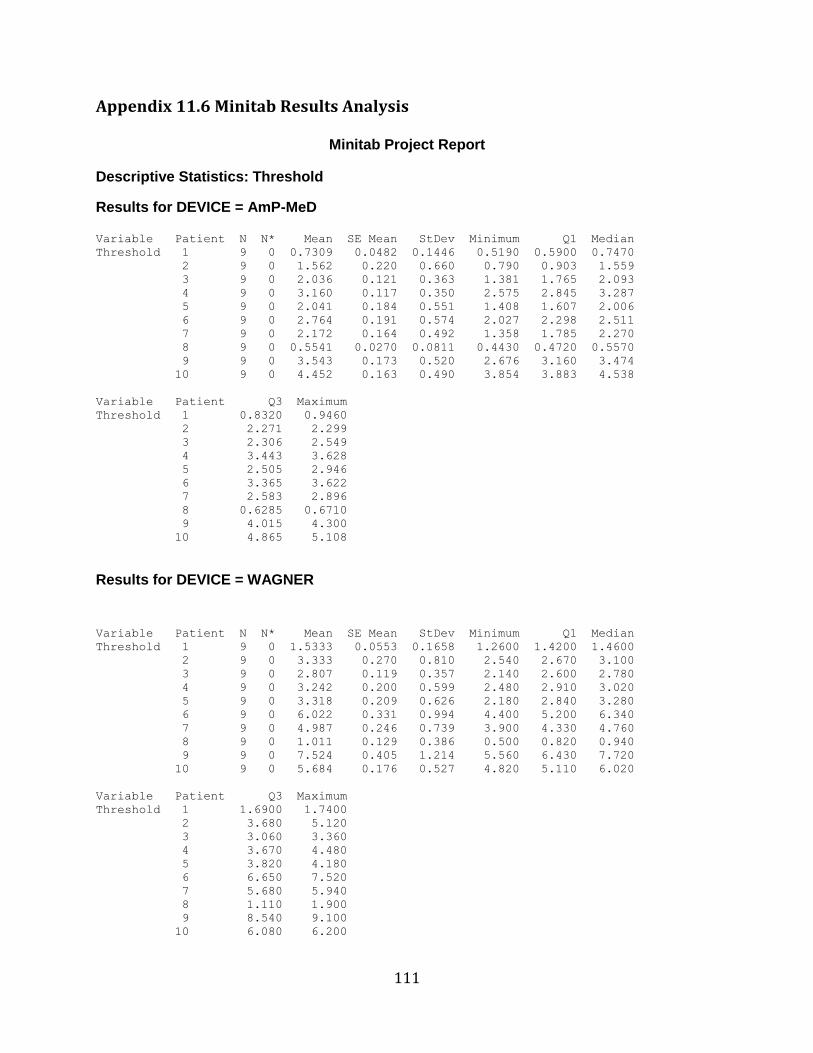
111
Appendix 11.6 Minitab Results Analysis
Minitab Project Report
Descriptive Statistics: Threshold
Results for DEVICE = AmP-MeD Variable Patient N N* Mean SE Mean StDev Minimum Q1 Median
Threshold 1 9 0 0.7309 0.0482 0.1446 0.5190 0.5900 0.7470
2 9 0 1.562 0.220 0.660 0.790 0.903 1.559
3 9 0 2.036 0.121 0.363 1.381 1.765 2.093
4 9 0 3.160 0.117 0.350 2.575 2.845 3.287
5 9 0 2.041 0.184 0.551 1.408 1.607 2.006
6 9 0 2.764 0.191 0.574 2.027 2.298 2.511
7 9 0 2.172 0.164 0.492 1.358 1.785 2.270
8 9 0 0.5541 0.0270 0.0811 0.4430 0.4720 0.5570
9 9 0 3.543 0.173 0.520 2.676 3.160 3.474
10 9 0 4.452 0.163 0.490 3.854 3.883 4.538
Variable Patient Q3 Maximum
Threshold 1 0.8320 0.9460
2 2.271 2.299
3 2.306 2.549
4 3.443 3.628
5 2.505 2.946
6 3.365 3.622
7 2.583 2.896
8 0.6285 0.6710
9 4.015 4.300
10 4.865 5.108
Results for DEVICE = WAGNER
Variable Patient N N* Mean SE Mean StDev Minimum Q1 Median
Threshold 1 9 0 1.5333 0.0553 0.1658 1.2600 1.4200 1.4600
2 9 0 3.333 0.270 0.810 2.540 2.670 3.100
3 9 0 2.807 0.119 0.357 2.140 2.600 2.780
4 9 0 3.242 0.200 0.599 2.480 2.910 3.020
5 9 0 3.318 0.209 0.626 2.180 2.840 3.280
6 9 0 6.022 0.331 0.994 4.400 5.200 6.340
7 9 0 4.987 0.246 0.739 3.900 4.330 4.760
8 9 0 1.011 0.129 0.386 0.500 0.820 0.940
9 9 0 7.524 0.405 1.214 5.560 6.430 7.720
10 9 0 5.684 0.176 0.527 4.820 5.110 6.020
Variable Patient Q3 Maximum
Threshold 1 1.6900 1.7400
2 3.680 5.120
3 3.060 3.360
4 3.670 4.480
5 3.820 4.180
6 6.650 7.520
7 5.680 5.940
8 1.110 1.900
9 8.540 9.100
10 6.080 6.200

112
Test and CI for Two Variances: Threshold vs DEVICE Method
Null hypothesis Sigma(AmP-MeD) / Sigma(WAGNER) = 1
Alternative hypothesis Sigma(AmP-MeD) / Sigma(WAGNER) not = 1
Significance level Alpha = 0.05
Statistics
DEVICE N StDev Variance
AmP-MeD 90 1.240 1.538
WAGNER 90 2.077 4.314
Ratio of standard deviations = 0.597
Ratio of variances = 0.357
95% Confidence Intervals
CI for
Distribution CI for StDev Variance
of Data Ratio Ratio
Normal (0.484, 0.736) (0.235, 0.542)
Continuous (0.483, 0.736) (0.233, 0.542)
Tests
Test
Method DF1 DF2 Statistic P-Value
F Test (normal) 89 89 0.36 0.000
Levene's Test (any continuous) 1 178 21.20 0.000
One-way ANOVA: Threshold versus DEVICE
Source DF SS MS F P
DEVICE 1 121.72 121.72 41.60 0.000
Error 178 520.85 2.93
Total 179 642.57
S = 1.711 R-Sq = 18.94% R-Sq(adj) = 18.49%
Individual 95% CIs For Mean Based on
Pooled StDev
Level N Mean StDev --------+---------+---------+---------+-
AmP-MeD 90 2.302 1.240 (-----*-----)
WAGNER 90 3.946 2.077 (-----*-----)
--------+---------+---------+---------+-
2.40 3.00 3.60 4.20
Pooled StDev = 1.711
Grouping Information Using Tukey Method
DEVICE N Mean Grouping
WAGNER 90 3.946 A
AmP-MeD 90 2.302 B
Means that do not share a letter are significantly different.

113
Tukey 95% Simultaneous Confidence Intervals
All Pairwise Comparisons among Levels of DEVICE
Individual confidence level = 95.00%
DEVICE = AmP-MeD subtracted from:
DEVICE Lower Center Upper -------+---------+---------+---------+--
WAGNER 1.141 1.645 2.148 (------*-------)
-------+---------+---------+---------+--
0.00 0.70 1.40 2.10


![Design Verification of Complex Microprocessors - KAISTics.kaist.ac.kr/intjpapers/Design Verification of Complex... · The hardware emulationr2], formal verification[l] ... suggest](https://static.fdocuments.us/doc/165x107/5b244c6a7f8b9a317d8b4604/design-verification-of-complex-microprocessors-verification-of-complex.jpg)