Design Description Documenthajim.rochester.edu/.../solar-finalddd_teamsolar.pdfSolar Team Design...
27
Solar Team Design Description Document UNIVERSITY OF ROCHESTER Design Description Document Light Weight/Low Cost/High Powered Solar Concentrator Bryan Maas, Michael Dupuis, Daniel Morgen, Wanyue Song, Sean Reid Customer: Wayne H. Knox Optical Engineers: Michael Dupuis, Bryan Maas, Daniel Morgen, Wanyue Song Mechanical Advisor: Sean Reid Document Number: 00002 Revision Level: F Date: 04/25/2016 This is a computer generated document and the electronic master is the official revision. This paper copy is authenticated for the following purpose only: Authentication Block Project Overview: This optics senior design team is tasked with exceeding the performance of Professor Knox’s design by increasing the total concentrated power and efficiency of a solar concentrator. Page 1 00002 | Rev F
Transcript of Design Description Documenthajim.rochester.edu/.../solar-finalddd_teamsolar.pdfSolar Team Design...

Solar Team Design Description Document
UNIVERSITY OF ROCHESTER
Design Description Document Light Weight/Low Cost/High Powered Solar
Concentrator
Bryan Maas, Michael Dupuis, Daniel Morgen, Wanyue Song, Sean Reid
Customer: Wayne H. Knox Optical Engineers: Michael Dupuis, Bryan Maas, Daniel Morgen, Wanyue Song Mechanical Advisor: Sean Reid
Document Number: 00002
Revision Level: F
Date: 04/25/2016
This is a computer generated document and the electronic master is the official revision. This paper copy is authenticated for the following purpose only:
Authentication Block
Project Overview:
This optics senior design team is tasked with exceeding the performance of Professor Knox’s design by increasing the total concentrated power and efficiency of a solar concentrator.
Page 1 00002 | Rev F
Wayne H Knox
Sticky Note
To the SOLAR TEAM: (from customer, professor and advisor) but NOT competitor at all !! a very excellent job team ! i certainly had not appreciated the importance of the edge uniformity, although some interesting hints appeared at various times in the project a. my very first mirror used an actual bass drum with a very smooth edge, so did not suffer from this presumably - but i though it was not scalable b. a MechE senior design team tried this once using a series of clips to attach the membrane edges - but got a very terrible result - when tension was applied they had straight line striations covering 2/3 of the aperture = disaster ! but your team really nailed this down hard and the results are very impressive ; i also feel that you got right to the shape issue as well - and the results make a lot of sense now it is a scary thought that i guess we could make an 8 foot diameter one with that cnc router ! the membrane would have to have a seam down the middle - but not compromising optical quality too badly considering the massive power that would be collected by that monster your careful measurements of the shape using the red laser were just what we needed to get to the bottom of this ! your customer is very happy with your report and results SO THEREFORE your grade for this final DDD is 97 with some included comments

Solar Team Design Description Document
Table of Contents
Background
Problem Statement
Requirements
Specifications
Optical Design Analysis
Mechanical Frame Concepts
Concept Selection Matrix
Cost Analysis
Frame CAD for Fabrication
Product Requirement Document
System Flowchart
Appendix A: Optical System Design
Appendix B: Finite Element Modeling
Appendix C: Test Plan / Validation
Page 2 00002 | Rev F

Solar Team Design Description Document
Revision History Rev Description Date Authorization
A Creation of the DDD 01/31/2016 MLD
B Revision of the DDD, for presentation 02/03/2016 MLD
C Revision after presentation.
02/15/2016 MLD
D Revision for Midterm.
02/26/2016 MLD
E Revisions for Final DDD. 04/20/2016 MLD
F Revisions for final submission 04/25/2016 MLD
Page 3 00002 | Rev F

Solar Team Design Description Document
Background Professor Wayne Knox, our customer, built a solar concentrator in his garage using plywood, reflective Mylar, tape, and a vacuum cleaner. This concave mirror is able to burn lumber, cook burgers, and scorch asphalt in a matter of seconds. The optical engineering senior design team this year is tasked with pushing Knox’s design to the next level, increasing the total concentrated power and efficiency. The mechanical engineering senior design this year is tasked to design the system that will allow for increasing the total concentrated power and efficiency.
Figure 1: On left, Wayne Knox (our customer and competitor) takes a picture of his solar concentrator before a vacuum is applied. On right, the concentrator is able to ignite a block of wood.
Problem Statement The goal of this project is to design a solar concentrator that has the capability of being scaled by the manufacturer and shipped to remote locations or developing countries. The design has to be optimized in weight, size, and optical power efficiency.
Product Requirement Document See Final Solar PRD
Page 4 00002 | Rev F

Solar Team Design Description Document
System Flowchart
Figure 2: The approach used in designing, building, testing and revising our project prototypes.
Requirements
Number Description
1 More efficient at collecting sunlight than Knox’s prototype.
2 Must be lighter than Knox’s prototype.
3 Before creating the vacuum the membrane should be flat, uniform, and not under tension.
4 Before creating the vacuum, the membrane should be over an open circular area to create the ideal reflective surface shape.
5 The vacuum method must be used to create a pressure differential that will create the curved reflective Mylar surface. This vacuum method may be a passive vacuum.
6 Must be shippable in a cardboard box.
7 The reflective Mylar must be replaceable.
Table 1: Design requirements ranked in rough order of importance.
Page 5 00002 | Rev F

Solar Team Design Description Document
Specifications
Description Value Method of Evaluation
Diameter of reflective membrane.
4 [ft.] Measure with measuring tape.
Must weigh less than certain number.
15 [lbs.] Place on scale.
Manufacturing budget. 100 [USD] Evaluate the bill of materials.
Prototype budget. 500 [USD] Evaluate the bill of materials.
Total power output needs to exceed a certain value when testing.
Professor Knox’s Value
Focus light through 2 parallel plates. The front will contain a 2inch diameter hole that we will shine the light through. This plate will act as a barrier for stray light.
The next plate (aluminum) will be imaged with a thermal camera to determine power output.
Table 2: Required design parameters
Page 6 00002 | Rev F

Solar Team Design Description Document
Optical Design Analysis
Optical Efficiency Analysis
Through our analysis the membrane deforms into a shape that is nearly (3% RMS deviation) parabolic.
Optical inefficiencies are introduced by
1. Wrinkles about the edge which scatter light away from the focus.
2. Non uniform pretensioning, resulting in axial variations in curvature.
3. NearParabolic shape resulting from boundary conditions and load.
Figure 3 & 4: (Left) Knox’s concentrator has a ~1m maximum extent of light distribution, a sign of low efficiency. (Right) Ideal light distribution (~0.3m) from a nearparabolic concentrator, with spot size ~0.1m.
Figure 5 & 6: (Left) Careful measurements of Knox’s concentrator confirm that the shape is within 3% RMS of a parabola. (Right) Finite element models of the membrane are also verified by the measured shape.
Page 7 00002 | Rev F

Solar Team Design Description Document
Figure 7: Spot size analysis from LightTools onaxis raytrace of the measured membrane shape of Knox’s concentrator. The measured membrane does not include the extremely wrinkled edges, but as shown by the asymmetry of the spot, the membrane is aberrated onaxis which indicates it’s not perfectly parabolic. The size of this spot is 100mm by 60mm, which is similar in size to that of a paraboloid. This is further confirmation that the wrinkles over 7.3% of the aperture in Knox’s prototype are a cause of power loss.
Reflectance Analysis (Photon Budget)
Mylar reflectance analysis was conducted utilizing a red laser pointer and a power meter. % Reflectance
is a ratio between reflected optical power and incident optical power.
Exterior % Reflectance Interior % Reflectance
77.94 90.34
Table 3: Mylar reflectance on each side measured at 633 nm.
Solution to Knox Concentrator Optical Inefficiencies
A driving factor in this project is to maximize the optical efficiency from a solar concentrator. It is known
that the Knox concentrator is far from the ideal solar concentrator; however, it has been our job to
determine the root of this problem. Throughout this academic year our team has developed a
Page 8 00002 | Rev F

Solar Team Design Description Document
hypothesis that the optical inefficiencies of the Knox Concentrator is due to nonuniform boundary
conditions connecting the mylar membrane to the concentrator frame. The nonuniform boundary
condition creates “wrinkles” in the perimeter of the optical surface, which extremely reduce the optical
performance of the system.
We sought to prove this hypothesis by conducting surface profile measurements described in Appendix
C. This experiment calls for the translation of a laser pointer across the concentrator surface and the
reflected beam is marked on a whiteboard across from the concentrator. From these results we can
extrapolate sag data (thus describing the profile of our optical surface) and also conduct a primitive
experimental “raytrace.” If the membrane at a point is too aberrated, the reflected beam will wildly
deviate from its theoretical path, which can be seen as we mark our reflected beam on a white board.
When conducting these measurements on the Knox concentrator and the Senior Design concentrator,
the following was determined:
● The Knox concentrator was so aberrated that only 77% of the optical surface could be consistently traced
● The Senior Design concentrator was extremely close to the ideal, and 100% of the optical surface could be consistently traced
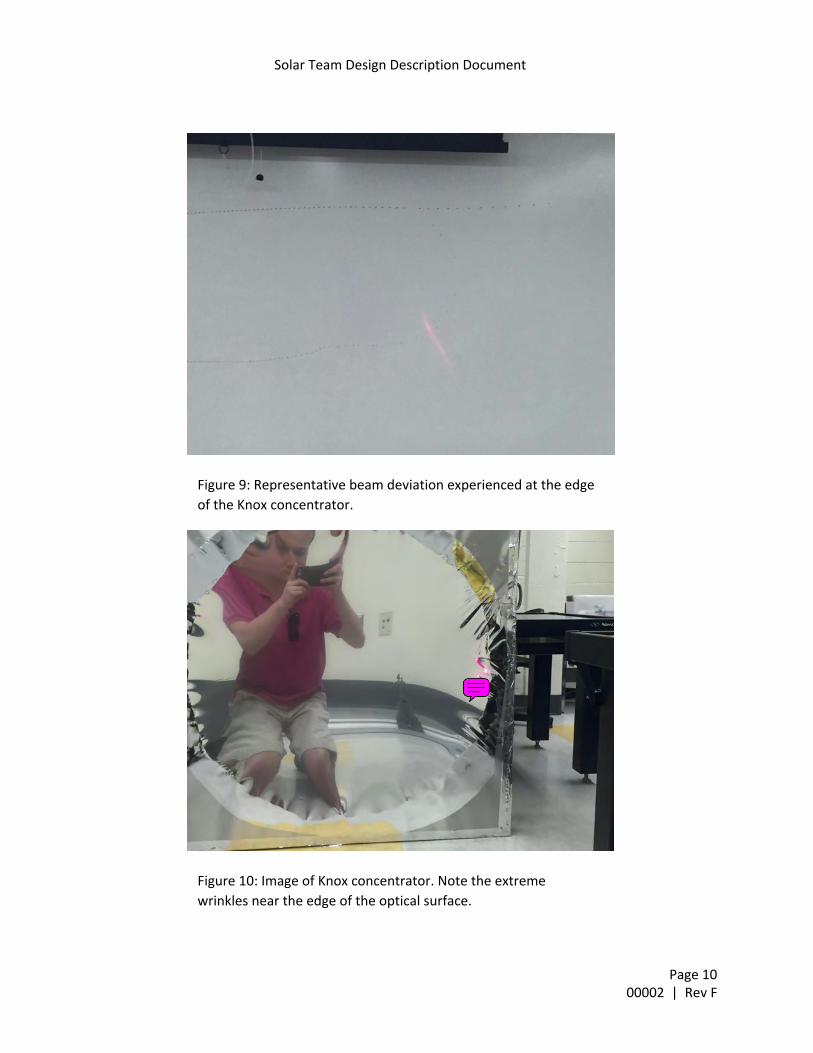
These results can be seen in the image below. The black dots represent Senior Design raytrace, while
the red dots represent the Knox raytrace. As can be seen below, the black dots from the Senior Design
concentrator are quite consistent across the entire optical surface, while the red dots from the Knox
concentrator are extremely inconsistent at the edges. Near the edge of the Knox concentrator, wrinkles
were extreme, causing such large beam deviation that measurements were impossible to record.
Figure 8: Black Dots: Senior Design concentrator raytrace, Red
Dots: Knox concentrator raytrace.
Page 9 00002 | Rev F
Solar Team Design Description Document
Figure 9: Representative beam deviation experienced at the edge
of the Knox concentrator.
Figure 10: Image of Knox concentrator. Note the extreme
wrinkles near the edge of the optical surface.
Page 10 00002 | Rev F
Wayne H Knox
Sticky Note
note that this image does not look like figure 1 left panel so i wonder if this edge effect is particularly exaggerated by the way this membrane was stretched and attached ?

Solar Team Design Description Document
Mechanical Frame Concepts
We chose to approach the frame design problem in many different ways. After generating several frame
ideas, the top three concepts were compared for optimality in a Pugh selection matrix, a method which
facilitates objective comparison.
Figure 11: On top left, design 1 is the original frame design created by Professor Wayne Knox. Design is a wooden box with an attachment that will create the vacuum. On top right, design 2 is a modular frame design, which can be assembled similar to Ikea furniture but the Mylar is permanently attached to the metal sheeting. The Spider frame mechanism allows for a strong frame support. Metal sheeting will be used for the actual frame. On bottom left, the Final Design is a lightweight design which tensions Mylar evenly. Design is similar to that of a drum head using clamps on the side to provide sealing. On bottom right, a mechanical sealing method for maintaining a vacuum. Rubber tubing will be attached to the lock ring and frame.
Page 11 00002 | Rev F

Solar Team Design Description Document
Concept Selection Matrix
Criteria Description “Will the design…”
Weight Obtain the minimum weight necessary based on material selection?
Cost Obtain the minimum manufacturing/prototype cost based on material selection?
Sealing Method Have a method of making an airtight seal for the vacuum? A passive vacuum is possible but an airtight seal is ideal.
Ease of Assembly Does the prototype take a short time to build, and are we capable of making it with the resources we have?
Efficiency Create the optimum total concentrated power, reducing imperfections that may reduce the power output?
Table 4: Pugh selection matrix criteria.
Design Weight Cost Sealing Method Ease of Assembly Efficiency Total
1 0 1 1 1 0 3
2 0 0 0 1 0 1
3 1 1 1 0 1 4
Table 5: Pugh selection matrix results.
From an analysis of the Pugh matrix with certain criteria selection the best design would be design 3 as shown in Figure 10, bottom left.
Page 12 00002 | Rev F

Solar Team Design Description Document
The Final Frame Design
The frame design used in the final prototype was the ‘Drumstyle’ design shown above with a fewminor
adaptations. Unforeseen complications arose when using the rubber tubing on both the top ring and
the main base. Due to the nature and shape of the tubing, when the sealing pressure was applied, the
rubber would misalign and cause large creases to form in the mylar. To prevent this problem, the top
ring was flipped, leaving the flat side to create the necessary seal against one ring of rubber tubing.
Figure 12: The frame was machined using a 10ft X 10ft CNC router (right) located on the first floor of
Rettner Hall. The wood chosen for the frame is a highquality Russian Birch Plywood because of its
strength and density, giving the vacuum minimal leakage when applied to the concentrator while also
maintaining great stability.
Currently, our frame consists of the circular base, a top ring to lock the mylar in place, rubber tubing to
create and even seal around the mylar, and eight Cclamps arranged to evenly distribute tension around
the perimeter of the concentrator.
Frame CAD for Fabrication
The selected frame design could be manufactured in the following ways:
1. Cut the entire frame as a single piece on a large CNC router
2. Cut segments of frame on a small CNC router
3. Cut the entire frame as a single piece using a handheld jigsaw
4. Cut the entire frame as a single piece using a handheld router
We have decided to manufacture our frame using method (1) because cutting the frame as a single
piece ensures that the boundary conditions are circularly symmetric.
Page 13 00002 | Rev F
Wayne H Knox
Sticky Note
great great cool can do 8' diameter too ! (in two pieces i guess) scary thought...

Solar Team Design Description Document
Figure 13: Bottom ring (47” OD, 44” ID, 2” depth) after manufacture
on large CNC router and assembly with wood glue. This ring is
comprised of two thinner rings, each of 1” depth. The rings are
made of highquality russian birch plywood.
Figure 14: Rubber gasket, embedded into the frame.
Page 14 00002 | Rev F

Solar Team Design Description Document
Figure 15: Adjustable pressure valve for controlling concentrator
focal length
Optical Testing Results
This section outlines results relating to optical performance for both Senior Design and Knox
concentrators. Relative power, maximum temperature, and spot size is analyzed. The results below
show definitively that the Senior Design concentrator outperforms the Knox concentrator.
Relative Power During testing described in Appendix D, both concentrators were imaged onto a metal plate 10 feet
away. A point and shoot temperature readout device was utilize to record temperature on the plate
over the span of one minute. Since temperature rate over time is proportional to optical power, the
slope of this data will yield relative power. The metal plate radiates as a blackbody, and at some point in
time the rate of energy lost to blackbody radiation equals the rate of energy absorbed from the solar
concentrator. When plotting the temperature against time, this looks like the temperature flattens out
or plateaus. Therefore, when monitoring only the temperature of the plate, the power will be most
accurately calculated by fitting a trend line through the beginning of the data. In our analysis, the first
minute of recorded data was fit to obtain power values. Results are shown below:
Page 15 00002 | Rev F

Solar Team Design Description Document
Figure 16: Senior Design and Knox concentrator temperature (deg F) vs. time (s), which yields
a slope indicative of relative power.
● Knox’s concentrator: 0.86 degrees Fahrenheit per second ● Senior Design Team’s concentrator: 1.29 degrees Fahrenheit per second
Since the temperature rate with time is proportional to the optical power, it is concluded that the senior
design team’s concentrator yields a power that is 50% greater than Professor Knox’s concentrator.
Maximum recorded temperature
Another indicator of optical performance is maximum recorded temperature. The maximum
temperature recorded from the point and shoot device may not necessarily be the maximum
temperature of the entire plate. However, the thermal imaging camera captures the temperature of the
entire plate throughout testing. Thus, we can compare maximum temperature readouts for both Senior
Design and Knox concentrator.
The metal plate was recorded with a thermal camera during testing of Senior Design and Knox
concentrators.. The maximum temperature recorded for each was as follows:
Page 16 00002 | Rev F
Wayne H Knox
Sticky Note
i guess you are getting the average slope with this fit ; how big are the temperature error bars ? it really seems to be a large departure from simple linear growth ; perhaps due to air movement, temperature fluctuations etc. ?

Solar Team Design Description Document
Figure 17: Senior Design and Knox concentrator maximum temperature readings.
● Knox’s concentrator: 43 degrees Celsius, or 109 degrees Fahrenheit ● Senior Design Team’s concentrator: 229 degrees Celsius, or 444 degrees Fahrenheit
Spot Size
Another extremely important indicator of optical performance is spot size. Ideally, maximum
performance would be obtained when the spot size is as small as possible. The ideal shape is a small
circular spot. The Knox concentrator produces a spot that is extremely aberrated, while the Senior
Design concentrator produces a spot that is extremely compact and circular in nature. The focused
spots are shown below:
Figure 18: Left: Knox concentrator focused spot. Right: Senior Design concentrator focused spot. It can be noted that the Knox concentrator spot is extremely aberrated compared to the Senior Design concentrator spot.
Page 17 00002 | Rev F
Wayne H Knox
Sticky Note
nice !

Solar Team Design Description Document
Cost Analysis
Materials Quantity Part
Price
Unit Price
(Final Design)
Unit Price
(MassManufacturing
)
1”x48”x96” Apple Plywood Sheet 2 $160.00 $320.00 $90.00
Silicone || 10.1 oz. White
Window and Door Caulk
1 $5.92 $5.92 $5.92
Titebond || 16 oz. Premium
Wood Glue
1 $5.47 $5.47 $5.92
1/4" x 0.170" x 20' PVC Tubing 1 $3.25 $3.25 $0.48
1/8" x 4' x 8' Utility Panel 1 $9.96 $9.96 $4.98
2" x 54" x 25' roll Sunfilm Mylar
Film Roll
1 $22.70 $22.70 $4.54
4" Industrial CClamp 10 $3.99 $39.90 $0.00
1/420 Threaded 2' Rod 4 $1.47 $5.88 $5.88
1/8"x1.5"x96" Aluminum Flat Bar 1 $21.89 $21.89 $21.89
1/4 size, ZincPlated Hex Nut 16 (100 per
box)
$5.37/b
ox
$5.37 $0.86
HighTemperature Silicon Cord 50' $6.88/ft
.
$344.00 $86.00
TOTAL COST N/A N/A $784.34 $226.47
Table 6: Bill of materials for final design materials and manufacturing. Manufacturing costs are an estimated reduced price if the concentrators are produced in bulk each value is reduced by a factor of 5.
Page 18 00002 | Rev F

Solar Team Design Description Document
Weight Analysis
Both the Senior Design and Knox concentrators were weighed to evaluate system mass. The results
were as follows:
Senior Design Concentrator Weight (lbs.) Knox Concentrator Weight (lbs.)
34.4 43.0
Table 7: Design comparison table for weight.
From these results it is apparent that our design did not meet the intended 15 pound weight
specification. However, much of this weight comes from the use of industrial cclamps, which were last
minute additions to the design. Future iterations of this project could easily implement a less massive
solution by replacing the cclamps. In addition, it is important to note that the Senior Design
concentrator is 8.6 pounds lighter than the Knox concentrator.
Page 19 00002 | Rev F

Solar Team Design Description Document
Appendix A: Optical System Design
Overview:
We seek to create a series of optical models LightTools. The first will be of a mirror fit to the Hencky Curve, an equation that theoretically describes our in use membrane shape. The second will be an accurate representation of our final solar concentrator. The third will be an accurate representation of Wayne Knox’s solar concentrator. Radiometric analysis will be run on all models in order to compare models, establish theoretical thresholds, and estimate negative performance impacts.
Theoretical Membrane (Hencky Curve) Model:
We seek to model the theoretical shape of our mirror, which is neither spherical nor parabolic. The actual shape follows the Hencky Curve. The Hencky Curve is the shape that results from a uniform, circular boundary condition that is acted upon by a uniform pressure. We utilize an equation for sag (z) that approximates the Hencky Curve:
(u) (u .111u )z = D64F2
2 + 0 4
Where z is sag in mm, F is mirror focal length in mm, and u is axial displacement from the origin in mm. Using this equation, we first need to model the curve in MATLAB:
Next, we create a 3D mesh in MATLAB representing our Hencky Curve surface. From here, we can take the 3Dmesh data fromMATLAB and translate it into a freeform reflective surface in LightTools by manual transfer of the data points:
Page 20 00002 | Rev F

Solar Team Design Description Document
With the LightTools Hencky Curve Model, we can run radiometric analysis for our theoretical membrane shape. We will compare these results to both Wayne Knox’s and our own solar concentrators.
Actual Membrane Models:
Using data collection methods defined in the Test Plan section, we gather 3D mesh data that describes the shape of the membrane. From here we can manually enter this data into LightTools as a freeform reflective surface:
Page 21 00002 | Rev F

Solar Team Design Description Document
Fill Factor Loss:
We considered two possible methods for scaling the design:
Array of 19 1ft diameter mirrors aligned to common focus
o Smaller mirror apertures means smaller spherical aberration contribution
o Tipped mirrors introduces coma
o Loss from fill factor
Single 4ft diameter reflecting Mylar membrane, 10ft focal length
o More spherical aberration due to larger aperture
o Zero fill factor loss
These two methods were tested in Lighttools. The single mirror design outperforms the array design by an order of magnitude.
Page 22 00002 | Rev F

Solar Team Design Description Document
Appendix B: Finite Element Modeling
Summary of model:
Material: 0.006” thick Mylar membrane, material properties from matweb.com
Boundary conditions: Fixed translation on 4ft diameter rim
Load: Uniform pressure of 0.1psi normal to surface
Displacement output from model: FEA shape is within 1.5% of parabolic shape
Conclusions:
The nonparabolic shape of WHK prototype shape is not caused by load conditions modeled.
Nonuniformities are caused by:
o Nonuniform tensioning of membrane. Membrane must be evenly tensioned for circularly symmetric shape. Due to lack of control in tensioning process, different axes have different curvatures. This results in astigmatism which blurs the spot.
o Nonuniformities in boundary conditions. If the frame is not circular, the membrane under load will not be symmetric.
The frame design must mitigate the issues of nonuniform tension and boundary.
Page 23 00002 | Rev F

Solar Team Design Description Document
Appendix C: Surface Profile Test Plan / Validation
In order to validate the ideal FEA parabola to be within 1.5% of a perfect parabola, a testing method capable of 0.5mm resolution is required. We are investigating the implementation of a laser displacement measurement.
Surface Testing and Model Validation:
A HeNe laser pointer will be used to measure the displacement caused from a known position. A laser pointer is placed upon an optical rail and directed upon the concentrator. The spot is then marked upon the whiteboard and the laser pointer is then translated to a fixed increment away upon the rail. The spot is then marked and the process is repeated. After the entire concentrator is scanned (without any major blur in the spot present), the displacement from the “zeroth” spot is measured with a fixed ruler.
The purpose of this measurement is twofold:
To input surface profile into LightTools and validate spot shape against picture of WHK prototype spot shape
To compare measured surface profile against FEA surface profile for model validation
Page 24 00002 | Rev F

Solar Team Design Description Document
Illustrative Results:
The above graph shows the measured deflection of the laser spot, as the laser was translated across the optical rail. Due to the hand measurements taken and subsequent calculations, error bars are set at ± 0.5 mm.
The above picture illustrates the sag profile measurement conducted using the laser displacement test. It is notable that this curve is parabolic to within 3%. Deviations from the parabolic are large in the center, where the curve is flatter. It is also notable that we were unable to measure the extremes of the curve due to wrinkles on the membrane→ this profile represents 77% of the membrane.
Page 25 00002 | Rev F

Solar Team Design Description Document
Appendix D: Optical Performance Test Plan
In order to compare performance of the senior design teams product to that of professor Knox, a testing method was devised that yields data proportional to that of power. This testing method serves as a final validation that our product outperforms that of professor Knox.
Optical Test Setup:
The concentrator is angled to capture sunlight such that its imaging spot is located on the center of an elevated metal plate located 10 feet away from the base of the concentrator. Variable vacuum pressure is utilized to change concentrator focal length and make the image spot size of the concentrator as small as possible on the metal plate. A thermal imaging (FLIR) camera, positioned to capture the entire metal plate, is utilized to take thermal images of the metal plate over a duration of five minutes. Temperature is also recorded utilizing a pointandshoot temperature readout device. This test is conducted for both senior design and Knox products.
Page 26 00002 | Rev F

Solar Team Design Description Document
Left: Image of test setup being assembled. Right: close up of spot being focused onto The concentrator
is positioned 10 feet away from a metal test plate. Vacuum will be applied to the concentrator to focus
sunlight onto the metal plate. Thermal images will be recorded with both a point and shoot
temperature readout device (pictured on the left and right) and an IR thermal camera (pictured on the
right). Note that in the final setup, the metal plate with a hole was removed as it was too difficult to
focus the beam through the hole.
Page 27 00002 | Rev F