Design Considerations for Increasing VDI Performance and ... · Setting Realistic Virtual Desktop...
21
White Paper Design Considerations for Increasing VDI Performance and Scalability with Cisco Unified Computing System White Paper April 2013 © 2013 Cisco and/or its affiliates. All rights reserved. This document is Cisco Public Information. Page 1 of 21
Transcript of Design Considerations for Increasing VDI Performance and ... · Setting Realistic Virtual Desktop...

White Paper
Design Considerations for Increasing VDI Performance and
Scalability with Cisco Unified Computing System
White Paper
April 2013
© 2013 Cisco and/or its affiliates. All rights reserved. This document is Cisco Public Information. Page 1 of 21

© 2013 Cisco and/or its affiliates. All rights reserved. This document is Cisco Public Information. Page 2 of 21
Contents
What You Will Learn ................................................................................................................................................ 3
Background.............................................................................................................................................................. 3
Test Objectives ........................................................................................................................................................ 3
Test Platform............................................................................................................................................................ 4
Physical Environment ............................................................................................................................................. 4
The Login VSI Testing Tool .................................................................................................................................... 5
Cores vs. Clock Speed and the Impact on Virtual Desktop Density ................................................................... 6
Effect of Individual Core Speed (Burst) on Virtual Desktop Scalability.............................................................. 8
Setting Realistic Virtual Desktop Limits for Cisco UCS B200 M3 Servers Using Intel Xeon E5-2643 and E5-2665 Processors ...................................................................................................................................................... 9
SPEC CPU2006 CINT2006 Rate Required for Virtual Desktop Operations....................................................... 10
Scalability of One- and Two-vCPU Virtual Desktop Deployments..................................................................... 11
Weighing the Merits of Two-vCPU Virtual Desktops .......................................................................................... 12
Effect of Memory Speed on VDI Scalability ......................................................................................................... 13
Effect of Memory Density on VDI Scalability ....................................................................................................... 15
Effect of Storage IOPS on Virtual Desktop Operations...................................................................................... 16
Your Results May Differ ........................................................................................................................................ 18
Conclusion ............................................................................................................................................................. 19
For More Information............................................................................................................................................. 19
Appendix: Server and Storage Configuration Information ................................................................................ 19
© 2013 Cisco and/or its affiliates. All rights reserved. This document is Cisco Public Information. Page 3 of 21
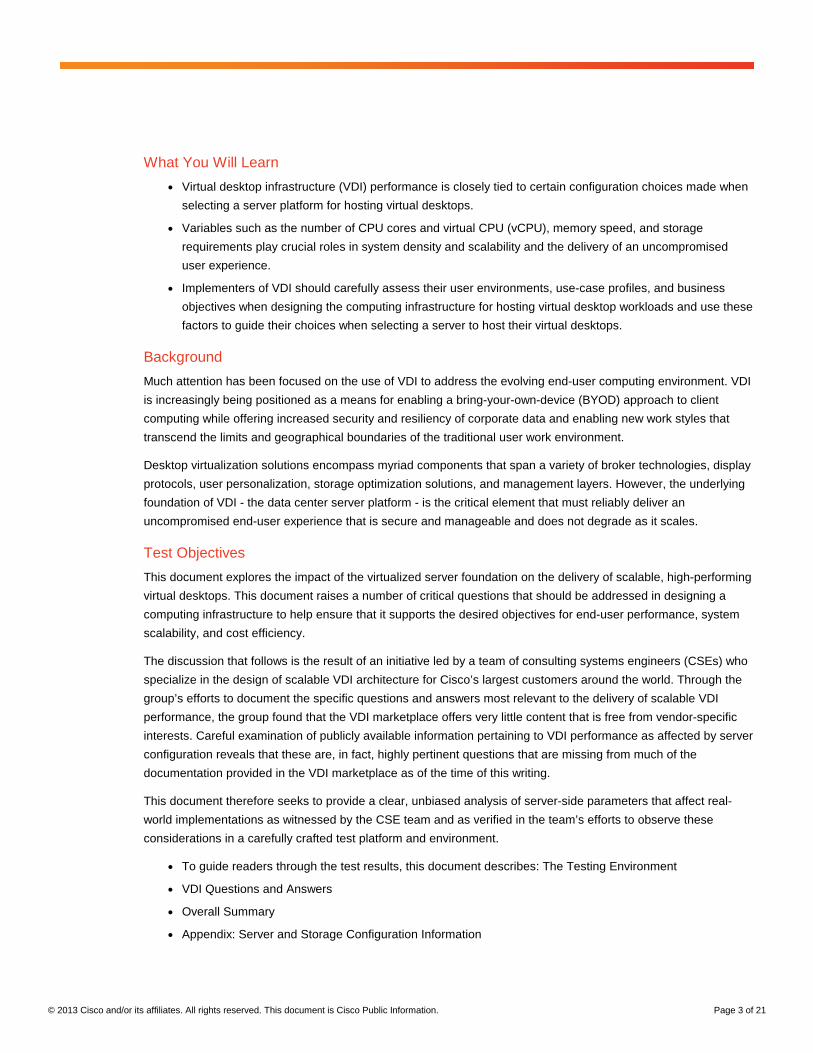
What You Will Learn
● Virtual desktop infrastructure (VDI) performance is closely tied to certain configuration choices made when
selecting a server platform for hosting virtual desktops.
● Variables such as the number of CPU cores and virtual CPU (vCPU), memory speed, and storage
requirements play crucial roles in system density and scalability and the delivery of an uncompromised
user experience.
● Implementers of VDI should carefully assess their user environments, use-case profiles, and business
objectives when designing the computing infrastructure for hosting virtual desktop workloads and use these
factors to guide their choices when selecting a server to host their virtual desktops.
Background
Much attention has been focused on the use of VDI to address the evolving end-user computing environment. VDI
is increasingly being positioned as a means for enabling a bring-your-own-device (BYOD) approach to client
computing while offering increased security and resiliency of corporate data and enabling new work styles that
transcend the limits and geographical boundaries of the traditional user work environment.
Desktop virtualization solutions encompass myriad components that span a variety of broker technologies, display
protocols, user personalization, storage optimization solutions, and management layers. However, the underlying
foundation of VDI - the data center server platform - is the critical element that must reliably deliver an
uncompromised end-user experience that is secure and manageable and does not degrade as it scales.
Test Objectives
This document explores the impact of the virtualized server foundation on the delivery of scalable, high-performing
virtual desktops. This document raises a number of critical questions that should be addressed in designing a
computing infrastructure to help ensure that it supports the desired objectives for end-user performance, system
scalability, and cost efficiency.
The discussion that follows is the result of an initiative led by a team of consulting systems engineers (CSEs) who
specialize in the design of scalable VDI architecture for Cisco’s largest customers around the world. Through the
group’s efforts to document the specific questions and answers most relevant to the delivery of scalable VDI
performance, the group found that the VDI marketplace offers very little content that is free from vendor-specific
interests. Careful examination of publicly available information pertaining to VDI performance as affected by server
configuration reveals that these are, in fact, highly pertinent questions that are missing from much of the
documentation provided in the VDI marketplace as of the time of this writing.
This document therefore seeks to provide a clear, unbiased analysis of server-side parameters that affect real-
world implementations as witnessed by the CSE team and as verified in the team’s efforts to observe these
considerations in a carefully crafted test platform and environment.
● To guide readers through the test results, this document describes: The Testing Environment
● VDI Questions and Answers
● Overall Summary
● Appendix: Server and Storage Configuration Information
© 2013 Cisco and/or its affiliates. All rights reserved. This document is Cisco Public Information. Page 4 of 21
Test Platform
The test platform used in this study included the following main components:
● Various configurations of the Cisco UCS B200 M3 Blade Server
● VMware Horizon View 5.1.1
● Login Virtual Session Indexer (Login VSI) 3.6.1 benchmark
● Login VSI Medium with Flash workload (click here for details)
● Microsoft Windows 7 SP1 32-bit virtual desktops
● Pure Storage FlashArray with Purity Version 2.0.2.
These test results are not a Cisco Validated Design or reference architecture. This document is not intended to
demonstrate maximum scalability, but instead to show scalability differences achieved under different operating
conditions. The goal of the tests was simply to show the many choices that affect scalability, including:
● Deployment using one vCPU or two vCPUs
● Use of 1600-MHz or 1066-MHz Intel platform
● Balance of CPU to memory capacity
Physical Environment
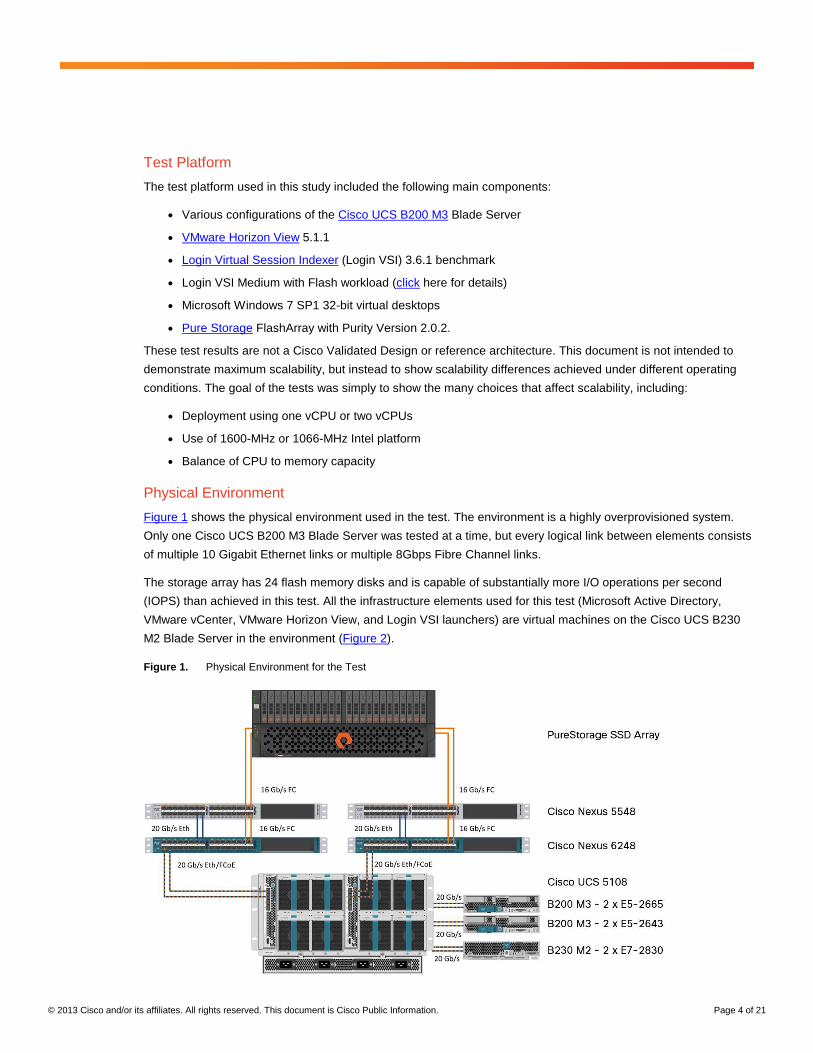
Figure 1 shows the physical environment used in the test. The environment is a highly overprovisioned system.
Only one Cisco UCS B200 M3 Blade Server was tested at a time, but every logical link between elements consists
of multiple 10 Gigabit Ethernet links or multiple 8Gbps Fibre Channel links.
The storage array has 24 flash memory disks and is capable of substantially more I/O operations per second
(IOPS) than achieved in this test. All the infrastructure elements used for this test (Microsoft Active Directory,
VMware vCenter, VMware Horizon View, and Login VSI launchers) are virtual machines on the Cisco UCS B230
M2 Blade Server in the environment (Figure 2).
Figure 1. Physical Environment for the Test
© 2013 Cisco and/or its affiliates. All rights reserved. This document is Cisco Public Information. Page 5 of 21
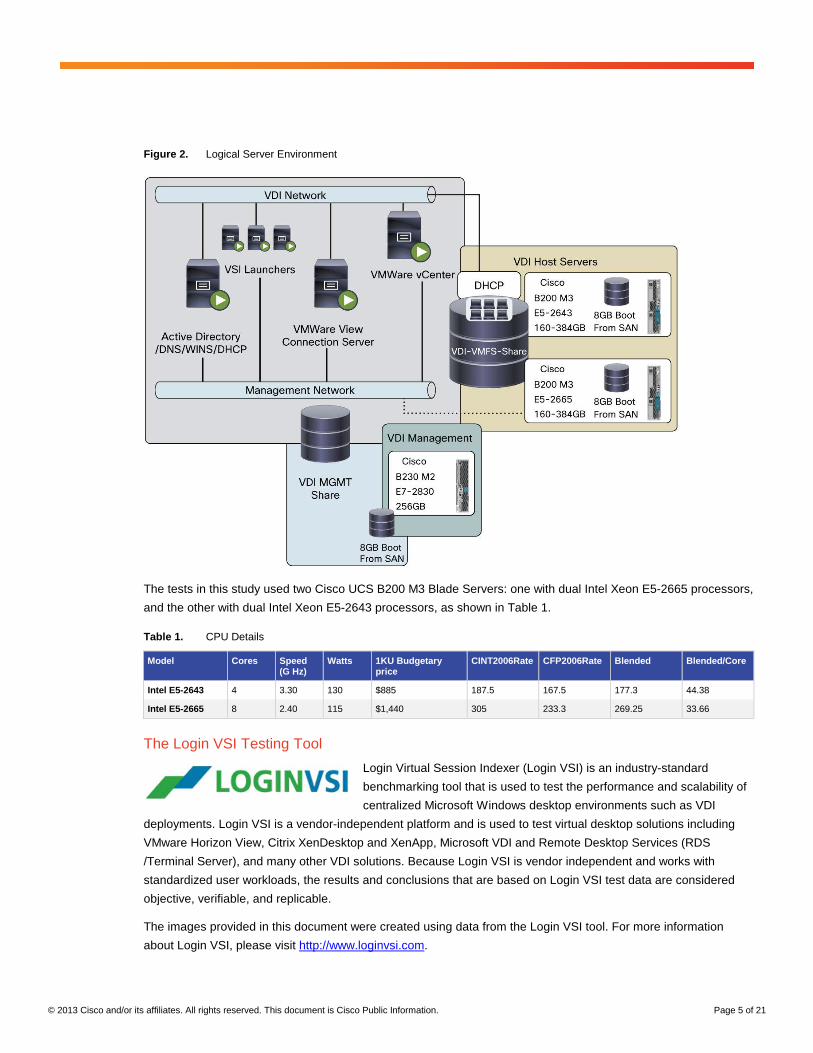
Figure 2. Logical Server Environment
The tests in this study used two Cisco UCS B200 M3 Blade Servers: one with dual Intel Xeon E5-2665 processors,
and the other with dual Intel Xeon E5-2643 processors, as shown in Table 1.
Table 1. CPU Details
Model Cores Speed (G Hz)
Watts 1KU Budgetary price
CINT2006Rate CFP2006Rate Blended Blended/Core
Intel E5-2643 4 3.30 130 $885 187.5 167.5 177.3 44.38
Intel E5-2665 8 2.40 115 $1,440 305 233.3 269.25 33.66
The Login VSI Testing Tool
Login Virtual Session Indexer (Login VSI) is an industry-standard
benchmarking tool that is used to test the performance and scalability of
centralized Microsoft Windows desktop environments such as VDI
deployments. Login VSI is a vendor-independent platform and is used to test virtual desktop solutions including
VMware Horizon View, Citrix XenDesktop and XenApp, Microsoft VDI and Remote Desktop Services (RDS
/Terminal Server), and many other VDI solutions. Because Login VSI is vendor independent and works with
standardized user workloads, the results and conclusions that are based on Login VSI test data are considered
objective, verifiable, and replicable.
The images provided in this document were created using data from the Login VSI tool. For more information
about Login VSI, please visit http://www.loginvsi.com.

© 2013 Cisco and/or its affiliates. All rights reserved. This document is Cisco Public Information. Page 6 of 21
As mentioned, tests were conducted using the Login VSI Medium with Flash workload.
The VSImax value was defined as 4000 ms and is illustrated by a shaded orange line on
each graph. A system reaches a level of unacceptable performance when the latency
exceeds the 4000-ms VSImax. Additional test configuration settings are detailed in Table 2.
Table 2. Configuration Settings for the Test
Configuration Setting(s)
Login VSI Configuration Settings ● Medium with Flash workload generator
● 4,000ms response cut off
Windows 7 Configuration ● 1.5GB memory for all tests
● 32-bit Windows 7 SP-I and Windows updates through September 1, 2012
ESX Host Configuration ● Power management set to High Performance in vSphere
● BIOS settings have C1E disabled in UCSM policy
● ESXi-5.0.0-623860-custom (Cisco specific build of ESXi with drivers)
VM Configuration ● 1vCPU and 2vCPU configurations
View Configuration ● Linked clones
● View Optimization registry changes on all Virtual desktops
● Did not use profile management
● Did not use host Cache for View
Cores vs. Clock Speed and the Impact on Virtual Desktop Density
A virtual desktop can only run as fast as the core on which it is running. This implies that the Intel Xeon E5-2643
processor has an advantage with a clock speed that is roughly 37 percent greater than that of the Intel Xeon E5-
2665. Although this may be the case in a nonoversubscribed system, the business and financial requirements of
VDI dictate that the cores be oversubscribed.
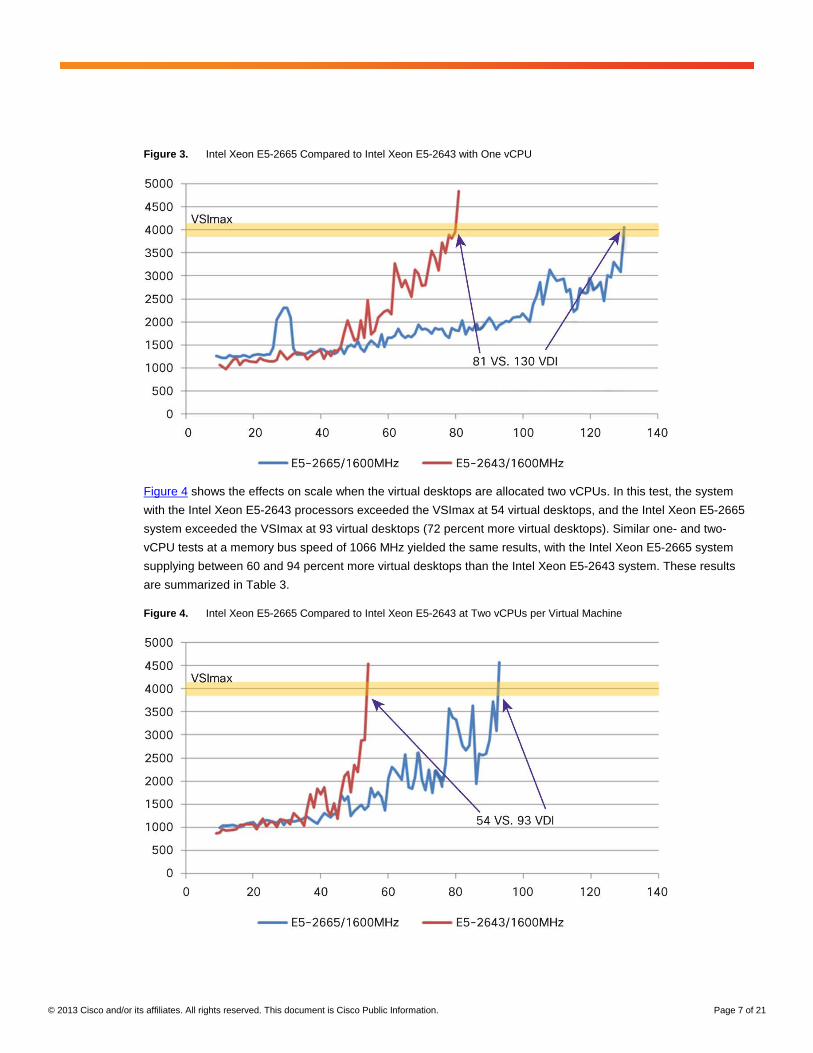
Figure 3 compares the VDI scalability of one-vCPU virtual machines using eight-core 2.4-GHz Intel Xeon E5-2665
processors to those using four-core 3.3-GHz Intel Xeon E5-2643 processors. The system with the Intel Xeon E5-
2643 processors supported 81 virtual desktops before exceeding the VSImax threshold while the system with the
Intel Xeon E5-2665 processors supported 130 virtual desktops. The result is a 60 percent improvement, implying
that the number of cores matters more than the core speed as virtual-to-physical CPU overcommit increases. Note
that at lower virtual machine (VM) counts (below 30 virtual desktops), the latency was slightly better on the higher-
speed Intel Xeon E5-2643 CPU.
© 2013 Cisco and/or its affiliates. All rights reserved. This document is Cisco Public Information. Page 7 of 21
Figure 3. Intel Xeon E5-2665 Compared to Intel Xeon E5-2643 with One vCPU
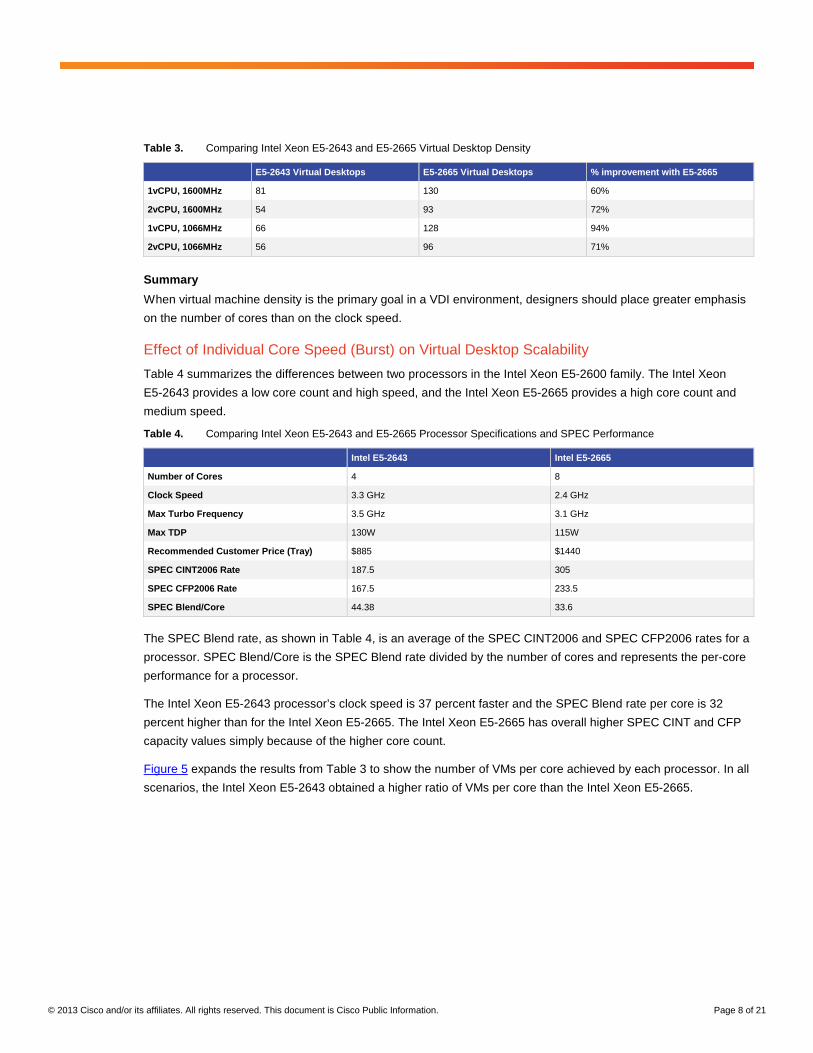
Figure 4 shows the effects on scale when the virtual desktops are allocated two vCPUs. In this test, the system
with the Intel Xeon E5-2643 processors exceeded the VSImax at 54 virtual desktops, and the Intel Xeon E5-2665
system exceeded the VSImax at 93 virtual desktops (72 percent more virtual desktops). Similar one- and two-
vCPU tests at a memory bus speed of 1066 MHz yielded the same results, with the Intel Xeon E5-2665 system
supplying between 60 and 94 percent more virtual desktops than the Intel Xeon E5-2643 system. These results
are summarized in Table 3.
Figure 4. Intel Xeon E5-2665 Compared to Intel Xeon E5-2643 at Two vCPUs per Virtual Machine
© 2013 Cisco and/or its affiliates. All rights reserved. This document is Cisco Public Information. Page 8 of 21
Table 3. Comparing Intel Xeon E5-2643 and E5-2665 Virtual Desktop Density
E5-2643 Virtual Desktops E5-2665 Virtual Desktops % improvement with E5-2665
1vCPU, 1600MHz 81 130 60%
2vCPU, 1600MHz 54 93 72%
1vCPU, 1066MHz 66 128 94%
2vCPU, 1066MHz 56 96 71%
Summary
When virtual machine density is the primary goal in a VDI environment, designers should place greater emphasis
on the number of cores than on the clock speed.
Effect of Individual Core Speed (Burst) on Virtual Desktop Scalability
Table 4 summarizes the differences between two processors in the Intel Xeon E5-2600 family. The Intel Xeon
E5-2643 provides a low core count and high speed, and the Intel Xeon E5-2665 provides a high core count and
medium speed.
Table 4. Comparing Intel Xeon E5-2643 and E5-2665 Processor Specifications and SPEC Performance
Intel E5-2643 Intel E5-2665
Number of Cores 4 8
Clock Speed 3.3 GHz 2.4 GHz
Max Turbo Frequency 3.5 GHz 3.1 GHz
Max TDP 130W 115W
Recommended Customer Price (Tray) $885 $1440
SPEC CINT2006 Rate 187.5 305
SPEC CFP2006 Rate 167.5 233.5
SPEC Blend/Core 44.38 33.6
The SPEC Blend rate, as shown in Table 4, is an average of the SPEC CINT2006 and SPEC CFP2006 rates for a
processor. SPEC Blend/Core is the SPEC Blend rate divided by the number of cores and represents the per-core
performance for a processor.
The Intel Xeon E5-2643 processor’s clock speed is 37 percent faster and the SPEC Blend rate per core is 32
percent higher than for the Intel Xeon E5-2665. The Intel Xeon E5-2665 has overall higher SPEC CINT and CFP
capacity values simply because of the higher core count.
Figure 5 expands the results from Table 3 to show the number of VMs per core achieved by each processor. In all
scenarios, the Intel Xeon E5-2643 obtained a higher ratio of VMs per core than the Intel Xeon E5-2665.

© 2013 Cisco and/or its affiliates. All rights reserved. This document is Cisco Public Information. Page 9 of 21
Figure 5. Comparing Intel Xeon E5-2643 and E5-2665 SPEC Blend/Core and Virtual Machines per Core Ratios
Table 5. Comparing Intel Xeon E5-2643 and E5-2665 Core Density
E5-2643 Virtual Desktops
E5-2643 VM/core E5-2665 Virtual Desktops
E5-2665 VM/core E5-2643 Core Density Advantage
1vCPU, 1600MHz 81 10 130 8.125 23%
2vCPU, 1600MHz 54 6.75 93 5.8125 16%
1vCPU, 1066MHz 66 8.25 128 8 3%
2vCPU, 1066MHz 56 7 96 6 17%
Summary
Although the increase is not linear, the data shows that the additional 32 percent performance of the higher-
bursting Intel Xeon E5-2643 can yield up to a 25 percent (two virtual machines per core) greater per-core virtual
machine density.
For more information about SPEC performance data, visit http://www.spec.org/.
Setting Realistic Virtual Desktop Limits for Cisco UCS B200 M3 Servers Using Intel Xeon E5-2643 and E5-2665 Processors
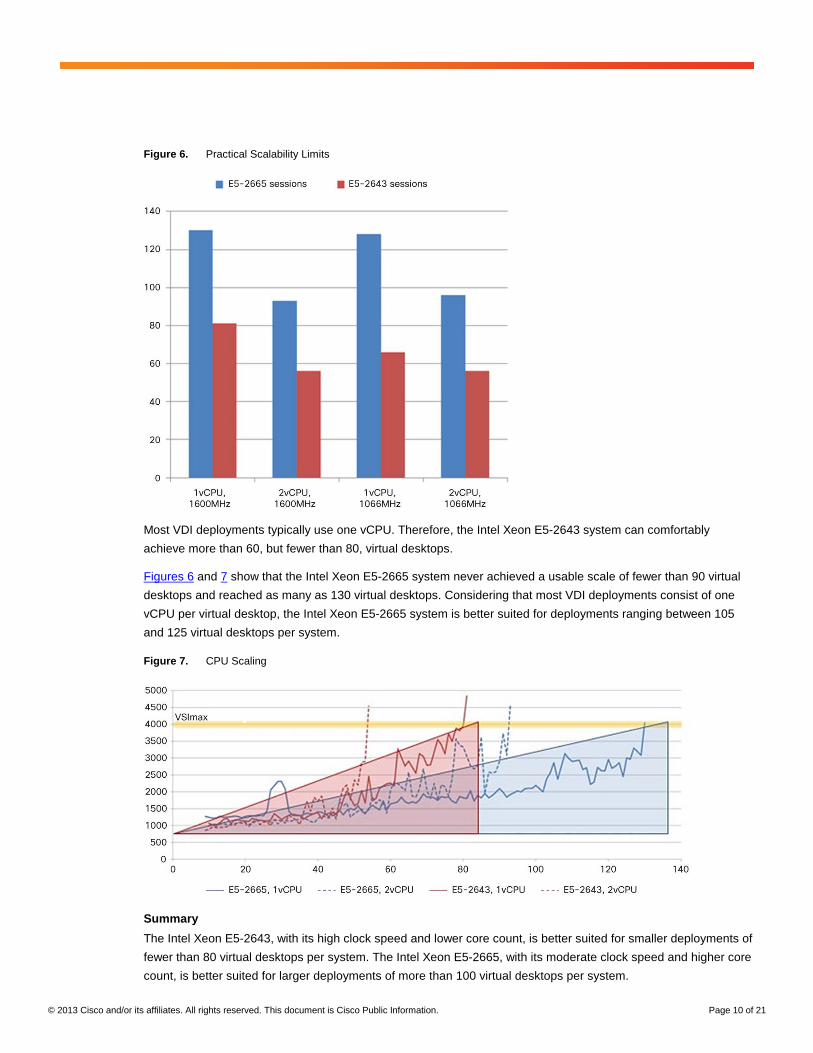
Data from previous tables in this document can be used to construct Figure 6, which shows that the system based
on the Intel Xeon E5-2643 never achieved more than 80 virtual desktops. The system achieved between 60 and
80 virtual desktops under one-vCPU loads, and fewer than 60 virtual desktops under two-vCPU loads.
© 2013 Cisco and/or its affiliates. All rights reserved. This document is Cisco Public Information. Page 10 of 21
Figure 6. Practical Scalability Limits
Most VDI deployments typically use one vCPU. Therefore, the Intel Xeon E5-2643 system can comfortably
achieve more than 60, but fewer than 80, virtual desktops.
Figures 6 and 7 show that the Intel Xeon E5-2665 system never achieved a usable scale of fewer than 90 virtual
desktops and reached as many as 130 virtual desktops. Considering that most VDI deployments consist of one
vCPU per virtual desktop, the Intel Xeon E5-2665 system is better suited for deployments ranging between 105
and 125 virtual desktops per system.
Figure 7. CPU Scaling
Summary
The Intel Xeon E5-2643, with its high clock speed and lower core count, is better suited for smaller deployments of
fewer than 80 virtual desktops per system. The Intel Xeon E5-2665, with its moderate clock speed and higher core
count, is better suited for larger deployments of more than 100 virtual desktops per system.
© 2013 Cisco and/or its affiliates. All rights reserved. This document is Cisco Public Information. Page 11 of 21
This assessment leaves two ranges that are not covered by either processor: between 80 and 100 virtual desktops
per system, and more than 120 virtual desktops per system. The Intel Xeon E5-2600 family includes many
processors that could be evaluated to cover these densities, but those processors are beyond the scope of the
testing discussed in this document.
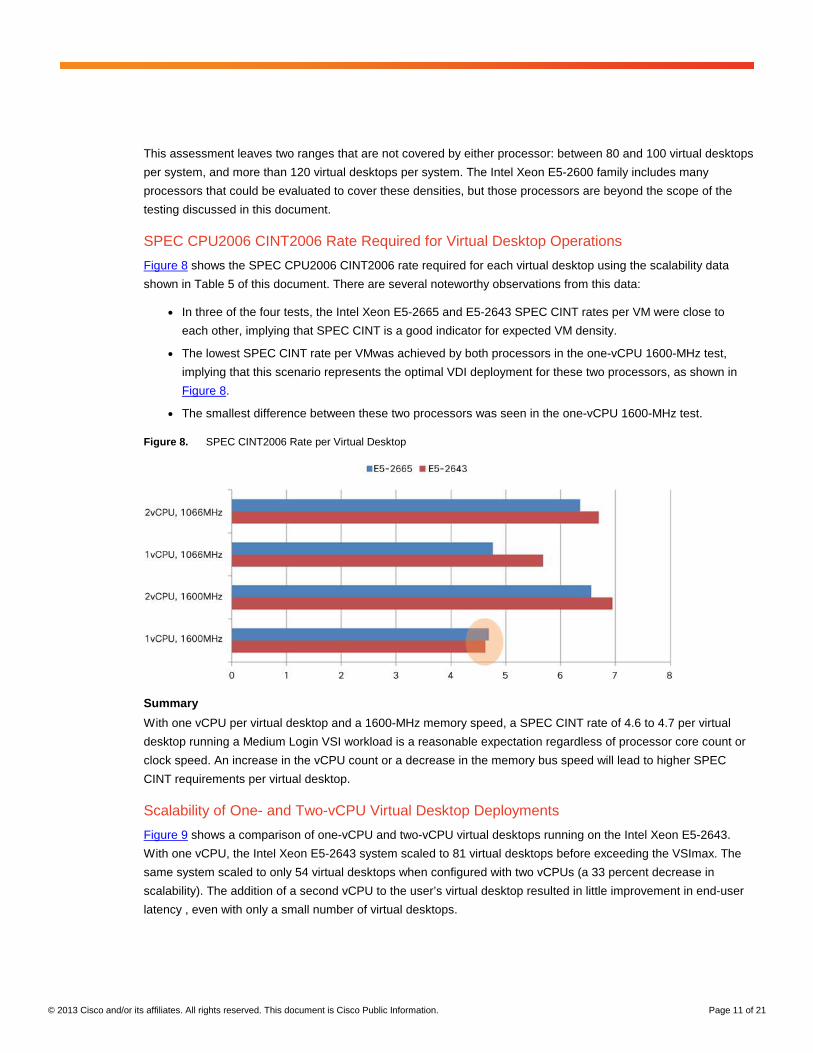
SPEC CPU2006 CINT2006 Rate Required for Virtual Desktop Operations
Figure 8 shows the SPEC CPU2006 CINT2006 rate required for each virtual desktop using the scalability data
shown in Table 5 of this document. There are several noteworthy observations from this data:
● In three of the four tests, the Intel Xeon E5-2665 and E5-2643 SPEC CINT rates per VM were close to
each other, implying that SPEC CINT is a good indicator for expected VM density.
● The lowest SPEC CINT rate per VMwas achieved by both processors in the one-vCPU 1600-MHz test,
implying that this scenario represents the optimal VDI deployment for these two processors, as shown in
Figure 8.
● The smallest difference between these two processors was seen in the one-vCPU 1600-MHz test.
Figure 8. SPEC CINT2006 Rate per Virtual Desktop
Summary
With one vCPU per virtual desktop and a 1600-MHz memory speed, a SPEC CINT rate of 4.6 to 4.7 per virtual
desktop running a Medium Login VSI workload is a reasonable expectation regardless of processor core count or
clock speed. An increase in the vCPU count or a decrease in the memory bus speed will lead to higher SPEC
CINT requirements per virtual desktop.
Scalability of One- and Two-vCPU Virtual Desktop Deployments
Figure 9 shows a comparison of one-vCPU and two-vCPU virtual desktops running on the Intel Xeon E5-2643.
With one vCPU, the Intel Xeon E5-2643 system scaled to 81 virtual desktops before exceeding the VSImax. The
same system scaled to only 54 virtual desktops when configured with two vCPUs (a 33 percent decrease in
scalability). The addition of a second vCPU to the user’s virtual desktop resulted in little improvement in end-user
latency , even with only a small number of virtual desktops.

© 2013 Cisco and/or its affiliates. All rights reserved. This document is Cisco Public Information. Page 12 of 21
Figure 9. Intel Xeon E5-2643 vCPU Scalability at 1600 MHz
Figure 10 shows the impact on the Intel Xeon E5-2665 system. With one vCPU, the Intel Xeon E5-2665 system
scaled to 130 virtual desktops before exceeding the VSImax. The same system scaled to only 93 virtual desktops
when configured with two vCPUs (a 40 percent decrease in scalability).
Figure 10. Intel Xeon E5-2665 vCPU Scalability at 1600 MHz
Unlike the Intel Xeon E5-2643 system, the Intel Xeon E5-2665 system showed a slight improvement in virtual
desktop latency with the use of two vCPUs. The slight improvement was achieved when fewer than 45 total virtual
desktops were deployed.
© 2013 Cisco and/or its affiliates. All rights reserved. This document is Cisco Public Information. Page 13 of 21
Figures 9 and 10 show systems performing at 1600-MHz memory bus speed. The same comparisons between
one- and two-vCPU deployments were performed at a memory bus speed of 1066 MHz. At the lower memory bus
speed, moving from one vCPU to two vCPUs resulted in a drop in VM density of between 12 and 20 percent, as
seen in Figures 12 and 13 later in this document.
Summary
Regardless of core count or processor speed, the number of vCPUs allocated to each virtual desktop has a
significant impact on scalability, even with the same workload.
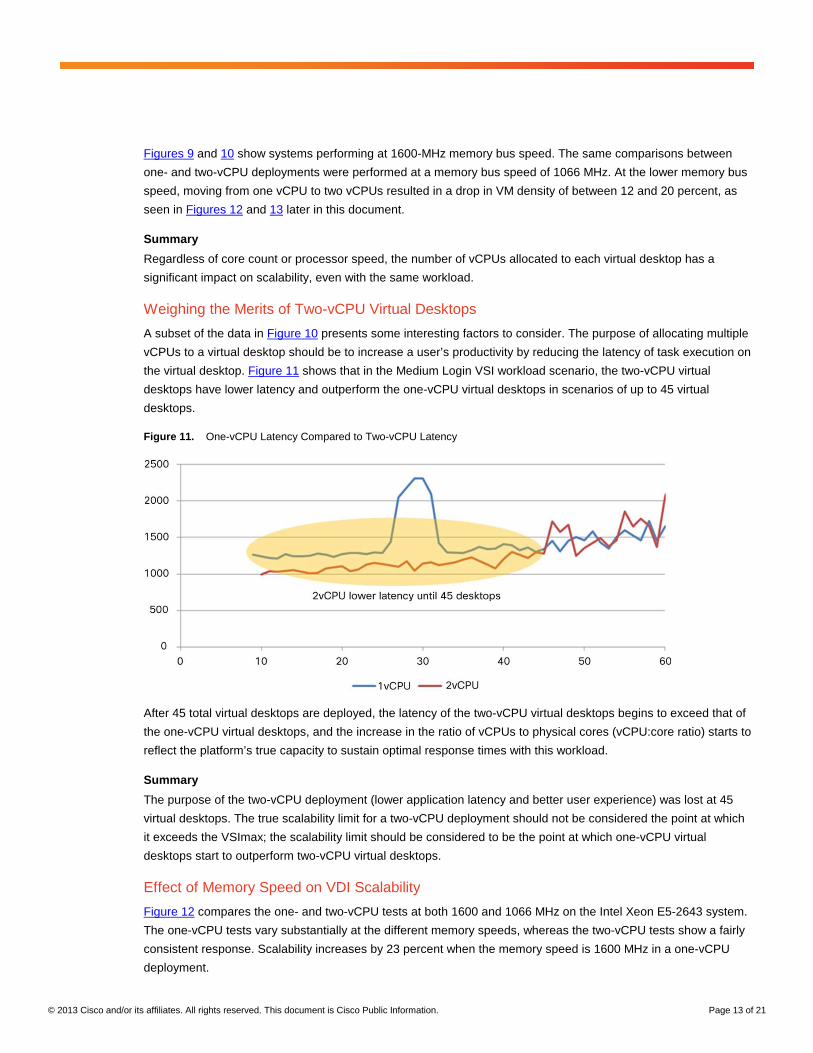
Weighing the Merits of Two-vCPU Virtual Desktops
A subset of the data in Figure 10 presents some interesting factors to consider. The purpose of allocating multiple
vCPUs to a virtual desktop should be to increase a user’s productivity by reducing the latency of task execution on
the virtual desktop. Figure 11 shows that in the Medium Login VSI workload scenario, the two-vCPU virtual
desktops have lower latency and outperform the one-vCPU virtual desktops in scenarios of up to 45 virtual
desktops.
Figure 11. One-vCPU Latency Compared to Two-vCPU Latency
After 45 total virtual desktops are deployed, the latency of the two-vCPU virtual desktops begins to exceed that of
the one-vCPU virtual desktops, and the increase in the ratio of vCPUs to physical cores (vCPU:core ratio) starts to
reflect the platform’s true capacity to sustain optimal response times with this workload.
Summary
The purpose of the two-vCPU deployment (lower application latency and better user experience) was lost at 45
virtual desktops. The true scalability limit for a two-vCPU deployment should not be considered the point at which
it exceeds the VSImax; the scalability limit should be considered to be the point at which one-vCPU virtual
desktops start to outperform two-vCPU virtual desktops.
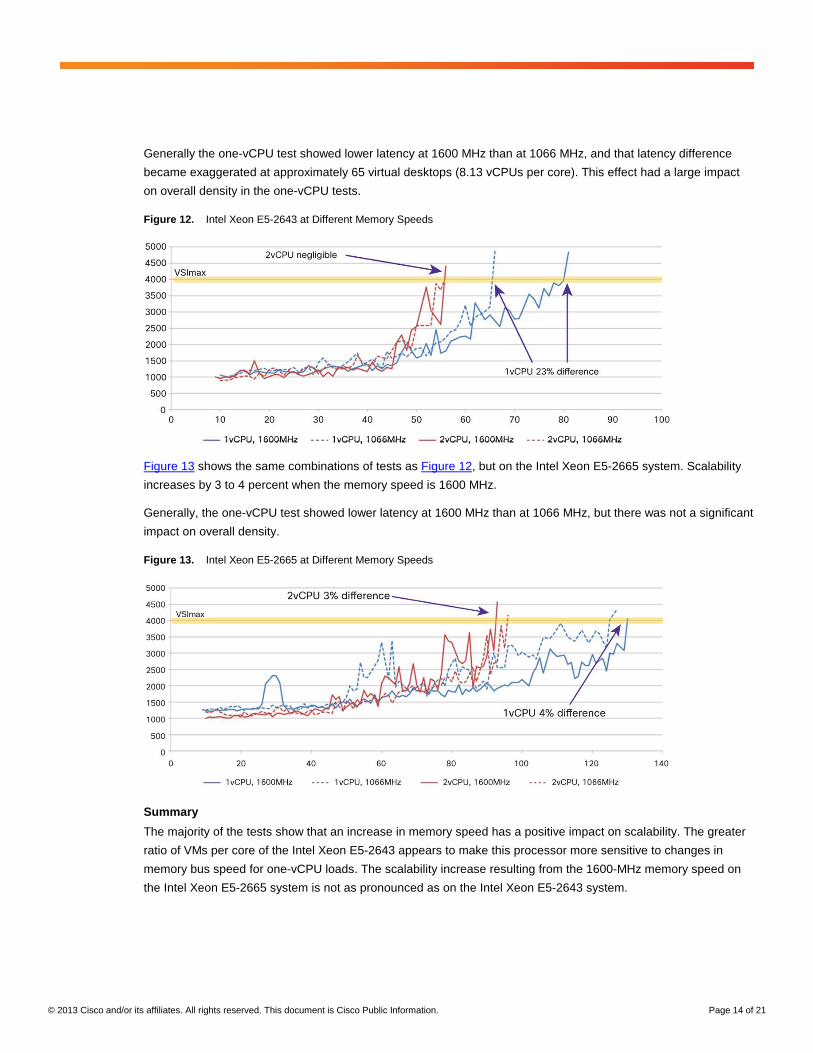
Effect of Memory Speed on VDI Scalability
Figure 12 compares the one- and two-vCPU tests at both 1600 and 1066 MHz on the Intel Xeon E5-2643 system.
The one-vCPU tests vary substantially at the different memory speeds, whereas the two-vCPU tests show a fairly
consistent response. Scalability increases by 23 percent when the memory speed is 1600 MHz in a one-vCPU
deployment.
© 2013 Cisco and/or its affiliates. All rights reserved. This document is Cisco Public Information. Page 14 of 21
Generally the one-vCPU test showed lower latency at 1600 MHz than at 1066 MHz, and that latency difference
became exaggerated at approximately 65 virtual desktops (8.13 vCPUs per core). This effect had a large impact
on overall density in the one-vCPU tests.
Figure 12. Intel Xeon E5-2643 at Different Memory Speeds
Figure 13 shows the same combinations of tests as Figure 12, but on the Intel Xeon E5-2665 system. Scalability
increases by 3 to 4 percent when the memory speed is 1600 MHz.
Generally, the one-vCPU test showed lower latency at 1600 MHz than at 1066 MHz, but there was not a significant
impact on overall density.
Figure 13. Intel Xeon E5-2665 at Different Memory Speeds
Summary
The majority of the tests show that an increase in memory speed has a positive impact on scalability. The greater
ratio of VMs per core of the Intel Xeon E5-2643 appears to make this processor more sensitive to changes in
memory bus speed for one-vCPU loads. The scalability increase resulting from the 1600-MHz memory speed on
the Intel Xeon E5-2665 system is not as pronounced as on the Intel Xeon E5-2643 system.
© 2013 Cisco and/or its affiliates. All rights reserved. This document is Cisco Public Information. Page 15 of 21
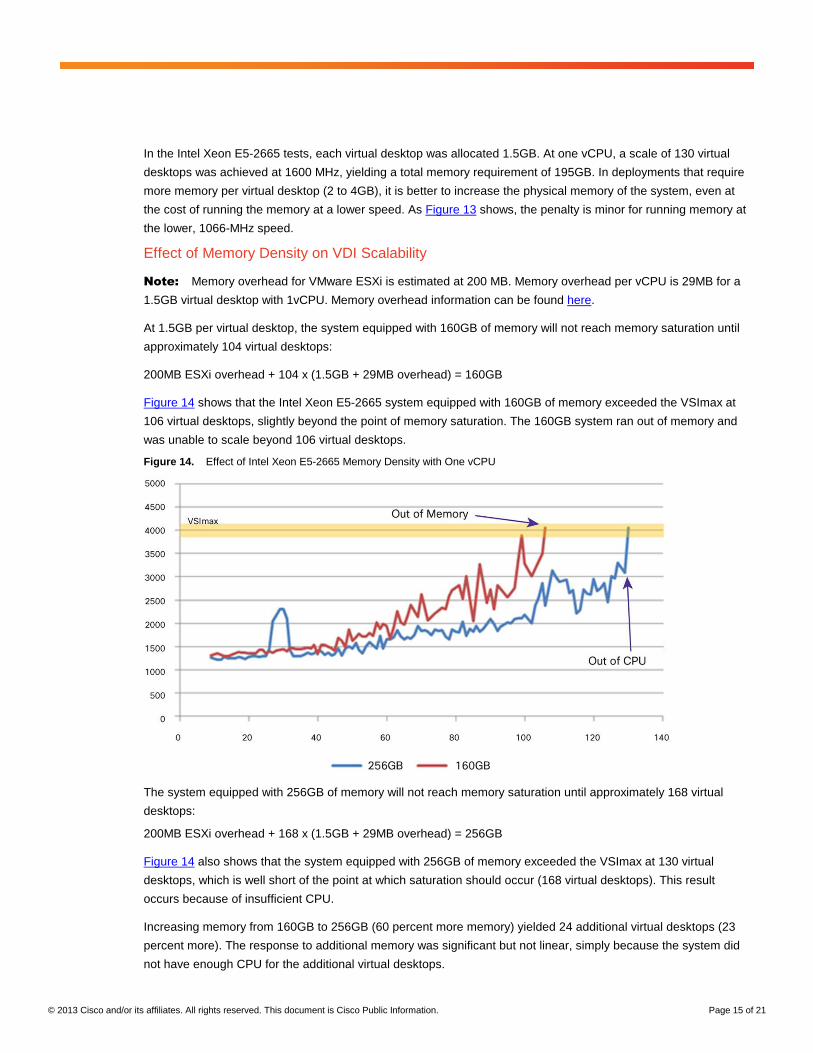
In the Intel Xeon E5-2665 tests, each virtual desktop was allocated 1.5GB. At one vCPU, a scale of 130 virtual
desktops was achieved at 1600 MHz, yielding a total memory requirement of 195GB. In deployments that require
more memory per virtual desktop (2 to 4GB), it is better to increase the physical memory of the system, even at
the cost of running the memory at a lower speed. As Figure 13 shows, the penalty is minor for running memory at
the lower, 1066-MHz speed.
Effect of Memory Density on VDI Scalability
Note: Memory overhead for VMware ESXi is estimated at 200 MB. Memory overhead per vCPU is 29MB for a
1.5GB virtual desktop with 1vCPU. Memory overhead information can be found here.
At 1.5GB per virtual desktop, the system equipped with 160GB of memory will not reach memory saturation until
approximately 104 virtual desktops:
200MB ESXi overhead + 104 x (1.5GB + 29MB overhead) = 160GB
Figure 14 shows that the Intel Xeon E5-2665 system equipped with 160GB of memory exceeded the VSImax at
106 virtual desktops, slightly beyond the point of memory saturation. The 160GB system ran out of memory and
was unable to scale beyond 106 virtual desktops.
Figure 14. Effect of Intel Xeon E5-2665 Memory Density with One vCPU
The system equipped with 256GB of memory will not reach memory saturation until approximately 168 virtual
desktops:
200MB ESXi overhead + 168 x (1.5GB + 29MB overhead) = 256GB
Figure 14 also shows that the system equipped with 256GB of memory exceeded the VSImax at 130 virtual
desktops, which is well short of the point at which saturation should occur (168 virtual desktops). This result
occurs because of insufficient CPU.
Increasing memory from 160GB to 256GB (60 percent more memory) yielded 24 additional virtual desktops (23
percent more). The response to additional memory was significant but not linear, simply because the system did
not have enough CPU for the additional virtual desktops.

© 2013 Cisco and/or its affiliates. All rights reserved. This document is Cisco Public Information. Page 16 of 21
In addition, the system with ample physical memory (256GB) achieved lower virtual desktop latency throughout
the test. The nature of this test did not give the Hypervisor enough time to reclaim memory. Over time it may be
possible to boot up some additional desktops, but it is not a recommended due to boot and login storms.
On the Intel Xeon E5-2643, CPU became a limiting factor before memory, with the result that the VSImax was
reached well before the theoretical 98 virtual desktop count. Therefore, the Intel Xeon E5-2643 data was not used
in this portion of the study.
Summary
Memory is often considered important in planning VDI capacity. Overcommit can help stretch limited memory
resources, but tests show better performance, improvements in overall usability, and lower response times when
the hypervisor has sufficient physical memory to scale as workloads increase.
Effect of Storage IOPS on Virtual Desktop Operations
To determine the number of IOPS required for a boot storm, a VMware Horizon View pool of 150 virtual desktops
was enabled. These 150 virtual desktops booted within an approximately 4-minute period as can be seen in the
Pure Storage dashboards shown in Figures 15 and 16.
Figure 15. Pure Storage Dashboard (1)
© 2013 Cisco and/or its affiliates. All rights reserved. This document is Cisco Public Information. Page 17 of 21
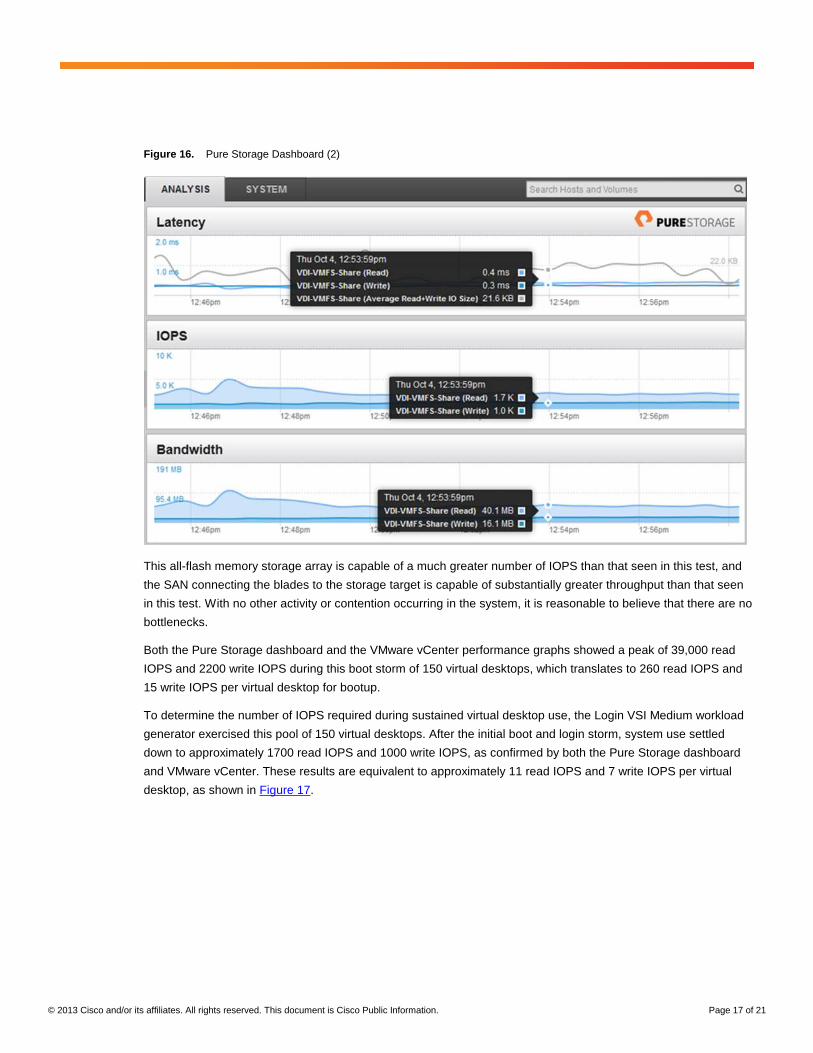
Figure 16. Pure Storage Dashboard (2)
This all-flash memory storage array is capable of a much greater number of IOPS than that seen in this test, and
the SAN connecting the blades to the storage target is capable of substantially greater throughput than that seen
in this test. With no other activity or contention occurring in the system, it is reasonable to believe that there are no
bottlenecks.
Both the Pure Storage dashboard and the VMware vCenter performance graphs showed a peak of 39,000 read
IOPS and 2200 write IOPS during this boot storm of 150 virtual desktops, which translates to 260 read IOPS and
15 write IOPS per virtual desktop for bootup.
To determine the number of IOPS required during sustained virtual desktop use, the Login VSI Medium workload
generator exercised this pool of 150 virtual desktops. After the initial boot and login storm, system use settled
down to approximately 1700 read IOPS and 1000 write IOPS, as confirmed by both the Pure Storage dashboard
and VMware vCenter. These results are equivalent to approximately 11 read IOPS and 7 write IOPS per virtual
desktop, as shown in Figure 17.

© 2013 Cisco and/or its affiliates. All rights reserved. This document is Cisco Public Information. Page 18 of 21
Figure 17. Virtual Desktop IOPS with 150 Simultaneous Virtual Desktops
Summary
A typical Microsoft Windows 7 machine can require 260 read IOPS and 15 write IOPS during bootup. Use of a
storage subsystem that accommodates fewer operations will result in slower boot times. The impact of boot
storms can be reduced by having some of the virtual desktops powered on at all times. Boot storms will still occur
if a VDI host fails and the virtual desktops from that host must be booted from other hosts.
After bootup and login, a typical Microsoft Windows 7 virtual desktop uses a small number of IOPS (11 read and 7
write), but storage must be sized to accommodate concurrent users (with additional capacity to handle boot and
login storms).
Your Results May Differ
As with many studies of this nature, the results achieved here are tightly coupled to the specific test environment
(hardware and software) used, user workload profile employed, and methodology followed. Although VDI
implementers can derive useful guidance from these findings, each specific VDI environment may yield different
results. This study therefore provides no guarantees, expressly written or implied, regarding results achieved.

© 2013 Cisco and/or its affiliates. All rights reserved. This document is Cisco Public Information. Page 19 of 21
Conclusion
This study was initiated with the objective of revealing the critical choices that implementers of desktop
virtualization must make when sizing and designing a computing platform to host virtual desktop workloads. In
documenting the findings, the study revealed critical considerations and questions that often are missing from
commonly available literature that discusses VDI. The findings in response to these questions are summarized
here:
● If the server-to-desktop density ratio is the main consideration, the number of CPU cores is more important
than the clock speed.
● The virtual machine density per CPU core can be increased (by up to 25 percent as shown in the study)
with a higher CPU burst clock speed.
● For deployments of fewer than 80 desktops, a high clock speed and lower core count yield better results.
For deployments with more than 100 desktops, a moderate clock speed and higher core count are
beneficial.
● A SPEC CINT requirement of 4.6 to 4.7 per virtual desktop running a Medium Login VSI workload is a
reasonable expectation regardless of the processor core count or clock speed.
● The use of more vCPUs per desktop may not increase desktop performance or enhance the user
experience, but it will significantly affect virtual desktop density.
● The performance benefits of two-vCPU configurations are achieved for a certain range of deployment size
(45 desktops in this study), after which one vCPU starts to outperform two vCPUs and yield lower latency.
● A lower memory bus speed may not affect virtual desktop density.
● Having sufficient physical memory to accommodate virtual machine requirements and overhead yields
better latency and better virtual desktop density.
● The number of IOPS during bootup can be 20 times higher than sustained the number of IOPS for a Login
VSI Medium workload. The IOPS during bootup are almost entirely read operations, whereas sustained
IOPS are more balanced between read and write operations.
For More Information
BrightTALK webinar on VDI “Missing Questions”
Blog series on VDI “Missing Questions”
Please also visit http://www.cisco.com/go/vdi.
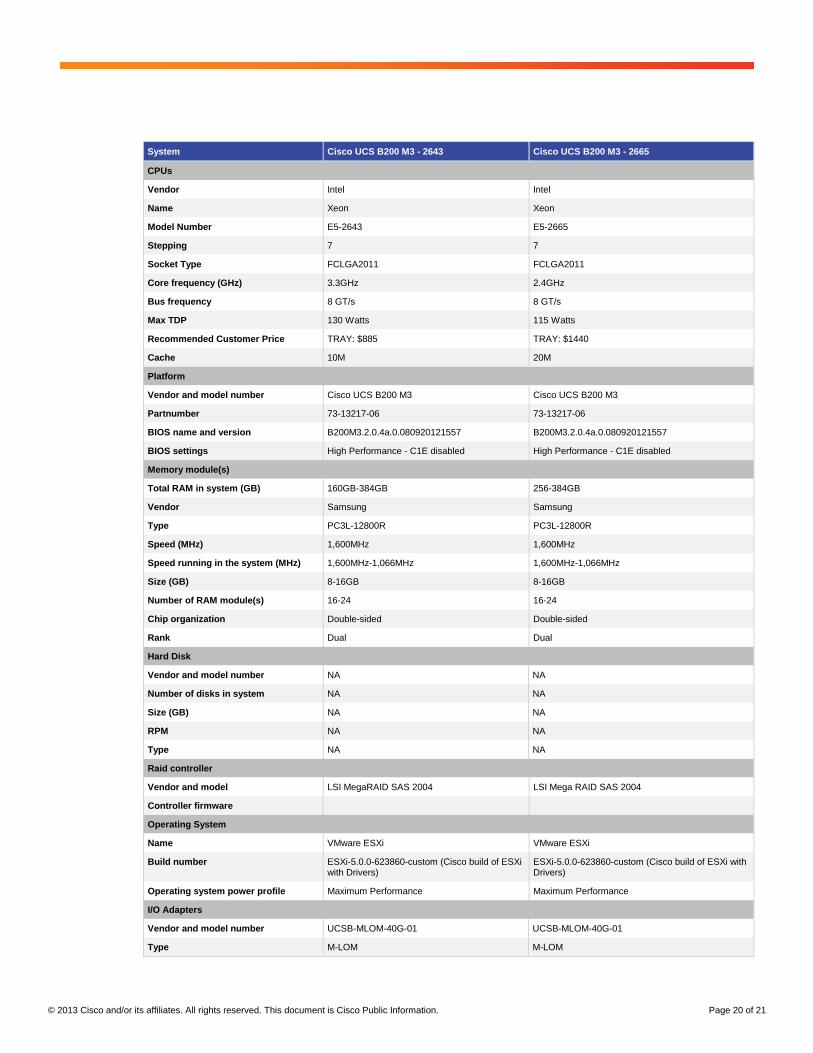
Appendix: Server and Storage Configuration Information
Table 6 presents Cisco UCS blade server configurations, and Table 7 presents the Pure Storage configuration.
Table 6. Cisco UCS Blade Server Configurations
System Cisco UCS B200 M3 - 2643 Cisco UCS B200 M3 - 2665
General
Number of processor packages 2 2
Number of cores per processor 4 8
System power management policy High Performance - C1E disabled High Performance - C1E disabled
© 2013 Cisco and/or its affiliates. All rights reserved. This document is Cisco Public Information. Page 20 of 21
System Cisco UCS B200 M3 - 2643 Cisco UCS B200 M3 - 2665
CPUs
Vendor Intel Intel
Name Xeon Xeon
Model Number E5-2643 E5-2665
Stepping 7 7
Socket Type FCLGA2011 FCLGA2011
Core frequency (GHz) 3.3GHz 2.4GHz
Bus frequency 8 GT/s 8 GT/s
Max TDP 130 Watts 115 Watts
Recommended Customer Price TRAY: $885 TRAY: $1440
Cache 10M 20M
Platform
Vendor and model number Cisco UCS B200 M3 Cisco UCS B200 M3
Partnumber 73-13217-06 73-13217-06
BIOS name and version B200M3.2.0.4a.0.080920121557 B200M3.2.0.4a.0.080920121557
BIOS settings High Performance - C1E disabled High Performance - C1E disabled
Memory module(s)
Total RAM in system (GB) 160GB-384GB 256-384GB
Vendor Samsung Samsung
Type PC3L-12800R PC3L-12800R
Speed (MHz) 1,600MHz 1,600MHz
Speed running in the system (MHz) 1,600MHz-1,066MHz 1,600MHz-1,066MHz
Size (GB) 8-16GB 8-16GB
Number of RAM module(s) 16-24 16-24
Chip organization Double-sided Double-sided
Rank Dual Dual
Hard Disk
Vendor and model number NA NA
Number of disks in system NA NA
Size (GB) NA NA
RPM NA NA
Type NA NA
Raid controller
Vendor and model LSI MegaRAID SAS 2004 LSI Mega RAID SAS 2004
Controller firmware
Operating System
Name VMware ESXi VMware ESXi
Build number ESXi-5.0.0-623860-custom (Cisco build of ESXi with Drivers)
ESXi-5.0.0-623860-custom (Cisco build of ESXi with Drivers)
Operating system power profile Maximum Performance Maximum Performance
I/O Adapters
Vendor and model number UCSB-MLOM-40G-01 UCSB-MLOM-40G-01
Type M-LOM M-LOM

© 2013 Cisco and/or its affiliates. All rights reserved. This document is Cisco Public Information. Page 21 of 21
Table 7. Pure Storage Configuration
System Pure Storage Flash Array
Storage
Number of disk enclosures 1
Power supplies
Total number 4
Disks
Number 24
Operating system
Name Purity V 2.0.2
Network
Type 8GB Fiber Channel
Note: At the time of testing, Cisco UCS certification testing for Pure Storage was not complete.
Authors and Credits (in Alphabetical Order)
● Keith Brant - Solutions Architect, Cisco Advanced Services.
● Doron Chosnek - Consulting Systems Engineer, Virtualization SME
● Shawn Kaiser - Consulting Systems Engineer, Virtualization SME
● Jason Marchesano - Consulting Systems Engineer, Service Provider
Hardware and software partners - the authors thanks the following vendors for their resources and support
provided to this initiative: Login VSI, Pure Storage, and VMware.
Printed in USA C11-727392-00 04/13