Numerical Simulation and Parameters Optimization of Laser ...

DIPARTIMENTO DI INGEGNERIA INDUSTRIALE
Dottorato di Ricerca in Ingegneria Meccanica XI Ciclo N.S. (2009-2012)
“Design and Optimization of a protection device
for laser weld beads of metal alloys for
aerospace applications”
Ing. Gaetano Corrado Tutor: Coordinatore:
Prof. Vincenzo Sergi Prof. Vincenzo Sergi


TABLE OF CONTENTS
Summary vii
Chapter 1 Basic Laser Principles 1.1 Introduction 1
1.2 How the Laser Works 2
1.2.1 Photos and Energy 2
1.2.2 Absorption, Spontaneous and
Stimulated Emissions 4
1.2.3 Population Inversion 7
1.2.4 The Resonator 8
1.2.5 Laser pumping sources 9
1.3 Propagation Characteristics of Laser Beam 10
1.3.1 Beam waist and Divergence 10
1.3.2 Locating the beam waist 12
1.3.3 Higher order Gaussian Laser Beams 16
1.3.4 Transvers Modes and Mode Control 18
1.4 Laser properties related to applications 21
ii Table of Contents
1.4.1 Collimation 21
1.4.2 Monochromaticity 21
1.4.3 Coherence 22
1.4.4 Intensity or Irradiance 23
1.4.5 Focusability 24
1.5 Type of Lasers 25
1.5.1 Gas Discharge Laser 26
1.5.2 Semiconductor Diode Lasers 29
1.5.3 Optically Pumped Lasers 31
1.5.4 Diode Pumped a Staid Solid Lasers 33
1.6 Disk Laser 35
1.6.1 The thin Disk Laser principles
(Multipass Pumping) 35
1.6.2 Minimal thermal lensing effect 38
1.6.3 Scaling power regulation 39
Chapter 2 Laser Welding 2.1 Introduction 41
2.2 Process Arrangement 43
2.2.1 Conduction limited welding 44
2.2.2 Deep penetration “keyhole” welding 45
2.2.2 Deep penetration “keyhole” welding 47
2.3 Laser welding parameters 48
2.3.1 Power 49
2.3.2 Polarisation 52

iii Table of Contents
2.3.3 Wavelength 53
2.3.4 Focal Position 55
2.3.5 Welding Speed 56
2.3.6 Joint Geometries 57
2.3.7 Gas Shroud and Gas Pressure 59
2.3.8 Effect of Gas Pressure — Due to Velocity
and Environment 62
2.3.9 Effect of Material Properties 63
Chapter 3 Automated laser welding apparatus 3.1 Introduction 66
3.2 Problems caused by the oxidation 67
3.3 Solutions proposed in the literature 69
3.4 Proposed Solution 73
3.4.1 Design and realization of the Upper Diffuser 76
3.4.2 Design and realization of the Lower Diffuser 81
3.5 Equipment for experimental works 83
3.5.1 Laser source and focus system 83
3.5.2 Moving system of the laser welding head 86
Chapter 4 Butt laser welding of Titanium alloy 4.1 Introduction 88
4.2 Material: Ti6Al4V Titanium alloy 88
4.3 Configuration of automated laser welding apparatus 91
4.4 Butt welding of Ti64: Experimental Plan 93

iv Table of Contents
4.5 Results and discussions: geometrical characteristics,
microstructures and defects 98
4.6 Analysis of the responses 103
4.7 Optimization and Tensile Test 110
Chapter 5 Butt laser welding of Nickel Superalloys 5.1 Introduction 113
5.2 What are Superalloys? 113
5.3 Superalloy Metallurgy 116
5.3.1 Crystal Structures 117
5.3.2 Phases in Superalloys 118
5.4 Haynes 188 119
5.5 Inconel 718 121
5.6 Configuration of automated laser welding apparatus 123
5.7 Design of Experiments 125
5.7.1 Experimental plan arrangement 125
5.7.2 Response variables choice 128
5.8 Results and discussion 130
5.9 Optimization of the responses 134
5.10 Constraint criteria for optimization 137
5.11 Optimal processing condition and tensile test 139
Chapter 6 Edge joint laser welding of Nickel Superalloy
6.1 Introduction 143
6.2 Material: Inconel 625 Nickel Superalloy 146

v Table of Contents
6.3 Automated laser welding apparatus for edge
joint configuration 147
6.3.1 Edge joint configuration 147
6.3.2 Configuration of automated laser welding
apparatus 148
6.4 Design of experiment 151
6.5 Results and discussions 152
6.5.1 Visual inspections 152
6.5.2 X-ray tests 154
6.6 Macrographic examinations 155
6.7 Micrographic examinations 159
Conclusion 161
Reference 164


Summary In the present thesis an automated laser welding apparatus was designed
and developed in order to perform laser , that allows to achieve laser welding in a controlled, versatile, efficient, reliable, simple, and economical way. This system allows to shield not controlled from oxidation and nitriding process, both the melted pool and the material portion just after welding when the oxidation or nitriding critical temperatures, generally between 200 °C and 500 °C are still in place. Oxidation is even more serious when welding titanium, nickel superalloy, zirconium, molybdenum, stainless steel and other gas-reactive metals and alloys. Most of these materials are used for a wide range of applications in aerospace and biomedical fields as well as for piping in petrochemical, food, semiconductor, nuclear, and chemical industries. These metals can be used in contact with corrosive or sensitive materials without contaminating them, thus making them the number one choices for applications requiring long service life and non-contamination.
The resulting oxidized surfaces are not-longer corrosion resistant and further treatment may be necessary. Removing the oxidation using mechanical means, such as grinding, also removes the metal’s passive protective layer.
The automated laser welding apparatus (patent number: SA2012A000016) was tested with three different joints: butt welding of 3 mm thick Ti6Al4V plates; dissimilar butt welding of 1.5 mm thick of Haynes 188 and Inconel 718 and edge joint of 0.7 mm thick Inconel 625 sheets.

ii Table of Contents
All of the tests were performed with automated laser welding apparatus; the bead quality was discussed in terms of geometrical features, porosity content, microstructure, hardness and strength. This work is divided in three parts.
In the first part, the principles of operation and the different types of laser are discussed, with mention to the advantages of a disk laser source, which is employed in the experimental part. Also, the types of laser welding, the influence of process parameters and the advantages compared to traditional welding techniques are explained.
The second part presents the issue of oxidation caused by welding and the relative solutions proposed in the literature for shielding the bead. Then, the development and the implementation of the automated laser welding apparatus with its components is described.
Finally, the capabilities of the automated laser welding apparatus on three different types of joint are discussed in the last part and the relative results are provided.

Chapter 1 Basic Laser Principles
1.1 Introduction Lasers are devices that produce intense beams of light which are
monochromatic, coherent, and highly collimated. The wavelength (color) of laser light is extremely pure (monochromatic) when compared to other sources of light, and all of the photons (energy) that make up the laser beam have a fixed phase relationship (coherence) with respect to one another. Light from a laser typically has very low divergence. It can travel over great distances or can be focused to a very small spot (area on a surface illuminated by a laser) with a brightness which exceeds that of the sun. Because of these properties, lasers are used in a wide variety of applications in all walks of life. The basic operating principles of the laser were put forth by Charles Townes and Arthur Schalow from the Bell Telephone Laboratories in 1958, and the first actual laser, based on a pink ruby crystal, was demonstrated in 1960 by Theodor Maiman at Hughes Research Laboratories. Since that time, literally thousands of lasers have been invented (including the edible “Jello” laser), but only a much smaller number have found practical applications in scientific, industrial, commercial, and military applications. The helium neon laser (the first continuous-wave laser), the semiconductor diode laser, and air-cooled ion lasers have found broad OEM application.
The term “laser” is an acronym for Light Amplification by Stimulated Emission of Radiation. To understand the laser, one needs to understand the meaning of these terms. The term “light” is generally accepted to be electromagnetic radiation ranging from 1 nm to 1000 μm in wavelength. The visible spectrum (what we see) ranges from approximately 400 to

2 Chapter 1 700 nm. The wavelength range from 700 nm to 10 μm is considered the near infrared (NIR), and anything beyond that is the far infrared (FIR). Conversely, 200 to 400 nm is called ultraviolet (UV); below 200 nm is the deep ultraviolet (DUV).
1.2 How the Laser Works
1.2.1 Photos and Energy
In 1915, Neils Bohr proposed a model of the atom that explained a wide
variety of phenomena that were puzzling scientists in the late 19th century. This simple model became the basis for the field of quantum mechanics and, although not fully accurate by today’s understanding, still is useful for demonstrating laser principles.
In Bohr’s model, shown in Figure 1.1, electrons orbit the nucleus of an atom. Unlike earlier “planetary” models, the Bohr atom has a limited number of fixed orbits that are available to the electrons. Under the right circumstances an electron can go from its ground state (lowest-energy orbit) to a higher (excited) state, or it can decay from a higher state to a lower state, but it cannot remain between these states. The allowed energy states are called “quantum” states and are referred to by the principal “quantum numbers” 1, 2, 3, etc. The quantum states are represented by an energy-level diagram.
Figure 1.1 The Bohr atom and a simple energy-level

Chapter 1 3 For an electron to jump- to a higher quantum state, the atom must
receive energy from the outside world. This can happen through a variety of mechanisms such as inelastic or semielastic collisions with other atoms and absorption of energy in the form of electromagnetic radiation (e.g., light). Likewise, when an electron drops from a higher state to a lower state, the atom must give off energy, either as kinetic activity nonradiative transitions) or as electromagnetic radiation (radiative transitions). For the remainder of this discussion we will consider only radiative transitions.
In the 1600s and 1700s, early in the modern study of light, there was a great controversy about light’s nature. Some thought that light was made up of particles, while others thought that it was made up of waves. Both concepts explained some of the behavior of light, but not all. It was finally determined that light is made up of particles called “photons” which exhibit both particle-like and wave-like properties. Each photon has an intrinsic energy determined by the equation (1.1)
𝐸 = ℎ ∙ 𝑣 (1.1)
where v is the frequency of the light and h is Planck’s constant.
Since, for a wave, the frequency and wavelength are related by the equation
λ𝑣 = 𝑐 (1.2)
where λ is the wavelength of the light and c is the speed of light in a vacuum, equation (1.1) can be rewritten as
𝐸 = ℎ𝑐/λ (1.3)
It is evident from this equation that the longer the wavelength of the light, the lower the energy of the photon; consequently, ultraviolet light is much more “energetic” than infrared light.

4 Chapter 1
Returning to the Bohr atom: for an atom to absorb light (i.e., for the light energy to cause an electron to move from a lower energy state En to a higher energy state Em), the energy of a single photon must equal, almost exactly, the energy difference between the two states. Too much energy or too little energy and the photon will not be absorbed. Consequently, the wavelength of that photon must be
λ = ℎ𝑐/∆𝐸
where (1.4)
∆𝐸 = 𝐸𝑚 − 𝐸𝑛 Likewise, when an electron decays to a lower energy level in a radiative
transition, the photon of light given off by the atom must also have an energy equal to the energy difference between the two states.
1.2.2 Absorption, Spontaneous and Stimulated Emissions
In general, when an electron is in an excited energy state, it must
eventually decay to a lower level, giving off a photon of radiation. This event is called “spontaneous emission,” and the photon is emitted in a random direction and a random phase. The average time it takes for the electron to decay is called the time constant for spontaneous emission, and is represented by τ.
On the other hand, if an electron is in energy state E2, and its decay path is to E1, but, before it has a chance to spontaneously decay, a photon happens to pass by whose energy is approximately E2-E1, there is a probability that the passing photon will cause the electron to decay in such a manner that a photon is emitted at exactly the same wavelength, in exactly the same direction, and with exactly the same phase as the passing photon. This process is called “stimulated emission.” Absorption, spontaneous emission, and stimulated emission are illustrated in Figure 1.2.

Chapter 1 5
Figure 1.2 Absorption Spontaneous and Stimulated emission
Now consider the group of atoms shown in Figure 1.3: all begin in
exactly the same excited state, and most are effectively within the stimulation range of a passing photon. We also will assume that t is very long, and that the probability for stimulated emission is 100 percent. The incoming (stimulating) photon interacts with the first atom, causing stimulated emission of a coherent photon; these two photons then interact with the next two atoms in line, and the result is four coherent photons, on down the line. At the end of the process, we will have eleven coherent photons, all with identical phases and all traveling in the same direction. In other words, the initial photon has been “amplified” by a factor of eleven. Note that the energy to put these atoms in excited states is

6 Chapter 1 provided externally by some energy source which is usually referred to as the “pump” source.
Figure 1.3 Amplification by stimulated emission
Of course, in any real population of atoms, the probability for
stimulated emission is quite small. Furthermore, not all of the atoms are usually in an excited state; in fact, the opposite is true. Boltzmann’s principle, a fundamental law of thermodynamics, states that, when a collection of atoms is at thermal equilibrium, the relative population of any two energy levels is given by
𝑁1𝑁2
= exp �−𝐸2 − 𝐸1𝑘 ∙ 𝑇
� (1.5)
where N2 and N1 are the populations of the upper and lower energy states, respectively, T is the equilibrium temperature, and k is Boltzmann’s constant. Substituting hn for E2-E1 yields

Chapter 1 7
∆𝑁 = 𝑁2 − 𝑁1 = �1 − 𝑒−ℎ𝑣𝑘𝑇�𝑁1 (1.6)
For a normal population of atoms, there will always be more atoms in
the lower energy levels than in the upper ones. Since the probability for an individual atom to absorb a photon is the same as the probability for an excited atom to emit a photon via stimulated emission, the collection of real atoms will be a net absorber, not a net emitter, and amplification will not be possible. Consequently, to make a laser, we have to create a “population inversion.”
1.2.3 Population Inversion
Atomic energy states are much more complex than indicated by the
description above. There are many more energy levels, and each one has its own time constants for decay. The four-level energy diagram shown in Figure 1.4 is representative of some real lasers.
Figure 1.4 A four-level laser pumping system

8 Chapter 1
The electron is pumped (excited) into an upper level E4 by some mechanism (for example, a collision with another atom or absorption of high-energy radiation). It then decays to E3, then to E2, and finally to the ground state E1. Let us assume that the time it takes to decay from E2 to E1 is much longer than the time it takes to decay from E2 to E1. In a large population of such atoms, at equilibrium and with a continuous pumping process, a population inversion will occur between the E3 and E2 energy states, and a photon entering the population will be amplified coherently.
1.2.4 The Resonator
Although with a population inversion we have the ability to amplify a
signal via stimulated emission, the overall single-pass gain is quite small, and most of the excited atoms in the population emit spontaneously and do not contribute to the overall output. To turn this system into a laser, we need a positive feedback mechanism that will cause the majority of the atoms in the population to contribute to the coherent output. This is the resonator, a system of mirrors that reflects undesirable (off-axis) photons out of the system and reflects the desirable (on-axis) photons back into the excited population where they can continue to be amplified.
Now consider the laser system shown in Figure 1.5.
Figure 1.5 Schematic diagram of a basic laser
The lasing medium or gain medium is pumped continuously to create a population inversion at the lasing wavelength. As the excited atoms start

Chapter 1 9
to decay, they emit photons spontaneously in all directions. Some of the photons travel along the axis of the lasing medium, but most of the photons are directed out the sides. The photons traveling along the axis have an opportunity to stimulate atoms they encounter to emit photons, but the ones radiating out the sides do not. Furthermore, the photons traveling parallel to the axis will be reflected back into the lasing medium and given the opportunity to stimulate more excited atoms. As the on-axis photons are reflected back and forth interacting with more and more atoms, spontaneous emission decreases, stimulated emission along the axis predominates, and we have a laser.
Finally, to get the light out of the system, one of the mirrors is has a partially transmitting coating that couples out a small percentage of the circulating photons. The amount of coupling depends on the characteristics of the laser system and varies from a fraction of a percent for helium neon lasers to 50 percent or more for high-power lasers.
1.2.5 Laser pumping sources
Laser pumping sources are the means by which energy is transferred
into the laser gain medium to produce the required population inversion ΔN21. These pumping sources generally consist of either electrons flowing within the medium or light being absorbed by the medium.
Electron pumping - Electron pumping is used primarily in gaseous or semiconductor gain media. In gases, many electrons are produced when a few initial electrons within the gain medium are accelerated by an electric field within the medium and these many electrons then collide with neutral atoms, exciting those atoms to higher-lying energy levels and even ionizing some of the atoms (removing an electron). The freed electrons are also accelerated, producing an avalanche of electrons and therefore an electrical current within the medium. The electrons lose their energy by transferring it to the atoms during the collision process. Some of the lasers operate on a pulsed basis, applying a large amount of current for a short

10 Chapter 1 period of time. Others operate on a continuous (cw) basis, using a much smaller but continuous current.
Optical pumping - Optical pumping of lasers generally applies to the pumping of liquid (dye) lasers and to dielectric solid-state lasers and is provided by either flash-lamps or other lasers. The most common types of flash-lamps used for pumping lasers are narrow, cylindrical quartz tubes with metal electrodes mounted on the ends, filled with a gaseous species such as xenon that serves as the radiating material within the lamp. A voltage is applied across the electrodes of the flash-lamp and current flows through the gas, populating excited levels of the atoms within the gas that radiate and produce intense light emission. The process is similar to that of electron excitation of lasers described above except that a population inversion is not produced and the radiating material of the lamp radiates via spontaneous emission, rather than by stimulated emission as in the case of a laser gain medium. The pumping wavelength of the flash-lamp is determined by the gaseous medium inserted within the flash-lamp tube. Xenon is the most common species because of both its radiating efficiency and its emission of a broad spectrum of wavelengths from which to choose in matching the lamp emission to the pumping absorption bands of the laser.
1.3 Propagation Characteristics of Laser Beam
1.3.1 Beam waist and Divergence
Diffraction causes light waves to spread transversely as they propagate,
and it is therefore impossible to have a perfectly collimated beam. The spreading of a laser beam is in accord with the predictions of diffraction theory. Under ordinary circumstances, the beam spreading can be so small it can go unnoticed. The following formulas accurately describe beam spreading, making it easy to see the capabilities and limitations of laser beams.

Chapter 1 11 Even if a Gaussian TEM00 laser-beam wave-front were made perfectly
flat at some plane, with all rays there moving in precisely parallel directions, it would acquire curvature and begin spreading in accordance with
𝑅(𝑧) = 𝑧 �1 + �𝜋 ∙ 𝑤0
2
𝜆 ∙ 𝑧�2
� (1.7)
and
𝑤(𝑧) = 𝑤0 �1 + �𝜆 ∙ 𝑧𝜋 ∙ 𝑤0
2�2
�
12
(1.8)
where z is the distance propagated from the plane where the wave-front is flat, l is the wavelength of light, w0 is the radius of the 1/e2 irradiance contour at the plane where the wave-front is flat, w(z) is the radius of the 1/e2 contour after the wave has propagated a distance z, and R(z) is the wave-front radius of curvature after propagating a distance z. R(z) is infinite at z=0, passes through a minimum at some finite z, and rises again toward infinity as z is further increased, asymptotically approaching the value of z itself.
The plane z=0 marks the location of a beam waist, or a place where the wave-front is flat, and w0 is called the beam waist radius.
The irradiance distribution of the Gaussian TEM00 beam, namely,
𝐼(𝑟) = 𝐼0𝑒−2𝑟2/𝑤2 =
2𝑃𝜋𝑤2 𝑒
−2𝑟2
𝑤2 (1.9)
where w=w(z) and P is the total power in the beam, is the same at all cross sections of the beam. The invariance of the form of the distribution is a special consequence of the presumed Gaussian distribution at z=0. Simultaneously, as R(z) asymptotically approaches z for large z, w(z) asymptotically approaches the value

12 Chapter 1
𝑤(𝑧) =𝜆 ∙ 𝑧𝜋 ∙ 𝑤0
(1.10)
where z is presumed to be much larger than πw0
2/ λ so that the 1/e2 irradiance contours asymptotically approach a cone of angular radius.
𝜃 =𝑤(𝑧)𝑧
=𝜆
𝜋 ∙ 𝑤0 (1.11)
This value is the far-field angular radius (half-angle divergence) of the
Gaussian TEM00 beam. The vertex of the cone lies at the center of the waist (see Figure 1.6).
It is important to note that, for a given value of λ, variations of beam diameter and divergence with distance z are functions of a single parameter, w0, the beam waist radius.
Figure 1.6 Growth in beam diameter as a function of distance from beam
waist
1.3.2 Locating the beam waist
Unlike conventional light beams, Gaussian beams do not diverge
linearly, as can be seen in Figure 1.6. Near the laser, the divergence angle is extremely small; far from the laser, the divergence angle approaches the asymptotic limit described in equation (1.11) above. The Raleigh range

Chapter 1 13
(zR), defined as the distance over which the beam radius spreads by a factor of √2 is given by
𝑧𝑅 =𝜋 ∙ 𝑤0
2
𝜆 (1 .12)
The Raleigh range is the dividing line between near-field divergence
and mid-range divergence. Far-field divergence (the number quoted in laser specifications) must be measured at a point >zR (usually 10zR will suffice). This is a very important distinction because calculations for spot size and other parameters in an optical train will be inaccurate if near- or mid-field divergence values are used. For a tightly focused beam, the distance from the waist (the focal point) to the far field can be a few millimeters or less. For beams coming directly from the laser, the far-field distance can be measured in meters.
For a Gaussian laser beam, the location (and radius) of the beam waist is determined uniquely by the radius of curvature and optical spacing of the laser cavity mirrors because, at the reflecting surfaces of the cavity mirrors, the radius of curvature of the propagating beam is exactly the same as that of the mirrors. Consequently, for the flat/curved cavity shown in Figure 1.7 (a), the beam waist is located at the surface of the flat mirror. For a symmetric cavity (b), the beam waist is halfway between the mirrors; for non-symmetric cavities (c and d), the beam waist is located by using the equation
𝑧1 =𝐿(𝑅2 − 𝐿)
𝑅1 + 𝑅2 − 2𝐿 (1.13)
and
𝑧1 + 𝑧2 = 𝐿 (1.14) where L is the effective mirror spacing, R1 and R2 are the radii of
curvature of the cavity mirrors, and z1 and z2 are the distances from the

14 Chapter 1 beam waist of mirrors 1 and 2, respectively. (Note that distances are measured from the beam waist, and that, by convention, mirror curvatures that are concave when viewed from the waist are considered positive, while those that are convex are considered negative.)
Figure 1.7 Location of beam waist for common cavity geometries

Chapter 1 15 In any case but that of a flat output mirror, the beam waist is refracted as
it passes through the mirror substrate. If the output coupler’s second surface is flat, the effective waist of the refracted beam is moved toward the output coupler and is reduced in diameter. However, by applying a spherical correction to the second surface of the output coupler, the location of the beam waist can be moved to the output coupler itself, increasing the beam waist diameter and reducing far-field divergence. (See Calculating a Correcting Surface.)
It is useful, particularly when designing laser cavities, to understand the effect that mirror spacing has on the beam radius, both at the waist and at the curved mirror. Figure 1.8 plots equations (1.7) and (1.8) as a function of R/z (curved mirror radius divided by the mirror spacing). As the mirror spacing approaches the radius of curvature of the mirror (R/z=1), the beam waist decreases dramatically, and the beam radius at the curved mirror becomes very large. On the other hand, as R/z becomes large, the beam radius at the waist and at the curved mirror are approximately the same.
Figure 1.8 Beam waist and output diameter as a function of mirror radius and
separation

16 Chapter 1
1.3.3 Higher order Gaussian Laser Beams In the real world, the truly 100-percent, single transverse mode,
Gaussian laser beam (also called a pure or fundamental mode beam) described by equations (1.7) and (1.8) is very hard to find. Low-power beams from helium neon lasers can be a close approximation, but the higher the power of the laser, and the more complex the excitation mechanism (e.g., transverse discharges, flash-lamp pumping), or the higher the order of the mode, the more the beam deviates from the ideal.
To address the issue of higher order Gaussian beams and mixed mode beams, a beam quality factor, M2, has come into general use. A mixed mode is one where several modes are oscillating in the resonator at the same time. A common example is the mixture of the lowest order single transverse mode with the doughnut mode, before the intracavity mode limiting aperture is critically set to select just the fundamental mode. Because all beams have some wave-front defects, which implies they contain at least a small admixture of some higher order modes, a mixed mode beam is also called a “real” laser beam.
For a theoretical single transverse mode Gaussian beam, the value of the waist radius–divergence product is (from equation (1.11)):
𝑤0 𝜃 = 𝜆/𝜋 (1.15)
It is important to note that this product is an invariant for transmission
of a beam through any normal, high-quality optical system (one that does not add aberrations to the beam wavefront). That is, if a lens focuses the single mode beam to a smaller waist radius, the convergence angle coming into the focus (and the divergence angle emerging from it) will be larger than that of the unfocused beam in the same ratio that the focal spot diameter is smaller: the product is invariant.
For a real laser beam, we have
𝑊0 Ɵ = 𝑀2𝜆/𝜋 (1.16)

Chapter 1 17
where W0 and Ɵ are the 1/e2 intensity waist radius and the far-field half-divergence angle of the real laser beam, respectively. Here we have introduced the convention that upper case symbols are used for the mixed mode and lower case symbols for the fundamental mode beam coming from the same resonator. The mixed-mode beam radius W is M times larger than the fundamental mode radius at all propagation distances. Thus the waist radius is that much larger, contributing the first factor of M in equation (1.16). The second factor of M comes from the half-angle divergence, which is also M times larger. The waist radius–divergence half-angle product for the mixed mode beam also is an invariant, but is M2 larger. The fundamental mode beam has the smallest divergence allowed by diffraction for a beam of that waist radius. The factor M2 is called the “times-diffraction-limit” number or (inverse) beam quality; a diffraction-limited beam has an M2 of unity.
For a typical helium neon laser operating in TEM00 mode, M2 < 1.05. Ion lasers typically have an M2 factor ranging from 1.1 to 1.7. For high-energy multimode lasers, the M2 factor can be as high as 30 or 40. The M2 factor describes the propagation characteristics (spreading rate) of the laser beam. It cannot be neglected in the design of an optical train to be used with the beam. Truncation (aperturing) by an optic, in general, increases the M2 factor of the beam.
The propagation equations (analogous to equations (1.7) and (1.8) for the mixed-mode beam W(z) and R(z) are as follows:
𝑊(𝑧) = 𝑊0 �1 + �𝑧𝑀2𝜆𝜋𝑊0
2 �2
�1/2
= 𝑊0 �1 + �𝑧𝑍𝑅�2� (1.17)
and
𝑅(𝑧) = 𝑧 �1 + �𝜋𝑊0
2
𝑧𝑀2𝜆�2
� = 𝑊0 �1 + �𝑍𝑅𝑧�2
� (1.18)
The Rayleigh range remains the same for a mixed mode laser beam
18 Chapter 1
𝑍𝑅 =𝜋𝑊0
2
𝑀2𝜆=𝜋𝑤0
2
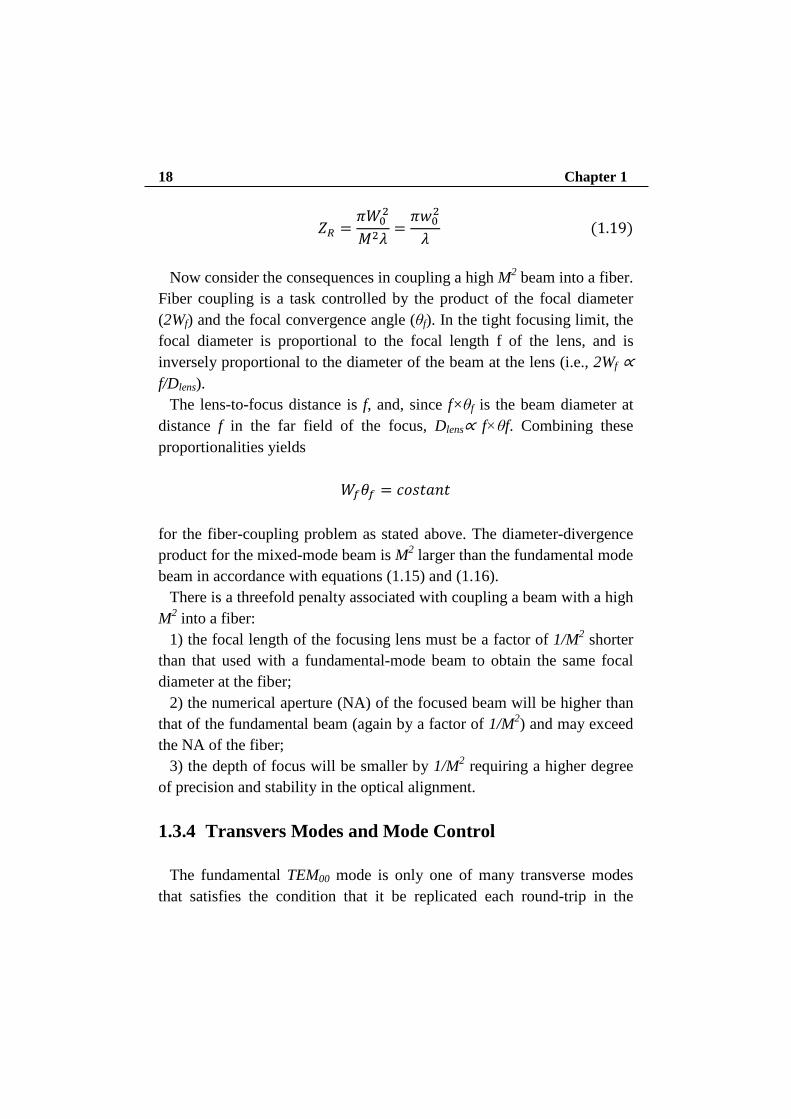
𝜆 (1.19)
Now consider the consequences in coupling a high M2 beam into a fiber.
Fiber coupling is a task controlled by the product of the focal diameter (2Wf) and the focal convergence angle (θf). In the tight focusing limit, the focal diameter is proportional to the focal length f of the lens, and is inversely proportional to the diameter of the beam at the lens (i.e., 2Wf ∝ f/Dlens).
The lens-to-focus distance is f, and, since f×θf is the beam diameter at distance f in the far field of the focus, Dlens∝ f×θf. Combining these proportionalities yields
𝑊𝑓𝜃𝑓 = 𝑐𝑜𝑠𝑡𝑎𝑛𝑡
for the fiber-coupling problem as stated above. The diameter-divergence product for the mixed-mode beam is M2 larger than the fundamental mode beam in accordance with equations (1.15) and (1.16).
There is a threefold penalty associated with coupling a beam with a high M2 into a fiber:
1) the focal length of the focusing lens must be a factor of 1/M2 shorter than that used with a fundamental-mode beam to obtain the same focal diameter at the fiber;
2) the numerical aperture (NA) of the focused beam will be higher than that of the fundamental beam (again by a factor of 1/M2) and may exceed the NA of the fiber;
3) the depth of focus will be smaller by 1/M2 requiring a higher degree of precision and stability in the optical alignment.
1.3.4 Transvers Modes and Mode Control
The fundamental TEM00 mode is only one of many transverse modes
that satisfies the condition that it be replicated each round-trip in the

Chapter 1 19
cavity. Figure 1.9 shows examples of the primary lower-order Hermite-Gaussian (rectangular) modes.
Note that the subscripts m and n in the mode designation TEMmn are correlated to the number of nodes in the x and y directions. The propagation equation can also be written in cylindrical form in terms of radius (ρ) and angle (ϕ). The eigenmodes (Eρϕ ) for this equation are a series of axially symmetric modes, which, for stable resonators, are closely approximated by Laguerre-Gaussian functions, denoted by TEMρϕ. For the lowest-order mode, TEM00, the Hermite-Gaussian and Laguerre-Gaussian functions are identical, but for higher-order modes, they differ significantly, as shown in Figure 1.10.
The mode, TEM01*, also known as the “bagel” or “doughnut” mode, is
considered to be a superposition of the Hermite-Gaussian TEM10 and TEM01 modes, locked in phase and space quadrature.
In real-world lasers, the Hermite-Gaussian modes predominate since strain, slight misalignment, or contamination on the optics tends to drive the system toward rectangular coordinates. Nonetheless, the Laguerre-Gaussian TEM10 “target” or “bulls-eye” mode is clearly observed in well-aligned gas-ion and helium neon lasers with the appropriate limiting apertures.
Figure 1.9 Low-order Hermite-Gaussian resonator modes

20 Chapter 1
Figure 1.10 Low-order axisymmetric resonator modes The transverse modes for a given stable resonator have different beam
diameters and divergences. The lower the order of the mode is, the smaller the beam diameter, the narrower the far-field divergence, and the lower the M2 value. For example, the TEM01
* doughnut mode is approximately 1.5 times the diameter of the fundamental TEM00 mode, and the Laguerre TEM10 target mode is twice the diameter of the TEM00 mode. The theoretical M2 values for the TEM00, TEM01
*, and TEM10 modes are 1.0, 2.3, and 3.6, respectively. Because of its smooth intensity profile, low divergence, and ability to be focused to a diffraction-limited spot, it is usually desirable to operate in the lowest-order mode possible, TEM00. Lasers, however, tend to operate at the highest-order mode possible, either in addition to, or instead of, TEM00 because the larger beam diameter may allow them to extract more energy from the lasing medium.
The primary method for reducing the order of the lasing mode is to add sufficient loss to the higher-order modes so that they cannot oscillate without significantly increasing the losses at the desired lower-order mode. In most lasers this is accomplished by placing a fixed or variable aperture inside the laser cavity. Because of the significant differences in beam diameter, the aperture can cause significant diffraction losses for the higher-order modes without impacting the lower-order modes. As an example, consider the case of a typical argon-ion laser with a long-radius cavity and a variable mode-selecting aperture.

Chapter 1 21 When the aperture is fully open, the laser oscillates in the axially
symmetric TEM10 target mode. As the aperture is slowly reduced, the output changes smoothly to the TEM01
* doughnut mode, and finally to the TEM00 fundamental mode. In many lasers, the limiting aperture is provided by the geometry of the laser itself. For example, by designing the cavity of a helium neon laser so that the diameter of the fundamental mode at the end of the laser bore is approximately 60 percent of the bore diameter, the laser will naturally operate in the TEM00 mode.
1.4 Laser properties related to applications
1.4.1 Collimation
Collimated light is light in which all of the light rays or waves are
traveling in a specific direction and hence they are all parallel to each other. Lasers produce the most collimated light of any type of light source. Such collimated light is used for reference beams in construction, leveling and grading land, alignment of pipe such as sewer pipe, and sending light over long distances without suffering significant divergence, and in laser pointers. Producing the most collimated light, in other words the least divergent light, is determined by the cavity mirror properties including the radii of curvature of the mirrors and the separation between mirrors as indicated in equations (1.7), (1.8), and (1.11). For the smallest beam divergence, w0 must be large, as you can see from equation (1.11). Also, the rays of the laser beam are the most parallel when the beam is at the location of the minimum beam waist w0 as described in equations (1.8), (1.18), and (1.19).
1.4.2 Monochromaticity
Monochromaticity refers to how pure in color (frequency or
wavelength) the laser beam is or, in other words, how narrow the laser

22 Chapter 1 beam frequency bandwidth is. If the laser is operating in a single longitudinal mode actual laser linewidth can be significantly narrower, the width of a single longitudinal mode beam. For most applications requiring a single narrow wavelength, most lasers would normally provide a sufficiently narrow frequency output bandwidth, of the order of 109–1011 Hz. This would represent a bandwidth that is less than 0.1% of the frequency or wavelength of the beam itself (or even smaller in most instances). However, in some applications, such as in remote sensing or in establishing a new frequency standard, a much narrower linewidth is required. Linewidths of the order of 1 MHz (106 Hz) or less can be obtained by operating with a single longitudinal and single transverse mode (TEM00). The narrowing is enhanced by choosing highly reflecting mirrors, constructing a very stable mirror cavity in conjunction with the amplifier by eliminating vibrations of the mirrors and other cavity elements, and providing temperature stability.
1.4.3 Coherence
Coherence refers to the how much in step or in phase various portions
of a single laser beam are. The closeness in phase of various portions of the laser frequency bandwidth is referred to as temporal or longitudinal coherence. The closeness in phase of different spatial portions of the beam after the beam has propagated a certain distance is referred to as spatial or transverse coherence. This phased relationship determines how readily the various portions of the beam can interfere with each other, after the beam has propagated a specific distance, to produce such effects as diffraction (bending) of light and related applications such as holography. Typically, applications involve dividing the beam into two or more beams that travel different lengths or pathways and are then recombined. When they are recombined they will interfere with each other, producing the desired effect if those parts are still in phase (coherent); if they are no longer in phase, the effect will not occur. The coherence length is used to describe the beam propagation distance over

Chapter 1 23
which the beams stay in phase. For longitudinal or temporal coherence, the coherence length lC is related to the wavelength λ and the total frequency bandwidth of the laser ΔνL by
𝑙𝐶 =𝜆2
∆𝜆 (1.20)
Δλ is the actual bandwidth of the laser beam given in wavelength units.
For transverse or spatial coherence, the transverse coherence length lt is related to the laser wavelength λ, the laser source diameter at its origin s, and the distance r the beam has propagated from its origin, by the following relationship.
𝑙𝑟 =𝑟𝜆𝑠
(1.21)
1.4.4 Intensity or Irradiance
Intensity or irradiance is the power of the laser beam divided by the
cross-sectional area of the beam. It is thus typically given in watts per square centimeter (W/cm2). It is a measure of the amount of energy that can be applied to a specific region within a given amount of time. It is one of the two most important parameters in using the laser for materials processing applications such as welding, cutting, heat treating, ablating, and drilling, or for laser surgery. The other important parameter is the laser wavelength, since the amount of absorption of all materials, including biological materials, is dependent upon the wavelength of the light. In some instances a deep penetration of the beam is desired, for example in doing processes that must be carried out quickly. In that situation, a laser wavelength in which the material has a relatively low absorption would be selected. Other applications might require a shallow penetration in order to control the quality of the edge to be left after the process is completed, such as in some surgical processes or in drilling
24 Chapter 1 very small holes. Thus, a wavelength region of high absorption would be chosen for the laser. A general rule is that absorption is very high for most materials at ultraviolet wavelengths and decreasing at longer wavelengths. However, this does not hold true for all materials or for all wavelengths. Many materials have high absorption peaks at specific wavelengths that could occur anywhere in the spectrum, so one must be careful to obtain the absorption versus wavelength curves for the desired material before choosing the specific laser.
Radiance is a parameter that includes the beam intensity (W/cm2) and takes into account the beam divergence angle. The divergence angle is generally given in steradians, which is a three-dimensional angular measurement as opposed to the term degrees, which describes angular spread in only two dimensions (in a plane). A complete sphere contains 4π steradians. Hence, radiance is given in units of watts per unit area per unit solid angle or (W/cm2-sr). Laser beam divergence is usually given in milliradians (mr) because of the very low divergence of most lasers. The approximate beam divergence in radians can be obtained by measuring the laser beam diameter at a specific, relatively long distance from the laser and dividing it by the square of the distance to where the measurement is made.
Radiance becomes useful when a beam must be propagated over a reasonable distance before it is used or where the divergence can affect the focusing ability of the beam. Since most materials applications do not involve the tightest focusing possible for a given beam, intensity is usually the more important parameter.
1.4.5 Focusability
Many applications of lasers involve their ability to be focused to a very
small spot size. Perhaps one of the most demanding applications is in focusing the small diode laser in a compact disk player. To store as much information as possible on each disk, that information must be included in the smallest grooves possible on the disk. The width of the grooves is

Chapter 1 25
determined by the ability of a laser beam to access a single groove without overlapping into adjacent grooves. Hence, the diameter of the spot size to which the laser beam can be focused becomes a very important parameter.
The smallest diameter that can be obtained with a focused laser, assuming that a single TEM00 mode can be obtained from the laser, is approximately the dimension of the wavelength of the laser and is given by the following expression
𝑑𝑚𝑖𝑛 ≅4𝜆 � 𝑓𝑑𝑙
�
𝜋 (1.22)
in which the f/dl is the focal length of the lens used for the focusing
divided by the useful diameter of the lens, the same notation as on camera lenses. If the laser beam is less than the actual lens diameter, the beam diameter is used instead of the lens diameter in determining the f/dl. In other words, a laser operating in the visible spectral region with a wavelength of the order of 500 nm could be focused to a size of less than one hundredth the width of a human hair! The effective f/dl focusing lens (ratio of focal length to laser beam diameter intercepted by the lens) must be of the order of unity to obtain such a small focus. Most lasers, however, can be focused relatively easily to spot diameters of the order of 0.1–0.2 mm. Extra care must be taken in terms of beam quality (mode quality) and lens focal length to obtain smaller spot diameters.
1.5 Type of Lasers
Since the discovery of the laser, literally thousands of types of lasers
have been discovered. However, only a relative few of these lasers have found broadly based, practical applications.
Lasers can be broadly classified into four categories: gas discharge lasers, semiconductor diode lasers, optically pumped lasers, and “other,” a category which includes chemical lasers, gas-dynamics lasers, x-ray
26 Chapter 1 lasers, combustion lasers, and others developed primarily for military applications. These lasers are not discussed further here.
1.5.1 Gas Discharge Laser
In principle, gas-discharge lasers are inherently simple—fill a container
with gas, put some mirrors around it, and strike a discharge. In practice, they are much more complex because the gas mix, discharge parameters, and container configuration must be specifically and carefully designed to create the proper conditions for a population inversion. Furthermore, careful consideration must be given to how the discharge will react with its container and with the laser optics. Finally, since the temperature of the gas can affect the discharge conditions, questions of cooling must be addressed.
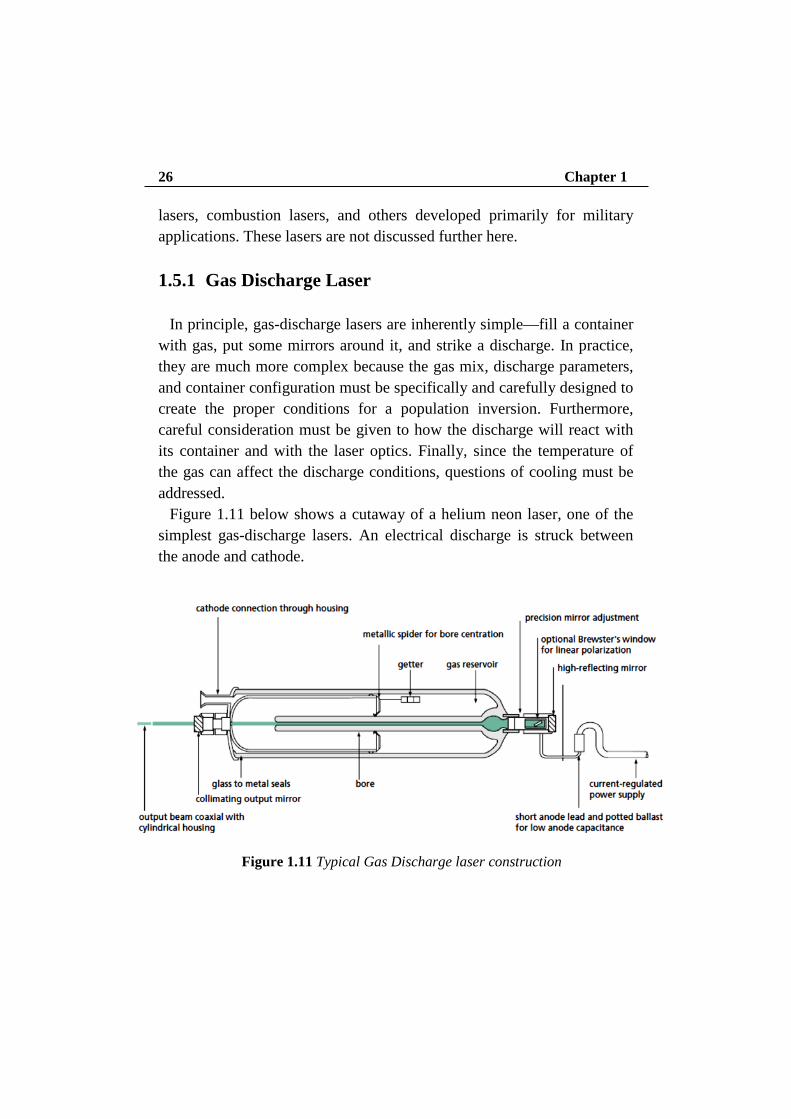
Figure 1.11 below shows a cutaway of a helium neon laser, one of the simplest gas-discharge lasers. An electrical discharge is struck between the anode and cathode.
Figure 1.11 Typical Gas Discharge laser construction

Chapter 1 27 The most common types of gas-discharge lasers are helium neon lasers,
helium cadmium lasers (a metal-vapor laser), noble-gas ion lasers (argon, krypton), carbon-dioxide lasers, and the excimer-laser family. Each of these will be discussed briefly below.
• Helium Neon Lasers
The helium-neon laser (HeNe) was the first gas laser. The most widely used laser wavelength is the red wavelength (632.8 nm) with a cw power output ranging from 1 to 100 mW and laser lengths varying from 10 to 100 cm. HeNe lasers can also be operated at the 543.5 nm green wavelength and several infrared wavelengths. Initiation of a relatively low electrical current through a low-pressure gas discharge tube containing a mixture of helium and neon gases produces the population inversion. With this gas mixture, helium metastable atoms are first excited by electron collisions with helium ground-state atoms. This energy is then transferred to the desired neon excited energy levels, thereby producing the required population inversion with lower-lying helium energy levels.
• Helium Caldium Lasers
Helium cadmium (HeCd) lasers are, in many respects, similar to the HeNe laser with the exception that cadmium metal, the lasing medium, is solid at room temperature. The HeCd laser is a relatively economical, cw source for violet (442 nm) and ultraviolet (325 nm) output. Because of its excellent wavelength match to photopolymer and film sensitivity ranges, it is used extensively for three-dimensional stereolithography and holographic applications.
As mentioned above, cadmium, a metal, is solid at room temperature. For lasing to occur, the metal must be evaporated from a reservoir, and then the vapor must be distributed uniformly down the laser bore. This is accomplished through a process called electrophoresis. Because cadmium will plate out on a cool surface, extreme care must be taken in the design of the laser to contain the cadmium and to protect the optics and windows from contamination, since even a slight film will introduce sufficient

28 Chapter 1 losses to stop lasing. The end of life usually occurs when cadmium is depleted from its reservoir.
• Noble-Gas ion Lasers
The argon ion laser and the krypton ion laser provide a wide range of visible and ultraviolet laser wavelengths. They produce cw output at wavelengths ranging from 275 to 686 nm and powers of up to tens of watts. Running a dc current through a long, narrow-bore plasma discharge tube filled with a low-pressure (0.1 torr) argon or krypton gas produces the population inversion. The argon atoms must be ionized to the first through third ionization stages to reach the appropriate energy levels for laser action. As a result, these lasers are relatively inefficient but still extremely useful for certain applications because of their short wavelengths.
• Carbon Dioxide Lasers
Because of their ability to produce very high power with relative efficiency, carbon dioxide (CO2) lasers are used primarily for materials-processing applications. The standard output of these lasers is at 10.6 μm, and output power can range from less than 1W to more than 10 kW.
Unlike atomic lasers, CO2 lasers work with molecular transitions (vibrational and rotational states) which lie at low enough energy levels that they can be populated thermally, and an increase in the gas temperature, caused by the discharge, will cause a decrease in the inversion level, reducing output power. To counter this effect, high-power cw CO2 lasers use flowing gas technology to remove hot gas from the discharge region and replace it with cooled (or cooler) gas. With pulsed CO2 lasers that use transverse excitation, the problem is even more severe, because, until the heated gas between the electrodes is cooled, a new discharge pulse cannot form properly.
A variety of types of CO2 lasers are available. High-power pulsed and cw lasers typically use a transverse gas flow with fans which move the gas through a laminar-flow discharge region, into a cooling region, and

Chapter 1 29
back again. Low-power lasers most often use waveguide structures, coupled with radio-frequency excitation, to produce small, compact systems.
• Noble-Gas ion Lasers
The term excimer or “excited dimer” refers to a molecular complex of two atoms which is stable (bound) only in an electronically excited state. These lasers, which are available only as pulsed lasers, produce intense output in the ultraviolet and deep ultraviolet. The lasers in this family are XeFl (351 nm), XeCl (308 nm), KrF (248 nm), KrCl (222 nm), ArF (193 nm), and F2 (157 nm). They are used extensively in photolithography, micromachining, and medical (refractive eye surgery) applications.
At first glance, the construction of an excimer laser is very similar to that of a transverse-flow, pulsed CO2 laser. However, the major difference is that the gases in the system are extremely corrosive and great care must be taken in the selection and passivation of materials to minimize their corrosive effects. A system built for CO2 would fail in minutes, if not seconds.
The principal advantage of an excimer laser is its very short wavelength. The excimer output beam can be focused to a spot diameter that is approximately 40 times smaller than the CO2 laser beam with the same beam quality. Furthermore, whereas the long CO2wavelength removes material thermally via evaporation (boiling off material), the excimer lasers with wavelengths near 200 nm remove material via ablation (breaking molecules apart), without any thermal damage to the surrounding material.
1.5.2 Semiconductor Diode Lasers
The means of generating optical gain in a diode laser, the recombination
of injected holes and electrons (and consequent emission of photons) in a forward-biased semiconductor pn junction, represents the direct conversion of electricity to light. This is a very efficient process, and

30 Chapter 1 practical diode laser devices reach a 50-percent electrical-to-optical power conversion rate, at least an order of magnitude larger than most other lasers.
In addition to a means to create optical gain, a laser requires a feedback mechanism, a pair of mirrors to repeatedly circulate the light through the gain medium to build up the resulting beam by stimulated emission. The stripe structures needed to make a laser diode chip are formed on a single crystal wafer using the standard photolithographic patterning techniques of the semiconductor industry. The substrate crystal axes are first oriented relative to the patterning such that, after fabrication, a natural cleavage plane is normal to the stripe direction, and cleaving both ends of the chip provides a pair of plane, aligned crystal surfaces that act as a Fabry-Perot resonator for optical feedback. These mirrors use either the Fresnel reflectivity of the facet (often sufficient because of the high gain of diode lasers), or they can be dielectric coated to other reflectivities. This might be desired, for instance, to protect against damage from the high irradiance at the facets. This geometry gives the familiar edge-emitting diode laser (see Figure 1.12).
Figure 1.12 Schematic of a double hetero structure index-guide diode laser

Chapter 1 31 The semiconductor crystal must be defect free to avoid scattering of
carriers and of light. To grow crystal layers without defects, commercial semiconductor lasers use III-V compounds, elements taken from those columns of the periodic table. These form varying alloys with the addition of dopants that can be lattice-matched to each other and to the initial crystal substrate. The band gap of the semiconductor chosen determines the lasing wavelength region. There are three main families: GaN-based lasers with UV-blue outputs, GaAs-based lasers with red-near infrared outputs, and InP-based lasers with infrared outputs. These base crystals are precisely doped with Ga, Al, In, As, and P to precisely control the band gap and index of refraction of the layers in the diode structure.
These compounds are direct band-gap semiconductors with efficient recombination of injected holes and electrons because no phonons (lattice vibrations) are required to conserve momentum in the recombination interaction. The injection layers surrounding the junction, the cladding layers, can be indirect band-gap semiconductors (where phonons are involved).
To make a planar waveguide that concentrates the light in the junction region (confinement between the top and bottom horizontal planes of the active region in Figure 1.12), the cladding layers are made of an alloy of lower refractive index (larger band gap) than the active junction region. This is then termed a double-heterostructure (DH) laser. The output power of the laser is horizontally polarized because the reflectivity of the planar waveguide is higher for the polarization direction parallel to the junction plane. Because the junction region is thin for efficient recombination (typically 0.1 μm), some light spreads into the cladding layers which are therefore made relatively thick (typically 1 μm) for adequate light confinement.
1.5.3 Optically Pumped Lasers
Optically pumped lasers use photons of light to directly pump the lasing
medium to the upper energy levels. The very first laser, based on a

32 Chapter 1 synthetic ruby crystal, was optically pumped. Optically pumped lasers can be separated into two broad categories: lamp-pumped and laser pumped. In a lamp-pumped laser, the lasing medium, usually a solid-state crystal, is placed near a high-intensity lamp and the two are surrounded by an elliptical reflector that focuses the light from the lamp into the crystal, as shown in Figure 1.13. In laser-pumped systems, the light from another laser is focused into a crystal (or a stream of dye), as shown in Figure 1.14.
Figure 1.13 Schematic of a lamp-pumped laser
Figure 1.14 Schematic of a laser-pumped laser

Chapter 1 33 In general, ignoring the efficiency of the pump laser itself, laser
pumping is a much more efficient mechanism than lamp pumping because the wavelength of the pump laser can be closely matched to specific absorption bands of the lasing medium, whereas most of the light from a broad-spectrum lamp is not usefully absorbed in the gain medium and merely results in heat that must be removed from the system. Furthermore, the size of the laser pump beam can be tightly controlled, serving as a gain aperture for improving the output mode characteristics of the pumped laser medium. On the other hand, laser pumping is often not suitable for high-energy applications where large laser crystals are required.
Diode-pumped solid-state (DPSS) lasers, a class of laser-pumped lasers, will be discussed in detail below.
1.5.4 Diode Pumped a Staid Solid Lasers
• The DPSS Laser revolution
The optical difficulties encountered with diode lasers—difficulty in coupling to the high divergence light, poor mode quality in the slow axis of wide-stripe lasers, low output power from single-transverse-mode lasers— led to a new philosophy about how best to use these efficient, long-lived, compact light sources.
The logic is simple. The primary light source (the diode laser) pumps another laser (an infrared crystal laser) to convert to a good mode, the beam of which is wavelength converted (by nonlinear optics techniques) to a visible output. The diode laser source replaces the discharge lamp for optically pumping the gain crystal in a traditional, high-efficiency, infrared laser. The infrared beam is generated in that independent resonator with a good mode, and consequently it can be efficiently converted with an intracavity nonlinear crystal to a visible beam with a good mode. Though power is lost at each step, the result is still a single-mode visible beam generated with a total electrical-to-optical conversion

34 Chapter 1 efficiency of several percent. These DPSS lasers are replacing the older visible gas lasers whose conversion efficiencies rarely reach 0.1 percent.
• End- and side-pumping geometries
The first DPSS lasers were made by focusing the diode light from a single laser diode emitter through the high-reflector coating (at 1.06 μm) on the end of the Nd:YAG rod. This “end-pumping” geometry provide good overlap between the pumped volume and the lasing volume, but it limited the pump power to that available from single-mode diode emitters.
In order to increase laser output and reduce cost (diode lasers suitable for end pumping are twice as expensive as diode laser arrays), diode arrays were mounted along the length of the laser rod.However, because of poor overlap of the pump beam with the 1.06 μm beam, the efficiency of this “side-pumping” technique was only half that of end-pumping geometries. No pump diode cost savings resulted.
Then in the late 1980s two advances were made. First, a variety of new laser rod materials, better tailored to take advantage of diode laser pumps, were introduced. Nd:YVO4 crystals have five times the gain cross section of Nd:YAG, and the Nd can be doped into this crystal at much higher concentrations. This decreases the absorption depths in the crystal from cm to mm, easing the collimation or focusing quality required of the pump beam. This crystal had been known, but could be grown only to small dimensions, which is acceptable for diode-pumped crystals. Another crystal introduced was Yb:YAG, pumped at 980 nm and lasing at 1.03 μm—leaving very little residual heat in the crystal per optical pumping cycle and allowing small chips of this material to be pumped at high levels.
Second, means were devised to make micro-cylindrical lenses (focal lengths less than a mm) with the correct surfaces (one type is a hyperbolic profile) for collimating or reducing the fast-axis divergence of the diode laser output. With good tooling and beam characterization these are correctly positioned in the diode beam and bonded in place to the diode

Chapter 1 35
housing. This allows more conventional lenses, of smaller numerical aperture, to be used in subsequent pump light manipulations.
• End-pumping with bars
With these two new degrees of freedom, laser designers realized they could create optical trains that would give them end-pumping system efficiencies (achieve good overlap between pump and lasing modes) with diode arrays as pump sources to obtain a lower diode cost per watt in their systems. This produced an explosion of unique DPSS laser designs generically described as “end-pumping with bars.”
Although the circular spot is large, its focal image, formed with high numerical aperture (NA) optics, is small enough to satisfactorily overlap the IR cavity laser mode. The small depth of focus, from the high NA optics, is inconsequential here because of the short absorption depth in the Nd:YVO4 laser crystal. The laser head can be disconnected from the diode modules at the fiber coupler without loss of alignment.
1.6 Disk Laser
1.6.1 The thin Disk Laser principles (Multipass Pumping)
The core concept of the thin-disk laser principle is the usage of a thin,
disk-shaped active medium that is cooled through one of the flat faces; simultaneously, the cooled face is used as folding or end mirror of the resonator. This face cooling minimizes the transversal temperature gradient and the phase distortions transversal to the direction of the beam propagation. This, in fact, is the basis of one of the outstanding features of the thin-disk laser: the excellent beam quality.
Figures 1.15 shows the principle of the thin-disk laser design. The laser crystal has a diameter of several millimeters (depending on the output power/energy) and a thickness of 100–200 μm depending on the laser-

36 Chapter 1 active material, the doping concentration, and the pump design (Figure 2.2).
Figure 1.15 Thin-disk laser design
The disk is highly reflective coated on its backside for both the laser and
the pump wavelengths and antireflective coated on the front side for both wavelengths. This disk is mounted with its backside on a water cooled heat sink using indium–tin or gold–tin solder. This technique allows a very stiff fixation of the disk on the heat sink without deformation of the disk. To reduce the stress during and after the soldering process, as much as possible, the heat sink is made from a heat expansion matched material (Cu–W). The heat sink is water cooled by impingement cooling using several nozzles inside the heat sink.
The crystal can be pumped in a quasi-end-pumped scheme. In this case, the pump beam hits the crystal under an oblique angle. Depending on the thickness and the doping level of the crystal, only a small fraction of the pump radiation is absorbed in the laser disk. Most of the incident pump power leaves the crystal after being reflected at the backside. By successive redirecting and imaging of this part of the pump power again onto the laser disk, the absorption can be increased.
A very elegant way to increase the number of pump beam passes through the disk is shown in Figure 1.16 The radiation of the laser diodes for pumping the disk is first homogenized either by fiber coupling of the pump radiation or by focusing the pump radiation into a quartz rod. The

Chapter 1 37
end of either the fiber or the quartz rod is the source of the pump radiation, which is imaged onto the disk using the collimating lens and the parabolic mirror.
Figure 1.16 Pump design of the thin-disk laser
In this way, a very homogeneous pump profile with the appropriate
power density in the disk can be achieved which is necessary for good beam quality. The unabsorbed part of the pump radiation is collimated again at the opposite side of the parabolic mirror. This beam is redirected using two mirrors to another part of the parabolic mirror where the pump beam is focused again onto the disk, this time from another direction. This reimaging can be repeated until all the (virtual) positions of the parabolic mirror have been used. At the end, the pump beam is edirected back to the source, thereby doubling the number of pump beam passes through the disk. In this way, up to 32 passes of the pump radiation through the disk have been realized and more than 90% of the pump power is absorbed in the disk.
Using multiple pump beam passes through the disk results in a thinner disk and/or a lower doping concentration, thus reducing the thermal effects like thermal lensing and stress in the disk. Another advantage is

38 Chapter 1 that the effective pump power density is increased (nearly four times for 16 pump beam passes) so that, on the one hand, the demands to the power density (beam quality) of the pump diodes are reduced and, on the other hand, quasi-three-level laser materials (e.g., ytterbium doped) can also be used with this design.
1.6.2 Minimal thermal lensing effect
Due to the small thickness of the disk ( 100–200 μm), the temperature
rise associated with the dissipated power is small. (It is not relevant that the density of heat generation is rather high, because the heat is generated very close to the heat sink.) In addition, the temperature gradients are dominantly in a direction perpendicular to the disk surface (Figure 1.17) and thus cause only weak thermal lensing and depolarization loss. This allows for operation with very high beam quality due to the weak thermal beam distortions, and stable operation can be achieved over a wide range of pump powers.
Figure 1.17 Difference temperature gradients between rod and disk
geometry As mentioned earlier, the temperature gradients inside the laser crystal
are mainly coaxial to the disk axis and the laser beam axis due to this mounting and cooling technique. The temperature in the radial direction is

Chapter 1 39
nearly uniform within the homogeneously pumped central area of the disk. Therefore, these temperature gradients only slightly influence the laser beam propagation through the disk. All the thermal lens effects and aspherical parts of the profile of the index of refraction are reduced by more than one order of magnitude compared to rod laser systems. The stress-induced birefringence is even more reduced and can be neglected for real laser systems. Additionally, due to the large surface-to-volume ratio, the heat dissipation from the disk into the heat sink is very efficient thus allowing the operation at extremely high volume power densities in the disk (up to 1 MW/cm3 absorbed pump power density).
1.6.3 Scaling power regulation
Very high laser output power can be achieved from one single disk, by
increasing the pump spot diameter while keeping the pump power density constant. Figure 1.18 shows the laser results (power and optical efficiency) from an Yb:YAG disk that has been pumped up to the same level of pump power density (about 4 kW/cm2) but with different pump spot diameters between 1.2 and 6 mm.
Figure 1.18 Laser results for different pump spot diameters (Yb:YAG,
doping 9 at.%, 16 pump beam passes).
40 Chapter 1
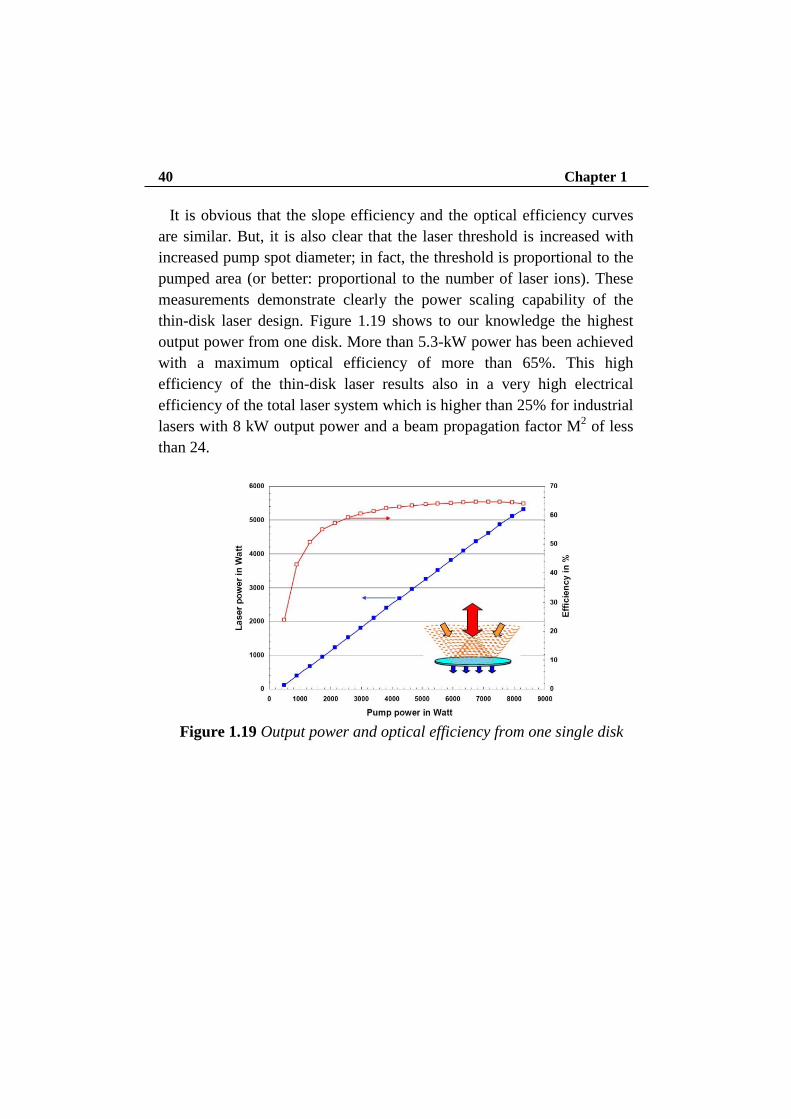
It is obvious that the slope efficiency and the optical efficiency curves are similar. But, it is also clear that the laser threshold is increased with increased pump spot diameter; in fact, the threshold is proportional to the pumped area (or better: proportional to the number of laser ions). These measurements demonstrate clearly the power scaling capability of the thin-disk laser design. Figure 1.19 shows to our knowledge the highest output power from one disk. More than 5.3-kW power has been achieved with a maximum optical efficiency of more than 65%. This high efficiency of the thin-disk laser results also in a very high electrical efficiency of the total laser system which is higher than 25% for industrial lasers with 8 kW output power and a beam propagation factor M2 of less than 24.
Figure 1.19 Output power and optical efficiency from one single disk

Chapter 2 Laser Welding
2.1 Introduction The focused laser beam is one of the highest power density sources
available to industry today. It is similar in power density to an electron beam. Together these two processes represent part of the new technology of high-energy-density processing.
At these high power densities all materials will evaporate if the energy can be absorbed. Thus, when welding in this way a hole is usually formed by evaporation. This "hole" is then traversed through the material with the molten walls sealing up behind it. The result is what is known as a "keyhole" weld. This is characterized by its parallel sided fusion zone and narrow width. Since the weld is rarely wide compared to the penetration it can be seen that the energy is being used where it is needed in melting the interface to be joined and not most of the surrounding area as well. A term to define this concept of efficiency is known as the "joining efficiency”. The joining efficiency is not a true efficiency in that it has units of (mm2 joined/kJ supplied). It is defined as (V t / P), where V is the traverse speed (mm/s), t is the thickness welded (mm) and P is the incident power (kW). Table 2.1 gives some typical values of the joining efficiency of various welding processes.
The higher the value of the joining efficiency the less energy is spent in unnecessary heating - that is generating a heat affected zone (HAZ) or distortion. Resistance welding is by far the best in this respect because the energy is mainly generated at the high-resistance interface to be welded. However, it can be seen that the electron beam and laser are again in a class by themselves.

42 Chapter 2
The main characteristics of the laser to bear in mind are listed in Table 2.2.
Table 2.1 Relative joining efficiencies of different welding process
Process Approximate joining efficiency (mm2/kJ)
Oxy acetylene flame 0.2-0.5
Manual metal arc (MMA) 2-3
Tungsten Inert Gas (TIG) 0.8-2
Submerged arc welding (SAW) 4-10
High frequency resistance welding 65-100
Electron Beam (EB) 20-30
Laser 15-25
Table 2.2 Relative joining efficiencies of different welding process
Characteristic Comment
High energy density—"Keyhole” type weld Laser distortion
High processing speed Cost effective (if fully employed)
Rapid start/stop Unlike arc processes
Welds at atmospheric pressure Unlike EB welding
No X-rays generated Unlike EB
No filler required (autogenous weld) N0 flux cleaning
Narrow weld Less distortion
Relatively little HAZ Can weld near heat sensitive materials
Very accurate welding possible Can weld thin to thick materials
Good weld bead profile No clean up necessary
No beam wander in magnetic field Unlike EB
Little or no contamination Depends only on gas shrouding Relatively little evaporation loss of volatile
components
Difficult materials can sometimes be welded
Relatively easy to automate General feature of laser processing
Laser can be time shared General feature of laser processing
Chapter 2 43 It can be seen from these tables that the laser has something special to
offer as a high-speed, high-quality welding tool. Developments of laser welding have opened up the applications zone to
thicker section welding, as well as the thinner micro-welding.
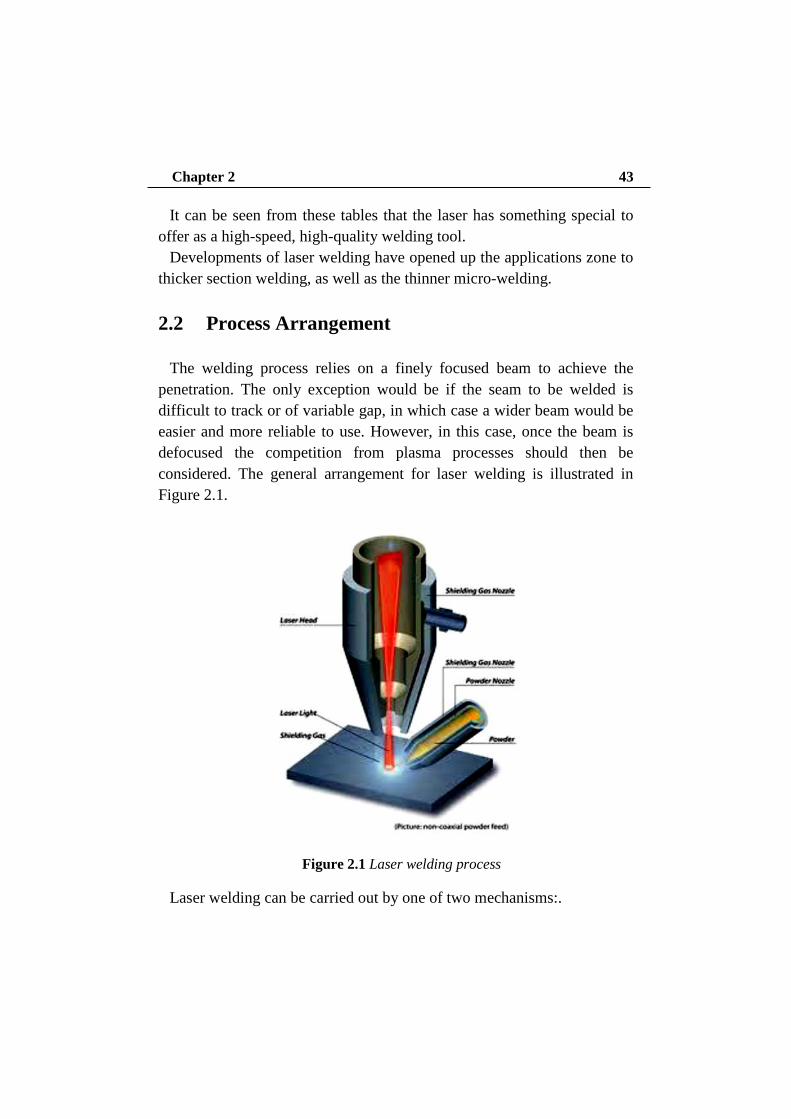
2.2 Process Arrangement The welding process relies on a finely focused beam to achieve the
penetration. The only exception would be if the seam to be welded is difficult to track or of variable gap, in which case a wider beam would be easier and more reliable to use. However, in this case, once the beam is defocused the competition from plasma processes should then be considered. The general arrangement for laser welding is illustrated in Figure 2.1.
Figure 2.1 Laser welding process
Laser welding can be carried out by one of two mechanisms:.

44 Chapter 2
• Conduction limited welding, where the laser acts like a point source of energy moving across the surface of the sheet. Welds performed by this process are roughly semi—circular in cross section.
• Keyhole welding, where the lasers acts as a line source of energy penetrating into the body of the material. This line source travels across the sheet producing welds which are narrow and deep.
2.2.1 Conduction limited welding
Conduction limited welding occurs when the power density of the laser
spot is limited. The welding method is similar to the traditional one. The laser beam heats the material until it reaches its melting point; thus generating a pool of molten material that because of the relative motion between the work-piece and the beam, apparently moves with the beam.
Figure 2.2 Conduction limited welding
The principle of conduction limited welding is simple. The laser beam irradiates the material surface and heat is conducted radially away from the laser—material interaction zone. The molten pool thus established has a semicircular type cross section as shown in Figure 2.2.

Chapter 2 45
2.2.2 Deep penetration “keyhole” welding When deep penetration keyhole welds are produced the laser acts as a
line source of energy throughout the depth of the material rather than a point source acting from the top surface only. This line source welding mechanism is made possible by the generation of a keyhole which penetrates into the material.
The keyhole takes the form of a narrow, deep, vapor filled cavity surrounded by molten metal. As this zone is traversed across a metal sheet the liquid metal flows around the cavity and solidifies behind it. The keyhole is produced only at high power densities (≥106W/cm2) by the following mechanism: Initially a conduction limited weld pool similar to that shown in Figure 2.2 is produced. At high power densities a dimple is formed in the centre of this melt pool as a result of vaporization of the melt and thermo-capillary or Marangoni stiring. This stirring action is driven by surface tension gradients in the melt which result from the severe thermal gradients (the melt is boiling in the centre and only just melting at the edges which are only a millimetre or so away).
Figure 2.3 Keyhole formation
The stirring action drives liquid away from the centre of the melt and thus a centre dimple is formed see Figure 2.3 (a). The dimple absorbs the

46 Chapter 2 incident beam more efficiently than the previously undim-pled melt surface. This increased absorption results in more central boiling and accelerated Marangoni flow both of which act to deepen the central dimple until a keyhole is formed see Figure 2.3 (b). The superheated, partially ionized vapour which fills and covers the keyhole is called plasma and has an important part to play in how the laser energy is transferred to the work piece.
The plasma associated with the keyhole, absorbs a proportion of the laser light. The light which is absorbed by the plasma cloud above the keyhole is re-radiated in all directions and only a portion of it reaches the work piece surface. Energy which is absorbed by the plasma inside the keyhole is eventually re-radiated and conducted into the keyhole sides assisting the melting process. The majority of the laser energy is absorbed directly by the walls of the keyhole as a result of the Fresnel absorption.
Figure 2.4 Schematic of the deep laser welding
Fresnel absorption always involves a certain amount of reflection of the incident laser beam. The reflected beam continues to propagate into the

Chapter 2 47
keyhole by multiple reflections at the keyhole wall (Figure 2.4). During each reflection of the laser beam, laser power is partly absorbed by the keyhole wall and partly by the keyhole plasma. The remaining laser power which is not absorbed by the plasma or by Fresnel absorption is reflected out of the keyhole and is lost to the welding process.
2.2.2 Deep penetration “keyhole” welding
The two modes of laser welding are different because in key-hole
welding the vaporization of material occurs, which is almost not existent in conduction welding. Since vaporization is a threshold process, as it occurs above a certain temperature, even the passage from one mechanism to another does not take place continuously, but at a certain value of power density, which means that above this threshold value the key-hole occurs (Figure 2.5).
Figure 2.5 Conduction/Key-hole transition to vary irradiance

48 Chapter 2
Consider as an example a butt welding between two steel plates of equal thickness and imagine performing different tests increasing irradiance (obtained by increasing the power of the beam or reducing the spot). For low values of irradiance the welding mechanism is by conduction, and then the geometry of the generated bead is almost semi-circular shape with an unitary aspect ratio. Increasing power density, the size of the bead increases because of higher power entering the work-piece while the aspect ratio remains unchanged.
Further increasing the power density and sudden increase in the depth of penetration occurs without there being a similar increase in width and then the mechanism that is established is a key-hole welding and the aspect ratio deviates substantially from the unit value. The threshold of irradiance between conduction and key-hole depends primarily on the material and for steel is about 106 W/cm2. Furthermore, the threshold is almost independent of the welding speed, which affects the geometry of the bead because at lower speeds correspond beads of smaller dimensions.
2.3 Laser welding parameters
In laser welding, there are several factors that can affect the process,
acting on the final geometry, on defects and on properties of the joint. In the following sections, the most important and significant are described.
They are as follows: • Beam properties
power, polarization and wavelength • Transport properties
speed, focal position, joint geometries and gap tolerance • Shroud gas properties
composition, shroud design and pressure/velocity • Material properties
composition and surface condition

Chapter 2 49
2.3.1 Power There are two main problems in welding: lack of penetration or the
inverse. "drop out”. These are the boundaries for a good weld for a given power as illustrated in Figure 2.6. The maximum welding speed for a given thickness rises with increase in power. The fall-off shown at the higher power levels of 2 kW is almost certainly due to the poorer mode structure given by most lasers when working at their peak power.
Figure 2.6 Welding Speed versus Power for a titanium alloy However, from the results in Figure 2.7, for higher power levels up to 5
kW, the fall-off may now be due to the same cause and also plasma effects. The main point to note from these two graphs is that for more power the operating window is larger.

50 Chapter 2
Figure 2.7 Welding Speed versus Power for a titanium alloy For high speeds the effects of sideways conduction during melting are
slight hence the Bessel functions become soluble. That is:
𝑌 = 0.438 𝑋 (2.1) in which
𝑌 =2𝜈𝑅𝛼
𝑎𝑛𝑑 𝑋 =𝑃𝑘𝑔𝑇
(2.2)
where
2R= w= weld width [m] α= thermal diffusivity= k/ρCp [m2/s]
g= thickness [m] T= temperature [K]
P= power [W] Tm= melting point for width [K]
rf= reflectivity v= welding speed [m/s]
Thus we have

Chapter 2 51
0.483 𝑃 �𝐼 − 𝑟𝑓� = 𝑉𝑤𝑔𝜌𝐶𝑝𝑇𝑚 (2.3) This is a form of the lumped heat capacity model seen previously for
cutting. This simple model for the maximum welding speed has neglected latent heat. What it has calculated is that 51.7% (i.e. l - 0.483) of the delivered energy is lost to conduction outside the melting isotherm. A further 25% approximately will be used for latent heat effects and the resulting melting efficiency will be of the order of 23%, as observed. It has also been assumed that the power is distributed as a line source along the beam axis, the ultimate in line focusing. However, the parametric relationships are enshrined in this equation. Incidentally this formula would act as a useful rule of thumb to find out what welding speed should be possible for a given laser power, if very finely focused. It is more accurate if the constant is taken as 0.25 to 0.3.
Penetration is inversely proportional to the speed for a given mode, focal spot size and power, as shown in Figure 2.8
Figure 2.7 Welding speed versus penetration

52 Chapter 2
The extent of the heat affected zone (HAZ) is a function of the welding speed. As an estimate it could be assumed that the edge of the heat wave causing the HAZ is when the Fourier number = l.
Thus F=αt/x2=1
and hence
𝑥 = √𝛼𝑡 = �𝛼𝐷𝑣
where x= extent of the HAZ [m] α= thermal diffusivity of material being welded [m2/s] t= interaction time for conduction [s] D= effective beam diameter on weld pool [m] v= welding speed [m/s]
2.3.2 Polarisation At first sight one might think that polarisation will have no effect on
laser welding since the beam is absorbed inside a keyhole and hence it will be absorbed regardless of the plane of polarisation. Note this is quite unlike cutting where all the absorption had to take place on a steeply sloped cut front. This thought would be in essence correct but some second—order events have been noted Figure 2.8 shows the slight variation in penetration thought to be due to polarisation effects.
The resulting weld fusion zones are also wider for the case of s-polarisation (perpendicular to the plane of incidence) as expected since in this case the main absorption would be at the sides. The argument suggested for this phenomenon is that there are two absorption mechanisms. At slow speeds the plasma absorption dominates and the

Chapter 2 53
beam is absorbed by inverse bremsstrahlung effects in the keyhole generating a plasma which appears blue in argon shrouded systems. As
the speed increases, the Fresnel absorption (absorption by refiection on front face) gains in importance due to the cooler plasma being less absorbing. However, no polarisation effects were noted with aluminum. This is still a puzzle and throws some questions on the whole theory.
Figure 2.8 Influence of beam on polarization on welding performance
2.3.3 Wavelength Due to the high absorptivity within the "keyhole" there is little
operational difference when welding with long or short wavelengths. When welding with a conduction limited weld then the surface reflectivity becomes paramount and the lower reflectivity with the shorter wavelengths gives a distinct advantage to Excimer, YAG or CO lasers over the CO2 laser.

54 Chapter 2
However, there is another factor affecting absorption and that is the plasma formed due to the very hot gases coming from the keyhole. The plasma will have three effects.
• Firstly, the electrons in the plasma are free to absorb photons and hence the plasma is going to block the beam depending upon the electron density. i.e. the temperature.
• Secondly, the hot plasma will cause density changes and hence changes in refractive index which will disperse the beam - a hot ball will behave like a concave lens.
• Thirdly, there will be condensate and particles caught up in the fast moving plasma which will have associated scattering effects.
All of these events depend to some extent on the absorption which sustains the plasma. This is dominated by the inverse bremmstrahlung process. The absorption coefficient, αbremm, due to inverse bremmstrahlung
𝛼𝑏𝑟𝑒𝑚𝑚 ≈ 𝑛2𝜆2𝑇3 2⁄ (2.4)
where n is the gas density, A is the wavelength and Tis the absolute
temperature of the plasma. Thus for shorter wavelengths there will be less absorption and hence
cooler and less absorbing plasmas as found by Greses.4 This gives a significant advantage to shorter wavelength lasers for welding and other plasma generating processes. The penetration depth possible with a CO laser working at 5.4 μm is greater than that for CO2 simply because the CO laser can weld slower without suffering plasma blocking problems. The welding of volatile materials such as certain Mg alloys and Al alloys appears to have reduced porosity when welded with Nd:YAG radiation compared to CO2 radiation, and there is a reduced "nail head" to the weld ingot. Thus shorter wavelengths are not so sensitive to the ionization potential of the shroud gas - they can thus use cheaper gases.

Chapter 2 55
2.3.4 Focal Position Often in the key-hole welding it is better to position the focus below the
upper surface of the work-piece as it is the condition which allows to obtain the maximum penetration depth. It is however necessary that the irradiance on the upper surface is sufficient to enable the triggering of the key-hole.
In laser welding the maximum weldable thickness is closely related to the depth of focus of the beam. As already mentioned in the chapter 1, the depth of focus can be useful to compare different optical conditions. But to understand the real depth of focus, it is necessary to perform an experimental test.
This test is based on an evaluation of the trigger of key-hole on an inclined plane as shown in Figure 2.9. Whereas the inclination of the plane (θ) in respect to the normal to the beam and the distance between the point at which the key hole triggers (xin) and one in which defuses (xout) we can calculate the real depth of focus as follows
𝛥𝑧 = |𝑥𝑖𝑛 − 𝑥𝑜𝑢𝑡|𝑠𝑖𝑛𝜃 (2.5)
Figure 2.9 Test to find the field depth in which key-hole occurs

56 Chapter 2
2.3.5 Welding Speed The effect of speed on the welding process is principally described by
the overall heat balance equation noted in equation (2.3). However, in addition to these main effects there are some others. Firstly, there is the effect of speed on the weld bead and, secondly, there is the problem of shrouding high-speed welds.
Effect of Speed on the weld pool and weld bead shape As the speed increases so will the pool flow pattern and size change. At
slow speeds the pool is large and wide and may result in drop out, Figure 2.10 d. In this case the ferrostatic head is too large for the surface tension to keep the pool in place and so it drops out of the weld leaving a hole or depression.
Figure 2.10 Range of weld shapes varying usually with speed: a normal/good;
b undercut; c humping (longitudinal section); d drop out. At higher speeds, the strong flow towards the centre of the weld in the
wake of the keyhole has no time to redistribute and is hence frozen as an undercut at the sides of the weld, diagrammatically shown in Figure 2.10 b. If the power is high enough and the pool large enough then the same undercut proceeds and edge freezing occurs leaving a slight undercut, but the thread of the pool in the centre has a pressure which is a function of the surface tension and the curvature. This leads to pressure instability along the length of the pool causing the “pinch" effect in which those regions of high curvature flow to regions of lower curvature resulting in large humps, Figure 2.10 c. For γ the surface tension and r the radius of curvature, the pressure, p, in these regions would vary by
𝑝 = 𝛾 𝑟2⁄ (2.6)

Chapter 2 57 There is an intermediate region in which there is a partial undercutting
and central string. All this has been mapped for certain alloys as shown in Figure 2.11 a, b.
Figure 2.11 Map of weld bead profiles as functions of welding speed and laser power: a 0.12 mm thick stainless steel; b 0.12 and 0.25 mm thick mid steel.
Effect of speed on shroud arrangements The faster the welding process the shorter the weld pool. However, with
increased speed the hot metal extends further beyond the welding point. Thus trailing shrouds are usually needed to avoid atmospheric contamination.
2.3.6 Joint Geometries
Joint Arrangements Laser beams causing keyhole type welds prefer a joint which helps the
absorption and hence the formation of the keyhole. High-intensity welding processes are not sensitive to different thicknesses of the pieces to be joined. This allows some new types of joint to be considered. Figure 2.12 shows some of the variations which can be considered.

58 Chapter 2
Figure 2.12 Various welding joint arrangements. a butt joint; b fillet or lap joint; c spot or lap weld; d spike or spot weld; e flange joint; f edge joint;
g T-joint; h flare weld; i corner; j kissing or flare weld. The flare weld was used for very high-speed welding of two strips at
speeds up to 4 m/s, and is currently used for making seam welds in thick section pipe. The plane of polarisation must be correct in this mode of welding or the beam will be absorbed before being reflected down to the point of the joint. It is, of course, a very efficient joining technique. The “T” weld geometry has a surprise attached to it, in that as the keyhole

Chapter 2 59
penetrates at an angle into the work piece it tends to turn upwards to allow full penetration around the base of the T. This very convenient event is the result of the reduced thermal load on the T-side of the keyhole, which encourages the melting isotherm that way. For a fully restrained weld, as in welding a cylinder into a hole there is a tendency to crack if the weld is not fully penetrating due to the stress raiser from the unwelded root. This can be overcome by using more power or welding slower, or redesigning the joint so that it is not so deep.
Effect of Gap In butt joints the gap must be small enough that the beam cannot pass
straight through the joint; that is to suggest that the gap should be smaller than half the beam diameter (< 200 μm). For welds where there is a large gap the beam is sometimes rotated by rotating the lens off-axis from the beam. However, in these cases there is a chance of some drop out or an underfill in the weld. This can be corrected by adding filler material as a wire or as a powder. On the whole the welds do not require filler material, they are “autogenous”. One might question how this is possible when the conservation of mass suggests that if there is a gap there will be a fall in the level of the weld. In practice there is usually a rise in the level This is due to the stresses in the cooling weldment drawing the work pieces together and so squashing the melt pool. Thus small gap can tolerated without any filler.
2.3.7 Gas Shroud and Gas Pressure
Shroud Composition The gas shroud can affect the formation of plasma which may block or
distort the beam and thus the absorption of the beam into the work piece. The formation of plasma is thought to occur through the reaction of the
hot metal vapours from the keyhole with the shroud gas. It seems unlikely, in view of the fast emission of vapour from the keyhole, that the

60 Chapter 2 shroud gas could enter the keyhole; nevertheless it does due to the pulsating collapse and formation of the keyhole.
The plasma formed above the keyhole with the shroud gas will be absorbing to an extent determined by the temperature and the ionization potential of the gases involved. Table 2.3 lists the ionization potential of the gases often encountered in laser processing.
Table 2.3 Ionization potential of common gases and metals
Gas First Ionization
Potential [eV] Material
First Ionization
Potential [eV]
Helium 24.46 Aluminum 5.96
Argon 15.68 Chromium 6.74
Neon 15.54 Nickel 7.61
Carbon Dioxide 14.41 Iron 7.83
Water vapor 12.56 Magnesium 7.61
Oxygen 12.50 Manganese 7.41
Welding steel with both a CO2; laser and a Nd:YAG laser, each at 3.5
kW, the welding plume for Nd:YAG was simply a hot, dusty gas discharge at around 2000 °C, while the plume for CO2 welding was a plasma at around 6 - l0000 °C. Thus the ionization potential of the shroud gas was not relevant to Nd:YAG welding at these powers. This is a very interesting piece of work since it means that Nd:YAG welding can use considerable cheaper shroud gas than can be used for CO2 welding.
In welding with CO2 lasers the plasma blocking effect will be less for those gases having a high ionization potential, thus helium is favored, in spite of its price, as the top shroud gas in laser welding. The shroud underneath the weld would be of a cheaper gas, e.g. argon, N2 or CO2. The difference in penetration can be significant as shown in the results in the Figure 2.13. The plasma blocking is greater with higher powers. The results of the Figure 2.14 give this data a new slant. At slow speeds there is an advantage for helium but at high speeds there is an advantage for

Chapter 2 61
argon. The explanation is that the plasma is both good and bad in aiding absorption. If the plasma is near the work piece surface or in the keyhole it is beneficial. If, however, it is allowed to become thick or leave the surface its effect is to block or disperse the beam.
Figure 2.13 Variation in penetration with shroud gas composition and laser power for 10.6 μm
Figure 2.14 Penetration versus speed for helium and argon shroud gasses

62 Chapter 2
Eject of Shroud Design The shroud design must give total coverage of the melt and the reactive
hot region of the weld. It must do so without having flow rates which may cause waves on the weld pool. As just noted, in welding a side jet is often added to blow the plasma away. In the case of welding zinc coated steel, if the side jet blows backward along the new weldment the zinc vapor will condense on the weldment and so enhance the corrosion protection.
2.3.8 Effect of Gas Pressure — Due to Velocity and
Environment The nozzle pressure affects the gas flow rate and hence the ability of the
gas to either blow the plasma away or correctly protect the weld. There is a minimum flow rate for adequate protection and also one for the removal of the plasma. There is a maximum rate above which the weld pool flow is affected and the melt pool is ruffled causing a poor bead.
Variation in the environment pressure has a dramatic effect on penetration, particularly at very low pressures. The results are shown schematically in Figure 2.15.
This means that the penetration of the laser and the electron beam are not too dissimilar. The electron beam is by necessity working in a high vacuum and hence enjoys the high penetration. There are two theories as to why this increase in penetration occurs. The first is that the lower pressure reduces the plasma density and hence the plasma is no longer blocking the beam. The second is that at the lower pressures the boiling point is reduced in a manner predicted by the Clapeyron-Celsius equation:
𝑑𝑝𝑑𝑇
=𝛥𝐻𝑇𝛥𝑉
(2.7)
Since the change in volume with the change in phase, ΔV, is negligible
with melting, as opposed to boiling, there is not a similar effect on the

Chapter 2 63
melting point. Thus the melting point and boiling points become closer together at the lower pressures and hence the wall thickness of the keyhole will be thinner. A thinner liquid wall is easier to maintain and hence the keyhole is more easily stabilized. It is this stability which allows greater penetration-
Figure 2.15 Relationship between penetration and pressure for both electron beams and lasers.
2.3.9 Effect of Material Properties
The main material problems with laser welding, in common with most
welding methods are crack sensitivity, porosity, HAZ embrittlement and poor absorption of the radiation. For welds of dissimilar metals there is the additional problem of the possible formation of brittle intermetallics.
Crack sensitivity refers to centreline cracking, hot cracking or liquation cracking. It is due to the shrinkage stress building up before the weld is fully solidified and strong enough to take the stress. It is thus most likely in metal alloys having a wide temperature range over which solidification
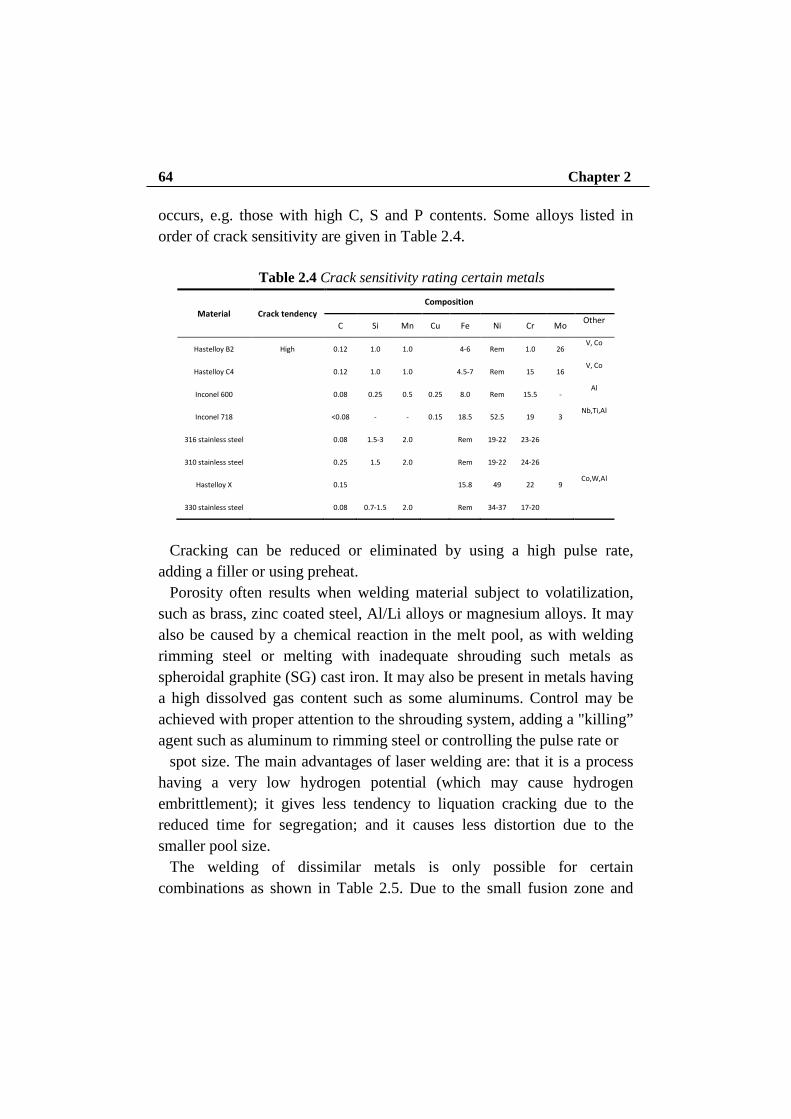
64 Chapter 2 occurs, e.g. those with high C, S and P contents. Some alloys listed in order of crack sensitivity are given in Table 2.4.
Table 2.4 Crack sensitivity rating certain metals
Material Crack tendency Composition
C Si Mn Cu Fe Ni Cr Mo Other
Hastelloy B2 High 0.12 1.0 1.0 4-6 Rem 1.0 26 V, Co
Hastelloy C4 0.12 1.0 1.0 4.5-7 Rem 15 16 V, Co
Inconel 600 0.08 0.25 0.5 0.25 8.0 Rem 15.5 - Al
Inconel 718 <0.08 - - 0.15 18.5 52.5 19 3 Nb,Ti,Al
316 stainless steel 0.08 1.5-3 2.0 Rem 19-22 23-26
310 stainless steel 0.25 1.5 2.0 Rem 19-22 24-26
Hastelloy X 0.15 15.8 49 22 9 Co,W,Al
330 stainless steel 0.08 0.7-1.5 2.0 Rem 34-37 17-20
Cracking can be reduced or eliminated by using a high pulse rate,
adding a filler or using preheat. Porosity often results when welding material subject to volatilization,
such as brass, zinc coated steel, Al/Li alloys or magnesium alloys. It may also be caused by a chemical reaction in the melt pool, as with welding rimming steel or melting with inadequate shrouding such metals as spheroidal graphite (SG) cast iron. It may also be present in metals having a high dissolved gas content such as some aluminums. Control may be achieved with proper attention to the shrouding system, adding a "killing” agent such as aluminum to rimming steel or controlling the pulse rate or
spot size. The main advantages of laser welding are: that it is a process having a very low hydrogen potential (which may cause hydrogen embrittlement); it gives less tendency to liquation cracking due to the reduced time for segregation; and it causes less distortion due to the smaller pool size.
The welding of dissimilar metals is only possible for certain combinations as shown in Table 2.5. Due to the small fusion zone and

Chapter 2 65
relatively rapid solidification of the weld there is a greater range of welds possible with the laser than with slower processes. There is also a greater tendency to form metastable solid solutions
Table 2.5 Laser weldability of dissimilar metal combinations

Chapter 3 Automated laser welding apparatus
3.1 Introduction Stainless steel, titanium, superalloys and other gas-sensitive metals are
being used for an amazing variety of applications from the aerospace and biomedical applications to the piping used in the petrochemical, food, semiconductor, nuclear, and chemical industries. These metals also have a very valuable characteristic, when welded correctly, these metals can be used in contact with corrosive or sensitive materials without contaminating them, thus making them the number one choices for applications requiring long service life and non-contamination.
The importance of protecting the joint with argon or an inert gas mixture is well known to most welders when joining gas-sensitive metals. Welders recognize the blue color on their welds as a sign of oxidation caused by exposure to oxygen. This oxidation is a form of corrosion that can be traced back to inadequate shielding.
Industry has fortunately moved from welding critical gas-sensitive metals with gas metal arc welding (GMAW) to gas tungsten arc welding (GTAW), but there is still a long way to go. Welding procedures often do not adequately detail the requirements for proper purging. Most welding is done to comply with a code while documentation for shielding is inadequate or lacking altogether. The most critical piece of a welding is the quality of the bead. If the weld has oxidized, it will be much weaker and may fail and/or cause contamination of the product.
To avoid oxidation while welding, the oxygen remaining in the purged atmosphere (rest oxygen) ideally should be zero. Oxidation is commonly called “sugaring” when welding stainless steels and chrome-nickel steels.

Chapter 3 67
This oxidation is even more serious when welding titanium, zirconium, molybdenum, and some other gas-reactive metals and alloys. The resulting oxidized surfaces are not longer corrosion resistant and further treatment may be necessary. Removing the oxidation using mechanical means, such as grinding, also removes the metal’s passive protective layer. This passive protective layer is only 20 angstroms thick and must either be protected or restored. Other mechanical procedures, such as brushing, blasting, or pickling, can remove the oxidation and restore the metal’s resistance. However, in some cases, such as for pipes, this is difficult or impossible to do.
The best solution is to prevent the oxidation from occurring in the first place by removing the oxygen. The purging gas is usually a heavier-than air inert gas such as argon. This shield as displaces the oxygen during welding then shields the welded joint from oxygen until it has cooled.
3.2 Problems caused by the oxidation
When welding any gas-reactive metal, it is imperative that the rest
oxygen content be below 70 parts per million (ppm) to avoid contamination or rejected welds. To give an idea of what this value of oxygen means, the oxygen content in the air that we breathe is about 21%. For the sake of quantifying a value that is far more accurate than using percentage, we need to measure rest oxygen in units of parts per million. For example, 21% oxygen would equal 210.000 ppm, and if the rest oxygen value is 0.1%, it equals 1000 ppm. If the value is without the term rest oxygen, it could signify air and consequently, the value would be hard to quantify with any accuracy. If we use the term rest oxygen and the value is 0.01%, this would be 100 ppm and consequently, 0.0001% would be 1 ppm. This means that a 70 ppm sample reading indicates there would be 70 parts of rest oxygen left in a sample size of 1 million parts of gas. This value sounds very low, but looking at the pictures of the rest oxygen levels, 70 ppm still gives considerable discoloration. Coupons made from 316L stainless steel were welded at various rest oxygen levels and

68 Chapter 3
photographs were taken of the welds — Fig. 3.1 A–F. (Note: A titanium weld made at 12 ppm would be much more discolored than what is shown here for stainless steel.).
Figure 3.1 Photos showing oxidation of 316L stainless steel coupons welded using argon purging gas with rest oxygen levels of: A — 12 ppm; B — 60 ppm; C — 70 ppm; D — 200 ppm; E — 250 ppm; and F — 500 ppm.
It is interesting to note that there are many oxygen indicators available
that have operating ranges from either 25 to 0.1% (1000 ppm), or 25 to 0.01% (100 ppm). The units that read down to 1000 ppm are useless for the welding industry and even the units measuring down to 100 ppm are not good enough. Any serious welding application needs an indicator that can accurately measure 1 ppm (0.0001%) rest oxygen. The two most common devices capable of measuring low levels of oxygen employ either an electrochemical-type cell or a zirconium cell.

Chapter 3 69 Documentation of the welding procedure before, as well as during, the
purging process is of the utmost importance. This is an area that will see an increased activity in the next few years. Labor and material costs in all areas of construction have rocketed up to all-time highs bringing a heightened awareness to documenting everything that is done. Soon, documentation proving that the welds were made correctly will be just as important as proving they were made to code.
Welding the joints correctly will also minimize the repair and maintenance operations that can add major costs and downtime and impede industries attempting to run at full capacity.
In conclusion, as the use of stainless, titanium and gas-reactive metal is increasing year after year because of their desired properties, the increase of potential weld-joint failures and premature wear leading to costly replacement is a reality that must be avoided. The industries that demand these alloys should also demand the most exacting standards from their employees and contractors when these materials are welded. To avoid the myriad problems caused by excessive oxygen levels while welding, manufacturers and contractors are urged to examine their weld procedures, purging equipment and techniques, and monitor the rest oxygen levels prior to welding, while routinely documenting all parameters for every weld joint.
3.3 Solutions in literature
The laser welding of metal alloys particularly reactive to atmospheric
agents (such as oxygen and nitrogen), requires the need to protect the welding area by means of a cover. Those particularly reactive alloys include titanium alloys, zirconium, niobium, some nickel superalloys. This implies that the weld must remain in an inert environment to prevent the oxidation and nitriding reactive processes. From literature research carried out that have been found some solutions to this problem.

70 Chapter 3 In the patent document JP 58011823 A is described the realization of a
laser welding apparatus that allows to weld the two components of a differential pressure transmitter, letting protection of the weld joint.
To prevent a semiconductor pressure-sensitive element from breaking down by tightly welding a differential pressure transmission line body to a cylinder in the atmosphere with a laser beam which has high energy density. The Figure 3.2 shows the entire system consisting of a main body and a cylinder are fitted to a rotating device and are rotated successively during welding. A laser beam is reflected by a reflecting mirror and then condensed through a condenser lens to illuminate a weld zone. The joint part between the main body and cylinder has steps.
Figure 3.2 Laser welding apparatus to weld the components of a differential
pressure transmitter

Chapter 3 71 During laser welding, inert gas for preventing the oxidation and
defection occurrence of the weld zone and the damaging of the condenser lens due to sputtering during the welding is supplied to a protective cover, thereby sealing the weld zone.
This apparatus is not very flexible since the protective cover used limits the complexity of the welding operations feasible, and also the protection from oxidation and nitriding is not efficient, because of the relative displacement of the laser source and the protective cover with respect to the joint.
Another solution is described in the patent document JP 2025271 A and JP 10328876 A, when to make effective utilization of laser light energy and to improve soldering quality by disposing a nozzle near soldering parts and executing soldering while ejecting an assist gas from the nozzle (Figure 3.3).
Figure 3.3 Laser welding apparatus describes of the patent system JP
2025271 A The nozzle is disposed near the soldering parts and the welding is
executed by the laser light focused by an optical system while the assist

72 Chapter 3
gas such as gaseous nitrogen is ejected in the direction of an arrow, shown in Figure 3.3, from the nozzle. The assist gas ejected from the nozzle forces the smoke generated at the time of soldering to flow in the direction of the arrow (see the Figure 3.3), thereby preventing the suction of the smoke to the laser light and the oxidation of the soldering parts. The laser energy at the time of soldering is effectively utilized in this way and the soldering quality is improved.
The solution proposed in the patent document US 6111214 A, instead, describes a laser welding apparatus showed in Figure3.4 that comprises: a laser output mechanism for applying a welding laser beam from its output end to a welding position of an object to be welded; and a plurality of jet nozzles for blowing out a shield gas to the welding position for preventing oxidation of the welding position, wherein the jet nozzles are arranged at an identical angle interval on a single circumference around the welding laser beam.
Figure 3.4 Laser welding apparatus describes of the patent system US
6111214 A

Chapter 3 73 This enables to perform welding into a sufficient depth and width. The solutions proposed in the patent documents JP 2025271 A, JP
10328876 A and US 6111214 A, in which a laser welding apparatus is provided with one or more nozzles which emit a jet of inert gas on the joint under welding are inefficient to shield from oxidation and nitriding process. The jet of inert gas, even if it forms an angle with the direction of emission of the laser beam variable between 30° and 90° not appropriately covers the welding area.
A further solution is described in the patent document KR 20040043451 A, in which the welding process is modified by depositing on the parts to be welded a layer of protective material having a good transmissivity of the laser beam with the wavelength of the laser source used by the automated apparatus. However, this welding process is extremely complex, longer and consequently more expensive, making the relative apparatus less versatile
3.4 Proposed Solution
An automated laser welding apparatus was designed and developed in
order to perform laser, that allows to achieve laser welding in a controlled, versatile, efficient, reliable, simple, and economical way. This system allows to shield not controlled from oxidation and nitriding process, both the melted pool and the material portion just after welding.
The automated laser welding apparatus according to the invention, allows to protect from oxidation and nitriding also the consolidated material portion just welded which is still above the of oxidation or nitriding critical temperature, generally between 200 °C and 500 °C.
In fact, compared to the apparatuses founded in literature review, this one allows to keep the shares just welded in an inert environment and even after the passage of the heat source (i.e. the laser source), until their surface does not reach temperatures below of the oxidation or nitriding critical temperature, so as to prevent such reactive processes.

74 Chapter 3 The automated laser welding apparatus is composed of a laser head and
a shielding gas system trained by an nozzle, an upper and lower diffuser. The Figure 3.5 shows a right side view of the apparatus automated laser
welding.
Figure 3.5 A right side view of the apparatus automated laser welding
In this figure, it can be observed that the apparatus automated laser
welding includes a laser head (100) connected to a laser source (not shown in the figures) that emits a laser beam (110) exiting the laser head (100).
The laser head (100) is configured to be moved from a processing and control unit of the apparatus automated translating above a support base (200). The support base have an upper surface (210) that is preferably planar, so as to translate in two opposite directions along a parallel line to the upper surface (210) of the support base (200). In particular, when the head laser emits the laser beam, it moves in a direction of advancement of welding (shown in Figure 3.6). The travel speed of the laser head, related

Chapter 3 75
to the welding speed, can be set by an operator through an interface system connected to the processing and control unit.
Figure 3.6 A left side view of the apparatus of automated
Furthermore, the laser head is configured to be arranged by the
processing and control unit of the apparatus automated so that its longitudinal axis (coinciding with or parallel to the axis of the laser beam emitted from the laser head) is parallel or inclined with respect to a straight line perpendicular to the upper surface of the support base, by means of a rotation around to an axis parallel to the upper surface of the support base and orthogonal to the direction of welding advancement (500).
Additionally, the laser head is configured to be translated by the processing and automated unit control of the apparatus in two opposite directions along a straight line parallel to the line normal to the upper surface of the support base. In this way the laser head can be approached or moved away from the upper surface of the support base.

76 Chapter 3
3.4.1 Design and realization of the Upper Diffuser From Figure 3.5 it can be observed that the apparatus automated laser
welding according comprises an upper diffuser (300), having a perforated bottom plate (310) preferably planar, which is coupled to the laser head by means mechanical coupling. During the welding process, the bottom plate of the upper diffuser is raised from (i.e. not in contact) with the surface of the support base. Preferably, the arrangement of the upper diffuser is such that its bottom plate is parallel to the upper surface of the support base. Moreover, when the laser head emits the laser beam shifting in the direction of advancement welding, the arrangement of the upper diffuser is such as to follow the laser head along the direction of welding advancement.
The mechanical coupling parts of the upper diffuser to the laser head include a link clamp coupled to the laser head, which is provided with of a first movement device to moving a bar disposed parallel to the longitudinal axis of the laser head.
Figure 3.7 The two possible translations of the upper diffuser

Chapter 3 77 First movement device is configured to translate the bar in two opposite
directions along a line perpendicular to the axis longitudinal of the laser head and parallel to the welding advancement direction; so as to approach or away from the bar with respect to the laser head longitudinal axis.
In addition, the first movement device is configured to translate the bar in two opposite directions along a straight line parallel to the laser head longitudinal axis; so as to approach or retract the lower end of the bar with respect to the upper surface of the support base, as shown in Figure 3.7. Reference to Figure 3.8, it can be observed that can adjust the following parameters of the upper diffuser disposition: • the distance of the perforated bottom plate (310) from the upper
surface of the base support, i.e. the distance L1 of the perforated bottom plate from upper surface of the workpiece;
• the distance L2 from the laser beam (110) emitted from the laser head (100).
Figure 3.8 Adjusting the position of the upper diffuser

78 Chapter 3 The upper diffuser length, where the term length means the dimension
in the direction of welding advancement, is defined according to the welding speed, that is the speed of translation of the laser head. In fact, the higher of the welding speed, the permanence time of the upper diffuser on the protected zone is reduced, so it would be necessary to use longer upper diffuser. However, the welding speed increases, at the same laser power output, there is a reduction of the heat input (equal to the ratio between power and speed) with second order polynomial law, as show the Figure 3.9. So, even at high speeds, at the same laser output power, the same length as the perforated bottom plate ensures optimal coverage.
Figure3.9 Heat Input vs. welding speed
In particular, the perforated bottom plate has a length preferably ranging from 80 mm to 140 mm, more preferably ranging from 87 mm to 120 mm, still more preferably ranging from 95 mm to 105 mm, even more preferably equal to 100 mm. The upper diffuser is provided with an internal cavity (320) accessible from the outside by a upper hole (330) and closed at the bottom by the bottom plate, which is preferably removable.
0
50
100
150
200
10 20 30 40 50 60
Heat
Inpu
t [J/
mm
]
speed [mm/s]
200015001000

Chapter 3 79
Figure 3.10 A perspective view (a), a right side view (b) and a plan view from
below (c) of the upper diffuser
80 Chapter 3 Through the upper hole, inert gas (such as argon or helium) is
introduced into the internal cavity (for example by a outer tube connected to a gas power supply system controlled by the processing and automated control unit of the apparatus) and escapes from the bottom plate which is perforated and is fixed in a removable manner to the upper diffuser with the lateral screws. In particular, the internal cavity accommodates an internal diffusion system by means of which the inert gas is distributed below the bottom plate in uniform way. This diffusion system is constituted of steel wool flakes placed so as to fill the entire internal cavity, with a density ranging from 150 kg/m3 to 310 kg/m3, preferably ranging from 180 kg/m3 to 280 kg/m3 , most preferably ranging from 200 kg/m3 to 260 kg/m3, still more preferably ranging from 220 kg/m3 to 240 kg/m3, even more preferably equal to 230 kg/m3. The steel wool flakes, which are keep up in the internal cavity from the bottom plate, allowing an uniform diffusion of the inert gas inside the internal cavity of the upper diffuser.
The lower plate holes have a diameter ranging from 0.2 mm to 1 mm, more preferably ranging from 0.3 mm to 0.8 mm, still more preferably ranging from 0.4 mm to 0.6 mm, even more preferably equal to 0.5 mm. In particular, have been found that holes of diameter less than 0.2 mm are too small for an easy evacuation of inert gas, causing the onset of turbulence that impede the uniform gas leakage from holes. While diameter holes greater than 1 mm cause a gas escape of not more uniform, creating the output preferred zones.
The upper diffuser is coupled by an auxiliary nozzle (700) (shown in Figures 3.6) that has the main task of preventing the plasma formation which is generated during a welding process with very high power density, of the order of 104 W/mm2. The inert gas usually used for the plasma elimination is helium, thanks to its high ionization potential. However, it is possible to use an-that other types of cheapest inert gases such as argon. In particular, the auxiliary nozzle is oriented so as to direct the inert gas jet emitted towards the area of the piece (600) invested by the laser beam.

Chapter 3 81
3.4.2 Design and realization of the Lower Diffuser A lower diffuser to protect the melted pool, and consequently the weld
bead root, from oxidation and nitriding process, for welding processes to complete penetration. In this case, the automated apparatus provides inert gas to the underside of the molten pool (i.e. the joint surface in welding which is in the opposite direction to that of laser beam emission), avoiding oxidation and nitriding process also at the welded joint back. For this purpose, the apparatus automated comprises a planar base of support (800), shown in greater detail in Figure 3.11, comprising a main block (810) and a top plate (820). The main block has a central groove (811) configured to be closed at the top by the upper plate. The top plate is provided with a of row of holes (821) with constant step and disposed longitudinally along a central line, so that, the holes are aligned with the line along which moves the laser head during the welding process. The holes each have a diameter preferably ranging from 1 mm to 6 mm, more preferably ranging from 2.5 mm to 5 mm, still more preferably ranging from 3.5 mm to 4.5 mm, even more preferably equal to 4 mm The holes have a interaxis distance variable with the size of their diameter, and which is preferably variable from 3 mm to 15 mm, more preferably ranging from 7 mm to 13 mm, still more preferably ranging from 10 mm to 12 mm , even more preferably equal to 11 mm. In particular, the central groove is shaped so as to create an edge (814) on which the upper plate can be rested on. In this way, when the base of support is assembled, the upper plate is slightly built-in with respect to the upper surface (818) of the main block. During a welding process, inert gas (such as argon or nitrogen) is introduced into the central groove through a hole (815) located on a side wall (816) of the main block. The inert gas leaks from the holes of the upper plate, distributing itself uniformly over the entire bottom surface of the workpiece in processing. The length of the upper plate provided with the holes and consequently the lengths of the upper plate and of the central groove are a function of the length of the weld: the upper plate provided with holes must have a length greater than or equal to the welding line.
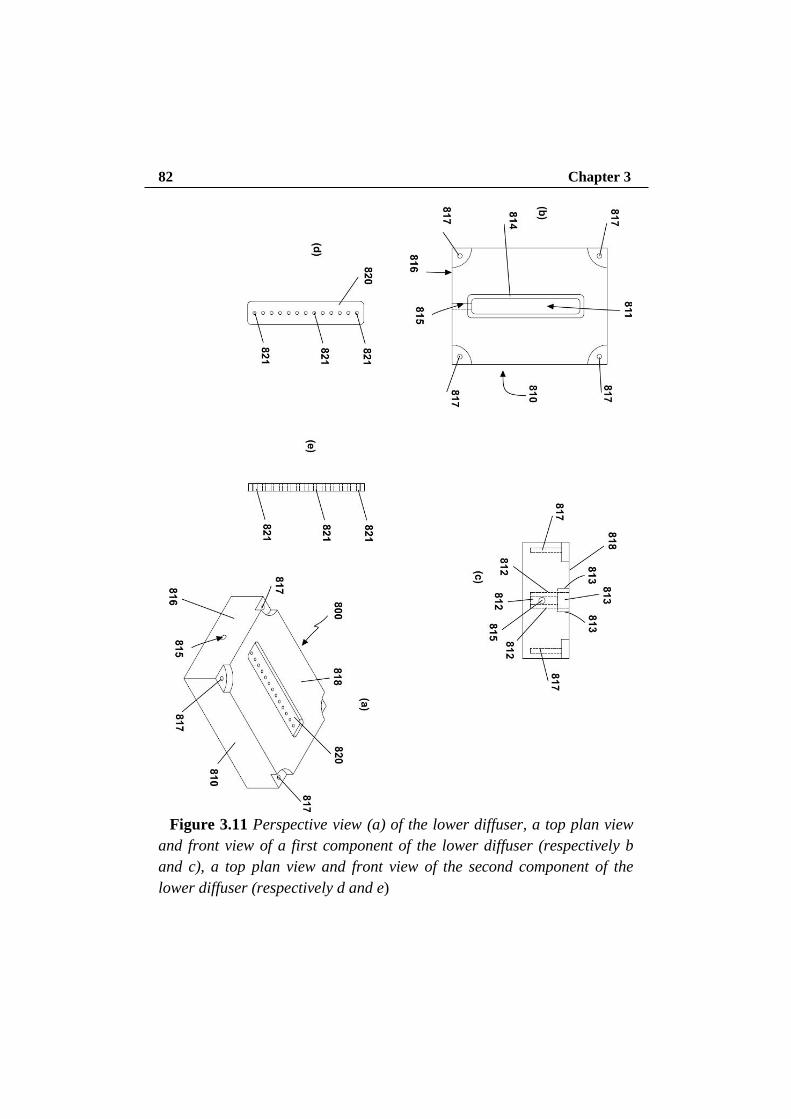
82 Chapter 3
Figure 3.11 Perspective view (a) of the lower diffuser, a top plan view
and front view of a first component of the lower diffuser (respectively b and c), a top plan view and front view of the second component of the lower diffuser (respectively d and e)

Chapter 3 83
3.1 Equipment for experimental works The automated laser welding apparatus and and the related mechanical
coupling parts have a small obstruction and is applicable to any laser head type. The entire system was tested on a BEO D70 TRUMPF laser welding head, with a focal length of 200 mm, mounted on an IRB 2400 ABB anthropomorphic robot to six axes. The laser beam is generated by a Yb:YAG disk laser source (TruDisk 2002) and it is sent to the laser welding head via an optic fiber having a diameter of 300 μm.
The experimental works was performed at the laboratories of “Technology and Manufacturing Systems” of the Department of the Industrial Engineering at the University of Salerno. In the next sessions the equipment and the experimental modalities are described.
3.5.1 Laser source and focus system The laser used is the Trumpf TruDisk 2002 (Figure 3.12), whose active
medium is a 200-μm-thick Yb:YAG disk longitudinally excited by diodes.
Figure 3.12 Trumpf TruDisk 2002
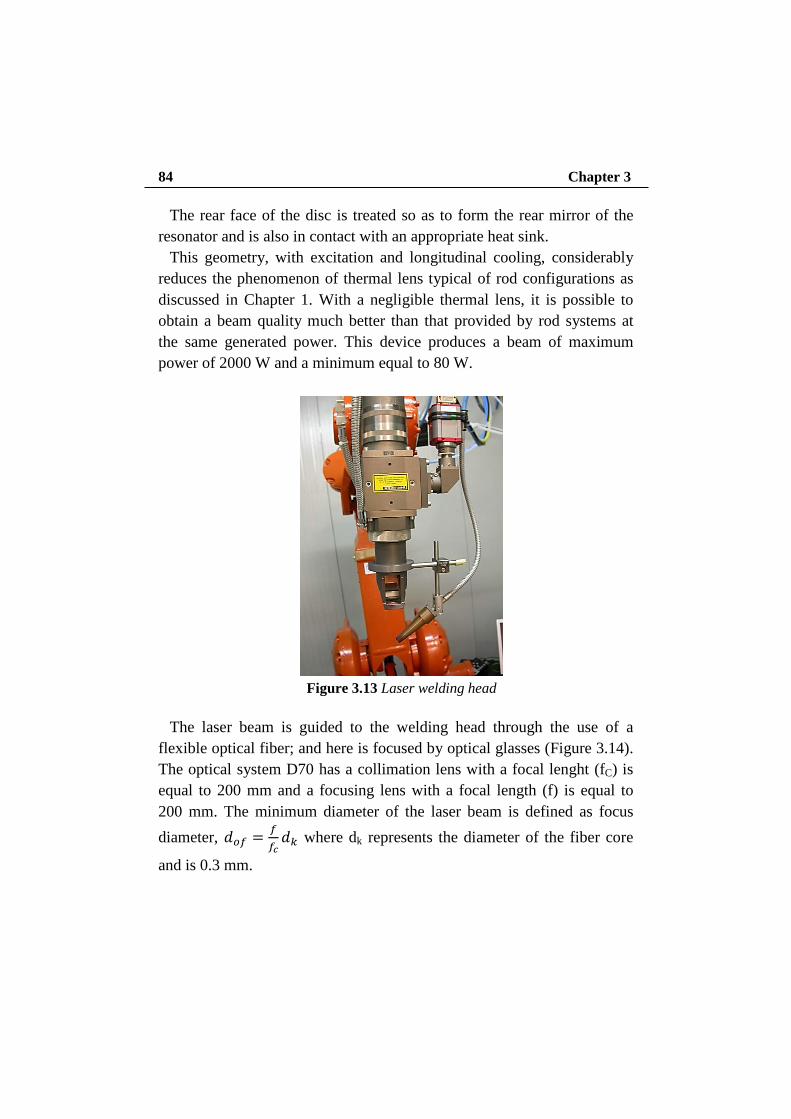
84 Chapter 3 The rear face of the disc is treated so as to form the rear mirror of the
resonator and is also in contact with an appropriate heat sink. This geometry, with excitation and longitudinal cooling, considerably
reduces the phenomenon of thermal lens typical of rod configurations as discussed in Chapter 1. With a negligible thermal lens, it is possible to obtain a beam quality much better than that provided by rod systems at the same generated power. This device produces a beam of maximum power of 2000 W and a minimum equal to 80 W.
Figure 3.13 Laser welding head
The laser beam is guided to the welding head through the use of a
flexible optical fiber; and here is focused by optical glasses (Figure 3.14). The optical system D70 has a collimation lens with a focal lenght (fC) is equal to 200 mm and a focusing lens with a focal length (f) is equal to 200 mm. The minimum diameter of the laser beam is defined as focus diameter, 𝑑𝑜𝑓 = 𝑓
𝑓𝑐𝑑𝑘 where dk represents the diameter of the fiber core
and is 0.3 mm.
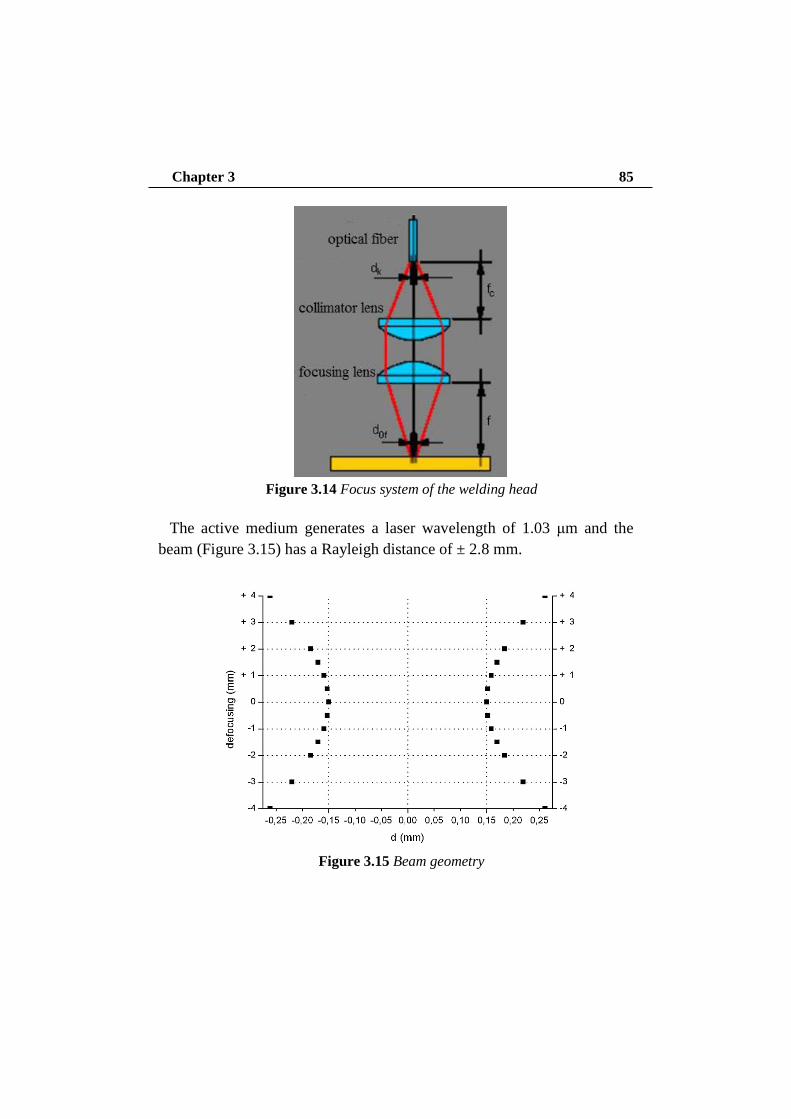
Chapter 3 85
Figure 3.14 Focus system of the welding head
The active medium generates a laser wavelength of 1.03 μm and the
beam (Figure 3.15) has a Rayleigh distance of ± 2.8 mm.
Figure 3.15 Beam geometry

86 Chapter 3
Table 3.1 Disk laser and focus system technical data
Active medium Yb:YAG
Wavelength 1030 [nm]
Range power 80 - 2000 [W]
Beam quality 8 [mm*mrad]
Focal length 200 [mm]
Fiber diameter 0.3 [mm]
Focus diameter 0.3 [mm]
3.5.2 Moving system of the laser welding head The laser head is moved by a 6-axis numerically controlled robot ABB
IRB 2400 (Figure 3.15). This is a 6-axis industrial robot, designed specifically for manufacturing industries that use flexible robot-based automation. The robot has an open structure that is specially adapted for flexible use, and can communicate extensively with external systems.
Figure 3.15 Robot with six controlled axes
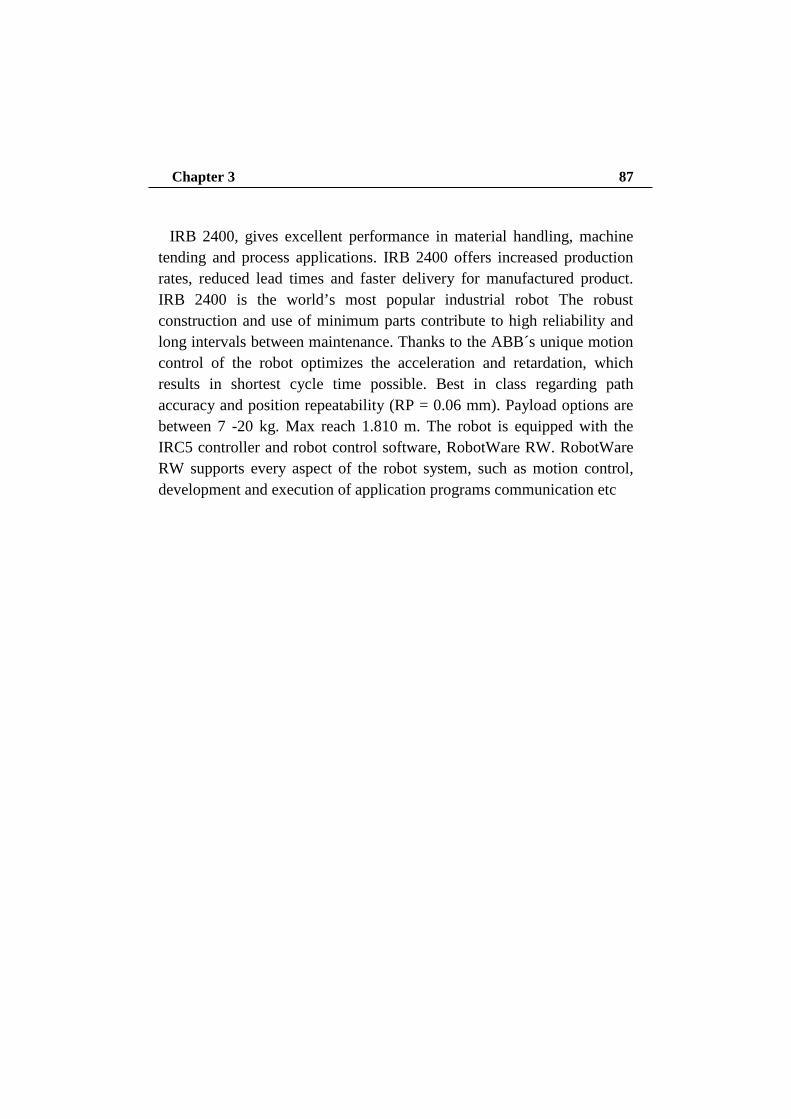
Chapter 3 87 IRB 2400, gives excellent performance in material handling, machine
tending and process applications. IRB 2400 offers increased production rates, reduced lead times and faster delivery for manufactured product. IRB 2400 is the world’s most popular industrial robot The robust construction and use of minimum parts contribute to high reliability and long intervals between maintenance. Thanks to the ABB´s unique motion control of the robot optimizes the acceleration and retardation, which results in shortest cycle time possible. Best in class regarding path accuracy and position repeatability (RP = 0.06 mm). Payload options are between 7 -20 kg. Max reach 1.810 m. The robot is equipped with the IRC5 controller and robot control software, RobotWare RW. RobotWare RW supports every aspect of the robot system, such as motion control, development and execution of application programs communication etc

Chapter 4 Butt laser welding of Titanium alloy
4.1 Introduction In this study butt welding tests on 3 mm-thick Ti6Al4V sheets were
performed using the automated laser welding apparatus. A fractional design was conducted using three values of power, welding speeds and laser focus position to obtain good-quality butt joints.
The joints were characterised in terms of the weld geometry, geometrical defects and porosity by X-ray examinations and the resistance by tensile tests. Vickers microhardness tests were performed from the base metal to the melted zone. The weld with the best geometric characteristics, least geometric defects and porosity content was selected for the tensile tests.
4.2 Material: Ti6Al4V Titanium alloy
Titanium is a metal of structural among the most light, but the high cost
of the base material and its processes, have relegated mainly applications of military aircraft and aerospace. Today, thanks to the creation of new cheaper and more efficient production processes and the parallel development of new joining technologies, the application areas have increased.
The general properties of titanium can be summarized as follows: • relatively low density • high corrosion resistance • good erosion resistance

Chapter 4 89
• good heat conductivity • favorable strength/w eight ratio • low thermal expansion • hard smooth oxide skin
The material under investigation is the Ti6Al4V alloy which is an α+β titanium alloy. Ti6Al4V is known as the “workhorse” of the titanium industry because it is by far the most common titanium alloy, accounting for more than 50% of total titanium usage and is the most widely used in the aerospace and automotive industries. This alloy may be considered in any application where a combination of high strength at low to moderate temperatures, light weight and excellent corrosion resistance are required. Some of the many applications where this alloy has been used include aircraft turbine engine components, aircraft structural components, aerospace fasteners, high-performance automotive parts, marine applications, medical devices and sports equipment.
Pure titanium, as well as the majority of titanium alloys, crystallizes at low temperatures in a modified ideally hexagonal close packed structure, called α titanium. At high temperatures, however, the body-centered cubic structure is stable and is referred to as β titanium. The β-transus temperature for pure titanium is 882±2 °C. The atomic unit cells of the hexagonal close packed (hcp) α titanium and the body-centered cubic (bcc) β titanium are schematically shown in Figure 4.1 with their most densely packed planes and directions highlighted.
Figure 4.1 Crystal structure of hcp α and bcc β phase

90 Chapter 4 The existence of the two different crystal structures and the
corresponding allotropic transformation temperature is of central importance since they are the basis for the large variety of properties achieved by titanium alloys. Both plastic deformation and diffusion rate are closely connected with the respective crystal structure. In addition, the hexagonal crystal lattice causes a distinctive anisotropy of mechanical behavior for the titanium. The elastic anisotropy is particularly pronounced. The Young’s modulus of titanium single crystals consistently varies between 145 GPa for a load vertical to the basal plane and only 100 GPa parallel to this plane
The Ti6Al4V alloy is a titanium-based alloy containing 6% aluminium and 4% vanadium. As the pseudo-binary phase diagram shows (Figure 4.2), at room temperature the alloy is bi-phasic Tiα+Tiβ, with a slight phase percentage of Tiβ.
Figure 4.2 Pseudo-binary phase diagram of Ti6Al4V
The existence of the two phases, Tiα and Tiβ, at room temperature
makes it possible to obtain an alloy with a high mechanical resistance due to the mutual interaction of the two phases. During heating, Tiα transforms into Tiβ at approximately 980°C. During fast cooling, the Tiβ

Chapter 4 91
phase undergoes a so-called martensitic transformation, forming a complex lamellar structure inducing significantly altered mechanical properties. These mechanical properties can be recovered by a low-temperature thermal treatment
The alloy under investigation is Ti6Al4V (Grade 5) whose chemical composition and mechanical property are given in Table 4.1 and Table 4.2 respectively
Table 4.1 Nominal chemical composition of Ti6Al4V
C Fe N2 O2 Al V H2 Ti
<%0.08
<%0.25 <%0.5 <%0.2 <%5.5 <%3.5 <%0.0375 Balance
Table 4.2 Mechanical property of Ti6Al4V
Density [kg/m3]
Ultimate Tensile
Strength [MPa]
Yeld Tensile
Strength [MPa
Elastic Modulus
[GPa]
Hardness Rockwell C
Elongation at break
[%]
4400 1170 1100 114 106 12
4.3 Configuration of automated laser welding
apparatus In welding titanium alloys, the shielding melt pool is very problematic
because, compared to other materials, titanium has a high affinity for environmental vapours and gases at temperatures above 300 °C. The phenomenon that most affects the quality of titanium alloy welding is the enrichment of interstitial elements or oxidants that might induce the formation of extremely hard intermetallic structures that cause brittleness. For this reason, an inert gas is used during the welding process to protect the melt pool and the HAZ from oxidation until cooling. A simple control

92 Chapter 4
method to determine the status of surface oxidation is the observation of the weld bead surface colour; the colours are in order of quality: silver, gold, blue and matte grey. The bead colour analysis indicates the thickness of the superficial oxide. Silvery, golden and blue colours indicate a thickness of the oxide film less than 10 nm, between 10-25 nm and between 25-70 nm, respectively. A generally acceptable level of contamination is represented by gold, but in aircraft applications for example, it is desirable to obtain a complete absence of colour.
The automated laser welding apparatus was used to achieve all welding tests. Several configurations were tested to determine the optimal values related to: the positioning of the all components of the laser welding apparatus (nozzle, upper diffuser and lower diffuser) both with respect to laser beam and both with respect to workpiece, shielding gas type and flow rate. Bead on plate (BOP) preliminary tests were performed to obtain silver weld beads, as shown in Figure 4.3
(a)
(b)
(c)
Figure 4.3 Oxidation levels in preliminary tests: a)high oxidation level on the upper surface; b)absence oxidation level on the upper surface; c) absence
oxidation level on the lower surface. The protection system (Figure 4.4) was equipped with two shielding
gases, and the best configuration was: helium in the nozzle at a flow rate

Chapter 4 93
of 50 Nl/min which, because of its high ionization potential, has been used to create a cloud of protection that prevents plasma formation. The lower surface and the upper surface were shielded using argon. The lower diffuser protects the root of the joint from oxidation when full penetration or excessive penetration occurs. The upper diffuser protects the top of the joint after passage of the beam to reduce oxidation during cooling. Argon was released from the upper diffuser at a flow rate of 20 Nl/min and from the lower diffuser at a flow rate of 10 Nl/min. The best results were obtained with the nozzle above the laser beam in the direction of motion. The centre of the outlet nozzle was 4 mm from the beam and 2 mm from the top surface of the plate. The axis of the nozzle made an angle of 40° with respect to plane of the plate. The distance between the upper diffuser and the upper surface of the work piece was 1 mm.
Figure 4.4 Configuration of laser welding apparatus
4.4 Butt welding of Ti64: Experimental Plan
Before making butt welds, bead on plate (BOP) tests were carried out to
determine the window parameters of power, welding speed and laser focus position (defocusing) to be used for butt welds.

94 Chapter 4 Power range has been fixed in order to obtain a specific power density
greater than conduction-keyhole threshold (104 W/mm2) also in defocused conditions, where the beam focus locates above or beneath the metal surface. Sensible values for welding speed have been found taking care of producing full penetrative beads with no significant excessive of penetration on the lower surface of the butting plates.
Negative defocusing with the beam focus beneath the metal surface was considered because a reduction of the grain size had been observed in a previous work and this effect was clear when defocusing outside of the Rayleigh range, which is equal to 2.8 mm with the welding system and optics in place.
Factorial experiments were then planned instead of a one-factor-at-a-time method, so to evaluate possible interactions between the leading independent variables. A 3-level (-1, 0, +1) experimental plan with power, speed and defocusing as governing factors was arranged; factor levels for each parameter are listed in Table 4.3, being P the power, s the welding speed and f the focus position
Table 4.3 Factor levels for input parameters
Factors Levels
-1 0 1
P [W] 1500 1750 2000
s [mm/s] 15 20 25
f [mm] − 3 − 1.5 0
A fractional design was preferred, aiming to reduce the amount of
welds: a central composite design (CCD) was planned being it more

Chapter 4 95
appropriate to create response surface models for analytical prediction. Many schemes are suggested, however, considering how the region of interest relates to the operating boundaries for the experimental factors, a face-centred scheme was chosen in order to explore the areas within the ranges previously found via BOP tests. Tests to be performed are placed on a cubic lattice according to Figure 4.5.
Welding conditions are shown in Table 4.4, with additional replications of the centred point condition as recommended in CCDs construction, balancing the number of centred points with the number of factor involved in the analysis and aiming to achieve a relatively uniform precision within the operating window of the processing parameters.
Figure 4.5 Face-centred CCD scheme
Since replication helps for the estimation of error, three runs were
planned for each condition in order to check the dispersion in the response data and to verify the statistical significance of measurements. Then, a random test procedure was arranged both to allocate the samples and to produce the specimens, so that the observations are independent random variables aiming to reduce experimental errors.
1
-1
1
1-1

96 Chapter 4
Table 4.4 Testing conditions in face-center CCD
Test P [W] s [mm/s] f [mm]
1 1500 15 -3 2 2000 15 -3 3 1500 25 -3 4 2000 25 -3 5 1500 15 0 6 2000 15 0 7 1500 25 0 8 2000 25 0 9 1500 20 -1.5
10 2000 20 -1.5 11 1750 15 -1.5 12 1750 25 -1.5 13 1750 20 -3 14 1750 20 0 15 1750 20 -1.5
Referring to Figure 4.6, the response variables to be considered in the
analysis are the bead width (CW), the root width (RW), the mean width of the heat affected zone on the upper surface (HAZup), the mean width of the heat affected zone on the lower surface (HAZlow), the extent of the fused zone (FZ) and the average grain size (not shown in Figure 4.6) formed in the fused zone.
Figure 4.6 Bead characterization of geometric features
CW
RW
FZ
HAZup
HAZlow

Chapter 4 97
An appropriate shape factor of the bead was defined as the root to
crown ratio (RW/CW) to study the bead profile, in order to involve a specific constraint at the optimization stage. As concerning the bead defects, the evaluation was required for right and left undercut (UC), reinforcement (R) and excessive penetration (EP) at the key-hole root, as shown in Figure 4.7.
Figure 4.7 Bead characterization of geometrical defects
In the field of laser welding, crucial issues are the primary fit up of the
plates and the proper removal of foreign particles which could contaminate the melt pool thus producing embrittlement of the welds. For this reason, possible burrs were removed using abrasive paper; then the surfaces were pickled with a solution of nitric and hydrofluoric acid. Besides, the sheets were clamped in order to prevent misalignment.
Butt samples were cross-cut perpendicularly to the welding direction and then polished to a mirror finish with SiC paper and grinding diamond paste on polishing cloths; three cross-cuts were examined for each sample. Chemical etching was performed using a solution of hydrofluoric acid (48%, 10 ml), nitric acid (65%, 15 ml), and water (75 ml) at room temperature in order to highlight the bead boundaries and microstructures in the cross-section; the etched specimens were eventually blow dried and observed using optical microscopy. Geometric features were evaluated via Nikon NIS-Elements imaging software for each operational condition referring to international standard in order to evaluate the welding quality level.
R
EP
UC
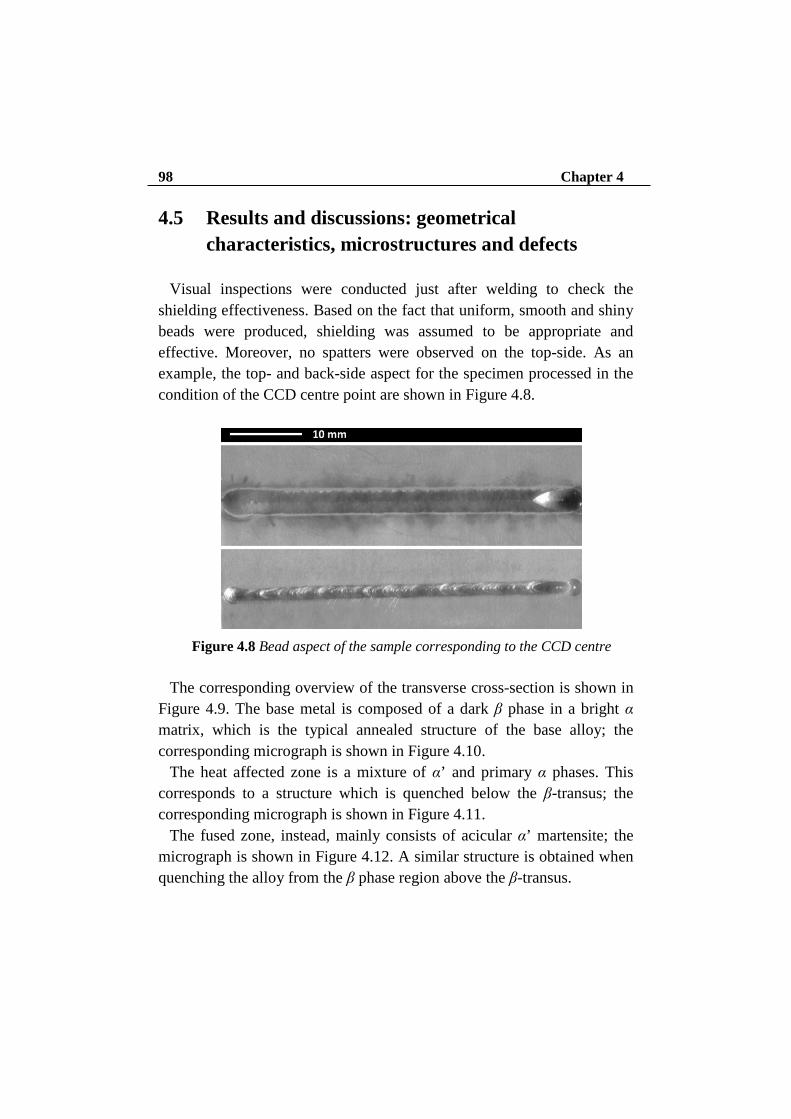
98 Chapter 4
4.5 Results and discussions: geometrical characteristics, microstructures and defects
Visual inspections were conducted just after welding to check the
shielding effectiveness. Based on the fact that uniform, smooth and shiny beads were produced, shielding was assumed to be appropriate and effective. Moreover, no spatters were observed on the top-side. As an example, the top- and back-side aspect for the specimen processed in the condition of the CCD centre point are shown in Figure 4.8.
Figure 4.8 Bead aspect of the sample corresponding to the CCD centre
The corresponding overview of the transverse cross-section is shown in
Figure 4.9. The base metal is composed of a dark β phase in a bright α matrix, which is the typical annealed structure of the base alloy; the corresponding micrograph is shown in Figure 4.10.
The heat affected zone is a mixture of α’ and primary α phases. This corresponds to a structure which is quenched below the β-transus; the corresponding micrograph is shown in Figure 4.11.
The fused zone, instead, mainly consists of acicular α’ martensite; the micrograph is shown in Figure 4.12. A similar structure is obtained when quenching the alloy from the β phase region above the β-transus.

Chapter 4 99
Figure 4.9 Cross-section micrograph of the sample corresponding to the CCD
centre
Figure 4.10 Micrograph of the base metal

100 Chapter 4
Figure 4.11 Micrograph of the heat affected zone
Figure 4.12 Micrograph of the fused zone
Since severe quality requirements apply for welding in aerospace, the
shape of the cross-section must be examined in terms of possible geometric imperfections. Three cross-cuts were produced for each bead; the measurements were conducted for the responses decided at a pre design stage. The average values for each testing condition are given in Table 4.5; missing data for RW, HAZlow and EP are due to the occurrence of incomplete penetration for the corresponding testing condition. As concerning the beads in fully penetrative condition, the stringent quality was met for the defects.

Chapter 4 101
Tab
le 4
.5 A
vera
ge v
alue
s of g
eom
etri
c fe
atur
es a
nd im
perf
ectio
n s f
or th
e di
ffere
nt w
eldi
ng c
ondi
tions
Gra
in
size
[µ
m]
168
177
140
154
210
385
145
240
152
186
234
147
161
210
187
FZ
[mm
2 ]
10.2
7
15.0
7
5.63
6.13
6.28
7.51
9.00
12.6
6
4.48
7.87
5.93
9.50
11.3
0
5.80
8.29
UC
left
[µ
m]
25
52
70
147
50
96
79
79
55
165
99
118
79
146
105
UC
right
[µ
m]
33
59
66
100
71
107
76
100
55
155
86
124
98
138
133
R [µ
m]
140
123
25
-8
61
117
134
158
76
107
75
137
145
125
64
EP
[µm
]
61
167 - 257
210
60
96
38
-31
179
237
199
150
210
229
HAZ
low
[µ
m]
2260
4477
-
2508
2503
3076
3579
4712
1660
3055
2399
3801
4420
2359
3227
HAZ
up
[µm
]
4076
4810
3014
3643
3758
3296
3799
4760
2852
3386
3615
4343
4785
3514
3954
RW
[µm
]
985
3419
-
1790
1730
2401
2869
4078
493
2611
1682
2963
3615
1728
2503
CW
[µm
]
3190
3826
2414
3077
3122
3017
3389
4185
2525
3048
2990
3737
4161
2963
3281
f [m
m]
-3
-3
-3
-3
-3
0 0 0 0 0 -1.5
-1.5
-1.5
-1.5
-1.5
s [m
m/s
]
15
15
25
25
20
20
15
15
25
25
20
20
15
25
20
P [k
W]
1500
2000
1500
2000
1750
1750
1500
2000
1500
2000
1500
2000
1750
1750
1750

102 Chapter 4 Geometrical defects (Figure 4.7) such as undercut, excess weld metal
and excessive penetration were measured for all beads. The undercut values ranged from 0.033 mm to 0.155 mm, the excess weld material ranged from 0.06 mm to 0.17 mm, and excessive penetration ranged from 0.02 mm to 0.19 mm. All values were in accordance the stringent limits imposed by the UNI EN ISO 13919 1:1997 standard.
Another typical defect in weld joints is porosity. Porosity usually decreases the weld cross-section and thus the strength of the joint, especially when the pores are large in size and number. Cross-sectional analysis showed that porosity was mainly distributed in the root of the melted area (Figure 4.13). This is probably due to more rapid cooling and solidification, which impedes the escape of bubbles. Because porosity is located in the root area and in the excessive penetration material, it does not seem to affect the tensile strength of the joints as will be shown later. The spherical shape of the pores is typically caused by hydrogen absorption in the molten pool.
Figure 4.13 Porosity location for a specimen welded at
1750 W, 15 mm/s and -1.5 mm Because it is not sufficient to evaluate the presence of porosity simply
through examination of the cross-sections, X-ray examinations were performed on a series of nine samples. As shown in Figure 4.14 , X-ray analysis showed an increase in porosity by a reduction in the speed, probably due to the increased time available for the bubbles to grow.

Chapter 4 103
However, the porosity content did not show a clear tendency to vary with power.
(a)
(b)
Figure 4.14 X-ray photograph of specimens at (a) 1750 W 15 mm/s and -1.5 mm and (b) 1750 W 25 mm/s and -1.5 mm
4.6 Analysis of the responses At a first stage of the analysis, the main effects of the governing
parameters are assessed via one factor plots. The effect of the focus position is not univocal for the responses. Notably, as shown in Fig. 4.15, defocusing has no effect on the trend of the extent of the fused zone whose values are comparable for a given thermal input (Q) which is the power to speed ratio, irrespective of the focus position. Therefore, when the focus position is neglected and the extent of the fused zone is hence studied as a function of power and speed as separate input parameters, the expected basic relationships are confirmed, as shown in Figure. 4.16 and 4.17, so any increase in the laser power yields a proportional increase on FZ; similarly, any increase in the welding speed results in a corresponding decrease on FZ.
Nevertheless, a clear effect of defocusing on the crown and the root width was noticed, therefore the bead profile is clearly influenced by the focus position, although comparable values of the fused zone extent are provided.

104 Chapter 4
Figure 4.15 Fused zone as function of thermal input
Figure 4.16 Fused zone as function of power

Chapter 4 105
Figure 4.17 Fused zone as function of welding speed
As an example, for a given thermal input of 88 J/mm, as obtained with a
power of 1750 W and a welding speed of 20 mm/s, the response to a focused beam is compared to the response to a defocused one. The corresponding micrographs are shown in Figure 4.17.
Figure 4.17 Bead profile with a focused (left) and defocused beam (right)
Polynomials are fitted to the experimental data to obtain the regression
equation of a generic response Y. A general form for the regression model is:

106 Chapter 4
𝑌 = 𝑓(𝑥1, 𝑥2, … … 𝑥𝑘) + 𝜀 (4.1) where xi values of k factors are combined to give the output, which is
affected by a residual ε between the actual value and the prediction. The general expression of a quadratic model is hence:
𝑌 = 𝑏0 + �𝑏𝑖𝑥𝑖 +𝑘
𝑖=1
�𝑏𝑖𝑖𝑥𝑖𝑖2 +𝑘
𝑖=1
��𝑏𝑖𝑗𝑥𝑖𝑥𝑗 +𝑘
𝑗=1𝑗≠𝑖
𝜀 (4.2)𝑘
𝑖=1
where linear terms, interactions and square terms are involved, since the
response variable is capable of being influenced by single effect, resulting from the input parameters acting alone, or interaction as well, resulting when combinations among the input parameters are in place.
The significant terms and therefore the best model for each response were selected via sequential statistical tests in a step-wise regression approach. The reinforcement, the undercut and the excessive penetration did not show adequate significance, so their models were neglected; it is inferred that a random influence arises due to both the upper and lower gas fluxes, which directly interact with the fused metal, although supplied at constant flow rate to result in perfect shielding.
Furthermore, low significance resulted for the HAZ width, both at the upper and at the lower surface; nevertheless, this is not thought to hamper the study, since it is assumed that a proper constraint of minimization on the fused zone extent would also act in reducing the HAZ.
The analytical models for the responses, which showed statistical significance as resulted from the ANOVA, are:
𝑪𝑾 = 56670 + 1.3𝑷− 386.8𝒔 − 228.7𝒇 − 7.9𝒔𝒇 + 7𝒔𝟐 − 141𝒇𝟐 (4.3)

Chapter 4 107 𝑹𝑾 = −8281.2 + 13.5𝑷 − 178.8𝒔 + 618.3𝒇 − 0.5𝑷𝒇 − 3 × 10⁻³𝑷𝟐
− 197.7𝒇𝟐 (4.4)
𝑭𝒁 = 27.4 − 3.9 × 10⁻³𝑷 − 1.7𝒔 − 4.6 × 10⁻⁴𝑷𝒔 + 5.5 × 10⁻⁶𝑷𝟐
+ 0.05𝒔𝟐 (4.5) 𝑹𝑾
𝑪𝑾� = −1.7 + 3.9 × 10⁻³𝑷 − 0.1𝒔 + 0.3𝒇 + 6.9 × 10⁻⁵𝑷𝒔 −1.8 × 10⁻⁴𝑷𝒇 − 1.3 × 10⁻⁶𝑷𝟐 − 1.3 × 10⁻³𝒔𝟐
− 0.04𝒇𝟐 (4.6) 𝑮𝒓𝒂𝒊𝒏 𝒔𝒊𝒛𝒆 = 63.4 + 0.4𝑷 − 31.2𝒔 − 64.6𝒇 − 7.5 × 10⁻³𝑷𝒔+ 0.1𝑷𝒇
− 2.7𝒔𝒇 + 0.8𝒔𝟐 (4.7)
and they provide the responses for a given set of input values, to estimate the effect of a certain welding condition. For each response, the corresponding p-values and R-squared factors to assess the reliability of the model are listed in Table 4.6.
Table 4.6 P-values and R-squared factors
Response variable
p-value Adjusted
R-squared
CW < 0.0001 0.95
RW < 0.0001 0.92
FZ < 0.0001 0.93
RW/CW < 0.0001 0.83
Grain size < 0.0001 0.90

108 Chapter 4 A deeper analysis is conducted for the responses which will be involved
in the optimization process. As concerning the shape factor, the corresponding response surfaces are shown in Figure 4.18 (a) and (b), for a given speed of 20 mm/s, and a given negative focus position of 3 mm, respectively: an increase of the laser power or a decrease of the welding speed yields a corresponding increase in the shape factor, since the root width approaches the crown width; conversely, a decrease of the laser power or an increase of the welding speed yield a corresponding decrease in the shape factor, as the typical shape of the key-hole is approached.
As concerning the grain size, the corresponding response surfaces are shown in Figure 4.19 (a) and (b), for a given power of 2000 W and a given speed of 20 mm/s, respectively: as expected when designing the experimental plan, a decrease in the mean grain size was noticed when defocusing.
Figure 4.18 (a) Shape factor for a given speed of 20 mm/s

Chapter 4 109
Figure 4.18 (b) Shape factor for a given negative focus position of 3 mm
Figure 4.19 (a) Shape factor for a given power of 2000 W

110 Chapter 4
Figure 4.19 (b) Shape factor for a given speed of 20 mm/s
4.7 Optimization and Tensile Test Once proved that the welds met the quality requirements for each
possible imperfection, the optimization was carried out considering the extent of the fused zone, the mean grain size and the shape factor. Minimization is required for both the extent of the fused zone and the mean grain size. Aiming to produce a key-hole with a high aspect ratio to be balanced with a proper constraint on the root width in order to ease the expulsion of vapour which would result in porosity formation otherwise, an optimal range between 0.5 and 0.7 was chosen for the shape factor. Under the above-mentioned constraint criteria, the optimization of the process was carried out.
The goals are combined into an overall desirability function. This approach is one of the most widely used in industry for the optimization of multiple response processes and it is based on the idea that a product or a process that has multiple quality characteristics is completely

Chapter 4 111
unacceptable if even only one of them drops outside of some desired limits.
For each response Yi (x), the desirability function di (Yi) assigns numbers ranging between 0 and 1 to the possible values of Yi, with di (Yi) = 0 representing a completely undesirable value of Yi and di (Yi) = 1 representing a completely desirable or ideal response value. The individual desirability values are then combined using a geometric mean, which gives the overall desirability D:
𝐷 = [𝑑1(𝑌1) ∙ 𝑑2(𝑌2) ∙ … .𝑑ℎ(𝑌ℎ)]1 ℎ� (4.8)
with h denoting the number of responses. A proper weight can be
awarded to each constraint; in particular, a higher weight was awarded in this study to the constraint involving the grain size, aiming to produce a finer structure. Predictably, the suggested optimum welding set-up condition would move towards a condition of negative defocusing. In particular, a solution with a power of 1820 W, a speed of 23 mm/s with 3 mm of negative defocusing and an overall desirability of 92% was found.
The optimum condition was tested with a tensile tests. Mechanical properties of the welding beads were examined by tensile tests on three specimens welded at power of 1820 W, at speed of 23 mm/s and at negative defocusing of -3 mm. The specimens were designed according to the UNI EN 895: 1997 standard with the following characteristics:
• thickness of the test specimens: 3mm • width of the calibrated parallel length: 25 mm • original gauge length: 100 mm • parallel length: 120 mm.
The samples were tested using a Schenk 630N machine operating with a load rate of 250 N/s at room temperature.
All three samples exhibited a fragile fracture mode, typical of Ti6Al4V Grade 5, with moderate elongation, limited shrinkage of cross-sectional

112 Chapter 4
area and a fracture path inclined by 45° with respect to the loading direction.
Figure 4.20 Welded specimens after tensile tests
All three welded specimens showed a break in the original gauge length
away from the beads, as shown in Figure 4.20. The ultimate tensile stress was 1149 MPa, the yield stress was 950 MPa, and the elongation at fracture varied between 8-9% (Figure 4.21).
Figure 4.21 Stress-strain diagram

Chapter 5 Butt laser welding of Nickel Superalloys
5.1 Introduction This study is a research and analyses dissimilar laser welding of
superalloys Haynes 188 and Inconel 718. The main target of the research is the use of thin sheets (1.5 mm thick) to be welded with a automated laser welding apparatus, to be proposed in order to give grounds for actual industrial applications, to replace tungsten arc welding and electron beam welding which are currently the main techniques for the super alloys in exam. In the present work, an experimental plan was arranged considering power, welding speed, and beam angle; few works have dealt with the latter variable. Non-destructive tests as well as evaluation of geometrical features of the beams were carried out to feed the optimization process. The eventual assessment of the suggested optimal welding condition was performed in terms of resulting Vickers microhardness and tensile strength, with convincing outcome.
In particular, the process was performed in single pass, without wire metal, neither pre heating; an overall simplification was then achieved. Dimensional limits for indications, specific common defects and shape dimensions, as provided into customer industrial specification, are effectively matched.
5.2 What are Superalloys?
The term “Superalloys" describe a group of alloys developed for
applications that require high performance at elevated temperatures.

114 Chapter 5 There are three categories of superalloys that have been developed:
• Nickel based superalloys • Iron-nickel based superalloys • Cobalt based superalloys
This superalloys generally used at temperatures above about 540°C (1000 °F). The iron-nickel-base superalloys are an extension of stainless steel technology and generally are wrought.
Cobalt-base and nickel-base super-alloys may be wrought or cast, depending on the application/composition involved. A large number of alloys have been invented and studied; many have been patented. However, the many alloys have been winnowed down over the years; only a few are extensively used. Alloy use is a function of industry (gas turbines, steam turbines, etc.).
Not all alloys can be mentioned; examples of older and newer alloys are used to demonstrate the physical metallurgy response of superalloy systems. Figure 5.1 compares stress-rupture behavior of the three alloy classes (iron-nickel-,nickel-, and cobalt-base).
Appropriate compositions of superalloys can be forged, rolled to sheet, or otherwise produced in a variety of shapes. The more highly alloyed compositions normally are processed as castings.
Fabricated structure scan be built up by welding or brazing, but many highly alloyed compositions containing a large amount of hardening phase are difficult to weld.
Properties can be controlled by adjustments in composition and by processing (including heat treatment), and excellent elevated-temperature strengths are available in finished products.
The high-temperature applications of superalloys are extensive, including components for aircraft, chemical plant equipment, and petrochemical equipment.

Chapter 5 115
Figure 5.1 Stress-rupture strengths of superalloys
Figure 5.2 shows the F119 engine, which is the latest in a series of
military engines to power high performance aircraft. The gas temperatures in these engines in the hot sections (rear areas of the engine) may rise to levels far above 1093°C. Cooling techniques reduce the actual component metal temperatures to lower levels, and superalloys that can operate at these temperatures are the major components of the hot sections of such engines. The significance of superalloys in today’s commerce is typified by the fact that, whereas in 1950 only about 10% of the total weight of an aircraft gas turbine engine was made of superalloys, by 1985 this figure had risen to about 50%.
Table 5.1 lists some cur-rent applications of superalloys. It will be noted, however, that not all applications require elevated-temperature strength capability. Their high strength coupled with corrosion resistance have made certain superalloys standard materials for biomedical devices. Superalloys also find use in cryogenic applications.

116 Chapter 5
Figure 5.2 F119 gas turbine engine - a major user of superalloys
Table 5.1 Some Applications of Superalloys Aircraft/industrial gas turbine components: Space vehicle components, such as:
Disks Aerodynamically heated skins Blades Rocket-engine parts Vanes Heat treating equipment: Combustors Trays Afterburners Fixtures Thrust reversers Conveyor belts
Steam turbine power plant components: Nuclear power systems: Bolts Control-rod drive mechanisms Blades Valve stems Stack-gas reheaters Springs
Selected automotive components, such as: Ducting Turbochargers Chemical and petrochemical industries: Exhaust valves Bolts
Metal processing, such as in: Valves Hot work tools and dies Reaction vessels Casting dies Piping
Medical components, such as in: Pumps Dentistry Prosthetic devices
5.3 Superalloy Metallurgy
As noted earlier, there are three groups of superalloys (iron-nickel-
,nickel-, and cobalt-base), which are further subdivided into cast and wrought macrostructures. In addition to macro-structure, there are crystal

Chapter 5 117
structure (on anatomic level) and microstructure (visible un-der the microscope). Metals tend to have relatively simple crystal structures.
5.3.1 Crystal Structures
When hard sphere models representing the crystal structures of most
metals are constructed, the atom positions (seen as the hard spheres in the example of Figure 5.3) are set in a few basic alignments. Face centered cubic (fcc), body-centered cubic (bcc), and hexagonal close-packed (hcp) more or less cover the gamut of common metal crystal structures. If body-centered tetragonal (bct) is added to the list, then the superalloys have been covered fairly well, except for delta phase and the complex phases such as sigma (σ). There is no special need to describe the crystal structure of all phases. Sometimes, when more than one element is present (as in an alloy), a structure may be ordered. The nature of order is that specific crystallographic locations are now required for given elements.
Figure 5.3 Line sketches and hard sphere atomic models of crystal structures
For example, if a material has a secondary phase such as Ni3Al, the
Ni3Al will be ordered. That is, the fcc crystal structure will now have nickel atoms at the face positions and aluminum atoms at the corners. Figure 5.3 shows ordering. Ordering is very important in the strengthening of superalloys. In Figure 5.4 the black circles (solid circles) represent nickel atoms, shared with adjacent cube. The white circles (open circles) represent aluminum or titanium atoms, shared with eight cubes at

118 Chapter 5
each corner. The dotted lines show hidden atoms. Nickel atoms are always on faces; titanium or aluminum atoms are always at cube corners, in contrast to disordered structures where atoms may occupy any given location.
Figure 5.4 Line sketch of an ordered fcc crystal structure of γ’ phase
5.3.2 Phases in Superalloys
Superalloys consist of the austenitic fcc matrix phase γ plus a variety of
secondary phases. Secondary phases of value in controlling properties are the fcc carbides MC, M23C6, M6C, and M7C3 (rare) in virtually all superalloy types; gamma prime (γ’) fcc ordered Ni3 (Al, Ti); gamma double prime (γ’’) bct ordered Ni3Nb; eta (η) hexagonal ordered Ni3Ti; and the delta (δ) orthorhombic Ni3Nb intermetallic compounds in nickel- and iron-nickel-base superalloys. The γ’, γ’’ and η phases also are known as geometrically close-packed (gcp) phases. In addition to grain size and morphology, (plus occasional cold work) it is the production and control (manipulation) of the various phases that give superalloys their unique characteristics.
The superalloys derive their strength mostly from solid-solution hardeners and precipitated phases. Principal strengthening precipitate phases are γ’ and γ’’, which are found in iron-nickel- and nickel-base superalloys. Carbides may provide limited strengthening directly (e.g., through dispersion hardening) or, more commonly, indirectly (e.g., by stabilizing grain boundaries against excessive shear). Carbides are found in all three superalloy groups. The δ and η phases are useful (along with

Chapter 5 119
γ’) in control of structure of wrought iron-nickel- and nickel-base super-alloys during processing. The extent to which they contribute directly to strengthening depends on the alloy and its processing. In addition to those elements that produce solid-solution hardening and/or promote carbide and γ’ formation, other elements (e.g., boron, zirconium, and hafnium) are added to enhance mechanical or chemical properties. These minor elements are not customarily found in most cobalt-base alloys. Some car-bide- and γ’-forming elements may contribute significantly to chemical properties as well. Borides may form in the iron-nickel-and nickel-base superalloys.
Detrimental phases also form in the super-alloys. Among these phases are σ, μ and Laves. These phases are so-called topologically close-packed (tcp) phases and may not be of concern in trace amounts, but are in-variably detrimental when more than trace amounts are present.
5.4 Haynes 188
Haynes 188 alloy is a cobalt-nickel-chromium-tungsten alloy that
combines excellent high-temperature strength with very good resistance to oxidizing environments up to 1095°C for prolonged exposures, and excellent resistance to sulfate deposit hot corrosion. Its chemical composition is given by the Table 5.2.
Table 5.2 Nominal chemical composition of Haynes 188
Co Ni Cr W Fe Mn Si C La B
39 22 22 14 3 1.25 0.35 0.10 0.03 0.02
It is readily fabricated and formed by conventional techniques, and has
been used for cast components. Other attractive features include excellent resistance to molten chloride salts, and good resistance to gaseous sulfidation.

120 Chapter 5 Haynes 188 alloy has good forming and welding characteristics. It may
be forged or otherwise hot-worked, providing that it is held at 1175°C for a time sufficient to bring the entire piece to temperature. As a consequence of its good ductility, 188 alloy is also readily formed by cold working. The alloy does work harden rapidly, however, so frequent intermediate annealing treatments may be needed for complex component forming operations. All hot or cold-worked parts should be annealed and rapidly cooled in order to restore the best balance of properties.
The alloy can be welded by both manual and automatic welding methods, including gas tungsten arc (TIG), gas metal arc (MIG), electron beam and resistance welding. It exhibits good restraint welding characteristics.
Wrought Haynes 188 alloy is furnished in the solution heat-treated condition, unless otherwise specified. The alloy is normally solution heat-treated at 1175°C ± 14°C and rapidly cooled or water-quenched for optimal properties.
Annealing at temperatures less than the solution heat-treating temperature will produce some carbide precipitation in Haynes 188 alloy, which may affect the alloy’s properties.
Haynes 188 alloy combines properties which make it suitable for a variety of fabricated component applications in the aerospace industry. It is widely used in established military and commercial gas turbine engines for combustion cans, transition ducts, and after-burner components. It shares applications in newer engine programs with a more recently developed material, Haynes 230 alloy, which possesses improved properties. Haynes 188 alloy is a solid solution-strengthened material which combines excellent high-temperature strength with good fabricability at room temperature. It is particularly effective for very long-term applications at temperatures of 650°C or more. It is stronger than nickel-base solid-solution strengthened alleys, and far stronger than simple nickel-chromium or iron-nickel-chromium heat-resistant alloys.
This can allow for significant section thickness reduction when it is substituted for these materials.

Chapter 5 121
Figure 5.5 Comparison of sheet materials, stress to produce 1% creep in 1000
HR
5.5 Inconel 718
Inconel alloy 718 is a high-strength, corrosion-resistant nickel
chromium material used at -453° to 704 °C. Typical composition limits are shown in Table 5.3.
Table 5.3 Nominal chemical composition of Inconel 718
Ni Cr Fe Nb Mo Ti Al Cu C
52.5 19 18.5 5.1 3 0.9 0.5 0.15 0.08
The age-hardeable alloy can be readily fabricated, even into complex
parts. Its welding characteristics, especially its resistance to post weld cracking, are outstanding.
The ease and economy with which Inconel alloy 718 can be fabricated, combined with good tensile, fatigue, creep, and rupture strength, have

122 Chapter 5
resulted in its use in a wide range of applications. Examples of these are components for liquid fueled rockets, rings, casings and various formed sheet metal parts for aircraft and land-based gas turbine engines, and cryogenic tankage. It is also used for fasteners and instrumentation parts.
For most applications, Inconel alloy 718 is specified as: solution annealed and precipitation hardened (precipitation hardening, age hardening, and precipitation heat treatment are synonymous terms). Alloy 718 is hardened by the precipitation of secondary phases (e.g. gamma prime and gamma double-prime) into the metal matrix. The precipitation of these nickel-(aluminum, titanium, niobium) phases is induced by heat treating in the temperature range of 593 to 816 °C. For this metallurgical reaction to properly take place, the aging constituents (aluminum, titanium, niobium) must be in solution (dissolved in the matrix); if they are precipitated as some other phase or are combined in some other form, they will not precipitate correctly and the full strength of the alloy with not be realized. To perform this function, the material must first be solution heat treated (solution annealed is a synonymous term).
Two heat treatments are generally utilized for INCONEL alloy 718: •Solution anneal at 926-1010 °C followed by rapid cooling, usually in
water, plus precipitation hardening at 718 °C for 8 hours, furnace cool to 621 °C, hold at 621 °C for a total aging time of 18 hours, followed by air cooling.
•Solution anneal at 1038-1066 °C followed by rapid cooling, usually in water, plus precipitation hardening at 760 °C for 10 hours, furnace cool to 649 °C, hold at 649 °C for a total aging time of 20 hours, followed by air cooling.
If the material is to be machined, formed, or welded, it typically is
purchased in the mill annealed or stress relieved condition. The material is then fabricated in its most malleable condition. After fabrication, it can be heat treated as required per the applicable specification.

Chapter 5 123
5.6 Configuration of automated laser welding apparatus
The autogenous disk-laser welding of Haynes 188 and Inconel 718,
which are among the most common and representative aerospace superalloys, is discussed in this chapter.
A 3-factors experimental plan, with power, welding speed and beam angle has been arranged to feed the optimization process.
In order to tilt the laser head and keep the lower surface of the upper diffuser parallel to the surface of the work piece has introduced another freedom degree to the system described in chapter 3. Has added a device that allows the rotation around a linchpin (parallel to the surface of the support base) of the upper diffuser relative to the bar that supports it, as highlighted with a red circle in Figure 5.6.
Figure 5.6 Upper diffuser with a new freedom degree
This new freedom degree allows to rotate in two opposite directions the
upper diffuser around the linchpin (parallel to the upper surface of the
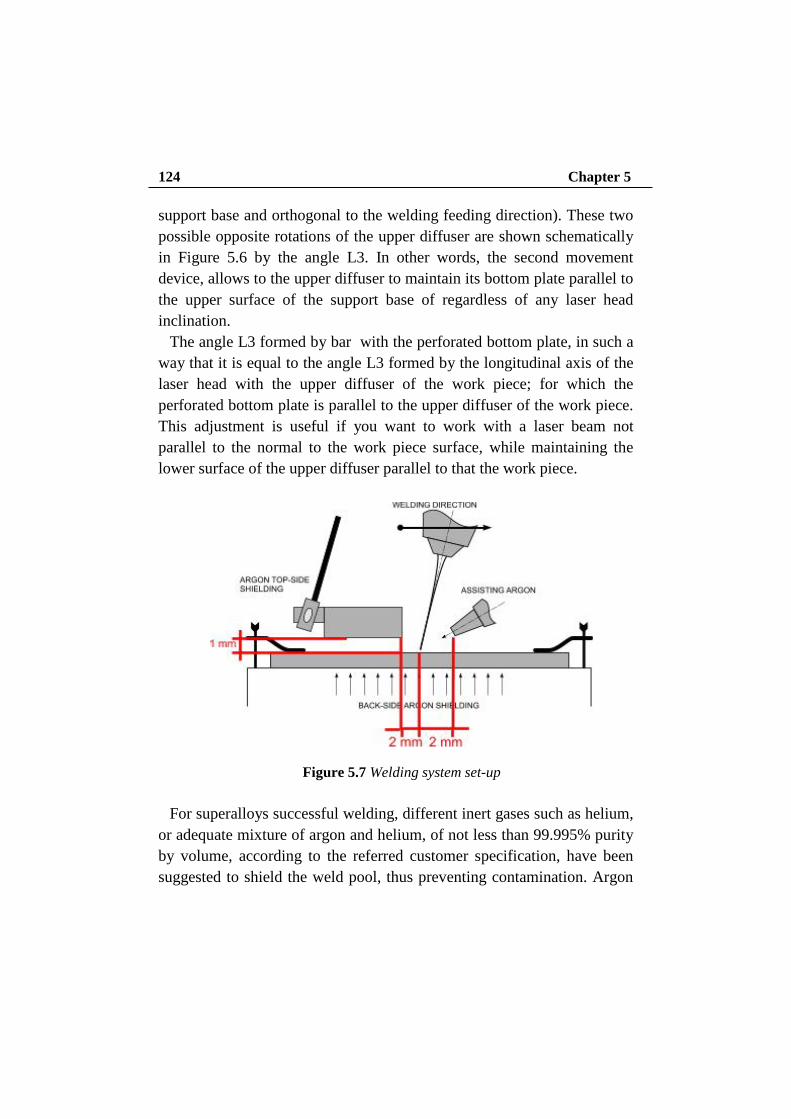
124 Chapter 5
support base and orthogonal to the welding feeding direction). These two possible opposite rotations of the upper diffuser are shown schematically in Figure 5.6 by the angle L3. In other words, the second movement device, allows to the upper diffuser to maintain its bottom plate parallel to the upper surface of the support base of regardless of any laser head inclination.
The angle L3 formed by bar with the perforated bottom plate, in such a way that it is equal to the angle L3 formed by the longitudinal axis of the laser head with the upper diffuser of the work piece; for which the perforated bottom plate is parallel to the upper diffuser of the work piece. This adjustment is useful if you want to work with a laser beam not parallel to the normal to the work piece surface, while maintaining the lower surface of the upper diffuser parallel to that the work piece.
Figure 5.7 Welding system set-up For superalloys successful welding, different inert gases such as helium,
or adequate mixture of argon and helium, of not less than 99.995% purity by volume, according to the referred customer specification, have been suggested to shield the weld pool, thus preventing contamination. Argon

Chapter 5 125
has been considered in this study as it would provide an ideal compromise between effectiveness and economic needs in industrial environments. A special device for gas supply has been designed to upgrade the welding head: a 30° tilted nozzle, with 7.8 mm outlet diameter, is located 1 mm above the sheets and is used to blow the ionized metal plume away from the interaction zone between the beam and the material; at the same time, topside shielding to avoid oxidation during cooling is achieved through a side diffuser with a 2 mm gap to the top surface of the joint. Both the
nozzle and the diffuser move with the laser head, whilst a fixed grooved box provides back shielding as the beads are aimed to be produced in fully penetrative conditions. The welding system set-up is shown in Figure 5.7. Argon flow rate of 15 l/min, welding direction, nozzle angle and diffuser positioning have been chosen basing on trial experiments.
5.7 Design of Experiments
5.7.1 Experimental plan arrangement
When approaching a process to be characterized, a series of tests needs
to be planned, firstly defining which leading governing parameters and crucial response variables are to be considered. The choice is usually based both on literature and past experience. Many variables are involved in laser welding; laser power and welding speed are the main ones as they determine the energy rate input, therefore they will be taken into account in the study. Nevertheless, it has been suggested that optimal welding condition can be achieved considering additional factors such as the position of the focal point and the laser beam angle.
Welding is told to be carried out in defocused condition when the focal point locates above or beneath the upper surface of the specimen; the beam geometry of the welding system to be used in the experimental plan has been studied in order to determine the spot extent and the specific energy input which is actually delivered to the material as a function of

126 Chapter 5
the focal position. Given the specific features of the disk-laser, which allows to obtain a tight beam with 2.8 mm Rayleigh distance, so with considerably low divergence compared to traditional rod and CO2 lasers, defocusing is not expected to produce significant difference in the response of the superalloys within the 1.5 mm thickness of the sheets.
Furthermore, reasons to avoid defocusing have been pointed out in experimental welding of Inconel 718 with CO2 lasers, as focus positions above or below the upper surface resulted in porosity, spatters or concave welds. As a consequence, any stand-off of the focal position has been discarded and all the tests have been carried out focusing the laser beam on the upper surface of the joint. With respect to the influence of laser beam angle on the welding output, it has been reported that a forward or backward tilting irradiation may change the amount of underfilling at the backside tip of the key-hole and alter the formation of spattering on the top surface of the sheet when welding steel. Few works have dealt with the influence of the beam angle, so the parameter is worth being investigated.
Eventually, a 3-factors study with power, welding speed and beam angle as governing parameters has been arranged.
Ad hoc bead-on-plate (BOP) extensive trials on Haynes 188 and Inconel 718 sheets with the same thickness of the specimens to be welded, have suggested sensible outer limits of the range to be explored for each factor, aiming to produce full penetrative beads with no oxidation and no significant drop-through on the lower surface of the butting sheets. Then, in order to evaluate possible interactions between the leading independent variables, the one-factor-at-a-time approach has been rejected in favor of factorial experiments. Nevertheless, a fractional design has been preferred so to reduce the amount of welds.
A central composite design (CCD) provides a solid statistical foundation for generating a response surface map; furthermore, a face-centred scheme has been preferred in order to stay within the ranges which have been previously found via BOP tests. This results in a 3-levels

Chapter 5 127
(-1, 0, +1) experimental plan whose testing conditions are placed on a cube plot according to Figure 4.5.
Table 5.4 Factor levels for input parameters
Factors Levels
-1 0 1
P [W] 1500 1200 1400
s [mm/s] 30 45 60
α[°] − 10 0 10
Table 5.5 Testing conditions in face-center CCD
Test P [W] s [mm/s] α[°]
1 1000 30 -10 2 1000 30 10 3 1000 45 0 4 1000 60 -10 5 1000 60 10 6 1200 30 0 7 1200 45 -10 8 1200 45 0 9 1200 45 10
10 1200 60 0 11 1400 30 -10 12 1400 30 10 13 1400 45 0 14 1400 60 -10 15 1400 60 10

128 Chapter 5 Being P the power, s the welding speed and α the beam angle, factor
levels for each parameter are listed in Table 5.4; the 15 corresponding welding conditions are shown in Table 5.5.
Two additional tests at least have to be planned for the cube center point conditions recommended in CCDs construction, so to add both a much more stable variance of the responses and effectiveness in estimating any second order effect to characterize curvatures of the response variables. Furthermore, given the need to verify the statistical significance of the results, each processing condition has to be tested 3 times. Thus, a total of 51 welding bead specimens is produced; both the run order and the allocation of the sheets to each test have been randomized, restraining any noise effect and satisfying the statistical requirement of independence of the observations.
5.7.2 Response variables choice
At a pre design stage, the response variables to be discussed have to be
defined. Aiming to develop a welding procedure which would be feasible and effective for actual components, the conditions to be satisfied for acceptance of welds and therefore the output parameters to be measured have been defined referring to customer specifications Avio S.p.A. The idea is to firstly carry out successive non destructive tests (NDT) such as visual examinations, fluorescent penetrant inspections (FPI) and radiographic tests (RT). Since cracks and porosity can be a factor in rapidly cooled welds such those ones produced with laser beam, because of the rapid solidification rate, the total number of indications NI has been considered as the response variable coming from NDT; the concrete effectiveness of such a choice will be further discussed when presenting the results.
Before cutting the specimens, the buckling distortion angle β between the welded plates is an interesting variable to be measured in order to consider the heating effect, although no prescriptions are suggested in the normative.
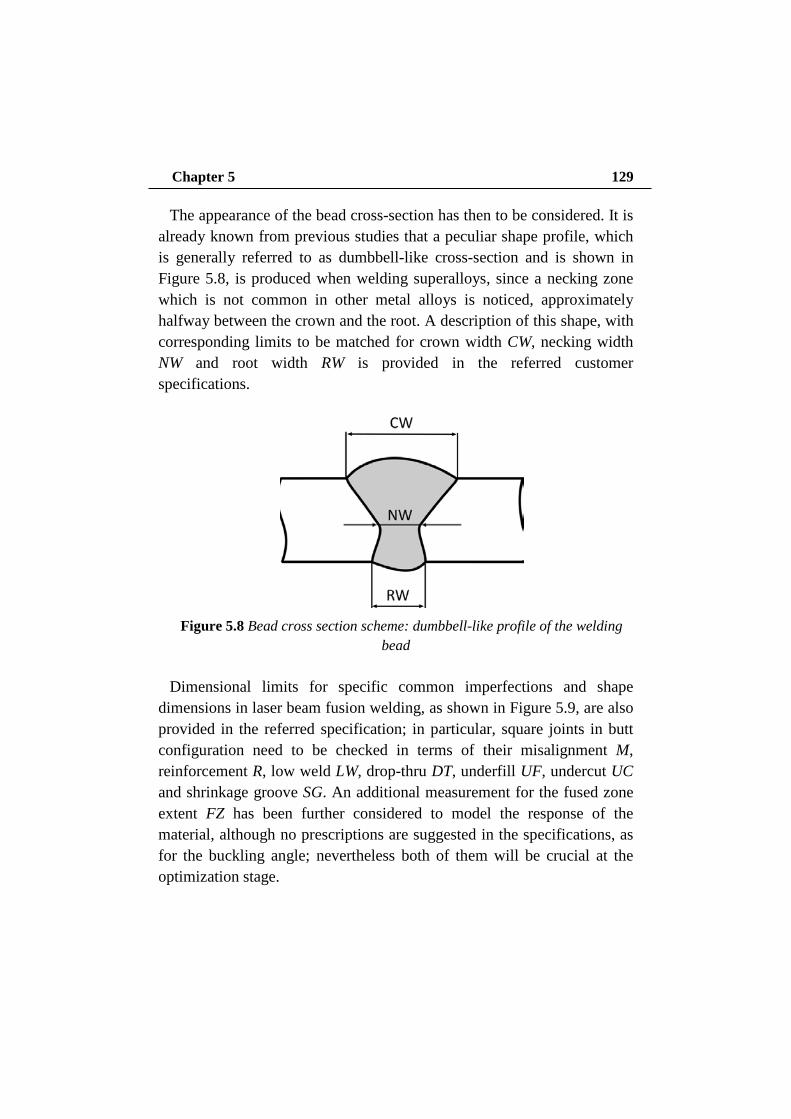
Chapter 5 129 The appearance of the bead cross-section has then to be considered. It is
already known from previous studies that a peculiar shape profile, which is generally referred to as dumbbell-like cross-section and is shown in Figure 5.8, is produced when welding superalloys, since a necking zone which is not common in other metal alloys is noticed, approximately halfway between the crown and the root. A description of this shape, with corresponding limits to be matched for crown width CW, necking width NW and root width RW is provided in the referred customer specifications.
Figure 5.8 Bead cross section scheme: dumbbell-like profile of the welding
bead Dimensional limits for specific common imperfections and shape
dimensions in laser beam fusion welding, as shown in Figure 5.9, are also provided in the referred specification; in particular, square joints in butt configuration need to be checked in terms of their misalignment M, reinforcement R, low weld LW, drop-thru DT, underfill UF, undercut UC and shrinkage groove SG. An additional measurement for the fused zone extent FZ has been further considered to model the response of the material, although no prescriptions are suggested in the specifications, as for the buckling angle; nevertheless both of them will be crucial at the optimization stage.

130 Chapter 5
Figure 5.9 Common defects in laser beam welding to be investigated, as
requested in customer specification
5.8 Results and discussion First of all, visual inspections have been carried out on both sides of the
bead: no spatters have been observed; the bead width on the upper crown and the lower root has been found to be constant along the welding line; also no discoloration, and therefore no oxidation, has been detected on the topside surface neither on the backside one, thus confirming adequate flow rate and diffuser positioning. As an example, the bead surfaces for one of the cube centre point specimen are shown in Figure 5.9.
Uninterrupted fusion throughout the complete length of the joint has to be achieved when welding from the upper side of the joint, unless otherwise designated, as requested in the referred specification.

Chapter 5 131
Figure 5.9 Bead (a) topside and (b) backside surfaces appearance; Haynes
above, Inconel below This caused rejection for all the specimens produced in condition 5,
which did not comply with the complete penetration requirement; as a consequence they did not undergo any further analysis; besides, measurements for certain chosen response variables would not be possible. Notably, the fact that condition 5 is actually on the edge of the CCD domain. The evaluation of the selected response variables has been carried out on the remaining fully penetrative specimens. Average values coming from replications for each processing condition are given in Table 5.6, although quality checks have been referred to each single measurement for variables which need to match specific requirements according to the specification, as mere average values may lead to misjudgments in the case of defect analysis due to compensation in the arithmetic mean. Limits for quality compliance are referred to customer specification.
No indications of surface porosity neither cracks resulted from FPI along the whole bead, while evidences of inclusions or subsurface porosities are detected via RT. When welding nickel alloys, such kind of indications are allowed for stringent quality class compliance, provided they have a maximum size of 0.3 mm in diameter or length, a minimum distance of 10 times the size of the largest adjacent indication and an accumulative length of 0.3 mm per 25 mm of weld.

132 Chapter 5
Tab
le 5
.6 A
vera
ge v
alue
s of g
eom
etri
c fe
atur
es a
nd d
efec
ts fo
r tes
ted
proc
essi
ng c
ondi
tions
FZ
[mm
2 ]
1.71
1.48
0.96
0.85
Excl
uded
due
to la
ck o
f pen
etra
tion
1.55
1.17
1.02
1.12
0.90
1.82
2.01
1.11
1.03
1.10
RW
[μm
]
1195
851
792
497
1286
948
923
675
779
1453
1404
1020
884
801
1650
NW
[μ
m]
708
594
457
378
711
509
493
478
460
485
865
519
470
464
953-
1690
CW
[μm
]
1399
1494
931
880
1284
1061
959
1224
875
1320
1604
1027
924
1091
3150
SG
[μm
]
2.1
3.4
22.7
10.1
51.5
5.5
36.1
0.00
0.00
27.1
12.0
17.9
26.4
0.00
150
UC
[μm
]
29.1
44.3
74.2
115.
1
69.3
51.7
78.9
46.2
24.6
57.4
85.2
53.3
46.2
44.2
150
UF
[μm
]
2.4
6.1
0.00
9.6
250
DT
[μm
]
35.7
21.2
5.1
14.8
5.5
9.6
0.00
25.7
17.6
14.6
4.1
330
LW
[μm
]
12.7
64.0
32.9
20.4
6.50
4.81
36.9
26.7
12.0
12.4
250
R [μ
m]
7.72
10.3
8
36.3
1
5.29
330
M
[μm
]
26.9
48.0
22.2
10.9
26.9
9.4
20.9
6.3
3.0
32.1
12.5
20.1
17.3
26.5
75.0
β
[°]
0.33
1.20
0.69
1.56
0.00
0.40
0.00
1.39
0.48
0.00
0.37
0.15
0.00
1.31
NI
13
17
2 22
0 0 0 13
2 0 0 0 0 0
Cond
.
1 2 3 4 5 6 7 8 9 10
11
12
13
14
15
Lim
its

Chapter 5 133 A number of 6 specimens did not comply with the above-mentioned
quality requirements; nevertheless, it has to be noted anyway that NDT did never completely reject a certain welding condition, as one replication at least is accepted.
Even though any NDT outcome is generally treated as acceptance/rejection basing on limits for allowable indications, the proposal is to consider all the beads anyway in the analysis, provided they are fully penetrative, thus to offer a much more robust model to characterize the effects of the processing parameters: the assumption is that proper optimization criteria would eventually exclude all those welding conditions which do not meet the quality specifications. Interestingly, it has been noticed that those specimen with the highest number of NDT indications also do not meet the referred specifications in terms of allowed maximum size and minimum distance between consecutive indications; this supports the effectiveness of the initial choice of considering the total amount of indications as one of the response variables to be discussed.
An example of the dumbbell-like cross-section for the cube centre point specimen is shown in Figure 5.10: different structures are noticed in the base metals and the bead; as a consequence of the vortex structure in the flow of the melted metal when a key-hole welding condition is produced, Haynes and Inconel result to be mixed in the fused zone.
Figure 5.10 Cross-section for the cube centre point specimen; Haynes on the
left, Inconel on the right

134 Chapter 5 All the welded specimens complied with quality requirements checks in
terms of reinforcement, low weld, drop-thru, underfill and shrinkage groove. As one may expect, reinforcement and low-weld on the upper surface are mutually exclusive, as well as drop-thru and underfill on the lower one. A single out-layer of 107 μm for misalignment in condition 5 and two out-layers of 183 and 169 μm for undercut in conditions 3 and 9 respectively, have been found; as two replications at least are accepted after dimensional checks on defects, the above-mentioned processing conditions are not rejected at all, so they are kept into the results table.
The dumbbell-like shape of the bead cross-section has been considered at the next step. Both CW and RW have met the specification, interestingly with considerable tolerance in respect of the corresponding threshold values; in particular 36% and 63% narrower width have been obtained on average for crown and root respectively. This drives to a much smaller fused zone and, as a consequence, the resulting necking zone is significantly thinner and it ends up to be shifted when compared to the assigned range; nevertheless, in order to provide a more realistic reference to judge even smaller beads such those ones produced when welding superalloys with a disk-laser, new limits for NW are suggested as a percentage on CW, so that the corresponding range is a function of the crown and, therefore, of the welding condition. In a way which is consistent with the principle of the normative and its referring range, a lower limit of 30% and an upper one of 60% with respect of the crown width may be defined for NW.
5.9 Optimization of the responses
With the only exclusion of condition 7 due to lack of penetration, all the
welding conditions which have been examined in the experimental plan are adequate to make the quality requirements be matched in terms of compliance to NDT, limits for each possible imperfection and shape geometry; the ANOVA has been therefore carried out upon their response variables, aiming to test the effective influence of the controlling

Chapter 5 135
parameters on each welding outcome. The misalignment has been considered as a result of improper clamping, rather than improper processing condition; therefore its modeling has been neglected. The shape factors CW/NW and CW/RW have been defined at this stage in order to give a synthetic description of the bead cross section, thus easing both the modeling of the bead dumbbell-like shape and the next choice of the optimization constraints.
A lack-of-fit test with a step-wise regression method has been used to eliminate any non -significant term in each model whose significance has been eventually assessed in terms of p-values and adjusted R-Squared. As p-values are indicative of the probability of rumour effect on the considered response variable, models are intended to be significant when they result in p-value of not more than 0.05; additionally, the adjusted R-squared is expected to be close to 1, being it a measure of the model capability in accounting the variation of the dependent variable. Once modeled, misalignment, reinforcement, low weld, drop-thru, underfill, undercut and shrinkage groove did not show adequate significance: it is inferred that a random influence arise due to both the upper and lower gas fluxes, which directly interact with the fused metal, although supplied at constant flow rate to result in perfect shielding.
Table 5.7 Resulting p-values and adjusted R-squared factors
Response variable
p-value Adjusted
R-squared
NI < 0.0001 0.438
β [°] < 0.0001 0.896
CW/NW < 0.0001 0.723
CW/RW < 0.0001 0.881
FZ [mm2] < 0.0001 0.877
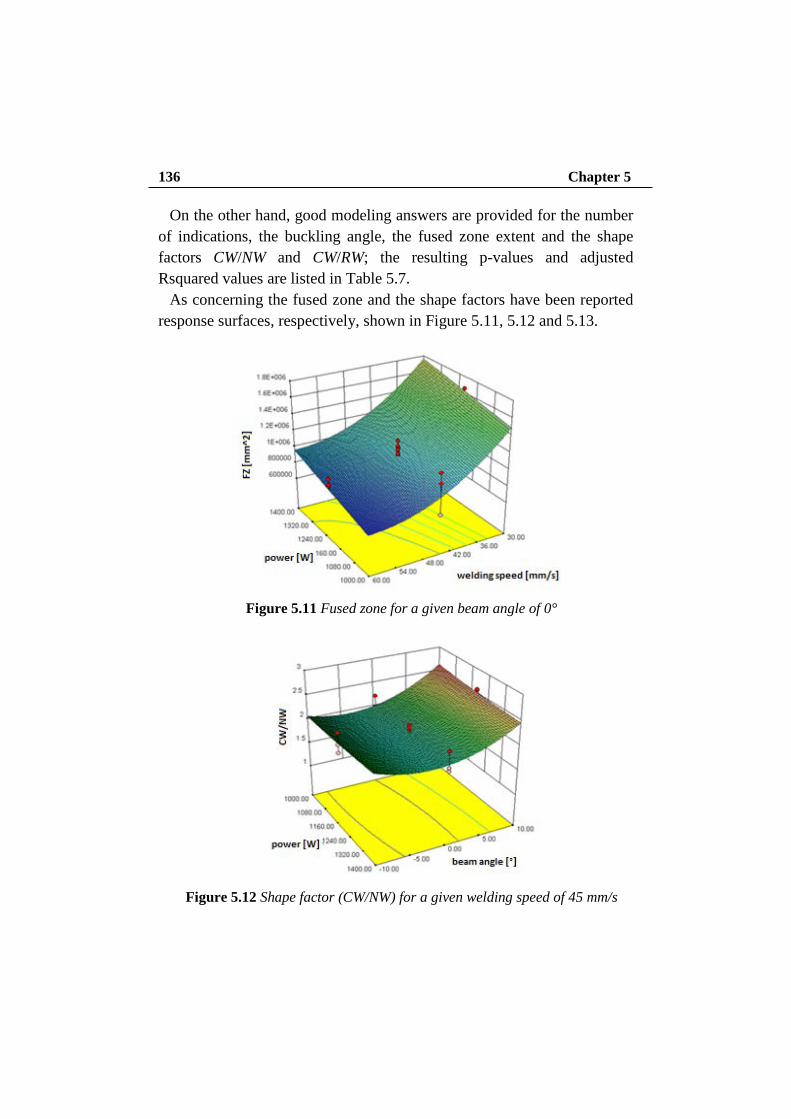
136 Chapter 5 On the other hand, good modeling answers are provided for the number
of indications, the buckling angle, the fused zone extent and the shape factors CW/NW and CW/RW; the resulting p-values and adjusted Rsquared values are listed in Table 5.7.
As concerning the fused zone and the shape factors have been reported response surfaces, respectively, shown in Figure 5.11, 5.12 and 5.13.
Figure 5.11 Fused zone for a given beam angle of 0°
Figure 5.12 Shape factor (CW/NW) for a given welding speed of 45 mm/s

Chapter 5 137
Figure 5.13 Shape factor (CW/RW) for a given welding speed of 45 mm/s
The ANOVA-significant response variables have been considered to
feed the optimization process with the corresponding constraints.
5.10 Constraint criteria for optimization Specific constraint criteria need to be set for the chosen response
variables. Nevertheless, with respect to the bead aspect, each constraint necessarily have to be awarded different weight, ranging from 0 to 1, on a technological basis. In principle, the minimization of the fused zone is required, aiming to reduce the amount of material which is directly affected by the laser beam; a low weight of 0.4 has been awarded, since previous measurements on cross-section crown and root widths did already show very good agreement with the referred specification
With respect to the shape, any constraint to be placed need to be consistently referred to the real and unavoidable behavior of the alloy in the weld cross section, this meaning that a demand for a steep key-hole shape is not feasible; nevertheless, an ideal regular rectangular geometry

138 Chapter 5
with no necking zone and with adequate fusion on both the upper and the lower surface should be achieved, so both the shape factors have been targeted to 1, even though a higher weight of 0.8 against 0.4 has been awarded to the factor involving NW, being it related to the zone where stresses would be more critical. Maximum importance has been assigned to minimization of the total number of indications and the buckling angle, since the former relates to possible weakening in the bead and the latter is an evidence of residual thermal stresses which are detrimental to the operating life of the weld. Under these constraints, the optimization procedure has been carried out.
Many procedures are feasible to solve constrained nonlinear optimization problems. The penalty function method has been preferred in order to convert the constrained optimization problem into an unconstrained one, so that penalties would be awarded to any processing conditions which do not approach the optimum of the model neither satisfy the constraint equations.
Then, the goals are combined into an overall desirability function: this approach is widely used in industry for the optimization of multiple response processes. The desirability function ranges between 0 and 1, from a completely undesirable value and an ideal response. The first five solutions of the optimization process are listed in Table 5.8 with corresponding desirability function values.
Table 5.8 Resulting desirability values
P
[W] s
[mm/s α [°] NI β
[°] CW/NW CW/RW FZ [mm2] Des.
1 1345 55.7 -7.47 0 0.00 1.98 1.00 0.98 0.888
2 1345 55.8 -7.52 0 0.00 1.98 1.00 0.98 0.887
3 1249 48.5 -1.84 0 0.07 1.94 1.00 0.99 0.887
4 1247 48.1 -1.88 0 0.06 1.94 1.00 0.99 0.887
5 1245 48.0 -1.90 0 0.06 1.94 1.00 0.99 0.887

Chapter 5 139 An optimal processing condition which has not been tested in the
experimental plan, with 1350 W power level, 55 mm/s welding speed and -7.5° beam angle is clearly suggested since the highest desirability is reached, with no expected buckling distortion. Therefore, it is worth being investigated in terms of mechanical properties.
5.11 Optimal processing condition:microhardness and
tensile tests The processing parameters in the suggested optimal condition have been
set to produce new 100 mm long welding beads, to be checked with the same post welding procedure which has already been used for the samples in the experimental plan, and additional specimens to be tested in terms of tensile strength. All of them did undergo NDTs, resulting in no indications; an example of an x-ray transmitted image of the welding bead to be tensile-tested is provided in Figure 5.14.
Figure 5.14 Welding bead x-ray transmitted image; Haynes above, Inconel
below Furthermore, no buckling distortions have been produced and any
random cross section has successfully matched the limits for defects and geometry in the referred specification. As an example, a cross-section is shown in Figure 5.15; mean values of 958 μm for CW, 517 μm for NW and 951 μm for RW have been measured, within a 1.03 mm2 mean FZ.

140 Chapter 5
Figure 5.15 Cross-section for the specimen in the suggested optimal
condition; Haynes on the left, Inconel on the right Significant differences can be spotted in the cross-section shape,
compared to a non optimal specimen, such as the one produced in the cube centre point condition, since comparable values are now obtained for CW and RW as a consequence of the relative high weight which has been awarded to the constraint involving the CW/RW factor when optimizing the process.
Microhardness test Any welding process is expected to produce unavoidable heat affected
zone (HAZ) at the interface between the fused area and the base metal; HAZ is therefore intended to be any fraction of base metal which has not been melted, but whose mechanical properties or microstructure have been altered by the heat source of welding. The HAZ extent depends on the processing condition and need to be assessed to consider possible undesirable micro structural changes in the material. The HAZ of the etched tested welds can be clearly seen with optical microscope, but only at the Haynes side, as shown in Figure 5.16, and is supposed to have a mean extent of less than 20 μm

Chapter 5 141
Figure 5.16 Heat affected zone at the Haynes side; base material on the left,
fused zone on the right Nevertheless, since it has been suggested that metallographic etching is
not enough for adequate and persuasive HAZ evaluation and in order to embrace the material response at the Inconel side, Vickers micro hardness tests have been carried out with reference to the corresponding normative (EN ISO, 2005). Indentations have been made at mid-thickness of the work-piece.
Suitable indenting load is required to measure the hardness distribution of the weld. It has been proved that indenting load of 0.05 kgf are inappropriate as significant deviations are observed in the testing portion due to microstructure variation in the grains; on the other hand, much larger indenting loads result in larger indentations which are not capable of differentiating a narrow expected HAZ, given the requirement to ensure a minimum gap between indentations (EN ISO, 2005), thus avoiding overlapping of indented areas across the testing region. An indenting load of 0.200 kgf has therefore been deemed to be appropriate to adequately satisfy both the needs.
The micro hardness profile across the section is shown in Figure 5.17 as a function of the indentation position. Values of 270 and 240 HV0.2 have been obtained on average for as-received Haynes and Inconel respectively. An increasing trend is noticed at the Haynes side towards the fused zone; a 330 HV0.2 peak is achieved close to the fused zone, where peculiar grain morphology is pointed out in metallographic analyses. Base values are more quickly recovered at the Inconel side

142 Chapter 5
instead, once crossed the fused zone boundary. As a consequence of mixing, micro hardness mean values in the fused zone itself are lower than those ones in the Haynes HAZ, although higher than those ones at the Inconel side anyway.
Figure 5.17 Vickers microhardness trend along the welding bead
Tensile test Three specimens of same shape and size as shown in Figure 5.18 in
accordance with AWS specification, have been milled from three independent welding beads, then tested in perpendicular direction to the welding bead with 6 MPa/s increasing load at room temperature.
Figure 5.18 Tensile specimen according to AWS B4.0 specification; all
dimensions in millimeters
-3.5 -3.0 -2.5 -2.0 -1.5 -1.0 -0.5 0.0 0.5 1.0 1.5 2.0 2.5 3.0 3.5200
220
240
260
280
300
320
340FZ INCONEL 718
HV0.2
Distance from weld center [mm]
HAYNES 188
60
R 15
12.520

Chapter 5 143 The specimens experienced fracture in the base material, at the Inconel
side, 15 mm at least away from the welding bead, as shown in Figure 5.19
Figure 5.19 Failure location in fractured tensile specimen
The tensile tests outcome do therefore match the Vickers micro
hardness result, since Inconel did already show lower hardness compared to Haynes; furthermore, it also suggests that micro-fissures and Laves phase issues in the HAZ are overcome. The corresponding stress-strain diagram is shown in Figure 5.20, where the yield point is clearly spotted. Average values of mechanical properties at room temperature in the hybrid structure of welded Haynes and Inconel as obtained from the tensile tests are listed in Table 5.9 in comparison with the corresponding values in the base materials.
Figure 5.20 Stress-strain diagram for hybrid Haynes-Inconel welded specimen
0.00 0.05 0.10 0.15 0.20 0.25 0.30 0.350
100
200
300
400
500
600
700
800
900
1000
Stre
ss [M
Pa]
Strain [mm/mm]

144 Chapter 5
Table 5.9 Mechanical properties at room temperature for base metals and resulting hybrid welded structure
Haynes 188 Inconel 718 Hybrid welded structure
Young modulus [GPa] 232 211 218
Yield strength [MPa] 465 550 470
Ultimate tensile Strength [MPa] 945 965 928
Elongation [% in 51 mm] 52.9 30 32

Chapter 6 Edge joint laser welding of Nickel Superalloy
6.1 Introduction In this study edge joint tests on 0.7 mm-thick Inconel 625 sheets were
performed using the automated laser welding apparatus. Inconel 625 is among the most common and representative aerospace
superalloys, is employed for nozzle guide vanes (NGV) and is the subject of this research paper, since an alternative to traditional welding technologies is discussed aiming to give grounds to industrial improvements. Welding is indeed generally addressed special consideration being it often a necessary process during fabrication and assembly of simple to complex shaped turbine parts. Relating to this area, aeronautic industry has been constantly and progressively working in developing and validating any new technology in a bid to reduce operating and designing costs.
A Trumpf TruDisk 2002 Yb:YAG disk-laser with D70 focusing optics was employed to produce edge joint beads in square groove configuration and a special glove box for gas supply was designed to upgrade the welding head.
A design of experiment approach was taken aiming to study possible interactions among the governing factors. Power and welding speed are considered as crucial input variables since they determine the thermal input to the work-piece. Sensible outer limits of the range to be explored for each factor are found via ad hoc BOP extensive trials and butt welds on base metal, as well as referring to previous studies on similar superalloys. Results were discussed referring to bead profile, microstructure and X-rays, aiming to provide useful and effective data for

146 Chapter 6
actual industrial application to join upper and lower airfoil camber side in NGV and study issues in Inconel 625 laser welding.
6.2 Material: Inconel 625 Nickel Superalloy
Inconel 625is used for its high strength, excellent fabricability
(including joining), and outstanding corrosion resistance. Service temperatures range from cryogenic to 982°C. Composition is shown in Table 6.1.
Table 6.1 Nominal chemical composition of Inconel 625
Cr Mo Fe Nb (+Ta) Co Mn Si Al Ti C Ni
20-23 8-10 5 3.15-4.15 1 0.5 0.5 0.4 0.4 0.1 Balanced
Strength of Inconel alloy 625 is derived from the stiffening effect of
molybdenum and niobium on its nickel-chromium matrix; thus precipitation-hardening treatments are not required. This combination of elements also is responsible for superior resistance to a wide range of corrosive environments of unusual severity as well as to high-temperature effects such as oxidation and carburization.
The properties of Inconel 625 that make it an excellent choice for sea-water applications are freedom from local attack (pitting and crevice corrosion), high corrosion-fatigue strength, high tensile strength, and resistance to chloride-ion stress-corrosion cracking. It is used as wire rope for mooring cables, propeller blades for motor patrol gunboats, submarine auxiliary propulsion motors, submarine quick-disconnect fittings, exhaust ducts for navy utility boats, sheathing for undersea communication cables, submarine transducer controls, and steam-line bellows. Potential applications are springs, seals, bellows for submerged controls, electrical cable connectors, fasteners, flexure devices, and oceanographic instrument components. High tensile, creep, and rupture strength;

Chapter 6 147
outstanding fatigue and thermal-fatigue strength; oxidation resistance; and excellent weldability and brazeability are the properties of Inconel 625 that make it interesting to the aerospace field. It is being used in such applications as aircraft ducting systems, engine exhaust systems, thrust-reverser systems, resistance-welded honeycomb structures for housing engine controls, fuel and hydraulic line tubing, spray bars, bellows, turbine shroud rings, and heat-exchanger tubing in environmental control systems. It is also suitable for combustion system transition liners, turbine seals, compressor vanes, and thrust-chamber tubing for rocket motors.
The outstanding and versatile corrosion resistance of Inconel 625 under a wide range of temperatures and pressures is a primary reason for its wide acceptance in the chemical processing field. Because of its ease of fabrication, it is made into a variety of components for plant equipment. Its high strength enables it to be used, for example, in thinner-walled vessels or tubing than possible with other materials, thus improving heat transfer and saving weight. Some applications requiring the combination of strength and corrosion resistance offered by Inconel 625 are bubble caps, tubing, reaction vessels, distillation columns, heat exchangers, transfer piping, and valves
6.3 Automated laser welding apparatus for edge joint
configuration
6.3.1 Edge joint configuration Edge welds are used where the edges of two sheets or plates are
adjacent and are in approximately parallel planes at the point of welding. Figure 6.1 shows several types of edge weld designs. These designs are common only in structural use. Since the weld does not penetrate completely through the joint thickness, it should not be used in stress or pressure applications.
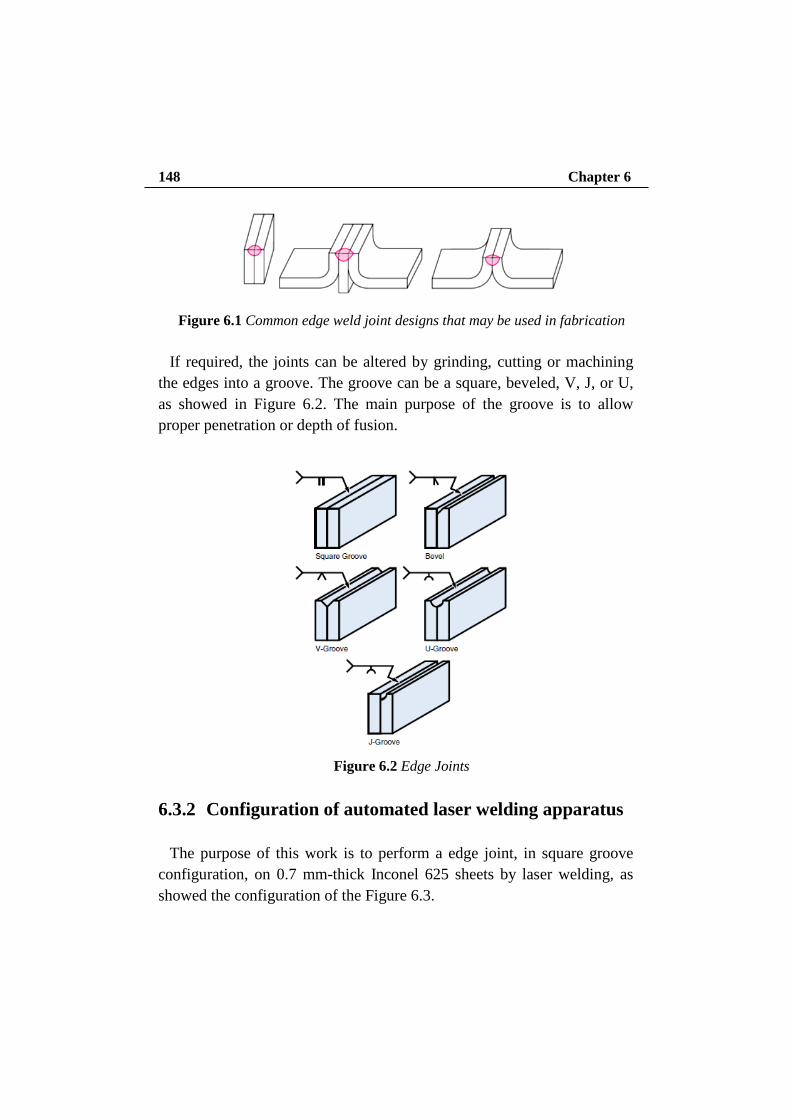
148 Chapter 6
Figure 6.1 Common edge weld joint designs that may be used in fabrication
If required, the joints can be altered by grinding, cutting or machining
the edges into a groove. The groove can be a square, beveled, V, J, or U, as showed in Figure 6.2. The main purpose of the groove is to allow proper penetration or depth of fusion.
Figure 6.2 Edge Joints
6.3.2 Configuration of automated laser welding apparatus
The purpose of this work is to perform a edge joint, in square groove
configuration, on 0.7 mm-thick Inconel 625 sheets by laser welding, as showed the configuration of the Figure 6.3.

Chapter 6 149
Figure 6.3 Laser welding in edge joint configuration
The need for proper shielding when welding superalloys has been
pointed out in literature. In this type of joint the weld bead extending over all (or almost completely) the two edges of the end portions of the two sheets. However, due to the configuration of the particular edge joint seam, the flow shield is concerned, therefore, shielding would not be effective through a plane diffuser, such as that used in previous work.
In fact, the Figure 6.4 below shows the high degree of oxidation that is had by performing the welding tests.
Figure 6.4 Oxidation level of the Inconel 625 in preliminary tests
Therefore, a special device has been designed and produced, as shown
in Figure 6.5. The perforated bottom plate of the upper diffuser of the
WELDING HEAD
WELDING DIRECTION

150 Chapter 6
apparatus automated laser welding has been modified according to a tunnel shape (an inverted V shape with side walls which form an angle greater than 0 ° and preferably not exceeding 30 °) in order to obtain optimum shielding of the molten pool in the presence of the edge joint configuration.
Preliminary trials with this configuration for bead protection, resulted in improper shielding of the bead, with oxidation of the bead crown. Hence, two sliding plates were added on the back-side of the diffuser in order to prevent the gas from leaving the welding area, thus improving the effectiveness of inert atmosphere.
Figure 6.5 New configuration of the upper diffuser
Because the weld bead is equal (or almost equal) to the entire thickness
of the two plates is necessary that the inert gas acts not only on the two edges of the ends of the two plates that are affected by the laser beam, but also on the outer parts of the portions ends of the two plates that are in close proximity of the welding bead. For this purpose, a conformation gallery of perforated bottom plate of the upper diffuser allows the joint to pass under upper diffuser protecting from oxidation and nitriding both edges of the end portions of the two plates that are in direct contact with

Chapter 6 151
the laser beam is the outer parts of the end portions of the two plates that are in the near of the welding bead, as shown in Figure 6.6.
Figure 6.6 Edge joint of Inconel 625 without oxidation
6.4 Design of experiment Inconel 625 in 0.7 mm thick sheets was considered to produce welding
beads in edge joint configuration. A design of experiment approach was taken in this work. Power and welding speed are considered as crucial input variables since they determine the thermal input to the work-piece; furthermore, previous research on superalloys welding had shown benefits from tilted beams; any stand-off of the focal position is discarded instead since reasons to avoid defocusing are pointed out in literature with respect to experimental welding of Inconel 718 with CO2 lasers, as focus positions above or below the upper surface resulted in porosity, spatters or concave welds.
Sensible outer limits of the range to be explored for each factor were found via ad hoc BOP extensive trials and butt welds on base metal, as well as referring to previous studies on similar superalloys in terms of metallurgical behavior. In particular, the window for the welding parameters was chosen aiming to melt the total thickness of the sheets in edge joint.

152 Chapter 6 A 2-factors study with power and welding speed as leading governing
parameters was arranged. At a first stage analysis, 3 levels were chosen for laser power and 4 levels for welding rate. The resulting welding conditions of the plan are listed in Table 6.2. As two replications of each test were planned, a total of 24 welding specimens was produced.
Table 6.2 Welding conditions of the experimental plan
Condition Power
[W] Welding speed
[mm/s] Thermal input
[J/mm] 1 800 20 40.0 2 800 35 22.9 3 800 50 16.0 4 800 65 12.3 5 1000 20 50.0 6 1000 35 28.6 7 1000 50 20.0 8 1000 65 15.4 9 1200 20 60.0
10 1200 35 34.3 11 1200 50 24.0 12 1200 65 18.5
6.5 Results and discussions
6.5.1 Visual inspections
Based on the fact that shiny beads were produced, shielding was
assumed to be appropriate and effective. A dependence on the thermal input was observed. In particular, in welding conditions with a thermal input equal to or higher than 28.6 J/mm an uneven bead was obtained. Specimens shown in Figures 6.7 and 6.8 proved that welds produced with different welding parameters but characterized by thermal input higher
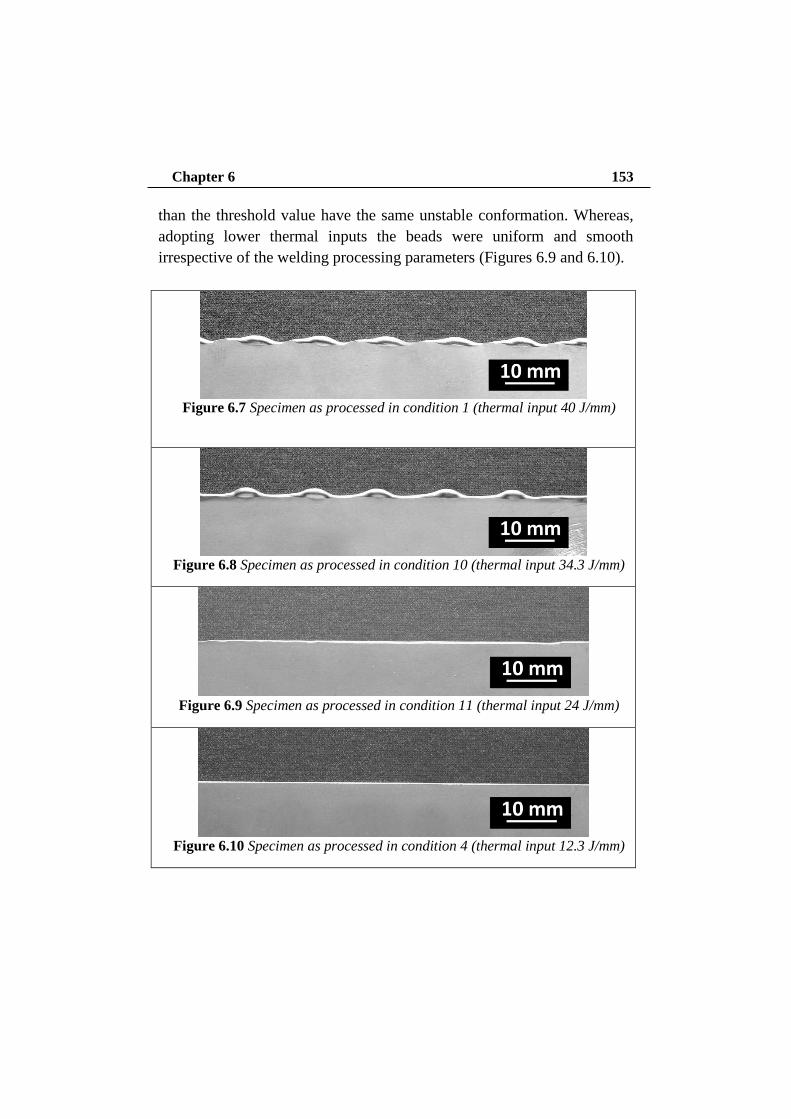
Chapter 6 153
than the threshold value have the same unstable conformation. Whereas, adopting lower thermal inputs the beads were uniform and smooth irrespective of the welding processing parameters (Figures 6.9 and 6.10).
Figure 6.7 Specimen as processed in condition 1 (thermal input 40 J/mm)
Figure 6.8 Specimen as processed in condition 10 (thermal input 34.3 J/mm)
Figure 6.9 Specimen as processed in condition 11 (thermal input 24 J/mm)
Figure 6.10 Specimen as processed in condition 4 (thermal input 12.3 J/mm)
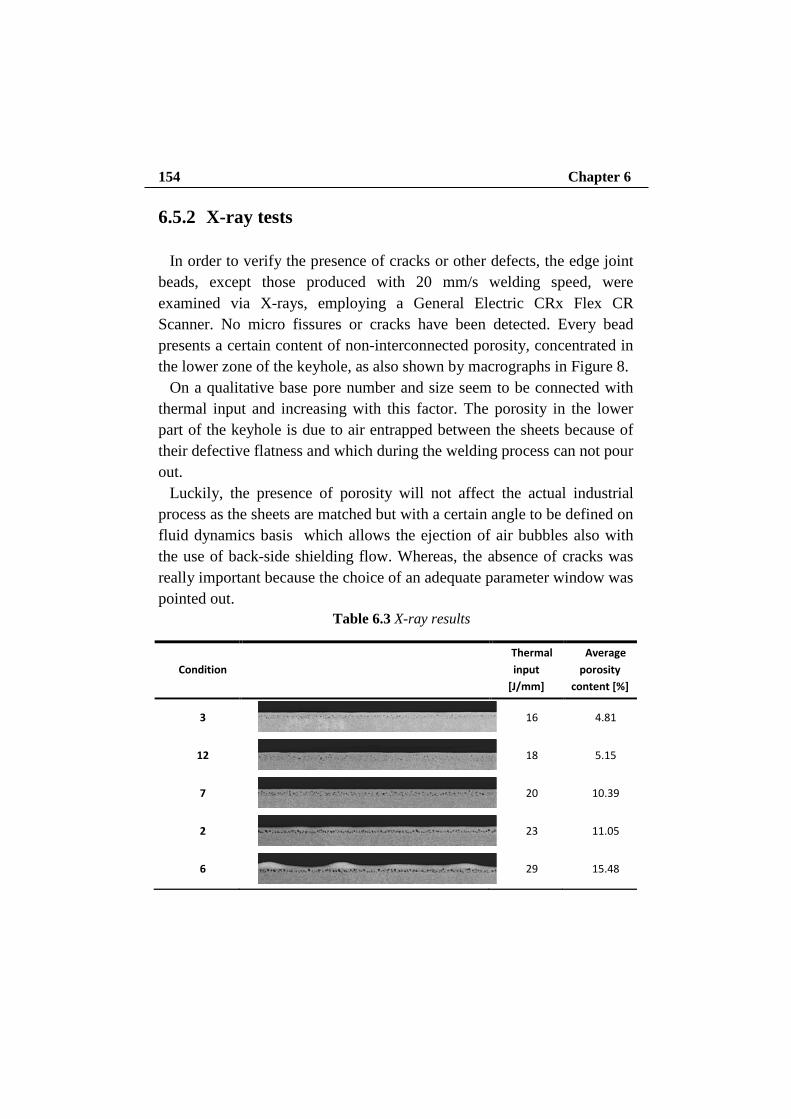
154 Chapter 6
6.5.2 X-ray tests In order to verify the presence of cracks or other defects, the edge joint
beads, except those produced with 20 mm/s welding speed, were examined via X-rays, employing a General Electric CRx Flex CR Scanner. No micro fissures or cracks have been detected. Every bead presents a certain content of non-interconnected porosity, concentrated in the lower zone of the keyhole, as also shown by macrographs in Figure 8.
On a qualitative base pore number and size seem to be connected with thermal input and increasing with this factor. The porosity in the lower part of the keyhole is due to air entrapped between the sheets because of their defective flatness and which during the welding process can not pour out.
Luckily, the presence of porosity will not affect the actual industrial process as the sheets are matched but with a certain angle to be defined on fluid dynamics basis which allows the ejection of air bubbles also with the use of back-side shielding flow. Whereas, the absence of cracks was really important because the choice of an adequate parameter window was pointed out.
Table 6.3 X-ray results
Condition Thermal input
[J/mm]
Average porosity
content [%]
3
16 4.81
12
18 5.15
7
20 10.39
2
23 11.05
6
29 15.48

Chapter 6 155 From a quantitative point of view X-ray results are summed in Table
6.3. In order to evaluate the average content of porosity, as measured from the X-rays transmitted images, a welded length of 50 mm was referred to. An increasing content of porosity was noticed as a function of increasing thermal input.
6.6 Macrographic examinations
For each of the 24 welded beads, 3 cross cuts were performed along the
welding direction in order to evaluate the bead features. Referring to Figure 6.11, the following items were measured: extent of the fused zone (FZ), bead width (W) and bead height (H). In particular, the bead height has been measured between crown and tip, since any reference with respect to the original edge was lost in welding.
Figure 6.11 Main geometric features of the bead
The macrographs for each one of the welding conditions are listed in
Figure 6.12. It is clear that when considering a welding speed of 20 mm/s, hence with a resulting thermal input of 40 J/mm or higher, the development of the typical key-hole shape, which is the evidence of actual metallurgical joining, is prevented, due to large extent of the fused
HW
FZ

156 Chapter 6
zone and instability produced by the shielding flux. Nevertheless, an increase of the extent of the fused zone was noticed with increasing thermal input, as shown in Figure 6.13.
800 W 1000 W 1200 W
20 m
m/s
35 m
m/s
50 m
m/s
65 m
m/s
-
Figure 6.12 Macrographs for the 12 welding conditions
Moreover, when providing low thermal inputs below 30 J/mm, the
effect on the extent of the fused zone is restrained, although a significant change is noticed for both the bead width and height, whose ratio can be considered to be a shape-factor of the welded bead. A specific dependence on power and welding rate is in place for both the bead width

Chapter 6 157
and height, with low or no interactions at all. Referring to Figure 6.14 (a) and (b), the bead height is strongly dependent on the power for each level of the welding rate, whereas the dependence on the welding rate is significant only when the highest power is considered.
Figure 6.13 Melted area vs. thermal input
(a)
10 20 30 40 50 600
2
4
6
8
Mel
ted
area
[mm
2 ]
Thermal input [J/mm]
800 1000 1200
1600
2000
2400
2800
Heig
ht [µ
m]
Power [W]
35 mm/s 50 mm/s 65 mm/s

158 Chapter 6
(b)
Figure 6.14 Bead height as function of power (a) and welding speed (b)
A different behavior is noticed for the bead width which has low
dependence on the power, whilst being strongly dependent on the welding rate, as shown in Figure 6.15 (a) and (b).
(a)
35 50 65
1600
2000
2400
2800He
ight
[µm
]
Speed [mm/s]
800 W 1000 W 1200 W
800 1000 1200
400
500
600
700
800
Key-
hole
wid
th [µ
m]
Power [W]
35 mm/s 50 mm/s 65 mm/s

Chapter 6 159
(b)
Figure 6.15 Key-hole width as function of power (a) and welding speed (b)
6.7 Micrographic examinations
Stiffness in Inconel 625 is a result of molybdenum and niobium addition
in a nickel-chromium face-centred-cubic base matrix. Carbides are found to be rich in nickel, niobium and molybdenum in the base metal. As a consequence of welding thermal cycles, the microstructure of the fused zone consists of dendritic grains with columnar shape in the direction of the thermal gradient. As an example, micrographs of the specimens in condition 4 and 9 are shown in Figure 6.16.
Figure 6.16 Micrographs of the specimens in condition 4 (left) and 9 (right)
35 50 65
400
500
600
700
800
Key-
hole
wid
th [µ
m]
Speed [mm/s]
800 W 1000 W 1200 W

160 Chapter 6 With respect to the key-hole, where cooling rates are lower compared to
the bead crown, brittle intermetallics which would affect the mechanical features of the joint are not produced. As concerning the grain size, a dependence was observed as a function of the thermal input: in particular, a decrease in the grain size results as a consequence of decreasing thermal input. Similar findings are provided in literature when considering the same alloy in square butt configuration to be welded via fiber laser. The structure of the above-mentioned specimens is compared in Figure 6.17. No heat affected zones where noticed according to metallographic analyses in conjunction with specific micro hardness tests.
Figure 6.17 Comparison of structure of the specimens in condition 4 (left) and 9 (right)

Conclusions In the present thesis an automated laser welding apparatus was designed
and developed in order to perform laser , that allows to achieve laser welding in a controlled, versatile, efficient, reliable, simple, and economical way. This system allows to shield not controlled from oxidation and nitriding process. The automated laser welding apparatus (patent number: SA2012A000016) was tested with three different joints: butt welding of 3 mm thick Ti6Al4V plates; dissimilar butt welding of 1.5 mm thick of Haynes 188 and Inconel 718 and edge joint of 0.7 mm thick Inconel 625 sheets.
A study on 3 mm-thick Ti6Al4V plats in square butt welding configuration was conducted. Uniform, smooth and shiny beads were produced, thus confirming the adequate shielding rate and nozzle positioning. The fused zone of the bead consisted of acicular α’ martensite, because the welding thermal cycles resulted in quenching the alloy from the β phase region above the β-transus. The stringent quality requirements were met for defects such as undercut, reinforcement and excessive penetration.
Defocusing had no effect on the trend of the extent of the fused zone; nevertheless, a clear effect of defocusing on the crown and the root width was noticed, therefore the bead profile is clearly influenced by the focus position. A decrease of the laser power or an increase of the welding speed yield a corresponding decrease in the root to crown width ratio, as the typical shape of the key-hole is approached. Considering the response surfaces, a decrease in the mean grain size was observed when defocusing.

162 Conclusions The optimization was eventually carried out; minimization was required
for both the extent of the fused zone and the mean grain size; an optimal range for the root to crown width ratio was deemed to be crucial. In particular, a solution with a power of 1820 W, a speed of 23 mm/s with 3 mm of negative defocusing and an overall desirability of 92% was found. The optimum condition was tested via tensile tests; fracture was experienced in the original gauge length, at reasonable distance from the beads.
Many issues are expected when welding dissimilar metals. Nevertheless, convincing results were provided to give grounds to process improvements in industrial environments, since dissimilar autogenous laser beam welding of Haynes 188 and Inconel 718 was successfully addressed with no pre heating, neither need for mechanical finishing. No spatters neither oxidation was detected both on the top and backside of the bead, since adequate shielding is provided thanks to the device for gas supply.
Dimensional limits for indications, specific common defects and shape dimensions, as provided into industrial specification, were effectively matched.
The optimization of the testing conditions in the experimental plan provided an optimal processing set with 1350 W power level, 55 mm/s welding speed and -7.5° beam angle positioning. The eventual mechanical assessment highlighted an increasing trend in Vickers micro hardness values at the Haynes side only, whilst mixed values were achieved in the fused zone; furthermore, tensile tests suggested that microfissures and Laves phase issues which are common when using arc or electron beam sources were overcome, since fracture was experienced in the base metal, at the Inconel side, at convincing distance from the joint.
In literature laser welding of Inconel 625 edge joint beads in square groove configuration were not examined before, therefore the main purpose of the work was a feasibility study and, moreover, the analysis of welding key parameters, and their influence on bead geometry.

Conclusions 163
Furthermore, since the alloy in exam was susceptible to oxidation, the issue of proper shielding was considered, developing a special glove box.
A dependence on thermal input was observed for the grain size and the content of porosity. The presence of porosity would not affect the actual industrial process where the sheets are joined with a proper angle which allows the ejection of air bubbles. No micro fissures or cracks were detected via X-rays.

References • William T. Silfvast, Lasers, Fundamentals of Photonics, Module 5 • H.Haken, “Light”, Laser Light Dynamics, Volume 2 • Melles Griot “Introduction to Laser Technology” • Silfvast, William T. Laser Fundamentals. New York: Cambridge
University Press, (1996) • A. Giesen et al., “Scalable concept for diode-pumped high-power
solid-state lasers”, Appl. Phys. B 58, 363 (1994) • P. Klopp et al., “Highly efficient mode-locked Yb:Sc2O3 laser”,
Opt. Lett. 29 (4), 391 (2004) • SeyfollahToroghi, Ahmad Khayat Jafari, Ala Hashemi Golpayegani
“The effect of temperature on absorption in end-pumped Yb:YAG thin disk lasers”, Optics & Laser Technology 41 (2009) 800–803
• R. Peters, C. Krankel, K. Petermann, G. Huber, “Power scaling potential of Yb:NGWin thin disk laser configuration”, Lasers and Optics, Appl. Phys. B 91, 25–28 (2008)
• Giesen, A., Speiser, J., (2007), “Fifteen Years of Work on Thin-Disk Lasers: Results and Scaling Laws”, Journal of Selected Topics in Quantum Electronics,Vol. 13, No 3, 598-609
• A. Baum et al. “Axial mode tuning of a single frequency Yb:YAG thin disk laser", Lasers and Optics, Appl. Phys. B 81, 1091–1096 (2005)
• C. Krankel, et al. “Continuous-wave high power laser operation and tunability of Yb:LaSc3(BO3)4 in thin disk configuration”, Lasers and Optics, Appl. Phys. B 87, 217–220 (2007)

References 165 • Capello, E., 2008. Le lavorazioni industriali mediante laser di
potenza, Maggioli Editore. • Steen, W. M. (2003). Laser Material Processing. Springer, London,
pp. 157-199. • Donachie, M. J. (2000). Titanium, a technical guide. ASM
International, USA. • Duley, W.W., 1998. Laser welding, Wiley-Interscience. • Caiazzo, F., Curcio, F., Daurelio, G., Memola Capece Minutolo, F.,
(2004), Ti6Al4V Sheets Lap and Butt Joints Carried out by CO2 Laser: Mechanical and Morphological Characterization, Journal of Material Processing Technology, 149, 546-552.
• Cao, X., Jahazi, M., (2009), Effect of Welding Speed on Butt joint Quality of Ti6Al4V Alloy Welded Using a High-Power Nd:YAG Laser, Optics and Lasers in Engineering, 47, 1231-1241.
• Fabrizia Caiazzo, Vittorio Alfieri, Francesco Cardaropoli, Gaetano Corrado, Vincenzo Sergi (2013). Characterization of disk-laser dissimilar welding of titanium alloy Ti-6Al-4V to aluminum alloy 2024. Proceedings of Spie, The International Society For Optical Engineering, p. 1-11, ISSN: 0277-786X, doi: 10.1117/12.2004681
• Sun, Z., Pan, D., Zhang, W., (2002), Correlation Between Welding Parameters and Microstructures in TIG, Plasma, and Laser Welded Ti-6Al-4V, 6th International Conference Trends in Welding Research, Pine Mountain, Georgia, USA, 760-767
• Tillack D.J., 2007. Welding superalloys for aerospace applications, Welding Journal, vol. 1, pp. 28-32.
• Petronic S., Drecun-Nesic S., Milosavljevic A., Sedmak A., Popovic M., Kovacevic A., 2009. Microstructure changes of nickel-base superalloys induced by interaction with femtosecond laser beam, Acta Physica Polonica A, vol. 116, n. 4, pp. 550-552.
• Teresa Sibillano et al, (2006), A study of the shielding gas influence on the laser beam welding of AA5083 aluminium alloys by in-process spectroscopic investigation, Optics and Lasers in Engineering 44 1039–1051

166 References • Zapirain F., Zubiri F., Garciandía F., Tolosa I., Chueca S., Goiria A,
2011. Development of laser welding of Ni based superalloys for aeronautic engines applications (Experimental process and obtained properties), Physics Procedia, vol. 12, pp. 105-112.
• Fabrizia Caiazzo, Gaetano Corrado, Vittorio Alfieri, Vincenzo Sergi, Luigi Cuccaro (2013). Disk-laser welding of Hastelloy X cover on René 80 turbine stator blade . Proceedings of Spie, The International Society For Optical Engineering, p. 1-10, ISSN: 0277-786X, doi: 10.1117/12.2010572
• Cao, X., Jahazi, M., Immarigeon, J., P., Wallace, W., (2006), A Review of Laser Welding Techniques for Magnesium Alloys, Journal of Materials Processing Technology, 171/2, 188-204
• Ernesto Mastrocinque, Gaetano Corrado, Fabrizia Caiazzo, Nicola Pasquino, Vincenzo Sergi (2012). Effect of Defocusing on Bead-on-Plate of Ti6Al4V by Yb:YAG Disk Laser. Advanced Materials Research, vol. 383-390, p. 6258-6264, ISSN: 1662-8985, doi: 10.4028/www.scientific.net/AMR.383-390.6258
• J. Xie and A. Kar (1999), Laser Welding of Thin Sheet Steel with Surface Oxidation, Welding research supplement 343 s-348 s
• Hong Wang, et al (2007). Effect of assist gas flow on the gas shielding during laser deep penetration welding, Journal of Materials Processing Technology 184 (2007) 379–385
• Dominique Grevey, Pierre Sallamand, Eugen Cicala, Sorin Ignat (2005).Gas protection optimization during Nd:YAG laser welding, Optics & Laser Technology 37 647–651
• Fabrizia Caiazzo, Ernesto Mastrocinque, Gaetano Corrado, Vincenzo Sergi (2012). Regression modeling to predict the geometrical features of Ti6Al4V thin sheets butt joints welded by disk laser. Proceedings of Spie, The International Society For Optical Engineering, p. 84330Y-84330Y-11, ISSN: 0277-786X, doi: 10.1117/12.922472
• Alfieri, V., Cardaropoli, F., Caiazzo, F., and Sergi, V. (2011). “Porosity evolution in aluminum alloy 2024 BOP and butt

References 167
defocused welding by Yb:YAG disk laser”. Eng. Rev., 31(2), pp. 125-132.
• E. Mastrocinque, G. Corrado, F. Caiazzo, N. Pasquino, V. Sergi, Francesco Acerra (2011). Disk Laser welding of Ti6Al4V Alloy. In: Tobias Krause (Ed.). Innovation in Porduct and Production. Stuttgart, July 31- August 4, 2011 , p. 1-6, Tobias Krause (Ed.), ISBN: 9783839602935
• E. Mastrocinque, G. Corrado, F. Caiazzo, N. Pasquino, V. Sergi (2011). Pulsed-Disk-Laser welding of Ti6Al4V. In: Elso Kuljanic. AMST 11 Advanced Manufacturing Systems and Technology . Mali Losinj, June 16-17, 2011, p. 383-393, Elso Kuljanic, ISBN: 9789536326648
• F. Capelli, V. Boneschi (1999), I fenomeni corrosivi più comuni nei giunti saldati, Centro Inox, Milano
• Cao, X., Jahazi, M., (2009), Effect of Welding Speed on Butt joint Quality of Ti6Al4V Alloy Welded Using a High-Power Nd:YAG Laser, Optics and Lasers in Engineering, 47, 1231-1241
• Fabrizia Caiazzo, Vincenzo Sergi, Gaetano Corrado, Vittorio Alfieri, Francesco Cardaropoli (2012). APPARATO AUTOMATIZZATO DI SALDATURA LASER. SA2012A000016, Università di Salerno
• Montgomery, D. C., Design and Analysis of Experiments, Mc-Graw Hill (2005).
• EN ISO 13919-1, [Welding - Electron and laser beam welded joints - Guidance on quality levels for imperfections - Steel] (1997).
• AWS B4.0 (2007). Standard Methods for Mechanical Testing of Welds.
• EN ISO 9015-2 (2011). Destructive Tests on Welds in Metallic Materials - Hardness test - Part 2: microhardness testing on welded joints.