Design and Implementation of a Pressure-Equalizing … and Implementation of a Pressure-Equalizing...
75
Design and Implementation of a Pressure-Equalizing Vent System for Low-Slope Roofs Elizabeth Joyce Grant Thesis submitted to the Faculty of the Virginia Polytechnic Institute and State University in partial fulfillment of the requirements for the degree of Master of Science in Architecture James R. Jones, Chair Demetri P. Telionis Edward A. Dorsa August 21, 2003 Blacksburg, Virginia Keywords: Pressure-equalizing roofing system, negative pressure roofing system, vacuum roofing system, vented roofing system Copyright 2003, Elizabeth Joyce Grant
Transcript of Design and Implementation of a Pressure-Equalizing … and Implementation of a Pressure-Equalizing...

Design and Implementation of a Pressure-Equalizing Vent System for Low-Slope Roofs
Elizabeth Joyce Grant
Thesis submitted to the Faculty of the Virginia Polytechnic Institute and State University in partial fulfillment of the requirements for the degree of
Master of Science
in Architecture
James R. Jones, Chair
Demetri P. Telionis Edward A. Dorsa
August 21, 2003
Blacksburg, Virginia
Keywords: Pressure-equalizing roofing system, negative pressure roofing system, vacuum roofing system, vented roofing system
Copyright 2003, Elizabeth Joyce Grant
Design and Implementation of a Pressure-Equalizing Vent System for Low-Slope Roofs
Elizabeth Joyce Grant
(Abstract) Winds create forces on buildings, sometimes with disastrous results. Low-slope roofs are subjected to potentially high levels of suction pressure, especially when winds strike the corner of a building, creating vortices. Traditional methods of attaching roof membranes to substrates are prone to failure when the low pressure on the roof surface instigates a transfer of forces to the roof membrane. Existing pressure-equalized roof systems use the power of the wind to transmit low pressure to the space immediately beneath the roof membrane, pulling the membrane down to the roof surface. The object of this study is the design of a wind vent which, when coupled with a single-ply roof membrane in a complete roof assembly, will successfully equalize low pressure throughout the entire field of the roof. The proposed wind vent differs from existing equalizer valves in its use of the Bernoulli effect to create low pressure. Optimized for ease of manufacturing and installation, the vent is omni-directional and contains no moving parts. After the wind vent prototype is developed, future study will be required to determine the tributary area of each vent, the interaction with the insulation beneath the membrane, the response time of the system when subjected to dynamic wind loading, the effect on the vent of various weather conditions, and the permissible amount of infiltration into the roof system. Associated research will also investigate the benefits of incorporating the heat evacuating capacity of the pressure-equalizing roof vent system into a roof membrane containing an amorphous photovoltaic array.

iii
Acknowledgments I would like to acknowledge the following persons for their contribution to the inception and execution of this project: Jim Jones for envisioning the idea, recruiting and organizing the design team, pursuing the funding, orchestrating the tests, and assessing the results. Demetri Telionis, Pavlos Vlachos, José Rullan and Jason Gibbs for testing the theories, study models and prototypes, informing the direction of the study, and patiently explaining concepts. Chuck Johnson for lending industry and financial support and asking the questions driving the project. Ed Dorsa and Bill Green for their interest in the project and suggestions relative to the construction of the wind vent. Joe Hale and Michael Cornett for their help, support, and extensive knowledge of roofing technology and application. Thomas Kelly for his enthusiastic introduction to wind-vented roofing research. John Bryant, Tim Castine, William Sevebeck and Buddy Shaver for their expertise and assistance during the building of the prototype. Special thanks go to the Center for Innovative Technology and Acrylife, Inc. for their financial support of this project.

iv
Table of Contents Acknowledgments .............................................................................................iii Table of Contents...............................................................................................iv List of Figures ....................................................................................................vi List of Equations..............................................................................................viii List of Charts......................................................................................................ix List of Tables.......................................................................................................x Chapter 1: Introduction .....................................................................................1 1.1 Introduction..............................................................................................1 1.2 Objectives................................................................................................3 1.3 Assumptions............................................................................................3 1.4 Hypotheses .............................................................................................3 1.4.1 Hypothesis 1.......................................................................................................3 1.4.2 Hypothesis 2.......................................................................................................4 1.4.3 Hypothesis 3.......................................................................................................5 1.5 Research Design Approach Summary ....................................................5 Chapter 2: Literature Review ............................................................................6 2.1 Fluid Mechanics: Principles and Applications.........................................6 2.1.1 The Bernoulli and Venturi effects .......................................................................6 2.1.2 Natural Ventilation in Buildings: Inspiration for the Wind Vent ..........................7 2.2 Pressure-Equalizing Concept and Applications.......................................9 2.2.1 Pressure-Equalizing Concept.............................................................................9 2.2.2 How Traditional Roofing Systems Resist Wind-Induced Pressure...................11 2.2.3 How Existing Pressure-Equalized Roof Systems Resist Wind-Induced Pressure
.........................................................................................................................11 2.2.4 How the Proposed Pressure-Equalizing Vent System Will Resist Wind-Induced
Pressure ...........................................................................................................13 2.2.5 Additional Benefits of Pressure-Equalized Roof Systems................................13 2.3 Codes, Standards, and Industry Testing ...............................................16 2.4 Research Trends ...................................................................................17 2.5 Patent Search........................................................................................19 2.6 Application of Literature Review to Research Design Approach ...........21 Chapter 3: Methodology and Design Development ......................................22 3.1 Study Design .........................................................................................22 3.1.1 The Geometry of the Wind Vent.......................................................................22 3.1.2 Testing Methods...............................................................................................23 3.1.3 Wind Tunnel Testing ........................................................................................24 3.2 Schematic of Experimental Setups in ESM Wind Tunnel, Relation of
Pressure to Wind Speed, and Calculation of Cp ....................................25 3.3 First Study Model...................................................................................28 3.4 Redesign and Second Study Model ......................................................32 3.5 Construction and Testing of the Prototype ............................................33 3.6 Schematic of Experimental Setup in Stability Wind Tunnel to Test Effect
of Infiltration...........................................................................................36 3.7 Summary of Methodology......................................................................40 Chapter 4: Results ...........................................................................................41 4.1 Results of Testing of First Study Model .................................................41
v
4.2 Results of Testing of Second Study Model............................................43 4.3 Summary of Results of First and Second Study Models........................46 4.4 Results of Stability Wind Tunnel tests of Prototype ...............................47 4.5 Summary of Results ..............................................................................49 Chapter 5: Conclusions and Final Design .....................................................50 5.1 Conclusions from Testing of First and Second Study Models ...............50 5.2 Conclusions from Testing of Prototype..................................................50 5.3 Validation of Hypotheses.......................................................................51 5.4 Future Development of the Prototype....................................................51 5.5 Future Development of the Pressure-Equalizing Vent System..............55 5.6 Final Remarks .......................................................................................56 5.7 Acknowledgements ...............................................................................56 References ........................................................................................................57 Appendix A: Wind Tunnel Specifications ......................................................59 A.1 Specifications for the Engineering Science and Mechanics (ESM) Wind
Tunnel ...................................................................................................59 A.2 Specifications for Virginia Tech's Stability Wind Tunnel ........................59 Appendix B: Wind Tunnel Data.......................................................................60 B.1 ESM Wind Tunnel Data .........................................................................60 B.2 Stability Wind Tunnel Data ....................................................................61 Vita .....................................................................................................................62
vi
List of Figures Figure 1.1 - Roof damage from hurricane Andrew (Rappaport, 2003, p. 3)...........1 Figure 1.2 - Contribution of internal pressure to roof uplift (FEMA, 1993, p. 55)... 2 Figure 2.1 - Venturi tube (Lechner, 1991, p. 185).................................................. 7 Figure 2.2 - Increase of wind speed as a function of height (Lechner, 1991, p. 186)........................................................................................................................ 7 Figure 2.3 - A roof ventilator in the shape of a Venturi tube (Lechner, 1991, p. 186)........................................................................................................................ 8 Figure 2.4 - Ionica Building (“Ionica”)..................................................................... 8 Figure 2.5 - Detail of wind towers at Ionica Building (“Ionica”)............................... 8 Figure 2.6 - Section through wind tower at Ionica building (Dawson, 1994, p. 36).......................................................................................................................... 9 Figure 2.7 - Air pressure transfer with permeable and impermeable roof decks (p. 23)....................................................................................................................... 10 Figure 2.8 - Pressure distribution on roof surface (2001, “How to,” 1997, p. 7).......................................................................................................................... 12 Figure 2.9 - System 2001 equalizer valves in action (2001, “Hurricane Designed”)........................................................................................................... 12 Figure 2.10 - Equalizer valves vent moisture out of roof assembly (2001, ”How to,” 1997, p. 6)..................................................................................................... 14 Figure 2.11 - Transport mechanisms for venting water vapor from insulation (Baker, 1976, p. 3)............................................................................................... 15 Figure 2.12 - Pressure distribution on PVC roof membrane (Baskaran & Savage, 2003, p. 19).......................................................................................................... 19 Figure 2.13 - U.S. Patent No. 04608792.............................................................. 20 Figure 2.14 - Vac-Q-Vent by Burke Industries, Inc. (“Vac-Q-Roofs,” 2002).................................................................................................................... 20 Figure 3.1 - Early design concept........................................................................ 22 Figure 3.2 - Elevation of first study model............................................................ 23 Figure 3.3 - Stage I to determine Pdynamic in ESM Wind Tunnel........................... 25 Figure 3.4 - Stage II to determine Pgauge in ESM Wind Tunnel............................. 27 Figure 3.5 - Section through first study model..................................................... 29 Figure 3.6 - Shallow dome, top and bottom view.................................................30 Figure 3.7 - Ellipsoid, top and bottom view.......................................................... 30 Figure 3.8 - Diagram of different configurations of first study model in ESM Wind Tunnel.................................................................................................................. 31 Figure 3.9 - Experimental setup with ellipsoid suspended from top of wind tunnel - Scenario 2.......................................................................................................... 32 Figure 3.10 - Section through second study model............................................. 33 Figure 3.11 - Section through prototype.............................................................. 34 Figure 3.12 - MDF base with chipboard flange, used as a mold for high-impact polystyrene lower hemisphere............................................................................. 35 Figure 3.13 - Prototype placed in Stability Wind Tunnel...................................... 35
vii
Figure 3.14 - Underside of plywood platform showing plastic tubing connected to pressure sensor and flow meter........................................................................... 36 Figure 3.15 - Experimental setup in Stability Wind Tunnel.................................. 37 Figure 3.16 - Stage I to determine Pdynamic in Stability Wind Tunnel.................... 38 Figure 3.17 - Stage II to determine Pgauge in Stability Wind Tunnel...................... 39 Figure 5.1 - Future prototype with shallow dish and check valve........................ 53 Figure 5.2 - Three-D model of the roto-molded wind vent................................... 54 Figure 5.3 - Wind vented roof assembly.............................................................. 55
viii
List of Equations Equation 1.1 - Bernoulli Equation...........................................................................3 Equation 1.2 - Hypothesis 1................................................................................... 4 Equation 1.3 - Hypothesis 2.................................................................................. 4 Equation 1.4 - Hypothesis 3, Part 1....................................................................... 5 Equation 1.5 - Hypothesis 3, Part 2........................................................................5 Equation 2.1 - Newton’s second law of motion...................................................... 6 Equation 2.2 - Bernoulli Equation.......................................................................... 6 Equation 2.3 - Bernoulli Equation for air flow......................................................... 6 Equation 3.1 - Reynolds number..........................................................................24 Equation 3.2 - Total pressure inside the tunnel................................................... 26 Equation 3.3 - Dynamic pressure......................................................................... 26 Equation 3.4 - Dynamic pressure related to wind speed..................................... 26 Equation 3.5 - Calculation of wind speed............................................................. 26 Equation 3.6 - Static pressure inside the vent..................................................... 27 Equation 3.7 - Calculation of Pgauge...................................................................... 27 Equation 3.8 - Bernoulli Equation........................................................................ 28 Equation 3.9 - Pgauge related to wind speed......................................................... 28 Equation 3.10 - Calculation of Cp......................................................................... 28 Equation 3.11 - Cp related to wind speed............................................................. 28
ix
List of Charts
Chart 4.1 - Cp vs. Distance between bodies for shallow dome, with ellipsoid and post...................................................................................................................... 41 Chart 4.2 - Cp vs. Distance between bodies for shallow dome, with ellipsoid, no post...................................................................................................................... 42 Chart 4.3 - Cp vs. Wind speed for first study model, different configurations....... 43 Chart 4.4 - Cp vs. Wind speed for shallow dome and lower hemisphere (base only)..................................................................................................................... 44 Chart 4.5 - Cp vs. Distance between bodies for double hemisphere................... 45 Chart 4.6 - Cp vs. Wind speed for double hemisphere......................................... 46 Chart 4.7 - Cp vs. Wind speed for first and second study models, different configurations....................................................................................................... 47 Chart 4.8 - Cp vs. Wind speed for prototype with and without leakage................ 48
x
List of Tables Table 2.1 - Partial U.S. Patent Search................................................................. 19 Table 4.1 - Selected Stability Wind Tunnel data.................................................. 48 Table B.1 - Shallow dome, with ellipsoid at 14.1 m/s, Pdynamic = 0.90 Torr........... 60 Table B.2 - Shallow dome, with ellipsoid at 15.85 m/s, Pdynamic = 1.15 Torr......... 60 Table B.3 - Shallow dome, with ellipsoid at 17.8 m/s, Pdynamic = 1.43 Torr........... 60 Table B.4 - Shallow dome, with ellipsoid at 19.4 m/s, Pdynamic = 1.73 Torr........... 60 Table B.5 - Shallow dome, no ellipsoid, at various speeds.................................. 61 Table B.6 - Base only........................................................................................... 61 Table B.7 - Double hemisphere........................................................................... 61 Table B.8 - Stability Wind Tunnel Data................................................................ 61

1
Chapter 1: Introduction
1.1 Introduction Ever since the first structures were erected, wind forces have threatened to tear them down. Over time, these forces have become better understood, and perhaps better anticipated, but building failures due to storm damage continue to devastate communities worldwide. Hurricane Andrew, one of the most widely publicized storms in recent memory, was directly responsible for the loss of 26 lives and over $25 billion worth of damage (Rappaport, 1993), necessitating $1.849 billion in Federal Emergency Management Agency (FEMA) relief costs alone (“Top Ten,” 2003).
Figure 1.1 - Roof damage from hurricane Andrew (Rappaport, 2003, p. 3)
The effects of Andrew were recorded and analyzed in a document prepared by FEMA’s Federal Insurance Administration. Members of the Building Performance Assessment Team dispatched to southern Dade County, Florida, the area hit by hurricane Andrew on August 24,1992, observed that roof failures were the most prevalent form of damage (FEMA, 1993). Loss of roof cladding was the primary vehicle of failure, leading to subsequent destruction of interiors due to wind and rain. The low pressure present on roof surfaces, coupled with the intensification of internal pressure within a building caused by the failure of doors, windows and other building envelope components, created a powerfully destructive force, as shown in Figure 1.2.

2
Figure 1.2 - Contribution of internal pressure to roof uplift (FEMA, 1993, p. 55)
The failures observed by the assessment team were the result of observed peak sustained wind speeds as high as 141 mph and observed peak wind gusts of over 160 mph (FEMA, 1993). In an extensive report evaluating the performance of roofing systems during Hurricane Hugo, James McDonald of Texas Tech University and Thomas L. Smith (1990) of the National Roofing Contractor’s Association observed and cataloged damage to various roofing systems, including low-slope roofs. They observed roof membranes tearing at the locations of fasteners in mechanically attached roofs, failure at locations of missing adhesive at fully adhered roofs, and scour and loss of aggregate on ballasted roofs. Many of the roofs also experienced failure of the edge condition, including damage to wood nailers and metal flashings, copings, and gutters. Building codes and standards attempt to protect the public against the disastrous results of storms such as hurricanes Andrew and Hugo. Researchers collaborate with the roofing industry to develop products with improved uplift resistance through improvements in fastener technology, membrane tensile strength, and other material parameters. Testing agencies attempt to replicate the forces generated by the wind in order to rate the performance of various roofing systems. But even the most assiduous designer cannot ensure that the roof system will resist the dynamic, fluctuating pressures present on the roof surface during an unpredictable wind event. An ideal roof system would be able to quickly equalize the pressure between the roof surface and the pressurized building interior, resisting tear-off of the roof membrane and its substrate. In the spring of 2002, a joint proposal was submitted by Dr. Jim Jones and Dr. Demetri Telionis of Virginia Tech in collaboration with Mr. Charles Johnson of Acrylife, Inc. to the Center for Innovative Technology (CIT) to design, construct and test a pressure-equalizing vent system for membrane roof systems. A grant was received from the Center for Innovative Technology (CIT) with additional
3
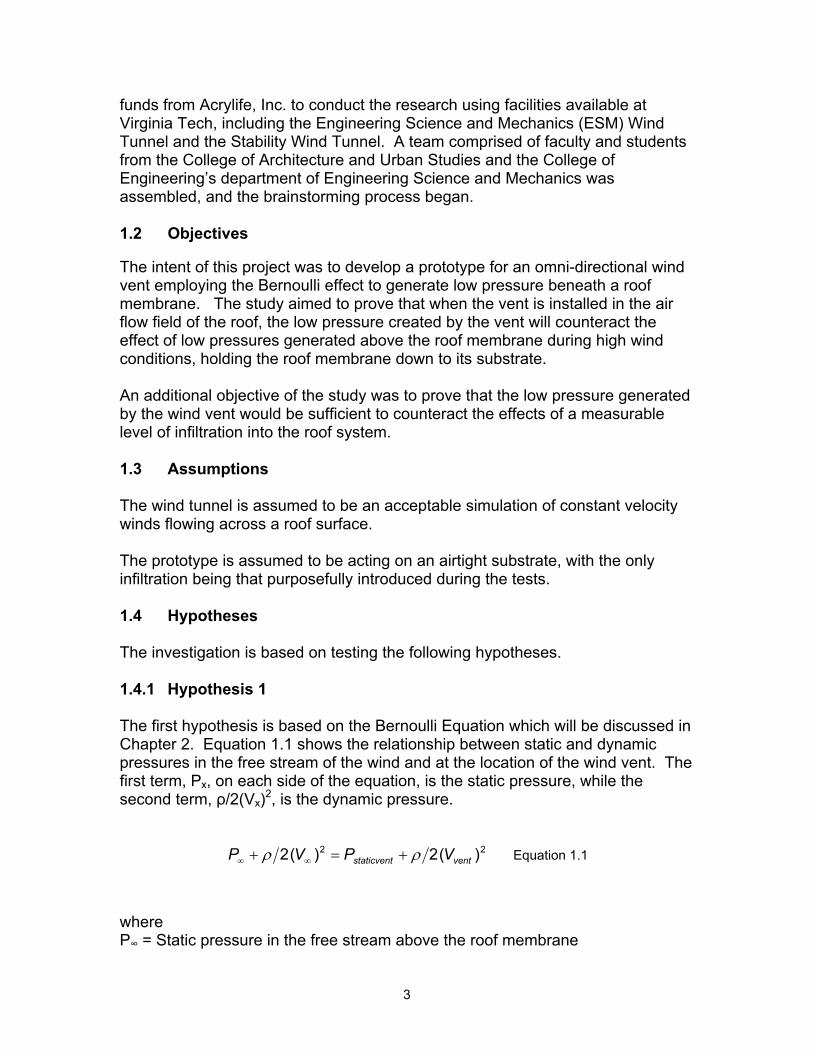
funds from Acrylife, Inc. to conduct the research using facilities available at Virginia Tech, including the Engineering Science and Mechanics (ESM) Wind Tunnel and the Stability Wind Tunnel. A team comprised of faculty and students from the College of Architecture and Urban Studies and the College of Engineering’s department of Engineering Science and Mechanics was assembled, and the brainstorming process began. 1.2 Objectives The intent of this project was to develop a prototype for an omni-directional wind vent employing the Bernoulli effect to generate low pressure beneath a roof membrane. The study aimed to prove that when the vent is installed in the air flow field of the roof, the low pressure created by the vent will counteract the effect of low pressures generated above the roof membrane during high wind conditions, holding the roof membrane down to its substrate. An additional objective of the study was to prove that the low pressure generated by the wind vent would be sufficient to counteract the effects of a measurable level of infiltration into the roof system. 1.3 Assumptions The wind tunnel is assumed to be an acceptable simulation of constant velocity winds flowing across a roof surface. The prototype is assumed to be acting on an airtight substrate, with the only infiltration being that purposefully introduced during the tests. 1.4 Hypotheses The investigation is based on testing the following hypotheses. 1.4.1 Hypothesis 1 The first hypothesis is based on the Bernoulli Equation which will be discussed in Chapter 2. Equation 1.1 shows the relationship between static and dynamic pressures in the free stream of the wind and at the location of the wind vent. The first term, Px, on each side of the equation, is the static pressure, while the second term, ρ/2(Vx)2, is the dynamic pressure.
22 )(2)(2 ventstaticvent VPVP ρρ +=+ ∞∞ Equation 1.1
where P∞ = Static pressure in the free stream above the roof membrane

4
V∞ = Wind speed in the free stream above the roof membrane Pstaticvent = Static pressure in the cavity of the lower body of the wind vent Vvent = Wind speed at the wind vent ρ = air density It is evident from Equation 1.1 that as dynamic pressure at the wind vent increases due to the increased velocity of the wind speed at the wind vent, the static pressure inside the cavity of the lower body of the wind vent will decrease. Equation 1.1 may also be expressed as shown in Equation 1.2, which formulates the first hypothesis: The gauge pressure, defined as the difference between the static pressure in the cavity of the lower body of the wind vent and the static pressure in the free stream above the roof membrane, will be directly proportional to the dynamic pressure multiplied by a pressure coefficient, Cp.
dynamicpgauge PCP = Equation 1.2
where Pgauge = Pstaticvent - P∞ Pdynamic = ρ/2(V∞)2
Cp = Pressure coefficient The degree to which this drop in static pressure occurs is a function of the geometry of the wind vent and is manifested in the pressure coefficient, Cp. The calculation of the pressure coefficient will be presented in Chapter 3, Section 3.2. 1.4.2 Hypothesis 2 The static pressure in the cavity of the lower body of the wind vent with no infiltration will be lower than the static pressure present above the roof membrane during a wind event.
01 >−∞ PP Equation 1.3
where P∞ = Static pressure in the free stream above the roof membrane P1 = Static pressure in the cavity of the lower body of the wind vent with no infiltration

5
1.4.3 Hypothesis 3 The static pressure in the cavity of the lower body of the wind vent when infiltration is introduced into the cavity will be lower than the static pressure present above the roof membrane during a wind event, but higher than the static pressure in the cavity of the lower body of the wind vent with no infiltration.
012 >−PP Equation 1.4
where P1 = Static pressure in the cavity of the lower body of the wind vent with no infiltration P2 = Static pressure in the cavity of the lower body of the wind vent with introduced infiltration, and
02 >−∞ PP Equation 1.5
where P∞ = Static pressure in the free stream above the roof membrane P2 = Static pressure in the cavity of the lower body of the wind vent with introduced infiltration 1.5 Research Design Approach Summary Chapter 1 introduced the need for research to develop wind-resistant roof systems and provided a description of the objectives, assumptions and hypotheses of this study. In order to understand the evolution of the research design, and the translation of the objectives stated above into appropriate testing methodology, it is necessary to begin with an examination of the underlying physical principles of air flow with a view toward their application to building design in general and roof systems in particular. This summary is found Chapter 2: Literature Review. The design logic driving the development of the prototype and the factors influencing the selection of the test method is discussed at the beginning of Chapter 3: Methodology and Design Development. Chapter 4 consists of a presentation and summary of the results. Chapter 5 provides conclusions derived from testing, validation of the hypotheses, discussion of the future development of the prototype and the pressure-equalizing vent system, and opportunities for further study.

6
Chapter 2: Literature Review 2.1 Fluid Mechanics: Principles and Applications 2.1.1 The Bernoulli and Venturi effects In order to understand the functioning of the wind vent, it is necessary to begin with a discussion of the underlying principles of fluid mechanics. Newton’s second law of motion states:
maF = Equation 2.1
Where F is force, m is mass and a is acceleration. When this law is applied to particle motion within inviscid fluids, the famous Bernoulli Equation is derived through general integration as follows:
tconszVp tan21 2 =++ γρ Equation 2.2
where p is static pressure, 1/2ρV2 is dynamic pressure, and γz is hydrostatic pressure (Young, Munson & Okiishi, 2001). The sum of these three forms of energy present in the flow must always remain constant due to the law of conservation of energy. Since the density of air (γ) is so small, the hydrostatic pressure may be neglected when the equation is applied to air flow. The equation is rewritten in Equation 2.3.
tconsVp tan21 2 =+ ρ Equation 2.3
In the second term of this equation, dynamic pressure (1/2ρV2), ρ is the fluid density and V is the fluid speed. It is apparent from the Bernoulli Equation that static pressure (p) decreases as the velocity of a fluid (V) increases. When applied to steady, incompressible air flow, the faster the wind speed, the lower the static pressure. This lowered pressure is the effect desired in the lower cavity of the wind vent. The increased wind speed is achieved through the use of a Venturi tube or similar shape.

7
Figure 2.1 – Venturi tube (Lechner, 1991, p. 185)
The Venturi tube is an illustration of the Bernoulli effect. The shape of the tube smoothly forces the air into a smaller cross section, thereby increasing its speed. The increased speed generates reduced pressure in the necked-down portion of the tube. 2.1.2 Natural Ventilation in Buildings: Inspiration for the Wind Vent The inspiration for the wind vented roofing system came from natural ventilation strategies applied at the scale of the whole building. Low pressures occur on roofs as a result of the increase in wind speeds at higher elevations. The static pressure at the roof is typically less than the static pressure at grade due to the higher velocity of the wind at higher elevations.
Figure 2.2 - Increase of wind speed as a function of height (Lechner, 1991, p. 186)
This manifestation of the Bernoulli effect drives the natural flow of air from lower window openings up through roof openings. Rooftop elements shaped to further increase the wind speed and take even greater advantage of the Bernoulli effect have been used as a means to create low pressure zones to exhaust warm air.

8
Figure 2.3 - A roof ventilator in the shape of a Venturi tube (Lechner, 1991, p. 186)
An example of this approach is found at the Ionica building in Cambridge, England, designed by the RH Partnership in collaboration with mechanical and electrical design consultant Battle McCarthy.
Figure 2.4 - Ionica Building (“Ionica”)
Figure 2.5 - Detail of wind towers at Ionica Building (“Ionica”)
Six wind towers installed at the top of the atrium evacuate warm air rising through the space. The air is exhausted partly due to the action of the stack effect, natural convection caused by buoyancy when air near the top of a space is warmer and less dense than the air entering from outdoors near the bottom of the space. But the Bernoulli effect is also at work when the wind is blowing, and

9
because the towers are four-sided, they capitalize on winds from any direction. The inverted pyramids at the tops of the towers act as Venturi caps. They constrict the wind stream, increase its velocity and thereby lower the pressure at the throat of the towers, drawing out warm air. The result is reliable cross-ventilation accelerated by the geometry of the towers. (Dawson, 1994)
Figure 2.6 - Section through wind tower at Ionica building (Dawson, 1994, p. 36)
2.2 Pressure-Equalizing Concept and Applications 2.2.1 Pressure-Equalizing Concept During periods of wind activity, pressure variations develop on the surfaces of buildings. On a building with a low-slope roof, high pressure is generated at the windward face of a structure, while low pressure is generated at the leeward and roof surfaces. Resisting the effects of high winds and wind gusts is a critical parameter in roofing design. Building codes dictate the wind uplift forces that roof systems must resist, but do not specify the required means of resisting these forces. The focus of this study is on low-slope, single ply roofing and its ability to resist wind-generated forces. The low pressure on the exterior of the roof system becomes problematic because the interior face of the system is simultaneously subjected to the relatively higher static pressure present inside the building. As Philip Dregger (2002), registered roof consultant and key member of the Roofing Industry Committee on Wind Issues, explains in an article entitled “Air Infiltration: the Enemy of Wind Resistance and Condensation Control”, the permeability of the roof deck and insulation determines the degree and speed with which the roof

10
membrane is affected by the pressure differential between the interior and exterior. Figure 2.7, featured in the article, illustrates the process.
Figure 2.7 - Air pressure transfer with permeable and impermeable roof decks (p. 23)
First, wind blowing across the roof surface generates low pressure, pulling upward on the roof membrane. When the membrane is not fully adhered to the insulation or roof deck, air from inside the building flows into the space beneath the membrane to equalize the pressure, transferring forces down to the roof deck. If this process occurs quickly, i.e. there are significant air pathways from inside the building to the underside of the roof deck, the membrane and fasteners or ballast take on the brunt of the pressure-induced force, causing the membrane to balloon above the roof surface. If the process occurs more slowly, i.e. the deck is more impermeable to air, the roof deck will primarily resist the force and the membrane will deflect only slightly.

11
2.2.2 How Traditional Roofing Systems Resist Wind-Induced Pressure The most prevalent traditional methods of attaching a low-slope, single ply roofing membrane to its substrate are fully adhered systems, mechanically fastened systems, and loose-laid ballasted systems. In a fully adhered system, the coupling of the membrane and its substrate allow the composite system to resist the wind-generated forces. In a mechanically fastened system, the low pressure above the membrane often results in an upward deflection of the membrane, causing an expansion of the thin layer of air immediately below the membrane and thereby reducing the pressure. This pressure then acts on the roof deck immediately below this layer of air. The roof deck then resists the upward pull of the low pressure. If the deck is relatively impermeable, it will resist much of the load. If, however, the deck is permeable, positively pressurized air from the interior of the building will infiltrate into the space between the membrane and the deck, forcing the membrane to balloon upward as it resists the uplift forces, consequently creating significant stress on the fasteners. In a ballasted system, the weight of the ballast holds the membrane in place, allowing it to deflect upward only if the uplift pressure exceeds the force of gravity on the ballast. 2.2.3 How Existing Pressure-Equalized Roof Systems Resist Wind-Induced
Pressure Existing pressure-equalized roof systems, also known as vacuum systems, are a less common method of membrane attachment. Attached only at the perimeter and at roof penetrations, they rely on the transfer of the low pressure developed above the roof membrane to the interstitial space immediately below the roof membrane to hold the membrane in place. These systems also depend on the relative impermeability of the roof deck to prevent the membrane from ballooning upward during high winds. The deck must be carefully detailed to prevent air pathways between the building interior and the space beneath the roof membrane. The pressure generated beneath the roof membrane must be sufficiently low to resist the effects of the high pressure air infiltrating from beneath the deck. Fortunately, the faster the wind speed, the lower the pressure and the better the system works. One such system was developed by Thomas L. Kelly of the 2001 Company. Mr. Kelly holds several patents on equalizer valve systems which are commercially available as System 2001 roof designs. The technology is also licensed to several single ply roofing manufacturers. The System 2001 roof depends on wind vortices generated at building perimeters and corners to create the necessary low pressure at the vent locations. Wind tunnel testing has proven that pressures are lowest at building corners and edges, as seen in the example graph from the 2001 Company’s product literature shown in Figure 2.8.

12
Figure 2.8 - Pressure distribution on roof surface (2001, “How to,” 1997, p. 7)
The wind vents are placed in the locations of the vortices to take advantage of the low pressure created when the wind stream is disturbed by the building edge. These areas have traditionally been most prone to roof failure due to the propensity for the low pressure to rip off edge metal and flashing, thereby allowing air to infiltrate beneath the roof membrane. This instigates a progressive tear-off of the roof membrane, exposing the insulation beneath and wreaking havoc on the entire roof system. The 2001 System targets these damage-prone areas, capitalizing on the low pressure by transferring it beneath the roof membrane with aluminum “equalizer valves” as seen in Figure 2.9.
Figure 2.9 - System 2001 equalizer valves in action (2001, “Hurricane Designed”)
Wind direction
Pressure coefficient
-3.0 to -2.5 -2.0 to -2.5 -1.5 to -2.0 -1.0 to -1.5 -0.5 to -1.0 0 to -0.5

13
2.2.4 How the Proposed Pressure-Equalizing Vent System Will Resist Wind-Induced Pressure
The system proposed in this study differs functionally from the other pressure-equalizing vent systems currently on the market in several ways. First, the wind vent developed in this project will be positioned in the uninterrupted wind stream in the field of the roof, rather than at a roof area’s corners and perimeter. The wind vent itself will create the low pressure required to hold the roof membrane in place, rather than relying on low pressure induced by wind vortices at roof edges. It is anticipated that the proposed system will perform even better than the existing pressure-equalized roof systems because the shape of the vent will induce pressures beneath the roof membrane lower than those created by the wind itself. Second, the wind vents, by creating pressure lower than that naturally present on the roof surface, will allow the system the ability to tolerate a certain amount of infiltration, lessening the reliance of the system on a completely sealed roof deck key to the success of the current pressure-equalizing roof systems. The low pressure generated by the proposed wind vent system will compensate for some quantity of air entering the interstitial space between the roof membrane and the roof deck due to tears in the roof membrane (a potentiality in storm conditions with wind-blown debris) and infiltration from the building interior due to inevitable gaps in the roof deck and insulation beneath the roof membrane. The wind tunnel testing conducted during this study included the introduction of a measurable amount of infiltration. The amount of infiltration will also be measured experimentally with in-situ monitoring when the final wind vent is beta tested, to validate the simulated results with an actual roof assembly subjected to real wind conditions. 2.2.5 Additional Benefits of Pressure-Equalized Roof Systems Another possible benefit of the existing pressure-equalized roof systems is their purported ability to dry out a wet roof assembly. The equalizer valves are equipped with one-way valves that allow air to exit the space beneath the roof membrane while preventing air on the surface of the roof from entering. This feature permits warm, moist air to escape the roof assembly when the flap is lifted by the low pressure generated by the wind, but when winds are absent, the flap is re-seated and prevents backflow of humid air into the roof assembly. Due to the radiation of the sun and the stratification of air within the interior of a building, the air within the roof assembly tends to be hotter than the air in the building below. If the roof assembly contains liquid water, it is vaporized due to the elevated temperature of this air. When the wind blows, the low pressure generated by wind vortices is transferred beneath the membrane by equalizer valves, contributing further to the vaporization of water and accelerating the drying process. The water-vapor laden air is pulled out of the roof space by the low pressure generated by the wind when the valve is open (2001, “How to”, 1997). The degree to which this passive process removes water from roof

14
assemblies remains to be proven. A study using an existing pressure-equalized roof system to dry a moisture-laden roof assembly is presented later in this section.
Figure 2.10 - Equalizer valves vent moisture out of roof assembly. Yellow is hot air, orange is insulation, green is water-vapor saturated air, and blue is liquid water (2001,”How to,” 1997, p. 6).
In addition to the pressure equalized roof system valves, other insulation vents and “breather” vents are commercially available featuring one- and two-way valves that vent water vapor trapped in roof assemblies using stratification, solar radiation, and frequently, the low pressures present on roof surfaces to drive the process. In an article in Canadian Building Digest, M.C. Baker and C.P. Hedlin (1976) discuss the process of venting low-slope roofs, pointing to two means by which wet insulation can be dried using two-way breather vents. The first is convection, whereby air transports water vapor out the vents, and the second is vapor diffusion within fibrous insulation materials, which is not elaborated here. In the discussion of convection, the authors describe the “breathing action” of the roof membrane through vents as heating and cooling cycles expand and contract the interstitial layer of air just beneath the roof membrane, alternately pushing air out of and pulling it into the air space. With an open vent there is some potential to draw moisture into the roof space, however, the authors point out that even when air at nearly 100% relative humidity is “inhaled” by the system, the relatively warmer atmosphere beneath the membrane will heat this air above its dew point. At the same time, they warn that moist air exiting the system, when exposed to sub-freezing exterior temperatures may cause ice to form on the inside surface of the vent, wetting the insulation when it later thaws. For this reason, some metal roof vents, including the 2001 equalizer valves discussed above, have an insulated throat. Another means of convection through the roof space occurs when one vent is subjected to a lower air pressure than its neighbor, pulling air in one vent and pushing it out the next. These low pressures are generated by the wind or the stack effect, as explained in Section 2.1.2. On a low-slope roof, the stack effect is negligible because of the lack of elevation change, and the wind effects will be

15
small. The air must be allowed to flow relatively freely between vents through the insulation space for this strategy to succeed. There must also be an air barrier beneath the insulation to prevent leakage from the inside of the building from defeating the system.
Figure 2.11 - Transport mechanisms for venting water vapor from insulation (Baker, 1976, p. 3)
As we have seen, existing pressure-equalized roof systems assist the convective movement of air out the equalizer valves by strategically placing them in the areas of lowest pressure to provide a superior drying potential. The ability to dry out a wet roof is especially important in re-roofing applications where it is physically or economically infeasible to remove existing damp insulation and/or sheathing board from a roof. Warren R. French (1999), in his study of the drying capacity of a pressure-equalized roof system on a re-roofing project in Houston, observes that wet roofing materials contribute to the premature failure of roof assemblies through several vehicles, including corrosion of metal fasteners, steel roof decks or steel reinforcing in concrete roof decks, and structural steel supporting the deck. Moisture-laden substrates can also contribute to the accelerated degradation of roof membranes. Further, wet insulation has a reduced thermal resistance, permitting undesirable energy transfer through the roof assembly. The Houston project evaluated the moisture content of lightweight concrete insulating fill on a penthouse roof using nuclear moisture surveys correlated with gravimetric analysis of core samples. Testing was first conducted before

16
removal of the existing built-up roof and wood fiber insulation, and again thirteen months after the installation of a pressure-equalized, single-ply roofing system. The new system was selected primarily for its ability to resist high winds and obviate the need for fasteners in the already compromised lightweight concrete substrate, and secondarily for its ability to dry the roof assembly. The results, while ultimately inconclusive with respect to the drying capacity of pressure-equalizing systems, in general, did point to a slight lowering of the overall moisture content of the lightweight concrete in the tested roof, and a trend toward uniformity in moisture content through the material, significantly lessening the extremes of saturation present in portions of the roof. While further research is necessary to evaluate the overall success of the drying potential of pressure-equalizing roof systems, the study points to the roofing industry’s interest in this application, and its inherent benefits. 2.3 Codes, Standards, and Industry Testing Model building codes throughout the country provide methods for calculating wind loads on roofs. The Building Officials and Code Administrators International, Inc. (BOCA) National Building Code/1996 (1996), currently the model code adopted as part of the Virginia Uniform Statewide Building Code (VUSBC), contains a section dealing with wind loads. Section 1609.1 references Section 6 of ASCE 7, the American Society of Civil Engineers’ publication entitled, “Minimum Design Loads for Buildings and other Structures” as an alternate design standard. BOCA 1996 may only be used for any “buildings or other structures which are sited such that wind channeling effects or buffeting in the wake of upwind obstructions do not merit alternate design procedures” (p. 168). Similarly, the International Building Code 2000’s Chapter on Wind Loads states that “wind loads on every building or structure shall be determined in accordance with Section 6 of ASCE 7” (International Code Council, 2000, p. 267). The exceptions are certain residential buildings and low-rise structures with a mean roof height of 60 feet or less. It is clear that ASCE 7 has become the design standard for wind loading. Section 6 of ASCE 7, “Wind Loads,” provides an analytical procedure and a wind tunnel procedure for determining design wind loads on structures. The analytical procedure involves several components: a velocity pressure (based on the basic wind speed, importance factor, velocity pressure coefficient, and topographic factor), a gust effect factor, and a pressure or force coefficient. Buildings subjected to “channeling effects or buffeting in the wake of upwind obstructions…or structures having unusual geometric shapes or response characteristics” (American Society of Civil Engineers, 2000, p. 15) must be evaluated using the wind tunnel procedure. The wind tunnel procedure requires certain test conditions to be satisfied, and demands that the dynamic response be modeled for a given building or structure.

17
While wind speed is certainly not the only factor involved in evaluating wind loads, it is usually the first factor considered by the designer of a roof system. In the hurricane-prone coastal regions of the United States, a design wind speed of 150 mph is shown in Fig. 6-1. of ASCE 7. Quite probably the worst case scenario for the wind vent, this wind speed was targeted as the goal for the wind tunnel testing in this study. Testing of the roof vent in the wind tunnel should not be confused with the wind tunnel testing required by ASCE 7, which involves the modeling of an entire building and its adjacent surroundings. While ASCE 7 and the model building codes provide the means to calculate wind loads and their associated design uplift pressures, other publications must be consulted to determine whether, and how, various roof systems resist these pressures. Factory Mutual (FM) Global Property Loss Prevention Data Sheets and various American National Standards Institute (ANSI) / Rubber Manufacturers Association (RMA) / Single Ply Roofing Institute (SPRI) publications, among others, provide design assistance (Pierce, 2002). It is interesting to note that many of the accepted uplift test procedures, notably those included in FM Global’s Approval Standard 4470, “Class I Roof Covers” evaluate the roof assembly, which usually consists of a membrane, insulation and roof deck, by affixing its perimeter to a frame, providing increased pressure below or decreased pressure above the assembly, and observing the results. In an article for Western Roofing entitled “Hurricane Force, Part II: Understanding and Minimizing the Risk of Wind Damage” Philip Dregger (1993) points out that these tests do not take into account the effect of perimeter leaks or penetrations through the membrane. The tests also fail to consider the effect of wind, making them inappropriate for the evaluation of a pressure-equalized roof system. Instead, pressure-equalized roof systems must be tested in a wind tunnel to obtain a fair assessment of their performance. 2.4 Research Trends A task group supported by SPRI, the Oak Ridge National Laboratories, and the Naval Civil Engineering Laboratory met in Dallas, Texas in 1989 to discuss research needs in the field of wind uplift resistance testing for roofing systems as a response to the growing popularity of single ply roof membranes with various modes of attachment. The ambitious range of research issues identified included discussion of air retarders to guard against rapid pressurization of the space beneath the roof membrane, a discussion of dynamic testing of varying pressures on roofs to simulate real-world conditions, pullout and fatigue failure of fasteners, testing of uplift resistance in the field of the roof, and methods for pressure equalization of the roof membrane. The existence of currently available pressure-equalized roof systems was acknowledged by the group, but further research was called for “to determine the various parameters such as equalization valve design and seal, required air flow to minimize pressure differentials, required valve spacing, allowable drag forces, and effect of building

18
configuration and height” (“Wind Resistance,” 1989, pp. 7-8). These issues are substantively the same questions addressed in this study and to be investigated in subsequent phases of research into the implementation of the whole pressure-equalizing vent system. More recently, a consortium of roofing professionals, including researchers, designers and project managers, building owners, contractors' associations, and manufacturers, formed the Special Interest Group for the Dynamic Evaluation of Roofing Systems (SIGDERS). Dr. A. "Bas" Baskaran (1996) summarized the group's research in the October 1996 issue of Interface. A chief goal was to determine a method by which the dynamic pressure fluctuations on a roof surface can be simulated. Techniques to achieve this goal include experimental tests and modeling. The experimental portion of the work includes material and system tests and measurement of dynamic pressures in the wind tunnel. The modeling task is comprised of numerical tools such as a Finite Element Method (FEM) and Computational Fluid Dynamics (CFD) models. Various types of roofing have been evaluated using these methods, including mechanically fastened, fully adhered, and ballasted systems. Because of the changing nature of wind forces, the effects of building geometry on roof system performance, and the difficulty of modeling roof components such as edge conditions at reduced scales, software tools are desirable to assist designers in choosing the appropriate system. In April of 2003, Dr. Baskaran and M.G. Savage (2003) reported on the success of efforts to model wind pressures on single ply roofing membranes using full-scale test sections. By simulating winds approaching perpendicularly and diagonally to a building in their large wind tunnel, a team of scientists at the National Research Council of Canada (NRCC) are analyzing the effects of wind-induced membrane oscillations on pressure distributions on roofs, as seen in Figure 2.12. These results are being used to generate a transfer function to take into account membrane movement when using existing flat roof models. While this particular study focused on mechanically fastened roof systems, it reveals the general need to evaluate dynamic wind loading in a full-scale model to obtain useful results.

19
Figure 2.12 - Pressure distribution on PVC roof membrane (Baskaran & Savage, 2003, p. 19)
2.5 Patent Search In the process of developing a wind vent that would equalize wind-generated pressures in a unique way, a United States patent search was conducted through an online database provided by Community of Science, Inc. (2003). While not necessarily comprehensive, a list of relevant patent holders is provided here:
Table 2.1 - Partial U.S. Patent Search
US Patent No.
Inventor Title
04223486 Thomas L. Kelly Roof equalizer 04409761 Thomas J.
Bechtel Roof construction system holding roof membranes in place by suction forces
04557081 Thomas L. Kelly Roofing structure with hermetically sealed panels
04608792 Dennis H. Gerber
Roof membrane hold down system
04888930 Thomas L. Kelly Sealed roof deck wind vacuum transfer system
05784846 Raymond D. Godschalx
Structure and method of reducing and redistributing uplift forces on membrane roofs
The patents held by Thomas L. Kelly are manifested in the 2001 System discussed above. The patent held by Raymond D. Godschalx utilizes an “air

20
permeable and resilient mat” above the roof membrane to reduce the wind velocity thereby reducing uplift. Thomas J. Bechtel’s system includes an exhaust fan mounted on a shaft parallel to the roof surface, which is in turn mounted in a housing connected to a suction inlet between the roof membrane and roof surface. The roof membrane hold down system patented by Dennis H. Gerber includes the use of a suction device in the shape of a Venturi channel mounted on a base, which rotates in order to catch prevailing winds, as seen in Figure 2.13.
Figure 2.13 - U.S. Patent No. 04608792
The assignee of the patent, Burke Industries, Inc. currently markets a product called the Vac-Q-Vent, part of the Burkeline® Vac-Q-Roof System. Channels under a Hypalon® roof are connected to vents which create low pressure by spinning in the wind. The turbine-like Vac-Q-Vent is shown in Figure 2.14.
Figure 2.14 - Vac-Q-Vent by Burke Industries, Inc. (“Vac-Q-Roofs,” 2002)
While the original Gerber patent shows a suction device using a Venturi tube, it differs from the wind vent developed by this study in two important ways. First, the Gerber roof vent is fitted with a directional device in order to rotate into the direction of the prevailing wind. The wind vent in this study is characterized by radial symmetry, allowing it to capitalize on winds from any direction without adjustment. In both the original Gerber sketch and the Vac-Q-Vent product, moving parts are necessary to achieve the desired low pressure; in the former, to align the device, in the latter, to operate the turbine. The wind vent in this study contains no moving parts, lending simplicity to its construction and maintenance.

21
2.6 Application of Literature Review to Research Design Approach An understanding of the principles of fluid dynamics and their application to buildings and roof systems was critical to the design process generating the wind vent. An examination of existing pressure-equalizing roof systems provided valuable information regarding the design parameters of the wind vent, as well as concrete examples of strategies for its integration into a complete roofing system. A review of the relevant codes and standards led to the selection of a testing method which would best accomplish the goals of the study while drawing from lessons learned from ongoing industry research. The evolution of the research design approach is discussed in detail in Chapter 3: Methodology and Design Development.

22
Chapter 3: Methodology and Design Development 3.1 Study Design 3.1.1 The Geometry of the Wind Vent As stated in Chapter 1, the objective of this study was to create a wind vent capable of harnessing the power of the wind to create low pressure beneath a roof membrane for the purpose of holding the membrane down to its substrate. It was hypothesized that by optimizing the geometry of the wind vent, this low pressure would decrease as the wind speed at the roof surface increased, and that the pressure in the lower cavity of the wind vent would be lower than the pressure generated by the wind above the roof membrane. The shape of the wind vent was envisioned as an omni-directional Venturi tube, able to generate the Bernoulli effect (explained in Section 2.1.1.) by capitalizing on winds from every direction. The geometry of the negative space between the two bodies of the wind vent would decrease the area of the cross-section through which wind would flow, thereby increasing the wind speed and reducing air pressure at this location. While it was acknowledged that the wind vent would need to function as a component of a larger roofing system comprising a roof membrane, insulation, deck, penetrations and perimeter treatment, this study was limited to a validation of the ability of the wind vent to create measurable suction in its lower cavity.
INSULATION
ROOF DECKMEMBRANE
FLASHING
Figure 3.1 - Early design concept
The wind vent was initially considered as a two-part construction, an upper and lower element, separated by a post or series of posts. This design would satisfy several design conditions. First, the outlet through which the air would be drawn from beneath the roof membrane needed to be elevated off the roof surface to prevent the infiltration of liquid water. This requirement integrated well with the need for the lower body to form the lower half of a Venturi channel. Second, the lower body was designed to be flashed into a roof membrane, necessitating a flange around its perimeter. Third, the upper body was visualized as a cap not

23
only forming the upper half of the Venturi channel, but also protecting the outlet in the lower body from rain. The evolution of the shape of the upper and lower bodies grew from the parameters mentioned above. A shallow dome was originally selected for the lower body to create a smooth transition from the air stream across the roof surface to the reduced area created between the two bodies of the vent. An ellipsoid was similarly chosen for the upper body to encourage attached air flow into the gap between the bodies, while simultaneously protecting the outlet hole at the top of the lower body from the weather. Additional strategies for dealing with the infiltration of water in its solid, liquid and gaseous forms were discussed during the early design phase, but relegated to future testing as described in Section 5.4. The method of attaching the two bodies was seen as critical to the successful construction of the final product, therefore a single, central post was initially proposed for its simplicity. The first study model, which met the criteria discussed here, is shown in Figure 3.2. Its construction is described in Section 3.3.
Figure 3.2 - Elevation of first study model
3.1.2 Testing Methods Several methods were considered to evaluate the ability of the wind vent to generate low pressure. Computational fluid dynamics (CFD) tools were contemplated, but due to the absence of validation of their applicability to this testing scenario, they were rejected in favor of methods more universally recognized by and accessible to designers, building officials, and the roofing industry at large. As noted in Section 2.4, research to develop software tools employing CFD for the evaluation of various roofing systems is ongoing. In-situ monitoring of the roof vent, while providing the closest approximation of real-world conditions, was found to have several significant limitations. First, a wind vent capable of resisting the effects of weather concomitant with on-site evaluation would have been more costly to produce and more difficult to adjust during the early phases of design development. Second, the relationship of wind speed to air pressure was critical to the validation of the first hypothesis; due to

24
the fluctuating nature of real wind conditions, it would have been difficult or impossible to obtain the constant air flows necessary for testing the wind vent at a wide range of wind speeds. The variable air density present in an in-situ setup would also present a complicating factor. The ability to control the wind speed and atmospheric conditions suggested the use of wind tunnel testing. This method, as seen in Section 2.3, is promulgated in ASCE 7 and many model building codes as the industry standard for testing buildings where analytical procedures cannot adequately predict the effects of wind loading. It is also the method by which existing pressure-equalized roof systems have been evaluated. The wind tunnels proposed for use in this study provided easily accessible platforms allowing simple adjustment and interchange of study models and the ability to measure controlled infiltration into the lower cavity of the wind vent. Originally, a reduced-scale model of the wind vent was considered for wind tunnel testing, allowing a mock-up of a building edge to be constructed in the cross-section of the wind tunnel. However, testing a reduced-scale model meant an associated increase of wind speeds to keep a constant Reynolds number. Equation 3.1 shows that for a given air density and viscosity, wind speed and length are inversely proportional.
µρVL=Re Equation 3.1
where Re = Reynolds number ρ = Air density V = Wind speed L = Length µ = Viscosity Because the wind tunnels used in the study were able to collectively generate wind speeds from 0 to 150 mph, a full scale model was best able to take advantage of the full range of wind speeds, and provided the closest approximation to site conditions. It was ultimately deemed unnecessary to model the roof edge for this study, because the wind vent was evaluated for its effects in the field of the roof rather than at the areas of turbulence nearer the perimeter and corners. Additionally, in creating a full-scale mock-up of the wind vent, the design team had the opportunity to consider and address several fabrication issues early in the design process. 3.1.3 Wind Tunnel Testing Wind tunnel testing was conducted on two study models to determine the optimum geometry for the wind vent prototype. The initial testing took place in the Engineering Science and Mechanics (ESM) Wind Tunnel in the Fluid

25
Mechanics Lab in Norris Hall at Virginia Tech. The data collected from these low speed tests provided critical information used in the design of the prototype, which was tested in Virginia Tech's Stability Wind Tunnel located in Randolph Hall. Refer to Appendix A for principal specifications on the two tunnels. 3.2 Schematic of Experimental Setups in ESM Wind Tunnel, Relation of
Pressure to Wind Speed, and Calculation of Cp Before discussing the specific construction and testing procedures for each of the study models and the prototype, it is useful to describe the experimental setup and define the variables to be tested. The following diagrams illustrate the setup used in the ESM wind tunnel for the first and second study models. The setup for the prototype in the Stability wind tunnel was similar and will be described in more detail in Section 3.6. In order to derive the negative pressure generated by the wind vent using one pressure sensor, it was necessary to perform the testing in two stages. The first stage determined the dynamic pressure generated by the wind and the second stage, immediately following, determined the gauge pressure beneath the wind vent (i.e. the shallow dome of the first study model or the lower hemisphere of the second study model). The pressure coefficient Cp is a ratio of these two values and indicates the effectiveness of the wind vent at generating the desired low pressure.
Ptotal
PITOT TUBE
Ptotal
PstatictunnelPdynamic
PRESSURE SENSOR
OUTSIDE TUNNEL
INSIDE TUNNEL
Pstatictunnel
Figure 3.3 - Stage I to determine Pdynamic in ESM Wind Tunnel
Stage I: Measurements were taken as follows: Ptotal = Total pressure inside the tunnel, measured in Torr, at the end of the pitot tube.

26
Pstatictunnel = Static pressure inside the tunnel, measured in Torr, at the small holes along the circumference of the pitot tube. The total pressure inside the tunnel is composed of the static pressure inside the tunnel combined with the dynamic pressure generated by the wind in the tunnel.
dynamicelstatictunntotal PPP += Equation 3.2
so
elstatictunntotaldynamic PPP −= Equation 3.3
Pdynamic = Dynamic pressure, shown on the digital readout of the pressure sensor in Torr. It is the component of the pressure generated by the wind and is related to the velocity of the wind in the tunnel as follows:
2)(2 tunneldynamic VP ρ= Equation 3.4
so
ρdynamic2PV =tunnel Equation 3.5
where ρ = Air density, 1.11 kg/m2 as determined from the atmospheric conditions at the time of testing.
Vtunnel = Wind speed in the tunnel, measured in m/s. Pdynamic = Dynamic Pressure, which must be converted to Pascal. (1 Torr = 133.33 Pascal) The measured dynamic pressures and the air density were used to calculate the wind speeds in the ESM tunnel at the time of testing.

27
Pstaticvent
TOP VIEW OF LOWER HEMISPHERE
Ptotal
PITOT TUBE
Ptotal
PstatictunnelPgauge
PRESSURE SENSOR
OUTSIDE TUNNEL
INSIDE TUNNEL
Pstatictunnel
Pstaticvent
Figure 3.4 - Stage II to determine Pgauge in ESM Wind Tunnel
Stage II: Measurements were taken as follows: Pstaticvent = Static pressure inside the shallow dome or lower hemisphere, measured in Torr, at the end of the plastic tubing. Pstatictunnel = Static pressure inside the tunnel, measured in Torr, at the small holes along the circumference of the pitot tube. The plastic tubing from the end of the pitot tube was unplugged from the pressure sensor (See Stage I) and replaced with tubing leading from inside the shallow dome or lower hemisphere. This was done to allow the pressure sensor to subtract the static pressure in the tunnel from the static pressure beneath the wind vent, to obtain Pgauge, as seen in Equation 3.7.
gaugeelstatictunnstaticvent PPP += Equation 3.6
so
elstatictunnstaticventgauge PPP −= Equation 3.7

28
Pgauge = Gauge pressure, shown on the digital readout of the pressure sensor in Torr. It was a negative number because the static pressure inside the tunnel was larger than the static pressure inside the dome, as was hypothesized. As introduced in Hypothesis 1, the Bernoulli Equation states that as the dynamic pressure rises, the static pressure drops in order to maintain a constant total pressure.
22 )(2)(2 ventstaticventtunnelelstatictunn VPVP ρρ +=+ Equation 3.8
where Pstatictunnel = Static pressure in the tunnel Vtunnel = Wind speed in the tunnel Pstaticvent = Static pressure in the cavity of the lower body of the wind vent Vvent = Wind speed at the wind vent ρ = air density Pgauge, the gauge pressure, is related to the wind speed in the tunnel and at the vent as follows:
])()[(2 22venttunnelelstatictunnstaticventgauge VVPPP −=−= ρ Equation 3.9
Cp is the ratio used to relate the effectiveness of each study model and the prototype. It is derived as follows:
dynamicgaugep PPC = Equation 3.10
When Pgauge is negative, the ratio Cp is also negative. Cp is directly proportional to Pgauge. The lower the gauge pressure, the lower the Cp, and therefore the more effective the model. Cp relates to wind speed in the tunnel and at the vent as follows:
2)(1 tunnelventdynamicgaugep VVPPC −== Equation 3.11
3.3 First Study Model For ease of construction, testing and future fabrication the first study model was built with a central post separating the upper and lower portions of the model.

29
The upper portion of the model (ellipsoid) was built with rounded edges to encourage an attached air flow stream. The top of the lower portion of the model (shallow dome) was designed to rise 4” above the roof membrane, to allow for 2” of possible standing water on the roof. The model was constructed of 3/16” thick foam core board ribs covered with Bristol board and coated with a plastic spray-on material. The underside of the ellipsoid was fitted with concentric rings to create surface roughness to help with the attachment of the airflow. A ½” inside diameter PVC pipe was imbedded securely in the ellipsoid portion of the model, extended through a PVC fitting at the top of the shallow dome, and inserted into a hole in the plywood base of the ESM Wind Tunnel. The pipe was held in place with a set screw to allow various gaps between the shallow dome and ellipsoid to be tested.
R10"
1'-0"
2"
2"
1'-4"
4"2"
VAR
IES
Figure 3.5 - Section through first study model

30
Figure 3.6 - Shallow dome, top and bottom view
Figure 3.7 - Ellipsoid, top and bottom view
The shallow dome was taped to the plywood base of the wind tunnel with duct tape to prevent air infiltration into the cavity. A pitot tube was installed in the back wall of the ESM wind tunnel, and plastic tubing was run from the cavity of the shallow dome to a pressure sensor located outside the tunnel. Evaluation of the first study model consisted of testing the four scenarios diagrammed in Figure 3.8.
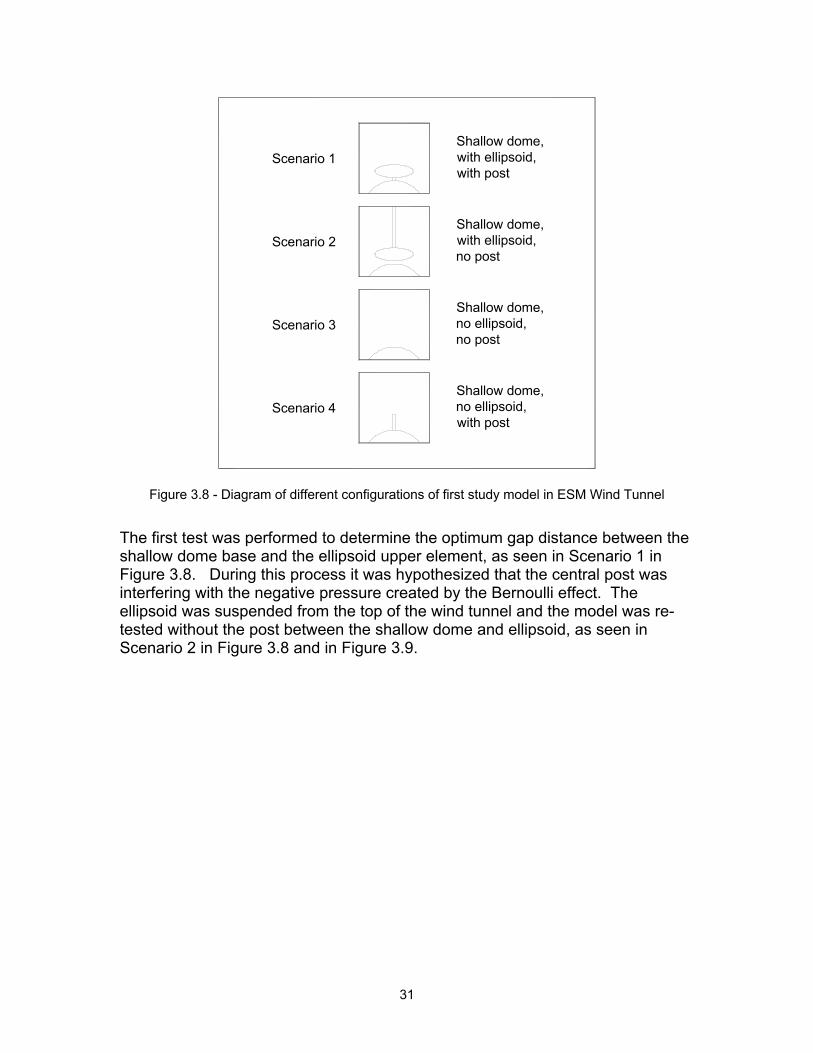
31
Shallow dome, with ellipsoid, with post
Shallow dome, with ellipsoid, no post
Shallow dome, no ellipsoid, no post
Shallow dome, no ellipsoid, with post
Scenario 4
Scenario 3
Scenario 2
Scenario 1
Figure 3.8 - Diagram of different configurations of first study model in ESM Wind Tunnel
The first test was performed to determine the optimum gap distance between the shallow dome base and the ellipsoid upper element, as seen in Scenario 1 in Figure 3.8. During this process it was hypothesized that the central post was interfering with the negative pressure created by the Bernoulli effect. The ellipsoid was suspended from the top of the wind tunnel and the model was re-tested without the post between the shallow dome and ellipsoid, as seen in Scenario 2 in Figure 3.8 and in Figure 3.9.

32
Figure 3.9 - Experimental setup with ellipsoid suspended from top of wind tunnel - Scenario 2
Further testing, as seen in Scenario 3 in Figure 3.8, was performed to isolate the effect of the shallow dome alone, without the ellipsoid, to verify that the geometry of the ellipsoid was in fact contributing significantly to the reduced pressure measured beneath the shallow dome. To determine the effect of the central post, the model was also tested without the ellipsoid, with the post in place, as seen in Scenario 4 in Figure 3.8. The pressure coefficient Cp was calculated at wind speeds of 14.1 m/s (31.5 mph), 15.85 m/s (35.5 mph), 17.8 m/s (39.8 mph) and 19.4 m/s (43.4 mph), for the four different scenarios. Results of the testing of the first study model are presented in Section 4.1. 3.4 Redesign and Second Study Model While in the process of testing the first study model, it was suggested that a double hemisphere would be the ideal shape and would provide lower pressure than that generated by the ellipsoid and shallow dome of the first study model. To test this assumption, a second study model consisting of two rigid plastic hemispheres with a radius of 6¼” was constructed and tested. The model was formed from two plastic trash can lids, each covered with half of an inflatable ball secured to the lid at the perimeter with duct tape.

33
6 1/
4"6
1/4"
V AR
IES
1'-0 1/2"
1'-0 1/2"
R6 1/4"
R6 1/4"
Figure 3.10 - Section through second study model
The upper hemisphere was suspended from the top of the ESM Wind Tunnel with a ½” inside diameter PVC pipe, while the lower hemisphere was taped to the plywood floor of the tunnel. As with the first study model, the optimum gap distance between the hemispheres was determined, and the pressure coefficient Cp was derived at wind speeds of 14.1 m/s (31.5 mph), 15.85 m/s (35.5 mph), 17.8 m/s (39.8 mph) and 19.4 m/s (43.4 mph). Results of the testing of the second study model are presented in Section 4.2. 3.5 Construction and Testing of the Prototype The next phase of the project involved the creation of a prototype made out of a rigid plastic material ultimately compatible with the PVC roof membrane. While the roof membrane would not be tested in combination with the wind vent in the Stability Wind Tunnel, the prototype was intended to simulate the final wind vent as closely as possible. Ed Dorsa and Bill Green, professors in the Industrial Design Department of the College of Architecture and Urban Studies at Virginia Tech, were consulted regarding the best method to accomplish this goal. The design team decided that rotational molding of the vent would ultimately provide the best product, but due to high cost and time commitment, this method was not used for the initial prototype. Instead, the prototype was built in two parts. The radius of both hemispheres was set at 5” to permit fabrication in the vacuum former in the Plastics Lab at Virginia Tech's College of Architecture and Urban Studies.

34
1"
R5"
1"5"
R5"
5"10"
10"
1 11
/16"
Figure 3.11 - Section through prototype
The upper hemisphere was constructed of ¾” thick medium-density fiberboard (MDF), laminated with wood glue and turned on the lathe to achieve the desired shape. Threaded inserts were built into the laminated shape to receive the threaded rods that would connect the two halves of the prototype. A groove was routed in the underside of the upper hemisphere to act as a drip, preventing capillary action from carrying water to a location directly above the hole in the lower hemisphere. Because the lower hemisphere needed to be hollow in order to create a void in which to measure low air pressures, it was vacuum formed of a strong, rigid plastic material. High-impact polystyrene was selected for its strength and workability. 3/16” thick stock was chosen because it was the thickest material capable of being vacuum formed in the Plastics Lab. A MDF base was built in the same manner as the upper hemisphere, attached to a chipboard flange extending 1” beyond the MDF hemisphere and used as a mold for the high-impact polystyrene. A 1” diameter hole was drilled in the top of the lower hemisphere after vacuum forming, and three holes were drilled 1” in from the flange to receive the threaded rods.

35
Figure 3.12 - MDF base with chipboard flange, used as a mold for high-impact polystyrene lower hemisphere
The hemispheres were connected with three 3/8” threaded rods spaced evenly and located 1” inboard of the flange around the base of the lower hemisphere. The gap between the two hemispheres was set at 1.6" based on test results from the second study model.
Figure 3.13 - Prototype placed in Stability Wind Tunnel
The wind vent was placed in the Virginia Tech Stability Wind Tunnel as shown In Figure 3.13. The threaded rods were inserted through holes in a plywood platform and secured with double nuts. The flange of the polystyrene base was sealed with duct tape to the plywood platform, effectively preventing air from infiltrating the cavity from leaks around the perimeter. The plywood platform was then taped securely to the floor of the wind tunnel. A pitot tube was installed in the wall of the Stability Wind tunnel, and plastic tubing was run from the inside of the cavity of the lower hemisphere to a pressure sensor located outside the tunnel. A separate length of ¾” diameter plastic tubing equipped with a check valve was installed beneath the dome to allow the introduction of a controlled

36
amount of ambient air into the cavity of the dome at various times during the testing.
Figure 3.14 - Underside of plywood platform showing plastic tubing connected to pressure sensor and flow meter
3.6 Schematic of Experimental Setup in Stability Wind Tunnel to Test
Effect of Infiltration The ESM tunnel achieved a maximum wind speed of 43.4 mph during the testing of the first and second study models. The prototype, designed to withstand much higher winds speeds, was tested in the Stability wind tunnel because of its ability to reach wind speeds approaching 150 mph, the targeted wind speed of the study.

37
Figure 3.15 - Experimental setup in Stability Wind Tunnel
The experimental setup in the Stability wind tunnel was similar to the setup in the ESM Wind Tunnel. The air density, ρ, was determined to be 1.17 kg/m2 at the time of testing. First, the dynamic pressure was determined as shown in Figure 3.16.
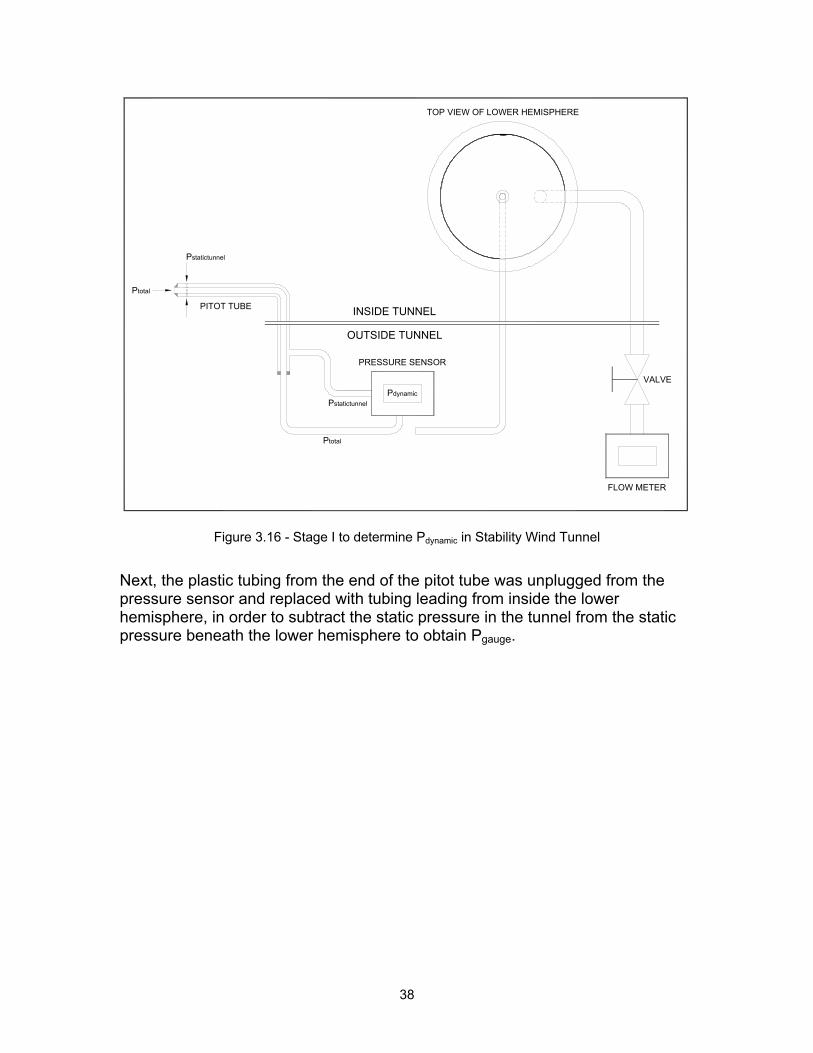
38
Ptotal
Ptotal
Pstatictunnel
PstatictunnelPdynamic
PITOT TUBE INSIDE TUNNEL
OUTSIDE TUNNEL
PRESSURE SENSOR
TOP VIEW OF LOWER HEMISPHERE
VALVE
FLOW METER
Figure 3.16 - Stage I to determine Pdynamic in Stability Wind Tunnel
Next, the plastic tubing from the end of the pitot tube was unplugged from the pressure sensor and replaced with tubing leading from inside the lower hemisphere, in order to subtract the static pressure in the tunnel from the static pressure beneath the lower hemisphere to obtain Pgauge.

39
Ptotal
Ptotal
Pstatictunnel
PstatictunnelPgauge
PITOT TUBE INSIDE TUNNEL
OUTSIDE TUNNEL
PRESSURE SENSOR
Pstaticvent
Pstaticvent
TOP VIEW OF LOWER HEMISPHERE
VALVE
FLOW METER
Figure 3.17 - Stage II to determine Pgauge in Stability Wind Tunnel
The tunnel wind speed was slowly increased to 48 miles per hour, where data was first recorded. Pgauge was recorded at ten different wind speeds ranging from 48 mph to 145 mph. The intervals were uneven because the incremental increase in motor speed of the wind tunnel did not correlate precisely with the increase in wind speed. One of the objectives of this study was to test the effects of infiltration on the ability of the wind vent to maintain negative pressure beneath the roof membrane. If the wind vent could tolerate some leakage, this would demonstrate a certain factor of safety in the system, proving that certain levels of infiltration would be acceptable at given wind speeds. These levels would give some indication of how airtight the roof deck and insulation would need to be for the system to work effectively. In order to test the hypothesis that the wind vent would generate sufficient pressure to counteract a measured amount of infiltration, a ¾” diameter plastic tube was inserted into the space beneath the lower hemisphere and connected to a check valve in the line, allowing measurement of Pgauge with and without infiltration. The flow meter attached to the line measured the infiltration flow rate in liters per hour. The pressure was recorded at each wind speed with no infiltration, and again with the check valve opened at the same wind speed. The amount of infiltration was also recorded at
40
each wind speed interval. Results of the testing of the prototype are presented in Section 4.4. 3.7 Summary of Methodology The study design began with a determination of the appropriate geometry for the wind vent. The shape of the wind vent was based on the principles of fluid mechanics explained in Chapter 2. After an assessment of the various available testing methods, wind tunnel testing of a full-scale model was selected. The hypotheses were evaluated through the construction and testing of two study models in the ESM Wind Tunnel and the fabrication and testing of a prototype in the Stability Wind Tunnel. The iterative nature of the testing permitted an optimization of the geometry of the bodies of the vent, the distance between the bodies, and their method of attachment. The effect of infiltration into the lower cavity of the wind vent was also investigated. The results of the testing are presented in Chapter 4.

41
Chapter 4: Results 4.1 Results of Testing of First Study Model Testing began in the ESM wind tunnel with the first study model, as described in Section 3.3. The initial test of the first study model determined the optimum gap distance between the shallow dome and the ellipsoid by adjusting the gap at four different wind speeds as seen in Chart 4.1.
-0.9
-0.8
-0.7
-0.6
-0.5
-0.4
-0.3
-0.2
-0.1
0.00.75 1.00 1.25 1.50 2.00
Distance between bodies (in)
Cp
14.1 m/s 15.85 m/s 17.8 m/s 19.4 m/s
Chart 4.1 - Cp vs. Distance between bodies for shallow dome, with ellipsoid and post
The optimum gap between the shallow dome and the ellipsoid for the first study model, with the post in place, was determined to be ¾”. A gap smaller than ¾” was not tested for Scenario 1 because it was assumed that obstruction of the air stream would occur in a smaller gap, inhibiting the performance of the wind vent. This assumption was proved correct in the testing of Scenario 2, seen in Chart 4.2. Because it had been hypothesized that the central post might interfere with the creation of low pressure inside the cavity of the shallow dome, the team ran

42
additional tests to determine the effects of the post on the pressure coefficient, Cp.
First, the ellipsoid of the first study model was suspended from the top of the wind tunnel to eliminate the post between the shallow dome and the ellipsoid. A test was conducted to determine the optimum gap distance between the bodies with this new configuration.
-1.6
-1.4
-1.2
-1.0
-0.8
-0.6
-0.4
-0.2
0.00.50 0.75 1.00 1.25 1.50 2.00
Distance between bodies (in)
Cp
14.1 m/s 15.85 m/s 17.8 m/s 19.4 m/s
Chart 4.2 - Cp vs. Distance between bodies for shallow dome, with ellipsoid, no post
The optimum gap distance between the ellipsoid and the shallow dome for the first study model, without the post, was determined to be 1”, or .06 times the diameter of the shallow dome in plan. Further testing was done to determine the relative importance of the effect of the central post on the performance of the first study model. Portions of the model were tested in four different combinations, as diagrammed in Chart 4.3. The accompanying graph shows the Cp calculated for each scenario.
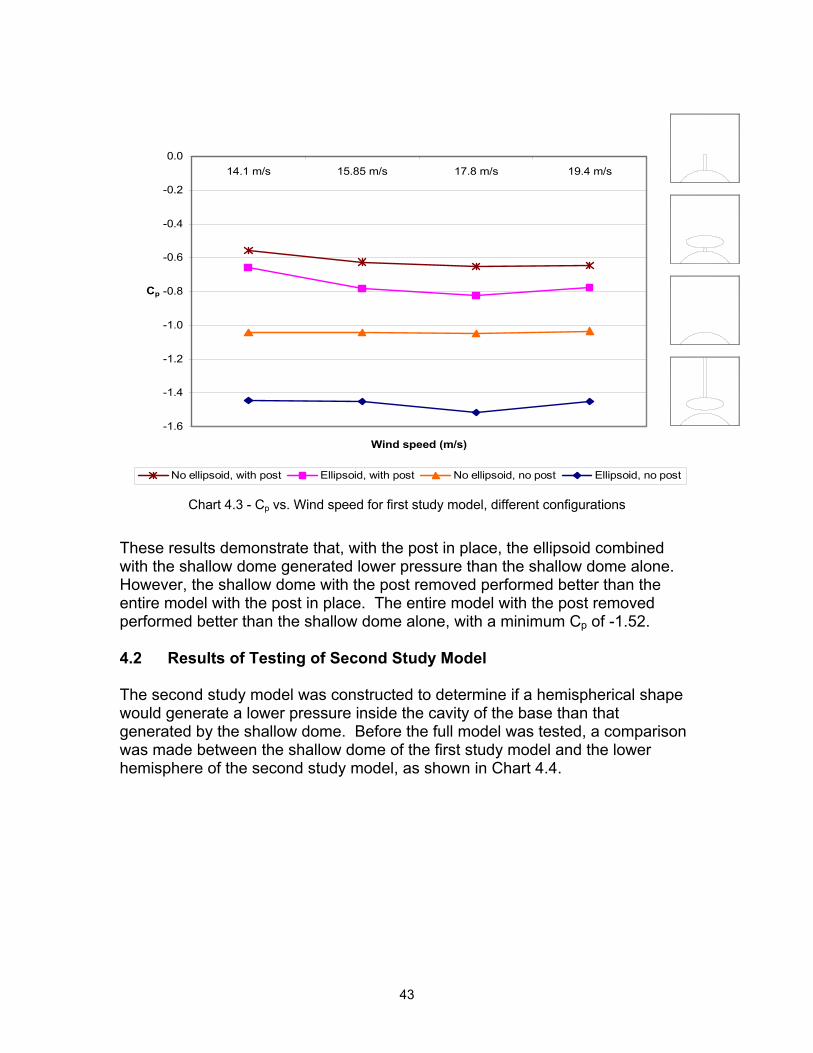
43
-1.6
-1.4
-1.2
-1.0
-0.8
-0.6
-0.4
-0.2
0.019.4 m/s17.8 m/s15.85 m/s14.1 m/s
Wind speed (m/s)
Cp
No ellipsoid, with post Ellipsoid, with post No ellipsoid, no post Ellipsoid, no post
Chart 4.3 - Cp vs. Wind speed for first study model, different configurations
These results demonstrate that, with the post in place, the ellipsoid combined with the shallow dome generated lower pressure than the shallow dome alone. However, the shallow dome with the post removed performed better than the entire model with the post in place. The entire model with the post removed performed better than the shallow dome alone, with a minimum Cp of -1.52. 4.2 Results of Testing of Second Study Model The second study model was constructed to determine if a hemispherical shape would generate a lower pressure inside the cavity of the base than that generated by the shallow dome. Before the full model was tested, a comparison was made between the shallow dome of the first study model and the lower hemisphere of the second study model, as shown in Chart 4.4.

44
-1.6
-1.4
-1.2
-1.0
-0.8
-0.6
-0.4
-0.2
0.019.4 m/s17.8 m/s15.85 m/s14.1 m/s
Wind speed (m/s)
Cp
Shallow dome Hemisphere
Chart 4.4 - Cp vs. Wind speed for shallow dome and lower hemisphere (base only)
As expected, the hemisphere generated a lower pressure than the shallow dome, with a correspondingly lower Cp. The complete second study model was then placed in the ESM wind tunnel to determine the optimum gap distance between the upper and lower hemispheres as described in Section 3.4.

45
-3.0
-2.5
-2.0
-1.5
-1.0
-0.5
0.01.00 2.00 3.00 4.00
Distance between bodies (in)
Cp
14.1 m/s 15.85 m/s 17.8 m/s 19.4 m/s
Chart 4.5 - Cp vs. Distance between bodies for double hemisphere
The optimum gap distance between the two hemispheres was experimentally determined to be 2”, or .32 times the diameter of the hemispheres. The second study model was retested with an optimized gap distance of 2” between the upper and lower hemispheres. As expected, the second study model developed a lower pressure than that of the first study model, with a minimum Cp of -2.40, as shown in Chart 4.6.

46
-3.0
-2.5
-2.0
-1.5
-1.0
-0.5
0.019.4 m/s17.8 m/s15.85 m/s14.1 m/s
Wind speed (m/s)
Cp
double hemisphere
Chart 4.6 - Cp vs. Wind speed for double hemisphere
4.3 Summary of Results of First and Second Study Models Chart 4.7 shows a summary of the calculated pressure coefficients obtained by testing the two models with variation in post placement and inclusion of the upper body.

47
-3.0
-2.5
-2.0
-1.5
-1.0
-0.5
0.019.4 m/s17.8 m/s15.85 m/s14.1 m/s
Wind speed (m/s)
Cp
Ellipsoid, with post No ellipsoid, no post Ellipsoid, no postLower hemisphere Double hemisphere
Chart 4.7 - Cp vs. Wind speed for first and second study models, different configurations
4.4 Results of Stability Wind Tunnel tests of Prototype On February 14, 2003, the prototype was placed in the Stability Wind Tunnel. Measurements of the pressure beneath the lower hemisphere were taken at speeds ranging from 48 to 145 miles per hour. At each interval, the pressure was measured both with the check valve open, and with it closed, as described in Section 3.6. Chart 4.8 shows the Cp versus the wind tunnel speed for the assembly with and without infiltration introduced into the cavity of the lower hemisphere.

48
-1.2
-1.0
-0.8
-0.6
-0.4
-0.2
0.048 66 81 93 104 114 123 131 140 145
Wind speed (mph)
Cp
Sealed model Model with leakage
Chart 4.8 - Cp vs. Wind speed for prototype with and without leakage
Table 4.1 illustrates the percentage difference between the Cp of the prototype with and without leakage of air into the cavity. As the wind speed increased, the rate of leakage also increased. The pressure in the cavity decreased at roughly the same rate, which kept the pressure coefficient Cp fairly constant throughout the full range of wind speeds tested. The minimum Cp achieved was -1.11.
Table 4.1 - Selected Stability Wind Tunnel data
Speed (mph) Leakage (L/hr) Cp (no leakage) Cp (with leakage) % diff in Cp 48 -1.11 -1.08 2.65 66 -1.07 -1.06 0.99 81 1.7 -1.07 -1.05 1.64 93 2.2 -1.06 -1.05 0.62
104 2.8 -1.05 -1.04 1.01 114 3.5 -1.03 -1.02 0.85 123 4 -1.01 -1.01 0.75 131 4.5 -1.02 -1.00 1.96 140 5.2 -1.02 -1.01 1.14 145 5.5 -1.03 -1.02 1.16

49
Tabular data for wind tunnel testing in both the ESM Wind Tunnel and the Stability Wind Tunnel can be found in Appendix B. 4.5 Summary of Results The results of the testing of the first study model in the ESM Wind Tunnel indicated the optimum gap distance between the two bodies and illustrated the need to eliminate the central post in favor of a decentralized method of connecting the two bodies. Testing of the second study model in the ESM Wind Tunnel verified that a hemisphere was a more appropriate shape for both the upper and lower bodies than the ellipsoid and shallow dome originally proposed. The optimum gap distance between the two hemispheres was also derived. Testing of the prototype in the Stability Wind Tunnel proved that the wind vent generated low pressure as expected at speeds up to 145 miles per hour, and demonstrated the ability of the wind vent to tolerate measurable amounts of infiltration into the lower hemisphere.

50
Chapter 5: Conclusions and Final Design 5.1 Conclusions from Testing of First and Second Study Models The first study model was used to test the geometry and spacing of the upper and lower portions of the wind vent. After testing the first study model in four different configurations, it was determined that the central post reduced the Bernoulli effect created by the constriction of the air stream, in fact, the base alone performed better that the shallow dome and ellipsoid with the post in place. It was necessary to eliminate the post and devise another method of separating the two bodies in the construction of the prototype. The second study model improved the pressure coefficient by replacing the ellipsoid and shallow dome with hemispheres. The resulting Cp of -2.40 was significantly less than the Cp of -1.52 generated by the first study model. The gap between the upper and lower hemispheres of the second study model was optimized at .32 times the diameter of the hemispheres, a fortuitous result that will be discussed later in this chapter. Based on the results of the testing of the first and second study models, a decision was made to proceed with the hemispherical model with three posts separating the lower and upper hemispheres in lieu of one central post, in order to maximize the low pressure generated by the wind vent. 5.2 Conclusions from Testing of Prototype The Stability Wind Tunnel was used to test the prototype because it was able to achieve much higher wind speeds than the ESM Wind Tunnel. The goal was to reach a wind speed of 150 mph to simulate the highest Basic Wind Speed listed in ASCE 7 for the continental United States. The maximum speed achievable in the Stability Wind Tunnel on the day of testing was 145 mph. The gauge pressure beneath the lower hemisphere was demonstrated to be directly proportional to the dynamic pressure multiplied by the pressure coefficient as expected. Because the air density in the tunnel was a constant 1.17 kg/m² throughout the testing, the results show that Cp remained constant throughout the range of wind speeds tested (see Chart 4.8). The average Cp for the model without leakage was -1.05, as compared to -1.52 for the first study model and -2.40 for the second study model. There are a few explanations for the disparity between pressure coefficients in the study models and the prototype. The difference in the tunnels largely accounts for the higher Cp in the prototype as compared to the study models. The ESM Tunnel, with a cross section of 22 inches by 22 inches, was subject to significant blockage effects. Since the study models were so large in relation to

51
the tunnel, the cross section was significantly reduced, creating faster wind speeds around the edges of the model along with associated lower pressures in its local vicinity. The prototype, when placed in the six foot by six foot cross section of the Stability Tunnel, did not create the same blockage effects. To a much smaller degree, the three posts may have also interfered with the Bernoulli effect created by the prototype. The optimized first study model and the second study model were tested with no obstructions between the bodies, while the prototype was tested with three posts separating the bodies, possibly creating some disturbance in the air flow. Because the study models were not structurally sound enough to handle the wind speeds tested in the Stability Wind Tunnel, nor were they designed to be suspended from the top of the much larger cross section, it was not possible to achieve a true comparison between them and the prototype. The average difference in Cp between the sealed model and the model with leakage was 1.28%, suggesting that the prototype generates sufficient low pressure to tolerate significant infiltration without a noticeable loss of performance. These results indicate that the suction created by the wind vent will not be the controlling factor in determining the effectiveness of the system, but rather the ability of the roofing membrane and its substrate to allow transfer of air beneath the membrane to the location of wind vent will determine the success of the system. 5.3 Validation of Hypotheses It is clear from the results that the gauge pressure, defined as the difference between the static pressure in the cavity of the lower body of the wind vent and the static pressure in the free stream above the roof membrane, was directly proportional to the dynamic pressure multiplied by a pressure coefficient, Cp. This observation validates Hypothesis 1, stated in Equation 1.2. It is also evident from the negative values of Pgauge that the static pressure in the cavity of the lower body of the wind vent with no infiltration was lower than the static pressure present above the roof membrane during a wind event, confirming Hypothesis 2, stated in Equation 1.3. The static pressure in the cavity of the lower body of the wind vent when infiltration was introduced into the cavity was lower than the static pressure present above the roof membrane during a wind event, but higher than the static pressure in the cavity of the lower body of the wind vent with no infiltration, verifying Hypothesis 3, stated in Equations 1.4 and 1.5.
5.4 Future Development of the Prototype Future research involving the wind vent as part of a total roofing system will be discussed later in this chapter. For the wind vent itself, there are several design and fabrication issues that remain to be tested and resolved.

52
When translated into a commercial product, the wind vent will need to be optimized for mass production. To this end, the geometry of the prototype was deliberately designed to not only maximize the Bernoulli effect, but also to be symmetrical for economy of construction. The plastic material used in the wind vent must be strong enough to resist wind speeds in excess of 150 mph, but light enough to facilitate handling and installation, and to minimize the use of material for economy of manufacture. The plastic selected must be also be compatible with the PVC roof membrane. Another design issue relates to the possibility of material entering the lower hemisphere of the wind vent. Because it will be flashed into the roof membrane, it will be difficult or impossible to service, so prevention of entry of foreign matter into the cavity is paramount to the success of the vent. The use of some type of screening will need to be investigated as a means of preventing insects and wind-blown detritus from becoming trapped inside the vent. Of primary concern is the resistance of the wind vent to rain and snow infiltration. To a certain degree, the vent is self-shielded by the upper hemisphere which prevents all but wind-driven rain and snow from entering the hole in the top of the lower hemisphere. The optimum distance between the upper and lower hemispheres in the second study model was determined to be 2”, or .32 times the diameter of the hemispheres. In the prototype, this gap was proportionally reduced to 1.6” These results are fortuitous because the smaller the gap, the less propensity for the wind-driven rain and snow to reach the hole in the top of the lower hemisphere. The relatively small size of the hole, 1" in diameter, would also tend to discourage rain and snow from entering the cavity. The drip provided in the underside of the upper hemisphere will prevent capillary action from pulling water down the surface and allowing it to accumulate and drop into the opening below. The inherent ability of the vent to create increasingly low pressure during increasingly high winds also serves to protect the cavity from liquid water and snow as air is sucked from the cavity of the lower hemisphere during wind events. The degree to which water infiltrates the cavity due to rain could be simulated by placing the prototype in a water shower. However, wind-driven rain and snow is difficult to create experimentally, so the wind vent would be more effectively tested in an in-situ setup over an extended period of time. Several strategies have been promulgated to solve the potential water infiltration problem. A plastic dish, as shown in Figure 5.1, could be located inside the cavity of the lower hemisphere to catch any rain water that enters through the hole at the top. Holes would be located at the upper perimeter of the dish to allow for air to flow from the underside of the roof membrane to the 1” hole at the top of the lower hemisphere. The prototype would be tested in a water shower and in actual rain conditions to see how much water accumulates in this dish. If necessary, a small drainage tube fitted with a check valve could be installed to

53
drain the dish. The check valve would prevent wind from infiltrating the cavity of the lower hemisphere when the drainage tube is on the windward side of the model, but will allow water to drain out when the drainage tube is on the leeward side of the model. This design takes into account the variability of wind direction in the field.
1"
R6"
1"2"
6"
R6"
6"
1'-0"
1'-0"
Figure 5.1 - Future prototype with shallow dish and check valve
Another approach to preventing water infiltration would be the inclusion of a one-way valve within the cavity of the lower hemisphere. This feature is common to currently available equalizer valves and one-way roof vents. A flap of flexible material, e.g. EPDM or silicone rubber, is fixed within the body of the vent. In the case of the equalizer valve, the low pressure induced by vortices at roof edges lifts the flap and pulls air from beneath the roof membrane. When the wind dies down, gravity re-seats the flap in the closed position. With the one-way roof vent, the sun heats the roof membrane, expanding the air beneath it, forcing open the valve and allowing the air to escape. When the air beneath the roof membrane cools, it contracts, pulling the valve closed and preventing moisture-laden air from entering the roof assembly. This technology could be adapted to the wind vent by including a flap that would open when low pressure was generated by a wind event, and close when the wind subsides. The one-way valve would also allow for the drying effect provided by other vented systems currently on the market. A one-way valve would also prevent the possibility of short-circuiting the wind vented roofing system. There is some potential for a wind vent, while generating low pressure, to pull air through the cavity of an adjacent vent in addition to pulling air from the tributary area beneath the roof membrane surrounding it. The friction between the roof membrane and its substrate and the distance between wind vents would discourage this effect. However, if this short-circuit did have a

54
tendency to occur, the one-way valve would prevent air from being drawn through the hole at the top of the lower hemisphere of the neighboring vent. The design team hypothesized that both the drainage tube with the check valve and the one-way valve within the lower cavity would be unnecessary due to the high probability that the shallow dish would be sufficient to collect water until it could be evaporated, and the low probability that backflow of air through the system would pose a problem. The capacity of the vent to create low pressure even at very low wind speeds suggests that it will be self-drying, and will not permit sufficient quantities of moisture to enter the space beneath the roof membrane. As discussed in Chapter 2, moist air entering the roof space during stagnant conditions would quickly be warmed above its dew point temperature, preventing condensation from becoming a problem. The corollary problem raised in Chapter 2 of water vapor exiting the wind vent and condensing on its surface to form ice should not pose a problem because the vent will be constructed of plastic with a reasonable thermal insulation value, instead of metal, as in the case of some breather vents. The thickness and type of plastic may be adjusted based on the required insulation value. Further testing of the entire system will provide answers to these and other design questions. As discussed earlier, the possibility of using rotational molding to construct the wind vent is an attractive alternative to connecting the two hemispheres with posts. A roto-molded vent could be constructed as one piece, eliminating the problem of assembly. The three posts used in the current prototype would be replaced with tapered fins designed to minimize the adverse impact on the air stream while maximizing structural strength and rigidity. The following three-dimensional computer model was generated by Ed Dorsa, professor of Industrial Design at Virginia Tech, along with a scaled-down model formed in the Rapid Prototyper at the College of Architecture and Urban Studies.
Figure 5.2 – Three-D model of the roto-molded wind vent

55
5.5 Future Development of the Pressure-Equalizing Vent System The next phase of research involves the testing of the wind vent in combination with an elastomeric roof membrane and extruded expanded polystyrene (XEPS) substrate to determine the appropriate tributary area for each vent. The use of a felt backing beneath the elastomeric roof membrane not only isolates the PVC of the roof membrane from the XEPS, obviating the chemical incompatibility between the two materials (Patterson & Mehta, 2001), but also provides a small layer through which air will be pulled by the wind vents.
WIND VENT
PVC SKIRT - SOLVENT WELDED
PVC MEMBRANE WITH FELT BACKING
XEPS INSULATION
Figure 5.3 - Wind vented roof assembly
The roof membrane used in the assembly will be an Acryply 3000 roof system, which is a fabric-reinforced, hot-air-welded thermoplastic PVC single ply membrane with a thickness of 40 mils, manufactured by Acrylife, Inc. The flange surrounding the base of the vent will be solvent welded to a skirt also made of this membrane, which will in turn be welded to the top of the PVC base sheet. One suggested future test involves the insertion of a suction pump into a hole in the roofing membrane to simulate the effects of the wind vent. Test ports located at various points radiating from the central penetration would measure the low pressure generated at these locations. It might be necessary to provide corrugations or gaps in the upper surface of the XEPS substrate, wrinkles in the roof membrane (a technique currently used in the application of existing pressure-equalized roof systems), ribs in the flange of the lower hemisphere, or some combination of these strategies in order to improve the transfer of air from beneath the membrane to the hole at the top of the upper hemisphere. The speed at which the pressure is lowered is crucial to the ability of the system to weather storm events. The pressure beneath the membrane must be equalized quickly enough to stop membrane uplift before it is propagated throughout the roof surface. The proposed test would determine the area of influence of each wind vent and therefore serve as a guideline for appropriate spacing of the vents on a roof. The system will likely be fully adhered at certain intervals to minimize the damage should a section of roof fail due to loss of low pressure. This is

56
intended to add a safety factor to the roof system, and would eliminate the potential for transfer of air between vents as discussed above. Once the proper spacing has been established, the wind vents will be beta-tested on the roof of a building in Blacksburg, Virginia. Pressure sensors permanently installed beneath the membrane will continuously monitor the pressure generated by the wind vents. Weather data will be collected to observe the correlation between wind speed and pressure developed, and to study the effects of rain and snow on the wind vents. Funding for this research, and for a possible integration of thin film amorphous silicon photovoltaic cells into the roof membrane of the wind vented roofing system, is currently being sought. The combination of photovoltaic technology combined with the wind vented roofing system presents an exciting symbiosis, because the ability to vent heat away from the underside of the photovoltaic array would increase its performance capability, while the power generated by the photovoltaic cells would help to offset the cost of the wind vented roofing system. Without adhesives or fasteners to complicate the installation of the photovoltaic array, it becomes easier to contemplate the widespread use of this technology, particularly in remote areas where electricity must be generated on-site. 5.6 Final Remarks The goal of this project was to prove that a known principle of fluid mechanics could be applied successfully to a roof vent capable of securing the roof membrane to the roof deck, even in storm conditions. There is an inherent poetry to the notion of using the wind, the force that threatens to detach a roof membrane, to attach that same membrane to its substrate. The purity of this idea motivated the conception, construction and testing of the study models and prototype. The implications for economic and environmental sustainability are also significant. Removing the need for fasteners or adhesives reduces labor and material costs, and decreases the embodied energy of the entire system. The stimulating possibility of integrating the system with photovoltaic cells, enabling it to not only pay for itself but also contribute positively to the energy balance of the buildings it protects, will continue to drive the project through the next phases of testing and application. 5.7 Acknowledgements Special thanks go to the Center for Innovative Technology and Acrylife, Inc. for their financial support of this project.
57
References American Society of Civil Engineers. (2000). Minimum design loads for
buildings and other structures, ASCE 7-98. ASCE. Baker, M. C. & Hedlin, C. P. (1976). CBD-176: Venting of flat roofs. Canadian
Building Digest. National Research Council Canada, Division of Building Research.
Baskaran, A. (1996, October). The effects of dynamic wind loads on roofing
systems. Interface, pp. 5-8. Baskaran, A. & Savage, M. G. (2003, April). Wind pressure measurements on
full scale flat roofs. Interface, pp. 17-21. Building Officials and Code Administrators, Inc. (1996). The BOCA national
building code/1996: thirteenth edition. BOCA. Community of Science, Inc. (2003). Search U.S. patents.
http://patents.cos.com (31 May 2003). Dawson, S. (1994). Cambridge calling. The Architects’ Journal, 200.21, pp. 29-
38. Dregger, P. (1993, January-February). Hurricane force, part II: understanding
and minimizing the risk of wind damage. Western Roofing, pp. 1-2. Dregger, P. (2002, June). Air infiltration: the enemy of wind resistance and
condensation control. Interface, pp. 21-29. Federal Emergency Management Agency: Federal Insurance Administration.
(1993). Building performance: hurricane Andrew in Florida: observations, recommendations, and technical guidance. Washington, D.C.: Federal Insurance Administration.
French, W. R. (1999, August). Post-installation field evaluation of a pressure-
equalized single-ply roofing system to determine drying effects on a moist, cementitious, roof deck. Interface. pp. 3-12.
Ionica. R H Partnership Architects. http://www.rhpartnership.co.uk/o01.htm (18
May 2003). International Code Council. (2000). International Building Code 2000. ICC.

58
Lechner, N. (1991). Heating, cooling, lighting: design methods for architects. New York: John Wiley & Sons, Inc.
McDonald, J. R. & Smith, T. L. (1990). Performance of roofing systems in
hurricane Hugo. Lubbock, TX: Institute for Disaster Research, Texas Tech University.
Patterson, S. & Mehta, M. (2001). Roofing design and practice. Upper Saddle
River, NJ: Prentice-Hall, Inc. Pierce, H. H. & Woodring, W.J. (2002). Wind events and wind warranties.
Proceedings of the 17th International Convention and Trade Show. Roof Consultants Institute.
Rappaport, E. (1993). Preliminary report: hurricane Andrew 16-28 August,
1992. National Hurricane Center. http://www.nhc.noaa.gov/1992andrew.html (26 May 2003).
Wind resistance testing of roofing systems: report of task group on research
needs. (1989). Workshop on Roof Wind Uplift Resistance Testing. Oak Ridge, Tennessee.
Top ten natural disasters. (2003). FEMA Virtual Library and Electronic Reading
Room. http://www.fema.org/library/df_8.shtm. (26 May 2003). 2001 Company. (1997). How to dry out a wet roof. Waterbury, CT: 2001
Company. 2001 Company. Hurricane designed roof system. Waterbury, CT: 2001
Company. Vac-Q-Roofs: Burkeline roofing systems. (2002). Burke Industries Incorporated
Web Site. http://www.burkemercer.com/roofing/vacqroofs.asp (31 May 2003).
Young, D. F., Munson, B. R. & Okiishi, T. H. (2001). A brief introduction to fluid
mechanics: second edition. New York: John Wiley & Sons, Inc.
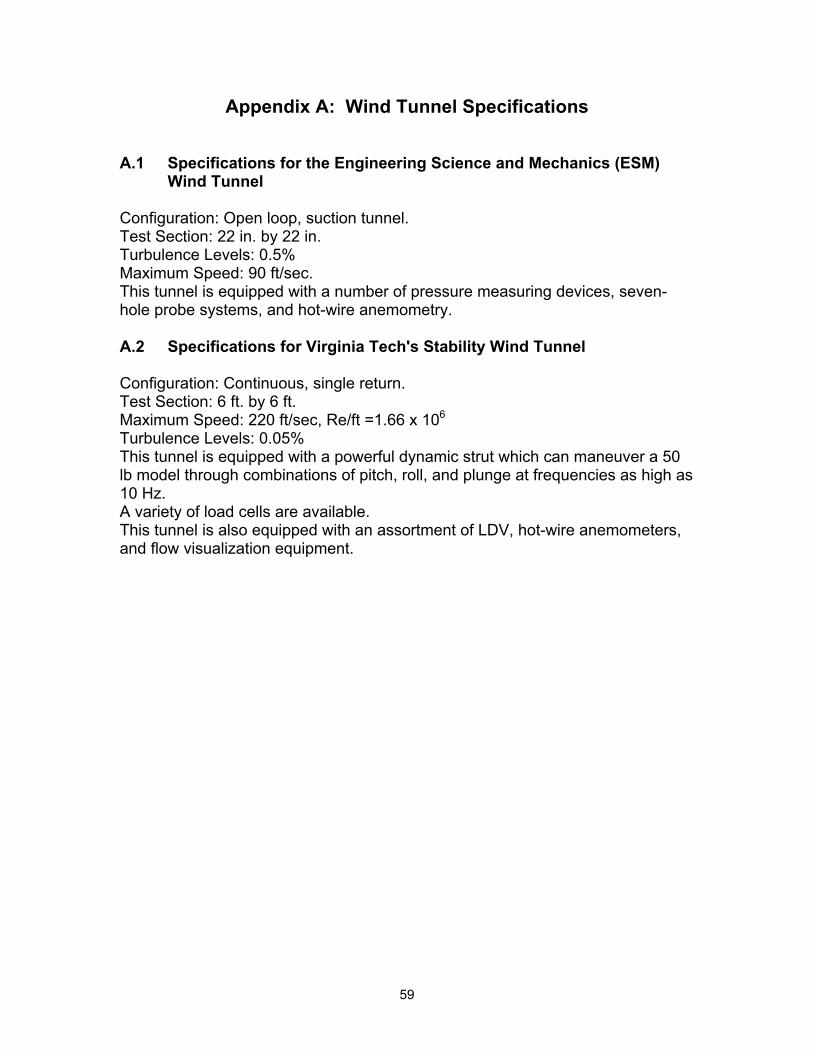
59
Appendix A: Wind Tunnel Specifications A.1 Specifications for the Engineering Science and Mechanics (ESM)
Wind Tunnel Configuration: Open loop, suction tunnel. Test Section: 22 in. by 22 in. Turbulence Levels: 0.5% Maximum Speed: 90 ft/sec. This tunnel is equipped with a number of pressure measuring devices, seven-hole probe systems, and hot-wire anemometry. A.2 Specifications for Virginia Tech's Stability Wind Tunnel Configuration: Continuous, single return. Test Section: 6 ft. by 6 ft. Maximum Speed: 220 ft/sec, Re/ft =1.66 x 10⁶ Turbulence Levels: 0.05% This tunnel is equipped with a powerful dynamic strut which can maneuver a 50 lb model through combinations of pitch, roll, and plunge at frequencies as high as 10 Hz. A variety of load cells are available. This tunnel is also equipped with an assortment of LDV, hot-wire anemometers, and flow visualization equipment.

60
Appendix B: Wind Tunnel Data B.1 ESM Wind Tunnel Data Data for first study model:
No post With post Distance btwn. bodies (in.) Pgauge (Torr) Cp Pgauge (Torr) Cp
0.75 -1.26 -1.40 -0.59 -0.66 1.00 -1.30 -1.44 -0.58 -0.64 1.25 -1.28 -1.42 -0.57 -0.63 1.50 -1.25 -1.39 -0.54 -0.60 2.00 -1.22 -1.36 -0.52 -0.58
Table B.1 - Shallow dome, with ellipsoid at 14.1 m/s, Pdynamic = 0.90 Torr
No post With post Distance btwn.
bodies (in.) Pgauge (Torr) Cp Pgauge (Torr) Cp 0.75 -1.64 -1.43 -0.90 -0.78 1.00 -1.67 -1.45 -0.83 -0.72 1.25 -1.65 -1.43 -0.82 -0.71 1.50 -1.60 -1.39 -0.82 -0.71 2.00 -1.54 -1.34 -0.80 -0.70
Table B.2 - Shallow dome, with ellipsoid at 15.85 m/s, Pdynamic = 1.15 Torr
No post With post Distance btwn.
bodies (in.) Pgauge (Torr) Cp Pgauge (Torr) Cp 0.75 -2.13 -1.49 -1.18 -0.83 1.00 -2.17 -1.52 -1.12 -0.78 1.25 -2.10 -1.47 -1.06 -0.74 1.50 -2.02 -1.41 -1.03 -0.72 2.00 -1.91 -1.34 -1.03 -0.72
Table B.3 - Shallow dome, with ellipsoid at 17.8 m/s, Pdynamic = 1.43 Torr
Table B.4 - Shallow dome, with ellipsoid at 19.4 m/s, Pdynamic = 1.73 Torr
No post With post Distance btwn. bodies (in.) Pgauge (Torr) Cp Pgauge (Torr) Cp
0.75 -2.48 -1.43 -1.34 -0.77 1.00 -2.51 -1.45 -1.29 -0.75 1.25 -2.44 -1.41 -1.28 -0.74 1.50 -2.30 -1.33 -1.25 -0.72 2.00 -2.12 -1.23 -1.20 -0.69

61
No post With post Speed (m/s) Pdynamic (Torr) Pgauge (Torr) Cp Pgauge (Torr) Cp
14.10 0.90 -0.94 -1.04 -0.50 -0.56 15.85 1.15 -1.20 -1.04 -0.72 -0.63 17.80 1.43 -1.50 -1.05 -0.93 -0.65 19.40 1.73 -1.79 -1.03 -1.12 -0.65
Table B.5 - Shallow dome, no ellipsoid, at various speeds
Data for second study model:
Speed (m/s) Pdynamic (Torr) Pgauge (Torr) Cp 14.10 0.90 -1.34 -1.49 15.85 1.15 -1.66 -1.44 17.80 1.43 -2.09 -1.46 19.40 1.73 -2.48 -1.43
Table B.6 - Base only
14.1 m/s 15.85 m/s 17.8 m/s 19.4 m/s Distance
btwn. bodies
(in.) Pgauge (Torr) Cp
Pgauge (Torr) Cp
Pgauge (Torr) Cp
Pgauge (Torr) Cp
1.00 -1.99 -2.21 -2.59 -2.25 -2.95 -2.06 -3.48 -2.01 2.00 -2.04 -2.27 -2.66 -2.31 -3.40 -2.38 -4.15 -2.40 3.00 -2.00 -2.22 -2.59 -2.25 -3.15 -2.20 -3.84 -2.22 4.00 -1.93 -2.14 -2.47 -2.15 -3.08 -2.15 -3.69 -2.13
Table B.7 - Double hemisphere
B.2 Stability Wind Tunnel Data
No leakage With leakage Pdynamic (Torr)
Speed (mph) Pgauge
(Torr) Cp Leakage (Liters/hr)
Pgauge (Torr) Cp
% diff in Cp
2.03 48 -2.26 -1.11 2.20 -1.08 2.65 3.76 66 -4.04 -1.07 4.00 -1.06 0.99 5.70 81 -6.10 -1.07 1.70 6.00 -1.05 1.64 7.60 93 -8.05 -1.06 2.20 8.00 -1.05 0.62 9.42 104 -9.90 -1.05 2.80 9.80 -1.04 1.01
11.40 114 -11.75 -1.03 3.50 11.65 -1.02 0.85 13.12 123 -13.30 -1.01 4.00 13.20 -1.01 0.75 15.04 131 -15.30 -1.02 4.50 15.00 -1.00 1.96 17.13 140 -17.50 -1.02 5.20 17.30 -1.01 1.14 18.40 145 -19.00 -1.03 5.50 18.78 -1.02 1.16
Table B.8 - Stability Wind Tunnel Data

62
Vita
ELIZABETH J. GRANT, AIA 1419 Highland Circle Blacksburg, Virginia 24060 (540) 951-0653 [email protected]
EDUCATION MASTER OF SCIENCE IN ARCHITECTURE Virginia Polytechnic Institute and State University,
Blacksburg, Virginia August 2003 (degree pending completion) BACHELOR OF ARCHITECTURE, Summa Cum Laude
Virginia Polytechnic Institute and State University, Blacksburg, Virginia August 1995
PROFESSIONAL PROJECT ARCHITECT EXPERIENCE HDH Associates, P.C., Christiansburg, Virginia
February 2001 - July 2003 Designed and managed educational and civic renovation projects. Coordinated work of consultants, directed drafting staff and marketed firm to current and prospective clients.
ARCHITECT Reynolds Architects Incorporated, Blacksburg, Virginia
July 2000 - November 2000 Organized and executed design and construction documents for civic, commercial, religious and health care facilities.
ASSOCIATE AND PROJECT MANAGER Ponikvar & Associates, Inc. Architects, Gainesville, Florida September 1995 - June 2000 Managed multiple building projects, including physicians’ offices, clinics and research facilities. Mentored architectural staff and represented firm.
DESIGNER
Science Museum of Western Virginia, Roanoke, Virginia November 1994 - December 1994 Designed information desk at museum entry in collaboration with museum staff. Participated in construction with cabinetmakers and fiber optic lighting designers.

63
INTERN Getz Taylor Architects, Inc., Havre de Grace, Maryland
June 1993 - August 1993 Developed design, drafting and office management skills. Prepared construction documents for commercial facilities. Generated presentation graphics and brochures.
PROFESSIONAL NCARB Certification 50844 REGISTRATION Virginia Registration 401 011993 & AFFILIATION Florida Registration R0016447 Ohio Registration 12788 American Institute of Architects 30128156 Roof Consultants Institute 22288 RESEARCH Co-Principal Investigator, “Design and Implementation
of a Pressure-Equalizing Vent System for Low Slope Roofs”, sponsored by the Center for Innovation Technology and Acrylife, Inc., 2003.
CONTINUING TMI Systems Design Corporation “Casework EDUCATION Specifications”, Blacksburg, Virginia, 13 May 2003.
Georgia Pacific Seminar “Dens Deck Products”, Christiansburg, Virginia, 18 November 2002.
Firestone Seminar “New Platinum System”, Christiansburg, Virginia, 5 November 2002.
Roof Consultants Institute (RCI) 17th Annual Convention
and Trade Show, Galveston, Texas, 4-6 May 2002.
AIA Virginia Society, “Overview of the 2002 International Building Code”, Roanoke, Virginia, 28 February 2002.
RCI, “Rooftop Safety for Consultants and Building Owners”, Atlantic City, New Jersey, 31 January 2002.
RCI, “Basics of Roofing”, Richmond, Virginia, 16 August 2001.
RCI 16th Annual Convention and Trade Show, Baltimore, Maryland, 21-23 April 2001.
Firestone Seminar, Christiansburg Virginia, 27 February 2001

64
AIA Virginia Society, “Building Virginia 2000”, Richmond, Virginia, 2-3 November 2000
Hufcor Program, “How to Optimize Acoustical Performance in Rooms with Operable Partitions”, Gainesville, Florida, 28 January 2000
Agency for Health Care Administration/Office of Plans and Construction (AHCA/OPC) 15th Annual Seminar, “New Directions for a New Century of Health Care Facility Design and Construction”, Tampa, Florida, 25-26 October 1999
Sto Finish Systems Division, “Class PB EIFS”, Gainesville, Florida, 18 December 1998
AHCA/OPC 14th Annual Seminar, “Codes, Standards and Regulations in Health Care Design and Construction”, Orlando, Florida, 7-8 December 1998
AHCA/OPC 13th Annual Seminar, “Innovations and Issues in Health Care Design and Construction”, Orlando, Florida, 8-9 December 1997
DPIC’s Continuing Education Program, “Liability I.Q.”, Gainesville, Florida, 19 March, 1997
HONORS Founders Scholarship, National Society, Women
Descendants of the Ancient and Honorable Artillery Company, 2001
Outstanding Student of the College of Architecture and Urban Studies, 1995 Henry H. Wiss Prize for Academic Achievement in History and Theory of Art and Architecture, 1995 AIA Foundation Scholarship, 1994 Shriver and Holland Scholarship, 1994 Second Prize in Second-Year Design Competition (Harold Hill Award), 1993

65
Dean’s List of the College of Architecture and Urban Studies, 1991-1995 President’s List for Notable Academic Achievement, 1991-1995 National Merit Scholarship Award, 1991-1994