Design and Control of AC/DC Microgrid System for Rural ...
91
DSpace Institution DSpace Repository http://dspace.org Power Systems Engineering Thesis 2020-05-05 Design and Control of AC/DC Microgrid System for Rural Electrification in Ethiopia: A Case Study on Kirakir Village Tanashu, Minyahil http://hdl.handle.net/123456789/10804 Downloaded from DSpace Repository, DSpace Institution's institutional repository
Transcript of Design and Control of AC/DC Microgrid System for Rural ...

DSpace Institution
DSpace Repository http://dspace.org
Power Systems Engineering Thesis
2020-05-05
Design and Control of AC/DC Microgrid
System for Rural Electrification in
Ethiopia: A Case Study on Kirakir Village
Tanashu, Minyahil
http://hdl.handle.net/123456789/10804
Downloaded from DSpace Repository, DSpace Institution's institutional repository

Bahir Dar University
Bahir Dar Institute of Technology
Faculty of Electrical and Computer Engineering
Design and Control of AC/DC Microgrid System for Rural Electrification in
Ethiopia: A Case Study on Kirakir Village
By
Minyahil Tanashu
Advisor
Dr.-Ing. Belachew Bantyirga
Thesis submitted to the Faculty of Electrical and Computer Engineering of
Bahir Dar University in partial Fulfillment of the Requirements for the
Degree of Master of Science in Electrical and Computer Engineering (Power
Systems Engineering)
June, 2017
Bahir Dar, Ethiopia

Bahir Dar University
Bahir Dar Institute of Technology
Faculty of Electrical and Computer Engineering
Design and Control of AC/DC Microgrid System for Rural Electrification in
Ethiopia: A Case Study on Kirakir Village
By
MinyahilTanashu
APPROVAL BY BOARD OF EXAMINERS
Mr. Birhanu Zelalem ____________
Chairperson Signature
Dr. - Ing. BelachewBantyirga
Thesis advisor Signature
Dr. Tasew Tadiows
Internal Examiner Signature
Dr.Getachew Biru
External Examiner Signature

Design and Control of AC/DC Microgrid System for Rural Electrification in Ethiopia: Case Study on Kirakir
i
Declaration
I, the undersigned, declare that this thesis is my original work, has not been presented
for a degree in this or any other universities, and all sources of materials used for the thesis have
been fully acknowledged.
Minyahil Tanashu ______________
Name Signature
Date of Submission: __________________
This thesis has been submitted for examination with my approval as a university advisor.
Dr.-Ing. Belachew Bantyirga ________________
Thesis advisor Signature

Design and Control of AC/DC Microgrid System for Rural Electrification in Ethiopia: Case Study on Kirakir
ii
Acknowledgement
First of all, I would like to acknowledge the Almighty God for given me the strength to complete
this thesis.
I am also thankful to Dr.-Ing. Belachew Bantyirga from Bahir Dar Institute of Technology,
Faculty of Electrical and Computer Engineering for his supervision, advice, understanding,
support and encouragement for the completion of this thesis. It has truly been a great
privilege to conduct this thesis under his supervision.
I wish to thank Mr. Ahunim Abebe, senior lecturer at the faculty of electrical and
computer engineering of Bahir Dar Institute of Technology and subject reader of my thesis,
for his valuable comments improving my work.
I would also like to express my sincere acknowledgement to peer science project working on
development of microgrid research center in Ethiopia at Bahir Dar Institute of Technology for
their advice and support during this thesis.
Minyahil Tanashu Toga
Design and Control of AC/DC Microgrid System for Rural Electrification in Ethiopia: Case Study on Kirakir
iii
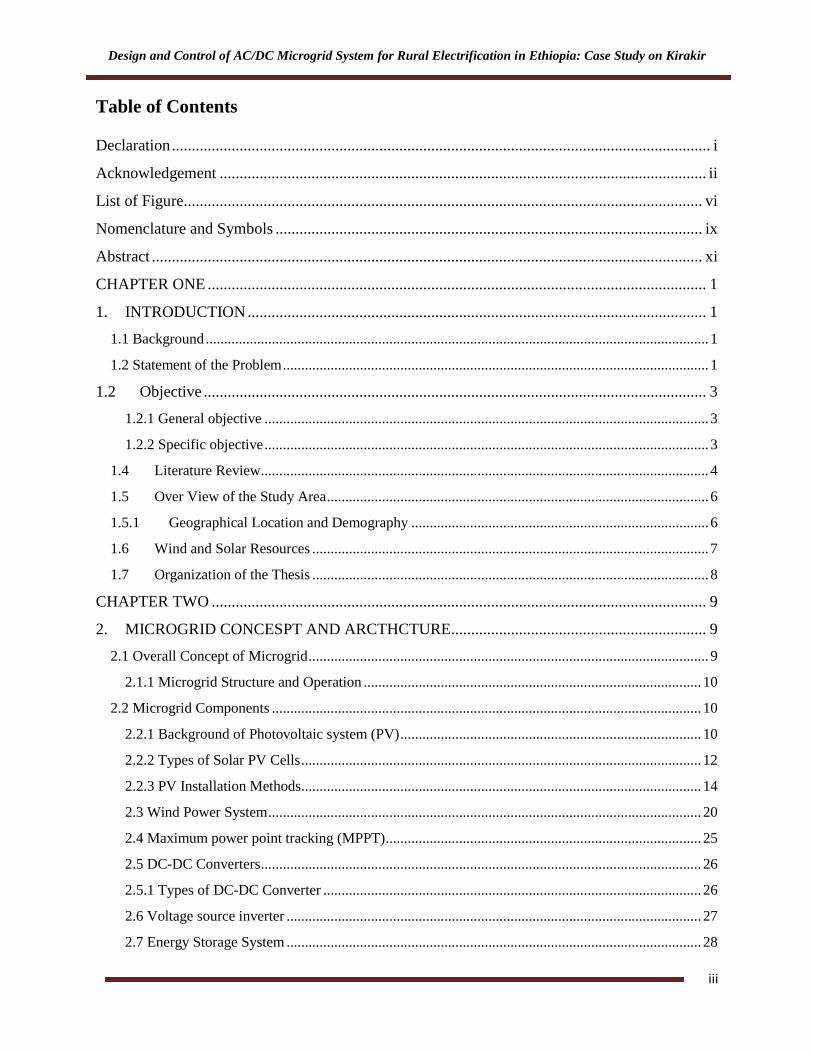
Table of Contents
Declaration ....................................................................................................................................... i
Acknowledgement .......................................................................................................................... ii
List of Figure.................................................................................................................................. vi
Nomenclature and Symbols ........................................................................................................... ix
Abstract .......................................................................................................................................... xi
CHAPTER ONE ............................................................................................................................. 1
1. INTRODUCTION ................................................................................................................... 1
1.1 Background ......................................................................................................................................... 1
1.2 Statement of the Problem .................................................................................................................... 1
1.2 Objective .............................................................................................................................. 3
1.2.1 General objective ......................................................................................................................... 3
1.2.2 Specific objective ......................................................................................................................... 3
1.4 Literature Review .......................................................................................................................... 4
1.5 Over View of the Study Area ........................................................................................................ 6
1.5.1 Geographical Location and Demography ................................................................................. 6
1.6 Wind and Solar Resources ............................................................................................................ 7
1.7 Organization of the Thesis ............................................................................................................ 8
CHAPTER TWO ............................................................................................................................ 9
2. MICROGRID CONCESPT AND ARCTHCTURE................................................................ 9
2.1 Overall Concept of Microgrid ............................................................................................................. 9
2.1.1 Microgrid Structure and Operation ............................................................................................ 10
2.2 Microgrid Components ..................................................................................................................... 10
2.2.1 Background of Photovoltaic system (PV) .................................................................................. 10
2.2.2 Types of Solar PV Cells ............................................................................................................. 12
2.2.3 PV Installation Methods............................................................................................................. 14
2.3 Wind Power System ...................................................................................................................... 20
2.4 Maximum power point tracking (MPPT) ...................................................................................... 25
2.5 DC-DC Converters ........................................................................................................................ 26
2.5.1 Types of DC-DC Converter ....................................................................................................... 26
2.6 Voltage source inverter ................................................................................................................. 27
2.7 Energy Storage System ................................................................................................................. 28
Design and Control of AC/DC Microgrid System for Rural Electrification in Ethiopia: Case Study on Kirakir
iv
2.7.2 Battery Types ............................................................................................................................. 30
2.7.3 Commenly used battery terminology ......................................................................................... 30
2.8 Bi-directional converter ................................................................................................................ 31
2.9 Proposed Microgrid System architecture .......................................................................................... 31
CHAPTER THREE ...................................................................................................................... 33
3. TECHNO-ECONOMIC FEASIBILITY STUDY OF THE MICROGRID SYSTEM ......... 33
3.1 Introduction ....................................................................................................................................... 33
3.2 Load Estimation ................................................................................................................................ 33
3.3 HOMER Model of the Hybrid System ............................................................................................. 37
3.3.1 Primary Load Input .................................................................................................................... 38
3.3.2 Deferrable Load Input ................................................................................................................ 39
3.3.3 Resource Inputs .......................................................................................................................... 39
3.3.4 Weibull Distribution .................................................................................................................. 39
CHAPETR FOUR ......................................................................................................................... 41
4. DESIGN, MODELING AND CONTROL OF MICROGRID SYSTEM ............................. 41
4.1 Overall system modeling .................................................................................................................. 41
4.2 Modeling of PV array ....................................................................................................................... 42
4.3 Boost converter model ...................................................................................................................... 47
4.4 MPPT algorism ................................................................................................................................. 49
4.5 Voltage source inverter modeling ..................................................................................................... 51
4.5.1 VSI converter controller............................................................................................................. 52
4.6 Battery modeling ............................................................................................................................... 52
4.6.1 Battery bidirectional converter modeling ................................................................................... 54
4.7 Modeling of Wind Turbine ............................................................................................................... 56
4.8 Control block configuration .............................................................................................................. 59
CHAPTER FIVE .......................................................................................................................... 61
5. RESULTS AND DISCUSSIONS ......................................................................................... 61
5.1 HOMER Simulation Results ............................................................................................................. 61
5.1.1 Cost Summary ............................................................................................................................ 62
5.1.2 Electric Power Production and Consumption ............................................................................ 63
5.2 MATLAB/Simulink simulation results of the microgrid power system ........................................... 64
CHAPTER SIX ............................................................................................................................. 68

Design and Control of AC/DC Microgrid System for Rural Electrification in Ethiopia: Case Study on Kirakir
v
6. CONCLUSIONS AND RECOMMENDATIONS ................................................................ 68
6.1 Conclusions ....................................................................................................................................... 68
6.2 Recommendation .............................................................................................................................. 69
6.3 Future Work ...................................................................................................................................... 69
References ..................................................................................................................................... 70
APPENDIX-1 ............................................................................................................................... 75
PV array block MATLAB initialization code ............................................................................... 75
APPENDIX-2 ............................................................................................................................... 77
P and O MPPT algorism MATLAB code ..................................................................................... 77

Design and Control of AC/DC Microgrid System for Rural Electrification in Ethiopia: Case Study on Kirakir
vi
List of Figure
Figure 1.1: Usage of kerosene and fuel wood in rural villages ................................................. 2
Figure 1.2: Proposed Case Study Area: Kirakir ….................................................................... 6
Figure 2.1: Photovoltaic System Module................................................................................. 11
Figure 2.2: Mono-Crystalline PV Cells .................................................................................. 12
Figure 2.3: Polycrystalline PV Cells ....................................................................................... 13
Figure 2.4: Thin Film PV Cells .............................................................................................. 13
Figure 2.5: Orientations and Slope of Solar PV Module ........................................................ 17
Figure 2.6: Typical Wind Tubine Power Curve....................................................................... 21
Figure 2.7: Major Turbine Component ................................................................................... 23
Figure 2.8: Three Phase Voltage Source Inverter ................................................................... 27
Figure 2.9: Simple Electrical Model of Battery ....................................................................... 29
Figure 2.10: Thevenin Electrical Model of a Battery ............................................................. 29
Figure 2.11: Proposed microgrid system description ............................................................. 32
Figure 3.1: HOMER model of the microgrid power system ................................................... 38
Figure 3.2: Daily Primary Load Profiles.................................................................................. 38
Figure 3.3: Monthly deferrable Load Profiles ......................................................................... 39
Figure 3.4: Monthly wind speed at 10m ................................................................................. 39
Figure 3.5: Wind speed probability density function at 10m .................................................. 40
Figure 3.6: Monthly average averge radiation ........................................................................ 40
Figure 4.1: General Simulink model of proposed system........................................................ 41
Figure 4.2: A PV cell equivalent electrical circuits ................................................................ 42
Figure 4.3: Schematic diagrams of module connection in a typical PV array ......................... 45
Figure 4.4: PV array Simulink model block ............................................................................ 46
Figure 4.5: Expanded view of PV module ............................................................................... 46
Figure 4.6: Expanded view of diod current model .................................................................. 46
Figure 4.7: Current Vs Voltage (I-V) curve of simulated PV array ........................................ 47
Figure 4.8: Power Vs Voltage (P-V) curve of simulation PV array ........................................ 47

Design and Control of AC/DC Microgrid System for Rural Electrification in Ethiopia: Case Study on Kirakir
vii
Figure 4.9: Typical boost converter ......................................................................................... 48
Figure 4.10: Simulink model of boost converter and MPPT ................................................... 49
Figure 4.11: P-V characteristc of photovoltic system .............................................................. 50
Figure 4.12: Flowchart of perturb and observe MPPT ............................................................ 50
Figure 4.13: P and O MPPT simulink block ........................................................................... 51
Figure 4.14: Matlab/simulink VSI block ................................................................................. 52
Figure 4.15: Simple equivalent circuit model of rechargeable lead acid battery ..................... 53
Figure 4.16: Mode of operation of converter ........................................................................... 54
Figure 4.17: Simulink model of battery and DC-DC convereter ............................................. 55
Figure 4.18: Expanded View of simulink model of battery and bidirectional DC-DC
converter .................................................................................................................................. 55
Figure 4.19: Battery converter controller................................................................................. 56
Figure 4.20: Simulink model of wind turbine .......................................................................... 58
Figure 4.21: Simulink model of wind power ........................................................................... 59
Figure 5.1: Some of the HOMER optimization results ............................................................ 61
Figure 5.2: The optimum microgrid power system cost share by each componentes ............ 62
Figure 5.3: Monthly average electric production of the microgrid power units ...................... 63
Figure 5.4: Irradiance,Maximum output voltage and PV array power .................................... 64
Figure 5.5: Wind power extracted .......................................................................................... 65
Figure 5.6: Battery voltage and state of charge ....................................................................... 65
Figure 5.7: DC bus voltage ..................................................................................................... 66
Figure 5.8: Inverter output and voltage and current for phase A ............................................. 67
Figure 5.9: Variable irradianc,PV output power and Voltage at maximum power point ........ 67
Design and Control of AC/DC Microgrid System for Rural Electrification in Ethiopia: Case Study on Kirakir
viii
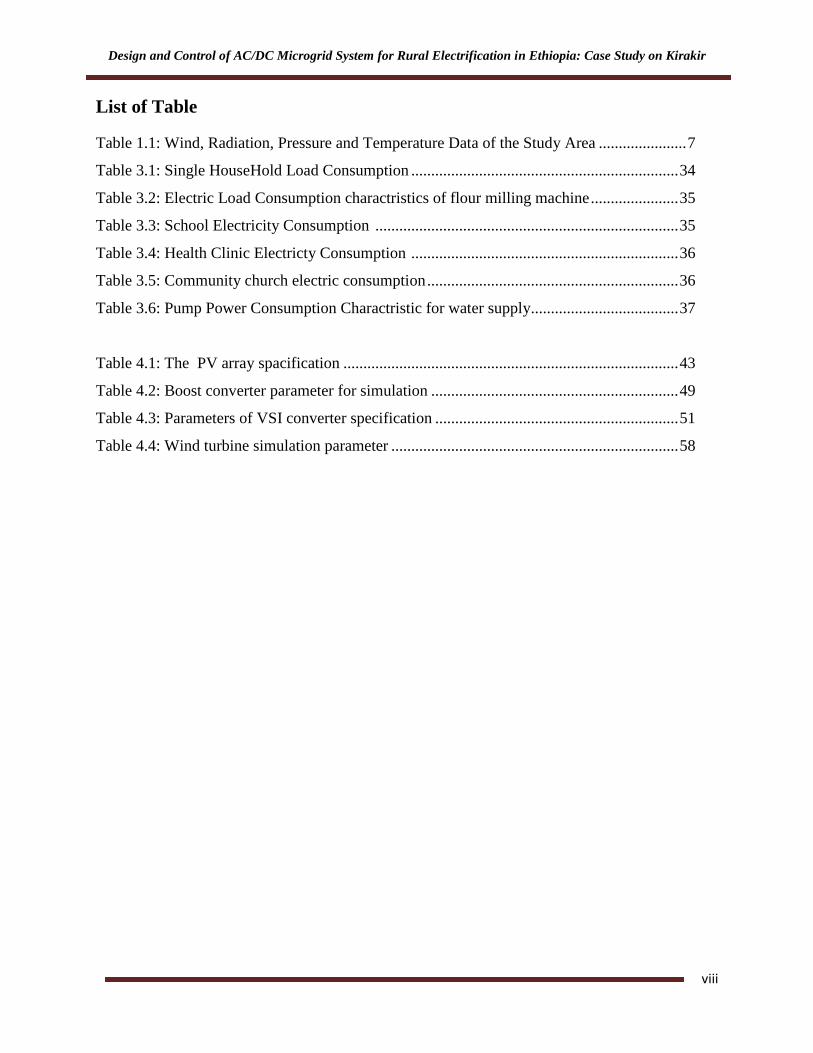
List of Table
Table 1.1: Wind, Radiation, Pressure and Temperature Data of the Study Area ...................... 7
Table 3.1: Single HouseHold Load Consumption ................................................................... 34
Table 3.2: Electric Load Consumption charactristics of flour milling machine ...................... 35
Table 3.3: School Electricity Consumption ............................................................................ 35
Table 3.4: Health Clinic Electricty Consumption ................................................................... 36
Table 3.5: Community church electric consumption ............................................................... 36
Table 3.6: Pump Power Consumption Charactristic for water supply..................................... 37
Table 4.1: The PV array spacification .................................................................................... 43
Table 4.2: Boost converter parameter for simulation .............................................................. 49
Table 4.3: Parameters of VSI converter specification ............................................................. 51
Table 4.4: Wind turbine simulation parameter ........................................................................ 58
Design and Control of AC/DC Microgrid System for Rural Electrification in Ethiopia: Case Study on Kirakir
ix
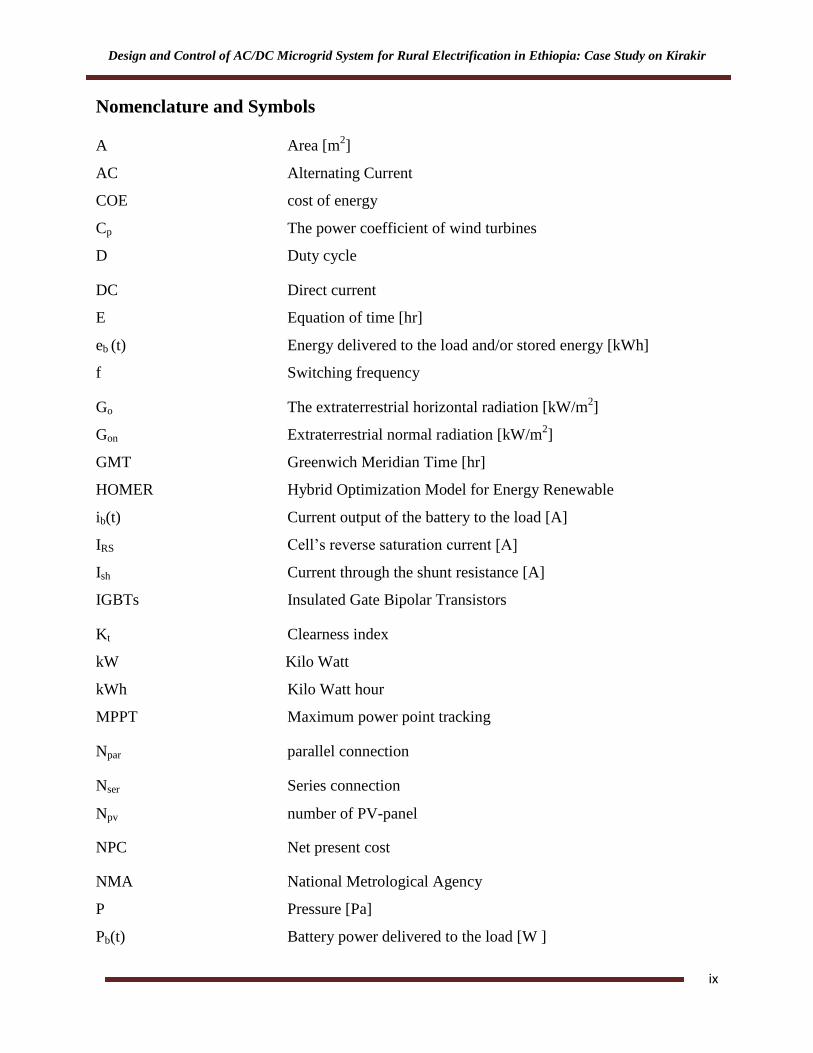
Nomenclature and Symbols
A Area [m2]
AC Alternating Current
COE cost of energy
Cp The power coefficient of wind turbines
D Duty cycle
DC Direct current
E Equation of time [hr]
eb (t) Energy delivered to the load and/or stored energy [kWh]
f Switching frequency
Go The extraterrestrial horizontal radiation [kW/m2]
Gon Extraterrestrial normal radiation [kW/m2]
GMT Greenwich Meridian Time [hr]
HOMER Hybrid Optimization Model for Energy Renewable
ib(t) Current output of the battery to the load [A]
IRS Cell‟s reverse saturation current [A]
Ish Current through the shunt resistance [A]
IGBTs Insulated Gate Bipolar Transistors
Kt Clearness index
kW Kilo Watt
kWh Kilo Watt hour
MPPT Maximum power point tracking
Npar parallel connection
Nser Series connection
Npv number of PV-panel
NPC Net present cost
NMA National Metrological Agency
P Pressure [Pa]
Pb(t) Battery power delivered to the load [W ]
Design and Control of AC/DC Microgrid System for Rural Electrification in Ethiopia: Case Study on Kirakir
x
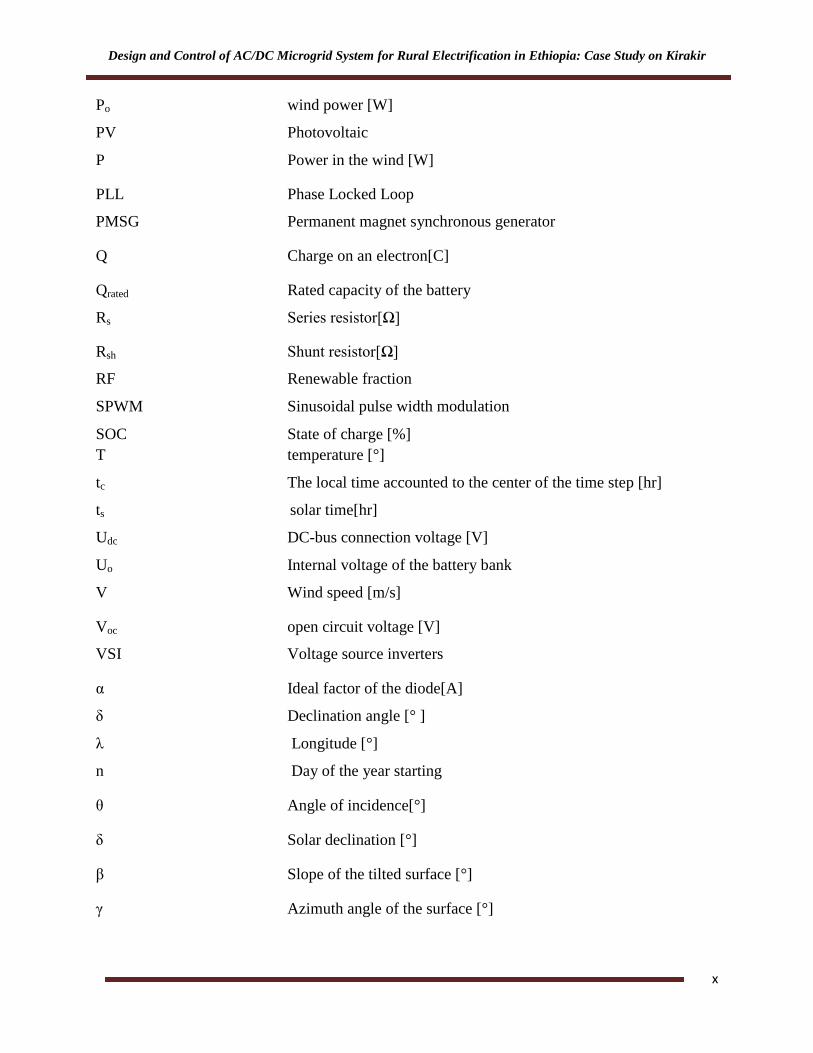
Po wind power [W]
PV Photovoltaic
P Power in the wind [W]
PLL Phase Locked Loop
PMSG Permanent magnet synchronous generator
Q Charge on an electron[C]
Qrated Rated capacity of the battery
Rs Series resistor[Ω]
Rsh Shunt resistor[Ω]
RF Renewable fraction
SPWM Sinusoidal pulse width modulation
SOC State of charge [%]
T temperature [°]
tc The local time accounted to the center of the time step [hr]
ts solar time[hr]
Udc DC-bus connection voltage [V]
Uo Internal voltage of the battery bank
V Wind speed [m/s]
Voc open circuit voltage [V]
VSI Voltage source inverters
α Ideal factor of the diode[A]
δ Declination angle [° ]
λ Longitude [°]
n Day of the year starting
θ Angle of incidence[°]
δ Solar declination [°]
β Slope of the tilted surface [°]
γ Azimuth angle of the surface [°]

Design and Control of AC/DC Microgrid System for Rural Electrification in Ethiopia: Case Study on Kirakir
xi
Abstract
Microgrid power systems have been possible solution to supply electricity to rural
communities living far in areas where grid extension is difficult. In this paper, the
designing, modeling process and control operation of microgrid power system is studied. It is
built based on a case study of electrification of a remote village of 450 house hold in kirakir
village in Amahra region, Ethiopia. The power demand is estimated and the costs of equipment
components are specified, microgrid design and modeling has been carried out using Hybrid
Optimization Model for Electric Renewable (HOMER) software. The microgrid consists of
photovoltaic, wind turbine, batteries, basic loads like lighting, water pumping, school and health
clinic equipment loads, television, radio and flour milling machines. The study site has been
identified with the following load data by specifying typical daily load profile: Primary energy
demand of 349kWh/day, Primary peak load of 105kW, deferrable energy is about
22kWh/day, and deferrable peak load of 3.6kW was carried with total peak load of 108.6kW.
In this thesis design, models and control for the microgrid power system components, winds, PV,
DC/DC converter, VSI (Voltage source inverter), battery storage and control strategy of
converter controller unit are developed. DC/DC boost converter duty cycle is controlled using P
and O MPPT (maximum power point tracking) algorithm and VSI (Voltage source inverter)
controlled to maintain stable voltage and frequency using PLL (phase lock loop) and voltage
regulator. In order to control the charge and discharge state of the battery a PI controller is used.
Then, a simulation model for the proposed microgrid power system has been developed using
MATLAB/Simulink environment. From HOMER simulation result the cost of energy is
$0.294/kWh and total net present cost is $508,775. The PV cost is $200,000, wind turbine cost is
$56,000, and battery cost is $140,000. About 84% of the electricity is produced from PV array
and 16% of the electricity production is produced from wind. The MATLAB/Simulink
simulation result indicates that the overall system is efficient and coordination controls of the
converters are effective, the modeled PV array and wind turbine meets the specifications
provided by the manufacturer. Therefore, the overall system is efficient and cost effective.
Key Words: Microgrid Power System; Modeling, control; Techno-Economic Analysis; Load estimation; Control strategy, rural communities.

Design and Control of AC/DC Microgrid System for Rural Electrification in Ethiopia: A Case Study on Kirakir
1
CHAPTER ONE
1. INTRODUCTION
1.1 Background
Energy requirement is becoming a prerequisite to enhance income, improved life quality for
individuals no matter where they are and even when exactly the time would. Africa is a
land of renewable energy source‟s opportunity. Africa‟s per capita energy consumption is only
one third of the global usage; however the continent covers 15% of the planets population with
5% of the glob primary energy consumption. Until 2009 around 587 million African
inhabitants were living without electricity access. Frequent electricity outage is common
trend, per capita electricity usage is low thus reliable, secured supply is demanding to
improve rapidly. Developing countries in the line of growing economies are in a much
demanding for electricity access to facilitate their industrial growth. Sustainable economic
growth of such countries mainly depends on the supply of electricity infrastructure, as
electricity is the heart and the driving engine of growing economy. It has been expected
that Ethiopia, Egypt, South Africa, Algeria and Nigeria will dominate the share of power sector
development in the continent.
Ethiopia‟s government has already started to apply the growth and transformation plan strategy
for the country to become a middle income nation until 2030. This target would be expected
to achieve by transforming into industrial development moreover to mechanized
agriculture. Thus sustainable and reliable supply of electricity is a requirement. The supply of
improved electricity services has benefits to create new job opportunities, to simplify rural
women life, to create good job atmosphere. The challenge, therefore, is the supply of sustainable
electricity service without long waits for grid extension and reliance on fossil based power
plants.
1.2 Statement of the problem
Even though Ethiopian has good renewable energy potential, still many rural villages and small
towns have no access to electricity neither from grid nor other source of energy due to the
Design and Control of AC/DC Microgrid System for Rural Electrification in Ethiopia: A Case Study on Kirakir
2
challenge in geographical location and economic constraints. Almost all people in the rural
villages use kerosene for lamp, flour mills, fire wood for cooking and dry cells for
radio. Certain fundamental services that should be provided to a particular community are
electricity, water supply, communication, transportation; health care and education are some
mandatory needs for any community to escalate out of poverty.
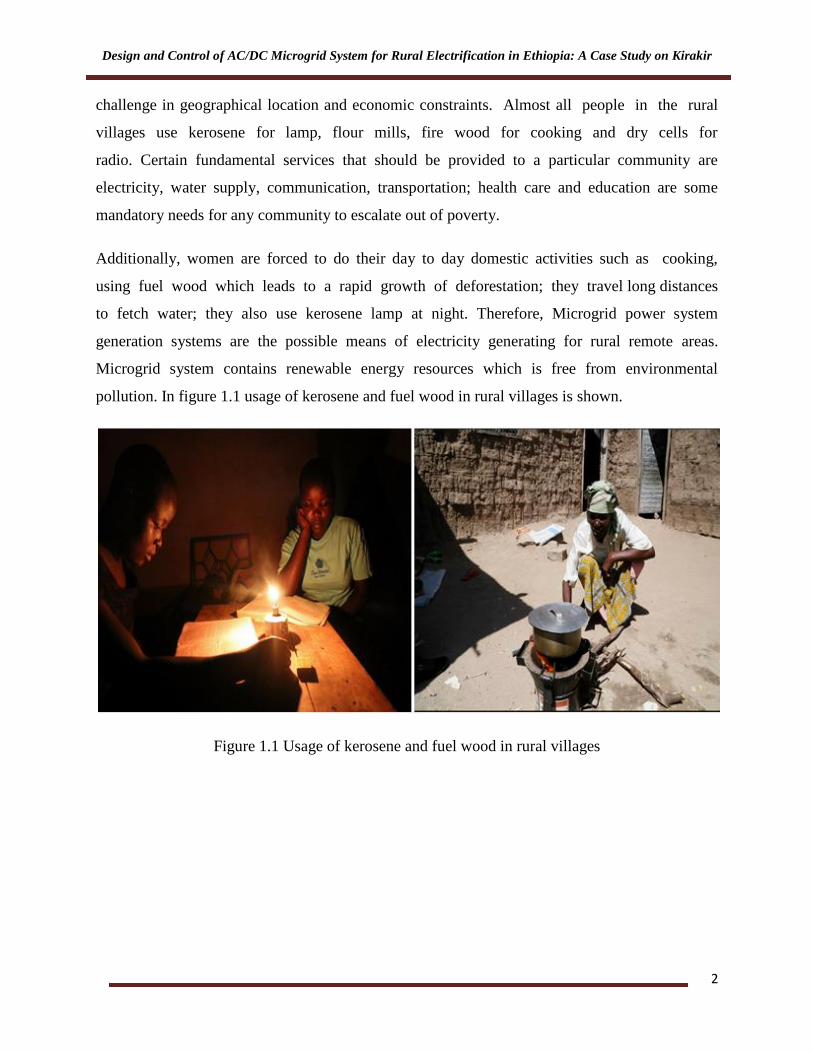
Additionally, women are forced to do their day to day domestic activities such as cooking,
using fuel wood which leads to a rapid growth of deforestation; they travel long distances
to fetch water; they also use kerosene lamp at night. Therefore, Microgrid power system
generation systems are the possible means of electricity generating for rural remote areas.
Microgrid system contains renewable energy resources which is free from environmental
pollution. In figure 1.1 usage of kerosene and fuel wood in rural villages is shown.
Figure 1.1 Usage of kerosene and fuel wood in rural villages

Design and Control of AC/DC Microgrid System for Rural Electrification in Ethiopia: A Case Study on Kirakir
3
1.2 Objective
1.2.1 General objective
Design and control of AC/DC microgrid electric power supply system consisting of PV-Wind
power where battery uses as a backup source for rural village electrification at kirakir.
1.2.2 Specific objective
Collecting first hand data from different sources
Load analysis of the site
Designing and modeling of the microgrid system
Study control strategies and techno-economic analysis of the microgrid system
Analyzing the system using HOMER software and MATLAB software.
1.3 Methodology
The methods applied in this thesis study are listed below:
Data collection: The data collected such as solar radiation, wind speed, altitude,
longitude, latitude, atmospheric pressure and air temperature of the study area were
obtained from NASA .
Load estimation: The primary and deferrable electric loads for the households, schools
and clinics of the community were estimated.
Techno-economic feasibility study: Techno-economic feasibility of the proposed
microgrid system is done using HOMER software
Design, modeling control of microgrid power system: MATLAB/Simulink has been
used.
Simulation result and conclusion.

Design and Control of AC/DC Microgrid System for Rural Electrification in Ethiopia: A Case Study on Kirakir
4
1.4 Literature Review
In this section works related to this thesis are discussed. Different authors were conducted for the
proposed system study at different times, sites and different countries.
In 2017, Kamal Tariq, et.al, presented “integration and control of an off-grid hybrid wind/PV
generation system for rural applications” for rural residential application [1]. Different DC/DC
converters are used to control power flow to the load and maximum power point tracking
(MPPT) is used to extract maximum power from PV/wind system using incremental conductance
method. In the proposed system architecture PV has the priority to meet the required load and the
proposed system uses five household at Malaysia campus. The control of power flow between
the load and the energy resource is regulated by the power control unit (PCU). The simulation
was carried out using MATLAB/Simulink.
In 2017, Gautam Praveen , Peri Venkata , Paliwal Priyanka , and C. Joseph Francis, presented
“ACMC-based hybrid AC/LVDC micro-grid” and published on journals of institute of
engineering and technology (IET) [2]. The paper discuses about the detail modeling novel
automatic centralized micro-grid controller with coordination control. The microgrid is designed
to work with renewable energy resource and the microgrid system is interconnected using
bidirectional converter. Based on the load requirement and voltage control of low voltage DC the
ACMC controls the active and reactive power. The system has been simulated using Simulink
and different converter configuration and modeling was discussed.
In 2017, Ahmad Shameem et a, presented “Modeling of grid connected battery wave energy and
PV hybrid renewable power generation” and published on IEEE journals [3]. The paper presents
about PV-Ocean hybrid system with battery as energy storage device. In order to build a PV
array, total five PV modules are designed using MATLAB/Simulink and ocean wave conversion
system was designed based on wave chamber converter which fed to wind turbine that coupled
using permanent magnet synchronous generator. A three phase voltage source inverter (VSI) is
designed to integrate the proposed system and used to at load side to control load side voltage
and amplitude in terms of the amplitude and frequency. To maintain constant voltage at DC bus
link capacitor storage device battery is used and a proportional integrator (PI) controller is used
Design and Control of AC/DC Microgrid System for Rural Electrification in Ethiopia: A Case Study on Kirakir
5
to control the charge and discharge of the battery to maintain DC link voltage constant.
MATLAB/Simulink has been used to simulate the system.
In 2017, Shatu Ghose, Adel El Shahat and Rami J.Haddad, presented “Wind-solar hybrid power
system cost analysis using HOMER for Statesboro, Georgia” and published in IEEE [4]. The
paper analyzes the wind-solar system for the proposed cased study area using Optimization
Model for Electric Renewable (HOMER) software and accessibility of resource has been
checked. Cost analysis based on solar irradiance, wind speed and load profile.
In 2016, Al-Falah Monaaf D.A, Sabah Nimma Kutaiba, S. D. G. Jayasinghe, and Enshae
Hossein, presented “Sizing and modeling of standalone hybrid energy” and published in IEEE
[5]. The paper present about the optimal sizing, modeling, performance analysis of standalone
PV-Wind and battery microgrid system for residential application in Ansons Bay, Tasmania,
Australia. Voltage source inverter (VSI) is used to connect DC bus to AC bus. The optimal
sizing algorism was implemented by using HOMER software and the modeling of microgrid
system was done using MATLAB/Simulink software.
In 2014, Hailamariam Abera, Mulu Bayray and Z.M Kimambo, presented “The feasibility of
developing of solar-wind and diesel hybrid power systems for supplying electricity to off-grid
rural community” a case study on Tigray region of northern Ethiopia [6]. In the paper studying
of load profile, solar and wind resource assessment was done using HOMER software. By
studying different scenarios, feasible system has been selected.
In 2016, Pooja G.Bandsod and Dr.S.P Adhau, presented “Dynamic modeling and control of
hybrid generation system for grid connected application” and published in journals of IEEE [7].
In this paper modeling and control strategy for an integrated renewable energy has been
discussed. The PV system is connected to DC bus through DC/DC converter for regulated DC
output voltage; a maximum power point tracking (MPPT) has been implemented in order to
maintain a reliable power output. The wind energy system is modeled using variable wind
turbine and permanent magnet synchronous generator (PMSG) and DC/DC converter. A PI
controller has been used for Maximum power point tracking and the simulation of the system
implemented using MATLAB/Simulink.

Design and Control of AC/DC Microgrid System for Rural Electrification in Ethiopia: A Case Study on Kirakir
6
In 2016, Nazih Moubayed, Nizar Kfoury, presented “Power control and energy management of
Lebanese Smart-grid” and published in IEEE [8]. In the paper, an energy management algorism
of a micro-grid used in the Lebanese case is presented. The proposed microgrid is supplying
residential load and composed of renewable (solar and wind) and non-renewable energy
resource. Maximum power point algorisms known as perturb and observe algorism for PV and
fuzzy logic controller is used. The modeling and simulation has been carried out using
MATLAB/Simulink.
Although the paper described in the above was used HOMER and MATLAB/Simulink as design,
modeling and control software and there microgrid system setup were studied using different
load demand, location of study as well as climatic data. Some of studies were implemented in
areas that have no electricity and other implemented in areas have access to electricity. However
this thesis differs from related study in terms of application, load demand (applied for lighting,
baking and communication, water supply, school and health service), climatic data and location
of the case study area and microgrid architecture. In this thesis both HOMER and
MATLAB/Simulink software has been used.
1.5 Over View of the Study Area
1.5.1 Geographical Location and Demography
Figure 1.2 Proposed case study area: kirakir [9]
Design and Control of AC/DC Microgrid System for Rural Electrification in Ethiopia: A Case Study on Kirakir
7
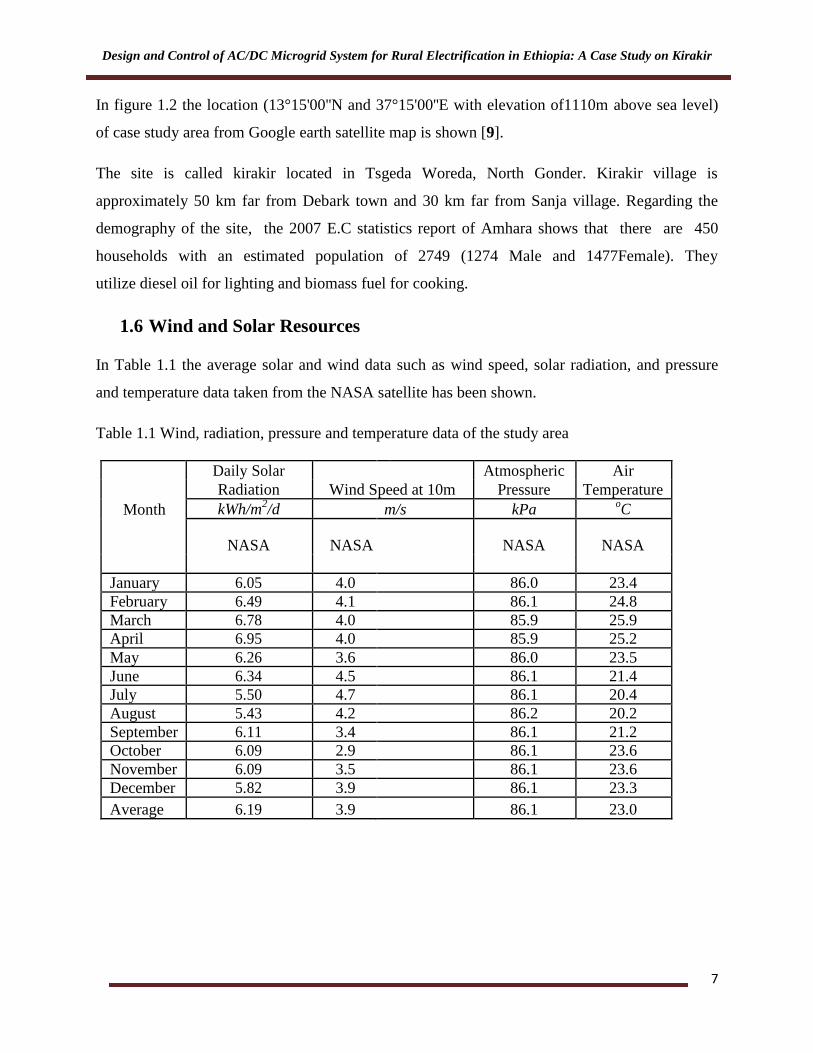
In figure 1.2 the location (13°15'00''N and 37°15'00''E with elevation of1110m above sea level)
of case study area from Google earth satellite map is shown [9].
The site is called kirakir located in Tsgeda Woreda, North Gonder. Kirakir village is
approximately 50 km far from Debark town and 30 km far from Sanja village. Regarding the
demography of the site, the 2007 E.C statistics report of Amhara shows that there are 450
households with an estimated population of 2749 (1274 Male and 1477Female). They
utilize diesel oil for lighting and biomass fuel for cooking.
1.6 Wind and Solar Resources
In Table 1.1 the average solar and wind data such as wind speed, solar radiation, and pressure
and temperature data taken from the NASA satellite has been shown.
Table 1.1 Wind, radiation, pressure and temperature data of the study area
Daily Solar Atmospheric Air
Radiation Wind Speed at 10m Pressure Temperature
Month kWh/m2/d m/s kPa
oC
NASA NASA NASA NASA
January 6.05 4.0 86.0 23.4
February 6.49 4.1 86.1 24.8
March 6.78 4.0 85.9 25.9
April 6.95 4.0 85.9 25.2
May 6.26 3.6 86.0 23.5
June 6.34 4.5 86.1 21.4
July 5.50 4.7 86.1 20.4
August 5.43 4.2 86.2 20.2
September 6.11 3.4 86.1 21.2
October 6.09 2.9 86.1 23.6
November 6.09 3.5 86.1 23.6
December 5.82 3.9 86.1 23.3
Average 6.19 3.9 86.1 23.0
Design and Control of AC/DC Microgrid System for Rural Electrification in Ethiopia: A Case Study on Kirakir
8
1.7 Organization of the Thesis
The thesis organized in chapter one covers about statement of the problem, objective of the
study, review of related works, organization of the thesis and overview of the studies. Chapter
two covers the basic theoretical concepts of microgrid system, microgrid system components,
solar power system, wind power system and energy storage system, Microgrid Structure and
Operation, proposed microgrid system description. Chapter three presents the techno-economic
optimization of the microgrid power system for a remote village in Ethiopia, kirakir. The
electrical power needs of the village are determined. The microgrid consists of photovoltaic,
wind turbine, batteries, a deferrable load and the primary loads. The techno-economical
optimization is performed with the help of the HOMER software. Chapter four presents the
microgrid is modeled in the Simulink environment of MATLAB. Each component is presented
along with the model of the control for the operational strategy of the system. Chapter five deals
with the results obtained from techno-economic analysis and modeling of the microgrid system.
In chapter six some conclusions are drawn in relation to the system, its design and model
and some aspects of it requiring further improvement of future work are indicated.
Design and Control of AC/DC Microgrid System for Rural Electrification in Ethiopia: A Case Study on Kirakir
9
CHAPTER TWO
2. MICROGRID CONCESPT AND ARCTHCTURE
2.1 Overall Concept of Microgrid
Microgrid is an integrated renewable energy system capable of balancing supply and demand
resources to maintain stable service within a defined boundary. A microgrid is a hybrid system
composed by many different types of electrical energy sources such as renewable energy
sources (photovoltaic, wind turbines, small hydro, biogas) but also generators using
conventional fossil fuels (in a smaller scale), different kinds of energy storage (batteries, fuel
cells, flywheels, water pumping) and loads of different types.
Local energy assets, resources and technologies are used and combined inside the
microgrid in order to satisfy the end users‟ requirements, which can vary from basic
electrification to more advanced or complicated services.
Some of the reasons for the increasing interest towards microgrid originate from the use
of renewable energy sources and the decentralized, distributed character of the system.
The environmental concerns (atmospheric, ground and water pollution, climate change)
due to use of fossil fuels, the finite and limited amounts of conventional fuels, the
increasing cost of electrical energy, the need for energy safety and independency of the
countries strengthen the effort for adopting and developing the technology of renewable
energy sources. The decentralization of electrical power production brings the generation closer
to the consumption point, enhancing the reliability of the system, since if one fault occurs
somewhere and a part of the grid gets isolated, then the other parts will not be affected.
Moreover, it increases the efficiency of the overall system, since the transmission losses are
decreased [10].
In developing African country like Ethiopia, Kenya and Sudan, the coverage of the
transmission grid is severely geographically limited. The daily per capital electricity use is
1 to 2 kWh, when it is taken as the average over the whole country‟s population. The main
barrier for the improvement of the situation there is the high capital investment required for
an extension of the grid following the traditional centralized power system. The short

Design and Control of AC/DC Microgrid System for Rural Electrification in Ethiopia: A Case Study on Kirakir
10
purchasing power and the low levels of average consumption among the population set
the microgrid to be a considerable alternative solution. This happens because for small
scale microgrids there is no need for significantly subsidized large capital development
support, especially if it is integrated within the community economic development. In this
case, it can facilitate and contribute to better healthcare services, enabling the
electrification of rural health clinics, better education and higher trade capabilities [10].
2.1.1 Microgrid Structure and Operation
Microgrid can be divided in four categories:
I. The off-grid microgrid: they include islands, remote sites and other systems not
connected to the local main grid
II. The campus microgrid: they are fully interconnected with a local electricity network,
but at the same time, they can independently keep and provide some level of
service in isolation from the grid, like in the case of a utility outage. Some
examples of this category are university campuses, military bases.
III. The community microgrid: they are integrated into utility networks, support
multiple customers and services inside the community and secure a resilient power
supply for vital community assets.
IV. The Nano-grid: they consist of the smallest discrete network units with the capability of
independent function, as it can happen in a single building. In this paper off-grid
microgrid power system is presented.
2.2 Microgrid Components
2.2.1 Background of Photovoltaic system (PV)
Solar cells, also called photovoltaic (PV) cells, convert sunlight directly into electricity. PV gets
its name from the process of converting light (photons) to electricity (voltage), which is called
the PV effect [11].
The photoelectric effect was first noted by a French physicist, Edmund Bequerel, in 1839, who
found that certain materials would produce small amounts of electric current when exposed to
Design and Control of AC/DC Microgrid System for Rural Electrification in Ethiopia: A Case Study on Kirakir
11
light. In 1905, Albert Einstein described the nature of light and the photoelectric effect on which
photovoltaic technology is based, for which he later won a Nobel Prize in physics. The first
photovoltaic module was built by Bell Laboratories in 1954. It was billed as a solar battery and
was mostly just a curiosity as it was too expensive to gain widespread use. In the 1960s, the
space industry began to make the first serious use of the technology to provide power aboard
spacecraft. Through the space programs, the technology advanced, its reliability was established,
and the cost began to decline. During the energy crisis in the 1970s, photovoltaic technology
gained recognition as a source of power for non-space applications [12].
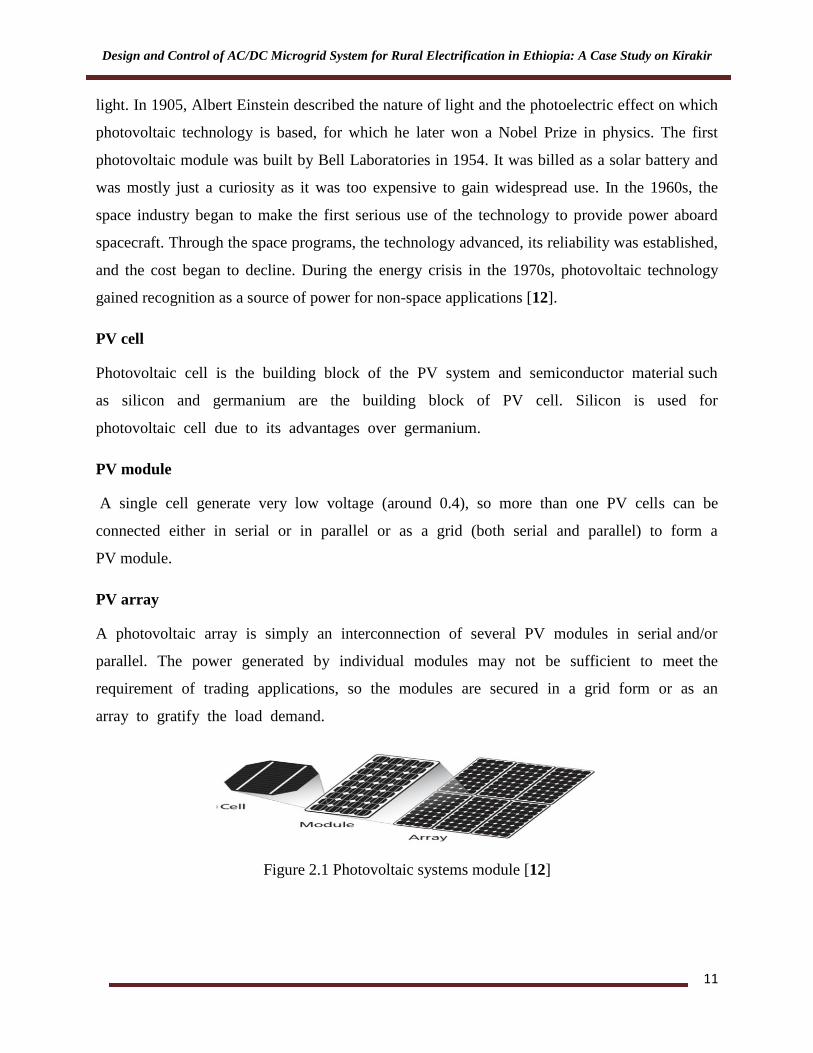
PV cell
Photovoltaic cell is the building block of the PV system and semiconductor material such
as silicon and germanium are the building block of PV cell. Silicon is used for
photovoltaic cell due to its advantages over germanium.
PV module
A single cell generate very low voltage (around 0.4), so more than one PV cells can be
connected either in serial or in parallel or as a grid (both serial and parallel) to form a
PV module.
PV array
A photovoltaic array is simply an interconnection of several PV modules in serial and/or
parallel. The power generated by individual modules may not be sufficient to meet the
requirement of trading applications, so the modules are secured in a grid form or as an
array to gratify the load demand.
Figure 2.1 Photovoltaic systems module [12]
Design and Control of AC/DC Microgrid System for Rural Electrification in Ethiopia: A Case Study on Kirakir
12
2.2.2 Types of Solar PV Cells
The first generation solar cells are produced on silicon wafers. It is the oldest and the most
popular technology due to high power efficiencies. The silicon wafer based technology is further
categorized into two subgroups named as [13].
Single/ Mono-crystalline silicon solar cell.
Poly/Multi-crystalline silicon solar cell.
Thin Film PV Cells.
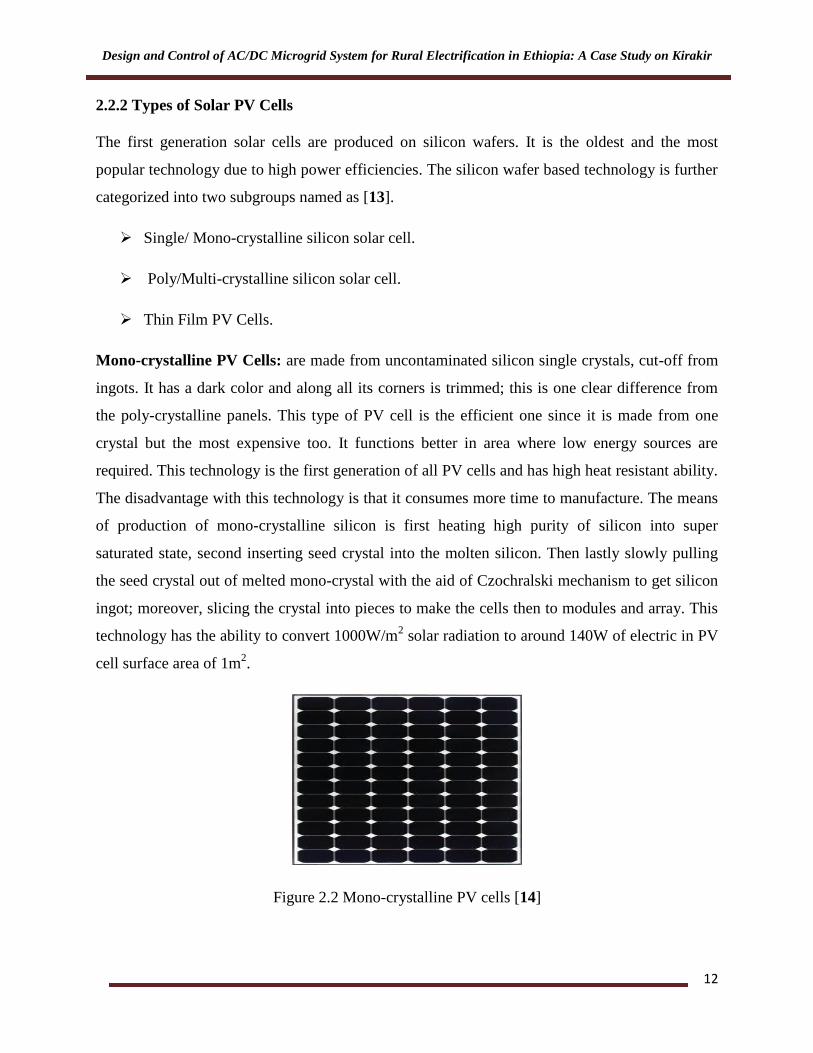
Mono-crystalline PV Cells: are made from uncontaminated silicon single crystals, cut-off from
ingots. It has a dark color and along all its corners is trimmed; this is one clear difference from
the poly-crystalline panels. This type of PV cell is the efficient one since it is made from one
crystal but the most expensive too. It functions better in area where low energy sources are
required. This technology is the first generation of all PV cells and has high heat resistant ability.
The disadvantage with this technology is that it consumes more time to manufacture. The means
of production of mono-crystalline silicon is first heating high purity of silicon into super
saturated state, second inserting seed crystal into the molten silicon. Then lastly slowly pulling
the seed crystal out of melted mono-crystal with the aid of Czochralski mechanism to get silicon
ingot; moreover, slicing the crystal into pieces to make the cells then to modules and array. This
technology has the ability to convert 1000W/m2 solar radiation to around 140W of electric in PV
cell surface area of 1m2.
Figure 2.2 Mono-crystalline PV cells [14]

Design and Control of AC/DC Microgrid System for Rural Electrification in Ethiopia: A Case Study on Kirakir
13
Polycrystalline PV Cells: It is made from combination of smaller quantities of silicon crystal
block. They are considered as the most widely used cells nowadays. Such PV cells are inefficient
than the single crystalline cells due to the reason that they are not grown from a single crystals
but from a combination of many crystal. They perform better than the mono-crystalline in
slightly shaded conditions. This technology has the ability to convert 1000W/m2 solar radiation
to around 130W of electricity in PV cell surface area of 1m2. The production of this type of cells
is more efficient than mono-crystalline. Molten silicon has to be placed into blocks, which are
then cut into slabs to make the crystals. Size of poly-crystalline solar panel is larger than mono-
crystalline panel to get the same wattage because mono-crystalline is more efficient per area than
multi- crystalline. So when comparing the two PV panels in terms of size to get high power
output, single crystalline is good in usefulness.
Figure 2.3 Polycrystalline PV Cells [14]
Thin Film PV Cells: This type of cells are not med from real crystal rather the silicon is
deposited on stainless steel, plastic or glass to form the solar module. These types of PV cells are
much less efficient than the above tow but the production process cost less. The inefficiency
shows that large panels of this type require producing same power as mono or polycrystalline
panels. They have efficiency from 5% to 13% and their lifespan is about 15-20 years.
Figure 2.4 Thin Film PV cells [14]

Design and Control of AC/DC Microgrid System for Rural Electrification in Ethiopia: A Case Study on Kirakir
14
2.2.3 PV Installation Methods
Solar energy depends on the tracking system that mounts PV system; basically the tracking
system is basically applied to the panel to the direction of sun light. Below are the techniques to
be considered during the design of the PV system [15].
No tracking: Photovoltaic Panels are mounted at a fixed slope and azimuth; moreover it is the
simplest and cheapest method. Preferable to orient the panel to the equator (south in the northern
hemisphere) usually the angle of tilt is equal to the latitude of the specific site under study. A
small increase and decrease from the latitude will be better for the winter and summer sun
tracking respectively.
Horizontal axis monthly adjustment: This type of tracking system, it rotates
horizontally from east to west direction. The angle of inclination of the PV is adjusted on the
beginning of every month so that the beam strikes at 90 to the PV panel when sun is overhead.
Horizontal axis weekly adjustment: This type of mounting system, its axis of rotation is
from east to west direction. The PV angle of tracking (slope) is adjusted on the first day of the
week, thus solar radiation is at 90 to PV at noon of the corresponding day. The PV module
slanted towards parallel the ground.
Horizontal axis daily adjustment: Axis of rotation is about a horizontal east-west direction to
track the solar radiation. The slope is adjusted each day so that the sun's rays are at 90
degree to PV at noon of the corresponding day.
Horizontal axis continuous adjustment: It is a type of PV mounting system in which slope of
photovoltaic is adjusted continuously and rotation is about a horizontal east-west axis. The slope
is adjusted continually in order to minimize the angle on incidence.
Vertical axis continuous adjustment: PV axis of rotation is about a vertical with respect to the
ground surface. The slope is fixed, but the azimuth is continually adjusted to minimize the angle
of incidence. Two axes: The panels are rotated about both to east-west and from north-
south having two pivots to rotate. However, it is the most expensive method.
Design and Control of AC/DC Microgrid System for Rural Electrification in Ethiopia: A Case Study on Kirakir
15
Commonly used Solar Terminologies
Taking an account for the PV systems and sunshine, it is necessary to take a note of the
following important concepts [16] [17] [15].
Irradiance: It is the power density of the sun, measured in W/m2. At night and on sunrise times,
irradiance is often zero and increases respectively then reaches at its highest value around noon.
It again decreases from noon to sunset and dropping to zero at night.
Irradiation: it is the time integral of power density of the sun (irradiance), measured in kWh/m2
Air mass: A parameter that influences the quantity of irradiance that is incident on the earth‟s
atmosphere.
Solar constant: The amount of solar radiation incident on the earth‟s atmosphere at a vertical
angle of air mass and its magnitude is about 1367 W/m2.
Global solar radiation: The total summation of the sunbeam and diffuse radiations. In case of
horizontal laid surfaces, global solar radiation is the summation of vertical radiation and diffuse
radiation. This is part of the constant solar radiation that hits the ground.
Beam radiation: It is the sunbeam that reaches the earth right from the sun disk.
Diffuse radiation: It is the solar radiation that reaches the ground from the sky where its
direction is changed by the atmosphere. The diffuse radiations magnitude depends on solar
height, and atmospheric transparency. The higher the cloud in the sky is the higher the dispersed
radiation.
Extraterrestrial normal radiation: Is the quantity of solar radiation that arrives on a surface
perpendicular to the atmosphere.
Extraterrestrial horizontal radiation: is the quantity of solar radiation reaching on a flat
surface positioned on top of the atmosphere. If the entire direct solar radiation source is
converted into usable form of energy in the earth, it would be more than enough to supply the
energy requirement of the world.
Design and Control of AC/DC Microgrid System for Rural Electrification in Ethiopia: A Case Study on Kirakir
16
Incident Radiation
The position of the sun, the slope and the orientation of the photovoltaic surface are the most
important parameters for any solar system design. Photovoltaic power output affects by the
amount of radiation reaching the surface area of the collector; however the irradiance that is
incident is flat or horizontal. Thus the incident solar radiation in a tilted surface is inclined
component of the radiation, which should be calculated from the global horizontal
radiation. Figure 2.6 illustrates the orientation of photovoltaic system towards the sun. The
angles involved in determining the amount of incident solar radiation on the surface of PV panel
are described below [15].
Zenith angle (θz): Is the angle between the line drawn vertically and the line that connects to the
sun from the vertical line. Usually this angle is 90º at sunrise and sunset times.
Solar altitude angle (αs): It is an angle included between the line that directs to the sun
and the line drawn perpendicular to this line. Its value remained at 0º during sunrise and
sunset times.
Solar azimuth angle (γs): It is an angle that draws from south direction to the line that indicates
to the sun. Its value varies from 0º when sun is overhead, -90º at sunrise and 90º at sunset.
Angle of incidence (θ): It is the angle sandwiched between the line that draws normal to PV
surface and the line that points to the sun. It is the critical angle in determining the incident
radiation accordingly the photovoltaic power output.
Hour angle (ω): is defined as the angular displacement of the sun, which is east or west, of the
civil meridian time zone. The earth rotates 15º/ hour; furthermore this shows that at 11am and
1pm, hour angle is -15º and 15º respectively.
Surface azimuth angle (γ) is an angle that measures from south to the line that draws
perpendicular to the PV panel surface.
Collector slope (β) is the angle of inclination of a surface between the PV and the
horizontal plane. A zero degree and ninety degree slopes indicate the horizontal and vertical

Design and Control of AC/DC Microgrid System for Rural Electrification in Ethiopia: A Case Study on Kirakir
17
orientations of the PV array respectively. A slope roughly equal to the latitude will typically
maximize the annual PV energy production.
Declination (δ) is the angle formed between the line of light ray from the sun directed from
equator and the line that directs straight to plane. It varies by plus or minus 23.45 degrees
during the year.
Latitude (φ) is the angle measured from the line that draws to the center of the earth and the line
directs to the equator.
Figure 2.5 Orientations and Slope of Solar PV Module [54]
The employment of PV array may describe with inclination or slope and azimuth of the PV
surface. The latitude, the time and day of the year are also parameters that relates to the
sun geometry. The time of year relates to the solar declination angle. Solar declination is the
latitude at which the solar beams are at 90° to the earth‟s surface at solar noon. All of the
following equations below are presented by.
365
284360sin45.23
noo 2.1
Where:
δ: Declination angle [° ], n: day of the year, 1st January as 1 through 365
The suns location in the sky and hour angle which is used to describe the diurnal time are
related in order to determine the hour angle. At solar noon hour angle is set as zero, while in the
morning and in the afternoon it is set as negative and positive respectively. The following
equation can be used to calculate the hour angle.
Design and Control of AC/DC Microgrid System for Rural Electrification in Ethiopia: A Case Study on Kirakir
18
hr
hrto
s
15*12 2.2
Where:
ω: Hour angle
ts: Solar time
At solar noon the value of is 12:00 hour and in 11/2
hour later its value is 13.5 hour. The 150
depicts the fact that the sun moves around the earth at 150 per hour. Solar radiation data and
electric load data are measured with civil times or local standard times and this shows that the
two parameters are local time dependent data's. Solar time can be calculated from civil time
using the following equation.
Ez
hr
tt cocs
15
2.3
Where:
ts: Solar time [hr]
tc: The local time accounted to the center (middle) of the time step [hr]
E: Equation of time in hour
λ:Longitude [°]
zc: Time region (zone) to east of Greenwich Meridian Time (GMT) [hr]
The equation of time corresponds for the effects of the tilt of the earth's axis of rotation (23.45°)
relative to the eccentricity of the earth's orbit and the plane of the ecliptic. The equation of time
can be calculated as follows.
04089.02cos014615.0sin032077.0cos00186.0000075.082.3 E 2.4
Where:
n: day of the year starting with January 1st as 1 through 365
Another parameter for a surface of any orientation is the angle of incidence, and it is defined as
the angle between the sun's beam radiation and the line perpendicular to the PV surface, which
is expressed mathematically using the following equation.

Design and Control of AC/DC Microgrid System for Rural Electrification in Ethiopia: A Case Study on Kirakir
19
sinsinsincoscossinsincos
coscoscoscoscossincossincossinsincos 2.5
Where:
θ: Angle incidence [°]
δ: Solar declination[°]
Ø: Latitude [°]
β: Slope of the tilted surface [°]
γ: Azimuth angle of the surface [°]
ω: Hour angle [°]
The zenith angle has value of zero degree when the sun is at solar noon and 90° when it is at
horizon. The zenith angle can be expressed mathematically as shown in equation below:
sinsincoscoscoscos z 2.6
Where:
θz: The zenith angle [°]
Extraterrestrial normal radiation is the quantity of radiation reaching at the top of the earth's
atmosphere at 90°and would be expressed mathematically as in equation 2.7.
365
360cos033.01
nGG scon 2.7
Where:
Gon: The extraterrestrial normal radiation
Gsc: The solar constant
The extraterrestrial horizontal radiation can be expressed mathematically by the following
equation.
zono GG cos 2.8
Where:
Go: The extraterrestrial horizontal radiation [kW/m2]

Design and Control of AC/DC Microgrid System for Rural Electrification in Ethiopia: A Case Study on Kirakir
20
The average extraterrestrial horizontal solar radiation can be calculated as follows.
]sinsin180
sincos[cos*12 21
21
oonGG 2.9
2
1
G
GK t
2.10
Where:
G = Extraterrestrial horizontal radiation averaged over time intervals
Gon: Extraterrestrial normal radiation [kW/m2]
ω1: Hour angle at time t1 [°]
ω2: The hour angle at time t2 [°]
Kt: Clearness index
G1: Global horizontal radiation reached the earth's surface averaged over time interval
G2: Extraterrestrial horizontal radiation averaged over time intervals [kW/m2]
2.3 Wind Power System
The wind is a free, clean, and inexhaustible type of renewable energy. Winds originate from the
uneven heating in the atmosphere from the sun, the irregularities from the earth‟s surface, and
rotation of the earth. Wind flow patterns are modified through the land terrain, environmental
conditions and buildings. This wind flow, or motion energy, when harvested by modern wind
turbines, enable to generate electricity [18].
2.3.1Wind Turbine
Characteristic parameters for wind machine are [18]:
Rated power of the machine is the maximum power developed by the rotor and is also
the generator rating.
Cut-in speed, uc is the minimum wind speed at which the machine starts rotating.
Rated speed, uR is the minimum wind speed at which the machine develops rated
power. This is the speed at which the blade regulation becomes active.
Furling speed, uF is the maximum wind speed at which the machine develops power.

Design and Control of AC/DC Microgrid System for Rural Electrification in Ethiopia: A Case Study on Kirakir
21
Figure 2.6 Typical wind turbine power curve [19]
The energy that a wind turbine will produce depends on both its power curve and the wind speed
frequency distribution at the site. Wind speed frequency distribution is a graph showing the
number of hours for which the wind blows at different wind speeds during a given period of
time. Energy produced at any wind speed can be obtained by multiplying the number of hours of
its duration by the corresponding turbine power at this wind speed obtained by the turbine's
power curve. The total energy produced is calculated by summing the energy produced at all the
wind speeds within the operating range of the turbine. The best way to determine the wind speed
distribution at a site is to carry out wind speed measurements including record of duration for
which the wind speed lies within each wind speed band. Availability of the turbine is one of the
factors that affect the total energy generation. Availability is an indication of the reliability of the
turbine installation and is the fraction of a given period of time for which a wind turbine is
available to generate, when the wind is blowing within the turbine's operating range. Typical
values of annual availabilities exceed 90% [19].
The actual power extracted by the rotor blades is the difference between the upstream and
downstream wind powers.

Design and Control of AC/DC Microgrid System for Rural Electrification in Ethiopia: A Case Study on Kirakir
22
2 21* *
2 2
oo o
V VP A V V
2.11
2
3
1 11
* *2 2
o o
o
V V
V VP V
2.12
31* *
2o pP V C
2.13
2
11
C where
2
00
p
V
V
V
V
blades.rotor theofexit at the velocity winddownstreamV
bladesrotor theof entrance at the velocity windupstream V
poweroutput turbineThe P :Where
0
0
Cp is the fraction of the upstream wind power that is captured by the rotor blades. The theoretical
maximum value of Cp is 0.59 and this is called the Betz limit, in practical design; the maximum
achievable value is below 0.5 for high speed, two blade turbine, and between 0.2 and 0.4 for
slow speed turbines with more blades.
Wind turbine components
The principle of wind turbines in power generation is transformation of the air kinetic energy
into rotating mechanical power of the turbine rotor blades.
Generally a wind turbine consists of a set of rotor blades rotating around a hub, a
gearbox generator set placed inside the nacelle.
Design and Control of AC/DC Microgrid System for Rural Electrification in Ethiopia: A Case Study on Kirakir
23
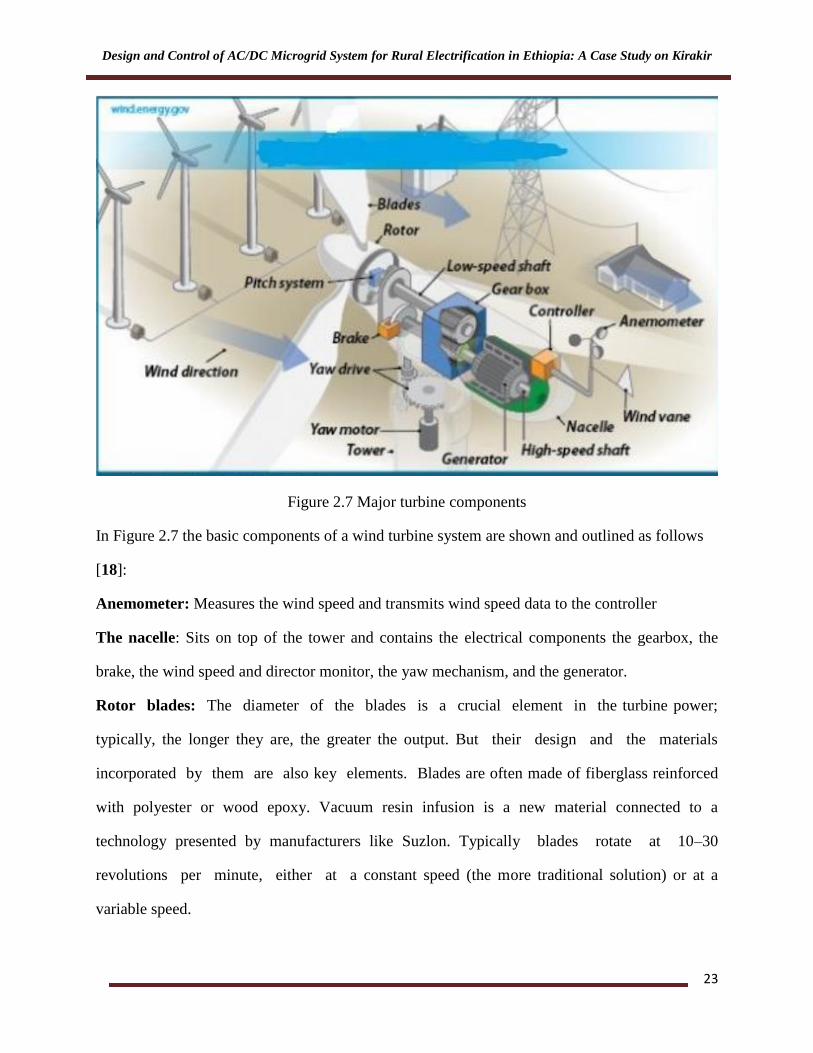
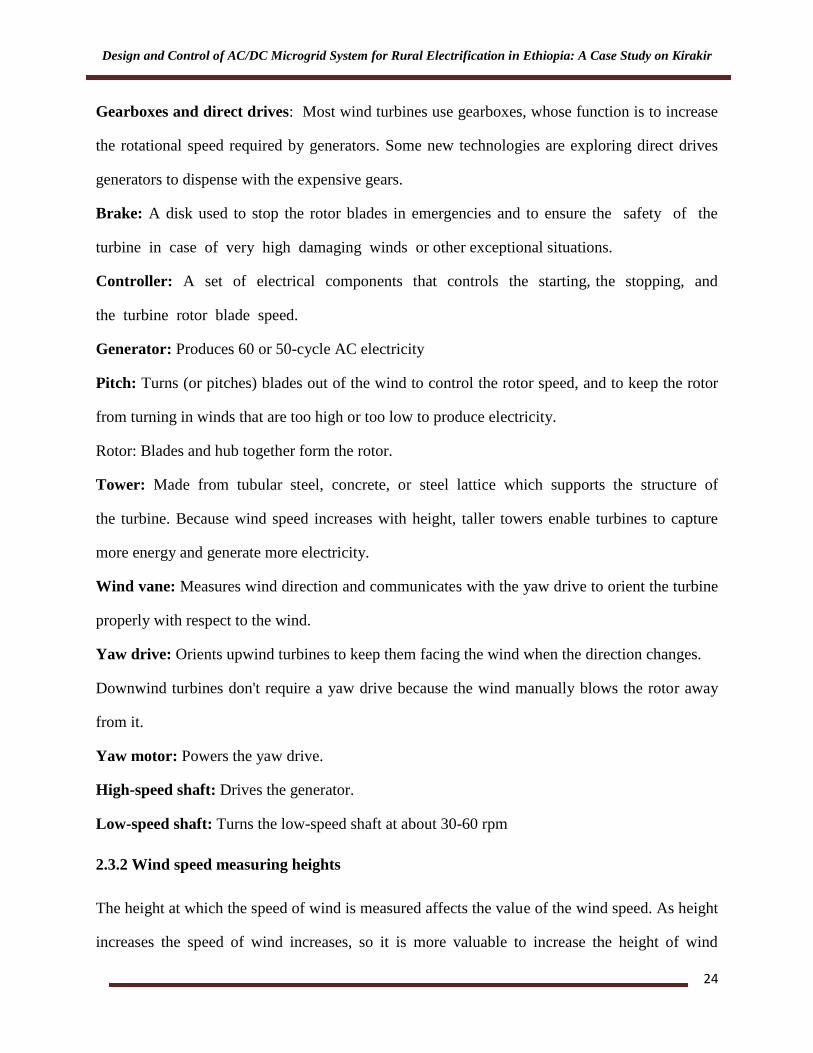
Figure 2.7 Major turbine components
In Figure 2.7 the basic components of a wind turbine system are shown and outlined as follows
[18]:
Anemometer: Measures the wind speed and transmits wind speed data to the controller
The nacelle: Sits on top of the tower and contains the electrical components the gearbox, the
brake, the wind speed and director monitor, the yaw mechanism, and the generator.
Rotor blades: The diameter of the blades is a crucial element in the turbine power;
typically, the longer they are, the greater the output. But their design and the materials
incorporated by them are also key elements. Blades are often made of fiberglass reinforced
with polyester or wood epoxy. Vacuum resin infusion is a new material connected to a
technology presented by manufacturers like Suzlon. Typically blades rotate at 10–30
revolutions per minute, either at a constant speed (the more traditional solution) or at a
variable speed.
Design and Control of AC/DC Microgrid System for Rural Electrification in Ethiopia: A Case Study on Kirakir
24
Gearboxes and direct drives: Most wind turbines use gearboxes, whose function is to increase
the rotational speed required by generators. Some new technologies are exploring direct drives
generators to dispense with the expensive gears.
Brake: A disk used to stop the rotor blades in emergencies and to ensure the safety of the
turbine in case of very high damaging winds or other exceptional situations.
Controller: A set of electrical components that controls the starting, the stopping, and
the turbine rotor blade speed.
Generator: Produces 60 or 50-cycle AC electricity
Pitch: Turns (or pitches) blades out of the wind to control the rotor speed, and to keep the rotor
from turning in winds that are too high or too low to produce electricity.
Rotor: Blades and hub together form the rotor.
Tower: Made from tubular steel, concrete, or steel lattice which supports the structure of
the turbine. Because wind speed increases with height, taller towers enable turbines to capture
more energy and generate more electricity.
Wind vane: Measures wind direction and communicates with the yaw drive to orient the turbine
properly with respect to the wind.
Yaw drive: Orients upwind turbines to keep them facing the wind when the direction changes.
Downwind turbines don't require a yaw drive because the wind manually blows the rotor away
from it.
Yaw motor: Powers the yaw drive.
High-speed shaft: Drives the generator.
Low-speed shaft: Turns the low-speed shaft at about 30-60 rpm
2.3.2 Wind speed measuring heights
The height at which the speed of wind is measured affects the value of the wind speed. As height
increases the speed of wind increases, so it is more valuable to increase the height of wind

Design and Control of AC/DC Microgrid System for Rural Electrification in Ethiopia: A Case Study on Kirakir
25
turbine in respect of power that can be captured, but as height increases the initial capital cost of
the tower increases also the maintenance and operation costs increases, so it is a compromise
issue. So when calculating the output of wind generator, the measured data of average hourly
wind speed must be converted to the corresponding values at the hub height. The most
commonly used formula is power law, expressed as:
2.11 1
2
12
Z
ZVV
tcoefficienfriction surface ground
and ,height Zat estimated speed wind V
,height Z reference at the measured speed wind V
Where
22
11
V1 = 3.9m/s, Z1= 10m then taking at Z2 = 40m, α = 0.3, V2 will become 6 m/s.
2.4 Maximum power point tracking (MPPT)
Maximum power point tracking (MPPT) system is an electronic control system that can
be able to coerce the maximum power from a PV system. It does not involve a single
mechanical component that results in the movement of the modules changing their
direction and make them face straight towards the sun. MPPT control system is a
completely electronic system which can deliver maximum allowable power by varying the
operating point of the modules electrically [10].
In the power versus voltage characteristic of a PV module we can observe that there exist
single maxima i.e. a maximum power point associated with a specific voltage and current
that are supplied. The overall efficiency of a module is very low around 12%. So it is
necessary to operate it at the nearest power point so that the maximum power can be
provided to the load irrespective of continuously changing environmental conditions. This
increased power makes it better for the use of the solar PV module. A DC/DC converter
which is placed next to the PV module extracts maximum power by matching the
impedance of the circuit to the impedance of the PV module and transfers it to the load.
Impedance matching can be done by varying the duty cycle of the switching elements.

Design and Control of AC/DC Microgrid System for Rural Electrification in Ethiopia: A Case Study on Kirakir
26
2.4.1 Types of MPPT algorithm
There are many algorithms which help in tracking the maximum power point of the PV
module. Some of maximum power point algorithms are as follows:
A. Perturb and Observe algorithm
B. Incremental conductance algorithm
C. Parasitic capacitance
D. Voltage based peak power tracking
E. Current Based peak power tracking
2.5 DC-DC Converters
DC/DC converters are used in a wide variety of applications including power supplies,
where the output voltage should be regulated at a constant value from a fluctuating power
source, to reduce the ripples in the output voltage or achieve multiple voltage levels from the
same input voltage. Several topologies exist to either increase or decrease the input voltage
or perform both functions together using a single circuit.
2.5.1 Types of DC-DC Converter
DC-DC converter is an electrical circuit whose main application is to transform a dc
voltage from one level to another level. It is similar to a transformer in AC source, it
can able to step the voltage level up or down. The variable dc voltage level can be
regulated by controlling the duty ratio (on-off time of a switch) of the converter. There
are various types of dc-dc converters that can be used to transform the level of the
voltage as per the supply availability and load requirement. Some of them are discussed
below.
1. Buck converter: Used to step down DC voltage level
2. Boost converter: Used to step up DC voltage level
3. Buck-Boost converter: Used to step down/sep up DC voltage level

Design and Control of AC/DC Microgrid System for Rural Electrification in Ethiopia: A Case Study on Kirakir
27
2.6 Voltage source inverter
Voltage source inverters (VSI) are mainly used to convert a constant DC voltage into
three phase AC voltages with variable magnitude and frequency. Figure 2-6 shows a schematic
diagram of a 3 phase VSI. The inverter is composed of six switches S1 through Switch each
phase output connected to the middle of each “inverter leg”. Two switches in each phase are
used to construct one leg. The AC output voltage from the inverter is obtained by controlling
the semiconductor switches ON and OFF to generate the desired output. Pulse width modulation
(PWM) techniques are widely used to perform this task. In the simplest form, three reference
signals are compared to a high frequency carrier waveform. The result of that comparison
in each leg is used to turn the switches ON or OFF. This technique is referred to as
sinusoidal pulse width modulation (SPWM). It should be noted that the switches in each leg
should be operated interchangeably, in order not to cause a short circuit of the DC supply.
Insulated Gate Bipolar Transistors (IGBTs) and power MOSFET devices can be used to
implement the switches. Each device varies in its power ratings and switching speed. IGBTs are
well suited for applications that require medium power and switching frequency [20] [21].
Figure 2.8 Three phase voltage source inverter (VSI) [20]
Characteristics of Six-step VSI [21]:
It is called “six-step inverter” because of the presence of six “steps” in the line to neutral
(phase) voltage waveform
Harmonics of order three and multiples of three are absent from both the line to line and
the line to neutral voltages and consequently absent from the currents
Design and Control of AC/DC Microgrid System for Rural Electrification in Ethiopia: A Case Study on Kirakir
28
Output amplitude in a three-phase inverter can be controlled by only change of DC-link
voltage (Vdc)
2.7 Energy Storage System
There are various types of energy storage systems including battery, compressed air,
flywheel, super-capacitor, fuel cell, pumped hydro etc. Each of them has their own
advantages and disadvantages.
Pumped hydro is the oldest form of energy storage. It consists of two reservoirs located
in different height, a pump, a turbine, a motor and a generator. The water is released from the
higher one through a turbine to collect energy. A Flywheel is a method of storing
mechanical kinetic energy. It uses a high accelerated flywheel to store energy and the flywheel is
decelerated to discharge energy. Compressed air uses air pressure to store energy. The access
energy can be stored as compressed air and can be released to generator when the load demand is
high.
The proposed energy storage system (ESS) consists of a lead acid battery and a bidirectional DC-
DC converter connected at the DC-link of the mmicrogrid system. The role of this
converter is to maintain the DC-link voltage constant despite the power changes in the
sources and the load. In this papre the DC-link voltage is controlled in the ESS through a PI
control strategy [22].
2.7.1 Battery
Battery is a storage device which stores the excess power generated and uses it to supply
the load in addition to the generators when power is required. Both PV and wind
energy systems (described in the previous chapters) are integrated i.e. Connected to a
common DC bus of constant voltage and the battery bank is also connected to the DC
bus. Any power transfer whether from generator to battery bank or generator to load or
from the battery bank to the load takes place via this constant voltage DC bus. As the

Design and Control of AC/DC Microgrid System for Rural Electrification in Ethiopia: A Case Study on Kirakir
29
power flow associated with the battery is not unidirectional, a bidirectional converter is
needed to charge and/or discharge the battery [23] [24].
A simple battery model contains two parts, a controlled voltage source or open circuit voltage
Voc and a variable series resistor Rs as shown in fig. 2.9.
Figure 2.9 Simple Electrical Model of a Battery
bat oc bat sV V I R 4.20
Where:
Voc is open circuit voltage
Rs is series resistor(internal resistance of the battery,due to electrochemical property of
the battery)
This simple model doesn„t consider the dynamic response of a battery. A more accurate
Thevenin model connects a parallel RC network in series based on the simple model,
describing the dynamic characteristics of the battery. As shown in Figure 2.10, it is mainly
composed of three parts including open-circuit voltage Voc, internal resistances and equivalent
capacitance [25] [26].
Figure 2.10 Thevenin Electrical Model of a Battery

Design and Control of AC/DC Microgrid System for Rural Electrification in Ethiopia: A Case Study on Kirakir
30
The internal resistances include the ohmic resistance Rs and the polarization resistance Rth.
The equivalent capacitance Cth is used to describe the transient response during charging
and discharging. Vth is the voltages across Cth. Ith is the outflow current of Cth.
2.7.2 Battery Types
There are mainly two types of battery: primary and secondary battery. Primary batteries
which are also known as disposable batteries often have higher energy density and lower self-
discharge than the secondary batteries. The major disadvantage of this type of battery is that they
are not reusable mainly due to the irreversible chemical reactions in these batteries.On the
other hand, the chemical reaction in secondary batteries or rechargeable batteries is
reversible. These make them suitable for energy storage system. There are many different
rechargeable battery technologies available. But only four among them are leading the
world market. These are: Nickel- Cadmium (Ni-Cd), Nickel-metal hydride (Ni-MH), Lead-
Acid and lithium-ion (Li-ion) batteries [27] [28] [29] [30].
2.7.3 Commenly used battery terminology
Commenly used battery terminologies are listed below [17] [27]:
Battery Capacity: This is a measure of how much energy the battery can store. The three main
ratings to specify the capacity of a battery are:
Ampere-hour (Ah): the current at which a battery can discharge at a constant rate over a
fixed interval of time.
Reserve capacity: the length of time (in minutes) that a battery can produce a
specified level of discharge.
kWh capacity: a measure of energy required to fully charge a depleted battery. A
depleted battery is not usually a fully discharged battery.
Design and Control of AC/DC Microgrid System for Rural Electrification in Ethiopia: A Case Study on Kirakir
31
Battery Voltage: The battery voltage is that of a fully charged battery. It depends up on the
number of cells and voltage per cell.
Energy Density/Specific Energy: Energy density is a measure of how much energy can be
extracted from a battery per unit of battery weight or volume.
Power Density/Specific Power: Power density is a measure of how much power can be
extracted from a battery per unit of battery weight or volume.
Autonomy: This variable is defined by the ratio of restorable energy capacity to
maximum power discharge. It refers to the maximum amount of time the system can
continuously release energy.
Durability (Cycling Capacity): The number of times the energy storage can release the energy
level it was designed for after each recharge is referred to as durability or cycling capacity. It is
expressed in number of cycles, Ncycles
Self-Discharge: This refers to the portion of energy which was initially stored and
dissipated in a given non-use period of time.
2.8 Bi-directional converter
Bidirectional converter has many applications and here in the work, the converter is used
for charging and discharging the battery based on the surplus and deficit of the power
respectively. When there is a surplus of energy, i.e. the supply is greater than demand then
the battery is charged, allowing the converter to operate in forward direction. When there
is a deficit in power i.e. the supply is less than demand then the battery starts discharging
supplying the deficit of power to the load [31] [32] [33] [34] [35].
2.9 Proposed Microgrid System architecture
Figure 2.1 shows the microgrid system consists of PV array, DC/DC converter, AC/DC rectifier,
bidirectional converter, Variable load, wind power, battery and control algorism for converters,
renewable energy generating units are connected to DC bus then supply AC load through voltage
source inverter. The AC power from wind turbine should be converted to DC through AC/DC

Design and Control of AC/DC Microgrid System for Rural Electrification in Ethiopia: A Case Study on Kirakir
32
converter before connected to DC bus. The power from the renewable energy can be provided to
consumers. Voltage source inverter is used to supply the load.
Figure 2.11 Proposed microgrid system descriptions
The entire microgrid system comprises of PV and the wind systems. The PV system is
powered by the solar energy which is abundantly available in nature. For PV system
maximum power point tracking method is used, which extracts the maximum possible power
from the PV modules using perturbed and observe algorism. The DC-AC inverter is used to
invert ac voltage to dc. Wind turbine, generator and an AC/DC converter are included in
the wind energy system. The wind turbine is used to convert wind energy to rotational
mechanical energy and this mechanical energy available at the turbine shaft is converted
to electrical energy using a generator. Both the energy systems are used to charge a
battery using bi-directional converter, PI controller is used for bi-directional converter control.
The output of the PV array is connected through DC/DC boost converter and MPPT control
algorism is applied to the boost converter so that the duty cycle of the boost converter is
adjusted. The load voltage and frequency is controlled using voltage source inverter controller.
Design and Control of AC/DC Microgrid System for Rural Electrification in Ethiopia: A Case Study on Kirakir
33
CHAPTER THREE
3. TECHNO-ECONOMIC FEASIBILITY STUDY OF THE
MICROGRID SYSTEM
3.1 Introduction
The Hybrid Optimization of Multiple Energy Resources (HOMER) software is a tool to
design, model and optimize stand-alone and grid connected power systems. It is widely
used for techno-economic analysis of microgrids, as it can simulate a range of different
conventional as well as renewable energy technologies and assess the technical and economic
feasibility of them. The inputs to the HOMER model are climate data, electrical load,
technical and economic parameters of the equipment used for generation and storage,
sensitivity variables, dispatch strategy, and some more constraints. Then the model performs a
simulation of the operation of the system making the energy balance calculations for each one of
the 8760 hours of the year, resulting in the optimal system size and control strategy based
on the lowest net present cost (NPC).
In this chapter, the techno-economic optimization process is described focused on the
electrification of a kirakir village in Ethiopia. The optimum configuration of the microgrid power
system in terms of different generation capacities is assessed through the HOMER
software.
3.2 Load Estimation
In designing a microgrid power system for a specific area of community the establishment of
information's like the load profile of the community, climatic data of the area, initial cost of the
components, project lifetime are the important parameters.
Electric load in the rural villages of Ethiopia can be assumed to be composed of lighting, radio
and television, water pumps, health post and primary schools load, work barbers, shops and

Design and Control of AC/DC Microgrid System for Rural Electrification in Ethiopia: A Case Study on Kirakir
34
church loads are considered [17] [15]. In this paper the load demand of the community is
categorized as follows: Household load which includes of (lighting, TV, Radio, and baking
appliances), Commercial load which includes flour milling machine, Community load which
consists of lighting, desktop computer, printer, vaccine refrigerator, communication radio,
television, microscope, Deferrable load which includes water supply.
Primary Load
Primary load is the load that should meet by the energy providing system as it requires
immediately; which includes lighting, baking, vaccine refrigeration, TV, radio, computer,
printer, fax, simple laboratory equipment and others. The electric consumption in each household
is considered to be the same and constant through the year. The load determination of the village
was performed for 450 household numbers with average of four family members per household.
The household electricity consumption is shown in table 3.1
Table 3.1 Household Electricity consumption
No
Appliances No.
In use
Unit
Power(W)
Total
power(W)
Hr./da
y
Watt-
hrs./day
Total
power(W)
Hrs./da
y
1 Lamps 3 11 33 6 198 14850 18:00 -
24:00
2 Cell phone 2 2.5 5 2 10 2250 8:00 -
10:00
3 Stereo
recorder
1 10 10 4 40 4500 8:00 -
12:00
4 TV 1 70 70 4 280 31500 4:00 -
8:00
5 DVD player 1 20 30 4 80 9000 18:00 -
12:00
Total 608
No. of household 450
Total 273600

Design and Control of AC/DC Microgrid System for Rural Electrification in Ethiopia: A Case Study on Kirakir
35
Commercial Load
Flour milling Machine is used to mill the grain or cereal which would be baked for local diet. In
Table 3.2: Electric Load Consumption Characteristics of Flour milling Machine is shown.
Table 3.2 Consumption Characteristics of Flour milling Machine
Appliances No. in
use
Unit
Power(W)
Total
power(W)
Hr./day Watt-
hrs./day
Total
power(W
)
Hrs./da
y
1 Flour
milling
2 6250 12500 6 75000 12500 9:00 -
15:00
No. of flour milling machine 1
Total 75000
School Load
During the day time no need of electricity for the class rooms. The largest load of the school will
be recorded on the evening times. During the weekend evening class will be conducted and
student can have tutorial classes. The daily electric consumptions of the school are shown below
in table 3.3.
Table 3.3 School Electricity Consumption
No
Appliances No.
In use
Unit
Power(W)
Total
power(W)
Hr./da
y
Watt-
hrs./day
Total
power(W)
Hrs./da
y
1 Lamps 14 11 154 12 1848 154 18:00 -
6:00
2 Cell phone 10 2.5 25 2 50 25 5:00 -
7:00
3 Stereo
recorder
3 10 10 3 90 30 4:00 -
7:00
4 TV 1 70 70 3 280 70 6:00 -
9:00
5 DVD player 1 20 20 3 60 20 18:00 -
11:00
6 Computer 1 115 115 8 920 115 8:00-
16:00
No. of school 1
Total 3248
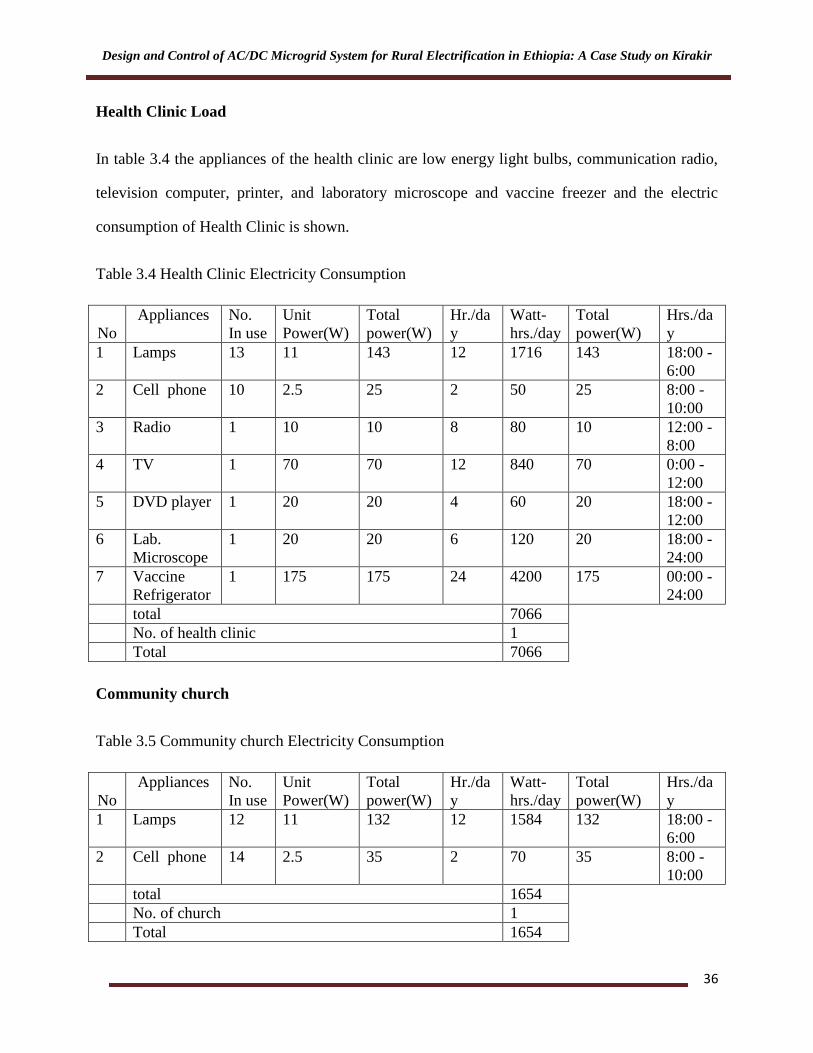
Design and Control of AC/DC Microgrid System for Rural Electrification in Ethiopia: A Case Study on Kirakir
36
Health Clinic Load
In table 3.4 the appliances of the health clinic are low energy light bulbs, communication radio,
television computer, printer, and laboratory microscope and vaccine freezer and the electric
consumption of Health Clinic is shown.
Table 3.4 Health Clinic Electricity Consumption
No
Appliances No.
In use
Unit
Power(W)
Total
power(W)
Hr./da
y
Watt-
hrs./day
Total
power(W)
Hrs./da
y
1 Lamps 13 11 143 12 1716 143 18:00 -
6:00
2 Cell phone 10 2.5 25 2 50 25 8:00 -
10:00
3 Radio 1 10 10 8 80 10 12:00 -
8:00
4 TV 1 70 70 12 840 70 0:00 -
12:00
5 DVD player 1 20 20 4 60 20 18:00 -
12:00
6 Lab.
Microscope
1 20 20 6 120 20 18:00 -
24:00
7 Vaccine
Refrigerator
1 175 175 24 4200 175 00:00 -
24:00
total 7066
No. of health clinic 1
Total 7066
Community church
Table 3.5 Community church Electricity Consumption
No
Appliances No.
In use
Unit
Power(W)
Total
power(W)
Hr./da
y
Watt-
hrs./day
Total
power(W)
Hrs./da
y
1 Lamps 12 11 132 12 1584 132 18:00 -
6:00
2 Cell phone 14 2.5 35 2 70 35 8:00 -
10:00
total 1654
No. of church 1
Total 1654
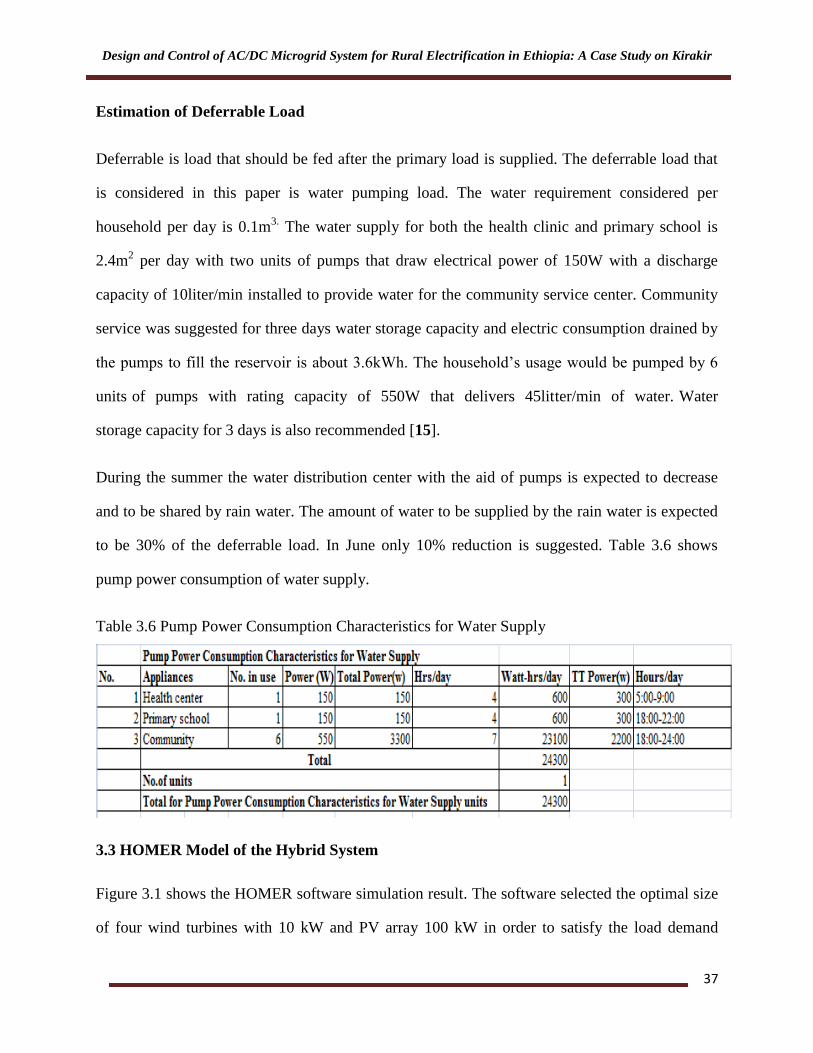
Design and Control of AC/DC Microgrid System for Rural Electrification in Ethiopia: A Case Study on Kirakir
37
Estimation of Deferrable Load
Deferrable is load that should be fed after the primary load is supplied. The deferrable load that
is considered in this paper is water pumping load. The water requirement considered per
household per day is 0.1m3. The water supply for both the health clinic and primary school is
2.4m2 per day with two units of pumps that draw electrical power of 150W with a discharge
capacity of 10liter/min installed to provide water for the community service center. Community
service was suggested for three days water storage capacity and electric consumption drained by
the pumps to fill the reservoir is about 3.6kWh. The household‟s usage would be pumped by 6
units of pumps with rating capacity of 550W that delivers 45litter/min of water. Water
storage capacity for 3 days is also recommended [15].
During the summer the water distribution center with the aid of pumps is expected to decrease
and to be shared by rain water. The amount of water to be supplied by the rain water is expected
to be 30% of the deferrable load. In June only 10% reduction is suggested. Table 3.6 shows
pump power consumption of water supply.
Table 3.6 Pump Power Consumption Characteristics for Water Supply
3.3 HOMER Model of the Hybrid System
Figure 3.1 shows the HOMER software simulation result. The software selected the optimal size
of four wind turbines with 10 kW and PV array 100 kW in order to satisfy the load demand
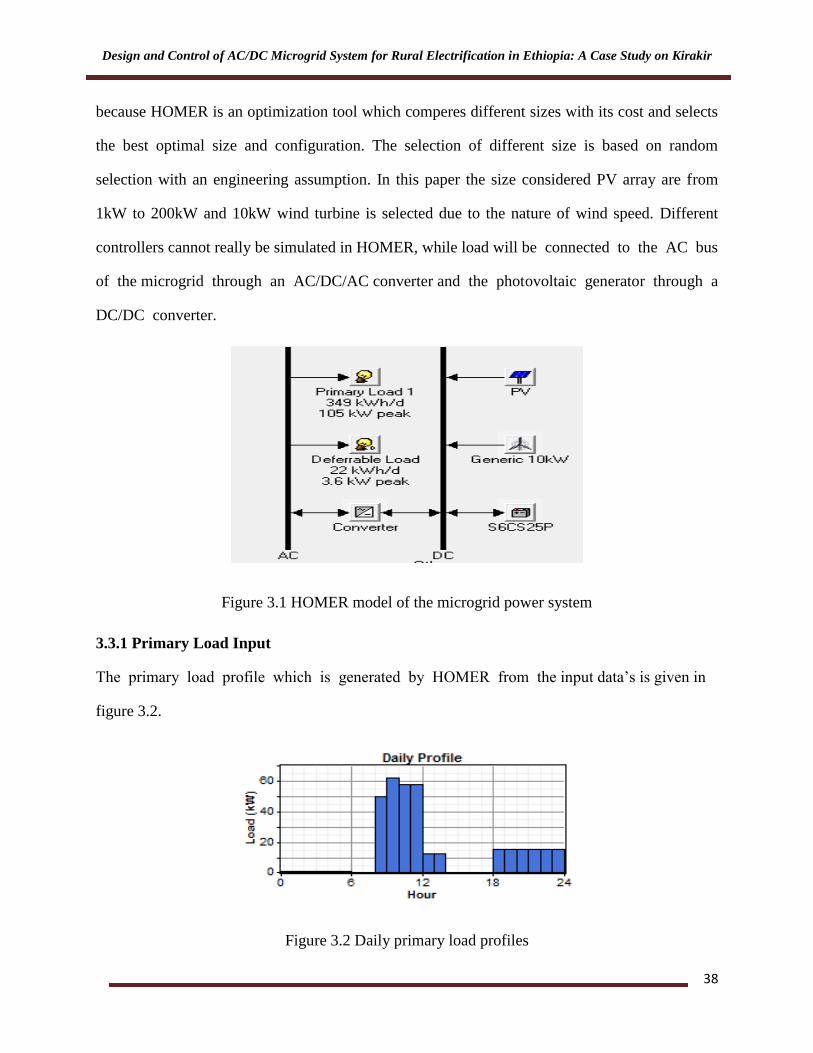
Design and Control of AC/DC Microgrid System for Rural Electrification in Ethiopia: A Case Study on Kirakir
38
because HOMER is an optimization tool which comperes different sizes with its cost and selects
the best optimal size and configuration. The selection of different size is based on random
selection with an engineering assumption. In this paper the size considered PV array are from
1kW to 200kW and 10kW wind turbine is selected due to the nature of wind speed. Different
controllers cannot really be simulated in HOMER, while load will be connected to the AC bus
of the microgrid through an AC/DC/AC converter and the photovoltaic generator through a
DC/DC converter.
Figure 3.1 HOMER model of the microgrid power system
3.3.1 Primary Load Input
The primary load profile which is generated by HOMER from the input data‟s is given in
figure 3.2.
Figure 3.2 Daily primary load profiles
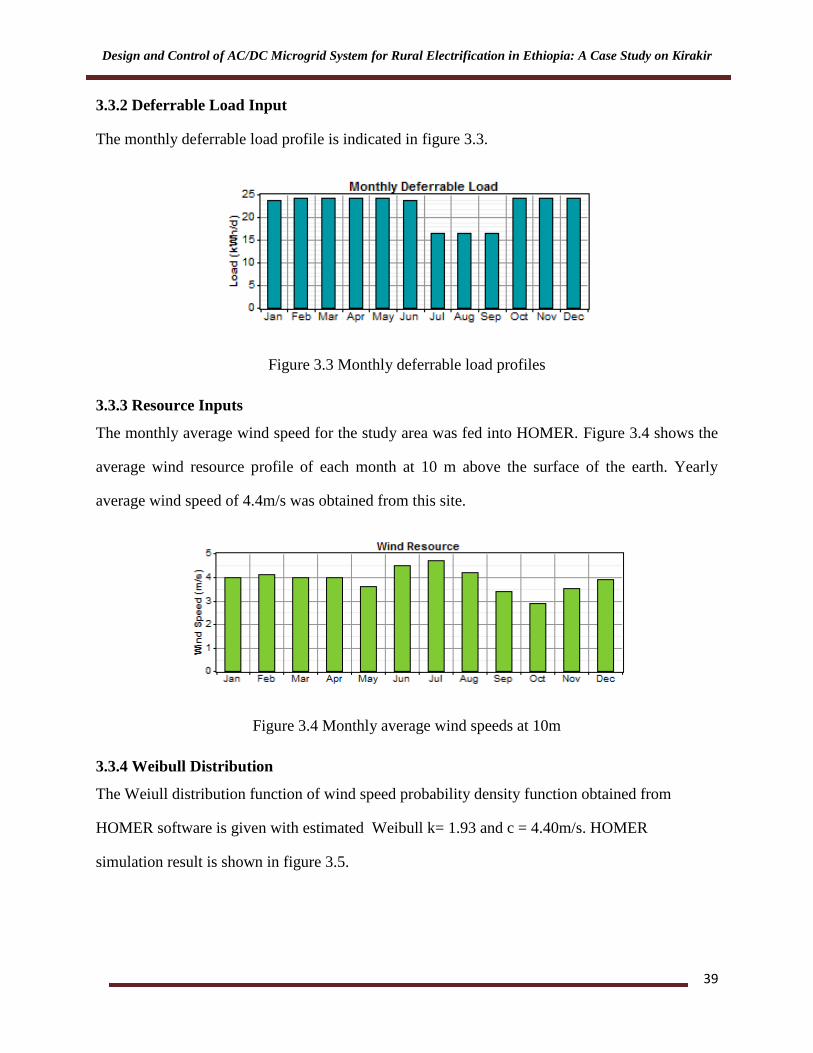
Design and Control of AC/DC Microgrid System for Rural Electrification in Ethiopia: A Case Study on Kirakir
39
3.3.2 Deferrable Load Input
The monthly deferrable load profile is indicated in figure 3.3.
Figure 3.3 Monthly deferrable load profiles
3.3.3 Resource Inputs
The monthly average wind speed for the study area was fed into HOMER. Figure 3.4 shows the
average wind resource profile of each month at 10 m above the surface of the earth. Yearly
average wind speed of 4.4m/s was obtained from this site.
Figure 3.4 Monthly average wind speeds at 10m
3.3.4 Weibull Distribution
The Weiull distribution function of wind speed probability density function obtained from
HOMER software is given with estimated Weibull k= 1.93 and c = 4.40m/s. HOMER
simulation result is shown in figure 3.5.

Design and Control of AC/DC Microgrid System for Rural Electrification in Ethiopia: A Case Study on Kirakir
40
Figure 3.5 Wind speed probability density function at 10m
Figure 3.6 presents the monthly average solar source potential of the village under case study. As
shown in the figure April was the sunniest month. The figure indicates that solar resource is
abundant through the year and electricity generated by PV panel could be promising. Thus the
site has excellent solar energy for electric generation. The maximum solar radiation is for the
April month with a radiation of 6.99kW/m2/day and the minimum is occurred in July and August
with 5.5kWh/m2/day.
Figure 3.6 Monthly average radiations
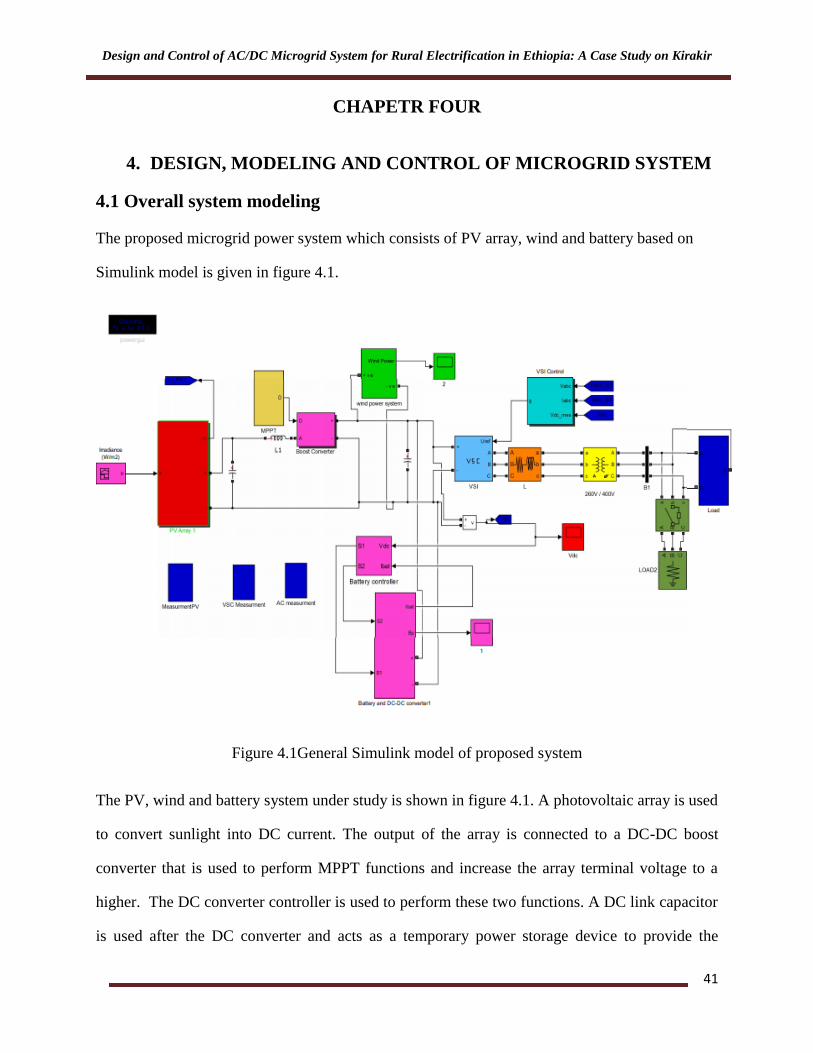
Design and Control of AC/DC Microgrid System for Rural Electrification in Ethiopia: A Case Study on Kirakir
41
CHAPETR FOUR
4. DESIGN, MODELING AND CONTROL OF MICROGRID SYSTEM
4.1 Overall system modeling
The proposed microgrid power system which consists of PV array, wind and battery based on
Simulink model is given in figure 4.1.
Figure 4.1General Simulink model of proposed system
The PV, wind and battery system under study is shown in figure 4.1. A photovoltaic array is used
to convert sunlight into DC current. The output of the array is connected to a DC-DC boost
converter that is used to perform MPPT functions and increase the array terminal voltage to a
higher. The DC converter controller is used to perform these two functions. A DC link capacitor
is used after the DC converter and acts as a temporary power storage device to provide the
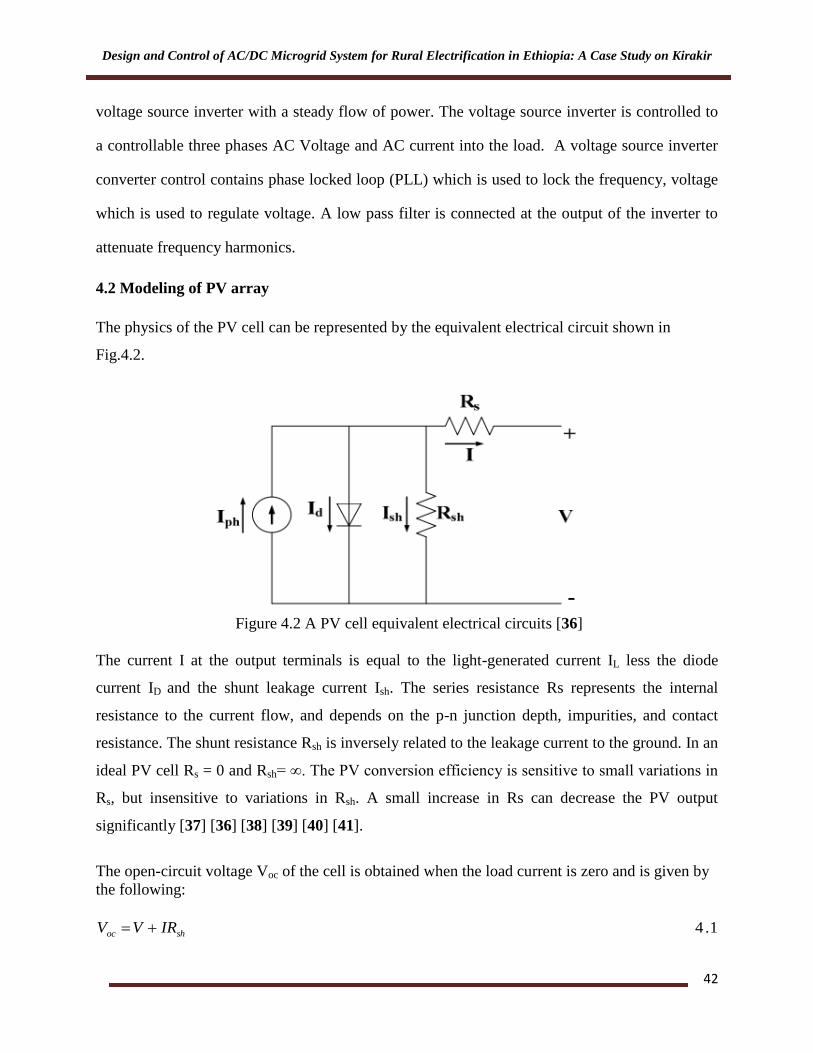
Design and Control of AC/DC Microgrid System for Rural Electrification in Ethiopia: A Case Study on Kirakir
42
voltage source inverter with a steady flow of power. The voltage source inverter is controlled to
a controllable three phases AC Voltage and AC current into the load. A voltage source inverter
converter control contains phase locked loop (PLL) which is used to lock the frequency, voltage
which is used to regulate voltage. A low pass filter is connected at the output of the inverter to
attenuate frequency harmonics.
4.2 Modeling of PV array
The physics of the PV cell can be represented by the equivalent electrical circuit shown in
Fig.4.2.
Figure 4.2 A PV cell equivalent electrical circuits [36]
The current I at the output terminals is equal to the light-generated current IL less the diode
current ID and the shunt leakage current Ish. The series resistance Rs represents the internal
resistance to the current flow, and depends on the p-n junction depth, impurities, and contact
resistance. The shunt resistance Rsh is inversely related to the leakage current to the ground. In an
ideal PV cell Rs = 0 and Rsh= ∞. The PV conversion efficiency is sensitive to small variations in
Rs, but insensitive to variations in Rsh. A small increase in Rs can decrease the PV output
significantly [37] [36] [38] [39] [40] [41].
The open-circuit voltage Voc of the cell is obtained when the load current is zero and is given by
the following:
.1 4 shoc IRVV

Design and Control of AC/DC Microgrid System for Rural Electrification in Ethiopia: A Case Study on Kirakir
43
The diode current is given by the classical diode current expression
KJ
C
eII AkT
QV
satd
oc
023-
19-
sat
/1.38x10constantBoltzmann k
constant fitting CurveA
1.6x10 chargeelectron Q
diode theofcurrent saturation theI
Where
4.2 1
Thus, the load current is given by the expression
4.3 1sh
ocAkT
QV
satLR
VeIII
oc
The open-circuit voltage as follows:
From the optimization result shows in HOMER, modules need to be installed is 100kW PV.
Under standard testing condition solar photovoltaic array is being operated at irradiance of 1000
W/m2 and solar photovoltaic panels are tested at 250c.The 100Kw PV array specification is
presented as follows [18] [42]:
Table 4.1 100kW PV array specification
SunPower module
Characteristics
Maximum power (kW)
0.3035kW
Maximum power voltage (V) 54.70
Maximum power current (A) 5.58
Open circuit voltage (V) 64.20
Short circuit current (A) 5.96
Maximum power temp. coefficient (W/deg.C) -1.154e+000
Maximum power voltage temp. coefficient
(V/deg.C)
-1.860e-001
Maximum power current temp. coefficient
(A/deg.C
-2.120e-003
Open circuit voltage temp. coefficient
(V/deg.C)
-1.770e-001
Short circuit current temp. coefficient 3.516e-003
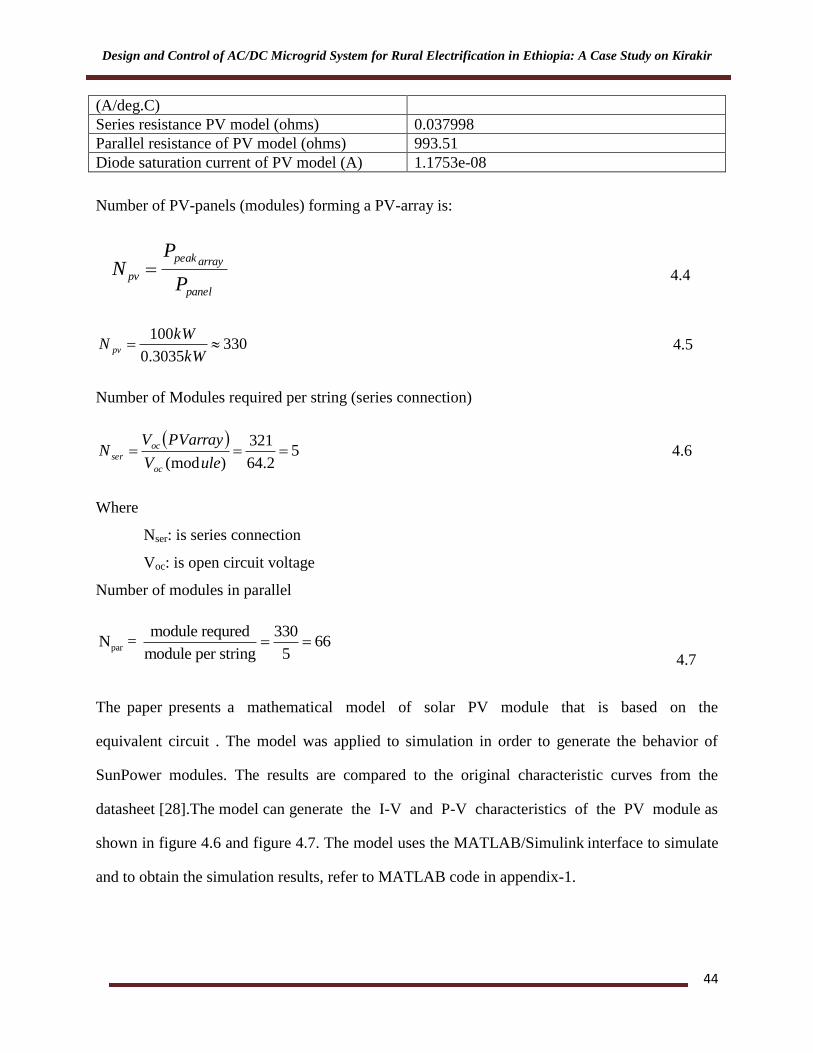
Design and Control of AC/DC Microgrid System for Rural Electrification in Ethiopia: A Case Study on Kirakir
44
(A/deg.C)
Series resistance PV model (ohms) 0.037998
Parallel resistance of PV model (ohms) 993.51
Diode saturation current of PV model (A) 1.1753e-08
Number of PV-panels (modules) forming a PV-array is:
panel
arraypeak
pvP
PN
4.4
3303035.0
100
kW
kWN pv
4.5
Number of Modules required per string (series connection)
5
2.64
321
)(mod
uleV
PVarrayVN
oc
oc
ser
4.6
Where
Nser: is series connection
Voc: is open circuit voltage
Number of modules in parallel
par
module requred 330N = 66
module per string 5
4.7
The paper presents a mathematical model of solar PV module that is based on the
equivalent circuit . The model was applied to simulation in order to generate the behavior of
SunPower modules. The results are compared to the original characteristic curves from the
datasheet [28].The model can generate the I-V and P-V characteristics of the PV module as
shown in figure 4.6 and figure 4.7. The model uses the MATLAB/Simulink interface to simulate
and to obtain the simulation results, refer to MATLAB code in appendix-1.
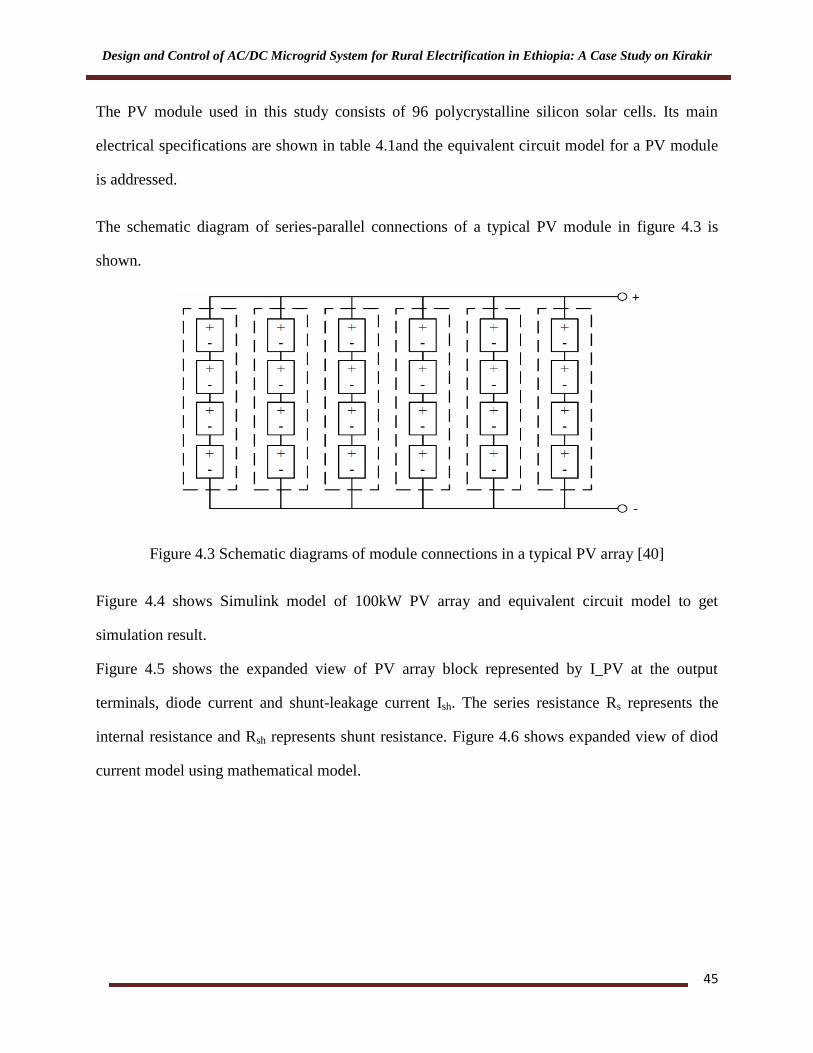
Design and Control of AC/DC Microgrid System for Rural Electrification in Ethiopia: A Case Study on Kirakir
45
The PV module used in this study consists of 96 polycrystalline silicon solar cells. Its main
electrical specifications are shown in table 4.1and the equivalent circuit model for a PV module
is addressed.
The schematic diagram of series-parallel connections of a typical PV module in figure 4.3 is
shown.
Figure 4.3 Schematic diagrams of module connections in a typical PV array [40]
Figure 4.4 shows Simulink model of 100kW PV array and equivalent circuit model to get
simulation result.
Figure 4.5 shows the expanded view of PV array block represented by I_PV at the output
terminals, diode current and shunt-leakage current Ish. The series resistance Rs represents the
internal resistance and Rsh represents shunt resistance. Figure 4.6 shows expanded view of diod
current model using mathematical model.
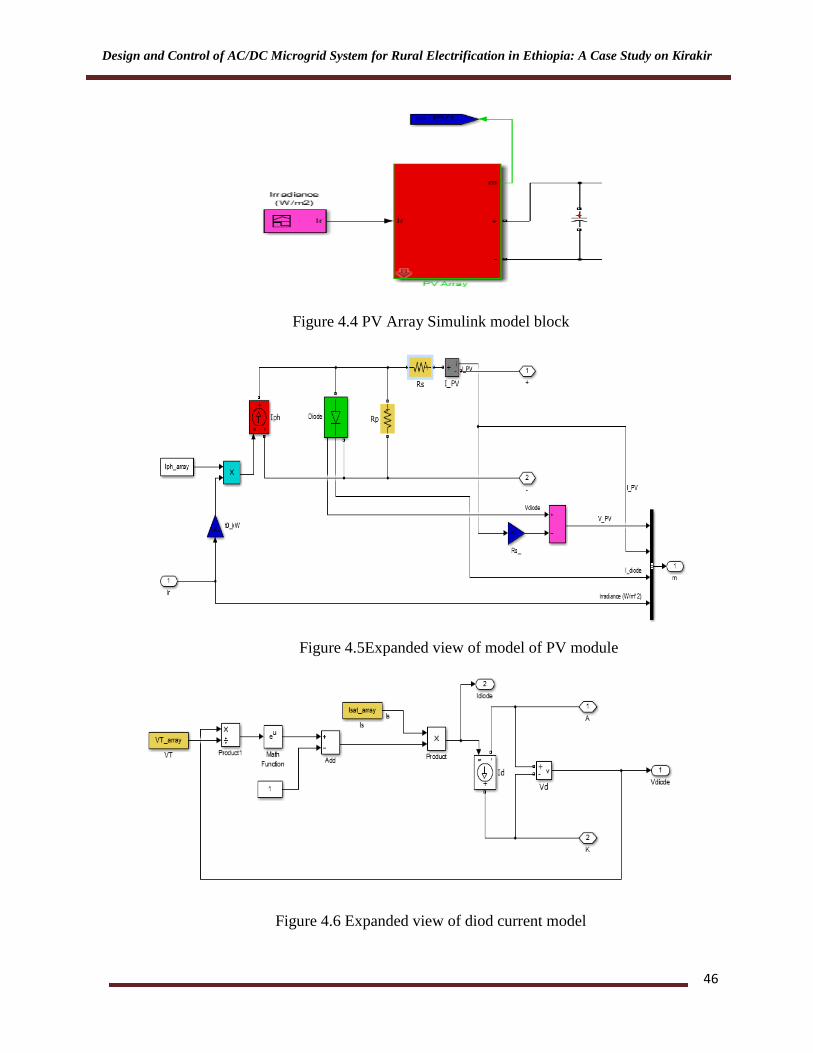
Design and Control of AC/DC Microgrid System for Rural Electrification in Ethiopia: A Case Study on Kirakir
46
Figure 4.4 PV Array Simulink model block
Figure 4.5Expanded view of model of PV module
Figure 4.6 Expanded view of diod current model
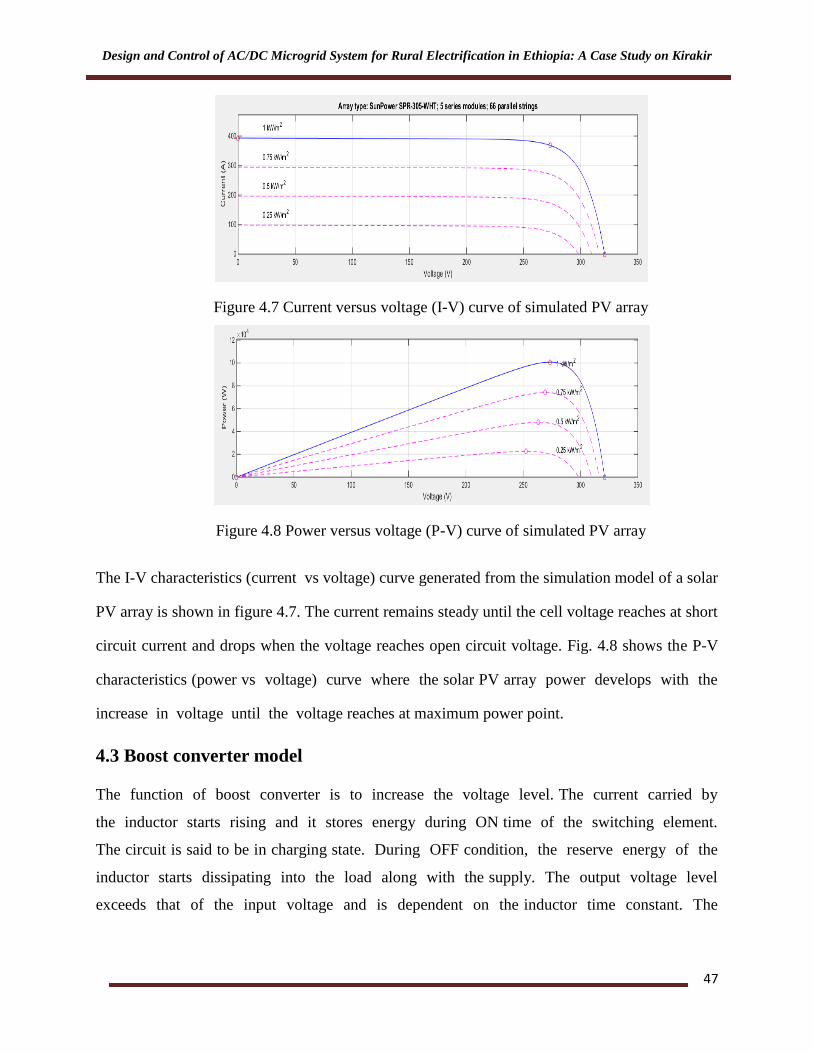
Design and Control of AC/DC Microgrid System for Rural Electrification in Ethiopia: A Case Study on Kirakir
47
Figure 4.7 Current versus voltage (I-V) curve of simulated PV array
Figure 4.8 Power versus voltage (P-V) curve of simulated PV array
The I-V characteristics (current vs voltage) curve generated from the simulation model of a solar
PV array is shown in figure 4.7. The current remains steady until the cell voltage reaches at short
circuit current and drops when the voltage reaches open circuit voltage. Fig. 4.8 shows the P-V
characteristics (power vs voltage) curve where the solar PV array power develops with the
increase in voltage until the voltage reaches at maximum power point.
4.3 Boost converter model
The function of boost converter is to increase the voltage level. The current carried by
the inductor starts rising and it stores energy during ON time of the switching element.
The circuit is said to be in charging state. During OFF condition, the reserve energy of the
inductor starts dissipating into the load along with the supply. The output voltage level
exceeds that of the input voltage and is dependent on the inductor time constant. The
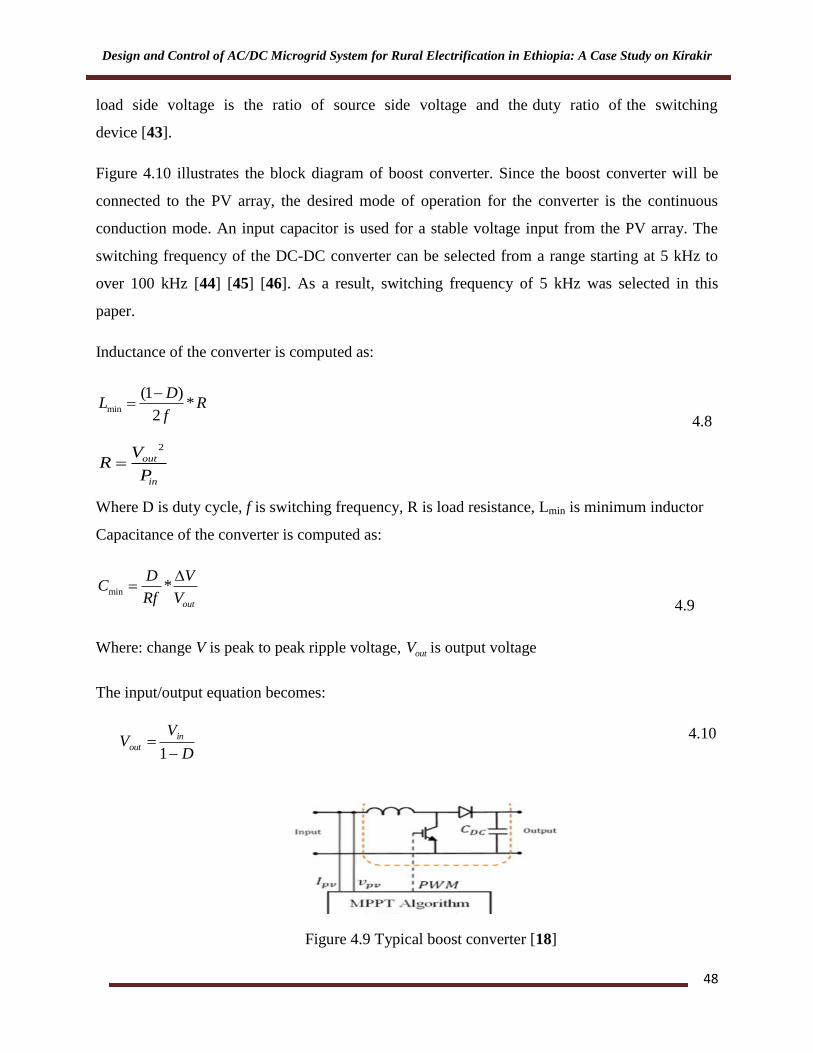
Design and Control of AC/DC Microgrid System for Rural Electrification in Ethiopia: A Case Study on Kirakir
48
load side voltage is the ratio of source side voltage and the duty ratio of the switching
device [43].
Figure 4.10 illustrates the block diagram of boost converter. Since the boost converter will be
connected to the PV array, the desired mode of operation for the converter is the continuous
conduction mode. An input capacitor is used for a stable voltage input from the PV array. The
switching frequency of the DC-DC converter can be selected from a range starting at 5 kHz to
over 100 kHz [44] [45] [46]. As a result, switching frequency of 5 kHz was selected in this
paper.
Inductance of the converter is computed as:
min
(1 )*
2
DL R
f
4.8
2
out
in
VR
P
Where D is duty cycle, f is switching frequency, R is load resistance, Lmin is minimum inductor
Capacitance of the converter is computed as:
min *out
D VC
Rf V
4.9
Where: change V is peak to peak ripple voltage, outV is output voltage
The input/output equation becomes:
4.10
Figure 4.9 Typical boost converter [18]
D
VV in
out
1
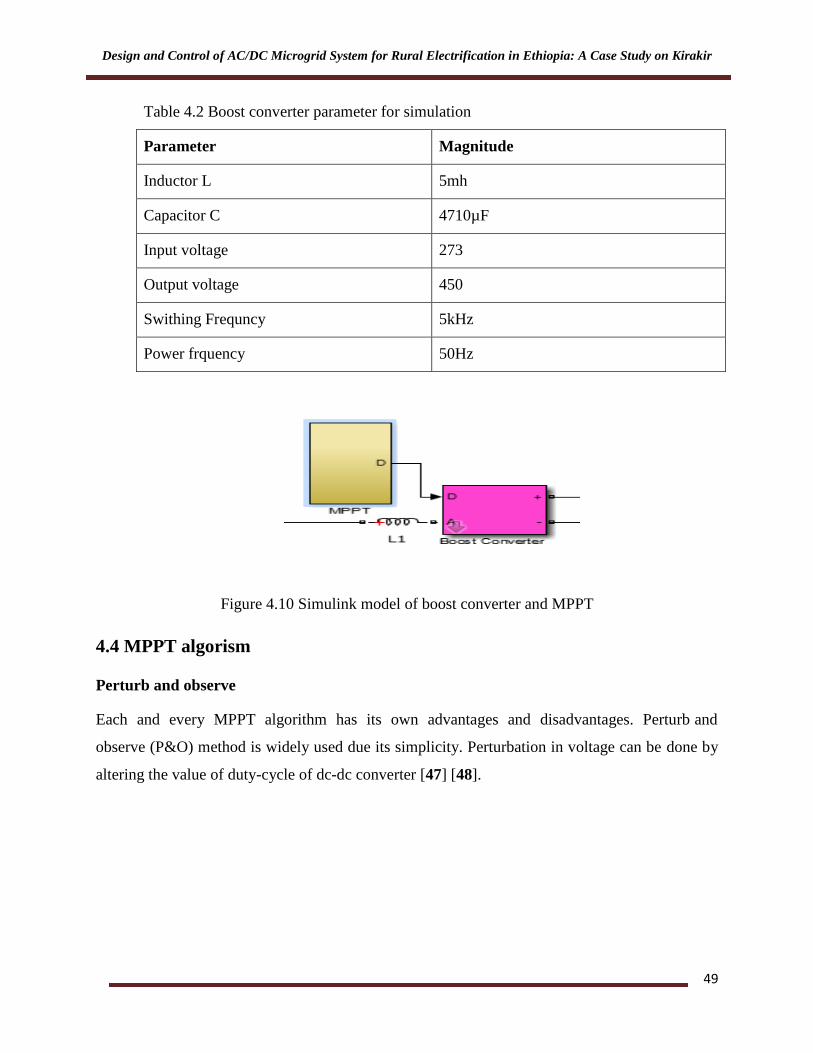
Design and Control of AC/DC Microgrid System for Rural Electrification in Ethiopia: A Case Study on Kirakir
49
Table 4.2 Boost converter parameter for simulation
Parameter Magnitude
Inductor L 5mh
Capacitor C 4710µF
Input voltage 273
Output voltage 450
Swithing Frequncy 5kHz
Power frquency 50Hz
Figure 4.10 Simulink model of boost converter and MPPT
4.4 MPPT algorism
Perturb and observe
Each and every MPPT algorithm has its own advantages and disadvantages. Perturb and
observe (P&O) method is widely used due its simplicity. Perturbation in voltage can be done by
altering the value of duty-cycle of dc-dc converter [47] [48].

Design and Control of AC/DC Microgrid System for Rural Electrification in Ethiopia: A Case Study on Kirakir
50
Figure 4.11 P-V characteristics of a photovoltaic system
Figure 4.11 shows the P-V characteristics of a photovoltaic system. From P-V characteristics
we can see that on right side of MPP as the voltage decreases the power increases but
on left side of MPP increasing voltage will increase power. This is the main idea we
have used in the P&O algorithm to track the MPPT [18] [49]. The flow chart of P&O
algorithm is manifested in figure 4.12.
Figure 4.12 Flowchart of perturb and observe MPPT algorithm

Design and Control of AC/DC Microgrid System for Rural Electrification in Ethiopia: A Case Study on Kirakir
51
As we can see from the flow chart first of all we measure voltage and current, by using
these values we calculate power, calculated power is compared with previous one and
accordingly we increase or decrease the voltage to locate the Maximum Power Point by
altering the duty cycle of converter.
Figure 4.13 P and O MPPT simulink block
4.5 Voltage source inverter modeling
The converter is composed of six switches, S1 to S6, with an ant -parallel free-wheeling diode for
each switch. Depending on operation type and power range these switches can be IGBT
and MOSFET devices model. If the primary end of the converter takes input as DC then
the secondary end produces three-phase variable voltage with variable frequency on AC side.
In this paper MATLAB/Simulink library VSI block is used for simulation purpose [18].
Table 4.3 Parameters of VSI 100kW converter specification
Parameter Magnitude
VSI power 100kW
VSI Voltage input/output 450V DC/260AC V
Transformer voltage 260V/380V
PI controller voltage regulator gains Kp, Ki 7,800
DC voltage 450V

Design and Control of AC/DC Microgrid System for Rural Electrification in Ethiopia: A Case Study on Kirakir
52
Power Frequency 50Hz
Figure 4.14 MATLAB/Simulink VSI block
4.5.1 VSI converter controller
DC-DC step-up converter increases the dc voltage from PV maximum natural voltage of 272V to
450V, and three-phase three-level VSI converts from 450Vdc to 260Vac.The VSC implements
voltage and frequency control for the load connection. The total AC power is transported to the
system through inverter; the system is needed to be operated to provide constant voltage and
frequency under varying loads. Hence, a voltage regulator is required. Transformer is used in the
system to increase the voltage level. A phase locked loop (PLL) is used for frquency control.
4.6 Battery modeling
The internal resistance is the major factor for the limited charging and discharging current
capability. The internal equivalent series resistance has different values under charging and
discharging operating conditions. The charging and discharging efficiency are nonlinear
functions of current and state of charge (SOC). The SOC is defined as the percentage of the
remaining capacity of a battery. SOC can be expressed as equation below:
*100%r
rated
QSOC
Q
4.12

Design and Control of AC/DC Microgrid System for Rural Electrification in Ethiopia: A Case Study on Kirakir
53
Where, Qr, Qrated are remaining capacity and rated capacity of the battery respectively, both in
Ampere-Hour (Ah).
Figure 4.15 Simple equivalent circuit model of rechargeable lead acid battery [1]
Applying a simple KVL, the voltage at the battery terminal can be expressed as [17]:
tiRUU biodc
4.11
The power that is drawn from the battery is also given as:
tiUtP bdcb
4.12
The energy which is left in the battery after the load has drawn power from the battery
can also be expressed as:
dttPtete bibb int 4.13
Where,
Udc = DC voltage at the DC bus connection
Uo = Internal voltage of the battery bank
Ri = Internal resistance of the battery bank
ib(t) = Current output of the battery to the load
eb(t) = Energy delivered to the load when the battery is discharging; and stored energy
when the battery is charging

Design and Control of AC/DC Microgrid System for Rural Electrification in Ethiopia: A Case Study on Kirakir
54
eb-init(t) = Initial energy of the battery
Pb(t) = Battery power delivered to the load
4.6.1 Battery bidirectional converter modeling
Figure 4.16 Mode of operation of converter (a) Mode boost(dicharging); (b) Mode buck
(charging) [50]
Figure 4.16 shows the circuit diagram of bidirectional DC-DC buck-boost converter. Figure 4.16
(a) is a boost mode or (discharging battery), a condition while switch S2 is turned off and switch
S3 is turned on, and so the power flows from the battery to DC Link. Whereas, the condition (b)
is a buck mode (charging battery), the condition when switch S2 is turned on and S3 is turned off,
so the power flows from the DC link to battery. The specification of bidirectional buck-boost
DC-DC converter while steady state conditions can be written by following equation [50]:
2
3
(1 )
2 s
D D RL
f
4.14
2
(1 )
8 ( )os
out
DC
VL f
V
4.15
Bidirectional converter parameter
L3 = 5mH, C = 50mF
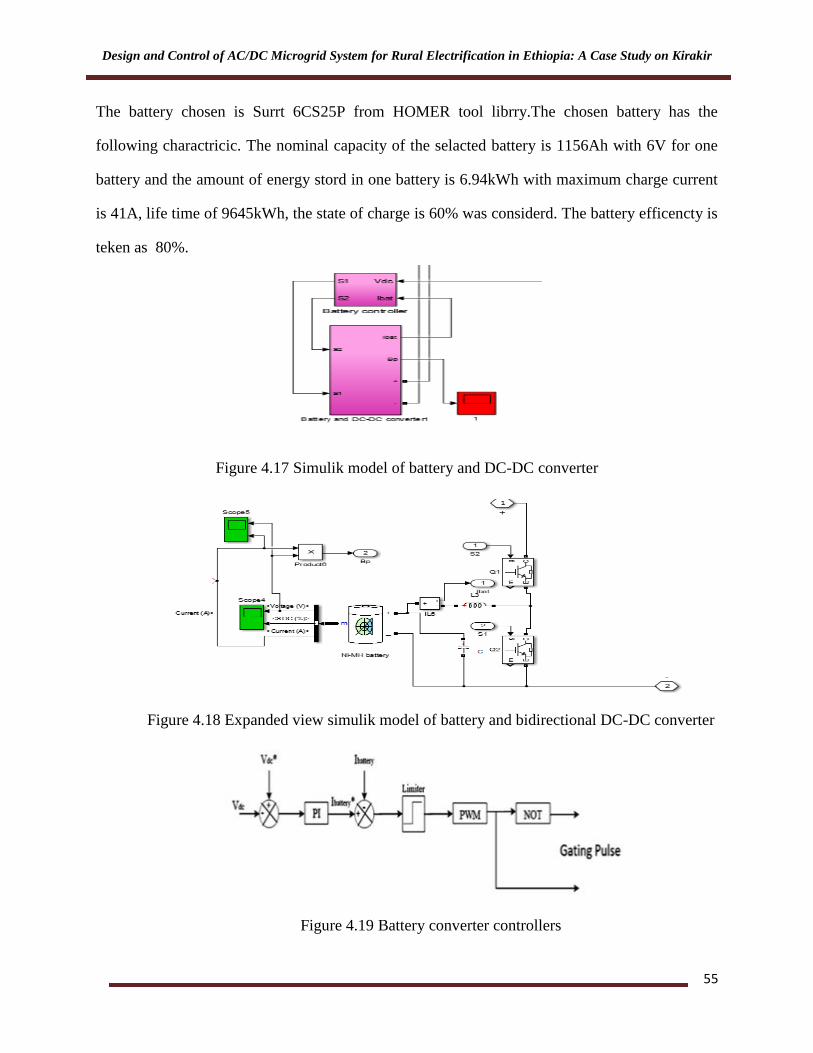
Design and Control of AC/DC Microgrid System for Rural Electrification in Ethiopia: A Case Study on Kirakir
55
The battery chosen is Surrt 6CS25P from HOMER tool librry.The chosen battery has the
following charactricic. The nominal capacity of the selacted battery is 1156Ah with 6V for one
battery and the amount of energy stord in one battery is 6.94kWh with maximum charge current
is 41A, life time of 9645kWh, the state of charge is 60% was considerd. The battery efficencty is
teken as 80%.
Figure 4.17 Simulik model of battery and DC-DC converter
Figure 4.18 Expanded view simulik model of battery and bidirectional DC-DC converter
Figure 4.19 Battery converter controllers

Design and Control of AC/DC Microgrid System for Rural Electrification in Ethiopia: A Case Study on Kirakir
56
Bi-directional converter is controlled based on PI controller and used to charge and discharge the
battery according to power generation and load demand. This control is also necessary to
keep dc link voltage constant. When the dc link voltage is greater than reference voltage
it will charge the battery. Again, when the dc link voltage is less than the reference voltage it
will discharge to the load.
From Fig. 4.19, it is seen that voltage of battery bank is compared with reference voltage Vdc*
then the output voltage is passed through a pulse width modulator and input gating pulse to
switches.
4.7 Modeling of Wind Turbine
From the output result of HOMER the wind turbines have a capacity of 10kW and wind turbine
is coupled to the DC-bus. The output of the wind turbine is AC but a rectifier is used to change
AC to DC.
As it is appeared from the power relation, wind speed has a strong influence on power output.
The power contained in the wind is not in practice the amount of power that can be extracted by
a wind turbine. This is because losses are incurred in the energy conversion process, also because
some of the air is pushed aside by the rotor and by passing it without generating power.
The actual power extracted by the rotor blades is given by the equation [51] [52] [53]:
31* *
2w w pP V C
4.16
Where, Pw is turbine power, ρ is the air density in kg/m3, A is the wind turbine swept area in m
2
and Vw is the wind speed in m/s
The mechanical power produced by the wind turbine due to Pw depends on the power coefficient
CP of the wind turbine and can be expressed as [54]:
( , )m p wP C P 4.17

Design and Control of AC/DC Microgrid System for Rural Electrification in Ethiopia: A Case Study on Kirakir
57
The coefficient of performance is as a function of tip speed ratio (TSR)
* m
m
TSRV
4.18
Where ωm is rotational speed, ϒ is turbine, Vw wind speed
m
wind
R
V
4.19
21
2m p windP R C V
4.20
5 31( )
2
mm pP R C
4.21
mm
m
PT
4.22
Where ωm is blade angular speed [rad/s], R = Blade radius[m], Vwind = wind speed [m/s],
Pm = mechanical power from wind blade [kW], ρ = air density [kg/m3], Cp = power coefficient,
Tm = mechanical torque input to the synchronous generator and driving the generator.
The common function defining the power coefficient as a function of the tip speed and blade
pitch angle is given by equation [54].
( 2)(0.44 0.0167)sin 0.0018( 2)
(13 0.3 )pC
4.23
Where β is the blade pitch angle, for a fixed pitch type the value of β is set to be a constant value,
λ is tip speed ratio

Design and Control of AC/DC Microgrid System for Rural Electrification in Ethiopia: A Case Study on Kirakir
58
Figure 4.20 Simulink model of wind turbine
Table 4.4 Parameter for simulation model [55]
Block Parameter Value
Wind turbine Nominal power 10kW
Base power of electrical
power
10kVA
Base wind speed 12m/s
Maximum power at base
speed
1p.u
Base rotational speed 1p.u
Pitch angle 0
Permanent magnet
synchronous machine
Rated electrical power 10kW
Rated speed 1800rpm
Stator phase resistance 0.2ohm
Inductance Ld, Lq 8.5mH
Flux linkage established by
magnet
0.175V.s
Viscose damping 0.005N.m.s
pole 4
Diode On resistance 1miliohm
Snubber resistance 100kiloohm
Snubber resistance infinity
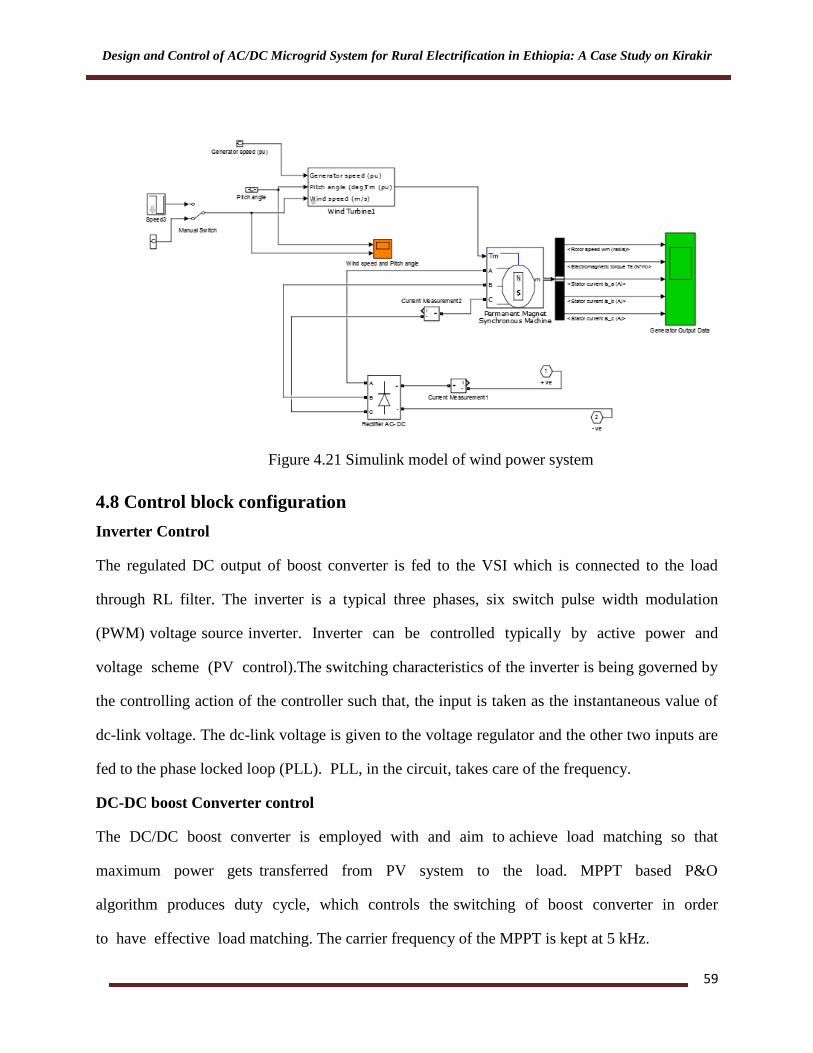
Design and Control of AC/DC Microgrid System for Rural Electrification in Ethiopia: A Case Study on Kirakir
59
Figure 4.21 Simulink model of wind power system
4.8 Control block configuration
Inverter Control
The regulated DC output of boost converter is fed to the VSI which is connected to the load
through RL filter. The inverter is a typical three phases, six switch pulse width modulation
(PWM) voltage source inverter. Inverter can be controlled typically by active power and
voltage scheme (PV control).The switching characteristics of the inverter is being governed by
the controlling action of the controller such that, the input is taken as the instantaneous value of
dc-link voltage. The dc-link voltage is given to the voltage regulator and the other two inputs are
fed to the phase locked loop (PLL). PLL, in the circuit, takes care of the frequency.
DC-DC boost Converter control
The DC/DC boost converter is employed with and aim to achieve load matching so that
maximum power gets transferred from PV system to the load. MPPT based P&O
algorithm produces duty cycle, which controls the switching of boost converter in order
to have effective load matching. The carrier frequency of the MPPT is kept at 5 kHz.

Design and Control of AC/DC Microgrid System for Rural Electrification in Ethiopia: A Case Study on Kirakir
60
Bi-directional converter
This control is also necessary to keep dc link voltage constant. When the dc link voltage
is greater than reference voltage it will charge the battery. Again, when the dc link
voltage is less than the reference voltage it will discharge to the load.
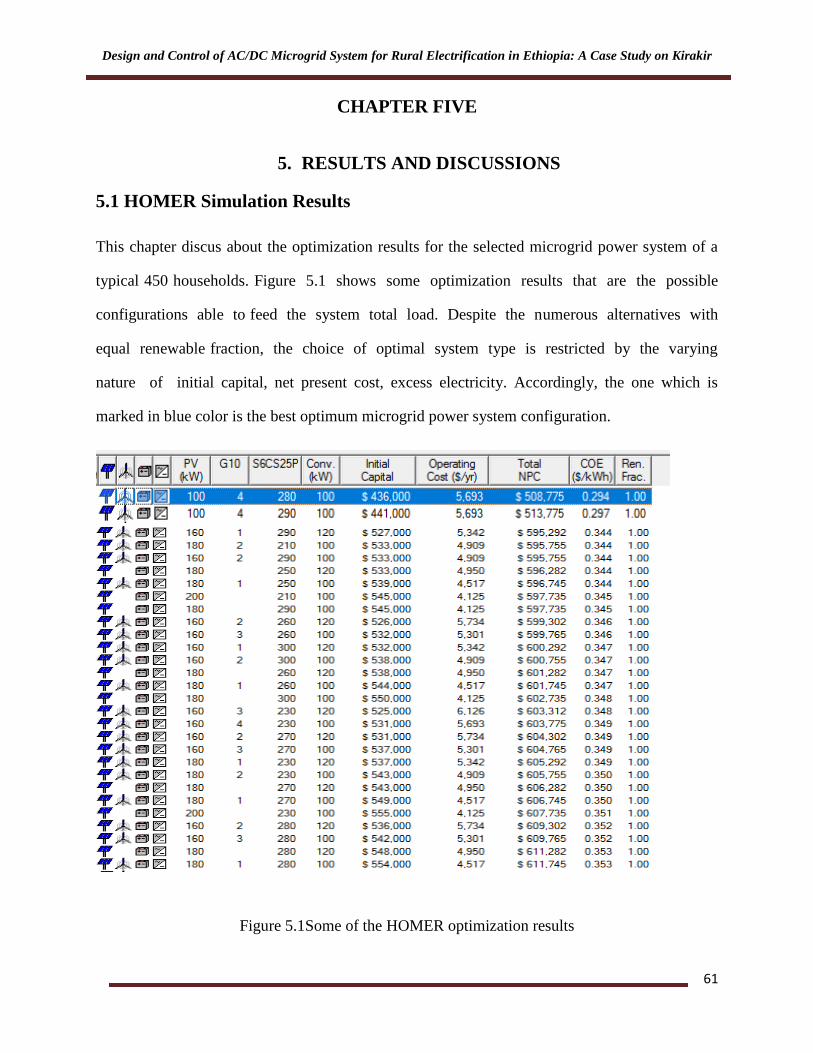
Design and Control of AC/DC Microgrid System for Rural Electrification in Ethiopia: A Case Study on Kirakir
61
CHAPTER FIVE
5. RESULTS AND DISCUSSIONS
5.1 HOMER Simulation Results
This chapter discus about the optimization results for the selected microgrid power system of a
typical 450 households. Figure 5.1 shows some optimization results that are the possible
configurations able to feed the system total load. Despite the numerous alternatives with
equal renewable fraction, the choice of optimal system type is restricted by the varying
nature of initial capital, net present cost, excess electricity. Accordingly, the one which is
marked in blue color is the best optimum microgrid power system configuration.
Figure 5.1Some of the HOMER optimization results

Design and Control of AC/DC Microgrid System for Rural Electrification in Ethiopia: A Case Study on Kirakir
62
The above HOMER simulation result indicates the optimal size with cost in sequence from least
to high cost. The system indicate in the 1st row with four unit of wind turbine with 10kW rating
power, 100kW photovoltaic panel, 280 unit batteries, and 100kW converter was selected because
of the minimum cost .
5.1.1 Cost Summary
The selacted system (1st row from HOMER result) detail cost summery results are shown in
figure 5.2. PV array took the first highest total NPC which is around $200,000 and battery is
the second placed scheme with cost of $140,000, followed with converter cost of $40,000
and wind with $56,000. The power system Net present cost and the levelized COE are $508,775
and $0.294/kWh, respectively.Furthermore, the system report shows that there is an excess
electricity of $26,316kWh/yr.
Figure 5.2 The optimum microgrid power system cost share by each components
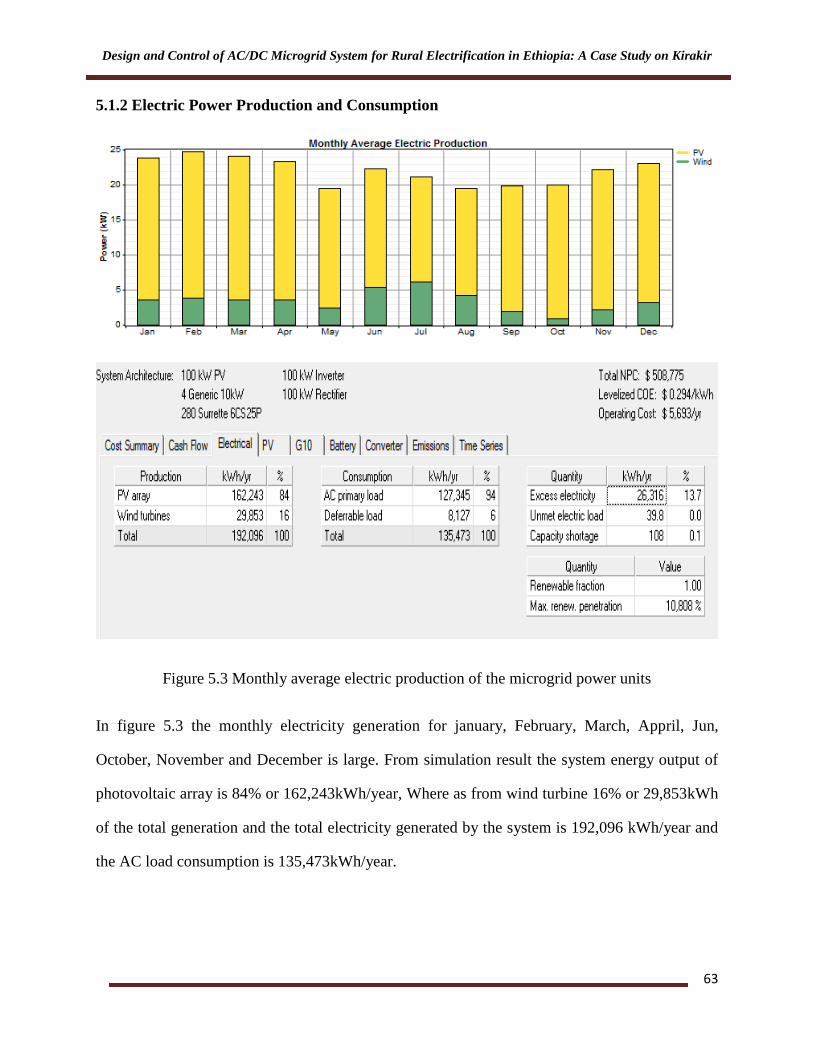
Design and Control of AC/DC Microgrid System for Rural Electrification in Ethiopia: A Case Study on Kirakir
63
5.1.2 Electric Power Production and Consumption
Figure 5.3 Monthly average electric production of the microgrid power units
In figure 5.3 the monthly electricity generation for january, February, March, Appril, Jun,
October, November and December is large. From simulation result the system energy output of
photovoltaic array is 84% or 162,243kWh/year, Where as from wind turbine 16% or 29,853kWh
of the total generation and the total electricity generated by the system is 192,096 kWh/year and
the AC load consumption is 135,473kWh/year.

Design and Control of AC/DC Microgrid System for Rural Electrification in Ethiopia: A Case Study on Kirakir
64
5.2 MATLAB/Simulink simulation results of the microgrid power system
In Figure 5.4 the matlab simulation of PV array input irradiance, PV array power and maximum
power point voltage is shown. From t = 0.3 MPPT is enabled,the PV array operates at astandard
testing condition of Irradianc 1000W/m2, PV voltage at maximum power point = 273.5V
(Nse*Vmp = 5*54.7=273.5) and PV array power output is around 100kW.
Figure 5.4 Irradianc, maximum output voltage and PV array power
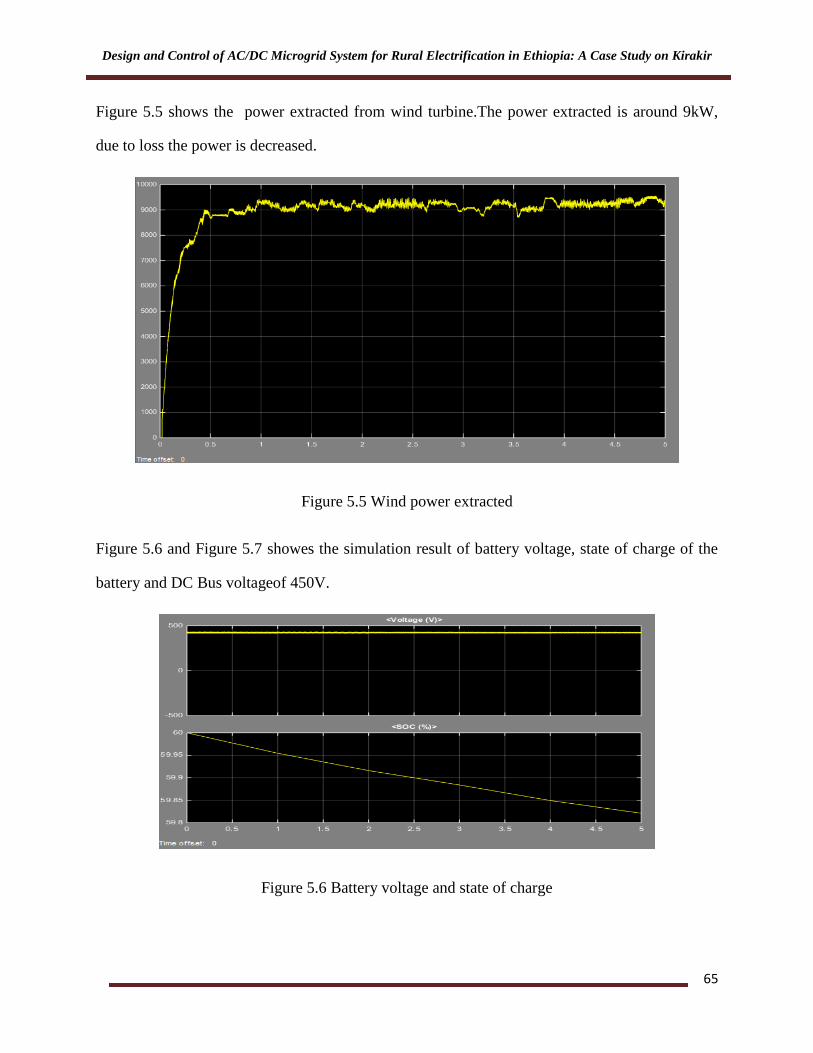
Design and Control of AC/DC Microgrid System for Rural Electrification in Ethiopia: A Case Study on Kirakir
65
Figure 5.5 shows the power extracted from wind turbine.The power extracted is around 9kW,
due to loss the power is decreased.
Figure 5.5 Wind power extracted
Figure 5.6 and Figure 5.7 showes the simulation result of battery voltage, state of charge of the
battery and DC Bus voltageof 450V.
Figure 5.6 Battery voltage and state of charge

Design and Control of AC/DC Microgrid System for Rural Electrification in Ethiopia: A Case Study on Kirakir
66
Figure 5.7 DC bus voltage
Figure 5.8 Inverter output voltage and current for phase A
Figure 5.9 showes sinousiodal phase A outpout voltage and current of inverter
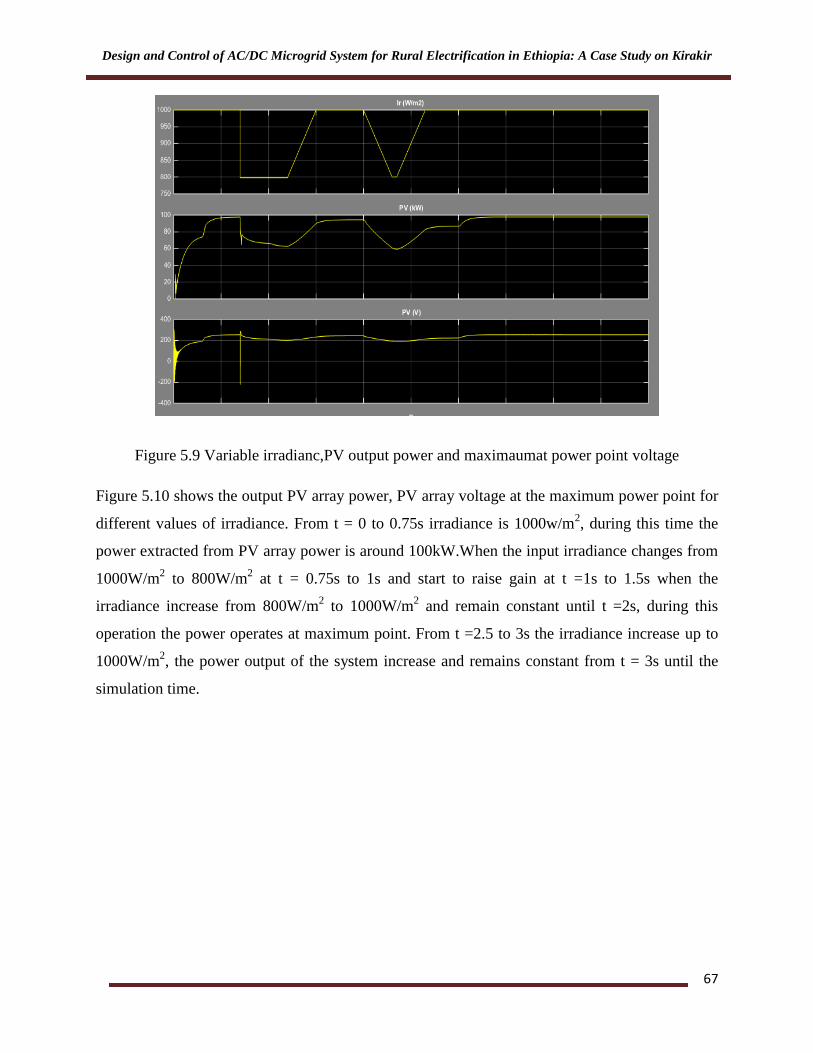
Design and Control of AC/DC Microgrid System for Rural Electrification in Ethiopia: A Case Study on Kirakir
67
Figure 5.9 Variable irradianc,PV output power and maximaumat power point voltage
Figure 5.10 shows the output PV array power, PV array voltage at the maximum power point for
different values of irradiance. From t = 0 to 0.75s irradiance is 1000w/m2, during this time the
power extracted from PV array power is around 100kW.When the input irradiance changes from
1000W/m2 to 800W/m
2 at t = 0.75s to 1s and start to raise gain at t =1s to 1.5s when the
irradiance increase from 800W/m2 to 1000W/m
2 and remain constant until t =2s, during this
operation the power operates at maximum point. From t =2.5 to 3s the irradiance increase up to
1000W/m2, the power output of the system increase and remains constant from t = 3s until the
simulation time.
Design and Control of AC/DC Microgrid System for Rural Electrification in Ethiopia: A Case Study on Kirakir
68
CHAPTER SIX
6. CONCLUSIONS AND RECOMMENDATIONS
6.1 Conclusions
Rural electrification is a challenge for developing countries like Ethiopia because of the
economic and geographical location constraints. To meet the energy requirement microgrid
power renewable energy technologies can be sustainable solutions. To upgrade the living
standard of rural villages environmental friendly renewable energy resource will be the future
energy possible solution.
The thesis study was carried out for 450 households in the rural village of Amhara region, kirker.
MATLAB/Simulink model is developed; techno- economical, sizing and feasibility study was
carried out using HOMER for proposed microgrid power system. Wind energy potential,
although it may not be sufficient for a large independent wind farm. Data source for solar
energy shows huge potential of solar energy at the site. the community electric demand is
supplied by a microgrid system power source containing 100kW PV array, four 10kW
wind turbine, 100kW converter, batteries. The microgrid system needs $
436,000 initial capital
and $508,775 total NPC. The result of the MATLAB/Simulink model that contains the microgrid
system set-up shows the modeling and controlling of converter. The output result of
MATLAB/Simulink shows that the PV array maximum power nearly 100kW, maximum power
point voltage 273.5V at 1000 W/m2. Figure 5.10 shows the output of PV array varies with
different input irradiance by tracking the maximum output of the PV array and the voltage output
of inverter is sinusoidal. The wind turbine output is around 9kW because of loss. Therefore, the
system is modeled with minimum cost and effective converter coordination control.

Design and Control of AC/DC Microgrid System for Rural Electrification in Ethiopia: A Case Study on Kirakir
69
6.2 Recommendation
The following recommendations can be considered based on this thesis work.
In this thesis conventional converter control configuration was used to study the system
performance. In order to get better performance and study dynamic response an artificial
intelligent control could be suggested
6.3 Future Work
In this study grid connected microgrid power system are not considered, thus studying
grid connected microgrid power system with artificial intelligent controller could be done
in the future.

Design and Control of AC/DC Microgrid System for Rural Electrification in Ethiopia: A Case Study on Kirakir
70
References
[1] Kamal Tariq et al., "Integration and Control of an Off-grid Hybrid wind/PV Generation
System for Rural Applications," IEEE, no. 978-1-5090-3310-2/17, 2017.
[2] Gautam Praveen , Peri Venkata , Paliwal Priyanka , and C. Joseph Francis , "ACMC-based
hybrid AC/LVDC micro-grid," IET Renewable Power Generation, vol. 11, no. 4, 2017.
[3] Ahmad Shameem et al., "Modeling of Grid Connected Battery Storage Wave Energy and
PV Hybrid Renewable Power Generation," International Conference on Electrical,
Computer and Communication Engineering (ECCE), Cox’s Bazar, Bangladesh/IEEE, no.
978-1-5090-5627-9/17, February 16-18 2017.
[4] Ghose Shantu , El Shaha Adel, and J. Haddad Rami , "Wind-Solar Hybrid Power System
Cost Analysis using HOMER for Statesboro,Georgia," IEEE, no. 978-1-5386-1539-3/17,
2017.
[5] Al-Falah Monaaf D.A, Sabah Nimma Kutaiba, S. D. G. Jayasinghe, and Enshae Hossein ,
"Sizing and Modeling of a Standalone Hybrid Renewable Energy System," IEEE, no. 978-
1-5090-1546-7/16, 2016.
[6] Abera Habtemariam , Bayray Mulu, and Z.M Kimambo, "The feasibility of development of
solar-wind and disesel hybrid power system for supplying electricity to off-grid rular
community," 2014.
[7] G. Bansod Pooja and Dr. S. P. Adhau, "Dynamic Modeling and Control of Hybrid
Generation System for Grid Connected Application," IEEE, no. 978-1-4673-9925-8/16,
2016.
[8] Nazih Moubayed Nizar Kfoury , "Power Control and Energy Management of a Lebanese
Smart Micro Grid," IEEE, no. 978-1-5090-6129-7/16, 2016.
[9] Google. (2016) Google earth. [Online]. https://maps.google.com
[10] Singh Navdeep , Sharma Neha , and Gupta Akhil , "Investigation of Two MPPT Techniques
for Solar PV System-A Comparative Analysis," International Journal of Engineering and
Technical Research, vol. 3, no. 2321-0869, May 2015.
[11] How solar work. [Online].
solardat.uoregon.edu/download/Lessons/Appendix_E_HowSolarCellsWork.pdf
[12] working princple of photovoltaics. (2017) [Online]. https://www.nrel.gov/workingwithus/re-

Design and Control of AC/DC Microgrid System for Rural Electrification in Ethiopia: A Case Study on Kirakir
71
photovoltaics.html
[13] (2017) Wind power principle. [Online]. http://dx.doi.org/10.4236/msa.2015.612113
[14] (2017) Solar panel orientation. [Online].
https://www.google.com.et/search?q=Orientation+And+Slope+of+Solar+PV+Module
[15] Solomon Teklemichael Bahta. (2014) Design and Analyzing of an Off-Grid Hybrid
Renewable Energy System to Supply Electricity for Rural Areas (Case Study: Atsbi District,
North Ethiopia).
[16] (2017) Wind energy system. [Online]. http://dx.doi.org/10.4236/msa.2015.612113
[17] Mikias Hailu Kebed, "Dynamic Modeling and Techno-Economic Analysis of PV-Wind-
Fuel Cell Hybrid Power System: The Case Study of Nifasso," July , 2014.
[18] S. Su mathi, Solar PV and Wind Energy Conversion Systems, An Introduction to Theory,
Modeling with MATLAB/SIMULINK, and the Role of Soft Computing Techniques.
Switzerland: London© Springer International , 2015.
[19] Abdirahiman et al and Abdirahiman et al, "Fisiblity study of renwable energy based
microgrid system in somaliland," Renwable energy, pp. 1048-1059, 2014.
[20] Phuong Hue Tran, "MATLAB/SIMULINK IMPLEMENTATION AND ANALYSIS OF
THREE PULSE-WIDTH-MODULATION (PWM) TECHNIQUES," May 2012.
[21] M.Eng C.U. Ogbuka, "Performance Characteristics of Inverter Controlled Three Phase
Induction Motor:Teaching and Research".
[22] Andreas Oberhofer, "Energy Storage Technologies & Their Role in Renewable Integration,"
Global Energy Network Institute (GENI), July 2012.
[23] Javier Bernabé Mohedano Martínez, "Batteries in PV systems," 2011.
[24] He Yongling and Wang Guofu Feng Jin, "Comparison Study of Equivalent Circuit Model of
Li-Ion Battery for Electrical Vehicles," Research Journal of Applied Sciences, Engineering
and Technology, no. 2040-7459, November 10 2013.
[25] "State of charge estimation for battery," Unveristy of Tennass, Knoxvills, 2002.
[26] Rui Xiong and Jinxin Fan Hongwen He, "Evaluation of Lithium-Ion Battery Equivalent
Circuit Models for State of Charge Estimation by an Experimental Approach," Energies,

Design and Control of AC/DC Microgrid System for Rural Electrification in Ethiopia: A Case Study on Kirakir
72
vol. 4, no. 10.3390/en4040582 , pp. 582-598.
[27] (2017) PV cost. [Online]. www.autoshop101.com/forms/h6.pd
[28] (2017) Application of battery. [Online]. www.eastpennmanufacturing.com/wp./Marine-
Battery-Application-Brochure-0149.pdf
[29] (2014) Comparison of different battery. [Online]. www.inf.fu-
berlin.de/lehre/WS02/robotik/Vorlesungen/./ComparisonBattery.pd
[30] (2016) Glossary of battery terms. [Online]. www.hdp-
power.com/sites/default/files/resources/glossary-of-battery-terms.pdf
[31] Yan Bao and Le Yi Wang Jiuchun Jiang 1, "Topology of a Bidirectional Converter for
Energy Interaction between Electric Vehicles and the Grid," Energies, vol. 7, no.
10.3390/en7084858, pp. 4858-4894, 2014.
[32] "Bidirectional DC-DC Converters," 2012.
[33] Abdulhakeem Alsaleem, "A Bidirectional Converter for Battery Based Energy System for
Residential Applications,".
[34] Dr. Sudip Mazumder Dr. Abas Goodarz, "Bi-directional dc-dc ConverterIncluding Vehicle
System Study to determine Optimum Battery and DC Link Voltages," February 28, 2008.
[35] Tamas Karikes cam pharm, "High efficent bidirectional converterfor residentioal PV
system,".
[36] Teena Jacob and Arun S, "Modeling of Hybrid Wind and Photovoltaic Energy System
Using A New Converter Topology," Electrical and Electronics Engineering: An
International Journal (EEEIJ), vol. 1, no. 2, August 2012.
[37] Mrs. Jerril Gilda Mrs. Ramalakshmi.T, "Grid Connected PV/Wind (GCPW) Hybrid System
with Improved Power Quality," International Journal of Advanced Research in Electrical
Electronics and Instrumentation Engineering, vol. 3, no. 4, May 2014.
[38] Rajendra H. Madhav Chaitrali S. Shedge, "mplementation of Standalone Hybrid Power
System Using Matlab/Simulink," , Jan. 2016.
[39] Medugu D. W. & Michael E., "Integrated Solar – Wind Hybrid Power Generating System
for Residential Application," Global Journal of Researches in Engineering, vol. 14, no. 4,
2014.

Design and Control of AC/DC Microgrid System for Rural Electrification in Ethiopia: A Case Study on Kirakir
73
[40] Husain Ahmed ikash Bhardwaj, "Battery States Controlling via PV-Wind Hybrid System,"
Electrical and Electronins Engineering, vol. 2, no. 7.
[41] YogeshTiwari Chitesh Dubey, "To design solar (photovoltaic) - Wind hybrid powe
generation system International Journal of Emerging Trends & Technology in Computer ,"
vol. 1, no. 4, November – December 2012.
[42] (2017) Module spacification. [Online].
http://www.solardesigntool.com/components/module-panel-solar/Sunpower/514/SPR-305-
WHT-U/specification-data-sheet.html
[43] Boost converter. [Online]. www-
personal.umich.edu/~annastef/FuelCellPdf/problemboostconverter.pdf
[44] SAURABH KASAT. (2004 , December) ANALYSIS, DESIGN AND MODELING OF
DC-DC CONVERTER USING SIMULINK.
[45] SHISHIR KUMAR PRADHAN DEBASHIS DAS, "MODELING AND SIMULATION OF
PVARRAY WITH BOOST CONVERTER: AN OPEN LOOP STUDY," 2011.
[46] Ehsan HOSSEINI, "MODELING AND SIMULATION OF CHOPPERS SWITCHING
VIA MATLAB/SIMULINK," Scientific Bulletin of the Petru Maior, vol. 4, no. 1, 2015.
[47] David Sanz Morales, "Maximum Power Point Tracking Algorithms for Photovoltaic
Applications," jun, 2010.
[48] B. Zahawi and D. J. Atkinson M. A. Elgendy, "Low Cost MPPT Algorithms for PV
Application: PV Pumping Case Study," 31 Jan, 2012.
[49] Abhishek Bhardwaj, Mrutyunjaya Sandhibigraha Arjav Harjai, "STUDY OF MAXIMUM
POWER POINT TRACKING (MPPT) TECHNIQUES IN A SOLAR PHOTOVOLTAIC
ARRAY," 2014.
[50] Ratna Ika Putri, MargoPujiantara,Ardyono Priyadi, Mauridhi Hery Purnomo Rachma Prilian
Eviningsih, "Controlled Bidirectional Converter using PID for Charging Battery in The
Stand alone Wind Turbine System with Modified P&O to Obtain MPPT,"
IEEE/International Conference on Green Energy and Applications, 2017.
[51] Member, IEEE, Dr. M. Vijaya Kumar, Life Fellow, STE Annamalai. M, "Modeling &
Simulation of Variable Speed Wind Turbine with Resonant DC-DC Converters," in
International Conference on Power Electronics, Systems and Applications (ICPESA'2012)
August 25-26, 2012 Kuala Lumpur (Malaysia).
Design and Control of AC/DC Microgrid System for Rural Electrification in Ethiopia: A Case Study on Kirakir
74
[52] Krishna Kant Sharma Raghuvendra Kumar Tiwari1, "Simulation and Modeling of Wind
Turbine using PMSG," vol. 2, no. 2, June 2014.
[53] Abraham Lomi, Widodo Puji Mulayanto Aryuanto Soetedjon, "Modeling of Wind Energy
System with MPPT Control," International Conference on Electrical Engineering and
Informatic, 2011.
[54] B.Baskaran S.Balakumar, "Design and Modeling of Wind Fed Resonant DC-DC Converter
through Synchronous Generator using MATLAB/Simulink," International Journal of
Computer Applications , vol. 73, no. 3, pp. 0975 – 8887, July 2013.
[55] Kiwoo PARK,Haishun SUN, Viorel TRIFA Vasile-Simion CRĂCIUN, "MODELING OF
A SMALL MODELING OF A SMALL MODELING OF A SMALL MODELING OF A
SMALL PERMANENT MAGNET
SSSYYYYNCRONNCRONNCRONNCRONOOOOUS GENERATOR WIND ENUS
GENERATOR WIND ENUS GENERATOR WIND ENERGY CONVERSION
SYSTEMSYSTEMSYSTEMSYSTEM FOR A SMART BUILDINGFOR," vol. 4, 2012.
[56] Mohamed Abdilahi and Abdirahiman et al,.
[57] "MATLAB/SIMULINK IMPLEMENTATION AND ANALYSIS OF THREE PULSE-
WIDTH-MODULATION (PWM) TECHNIQUES,".
[58] state of charge estiomation for battery,.
[59] "Simulation and Modeling of Wind Turbine using PMSG," International Journal of Recent
Research and Review, vol. 2, no. 2, June 2014.

Design and Control of AC/DC Microgrid System for Rural Electrification in Ethiopia: A Case Study on Kirakir
75
APPENDIX-1
PV array block MATLAB initialization code
BlockName=gcb;
Type= SunPowerSPR;
SolarModuleSpec(Type).Desc= 'SunPower SPR-3035-WHT';
SolarModuleSpec(Type).nCells= 96; % Number of cells in series
SolarModuleSpec(Type).Pmp= 305.2; % Maximum power (W)
SolarModuleSpec(Type).Vmp= 54.70; % Maximum power voltage (V)
SolarModuleSpec(Type).Imp= 5.58; % Maximum power current (A)
SolarModuleSpec(Type).Voc= 64.20; % Open circuit voltage (V)
SolarModuleSpec(Type).Isc= 5.96; % Short circuit current (A)
SolarModuleSpec(Type).TempC_Pmp= -1.154e+000; % Maximum power temp. coefficient
(W/deg.C)
SolarModuleSpec(Type).TempC_Vmp= -1.860e-001; % Maximum power voltage temp.
coefficient (V/deg.C)
SolarModuleSpec(Type).TempC_Imp= -2.120e-003; % Maximum power current temp.
coefficient (A/deg.C
SolarModuleSpec(Type).TempC_Voc= -1.770e-001; % Open circuit voltage temp. coefficient
(V/deg.C)
SolarModuleSpec(Type).TempC_Isc= 3.516e-003; % Short circuit current temp. coefficient
(A/deg.C)
SolarModuleSpec(Type).Rs= 0.037998; % Series resistance of PV model (ohms)
SolarModuleSpec(Type).Rp= 993.51; % Parallel resistance of PV model (ohms)
SolarModuleSpec(Type).Isat= 1.1753e-08; % Diode saturation current of PV model (A)
SolarModuleSpec(Type).Iph= 5.9602; % Light-generated photo-current of PV model (A)
SolarModuleSpec(Type).Qd= 1.3; % Diode quality factor of PV model
Type=strmatch(ModuleType,char(SolarModuleSpec.Desc));
k= 1.3806e-23; % Boltzman constant (J.K^-1)
q=1.6022e-19; % electron charge (C)
T=273+25;
nCells=SolarModuleSpec(Type).nCells;
Voc=SolarModuleSpec(Type).Voc;
Isc=SolarModuleSpec(Type).Isc;
Vm=SolarModuleSpec(Type).Vmp;
Im=SolarModuleSpec(Type).Imp;
set_param(BlockName,'Ncell',num2str(nCells));
str=sprintf('[ %g %g %g %g ]',Voc,Isc,Vm,Im);
set_param(BlockName,'ModuleParameters',str);
Rs=SolarModuleSpec(Type).Rs;
Rp=SolarModuleSpec(Type).Rp;
Isat=SolarModuleSpec(Type).Isat;
Iph=SolarModuleSpec(Type).Iph;
Qd=SolarModuleSpec(Type).Qd;
VT=k*T/q*nCells*Qd;

Design and Control of AC/DC Microgrid System for Rural Electrification in Ethiopia: A Case Study on Kirakir
76
str=sprintf('[ %g %g %g %g %g ]',Rs,Rp,Isat,Iph, Qd);
set_param(BlockName,'ModelParameters',str)
Iph_array=Iph*Npar;
Isat_array=Isat*Npar;
VT_array=VT*Nser;
Rs_array=Rs*Nser/Npar;
Rp_array=Rp*Nser/Npar;

Design and Control of AC/DC Microgrid System for Rural Electrification in Ethiopia: A Case Study on Kirakir
77
APPENDIX-2
P and O MPPT algorism MATLAB code
function D = PandO(Param, Enabled, V, I)
% MPPT controller based on the Perturb & Observe algorithm
% D output = Duty cycle of the boost converter (value between 0 and 1)
% Enabled input = 1 to enable the MPPT controller
% V input = PV array terminal voltage (V)
% I input = PV array current (A)
% Param input:
Dinit = Param(1); %Initial value for D output
Dmax = Param(2); %Maximum value for D
Dmin = Param(3); %Minimum value for D
deltaD = Param(4); %Increment value used to increase/decrease the duty cycle D
% ( increasing D = decreasing Vref )
persistentVoldPoldDold;
dataType = 'double';
ifisempty(Vold)
Vold=0;
Pold=0;
Dold=Dinit;
end
P= V*I;
dV= V - Vold;
dP= P - Pold;
ifdP ~= 0 & Enabled ~=0
ifdP< 0
ifdV< 0
D = Dold - deltaD;
else
D = Dold + deltaD;
end
else
ifdV< 0
D = Dold + deltaD;
else
D = Dold - deltaD;
end
end
else D=Dold;
end
if D >= Dmax | D<= Dmin
D=Dold;
end
Dold=D; Vold=V; Pold=P;


![Integrated Smart Grid Performance Testing...Mar 29, 2017 · Microgrid Interoperability Testbed AC/DC Load Emulators 3 X 4.5 kW, 500 V (nonlinear, motor, ]À U ](] UY Microgrid Controller,](https://static.fdocuments.us/doc/165x107/5fc6ab4c9ea13306dd7e43e6/integrated-smart-grid-performance-testing-mar-29-2017-microgrid-interoperability.jpg)


![Wind-driven SEIG supplying DC microgrid through a single ... · efficiency [24,25]. Main advantage of hybrid ac/dc microgrid is the elimination of unnecessary multi-conversion stages](https://static.fdocuments.us/doc/165x107/5f1d2c4f42b01347ec55a88c/wind-driven-seig-supplying-dc-microgrid-through-a-single-eficiency-2425.jpg)