Descriptive Summary of 2003–04 Beginning Postsecondary ...nces.ed.gov/pubs2008/2008174.pdf ·...
239
U.S. DEPARTMENT OF EDUCATION Descriptive Summary of 2003–04 Beginning Postsecondary Students: Three Years Later NCES 2008-174
Transcript of Descriptive Summary of 2003–04 Beginning Postsecondary ...nces.ed.gov/pubs2008/2008174.pdf ·...

U.S. DEPARTMENT OF EDUCATION
Descriptive Summary of 2003–04 Beginning Postsecondary Students: Three Years Later
NCES 2008-174

THIS PAGE INTENTIONALLY LEFT BLANK
NCES 2008-174
U.S. DEPARTMENT OF EDUCATION
Descriptive Summary of 2003–04 Beginning Postsecondary Students: Three Years Later
JULY 2008
Lutz Berkner Susan Choy MPR Associates, Inc.
Tracy Hunt-White Project Officer National Center for Education Statistics
U.S. Department of Education Margaret Spellings Secretary
Institute of Education Sciences Grover J. Whitehurst Director
National Center for Education Statistics Mark Schneider Commissioner
The National Center for Education Statistics (NCES) is the primary federal entity for collecting, analyzing, and reporting data related to education in the United States and other nations. It fulfills a congressional mandate to collect, collate, analyze, and report full and complete statistics on the condition of education in the United States; conduct and publish reports and specialized analyses of the meaning and significance of such statistics; assist state and local education agencies in improving their statistical systems; and review and report on education activities in foreign countries.
NCES activities are designed to address high-priority education data needs; provide consistent, reliable, complete, and accurate indicators of education status and trends; and report timely, useful, and high-quality data to the U.S. Department of Education, the Congress, the states, other education policymakers, practitioners, data users, and the general public. Unless specifically noted, all information contained herein is in the public domain.
We strive to make our products available in a variety of formats and in language that is appropriate to a variety of audiences. You, as our customer, are the best judge of our success in communicating information effectively. If you have any comments or suggestions about this or any other NCES product or report, we would like to hear from you. Please direct your comments to
National Center for Education Statistics Institute of Education Sciences U.S. Department of Education 1990 K Street NW Washington, DC 20006-5651
July 2008
The NCES World Wide Web Home Page is http://nces.ed.gov/. The NCES World Wide Web Electronic Catalog is http://nces.ed.gov/pubsearch.
Suggested Citation
Berkner, L., and Choy, S. (2008). Descriptive Summary of 2003–04 Beginning Postsecondary Students: Three Years Later (NCES 2008-174). National Center for Education Statistics, Institute of Education Sciences, U.S. Department of Education. Washington, DC.
For ordering information on this report, write to U.S. Department of Education ED Pubs P.O. Box 1398 Jessup, MD 20794-1398
or call toll free 1-877-4ED-Pubs or order online at http://www.edpubs.org.
Content Contact Aurora D’Amico (202) 502-7334 aurora.d’[email protected]

iii
Executive Summary
In the 2003–04 academic year, approximately 4 million students enrolled in postsecondary education institutions for the first time. A sample of these students were selected to be interviewed during or just after their first year in 2004 and interviewed again in 2006 as part of the Beginning Postsecondary Students Longitudinal Study (BPS:04/06). This report describes the background and characteristics of these beginning postsecondary students, some of their experiences while enrolled, and their persistence and completion of any programs of study in the 3 years after they had first enrolled.
Data and Methods
The 2004/06 Beginning Postsecondary Students Longitudinal Study (BPS:04/06) collected information from a sample of about 19,000 undergraduates who enrolled in about 1,300 postsecondary institutions for the first time between July 1, 2003, and June 30, 2004. These students were interviewed in 2004 as part of the National Postsecondary Student Aid Study (NPSAS:04) and were then interviewed again in 2006. The BPS:04/06 study includes first-year data about the students that were collected in NPSAS:04, as well as data collected in 2006 about their experiences after the first year of enrollment. The BPS:04/06 sample represents those first-time undergraduates enrolled in postsecondary institutions in the United States and Puerto Rico that participate in the federal Title IV student aid programs. Additional information about the
sample design is available in appendix B of this report.
The estimates presented in this report were produced using the BPS:04/06 Data Analysis System (DAS). The analysis uses standard t tests to determine the statistical significance of differences between estimates. All differences noted are statistically significant at the p < .05 level. For more information on statistical methods, see appendix B. The findings presented here are descriptive. Although associations are noted and discussed, no causal inferences should be made.
Types of Institutions Attended
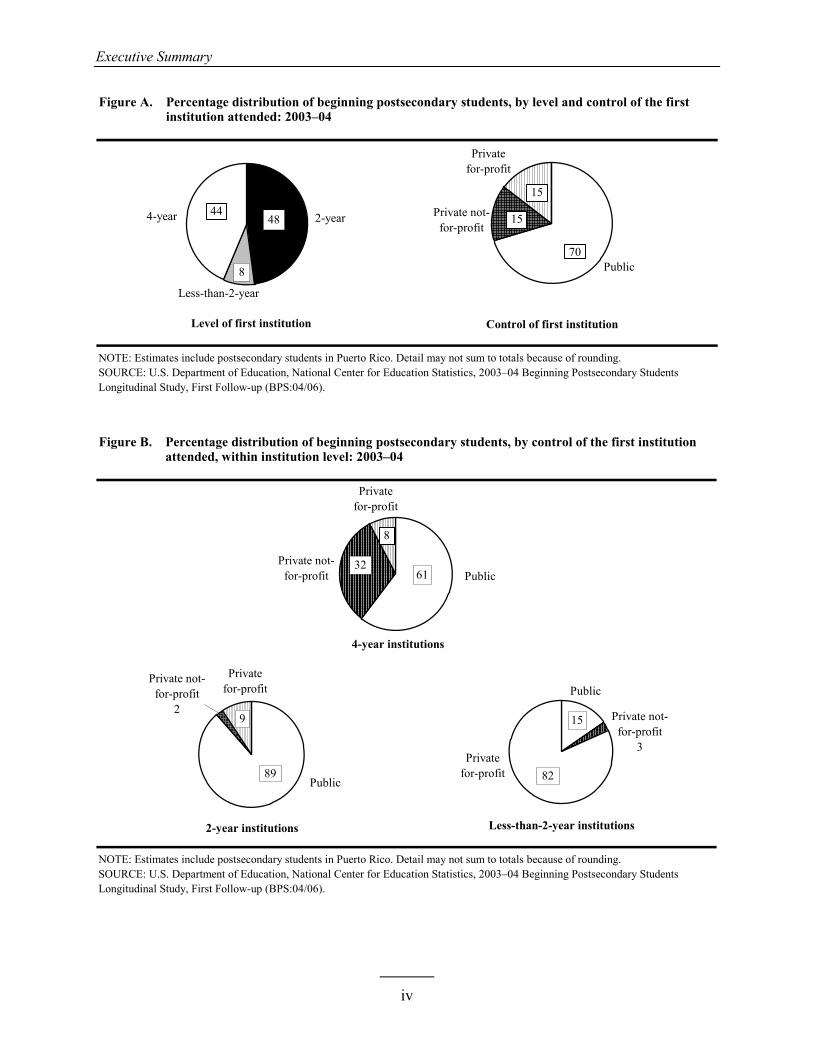
About one-half (48 percent) of the first-time students in 2003–04 began at a 2-year institution, 44 percent began at a 4-year institution, and 8 percent began at a less-than-2-year institution (figure A). Seventy percent of the students started at public institutions, 15 percent started at private not-for-profit institutions, and 15 percent started at private for-profit institutions.
When looking within levels of institutions, 89 percent of the beginners at 2-year institutions were first enrolled in public 2-year institutions (usually called “community colleges”), and 82 percent of the beginners at less-than-2-year institutions were first enrolled in private for-profit institutions (figure B). At the 4-year institutions, 61 percent of the beginners were first enrolled in public 4-year institutions, 32 percent in private not-for-profit
Executive Summary
iv
Figure B.—Percentage distribution of beginning postsecondary students, by control of the first institution Figure B.—attended, within institution level: 2003–04
NOTE: Estimates include postsecondary students in Puerto Rico. Detail may not sum to totals because of rounding.SOURCE: U.S. Department of Education, National Center for Education Statistics, 2003–04 Beginning Postsecondary Students Longitudinal Study, First Follow-up (BPS:04/06).
Privatefor-profit
3261
Less-than-2-year institutions
Privatefor-profit 82
15
2-year institutions
Privatefor-profit
89
9
Private not-for-profit
2
Public
Public
Public
8
4-year institutions
Private not-for-profit
Private not-for-profit
3
Figure A.—Percentage distribution of beginning postsecondary students, by level and control of the first Figure A.—institution attended: 2003–04
NOTE: Estimates include postsecondary students in Puerto Rico. Detail may not sum to totals because of rounding.SOURCE: U.S. Department of Education, National Center for Education Statistics, 2003–04 Beginning Postsecondary Students Longitudinal Study, First Follow-up (BPS:04/06).
Public
Control of first institution
2-year4-year
8
48
Level of first institution
70
15
15
Less-than-2-year
44
Privatefor-profit
Private not-for-profit

Executive Summary
v
institutions, and 8 percent in private for-profit institutions.
Degree Plans
In 2004, during or just after their first year of enrollment, beginning postsecondary students were asked about their degree plans. Forty percent said that they were working on a bachelor’s degree, 36 percent on an associate’s degree, and 13 percent on a certificate in a vocational program; 10 percent said that they were not working on any particular degree (table A). At the less-than-2-year institutions, 89 percent of the beginners planned to get a certificate. At the 2-year institutions, 64 percent of the beginners planned to get an associate’s degree, and about 10 percent each planned to get either a certificate or a bachelor’s degree (by transferring to a 4-year
institution). At public and private not-for-profit 4-year institutions, 84 percent of the beginners were planning to complete a bachelor’s degree, but at the private for-profit 4-year institutions, 57 percent were working on an associate’s degree and 39 percent were working on a bachelor’s degree.
Student Characteristics
The background characteristics of the beginning postsecondary students varied with the level of the first institution they attended. About two-thirds (66 percent) of the 2003–04 beginning students were 19 years or younger when they started (table B). Among those who started at 4-year institutions, 85 percent were in this age group, as were about one-half (54 percent) at the 2-year institutions and about one-third (32 percent) at the less-than-2-year institutions.
Table A.—Percentage distribution of beginning postsecondary students’ first-year degree plans, by level of Table A.—first institution and control of first 4-year institution attended: 2003–04
Level and control of first institution None Certificate Associate’s degree Bachelor’s degree
Total 10.4 13.2 36.3 40.0
Level of first institution4-year 5.6 1.9 11.6 80.92-year 16.2 10.4 63.6 9.8Less-than-2-year 1.6 89.2 8.0 1.3
Control of first 4-year institutionPublic 4-year 6.8 1.7 7.0 84.4Private not-for-profit 4-year 4.6 1.9 9.2 84.4Private for-profit 4-year 0.6 3.0 57.2 39.2
NOTE: Estimates include postsecondary students in Puerto Rico. Detail may not sum to totals because of rounding.SOURCE: U.S. Department of Education, National Center for Education Statistics, 2003–04 Beginning Postsecondary Students Longitudinal Study, First Follow-up (BPS:04/06).

Executive Summary
vi
For financial aid purposes, students are classified as “dependent” on their parents for financial support, or financially “independent.” Students under age 24 are assumed to be dependent, unless they are married or have dependents of their own (usually children) or meet some other less common criteria; all students age 24 or older are assumed to be financially independent. Seventy-one percent of all beginning students were dependent (table C). The percentage of beginning students who were dependent ranged
from 89 percent at 4-year institutions, to 61 percent at 2-year institutions, to 36 percent at less-than-2-year institutions.
One-fourth of the dependent beginning students came from families with annual incomes below $32,000 (table D). The percentage of dependent beginning students with family incomes below $32,000 was 20 percent at 4-year institutions, 28 percent at 2-year institutions, and 65 percent at less-than-2-year institutions.
Table C.—Percentage distribution of beginning postsecondary students’ dependency and marital status in Table C.—the first year enrolled, by level of first institution attended: 2003–04
Single, no children Single, no children Single parent MarriedLevel of first institution (dependent) (independent) (independent) (independent)
Total 70.9 7.1 10.5 11.5
Level of first institution4-year 88.6 3.5 4.2 3.72-year 60.9 9.4 12.8 16.8Less-than-2-year 36.1 12.2 30.5 21.2
NOTE: Estimates include postsecondary students in Puerto Rico. Detail may not sum to totals because of rounding.SOURCE: U.S. Department of Education, National Center for Education Statistics, 2003–04 Beginning Postsecondary Students Longitudinal Study, First Follow-up (BPS:04/06).
Table B.—Percentage distribution of beginning postsecondary students’ age in the first year enrolled, by Table B.—level of first institution attended: 2003–04
18 years 30 yearsLevel of first institution or younger 19 years 20–23 years 24–29 years or older
Total 42.6 23.4 12.8 7.9 13.3
Level of first institution4-year 58.0 27.4 6.5 3.5 4.52-year 32.9 21.4 17.0 9.8 18.9Less-than-2-year 18.0 13.9 22.0 19.4 26.6
NOTE: Estimates include postsecondary students in Puerto Rico. Detail may not sum to totals because of rounding.SOURCE: U.S. Department of Education, National Center for Education Statistics, 2003–04 Beginning Postsecondary Students Longitudinal Study, First Follow-up (BPS:04/06).

Executive Summary
vii
Academic Preparation
Because the information about high school academic preparation in BPS:04/06 is incomplete for older students who have been out of high school for more than 5 years, it is only reported for beginners who were under age 24 when they began postsecondary education in 2003–04 (about 80 percent of all beginners) (table 1.7).
Among the students under age 24 who began at 4-year institutions, about one-half (47 percent) reported a high school grade point average (GPA)
of 3.5 or higher, compared with 17 percent of the beginners at 2-year institutions (table E). One measure of the rigor of the courses taken in high school is the highest level of mathematics taken. Among students under age 24 who started at 4-year institutions, about one-fourth (27 percent) reported taking calculus in high school; 6 percent reported taking only courses below algebra II. Among beginners under age 24 starting at 2-year institutions, 5 percent reported taking calculus and one-fourth (25 percent) reported taking only courses below algebra II (table F).
Table E.—For beginning postsecondary students under age 24, percentage distribution of their high school Table E.—grade point average (GPA), by level of first institution attended: 2003–04
Level of first institution Below 3.0 3.0–3.4 3.5–4.0
Total 31.7 35.7 32.6
Level of first institution4-year 17.7 35.1 47.22-year 46.2 36.8 17.0Less-than-2-year 57.2 32.6 10.2
NOTE: Grades are self-reported and only include students with a regular high school diploma. Estimates include postsecondary students in Puerto Rico. Detail may not sum to totals because of rounding.SOURCE: U.S. Department of Education, National Center for Education Statistics, 2003–04 Beginning Postsecondary Students Longitudinal Study, First Follow-up (BPS:04/06).
Table D.—Percentage distribution of dependent beginning postsecondary students’ annual family income, by Table D.—level of first institution attended: 2003–04
Level of first institution Less than $32,000 $32,000–59,999 $60,000–91,999 $92,000 or more
Total 25.1 26.7 24.9 23.3
Level of first institution4-year 19.7 24.5 26.1 29.72-year 28.2 29.9 25.3 16.6Less-than-2-year 64.7 24.6 6.4 4.3
NOTE: Estimates include postsecondary students in Puerto Rico. Detail may not sum to totals because of rounding.SOURCE: U.S. Department of Education, National Center for Education Statistics, 2003–04 Beginning Postsecondary Students Longitudinal Study, First Follow-up (BPS:04/06).

Executive Summary
viii
About 90 percent of beginners had regular high
school diplomas, but the percentage who did not varied by institution type (compendium table 2.1). Four percent of students who began at 4-year institutions, 13 percent who began at 2-year institutions, and 25 percent who began at less-than-2-year institutions did so without a regular high school diploma.
Among beginning students under age 24, about one-fifth reported that they had earned Advanced Placement Test college credits which were accepted by their institution (19 percent) or that they had earned college credits for courses taken at a college while in high school (21 percent) (table 10).
Retention and Attainment at the First Institution Attended
The 3-year period covered in this report is too brief to determine whether students who had not attained a certificate or degree and were no longer enrolled anywhere in June 2006 had permanently left postsecondary education. Some beginning students may “stop out” by leaving an institution for a semester or more, and then return to that or a different institution later. Students who have “stopped out” can only be identified as such after
they have returned, which may be after the 3-year period of this study. When the term “left” is used in this report, it only refers to the enrollment status of the student at the end of the 3-year period, and includes some “stop-outs” who cannot be identified until later.
Institutions usually measure student retention as the percentage of beginners still enrolled in the fall term of each year after they first started. The figures below for 3-year retention at the first institution show the percentage of the 2003–04 beginners who were not enrolled at any time in 2005–06 and also those who were enrolled only in the fall of 2005.
Less-than-2-year institutions offer certificates in vocational fields that can be completed in less than 2 years of full-time enrollment. About one-half (52 percent) of the students beginning at a less-than-2-year institution in 2003–04 had attained a certificate by 2006 at the same institution where they had started (figure C). Five percent of the beginners at less-than-2-year institutions were still enrolled at the same institution without completing a certificate in June 2006; 3 percent were last enrolled there in the fall of 2005; and 35 percent left the institution without completing a certificate and were not enrolled
Table F.—For beginning postsecondary students under age 24, percentage distribution of the highest level of Table F.—mathematics courses taken in high school, by level of first institution attended: 2003–04
Level of first institution Below Algebra II Algebra II Trigonometry Pre-calculus Calculus
Total 15.7 30.4 17.6 19.9 16.3
Level of first institution4-year 6.3 20.2 19.4 27.0 27.12-year 24.9 40.2 16.0 13.4 5.5Less-than-2-year 29.5 46.7 14.2 6.8 2.8
NOTE: Courses are self-reported. Estimates include postsecondary students in Puerto Rico. Detail may not sum to totals because of rounding.SOURCE: U.S. Department of Education, National Center for Education Statistics, 2003–04 Beginning Postsecondary Students Longitudinal Study, First Follow-up (BPS:04/06).

Executive Summary
ix
anywhere in 2005–06. Five percent had transferred to a different institution without a certificate.
Two-year institutions offer associate’s degree programs, which can normally be completed in 2 years of full-time enrollment, and may also offer certificates in vocational programs. Sixteen percent of the 2003–04 beginning students at 2-year institutions had attained a certificate (6 percent) or associate’s degree (10 percent) within 3 years at the institution where they had first enrolled (table 5.1). Twenty-four percent of the beginners were still enrolled at the same institution without completing a degree in June 2006; 7 percent were last enrolled there in the fall of 2005; and 35 percent had left the institution before completing a degree and were
not enrolled anywhere during the 2005–06 academic year. Eighteen percent had left the institution without a degree and transferred elsewhere during the 3-year period.
Four-year institutions offer bachelor’s degrees, which can usually be completed in 4 years of full-time enrollment, but may also offer associate’s degree and certificate programs. Two percent of the beginners at 4-year institutions completed a bachelor’s degree in 3 years and 4 percent completed an associate’s degree or a certificate at the institution where they had started (table 5.1). Sixty percent were still enrolled at the same institution without a degree in June 2006; 4 percent were last enrolled in the fall of 2005; and 13 percent had left the institution and were not enrolled
Figure C.—Retention and attainment at the first institution attended after 3 years among students who Figure C.—began in 2003–04, by level of first institution attended
Figure 2-B.—
NOTE: The term “degree” includes certificates in vocational programs. Estimates include postsecondary students in Puerto Rico. Detail may not sum to totals because of rounding.SOURCE: U.S. Department of Education, National Center for Education Statistics, 2003–04 Beginning Postsecondary Students Longitudinal Study, First Follow-up (BPS:04/06).
Level of first institution attended in 2003–04
52
16
35 35
13
2460
0
20
40
60
80
100
Less-than-2-year 2-year 4-year
Percent
No degree, not enrolledin June 2006, last enrolledprior to 2005–06
No degree, not enrolledin June 2006, lastenrolled in fall 2005
No degree,transferred fromfirst institution
No degree, still enrolledat first institutionin June 2006
Attained degree orcertificate at firstinstitution by June 2006
Status in 2005–06:
55
3 7
4
18
18
6
35 35
13

Executive Summary
x
anywhere during the 2005–06 academic year. Eighteen percent had left the 4-year institution where they had started and transferred to a different institution before completing any program.
Persistence and Attainment Anywhere
In this report, the term retention is used to refer to the experience of the beginning postsecondary students after 3 years at the institution where they first enrolled. From the perspective of the institution where they started, students are retained if they are still enrolled at that institution or have attained a degree or
certificate there. The figures below compare the 3-year retention at the first institution, which includes students last enrolled in the fall of 2005, to the 3-year persistence of the same students anywhere in the spring of 2006. The students enrolled only in the fall term at the first institution are included among those not enrolled anywhere in June 2006.
Among students beginning at a 2-year institution, 35 percent left the institution without completing a program before the 2005–06 academic year and did not enroll anywhere else; 7 percent were last enrolled in the fall of 2005; and 18 percent transferred elsewhere without a degree (figure D).
Figure D.—Retention at the first institution attended and persistence anywhere after 3 years among Figure D.—students who began at 2-year institutions in 2003–04
NOTE: The term “degree” includes certificates. Estimates include postsecondary students in Puerto Rico. Detail may not sum to totals because of rounding.SOURCE: U.S. Department of Education, National Center for Education Statistics, 2003–04 Beginning Postsecondary Students Longitudinal Study, First Follow-up (BPS:04/06).
3545
1816
37
24
0
20
40
60
80
100
Retention at the first institution after 3 years
Student persistence at any institution after 3 years
Percent
No degree, notenrolled anywherein June 2006No degree, not enrolled inJune 2006, last enrolledprior to 2005–06No degree, not enrolledin June 2006, lastenrolled in fall 2005No degree,transferred fromfirst institutionNo degree,still enrolledin June 2006Attaineddegree orcertificate
(3)
(13)
(2)
Status in 2005–06:
Transfers
18
7
(7)
(35)
4535
Executive Summary
xi
By June 2006, 45 percent of the students who started at a 2-year institution had not attained any degree and were not enrolled anywhere; this proportion includes the students who transferred and then left the second institution, as well as those last enrolled in the fall of 2005. Eighteen percent had attained a degree or certificate, and 37 percent were still enrolled without a degree, either at the first institution or at the transfer institution.
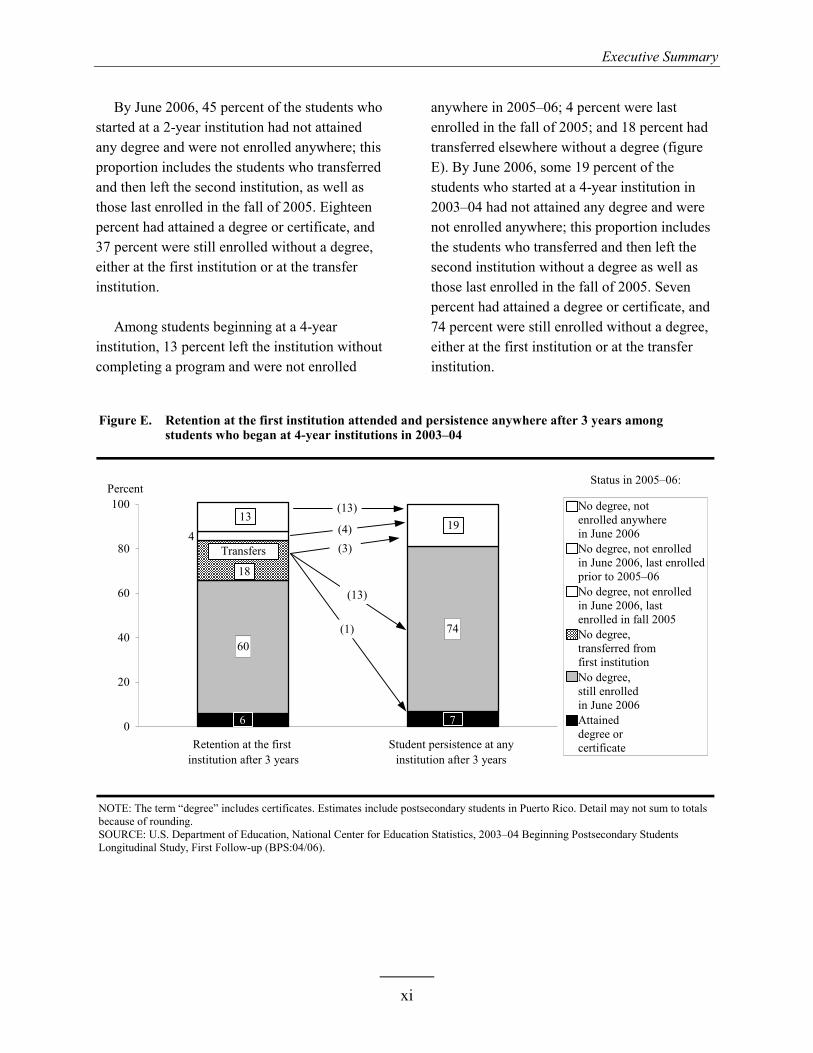
Among students beginning at a 4-year institution, 13 percent left the institution without completing a program and were not enrolled
anywhere in 2005–06; 4 percent were last enrolled in the fall of 2005; and 18 percent had transferred elsewhere without a degree (figure E). By June 2006, some 19 percent of the students who started at a 4-year institution in 2003–04 had not attained any degree and were not enrolled anywhere; this proportion includes the students who transferred and then left the second institution without a degree as well as those last enrolled in the fall of 2005. Seven percent had attained a degree or certificate, and 74 percent were still enrolled without a degree, either at the first institution or at the transfer institution.
Figure E.—Retention at the first institution attended and persistence anywhere after 3 years among Figure E.—students who began at 4-year institutions in 2003–04
NOTE: The term “degree” includes certificates. Estimates include postsecondary students in Puerto Rico. Detail may not sum to totals because of rounding.SOURCE: U.S. Department of Education, National Center for Education Statistics, 2003–04 Beginning Postsecondary Students Longitudinal Study, First Follow-up (BPS:04/06).
6074
1319
4
0
20
40
60
80
100
Retention at the first institution after 3 years
Student persistence at any institution after 3 years
PercentNo degree, notenrolled anywherein June 2006No degree, not enrolledin June 2006, last enrolledprior to 2005–06No degree, not enrolledin June 2006, lastenrolled in fall 2005No degree,transferred fromfirst institutionNo degree,still enrolledin June 2006Attaineddegree orcertificate
(3)
(13)
(1)
Status in 2005–06:
Transfers
18
6 7
(4)
(13)19
13

Executive Summary
xii
Some student characteristics associated with persistence and attainment include program type, enrollment intensity, dependency status, and employment while enrolled. In 2005–06, students in certificate programs had higher rates of completion than those in associate’s degree programs; students who were enrolled full time completed degrees at higher rates than those enrolled part time; and independent students had higher completion rates than dependent students, although larger percentages of dependent than independent students were still enrolled. Students who worked full time left postsecondary education without completion at higher rates and remained enrolled at lower rates than those who did not work or worked part time.
Summary
Most of the first-time students who began at 4-year institutions in 2003–04 were young (85 percent were age 19 or younger) and financially dependent on their parents. Among those under age 24, nearly all (94 percent) had taken algebra II or higher mathematics courses in high school, and about one-fourth had taken calculus. About one-half had a high school GPA of 3.5 or higher. Eighteen percent of students who began at 4-year institutions in 2003–04 transferred
from the institution where they started. After 3 years, 81 percent were either still enrolled in postsecondary education or had attained a degree or certificate.
About one-half (46 percent) of the students beginning at 2-year institutions in 2003–04 were age 20 or older when they started, and 39 percent were financially independent. Among those under age 24, one-fourth had not taken algebra II or higher high school mathematics, and about one-half had a high school GPA below 3.0. Eighteen percent transferred from the 2-year institution where they had started without a degree. After 3 years, 55 percent had either attained a certificate or degree (18 percent) or were still enrolled without a degree at some postsecondary institution (37 percent).
About two-thirds (68 percent) of the students beginning at less-than-2-year institutions in 2003–04 were age 20 or older when they started, and about two-thirds (64 percent) were financially independent. Among those under age 24, about one-half had a high school GPA below 3.0. Within 3 years, about one-half (52 percent) of the students starting at a less-than-2-year institution had completed a certificate program from that institution.
xiii
Foreword
This report provides a description of the student characteristics, persistence, and degree attainment of a nationally representative sample of students who began postsecondary education for the first time during the 2003–04 academic year. The report describes the background, academic preparation, and experience of these beginning students over 3 academic years, from July 2003 to June 2006, and provides information about rates of program completion, transfer, and attrition for students who first enrolled at various types of postsecondary institutions using data from the 2004/06 Beginning Postsecondary Students Longitudinal Study (BPS:04/06). The BPS survey is the longitudinal component of the 2003–04 National Postsecondary Student Aid Study (NPSAS:04), a nationally representative sample that includes students enrolled in all types of postsecondary institutions. The BPS:04/06 cohort consists of students in the NPSAS:04 sample who were identified as having enrolled in postsecondary education for the first time during the 2003–04 academic year. These beginning students were initially interviewed in 2004, at the end of their first year in postsecondary education, and then interviewed again in 2006, some 3 years after they had started.
The estimates presented in the report were produced using the NCES Data Analysis System (DAS), a web-based software application that enables users to specify and generate tables for most of the postsecondary surveys conducted by NCES. The DAS produces the design-adjusted standard errors necessary for testing the statistical significance of differences in the estimates. The DAS for BPS:04/06 is available on the NCES website (http://nces.ed.gov/das). For more information on the DAS, see appendix B of this report.
xiv
Acknowledgments
The 2004/06 Beginning Postsecondary Students Longitudinal Study was conducted by RTI International and MPR Associates for the National Center of Education Statistics (NCES). Jennifer Wine of RTI was responsible for the overall direction and management of the project. Others at RTI who made major contributions were Jeff Franklin for student interviews, Joe Simpson for data processing, Melissa Cominole for instrument development, Theresa Gilligan, Donna Anderson, and Kristin Dudley for the data files, Sara Wheeless for weights, and Darryl Creel for imputations. Sara Wheeless, Marcinda Mason, and Lesa Caves prepared the methodological appendix for this report.
At MPR, Shirley He, Stephen Lew, and Joanna Wu wrote the programs for the derived variables and prepared the documentation for the Data Analysis System files. Vicky Dingler, Terry Lew, and John Vavricka created the Data Analysis System files. Barbara Kridl was responsible for the production of the report; Alicia Broadway formatted the tables and the text of the report; Rosa Van prepared the glossary; and Andrea Livingston and Emily Forrest Cataldi edited the text.
The report was also reviewed by Jacqueline King (American Council on Education), Catherine Millett (Educational Testing Service), and Tammy Halligan (Career College Association) who provided many useful comments and suggestions for revisions.
xv
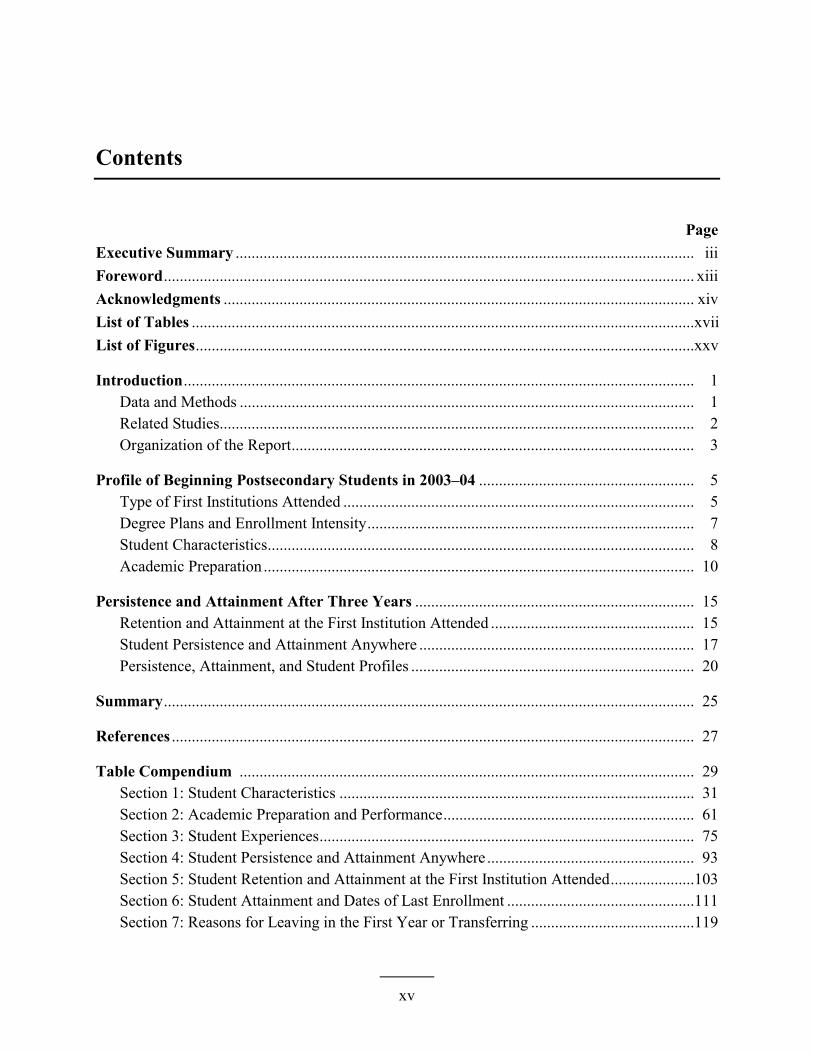
Contents
Page Executive Summary ................................................................................................................... iii Foreword..................................................................................................................................... xiii Acknowledgments ...................................................................................................................... xiv List of Tables ..............................................................................................................................xvii List of Figures.............................................................................................................................xxv
Introduction................................................................................................................................ 1 Data and Methods .................................................................................................................. 1 Related Studies....................................................................................................................... 2 Organization of the Report..................................................................................................... 3
Profile of Beginning Postsecondary Students in 2003–04 ...................................................... 5 Type of First Institutions Attended ........................................................................................ 5 Degree Plans and Enrollment Intensity.................................................................................. 7 Student Characteristics........................................................................................................... 8 Academic Preparation ............................................................................................................ 10
Persistence and Attainment After Three Years ...................................................................... 15 Retention and Attainment at the First Institution Attended ................................................... 15 Student Persistence and Attainment Anywhere ..................................................................... 17 Persistence, Attainment, and Student Profiles ....................................................................... 20
Summary..................................................................................................................................... 25
References ................................................................................................................................... 27
Table Compendium .................................................................................................................. 29 Section 1: Student Characteristics ......................................................................................... 31 Section 2: Academic Preparation and Performance............................................................... 61 Section 3: Student Experiences.............................................................................................. 75 Section 4: Student Persistence and Attainment Anywhere .................................................... 93 Section 5: Student Retention and Attainment at the First Institution Attended.....................103 Section 6: Student Attainment and Dates of Last Enrollment ...............................................111 Section 7: Reasons for Leaving in the First Year or Transferring .........................................119
Contents
xvi
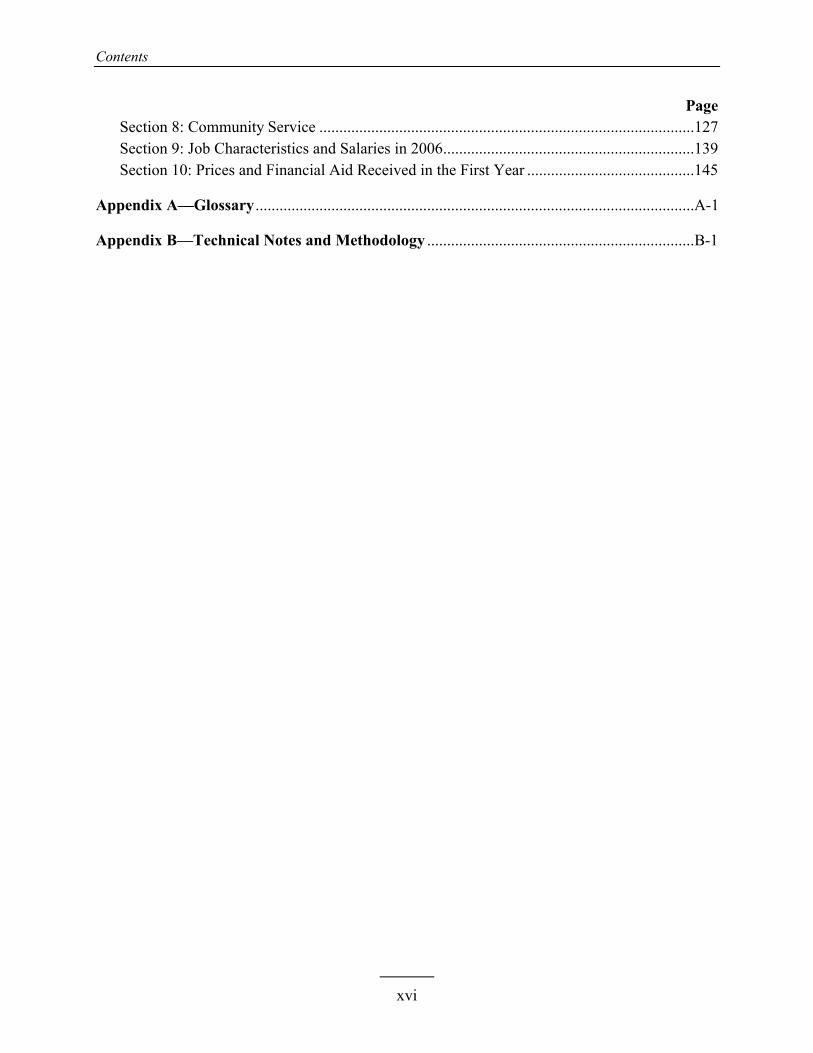
Page Section 8: Community Service ..............................................................................................127 Section 9: Job Characteristics and Salaries in 2006...............................................................139 Section 10: Prices and Financial Aid Received in the First Year ..........................................145
Appendix A—Glossary ..............................................................................................................A-1
Appendix B—Technical Notes and Methodology ................................................................... B-1
xvii
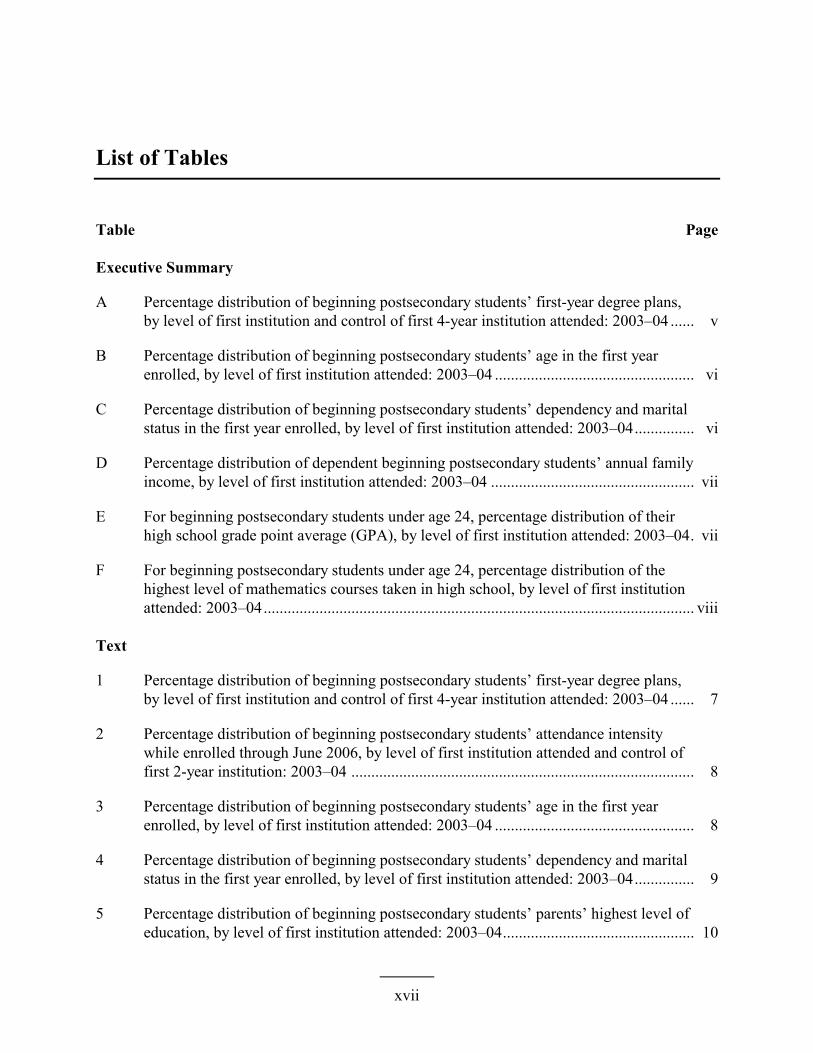
List of Tables
Table Page Executive Summary
A Percentage distribution of beginning postsecondary students’ first-year degree plans, by level of first institution and control of first 4-year institution attended: 2003–04 ...... v
B Percentage distribution of beginning postsecondary students’ age in the first year enrolled, by level of first institution attended: 2003–04 .................................................. vi
C Percentage distribution of beginning postsecondary students’ dependency and marital status in the first year enrolled, by level of first institution attended: 2003–04............... vi
D Percentage distribution of dependent beginning postsecondary students’ annual family income, by level of first institution attended: 2003–04 ................................................... vii
E For beginning postsecondary students under age 24, percentage distribution of their high school grade point average (GPA), by level of first institution attended: 2003–04. vii
F For beginning postsecondary students under age 24, percentage distribution of the highest level of mathematics courses taken in high school, by level of first institution attended: 2003–04............................................................................................................ viii
Text
1 Percentage distribution of beginning postsecondary students’ first-year degree plans, by level of first institution and control of first 4-year institution attended: 2003–04 ...... 7
2 Percentage distribution of beginning postsecondary students’ attendance intensity while enrolled through June 2006, by level of first institution attended and control of first 2-year institution: 2003–04 ...................................................................................... 8
3 Percentage distribution of beginning postsecondary students’ age in the first year enrolled, by level of first institution attended: 2003–04 .................................................. 8
4 Percentage distribution of beginning postsecondary students’ dependency and marital status in the first year enrolled, by level of first institution attended: 2003–04............... 9
5 Percentage distribution of beginning postsecondary students’ parents’ highest level of education, by level of first institution attended: 2003–04................................................ 10
List of Tables
xviii
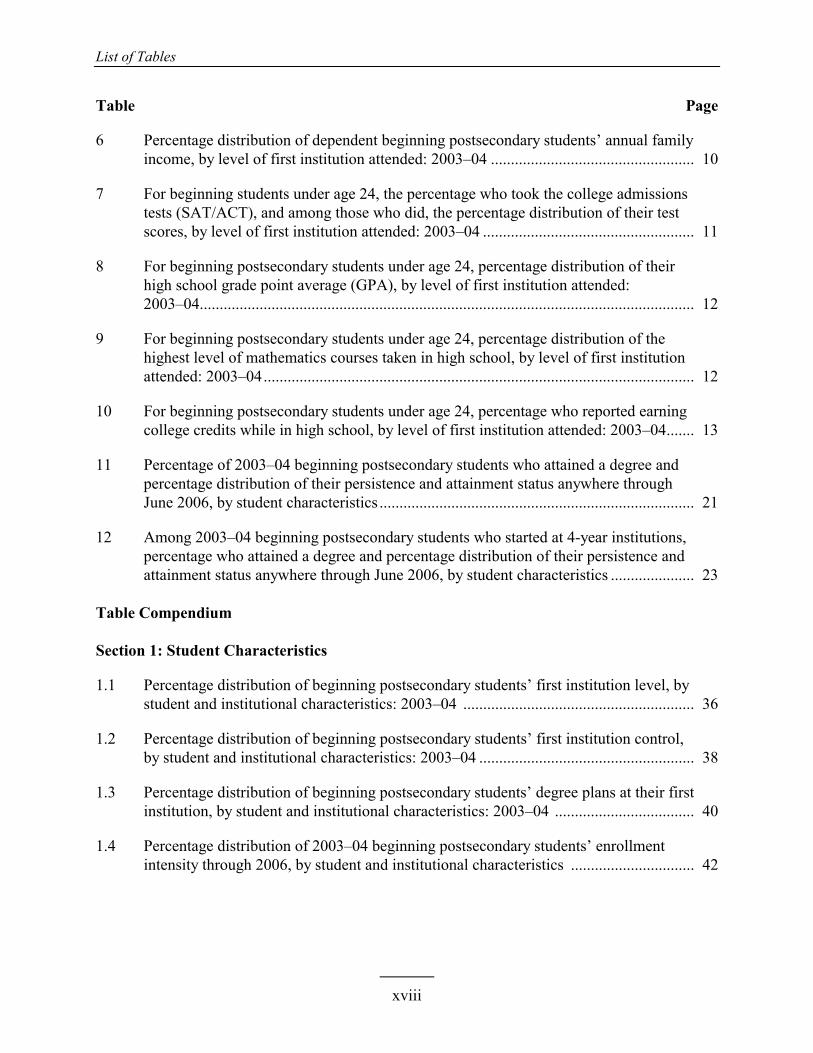
Table Page
6 Percentage distribution of dependent beginning postsecondary students’ annual family income, by level of first institution attended: 2003–04 ................................................... 10
7 For beginning students under age 24, the percentage who took the college admissions tests (SAT/ACT), and among those who did, the percentage distribution of their test scores, by level of first institution attended: 2003–04 ..................................................... 11
8 For beginning postsecondary students under age 24, percentage distribution of their high school grade point average (GPA), by level of first institution attended: 2003–04............................................................................................................................ 12
9 For beginning postsecondary students under age 24, percentage distribution of the highest level of mathematics courses taken in high school, by level of first institution attended: 2003–04............................................................................................................ 12
10 For beginning postsecondary students under age 24, percentage who reported earning college credits while in high school, by level of first institution attended: 2003–04....... 13
11 Percentage of 2003–04 beginning postsecondary students who attained a degree and percentage distribution of their persistence and attainment status anywhere through June 2006, by student characteristics ............................................................................... 21
12 Among 2003–04 beginning postsecondary students who started at 4-year institutions, percentage who attained a degree and percentage distribution of their persistence and attainment status anywhere through June 2006, by student characteristics ..................... 23
Table Compendium Section 1: Student Characteristics
1.1 Percentage distribution of beginning postsecondary students’ first institution level, by student and institutional characteristics: 2003–04 .......................................................... 36
1.2 Percentage distribution of beginning postsecondary students’ first institution control, by student and institutional characteristics: 2003–04 ...................................................... 38
1.3 Percentage distribution of beginning postsecondary students’ degree plans at their first institution, by student and institutional characteristics: 2003–04 ................................... 40
1.4 Percentage distribution of 2003–04 beginning postsecondary students’ enrollment intensity through 2006, by student and institutional characteristics ............................... 42

List of Tables
xix
Table Page
1.5 Percentage distribution of the degree plans of beginning postsecondary students who were recent (2003) high school graduates, by fall 2003 enrollment intensity and student and institutional characteristics: 2003–04 ........................................................... 44
1.6 Percentage distribution of beginning postsecondary students’ gender and the percentage reporting a disability, by student and institutional characteristics: 2003–04............................................................................................................................ 46
1.7 Percentage distribution of beginning postsecondary students’ age, by student and institutional characteristics: 2003–04 .............................................................................. 48
1.8 Percentage distribution of beginning postsecondary students’ race/ethnicity, by student and institutional characteristics: 2003–04 ........................................................... 50
1.9 Percentage distribution of beginning postsecondary students’ dependency and marital status, by student and institutional characteristics: 2003–04 ........................................... 52
1.10 Percentage distribution of beginning postsecondary students’ parents’ highest education level, by student and institutional characteristics: 2003–04............................ 54
1.11 Percentage distribution of dependent beginning postsecondary students’ family income, by student and institutional characteristics: 2003–04 ........................................ 56
1.12 Percentage distribution of beginning postsecondary students’ attendance pattern in their first year, by student and institutional characteristics: 2003–04.............................. 58
Section 2: Academic Preparation and Performance
2.1 Percentage distribution of beginning postsecondary students’ high school diploma status, by type of high school and student and institutional characteristics: 2003–04..... 64
2.2 For beginning postsecondary students under age 24, percentage distribution of their high school grade point average (GPA), by student and institutional characteristics: 2003–04............................................................................................................................ 66
2.3 For beginning postsecondary students under age 24, percentage distribution of the highest level of high school mathematics taken, by student and institutional characteristics: 2003–04................................................................................................... 68
2.4 For beginning postsecondary students under age 24, percentage with advanced placement and college credits, by student and institutional characteristics: 2003–04..... 70
2.5 For beginning postsecondary students under age 24, percentage who took college admission tests (ACT or SAT) and among those who did, percentage distribution of their admission test score rank, by student and institutional characteristics: 2003–04.... 72
List of Tables
xx
Table Page Section 3: Student Experiences
3.1 Among beginning postsecondary students who started at 4-year institutions, percentage distribution of the frequency with which they had graduate student instructors in their first year, by student and institutional characteristics: 2003–04........ 78
3.2 Among beginning postsecondary students who started at 4-year institutions, percentage distribution of the frequency with which they had essay exams in their first year, by student and institutional characteristics: 2003–04.............................................. 79
3.3 Among beginning postsecondary students who began at 4-year institutions, percentage distribution of the frequency with which they had large lecture classes in their first year, by student and institutional characteristics: 2003–04.............................. 80
3.4 Among beginning postsecondary students who began at 4-year institutions, percentage distribution of the frequency with which they wrote papers in their first year, by student and institutional characteristics: 2003–04.............................................. 81
3.5 Among beginning postsecondary students who started at 2- or 4-year institutions, percentage distribution of the frequency with which they had informal contact with faculty in their first year, by student and institutional characteristics: 2003–04.............. 82
3.6 Among beginning postsecondary students who started at 2- or 4-year institutions, percentage distribution of the frequency with which they talked with faculty about academic matters outside of class in their first year, by student and institutional characteristics: 2003–04................................................................................................... 83
3.7 Among beginning postsecondary students who started at 2- or 4-year institutions, percentage distribution of the frequency with which they met with an advisor in their first year, by student and institutional characteristics: 2003–04 ...................................... 84
3.8 Among beginning postsecondary students who started at 2- or 4-year institutions, percentage distribution of the frequency with which they attended fine arts activities in their first year, by student and institutional characteristics: 2003–04.......................... 85
3.9 Among beginning postsecondary students who started at 2- or 4-year institutions, percentage distribution of the frequency with which they participated in school clubs in their first year, by student and institutional characteristics: 2003–04.......................... 86
3.10 Among beginning postsecondary students who started at 2- or 4-year institutions, percentage distribution of the frequency with which they participated in sports in their first year, by student and institutional characteristics: 2003–04 ...................................... 87

List of Tables
xxi
Table Page
3.11 Among beginning postsecondary students who started at 2- or 4-year institutions, percentage distribution of the frequency with which they attended study groups in their first year, by student and institutional characteristics: 2003–04.............................. 88
3.12 Percentage of beginning postsecondary students who reported taking various types of courses in their first year, by student and institutional characteristics: 2003–04............. 89
3.13 Percentage of 2003–04 beginning postsecondary students who reported various academic experiences, by student and institutional characteristics: 2006 ....................... 91
Section 4: Student Persistence and Attainment Anywhere
4.1 Percentage of 2003–04 beginning postsecondary students who attained a degree and percentage distribution of their persistence and attainment status anywhere through June 2006, by student and institutional characteristics .................................................... 96
4.2 Among 2003–04 beginning postsecondary students who started at public 2-year institutions, percentage who attained a degree and percentage distribution of their persistence and attainment status anywhere through June 2006, by student and institutional characteristics............................................................................................... 98
4.3 Among 2003–04 beginning postsecondary students who started at 4-year institutions, percentage who attained a degree and percentage distribution of their persistence and attainment status anywhere through June 2006, by student and institutional characteristics...................................................................................................................100
Section 5: Student Persistence and Attainment at Their First Institution
5.1 Percentage distribution of 2003–04 beginning postsecondary students by degree attainment and retention status at their first institution through June 2006, by student and institutional characteristics........................................................................................105
5.2 Among 2003–04 beginning postsecondary students who started at public 2-year institutions, percentage distribution by attainment and retention status at their first institution through June 2006, by student and institutional characteristics .....................107
5.3 Among 2003–04 beginning postsecondary students who started at 4-year institutions, percentage distribution by attainment and retention status at their first institution through June 2006, by student and institutional characteristics.......................................109
List of Tables
xxii
Table Page Section 6: Student Attainment and Dates of Last Enrollment
6.1 Percentage of 2003–04 beginning postsecondary students who attained a degree by June 2006 and, for students who did not attain, last year enrolled, by student and institutional characteristics...............................................................................................113
6.2 Among 2003–04 beginning postsecondary students who started at public 2-year institutions, percentage who attained a degree by June 2006 and, for students who did not attain, last year enrolled, by student and institutional characteristics ........................115
6.3 Among 2003–04 beginning postsecondary students who started at 4-year institutions, percentage who attained a degree by June 2006 and, for students who did not attain, last year enrolled, by student and institutional characteristics .........................................117
Section 7: Reasons for Leaving in the First Year or Transferring
7.1 Percentage of 2003–04 beginning postsecondary students who reported various reasons for leaving in 2004 without completing, by student and institutional characteristics ..................................................................................................................121
7.2 Percentage of 2003–04 beginning postsecondary students who reported various reasons for transferring from their first institution, by student and institutional characteristics: 2006.........................................................................................................124
Section 8: Community Service
8.1 Percentage of beginning postsecondary students who reported that they had participated in community service in the last year, and among those who had, amount and type of service, by student and institutional characteristics: 2003–04 ......................128
8.2 Percentage of 2003–04 beginning postsecondary students who reported that they had participated in community service in the last year, and among those who had, amount and of type of service, by student and institutional characteristics: 2006........................132
8.3 Among 2003–04 beginning postsecondary students who had participated in community service in the last year, percentage who reported various benefits and effects of their community service, by student and institutional characteristics: 2006....136
Section 9: Job Characteristics and Salaries in 2006
9.1 Among 2003–04 beginning postsecondary students who were employed and not enrolled in 2006, percentage who reported various characteristics of their jobs, by student and institutional characteristics ...........................................................................140

List of Tables
xxiii
Table Page
9.2 Median annual salaries of 2003–04 beginning postsecondary students who were employed and not enrolled in 2006, by student and institutional characteristics.............142
Section 10: Prices and Financial Aid Received in the First Year
10.1 Among beginning postsecondary students, average tuition, average price of attendance, and percentage who received any financial aid, any grants, or any student loans and the average amounts received, by type of institution and selected student characteristics: 2003–04...................................................................................................147
10.2 Percentage of beginning postsecondary students who received Federal Pell, state, institutional, or merit-only grants and the average amounts received, by type of institution and selected student characteristics: 2003–04 ................................................149
10.3 Among full-time/full-year beginning postsecondary students, average tuition, price of attendance, and percentage who received any financial aid, grants, and loans and the average amounts received, by type of institution and selected student characteristics: 2003–04............................................................................................................................151
10.4 Percentage of full-time/full-year beginning postsecondary students who received Federal Pell, state, institutional, or merit-only grants and the average amounts received, by type of institution and selected student characteristics: 2003–04................153
Appendix
B-1 Numbers of NPSAS:04 sampled, eligible, and participating institutions and enrollment list participation rates, by type of institution: 2004 ....................................... B-5
B-2 Numbers of NPSAS:04 sampled and eligible students and response rates, by type of institution and student type: 2004 .................................................................................... B-7
B-3 Distribution of BPS:04/06 full-scale sample, by base-year response status: 2004 ........ B-10
B-4 BPS:04/06 sample allocation for NPSAS:04 student interview: 2004 .......................... B-11
B-5 Allocation of ineligible and final eligible BPS:04/06 sample members by interview status: 2006 .................................................................................................................... B-12
B-6 Summary of BPS:04/06 weight components: 2006 ....................................................... B-16
B-7 Summary of institution nonresponse bias analysis for all institutions, by type of institution: 2006 ............................................................................................................ B-19
B-8 Comparison of BPS:04/06 respondents and nonrespondents, by characteristics: 2006................................................................................................................................ B-22
List of Tables
xxiv
Table Page
B-9 Summary of student nonresponse bias for all students, by type of institution: 2006..... B-24
B-10 Item-level nonresponse for variables included in the Descriptive Report with greater than 15 percent item nonresponse: 2006........................................................................ B-25
B-11 Standard errors for 1.3: Percentage distribution of beginning postsecondary students’ degree plans at their first institution, by student and institutional characteristics: 2003–04.......................................................................................................................... B-27

xxv
List of Figures
Figures Page Executive Summary
A Percentage distribution of beginning postsecondary students, by level and control of the first institution attended: 2003–04 ............................................................................. iv
B Percentage distribution of beginning postsecondary students, by control of the first institution attended, within institution level: 2003–04 .................................................... iv
C Retention and attainment at the first institution attended after 3 years among students who began in 2003–04, by level of first institution attended........................................... ix
D Retention at the first institution attended and persistence anywhere after 3 years among students who began at 2-year institutions in 2003–04 ......................................... x
E Retention at the first institution attended and persistence anywhere after 3 years among students who began at 4-year institutions in 2003–04 ......................................... xi
Text
1 Percentage distribution of beginning postsecondary students, by level and control of the first institution attended: 2003–04 ............................................................................. 5
2 Percentage distribution of beginning postsecondary students, by control of the first institution attended, within institution level: 2003–04 .................................................... 6
3 Retention and attainment at the first institution attended after 3 years among students who began in 2003–04, by level of first institution attended........................................... 16
4 Retention at the first institution attended and persistence anywhere after 3 years among students who began at 4-year institutions in 2003–04 ......................................... 18
5 Retention at the first institution attended and persistence anywhere after 3 years among students who began at 2-year institutions in 2003–04 ......................................... 19
6 Retention at the first institution attended and persistence anywhere after 3 years among students who began at less-than-2-year institutions in 2003–04.......................... 20

THIS PAGE INTENTIONALLY LEFT BLANK
1
Introduction
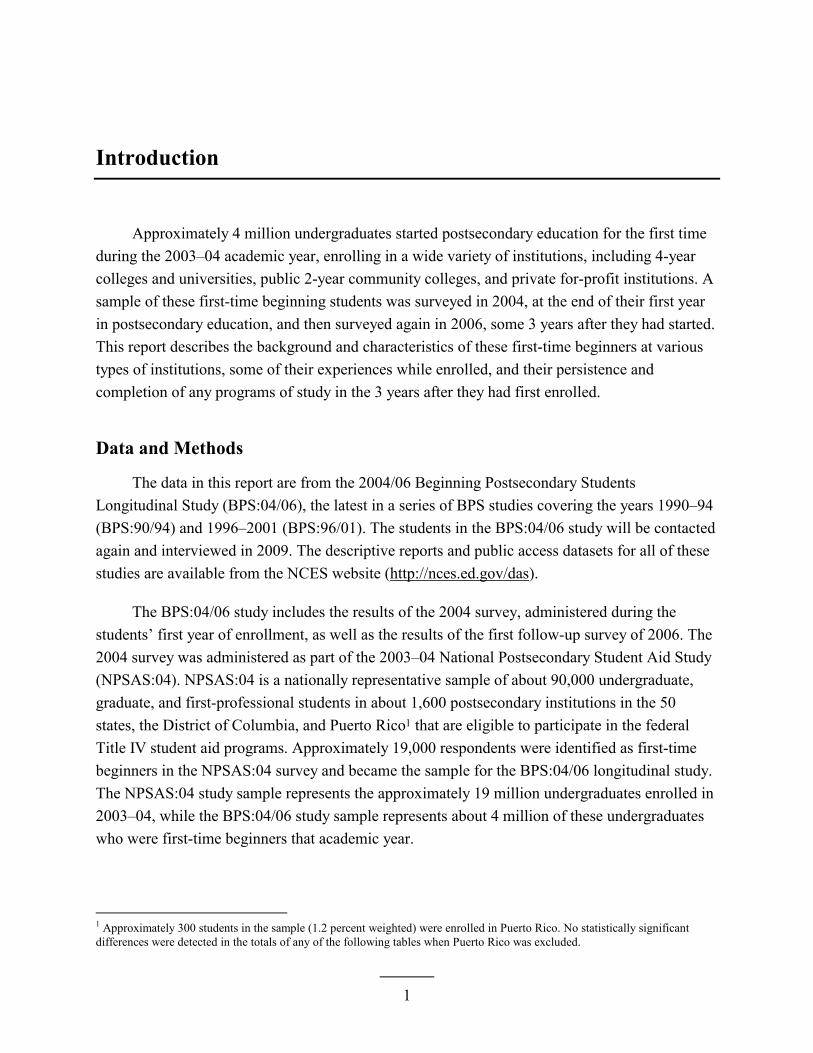
Approximately 4 million undergraduates started postsecondary education for the first time during the 2003–04 academic year, enrolling in a wide variety of institutions, including 4-year colleges and universities, public 2-year community colleges, and private for-profit institutions. A sample of these first-time beginning students was surveyed in 2004, at the end of their first year in postsecondary education, and then surveyed again in 2006, some 3 years after they had started. This report describes the background and characteristics of these first-time beginners at various types of institutions, some of their experiences while enrolled, and their persistence and completion of any programs of study in the 3 years after they had first enrolled.
Data and Methods
The data in this report are from the 2004/06 Beginning Postsecondary Students Longitudinal Study (BPS:04/06), the latest in a series of BPS studies covering the years 1990–94 (BPS:90/94) and 1996–2001 (BPS:96/01). The students in the BPS:04/06 study will be contacted again and interviewed in 2009. The descriptive reports and public access datasets for all of these studies are available from the NCES website (http://nces.ed.gov/das).
The BPS:04/06 study includes the results of the 2004 survey, administered during the students’ first year of enrollment, as well as the results of the first follow-up survey of 2006. The 2004 survey was administered as part of the 2003–04 National Postsecondary Student Aid Study (NPSAS:04). NPSAS:04 is a nationally representative sample of about 90,000 undergraduate, graduate, and first-professional students in about 1,600 postsecondary institutions in the 50 states, the District of Columbia, and Puerto Rico1 that are eligible to participate in the federal Title IV student aid programs. Approximately 19,000 respondents were identified as first-time beginners in the NPSAS:04 survey and became the sample for the BPS:04/06 longitudinal study. The NPSAS:04 study sample represents the approximately 19 million undergraduates enrolled in 2003–04, while the BPS:04/06 study sample represents about 4 million of these undergraduates who were first-time beginners that academic year.
1 Approximately 300 students in the sample (1.2 percent weighted) were enrolled in Puerto Rico. No statistically significant differences were detected in the totals of any of the following tables when Puerto Rico was excluded.
Introduction
2
The estimates presented in this report were produced using the BPS:04/06 Data Analysis System (DAS). A glossary describing the variables in the DAS that were used to produce the tables is provided in appendix A. All comparisons made in the Selected Findings were tested using Student’s t statistic, and all differences cited were statistically significant at the .05 level. Standard errors for estimates in this report are available at http://nces.ed.gov/das/library/reports.asp. The findings presented here are entirely descriptive in nature. Although associations are noted and discussed, these associations do not support causal inferences.
The information about the BPS students in their first year comes from the NPSAS:04 study, which is based on a wide variety of sources such as institutional records, federal financial aid applications, federal student loan and Pell grant records, and a student interview. The information about the BPS students in 2006 is primarily based on the follow-up student interview, supplemented with data from the same federal databases, college admissions test agencies, and the National Student Clearinghouse enrollment records. The student interviews in both years were a web-based questionnaire that was either self-administered or conducted via telephone with a trained interviewer. In 2006 about 15,000 students completed the interview, resulting in a weighted response rate of 77 percent. The technical notes in appendix B supply additional information about response rates, the methodology of the data collection, file preparation, and analysis.
Related Studies
The standard works on college student retention are by Tinto (1993) and Astin (1993). More recently, Pascarella and Terenzini (2005) have provided a comprehensive review of a decade of research on the persistence and attainment of college students. The literature which they summarize has shown that higher rates of student persistence and degree attainment are associated with the following student characteristics: academic achievement in high school, immediate entry into college after high school, full-time and continuous enrollment while in college, academic and social engagement with faculty and peers, working part time for less than 15 hours a week while enrolled, and beginning at a 4-year institution instead of a 2-year community college. Lower rates of persistence and attainment are associated with delayed entry into college after high school, weak academic preparation, part-time enrollment and interruptions in enrollment continuity, low levels of interaction with faculty and little participation in school activities, working more than 15 hours a week while enrolled, and beginning at a 2-year community college.
Introduction
3
Pascarella and Terenzini (2005) also review the research on the relationship of parental education and family income to student persistence. Student persistence in college is positively associated with higher levels of parental education; students whose parents attended college are more likely to go to college and to complete a degree. Persistence is also positively associated with family income, but financial aid enhances the persistence and degree completion of low-income students. The recent literature by economists examining the complex relationship of persistence to financial aid, family income, parental education, and academic preparation has been reviewed by Long (2007).
The first study in the Beginning Postsecondary Students series followed a cohort of students beginning postsecondary education in 1989–90 through their fifth year in 1994 (Berkner, Cuccaro-Alamin, and McCormick 1996). The second BPS study was based on a cohort of students beginning in 1995–96. The characteristics of these students in their first year were described by Kojaku and Nunes (1998) and their 3-year persistence and attainment was described by Berkner, Horn, and Clune (2000). These two reports provide information about the 1995–96 beginning students that is comparable to the information presented in this report about the 2003–04 beginning students.
The persistence and degree completion rates of the 1995–96 cohort after 6 years is described in Berkner, He and Cataldi (2002). The persistence and attainment rates of the 1989–90 and the 1995–96 cohorts of beginning students are compared in Horn and Berger (2004). Adelman (2006) analyses the BPS data in relation to the college enrollment experience and completion rates of a cohort of students who were in the eighth grade in 1988. Choy (2002) provides a summary of the results of the NCES studies on students that is written for a general audience.
Organization of the Report
This report describes some of the findings from the BPS:04/06 survey data that was recently released by NCES. The report has two purposes: (1) to present an overview of the characteristics of students who began postsecondary education for the first time in 2003–04 and their enrollment patterns during the 3 years after they first enrolled, and (2) to provide a reference tool for federal and state policymakers, postsecondary associations, college administrators, and others looking for detailed information based on national data about first-time students and their experience in postsecondary education.
The report is divided into two parts. The first part is a narrative that presents a profile of the demographic characteristics of students who began postsecondary education in 2003–04, their

Introduction
4
academic preparation, and their enrollment patterns during the 3 years after they first enrolled. The focus of the narrative is to show the differences in the backgrounds and enrollment persistence of students who started at either 4-year, 2-year, or less-than-2-year institutions in 2003–04. The student enrollment and attainment patterns are described both in terms of retention at the first institution attended and as persistence anywhere in postsecondary education.
The second part of the report is a table compendium that provides more detail about the topics discussed in the narrative. The compendium also includes tables and summaries of findings on a variety of other topics of interest that are covered in the BPS:04/06 survey. These topics include faculty contact, distance education and remedial courses, academic performance and experiences, reasons for leaving a college, participation in community service, job characteristics and salaries of those no longer enrolled, and financial aid received during the first year of enrollment. Each section of the compendium includes highlights of some of the important findings shown in the tables.
The variables selected for the rows in the tables describe institutional and student characteristics associated with persistence, such as the type of first institution attended, degree plans, enrollment intensity, age, gender, race/ethnicity, dependency status, family income, parental level of education, recent high school graduation, high school mathematics courses, and admissions test scores.

5
Profile of Beginning Postsecondary Students in 2003–04
Type of First Institutions Attended
About one-half (48 percent) of the first-time students began at a 2-year institution, 44 percent began at a 4-year institution, and 8 percent began at a less-than-2-year institution (figure 1). Seventy percent of the beginners started at public institutions, 15 percent started at private not-for-profit institutions, and 15 percent started at private for-profit institutions. In the BPS:96/98 study, which described first-time students in 1995–96, 73 percent began in public institutions, 16 percent in private not-for-profit institutions, and 11 percent in private for-profit institutions (Berkner, Horn, and Clune 2000, table 6.2b).
Less-than-2-year institutions offer certificates or other awards below associate’s degrees in vocational programs. About 82 percent of the beginners at less-than-2-year institutions were first
Figure 1.—Percentage distribution of beginning postsecondary students, by level and control of the first Figure 1.—institution attended: 2003–04
NOTE: Estimates include postsecondary students in Puerto Rico. Detail may not sum to totals because of rounding.SOURCE: U.S. Department of Education, National Center for Education Statistics, 2003–04 Beginning Postsecondary Students Longitudinal Study, First Follow-up (BPS:04/06).
2-year4-year 44
8
48
Level of first institution
Public
Control of first institution
70
15
15
Less-than-2-year
Privatefor-profit
Private not-for-profit

Profile of Beginning Postsecondary Students in 2003–04
6
enrolled in private for-profit institutions (figure 2). Two-year institutions offer associate’s degree as well as certificate programs. About 89 percent of the beginners at 2-year institutions were first enrolled in public 2-year institutions, which are usually called community colleges. Four-year institutions offer bachelor’s degree programs for undergraduates, but may also offer associate’s degrees and certificates. About 61 percent of the beginners at 4-year institutions were first enrolled in public institutions, 32 percent in private not-for-profit institutions, and 8 percent in private for-profit institutions. Among those who were first-time beginners in 1995–96, 63 percent of the beginners at 4-year institutions were enrolled in public, 36 percent in private-not-for-profit, and 1 percent in private for-profit institutions (Berkner, Horn, and Clune 2000, table 6.2b).
Figure 2.—Percentage distribution of beginning postsecondary students, by control of the first institution Figure 2.—attended, within institution level: 2003–04
NOTE: Estimates include postsecondary students in Puerto Rico. Detail may not sum to totals because of rounding.SOURCE: U.S. Department of Education, National Center for Education Statistics, 2003–04 Beginning Postsecondary Students Longitudinal Study, First Follow-up (BPS:04/06).
4-year institutions
Private for-profit
Private not-for-profit
32 61
Less-than-2-year institutions
Private not-for-profit
3
Privatefor-profit 82
15
2-year institutions
Privatefor-profit
89
9
Private not-for-profit
2
Public
Public
8
Public

Profile of Beginning Postsecondary Students in 2003–04
7
Degree Plans and Enrollment Intensity
In 2004, during or just after their first year of enrollment, students were asked what degree they were working on. Forty percent said that they planned to get a bachelor’s degree, 36 percent an associate’s degree, 13 percent a certificate in a vocational program, and 10 percent were not planning to get any particular degree (table 1). At the less-than-2-year institutions, 89 percent of the beginners planned to get a certificate. At the 2-year institutions 64 percent of the beginners planned to get an associate’s degree, and about 10 percent each planned to get either a certificate or a bachelor’s degree (by transferring to a 4-year institution). At the public and the private not-for-profit 4-year institutions, 84 percent of the beginners were planning to complete a bachelor’s degree, but at the private for-profit 4-year institutions 39 percent planned to complete a bachelor’s degree and 57 percent planned to complete an associate’s degree.
Completion of a program in the normal time assumes that the student is enrolled full time. About three-fourths of the beginners at 4-year and less-than-2-year institutions always attended full time while they were enrolled (table 2). At public 2-year institutions, 36 percent were always enrolled full time and 27 percent were always enrolled part time. At private for-profit 2-year institutions, 84 percent were always enrolled full time and 3 percent were always enrolled part time.
Table 1.—Percentage distribution of beginning postsecondary students’ first-year degree plans, by level of Table 1.—first institution and control of first 4-year institution attended: 2003–04
Level and Associate’s Bachelor’scontrol of institution None Certificate degree degree
Total 10.4 13.2 36.3 40.0
Level of first institution4-year 5.6 1.9 11.6 80.92-year 16.2 10.4 63.6 9.8Less-than-2-year 1.6 89.2 8.0 1.3
Control of first 4-year institutionPublic 4-year 6.8 1.7 7.0 84.4Private not-for-profit 4-year 4.6 1.9 9.2 84.4Private for-profit 4-year 0.6 3.0 57.2 39.2
NOTE: Estimates include postsecondary students in Puerto Rico. Detail may not sum to totals because of rounding.SOURCE: U.S. Department of Education, National Center for Education Statistics, 2003–04 Beginning Postsecondary Students Longitudinal Study, First Follow-up (BPS:04/06).

Profile of Beginning Postsecondary Students in 2003–04
8
Student Characteristics
About two-thirds (66 percent) of the 2003–04 beginning students were age 19 or younger when they started (table 3). Among those who started at 4-year institutions, 85 percent were 19 or younger, at the 2-year institutions about one-half (54 percent) were 19 or younger, and at the less-than-2-year institutions about one-third (32 percent) were 19 or younger.
Table 2.—Percentage distribution of beginning postsecondary students’ attendance intensity while enrolled Table 2.—through June 2006, by level of first institution attended and control of first 2-year institution:Table 2.—2003–04
Level and control of institution Always full-time Mixed Always part-time
Total 59.5 26.9 13.5
Level of first institution4-year 76.8 20.2 3.02-year 41.1 34.7 24.2Less-than-2-year 75.3 17.2 7.5
Control of first 2-year institutionPublic 2-year 35.9 37.3 26.8Private not-for-profit 2-year 71.4 20.3 8.3Private for-profit 2-year 83.8 13.2 3.0
NOTE: Estimates include postsecondary students in Puerto Rico. Detail may not sum to totals because of rounding.SOURCE: U.S. Department of Education, National Center for Education Statistics, 2003–04 Beginning Postsecondary Students Longitudinal Study, First Follow-up (BPS:04/06).
Table 3.—Percentage distribution of beginning postsecondary students’ age in the first year enrolled, by Table 3.—level of first institution attended: 2003–04
Level of 18 years 30 yearsfirst institution or younger 19 years 20–23 years 24–29 years or older
Total 42.6 23.4 12.8 7.9 13.3
Level of first institution4-year 58.0 27.4 6.5 3.5 4.52-year 32.9 21.4 17.0 9.8 18.9Less-than-2-year 18.0 13.9 22.0 19.4 26.6
NOTE: Estimates include postsecondary students in Puerto Rico. Detail may not sum to totals because of rounding.SOURCE: U.S. Department of Education, National Center for Education Statistics, 2003–04 Beginning Postsecondary Students Longitudinal Study, First Follow-up (BPS:04/06).
Profile of Beginning Postsecondary Students in 2003–04
9
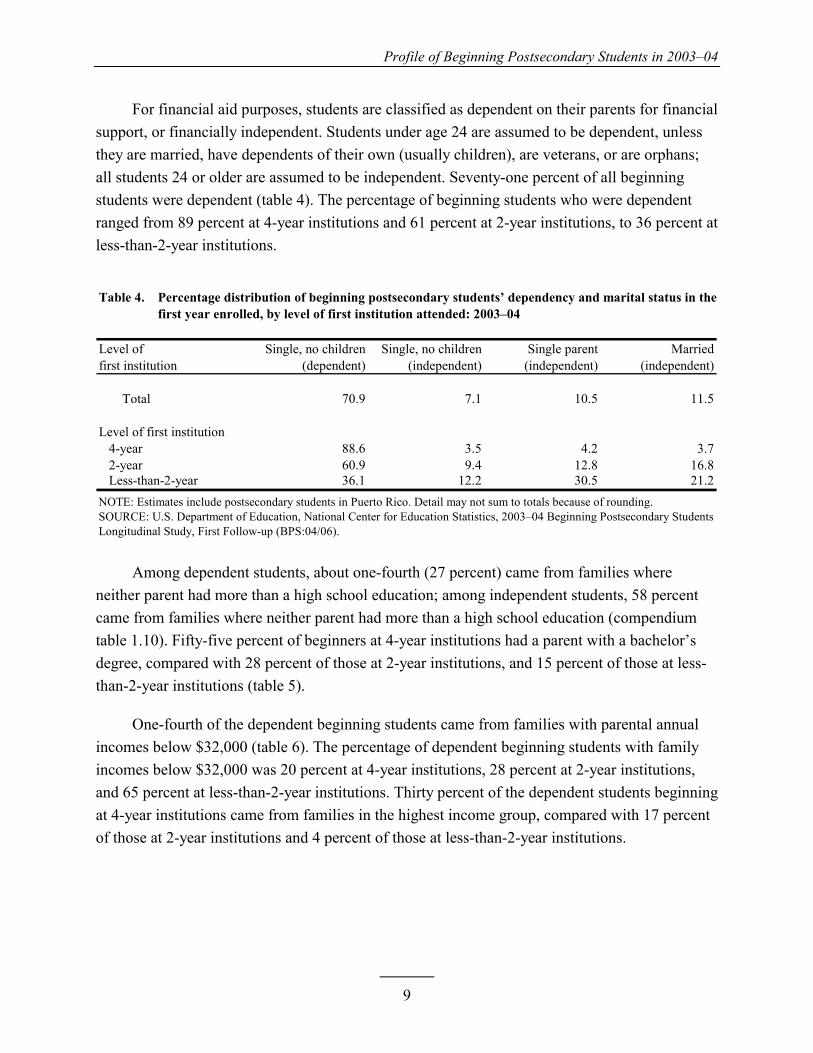
For financial aid purposes, students are classified as dependent on their parents for financial support, or financially independent. Students under age 24 are assumed to be dependent, unless they are married, have dependents of their own (usually children), are veterans, or are orphans; all students 24 or older are assumed to be independent. Seventy-one percent of all beginning students were dependent (table 4). The percentage of beginning students who were dependent ranged from 89 percent at 4-year institutions and 61 percent at 2-year institutions, to 36 percent at less-than-2-year institutions.
Among dependent students, about one-fourth (27 percent) came from families where
neither parent had more than a high school education; among independent students, 58 percent came from families where neither parent had more than a high school education (compendium table 1.10). Fifty-five percent of beginners at 4-year institutions had a parent with a bachelor’s degree, compared with 28 percent of those at 2-year institutions, and 15 percent of those at less-than-2-year institutions (table 5).
One-fourth of the dependent beginning students came from families with parental annual incomes below $32,000 (table 6). The percentage of dependent beginning students with family incomes below $32,000 was 20 percent at 4-year institutions, 28 percent at 2-year institutions, and 65 percent at less-than-2-year institutions. Thirty percent of the dependent students beginning at 4-year institutions came from families in the highest income group, compared with 17 percent of those at 2-year institutions and 4 percent of those at less-than-2-year institutions.
Table 4.—Percentage distribution of beginning postsecondary students’ dependency and marital status in the Table 4.—first year enrolled, by level of first institution attended: 2003–04
Level of Single, no children Single, no children Single parent Marriedfirst institution (dependent) (independent) (independent) (independent)
Total 70.9 7.1 10.5 11.5
Level of first institution4-year 88.6 3.5 4.2 3.72-year 60.9 9.4 12.8 16.8Less-than-2-year 36.1 12.2 30.5 21.2
NOTE: Estimates include postsecondary students in Puerto Rico. Detail may not sum to totals because of rounding.SOURCE: U.S. Department of Education, National Center for Education Statistics, 2003–04 Beginning Postsecondary Students Longitudinal Study, First Follow-up (BPS:04/06).

Profile of Beginning Postsecondary Students in 2003–04
10
Academic Preparation
Not all beginning students enter postsecondary education with the same level of academic preparation or performance, and this information is useful for understanding rates of persistence and attainment. For all beginning students, information is available on the type of high school credential they earned (if any) and the type of high school from which they graduated. For students under age 24 when they began their postsecondary education, information was usually available on their high school grade point average, the highest level of high school mathematics courses taken, any college credits they earned during high school, and their scores on college admission tests (ACT or SAT). This type of information is less relevant for older students who have been out of high school for a long time and were age 24 or older when they first started
Table 5.—Percentage distribution of beginning postsecondary students’ parents’ highest level of education, Table 5.—by level of first institution attended: 2003–04
Level of Some Bachelor’s degreefirst institution High school or less postsecondary or higher
Total 35.9 25.2 38.9
Level of first institution4-year 22.9 22.1 54.92-year 43.0 28.8 28.2Less-than-2-year 65.2 19.9 14.9
NOTE: Estimates include postsecondary students in Puerto Rico. Detail may not sum to totals because of rounding.SOURCE: U.S. Department of Education, National Center for Education Statistics, 2003–04 Beginning Postsecondary Students Longitudinal Study, First Follow-up (BPS:04/06).
Table 6.—Percentage distribution of dependent beginning postsecondary students’ annual family income, Table 6.—by level of first institution attended: 2003–04
Level offirst institution Less than $32,000 $32,000–59,999 $60,000–91,999 $92,000 or more
Total 25.1 26.7 24.9 23.3
Level of first institution4-year 19.7 24.5 26.1 29.72-year 28.2 29.9 25.3 16.6Less-than-2-year 64.7 24.6 6.4 4.3
NOTE: Estimates include postsecondary students in Puerto Rico. Detail may not sum to totals because of rounding.SOURCE: U.S. Department of Education, National Center for Education Statistics, 2003–04 Beginning Postsecondary Students Longitudinal Study, First Follow-up (BPS:04/06).
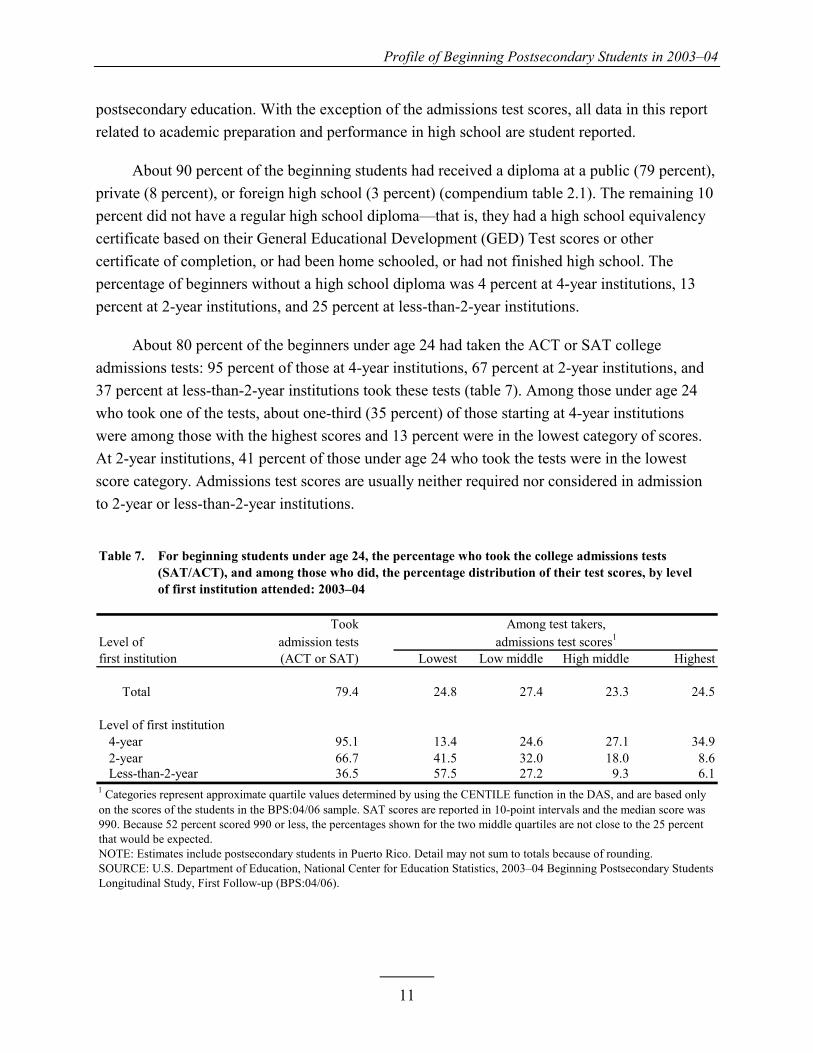
Profile of Beginning Postsecondary Students in 2003–04
11
postsecondary education. With the exception of the admissions test scores, all data in this report related to academic preparation and performance in high school are student reported.
About 90 percent of the beginning students had received a diploma at a public (79 percent), private (8 percent), or foreign high school (3 percent) (compendium table 2.1). The remaining 10 percent did not have a regular high school diploma—that is, they had a high school equivalency certificate based on their General Educational Development (GED) Test scores or other certificate of completion, or had been home schooled, or had not finished high school. The percentage of beginners without a high school diploma was 4 percent at 4-year institutions, 13 percent at 2-year institutions, and 25 percent at less-than-2-year institutions.
About 80 percent of the beginners under age 24 had taken the ACT or SAT college admissions tests: 95 percent of those at 4-year institutions, 67 percent at 2-year institutions, and 37 percent at less-than-2-year institutions took these tests (table 7). Among those under age 24 who took one of the tests, about one-third (35 percent) of those starting at 4-year institutions were among those with the highest scores and 13 percent were in the lowest category of scores. At 2-year institutions, 41 percent of those under age 24 who took the tests were in the lowest score category. Admissions test scores are usually neither required nor considered in admission to 2-year or less-than-2-year institutions.
Table 7.—For beginning students under age 24, the percentage who took the college admissions tests Table 7.—(SAT/ACT), and among those who did, the percentage distribution of their test scores, by level Table 7.—of first institution attended: 2003–04
TookLevel of admission testsfirst institution (ACT or SAT) Lowest Low middle High middle Highest
Total 79.4 24.8 27.4 23.3 24.5
Level of first institution4-year 95.1 13.4 24.6 27.1 34.92-year 66.7 41.5 32.0 18.0 8.6Less-than-2-year 36.5 57.5 27.2 9.3 6.1
1 Categories represent approximate quartile values determined by using the CENTILE function in the DAS, and are based onlyon the scores of the students in the BPS:04/06 sample. SAT scores are reported in 10-point intervals and the median score was 990. Because 52 percent scored 990 or less, the percentages shown for the two middle quartiles are not close to the 25 percent that would be expected.NOTE: Estimates include postsecondary students in Puerto Rico. Detail may not sum to totals because of rounding.SOURCE: U.S. Department of Education, National Center for Education Statistics, 2003–04 Beginning Postsecondary Students Longitudinal Study, First Follow-up (BPS:04/06).
Among test takers,admissions test scores1
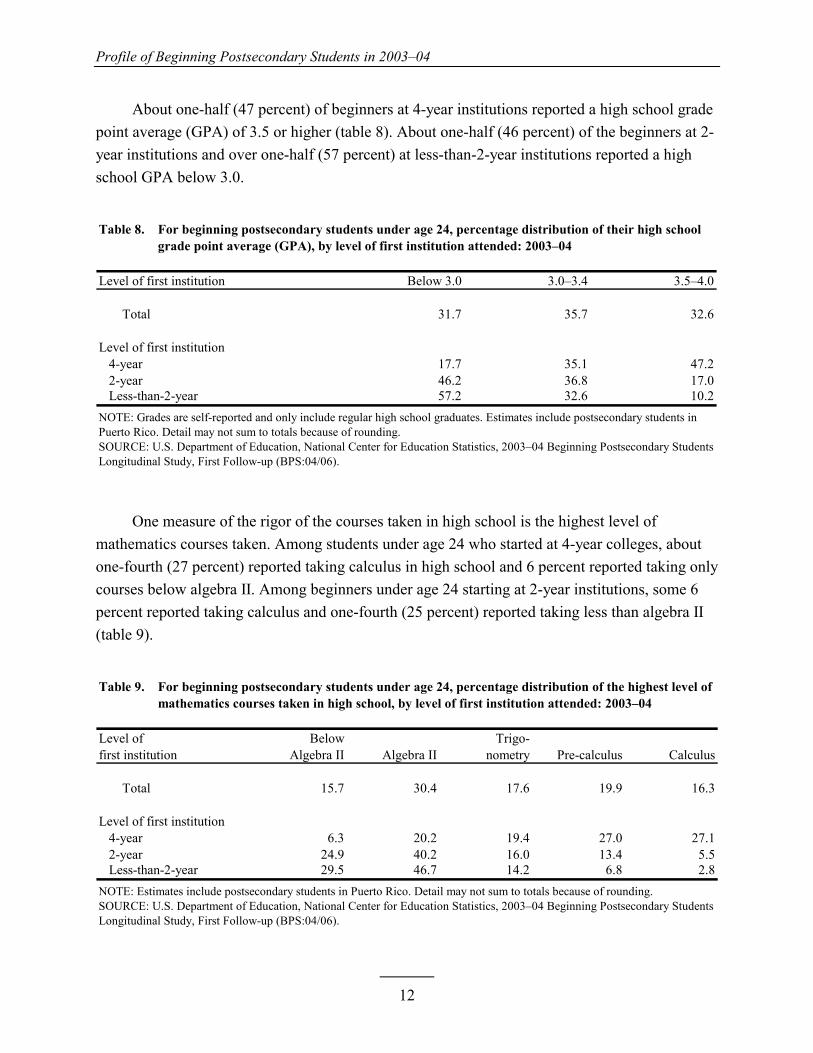
Profile of Beginning Postsecondary Students in 2003–04
12
About one-half (47 percent) of beginners at 4-year institutions reported a high school grade point average (GPA) of 3.5 or higher (table 8). About one-half (46 percent) of the beginners at 2-year institutions and over one-half (57 percent) at less-than-2-year institutions reported a high school GPA below 3.0.
One measure of the rigor of the courses taken in high school is the highest level of mathematics courses taken. Among students under age 24 who started at 4-year colleges, about one-fourth (27 percent) reported taking calculus in high school and 6 percent reported taking only courses below algebra II. Among beginners under age 24 starting at 2-year institutions, some 6 percent reported taking calculus and one-fourth (25 percent) reported taking less than algebra II (table 9).
Table 8.—For beginning postsecondary students under age 24, percentage distribution of their high school Table 8.—grade point average (GPA), by level of first institution attended: 2003–04
Level of first institution Below 3.0 3.0–3.4 3.5–4.0
Total 31.7 35.7 32.6
Level of first institution4-year 17.7 35.1 47.22-year 46.2 36.8 17.0Less-than-2-year 57.2 32.6 10.2
NOTE: Grades are self-reported and only include regular high school graduates. Estimates include postsecondary students in Puerto Rico. Detail may not sum to totals because of rounding.SOURCE: U.S. Department of Education, National Center for Education Statistics, 2003–04 Beginning Postsecondary Students Longitudinal Study, First Follow-up (BPS:04/06).
Table 9.—For beginning postsecondary students under age 24, percentage distribution of the highest level of Table 9.—mathematics courses taken in high school, by level of first institution attended: 2003–04
Level of Below Trigo-first institution Algebra II Algebra II nometry Pre-calculus Calculus
Total 15.7 30.4 17.6 19.9 16.3
Level of first institution4-year 6.3 20.2 19.4 27.0 27.12-year 24.9 40.2 16.0 13.4 5.5Less-than-2-year 29.5 46.7 14.2 6.8 2.8
NOTE: Estimates include postsecondary students in Puerto Rico. Detail may not sum to totals because of rounding.SOURCE: U.S. Department of Education, National Center for Education Statistics, 2003–04 Beginning Postsecondary Students Longitudinal Study, First Follow-up (BPS:04/06).
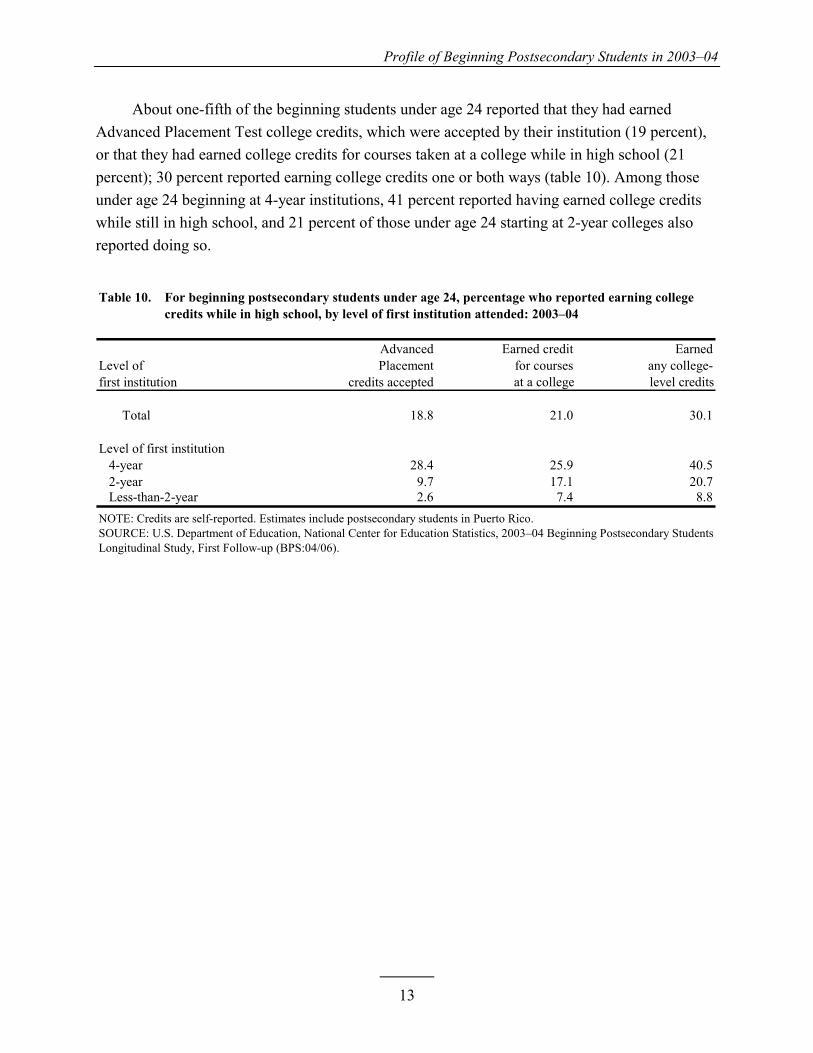
Profile of Beginning Postsecondary Students in 2003–04
13
About one-fifth of the beginning students under age 24 reported that they had earned Advanced Placement Test college credits, which were accepted by their institution (19 percent), or that they had earned college credits for courses taken at a college while in high school (21 percent); 30 percent reported earning college credits one or both ways (table 10). Among those under age 24 beginning at 4-year institutions, 41 percent reported having earned college credits while still in high school, and 21 percent of those under age 24 starting at 2-year colleges also reported doing so.
Table 10.—For beginning postsecondary students under age 24, percentage who reported earning college Table 10.—credits while in high school, by level of first institution attended: 2003–04
Advanced Earned credit EarnedLevel of Placement for courses any college-first institution credits accepted at a college level credits
Total 18.8 21.0 30.1
Level of first institution4-year 28.4 25.9 40.52-year 9.7 17.1 20.7Less-than-2-year 2.6 7.4 8.8
NOTE: Credits are self-reported. Estimates include postsecondary students in Puerto Rico.SOURCE: U.S. Department of Education, National Center for Education Statistics, 2003–04 Beginning Postsecondary Students Longitudinal Study, First Follow-up (BPS:04/06).

THIS PAGE INTENTIONALLY LEFT BLANK
15
Persistence and Attainment After 3 Years
Retention and Attainment at the First Institution Attended
The tables in this report present the information about beginning student enrollment and program completion from two different perspectives. One is from the perspective of the first institution attended. The first institution attended designates students as first-time beginners (or freshmen) and reports whether those students continue to be enrolled or complete a program at that institution. This perspective will be referred to as retention and attainment at the first institution attended. The other is from the perspective of the student. It looks at the beginning student’s enrollment history and degree attainment at any postsecondary institution over the 3-year period under consideration. This will be referred to as student persistence and attainment anywhere. The difference between these two perspectives reflects the fact that many students transfer out of the first institution attended. When beginning students leave the institution where they first enrolled and then enroll at a different institution, they continue to persist in postsecondary education, but from the perspective of the institution where they started, they have no longer been retained. Similarly, graduation rates reported by institutions do not include outcomes for students who have transferred elsewhere; this additional information requires a survey like the BPS study.
The normal length of time it takes for a full-time student to complete a program and attain a certificate or degree depends on the type of program. Vocational certificate programs normally take less than 2 years to complete, associate’s degree programs can be completed in 2 or 3 years, and bachelor’s degree programs can be completed in 4 or 5 years. The 3-year period covered in this report (from July 2003 to June 2006) is long enough for students beginning in 2003–04 to complete certificates and associate’s degrees, but too short for most students to complete bachelor’s degrees at 4-year colleges and universities.
The 3-year period covered in this report is also too short to determine whether students who had not attained a certificate or degree and were no longer enrolled anywhere in June 2006 had permanently left postsecondary education. Some beginning students may “stop out” by leaving an institution for a semester or more, and then returning to that or a different institution later. Students who have “stopped out” can only be identified as such after they have returned, which may be after the 3-year period of this study. When the term “left” is used in this report, it only

Persistence and Attainment After 3 Years
16
refers to the enrollment status of the student at the end of the 3-year period, and includes some “stop-outs” who cannot be identified until later.
Institutions usually measure student retention as the percentage of beginners still enrolled in the fall term of each year after they first started. The figures below for 3-year retention at the first institution show the percentage of the 2003–04 beginners who were not enrolled at any time in 2005–06 and also those who were enrolled only in the fall of 2005.
Less-than-2-year institutions offer certificates in vocational fields that can be completed in less than 2 years of full-time enrollment. About one-half (52 percent) of the students beginning at a less-than-2-year institution in 2003–04 had attained a certificate by 2006 at the same institution where they had started (figure 3). Five percent of the beginners at less-than-2-year institutions
Figure 3.—Retention and attainment at the first institution attended after 3 years among students who Figure 3.—began in 2003–04, by level of first institution attended
Figure 2-B.—
NOTE: Estimates include postsecondary students in Puerto Rico. Detail may not sum to totals because of rounding.SOURCE: U.S. Department of Education, National Center for Education Statistics, 2003–04 Beginning Postsecondary Students Longitudinal Study, First Follow-up (BPS:04/06).
Level of first institution attended in 2003–04
52
16
35
60
24
13
35
0
20
40
60
80
100
Less-than-2-year 2-year 4-year
Percent
No degree, not enrolled inJune 2006, last enrolledprior to 2005–06
No degree, not enrolledin June 2006, lastenrolled in fall 2005
No degree,transferred fromfirst institution
No degree, stillenrolled at firstinstitution in June 2006
Attained degree orcertificate at firstinstitution by June 2006
Status in 2005–06:
55
6
3 7
4
18
18
6
35 35
13

Persistence and Attainment After 3 Years
17
were still enrolled at the same institution without completing a certificate in June 2006; 3 percent were last enrolled there in the fall of 2005; and 35 percent left the institution without completing a certificate and were not enrolled anywhere in 2005–06. Five percent had transferred to a different institution without a certificate.
Two-year institutions offer associate’s degree programs, which can normally be completed in 2 years of full-time enrollment, and may also offer certificates in vocational programs. Sixteen percent of the 2003–04 beginning students at 2-year institutions had attained a certificate (6 percent) or associate’s degree (10 percent) within 3 years at the institution where they had first enrolled. Twenty-four percent of the beginners were still enrolled at the same institution without completing a degree or certificate in June 2006; 7 percent were last enrolled there in the fall of 2005; and 35 percent had left the institution before completing a degree or certificate and were not enrolled anywhere during the 2005–06 academic year. Eighteen percent had left the institution without a credential and transferred elsewhere during the 3-year period.
Four-year institutions offer bachelor’s degrees, which can usually be completed in 4 or 5 years of full-time enrollment, but may also offer associate’s degree and certificate programs. Two percent of the beginners at 4-year institutions completed a bachelor’s degree in 3 years and 4 percent completed an associate’s degree or a certificate at the institution where they had started. Sixty percent were still enrolled at the same institution without a degree in June 2006; 4 percent were last enrolled in the fall of 2005; and 13 percent had left the institution and were not enrolled anywhere during the 2005–06 academic year. Eighteen percent had left the 4-year institution where they had started and transferred to a different institution before completing any program.
Student Persistence and Attainment Anywhere
The students who left the institution where they had started without completing a certificate or degree either did not enroll anywhere else or they transferred (with or without credits) to another institution. Figures 4, 5, and 6 illustrate the relationship between the enrollment outcomes after 3 years at the first institution attended and the students’ enrollment experiences anywhere in postsecondary education. The difference between the two is what happens to the transfers: they may still be enrolled without a degree, may have attained a degree at the transfer institution, or they may also have left the transfer institution without a degree. Since this study is limited to a 3-year period, some of those without a degree and not enrolled anywhere in June 2006 may actually be “stop-outs” who will enroll again later. The figures below compare the 3-year retention at the first institution, which includes students last enrolled in the fall of 2005, to the 3-year persistence of the same students anywhere in the spring of 2006. The students enrolled

Persistence and Attainment After 3 Years
18
only in the fall term at the first institution are included among those not enrolled anywhere in June 2006.
Among students beginning at a 4-year institution, 13 percent left the institution without completing a program and were not enrolled anywhere in 2005–06; 4 percent were last enrolled in the fall of 2005; and 18 percent had transferred elsewhere without a degree (figure 4). By June 2006, 19 percent of the students who started at a 4-year institution had not attained any degree and were not enrolled anywhere; this includes the students who transferred and then left the second institution without a degree as well as those last enrolled in the fall of 2005. Seven percent had attained a degree or certificate and 74 percent were still enrolled without a degree, either at the first institution or at the transfer institution.
Figure 4.—Retention at the first institution attended and persistence anywhere after 3 years among Figure 5.—students who began at 4-year institutions in 2003–04
NOTE: Estimates include postsecondary students in Puerto Rico. Detail may not sum to totals because of rounding.SOURCE: U.S. Department of Education, National Center for Education Statistics, 2003–04 Beginning Postsecondary Students Longitudinal Study, First Follow-up (BPS:04/06).
74
1319
60
0
20
40
60
80
100
Retention at the first institution after 3 years
Student persistence at any institution after 3 years
Percent
No degree, notenrolled anywherein June 2006
No degree, not enrolled inJune 2006, last enrolledprior to 2005–06
No degree, not enrolledin June 2006, lastenrolled in fall 2005
No degree,transferred fromfirst institution
No degree,still enrolledin June 2006
Attaineddegree orcertificate
Status in 2005–06:
Transfers18
76
4(4)
(3)
(1)
(13)
6 7
(13)
1913

Persistence and Attainment After 3 Years
19
Among students beginning at a 2-year institution, 35 percent left the institution without completing a program before the 2005–06 academic year and did not enroll anywhere else; 7 percent were last enrolled in the fall of 2005; and 18 percent transferred elsewhere without a degree (figure 5). By June 2006, 45 percent of the students who started at a 2-year institution had not attained any degree and were not enrolled anywhere; this includes the students who transferred and then left the second institution as well as those last enrolled in the fall of 2005. Eighteen percent had attained a degree or certificate and 37 percent were still enrolled without a degree, either at the first institution or at the transfer institution.
Among students beginning at less-than-2-year institutions, 52 percent attained a certificate at the first institution attended; 35 percent left the institution without completing a certificate and
Figure 5.—Retention at the first institution attended and persistence anywhere after 3 years among Figure 4.—students who began at 2-year institutions in 2003–04
NOTE: Estimates include postsecondary students in Puerto Rico. Detail may not sum to totals because of rounding.SOURCE: U.S. Department of Education, National Center for Education Statistics, 2003–04 Beginning Postsecondary Students Longitudinal Study, First Follow-up (BPS:04/06).
24
3545
16 18
37
0
20
40
60
80
100
Retention at the first institution after 3 years
Student persistence at any institution after 3 years
Percent
No degree, notenrolled anywherein June 2006
No degree, not enrolled inJune 2006, last enrolledprior to 2005–06
No degree, not enrolledin June 2006, lastenrolled in fall 2005
No degree,transferred fromfirst institution
No degree,still enrolledin June 2006
Attaineddegree orcertificate
(13)
(2)
Status in 2005–06:
Transfers
18
7(3)
(7)
(35)
3545
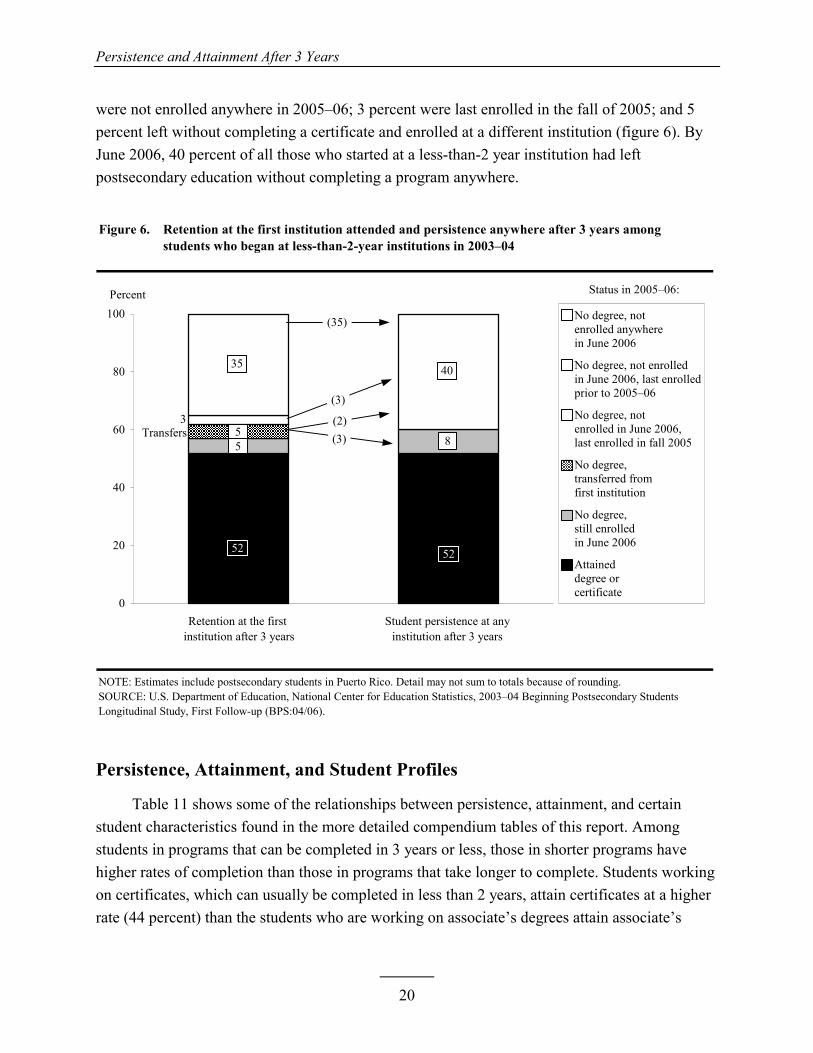
Persistence and Attainment After 3 Years
20
were not enrolled anywhere in 2005–06; 3 percent were last enrolled in the fall of 2005; and 5 percent left without completing a certificate and enrolled at a different institution (figure 6). By June 2006, 40 percent of all those who started at a less-than-2 year institution had left postsecondary education without completing a program anywhere.
Persistence, Attainment, and Student Profiles
Table 11 shows some of the relationships between persistence, attainment, and certain student characteristics found in the more detailed compendium tables of this report. Among students in programs that can be completed in 3 years or less, those in shorter programs have higher rates of completion than those in programs that take longer to complete. Students working on certificates, which can usually be completed in less than 2 years, attain certificates at a higher rate (44 percent) than the students who are working on associate’s degrees attain associate’s
Figure 6.—Retention at the first institution attended and persistence anywhere after 3 years among Figure 6.—students who began at less-than-2-year institutions in 2003–04
NOTE: Estimates include postsecondary students in Puerto Rico. Detail may not sum to totals because of rounding.SOURCE: U.S. Department of Education, National Center for Education Statistics, 2003–04 Beginning Postsecondary Students Longitudinal Study, First Follow-up (BPS:04/06).
35 40
0
20
40
60
80
100
Retention at the first institution after 3 years
Student persistence at any institution after 3 years
Percent
No degree, notenrolled anywherein June 2006
No degree, not enrolledin June 2006, last enrolledprior to 2005–06
No degree, notenrolled in June 2006,last enrolled in fall 2005
No degree,transferred fromfirst institution
No degree,still enrolledin June 2006
Attaineddegree orcertificate
Status in 2005–06:
5252
585
3
(3)Transfers
(3)
(2)
(35)
35 40

Persistence and Attainment After 3 Years
21
Table 11.—Percentage of 2003–04 beginning postsecondary students who attained a degree and percentage Table 11.—distribution of their persistence and attainment status anywhere through June 2006, by student Table 11.—characteristics
Attained Attained No No
Asso- Bach- degree, degree, degree, degree,Student Any Certif- ciate’s elor’s not still still notcharacteristics degree icate degree degree Total enrolled enrolled enrolled enrolled
Total 15.9 7.8 7.0 1.0 100.0 8.9 7.0 50.7 33.5
Degree plans first yearNone 9.4 4.8 4.3 0.3 100.0 4.3 5.1 46.9 43.7Certificate 45.8 43.7 2.0 0.1 100.0 36.4 9.5 13.2 41.0Associate’s degree 18.6 3.5 14.9 0.2 100.0 6.7 11.9 36.2 45.2Bachelor’s degree 5.1 0.6 2.2 2.3 100.0 3.0 2.1 77.2 17.7
Enrollment intensity through 2006Always full-time 18.3 8.6 8.3 1.4 100.0 11.1 7.2 53.8 27.9Mixed 14.9 7.2 7.0 0.7 100.0 6.3 8.6 57.2 28.0Always part-time 7.0 5.6 1.5 # 100.0 4.3 2.7 23.9 69.1
Dependency status first yearDependent 13.7 4.7 7.6 1.4 100.0 6.6 7.1 60.7 25.6Independent 21.2 15.4 5.6 0.2 100.0 14.6 6.6 26.2 52.7
Age first year enrolled18 years or younger 13.0 3.9 7.6 1.5 100.0 5.7 7.3 64.5 22.419 years 15.2 5.4 8.2 1.5 100.0 7.6 7.5 57.7 27.220–23 years 17.4 10.9 6.3 0.2 100.0 11.3 6.2 33.7 48.924–29 years 21.5 16.2 5.2 0.1 100.0 15.7 5.8 26.1 52.430 or older 21.4 16.4 4.9 0.1 100.0 15.1 6.3 24.7 53.9
Worked while enrolled in 2003–04Did not work 16.8 9.4 5.9 1.6 100.0 11.0 5.8 55.4 27.8Worked part time 15.7 6.1 8.5 1.1 100.0 7.6 8.1 55.6 28.7Worked full time 14.9 9.0 5.6 0.2 100.0 8.6 6.2 34.7 50.4
# Rounds to zero.NOTE: “Persistence and attainment anywhere” include students who transferred out of the first institution attended. “Degree” includes certificates in vocational programs. Dependent students were under age 24, unmarried, and had no dependents of their own in 2003. Totals include students in private not-for-profit less-than-2-year institutions; sample size was too small to show as a separate category. Estimates include postsecondary students in Puerto Rico. Detail may not sum to totals because of rounding.SOURCE: U.S. Department of Education, National Center for Education Statistics, 2003–04 Beginning Postsecondary Students Longitudinal Study, First Follow-up (BPS:04/06).
Attained degree anywhere through 2006
Highest degree Persistence anywhere through 2006
Persistence and Attainment After 3 Years
22
degrees (15 percent). Students who are always enrolled full time have higher completion rates (18 percent) than those who are always enrolled part time (7 percent), and part-time students leave postsecondary education without completion at higher rates (69 percent) than full-time students (28 percent).
Independent students both leave postsecondary education without completion at higher rates (53 percent) than dependent students (26 percent) and have higher overall completion rates (21 percent) than dependent students (14 percent). Dependent students, on the other hand, remain enrolled without having earned a degree at higher rates than independent students (61 percent vs. 26 percent). About one-fourth (27 percent) of the independent students are working on certificates, compared with 8 percent of the dependent students (compendium table 1.3), and 15 percent of all independent students attained a certificate, compared with 5 percent of all dependent students (table 11).
About 90 percent of independent students are age 20 or older (compendium table 1.7). During the first 3 years, older students leave postsecondary education without completion at higher rates than younger students (table 11). Students who began at age 18 or 19 had 3-year rates of departure from postsecondary education without completion of 22 and 27 percent, respectively, while those in the 20 or higher age groups left postsecondary education without completion at a rate of about 50 percent.
Among students who worked full time while enrolled in 2003–04, one-half left postsecondary education without completing a degree within 3 years, representing a higher rate of departure than those who did not work (28 percent) and those who worked part time (29 percent) (table 11). Students who worked full time remained enrolled after 3 years at lower rates than their peers who did not work or worked part time (35 percent vs. 55–56 percent).
Because bachelor’s degrees normally take at least 4 years of enrollment, the low 3-year attainment rates at 4-year institutions shown in this report are not meaningful. At 4-year institutions the rates at which students leave postsecondary education without completion within 3 years are more relevant to understanding differences in persistence (table 12).
Among 4-year beginners, 69 percent who were always enrolled part time had left postsecondary education without completion by June 2006, compared with 22 percent who were enrolled both full and part time and 17 percent of those who were always enrolled full time. About 85 percent of the beginning students at 4-year institutions are age 19 or younger and nearly 90 percent are dependent (tables 3 and 4, above). Among the dependent students beginning at 4-year institutions, those from families with incomes below $60,000 left postsecondary education without completion at higher rates than those from families with incomes of $92,000 or more
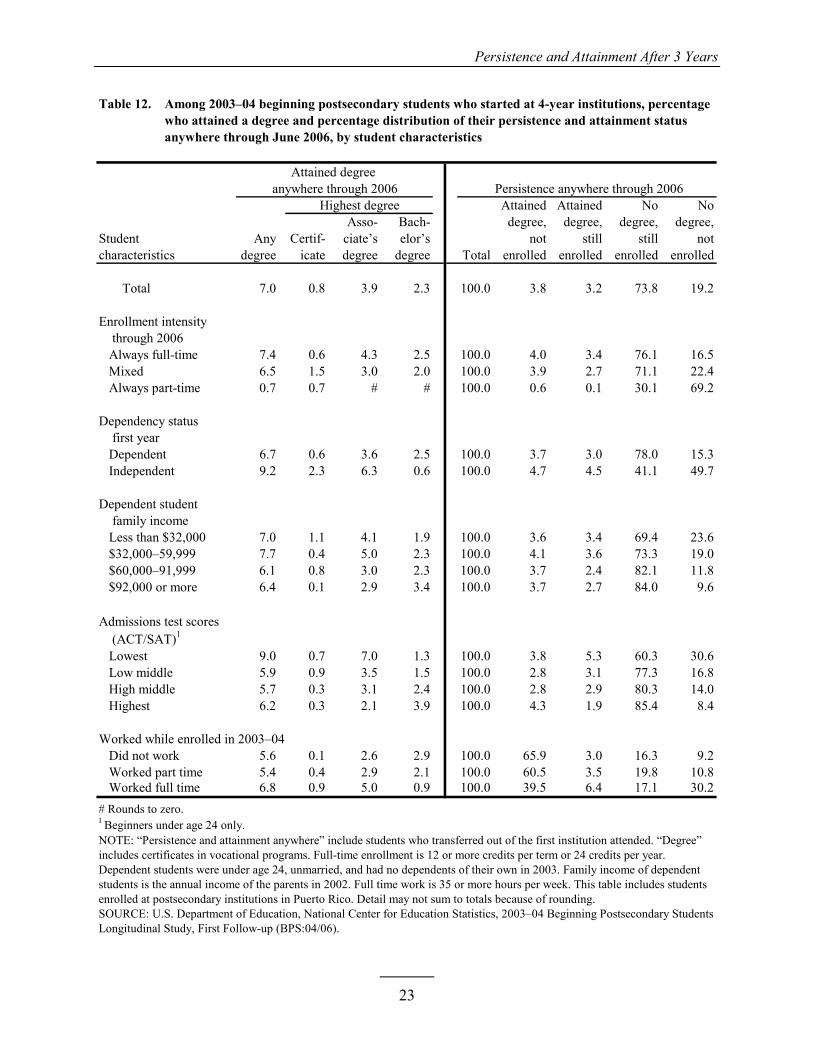
Persistence and Attainment After 3 Years
23
Table 12.—Among 2003–04 beginning postsecondary students who started at 4-year institutions, percentage Table 13.—who attained a degree and percentage distribution of their persistence and attainment status Table 13.—anywhere through June 2006, by student characteristics
Attained Attained No No Asso- Bach- degree, degree, degree, degree,Student Any Certif- ciate’s elor’s not still still notcharacteristics degree icate degree degree Total enrolled enrolled enrolled enrolled
Total 7.0 0.8 3.9 2.3 100.0 3.8 3.2 73.8 19.2
Enrollment intensity through 2006Always full-time 7.4 0.6 4.3 2.5 100.0 4.0 3.4 76.1 16.5Mixed 6.5 1.5 3.0 2.0 100.0 3.9 2.7 71.1 22.4Always part-time 0.7 0.7 # # 100.0 0.6 0.1 30.1 69.2
Dependency status first yearDependent 6.7 0.6 3.6 2.5 100.0 3.7 3.0 78.0 15.3Independent 9.2 2.3 6.3 0.6 100.0 4.7 4.5 41.1 49.7
Dependent student family income Less than $32,000 7.0 1.1 4.1 1.9 100.0 3.6 3.4 69.4 23.6$32,000–59,999 7.7 0.4 5.0 2.3 100.0 4.1 3.6 73.3 19.0$60,000–91,999 6.1 0.8 3.0 2.3 100.0 3.7 2.4 82.1 11.8$92,000 or more 6.4 0.1 2.9 3.4 100.0 3.7 2.7 84.0 9.6
Admissions test scores (ACT/SAT)1
Lowest 9.0 0.7 7.0 1.3 100.0 3.8 5.3 60.3 30.6Low middle 5.9 0.9 3.5 1.5 100.0 2.8 3.1 77.3 16.8High middle 5.7 0.3 3.1 2.4 100.0 2.8 2.9 80.3 14.0Highest 6.2 0.3 2.1 3.9 100.0 4.3 1.9 85.4 8.4
Worked while enrolled in 2003–04Did not work 5.6 0.1 2.6 2.9 100.0 65.9 3.0 16.3 9.2Worked part time 5.4 0.4 2.9 2.1 100.0 60.5 3.5 19.8 10.8Worked full time 6.8 0.9 5.0 0.9 100.0 39.5 6.4 17.1 30.2
# Rounds to zero.1 Beginners under age 24 only.NOTE: “Persistence and attainment anywhere” include students who transferred out of the first institution attended. “Degree” includes certificates in vocational programs. Full-time enrollment is 12 or more credits per term or 24 credits per year.Dependent students were under age 24, unmarried, and had no dependents of their own in 2003. Family income of dependent students is the annual income of the parents in 2002. Full time work is 35 or more hours per week. This table includes students enrolled at postsecondary institutions in Puerto Rico. Detail may not sum to totals because of rounding.SOURCE: U.S. Department of Education, National Center for Education Statistics, 2003–04 Beginning Postsecondary Students Longitudinal Study, First Follow-up (BPS:04/06).
Persistence anywhere through 2006Attained degree
Highest degreeanywhere through 2006
Persistence and Attainment After 3 Years
24
(table 12). Departure without completion was also related to admissions test scores. Thirty-one percent of those with the lowest 25 percent of test scores left postsecondary education without completion, compared with 8 percent of those with the highest 25 percent of test scores. However, test scores are also positively related to family incomes (compendium table 2.5): 39 percent of dependent students in the highest income category were also in the highest test score category, compared with 14 percent of dependent students in the lowest income category.

25
Summary
Most of the students who began at 4-year institutions in 2003–04 were young (85 percent were age 19 or younger) and financially dependent on their parents. Among those under age 24, nearly all (94 percent) had taken algebra II or higher mathematics courses in high school, and about one-fourth had taken calculus. Eighteen percent of students who began at 4-year institutions in 2003–04 transferred from the institution where they started. After 3 years, 81 percent were either still enrolled in postsecondary education or had attained a degree or certificate.
About one-half (46 percent) of the students beginning at 2-year institutions in 2003–04 were age 20 or older when they started, and 39 percent were financially independent. Among those under age 24, one-fourth had not taken algebra II or higher high school mathematics, and about one-half had a high school GPA below 3.0. Eighteen percent transferred from the 2-year institution where they had started without earning a degree. After 3 years, 55 percent had either attained a certificate or degree (18 percent) or were still enrolled without a degree at some postsecondary institution (37 percent).
About two-thirds (68 percent) of the students beginning at less-than-2-year institutions in 2003–04 were age 20 or older when they started, and about two-thirds (64 percent) were financially independent. Among those under age 24, about one-half had a high school GPA below 3.0. Within 3 years, about one-half (52 percent) of the students starting at a less-than-2-year institution had completed a certificate program from that institution, but 40 percent had not completed a program and were not enrolled anywhere.

THIS PAGE INTENTIONALLY LEFT BLANK
27
References
Adelman, C. (2006). The Toolbox Revisited: Paths to Degree Completion From High School Through College. Institute of Education Sciences, U.S. Department of Education. Washington, DC.
Astin, W.A. (1993). What Matters in College? Four Critical Years Revisited. San Francisco: Jossey-Bass, Inc.
Berkner, L., He, S., and Cataldi, E.F. (2002). Descriptive Summary of 1995–96 Beginning Postsecondary Students: Six Years Later (NCES 2003-151). National Center for Education Statistics, U.S. Department of Education. Washington, DC.
Berkner, L., Horn, L., and Clune, M. (2000). Descriptive Summary of 1995–96 Beginning Postsecondary Students: Three Years Later (NCES 2000-154). National Center for Education Statistics, U.S. Department of Education. Washington, DC.
Berkner, L.K., Cuccaro-Alamin, S., and McCormick, A.C. (1996). Descriptive Summary of 1989–90 Beginning Postsecondary Students: Five Years Later (NCES 96-155). National Center for Education Statistics, U.S. Department of Education. Washington, DC.
Breiman, L., Friedman, J.H., Olshen, R.A., and Stone, C.J. (1984). Classification and Regression Trees. London: Chapman & Hall.
Choy, S. (2002). Access and Persistence: Findings From 10 Years of Longitudinal Research on Students. Washington, DC: American Council on Education.
Cominole, M., Siegel, P., Dudley, K., Roe, D., and Gilligan, T. (2006). 2004 National Postsecondary Student Aid Study (NPSAS:04) Full Scale Methodology Report (NCES 2006-180). National Center for Education Statistics, Institute of Education Sciences, U.S. Department of Education. Washington, DC.
Cominole, M., Wheeless, S., Dudley, K., Franklin, J., and Wine, J. (2007). 2004/06 Beginning Postsecondary Students Longitudinal Study (BPS:04/06) Methodology Report (NCES 2008-184). National Center for Education Statistics, Institute of Education Sciences, U.S. Department of Education. Washington, DC.

References
28
Cox, B. (1980). The Weighted Sequential Hot Deck Imputation Procedure. Proceedings of the American Statistical Association, Section on Survey Research Methods, pp. 721–726.
Horn, L., and Berger, R. (2004). College Persistence on the Rise? Changes in 5-Year Degree Completion and Postsecondary Persistence Rates Between 1994 and 2000 (NCES 2005-156). National Center for Education Statistics, Institute of Education Sciences, U.S. Department of Education. Washington, DC.
Iannacchione, V. (1982). Weighted Sequential Hot Deck Imputation Macros. Presented at the Seventh Annual SAS User’s Group International Conference, San Francisco.
Kass, G.V. (1980). An Exploratory Technique for Investigating Large Quantities of Categorical Data. Applied Statistics, 29: 119–127.
Kaufman, S. (2004). Using the Bootstrap in a Two-Stage Design When Some Second-Stage Strata Have Only One Unit Allocated. In Proceedings of the American Statistical Association, Section on Survey Research Methods. Alexandria, VA: The American Statistical Association.
Kojaku, L.K., and Nuñez, A.-M. (1998). Descriptive Summary of 1995–96 Beginning Postsecondary Students, With Profiles of Students Entering 2- and 4-Year Institutions (NCES 1999-030). National Center for Education Statistics, U.S. Department of Education. Washington, DC.
Long, B.T. (2007). The Contributions of Economics to the Study of College Access and Success. Teachers College Record, 109(10): 2367–2443.
Pascarella, E.T., and Terenzini, P.T. (2005). How College Affects Students: A Third Decade of Research (Vol. 2). San Francisco: Jossey-Bass.
RTI International (RTI). (2004). SUDAAN User’s Manual, Release 9.0. Research Triangle Park, NC: Author.
Tinto, V. (1993). Leaving College: Rethinking the Causes and Cures of Student Attrition (2nd ed.). Chicago: University of Chicago Press.
U.S. Department of Education, Institute of Education Sciences, National Center for Education Statistics. (2003). NCES Statistical Standards (NCES 2003-601). Washington, DC.
Wine, J., Cominole, M., Wheeless, S., Bryant, A., Gilligan, T., Dudley, K., and Franklin, J. (2006). 2004/06 Beginning Postsecondary Students Longitudinal Study (BPS:04/06) Field Test Methodology Report (NCES 2006-01). National Center for Education Statistics, Institute of Education Sciences, U.S. Department of Education. Washington, DC.

29
Table Compendium

THIS PAGE INTENTIONALLY LEFT BLANK
31
Section 1: Student Characteristics
The tables in this section profile beginning postsecondary students, describing the types of institutions they first attended, their initial degree plans, and their attendance intensity. The tables also describe students’ basic demographic characteristics, such as gender, age, race/ethnicity, dependency status, and parents’ education and income. From these tables, it is possible to see the types of institutions chosen by students with different demographic characteristics and high school academic performance, and also to characterize student populations at each type of institution.
Type of First Institution
• Overall, 44 percent of beginning postsecondary students started at a 4-year institution (table 1.1). Another 48 percent enrolled at a 2-year institution, and the remaining 8 percent enrolled at a less-than-2-year institution.
• Among beginning postsecondary students who planned to earn a bachelor’s degree, 88 percent started at a 4-year institution, and 12 percent started at a 2-year institution. However, among high school graduates who enrolled in college full time without delay (i.e., finished high school in 2003 and then enrolled full time in fall 2003), relatively few of those planning to earn a bachelor’s degree (6 percent) started at a 2-year institution.
• A greater percentage of women (11 percent) than men (5 percent) began their postsecondary education at a less-than-2-year institution.
• The percentage of students starting at a 4-year institution was associated with age, with relatively more 18- and 19-year-olds than older students starting at this level.
• The percentage of students starting at a 4-year institution increased with parents’ education, income (for dependent students), college admissions test scores, and level of high school mathematics completed. Eighty-seven percent of beginning postsecondary students scoring in the highest 25 percent on college admissions tests and 84 percent of those who took calculus in high school enrolled first at the 4-year level.
• Among students who enrolled first at the 4-year level, 61 percent attended public institutions, 32 percent attended private not-for-profit institutions, and 8 percent attended private for-profit institutions (table 1.2).
Section 1: Student Characteristics
32
• Among students who enrolled first at the 2-year level, 89 percent attended public institutions, and among those who enrolled first at the less-than-2-year level, 82 percent attended private for-profit institutions.
Initial Degree Plans and Enrollment Intensity
• When interviewed during the 2003–04 academic year, beginning postsecondary students were asked about their degree plans at their first institution (table 1.3). Overall, 40 percent reported that they planned to earn a bachelor’s degree, 36 percent an associate’s degree, and 13 percent a certificate. The remaining 10 percent did not expect to earn either a degree or certificate.
• More than half (57 percent) of beginning postsecondary students enrolled at private for-profit 4-year institutions planned to earn an associate’s degree at that institution.
• Proportionately more males than females planned to earn a bachelor’s degree (42 vs. 38 percent), and proportionately more females than males planned to earn a certificate (16 vs. 10 percent).
• Proportionately fewer students 20 years or older than younger students were seeking a bachelor’s degree.
• As they progressed through the next 3 years, 60 percent of all beginning postsecondary students were enrolled full time each term they were enrolled (although they were not necessarily enrolled each term) (table 1.4). Another 14 percent were always enrolled part time, and the remaining 27 percent had a mixture of full- and part-time enrollment.
• At 4-year institutions, 77 percent of beginning postsecondary students were always enrolled full time, as were 75 percent at less-than-2-year institutions; at 2-year institutions, fewer (41 percent) were always enrolled full time.
• Among beginning postsecondary students who were 30 years or older when they first enrolled, 39 percent were enrolled exclusively part time.
• Among recent (2003) high school graduates, 35 percent were enrolled in college full time in fall 2003 and seeking a bachelor’s degree (table 1.5). Another 19 percent were working toward an associate’s degree, and 9 percent were working toward a certificate. The remaining 37 percent were either not enrolled full time or were enrolled but had no degree plans.
Gender
• Women constituted a majority of beginning postsecondary students overall (57 percent), but the distribution of males and females varied by type of institution (table 1.6). Women made up 56 percent of the beginning student population at both 2- and 4-year institutions, but they accounted for 73 percent at less-than-2-year institutions.

Section 1: Student Characteristics
33
• Proportionately more students 30 years or older were female (66 percent) than in any other age group.
• A greater percentage of Black and Hispanic beginning postsecondary students (62 and 61 percent, respectively) were female than were White or Asian students (56 and 52 percent).
Disabilities
• Ten percent of all beginning postsecondary students reported having a disability when they were first enrolled in 2003–04 (table 1.6).
• At private for-profit institutions, 13 percent of the beginning students reported having a disability.
• Nine percent of dependent beginning students reported a disability, compared with 14 percent of independent students.
Age
• Beginning postsecondary students in 2003–04 tended to enroll soon after high school: 43 percent were 18 years or younger, and 23 percent were 19 years old (table 1.7). However, 13 percent were 30 years or older when they first enrolled in postsecondary education.
• Two-year and less-than-2-year institutions had proportionately more beginning postsecondary students who were 30 years or older (19 and 27 percent, respectively) than 4-year institutions (5 percent).
• Among beginning students with certificate plans, 26 percent were 30 years or older; among those with associate’s degree plans, 17 percent were 30 years or older; among those with bachelor’s degree plans, 4 percent were 30 years or older.
• Proportionately more males than females were 19 years old when they first enrolled (27 percent versus 21 percent), but proportionately more females than males were 30 years or older when they first enrolled (15 percent versus 10 percent).
Race/Ethnicity
• Overall, 62 percent of beginning postsecondary students in 2003–04 were White, 15 percent were Hispanic, 13 percent were Black, and 5 percent were Asian. The remaining students were American Indian (1 percent) and multiple or other races (4 percent) (table 1.8).
• The racial/ethnic distribution of beginning postsecondary students varied by type of institution. At both public and private not-for-profit 4-year institutions, 70 percent were White, and at 2-year institutions, 60 percent were White. In contrast, at less-than-2-year institutions, 38 percent were White.

Section 1: Student Characteristics
34
• Less-than-2-year institutions had proportionately more Black (22 percent) and Hispanic (33 percent) students than other institution levels. At 4-year institutions, 11 percent of beginning postsecondary students were Black, and 10 percent were Hispanic; at 2-year institutions, the corresponding proportions were 15 and 16 percent.
Dependency and Marital Status
• At the 4-year level, 93 percent of beginning postsecondary students at public institutions and 91 percent at private not-for-profit institutions were financially dependent (table 1.9). At private for-profit 4-year institutions, in contrast, roughly half (47 percent) were financially dependent.
• At private for-profit 4-year institutions, 22 percent of beginning postsecondary students were single parents. Private for-profit institutions at other levels also had relatively large proportions of single parents: 27 percent at 2-year institutions and 32 percent at less-than-2-year institutions.
• Of the beginning postsecondary students who enrolled exclusively part time, 33 percent were married, and another 15 percent were single parents.
Parents’ Education and Income
• Among all beginning postsecondary students, 36 percent had parents who had not gone beyond high school, 25 percent had at least one parent with some postsecondary education, and 39 percent had at least one parent with a bachelor’s degree (table 1.10).
• The level of institution at which students first enrolled and parents’ education were related. For example, 65 percent of those enrolling at less-than-2-year institutions had parents who had not gone beyond high school, compared with 43 percent of those starting at 2-year institutions and 23 percent of those starting at 4-year institutions. Conversely, 55 percent of students starting at the 4-year level had a parent with a bachelor’s degree, compared with 28 percent of those at 2-year institutions and 15 percent of those at less-than-2-year institutions.
• Thirty percent of dependent beginning postsecondary students at 4-year institutions came from families with annual incomes of $92,000 or more, compared with 17 percent of those at 2-year institutions and 4 percent of those at less-than-2-year institutions (table 1.11).
• About two-thirds (65 percent) of students who began at less-than-2-year institutions came from families in the lowest income group (less than $32,000).
Attendance Patterns in the First Year
• In their first year, 59 percent of all 2003–04 beginning students were enrolled full time for a full academic year (9 or more months) (table 1.12).

Section 1: Student Characteristics
35
• Eighty percent of the beginning students at 4-year institutions, 61 percent at less-than-2-year institutions, and 39 percent at 2-year institutions were enrolled full-time/full-year in 2003–04.
• At public 2-year institutions, about one-fourth (27 percent) of the beginning students were enrolled part time for a full academic year and another one-fourth (26 percent) were enrolled part time for less than a full academic year.
• At private for-profit institutions, about one-fourth (24 percent) of the beginning students were enrolled full time for less than a full academic year.
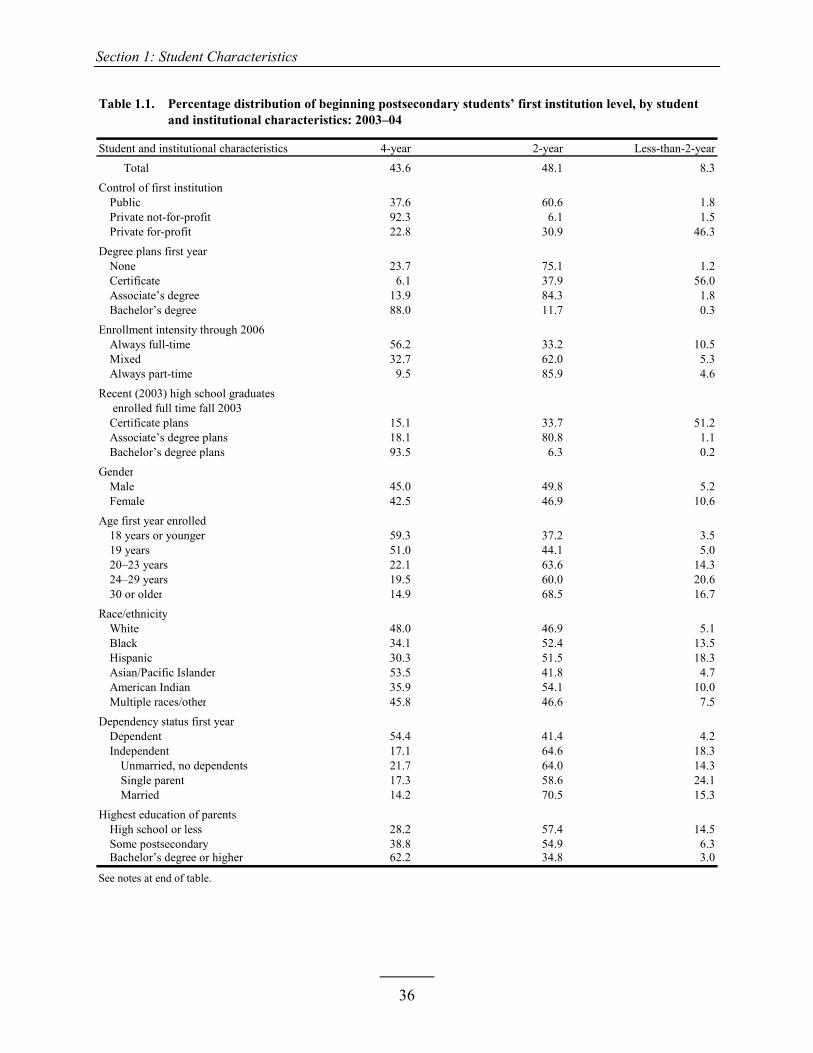
Section 1: Student Characteristics
36
Table 1.1.—Percentage distribution of beginning postsecondary students’ first institution level, by student Table 1.1.—and institutional characteristics: 2003–04
Student and institutional characteristics 4-year 2-year Less-than-2-year
Total 43.6 48.1 8.3
Control of first institutionPublic 37.6 60.6 1.8Private not-for-profit 92.3 6.1 1.5Private for-profit 22.8 30.9 46.3
Degree plans first yearNone 23.7 75.1 1.2Certificate 6.1 37.9 56.0Associate’s degree 13.9 84.3 1.8Bachelor’s degree 88.0 11.7 0.3
Enrollment intensity through 2006Always full-time 56.2 33.2 10.5Mixed 32.7 62.0 5.3Always part-time 9.5 85.9 4.6
Recent (2003) high school graduates enrolled full time fall 2003Certificate plans 15.1 33.7 51.2Associate’s degree plans 18.1 80.8 1.1Bachelor’s degree plans 93.5 6.3 0.2
GenderMale 45.0 49.8 5.2Female 42.5 46.9 10.6
Age first year enrolled18 years or younger 59.3 37.2 3.519 years 51.0 44.1 5.020–23 years 22.1 63.6 14.324–29 years 19.5 60.0 20.630 or older 14.9 68.5 16.7
Race/ethnicityWhite 48.0 46.9 5.1Black 34.1 52.4 13.5Hispanic 30.3 51.5 18.3Asian/Pacific Islander 53.5 41.8 4.7American Indian 35.9 54.1 10.0Multiple races/other 45.8 46.6 7.5
Dependency status first yearDependent 54.4 41.4 4.2Independent 17.1 64.6 18.3
Unmarried, no dependents 21.7 64.0 14.3Single parent 17.3 58.6 24.1Married 14.2 70.5 15.3
Highest education of parentsHigh school or less 28.2 57.4 14.5Some postsecondary 38.8 54.9 6.3Bachelor’s degree or higher 62.2 34.8 3.0
See notes at end of table.
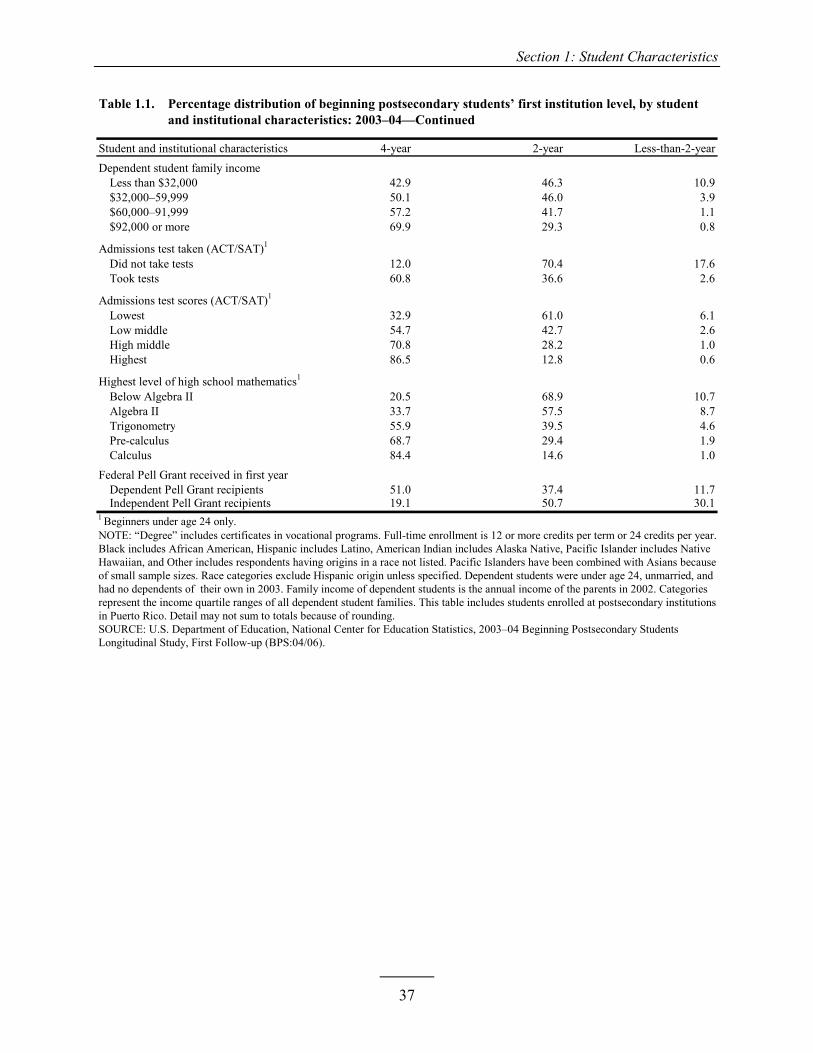
Section 1: Student Characteristics
37
Table 1.1.—Percentage distribution of beginning postsecondary students’ first institution level, by student Table 1.1.—and institutional characteristics: 2003–04—Continued
Student and institutional characteristics 4-year 2-year Less-than-2-year
Dependent student family income Less than $32,000 42.9 46.3 10.9$32,000–59,999 50.1 46.0 3.9$60,000–91,999 57.2 41.7 1.1$92,000 or more 69.9 29.3 0.8
Admissions test taken (ACT/SAT)1
Did not take tests 12.0 70.4 17.6Took tests 60.8 36.6 2.6
Admissions test scores (ACT/SAT)1
Lowest 32.9 61.0 6.1Low middle 54.7 42.7 2.6High middle 70.8 28.2 1.0Highest 86.5 12.8 0.6
Highest level of high school mathematics1
Below Algebra II 20.5 68.9 10.7Algebra II 33.7 57.5 8.7Trigonometry 55.9 39.5 4.6Pre-calculus 68.7 29.4 1.9Calculus 84.4 14.6 1.0
Federal Pell Grant received in first yearDependent Pell Grant recipients 51.0 37.4 11.7Independent Pell Grant recipients 19.1 50.7 30.1
1 Beginners under age 24 only.NOTE: “Degree” includes certificates in vocational programs. Full-time enrollment is 12 or more credits per term or 24 credits per year. Black includes African American, Hispanic includes Latino, American Indian includes Alaska Native, Pacific Islander includes Native Hawaiian, and Other includes respondents having origins in a race not listed. Pacific Islanders have been combined with Asians because of small sample sizes. Race categories exclude Hispanic origin unless specified. Dependent students were under age 24, unmarried, and had no dependents of their own in 2003. Family income of dependent students is the annual income of the parents in 2002. Categories represent the income quartile ranges of all dependent student families. This table includes students enrolled at postsecondary institutions in Puerto Rico. Detail may not sum to totals because of rounding.SOURCE: U.S. Department of Education, National Center for Education Statistics, 2003–04 Beginning Postsecondary StudentsLongitudinal Study, First Follow-up (BPS:04/06).

Section 1: Student Characteristics
38
Table 1.2.—Percentage distribution of beginning postsecondary students’ first institution control, by student Table 1.1.—and institutional characteristics: 2003–04
Student and institutional characteristics Public Private not-for-profit Private for-profit
Total 70.4 14.9 14.7
Level of first institution4-year 60.7 31.6 7.72-year 88.6 1.9 9.5Less-than-2-year 15.2 2.7 82.0
Degree plans first yearNone 90.0 6.5 3.5Certificate 38.4 4.3 57.3Associate’s degree 80.3 5.3 14.4Bachelor’s degree 66.8 29.3 3.9
Enrollment intensity through 2006Always full-time 60.7 20.0 19.3Mixed 81.0 9.4 9.6Always part-time 91.9 3.4 4.8
Recent (2003) high school graduates enrolled full time fall 2003Certificate plans 31.4 7.2 61.4Associate’s degree plans 81.9 7.6 10.4Bachelor’s degree plans 66.6 31.6 1.8
GenderMale 73.0 14.9 12.1Female 68.4 14.9 16.7
Age first year enrolled18 years or younger 72.6 19.9 7.619 years 73.2 17.6 9.220–23 years 65.5 7.9 26.524–29 years 58.7 6.1 35.230 or older 70.0 6.0 24.0
Race/ethnicityWhite 73.6 16.3 10.1Black 61.6 12.8 25.6Hispanic 62.6 11.6 25.7Asian/Pacific Islander 77.5 15.4 7.1American Indian 77.2 8.5 14.2Multiple races/other 69.6 12.5 17.9
Dependency status first yearDependent 73.0 18.5 8.5Independent 64.1 6.0 29.9
Unmarried, no dependents 65.5 6.8 27.8Single parent 54.0 6.6 39.5Married 72.5 5.1 22.4
Highest education of parentsHigh school or less 67.5 8.8 23.7Some postsecondary 74.1 12.3 13.6Bachelor’s degree or higher 70.9 22.7 6.3
See notes at end of table.

Section 1: Student Characteristics
39
Table 1.2.—Percentage distribution of beginning postsecondary students’ first institution control, by student Table 1.1.—and institutional characteristics: 2003–04—Continued
Student and institutional characteristics Public Private not-for-profit Private for-profit
Dependent student family income Less than $32,000 66.4 15.1 18.5$32,000–59,999 74.6 16.4 9.1$60,000–91,999 79.3 17.2 3.5$92,000 or more 71.0 26.7 2.4
Admissions test taken (ACT/SAT)1
Did not take tests 64.9 5.8 29.4Took tests 73.4 20.2 6.4
Admissions test scores (ACT/SAT)1
Lowest 75.3 10.7 14.0Low middle 78.7 15.1 6.2High middle 75.8 20.0 4.1Highest 63.0 35.9 1.1
Highest level of high school mathematics1
Below Algebra II 72.0 8.0 20.0Algebra II 73.5 10.9 15.6Trigonometry 73.3 16.5 10.2Pre-calculus 72.7 21.3 6.0Calculus 64.6 34.0 1.4
Federal Pell Grant received in first yearDependent Pell Grant recipients 60.6 18.2 21.2Independent Pell Grant recipients 44.8 6.4 48.8
1 Beginners under age 24 only.NOTE: Full-time enrollment is 12 or more credits per term or 24 credits per year. Black includes African American, Hispanic includes Latino, American Indian includes Alaska Native, Pacific Islander includes Native Hawaiian, and Other includes respondents having origins in a race not listed. Pacific Islanders have been combined with Asians because of small sample sizes. Race categories exclude Hispanic origin unless specified. Dependent students were under age 24, unmarried, and had no dependents of their own in 2003. Family income of dependent students is the annual income of the parents in 2002. Categories represent the income quartile ranges of all dependent student families. This table includes students enrolled at postsecondary institutions in Puerto Rico. Detail may not sum to totals because of rounding.SOURCE: U.S. Department of Education, National Center for Education Statistics, 2003–04 Beginning Postsecondary StudentsLongitudinal Study, First Follow-up (BPS:04/06).
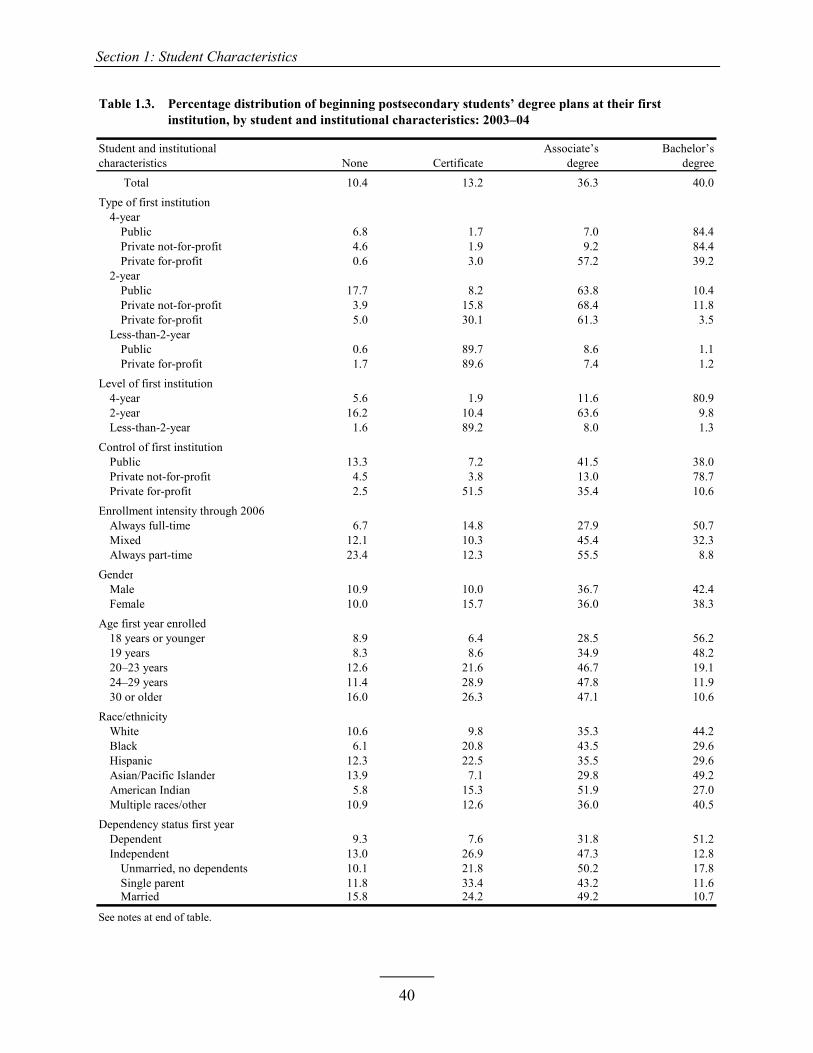
Section 1: Student Characteristics
40
Table 1.3.—Percentage distribution of beginning postsecondary students’ degree plans at their first Table 1.2.—institution, by student and institutional characteristics: 2003–04
Student and institutional Associate’s Bachelor’scharacteristics None Certificate degree degree
Total 10.4 13.2 36.3 40.0
Type of first institution4-year
Public 6.8 1.7 7.0 84.4Private not-for-profit 4.6 1.9 9.2 84.4Private for-profit 0.6 3.0 57.2 39.2
2-yearPublic 17.7 8.2 63.8 10.4Private not-for-profit 3.9 15.8 68.4 11.8Private for-profit 5.0 30.1 61.3 3.5
Less-than-2-yearPublic 0.6 89.7 8.6 1.1Private for-profit 1.7 89.6 7.4 1.2
Level of first institution4-year 5.6 1.9 11.6 80.92-year 16.2 10.4 63.6 9.8Less-than-2-year 1.6 89.2 8.0 1.3
Control of first institutionPublic 13.3 7.2 41.5 38.0Private not-for-profit 4.5 3.8 13.0 78.7Private for-profit 2.5 51.5 35.4 10.6
Enrollment intensity through 2006Always full-time 6.7 14.8 27.9 50.7Mixed 12.1 10.3 45.4 32.3Always part-time 23.4 12.3 55.5 8.8
GenderMale 10.9 10.0 36.7 42.4Female 10.0 15.7 36.0 38.3
Age first year enrolled18 years or younger 8.9 6.4 28.5 56.219 years 8.3 8.6 34.9 48.220–23 years 12.6 21.6 46.7 19.124–29 years 11.4 28.9 47.8 11.930 or older 16.0 26.3 47.1 10.6
Race/ethnicityWhite 10.6 9.8 35.3 44.2Black 6.1 20.8 43.5 29.6Hispanic 12.3 22.5 35.5 29.6Asian/Pacific Islander 13.9 7.1 29.8 49.2American Indian 5.8 15.3 51.9 27.0Multiple races/other 10.9 12.6 36.0 40.5
Dependency status first yearDependent 9.3 7.6 31.8 51.2Independent 13.0 26.9 47.3 12.8
Unmarried, no dependents 10.1 21.8 50.2 17.8Single parent 11.8 33.4 43.2 11.6Married 15.8 24.2 49.2 10.7
See notes at end of table.
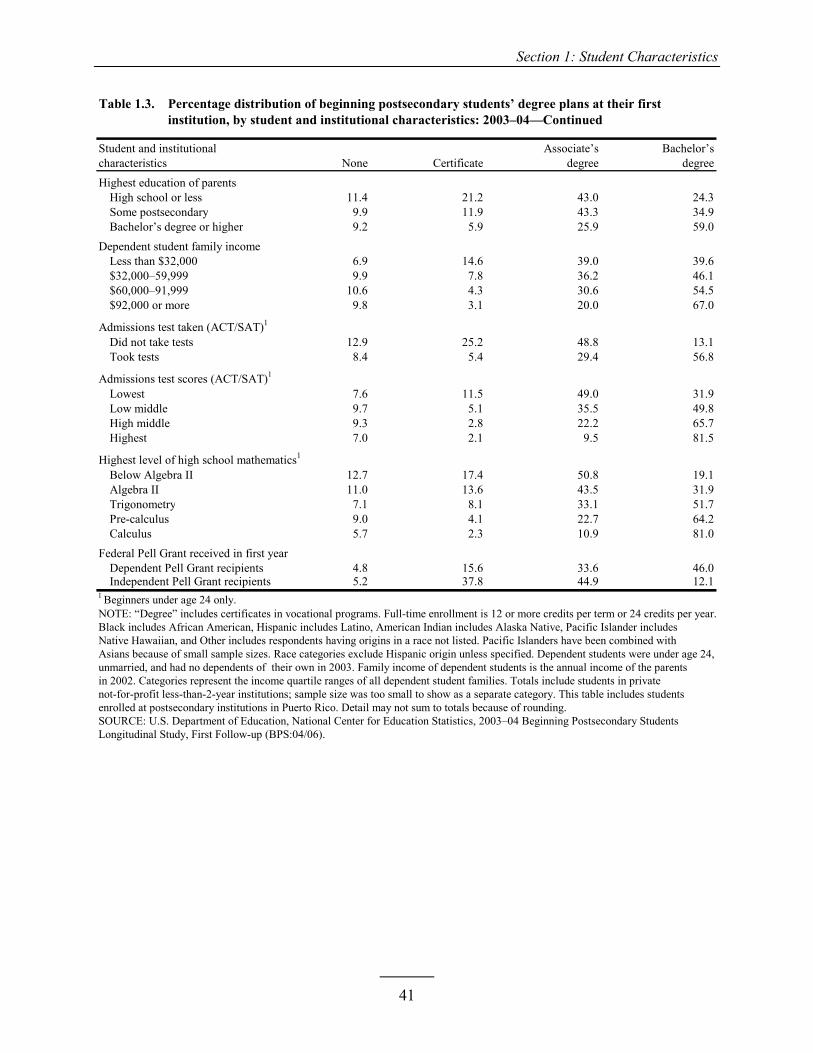
Section 1: Student Characteristics
41
Table 1.3.—Percentage distribution of beginning postsecondary students’ degree plans at their first Table 1.2.—institution, by student and institutional characteristics: 2003–04—Continued
Student and institutional Associate’s Bachelor’scharacteristics None Certificate degree degree
Highest education of parentsHigh school or less 11.4 21.2 43.0 24.3Some postsecondary 9.9 11.9 43.3 34.9Bachelor’s degree or higher 9.2 5.9 25.9 59.0
Dependent student family income Less than $32,000 6.9 14.6 39.0 39.6$32,000–59,999 9.9 7.8 36.2 46.1$60,000–91,999 10.6 4.3 30.6 54.5$92,000 or more 9.8 3.1 20.0 67.0
Admissions test taken (ACT/SAT)1
Did not take tests 12.9 25.2 48.8 13.1Took tests 8.4 5.4 29.4 56.8
Admissions test scores (ACT/SAT)1
Lowest 7.6 11.5 49.0 31.9Low middle 9.7 5.1 35.5 49.8High middle 9.3 2.8 22.2 65.7Highest 7.0 2.1 9.5 81.5
Highest level of high school mathematics1
Below Algebra II 12.7 17.4 50.8 19.1Algebra II 11.0 13.6 43.5 31.9Trigonometry 7.1 8.1 33.1 51.7Pre-calculus 9.0 4.1 22.7 64.2Calculus 5.7 2.3 10.9 81.0
Federal Pell Grant received in first yearDependent Pell Grant recipients 4.8 15.6 33.6 46.0Independent Pell Grant recipients 5.2 37.8 44.9 12.1
1 Beginners under age 24 only.NOTE: “Degree” includes certificates in vocational programs. Full-time enrollment is 12 or more credits per term or 24 credits per year. Black includes African American, Hispanic includes Latino, American Indian includes Alaska Native, Pacific Islander includes Native Hawaiian, and Other includes respondents having origins in a race not listed. Pacific Islanders have been combined withAsians because of small sample sizes. Race categories exclude Hispanic origin unless specified. Dependent students were under age 24, unmarried, and had no dependents of their own in 2003. Family income of dependent students is the annual income of the parents in 2002. Categories represent the income quartile ranges of all dependent student families. Totals include students in private not-for-profit less-than-2-year institutions; sample size was too small to show as a separate category. This table includes students enrolled at postsecondary institutions in Puerto Rico. Detail may not sum to totals because of rounding.SOURCE: U.S. Department of Education, National Center for Education Statistics, 2003–04 Beginning Postsecondary StudentsLongitudinal Study, First Follow-up (BPS:04/06).

Section 1: Student Characteristics
42
Table 1.4.—Percentage distribution of 2003–04 beginning postsecondary students’ enrollment intensity Table 1.3.—through 2006, by student and institutional characteristics
Student and institutional characteristics Always full-time Mixed Always part-time
Total 59.5 26.9 13.5
Type of first institution4-year
Public 76.2 21.1 2.7Private not-for-profit 80.6 16.6 2.7Private for-profit 66.5 27.8 5.7
2-yearPublic 35.9 37.3 26.8Private not-for-profit 71.4 20.3 8.3Private for-profit 83.8 13.2 3.0
Less-than-2-yearPublic 50.7 25.3 23.9Private for-profit 79.8 15.6 4.7
Level of first institution4-year 76.8 20.2 3.02-year 41.1 34.7 24.2Less-than-2-year 75.3 17.2 7.5
Control of first institutionPublic 51.3 31.0 17.7Private not-for-profit 80.0 16.9 3.1Private for-profit 78.0 17.6 4.4
Degree plans first yearNone 38.2 31.3 30.5Certificate 66.5 20.9 12.6Associate’s degree 45.6 33.6 20.7Bachelor’s degree 75.3 21.7 3.0
Recent (2003) high school graduates enrolled full time fall 2003Certificate plans 87.3 12.7 †Associate’s degree plans 70.9 29.1 †Bachelor’s degree plans 82.7 17.3 †
GenderMale 60.0 26.6 13.4Female 59.2 27.2 13.7
Age first year enrolled18 years or younger 69.1 25.7 5.219 years 64.9 27.5 7.620–23 years 52.3 28.2 19.524–29 years 48.6 28.1 23.330 or older 32.8 27.9 39.3
Race/ethnicityWhite 61.3 25.2 13.5Black 59.7 27.1 13.2Hispanic 53.4 30.4 16.2Asian/Pacific Islander 58.8 32.2 9.0American Indian 41.8 37.1 21.1Multiple races/other 58.5 32.1 9.4
See notes at end of table.

Section 1: Student Characteristics
43
Table 1.4.—Percentage distribution of 2003–04 beginning postsecondary students’ enrollment intensity Table 1.3.—through 2006, by student and institutional characteristics: 2006—Continued
Student and institutional characteristics Always full-time Mixed Always part-time
Dependency status first yearDependent 66.0 26.6 7.3Independent 43.7 27.6 28.7
Unmarried, no dependents 45.2 29.0 25.8Single parent 55.5 25.5 19.0Married 31.9 28.7 39.4
Highest education of parentsHigh school or less 54.3 26.1 19.6Some postsecondary 56.9 30.5 12.6Bachelor’s degree or higher 66.7 25.4 7.9
Dependent student family income Less than $32,000 69.2 23.7 7.1$32,000–59,999 63.1 28.8 8.1$60,000–91,999 63.7 28.4 7.9$92,000 or more 69.5 25.0 5.5
Admissions test taken (ACT/SAT)1
Did not take tests 51.9 29.9 18.1Took tests 68.5 25.8 5.7
Admissions test scores (ACT/SAT)1
Lowest 59.2 31.0 9.8Low middle 64.2 28.4 7.4High middle 70.7 25.4 3.9Highest 80.7 18.0 1.3
Highest level of high school mathematics1
Below Algebra II 52.0 30.6 17.4Algebra II 58.1 31.1 10.8Trigonometry 69.2 24.2 6.6Pre-calculus 70.3 25.9 3.8Calculus 80.2 18.1 1.7
Federal Pell Grant received in first yearDependent Pell Grant recipients 76.6 20.7 2.7Independent Pell Grant recipients 65.2 26.5 8.4
† Not applicable.1 Beginners under age 24 only.NOTE: “Degree” includes certificates in vocational programs. Full-time enrollment is 12 or more credits per term or 24 credits per year. Black includes African American, Hispanic includes Latino, American Indian includes Alaska Native, Pacific Islander includes Native Hawaiian, and Other includes respondents having origins in a race not listed. Pacific Islanders have been combined with Asians because of small sample sizes. Race categories exclude Hispanic origin unless specified. Dependent students were under age 24, unmarried, and had no dependents of their own in 2003. Family income of dependent students is the annual income of the parents in 2002. Categories represent the income quartile ranges of all dependent student families. Totals include students in private not-for-profit less-than-2-year institutions; sample size was too small to show as a separate category. This table includes students enrolled at postsecondary institutions in Puerto Rico. Detail may not sum to totals because of rounding.SOURCE: U.S. Department of Education, National Center for Education Statistics, 2003–04 Beginning Postsecondary StudentsLongitudinal Study, First Follow-up (BPS:04/06).
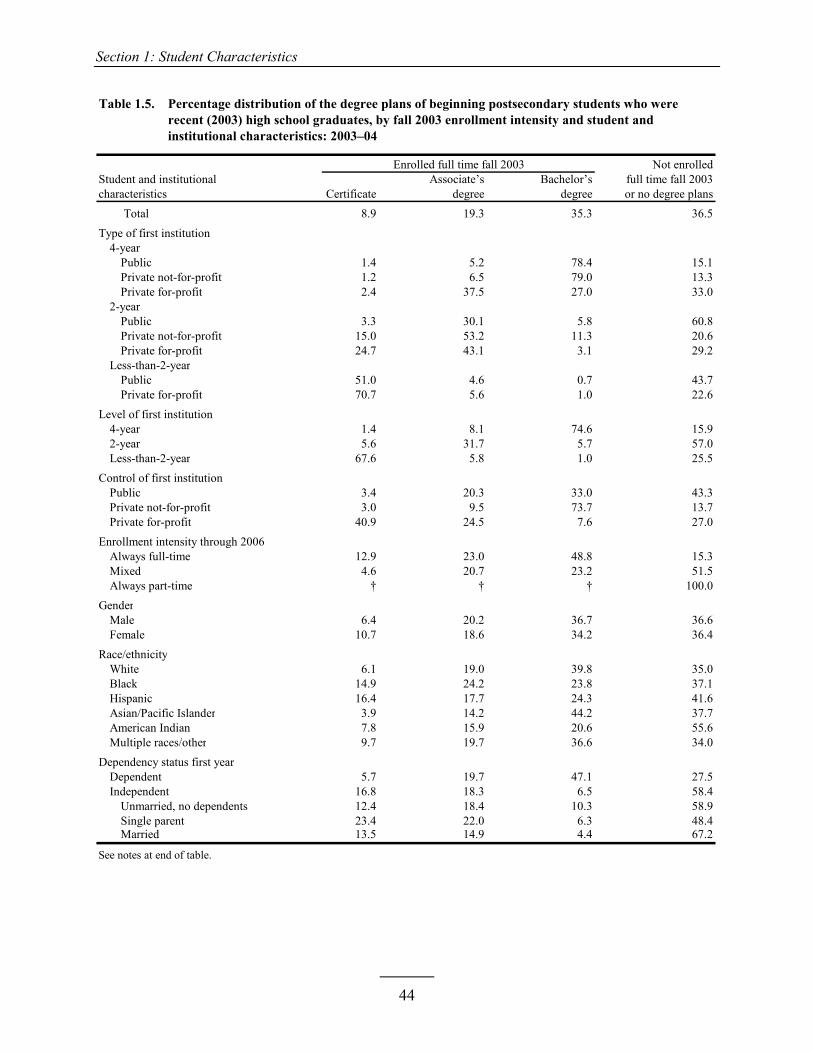
Section 1: Student Characteristics
44
Table 1.5.—Percentage distribution of the degree plans of beginning postsecondary students who were Table 1.5.—recent (2003) high school graduates, by fall 2003 enrollment intensity and student and Table 1.5.—institutional characteristics: 2003–04
Not enrolledStudent and institutional Associate’s Bachelor’s full time fall 2003characteristics Certificate degree degree or no degree plans
Total 8.9 19.3 35.3 36.5
Type of first institution4-year
Public 1.4 5.2 78.4 15.1Private not-for-profit 1.2 6.5 79.0 13.3Private for-profit 2.4 37.5 27.0 33.0
2-yearPublic 3.3 30.1 5.8 60.8Private not-for-profit 15.0 53.2 11.3 20.6Private for-profit 24.7 43.1 3.1 29.2
Less-than-2-yearPublic 51.0 4.6 0.7 43.7Private for-profit 70.7 5.6 1.0 22.6
Level of first institution4-year 1.4 8.1 74.6 15.92-year 5.6 31.7 5.7 57.0Less-than-2-year 67.6 5.8 1.0 25.5
Control of first institutionPublic 3.4 20.3 33.0 43.3Private not-for-profit 3.0 9.5 73.7 13.7Private for-profit 40.9 24.5 7.6 27.0
Enrollment intensity through 2006Always full-time 12.9 23.0 48.8 15.3Mixed 4.6 20.7 23.2 51.5Always part-time † † † 100.0
GenderMale 6.4 20.2 36.7 36.6Female 10.7 18.6 34.2 36.4
Race/ethnicityWhite 6.1 19.0 39.8 35.0Black 14.9 24.2 23.8 37.1Hispanic 16.4 17.7 24.3 41.6Asian/Pacific Islander 3.9 14.2 44.2 37.7American Indian 7.8 15.9 20.6 55.6Multiple races/other 9.7 19.7 36.6 34.0
Dependency status first yearDependent 5.7 19.7 47.1 27.5Independent 16.8 18.3 6.5 58.4
Unmarried, no dependents 12.4 18.4 10.3 58.9Single parent 23.4 22.0 6.3 48.4Married 13.5 14.9 4.4 67.2
See notes at end of table.
Enrolled full time fall 2003
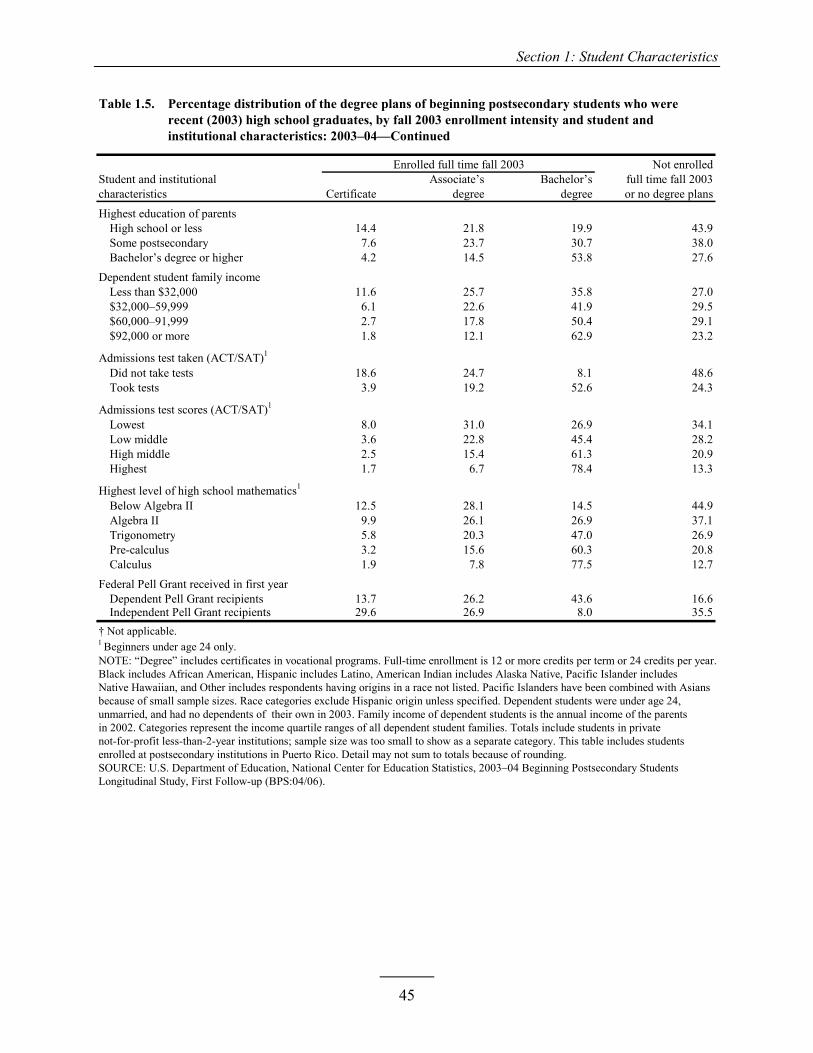
Section 1: Student Characteristics
45
Table 1.5.—Percentage distribution of the degree plans of beginning postsecondary students who were Table 1.5.—recent (2003) high school graduates, by fall 2003 enrollment intensity and student and Table 1.5.—institutional characteristics: 2003–04—Continued
Not enrolledStudent and institutional Associate’s Bachelor’s full time fall 2003characteristics Certificate degree degree or no degree plans
Highest education of parentsHigh school or less 14.4 21.8 19.9 43.9Some postsecondary 7.6 23.7 30.7 38.0Bachelor’s degree or higher 4.2 14.5 53.8 27.6
Dependent student family income Less than $32,000 11.6 25.7 35.8 27.0$32,000–59,999 6.1 22.6 41.9 29.5$60,000–91,999 2.7 17.8 50.4 29.1$92,000 or more 1.8 12.1 62.9 23.2
Admissions test taken (ACT/SAT)1
Did not take tests 18.6 24.7 8.1 48.6Took tests 3.9 19.2 52.6 24.3
Admissions test scores (ACT/SAT)1
Lowest 8.0 31.0 26.9 34.1Low middle 3.6 22.8 45.4 28.2High middle 2.5 15.4 61.3 20.9Highest 1.7 6.7 78.4 13.3
Highest level of high school mathematics1
Below Algebra II 12.5 28.1 14.5 44.9Algebra II 9.9 26.1 26.9 37.1Trigonometry 5.8 20.3 47.0 26.9Pre-calculus 3.2 15.6 60.3 20.8Calculus 1.9 7.8 77.5 12.7
Federal Pell Grant received in first yearDependent Pell Grant recipients 13.7 26.2 43.6 16.6Independent Pell Grant recipients 29.6 26.9 8.0 35.5
† Not applicable.1 Beginners under age 24 only.NOTE: “Degree” includes certificates in vocational programs. Full-time enrollment is 12 or more credits per term or 24 credits per year.Black includes African American, Hispanic includes Latino, American Indian includes Alaska Native, Pacific Islander includes Native Hawaiian, and Other includes respondents having origins in a race not listed. Pacific Islanders have been combined with Asians because of small sample sizes. Race categories exclude Hispanic origin unless specified. Dependent students were under age 24, unmarried, and had no dependents of their own in 2003. Family income of dependent students is the annual income of the parents in 2002. Categories represent the income quartile ranges of all dependent student families. Totals include students in private not-for-profit less-than-2-year institutions; sample size was too small to show as a separate category. This table includes students enrolled at postsecondary institutions in Puerto Rico. Detail may not sum to totals because of rounding.SOURCE: U.S. Department of Education, National Center for Education Statistics, 2003–04 Beginning Postsecondary StudentsLongitudinal Study, First Follow-up (BPS:04/06).
Enrolled full time fall 2003

Section 1: Student Characteristics
46
Table 1.6.—Percentage distribution of beginning postsecondary students’ gender and the percentage reporting a Table 1.5.—disability, by student and institutional characteristics: 2003–04
Student and institutional characteristics Male Female Any disability
Total 42.6 57.4 10.3
Type of first institution4-year
Public 44.6 55.4 7.5Private not-for-profit 43.0 57.0 8.8Private for-profit 43.7 56.3 11.2
2-yearPublic 44.0 56.0 11.3Private not-for-profit 39.8 60.2 10.7Private for-profit 45.5 54.5 15.9
Less-than-2-yearPublic 42.6 57.4 12.1Private for-profit 23.8 76.2 12.9
Level of first institution4-year 44.0 56.0 8.22-year 44.0 56.0 11.8Less-than-2-year 26.9 73.1 12.7
Control of first institutionPublic 44.2 55.8 9.9Private not-for-profit 42.6 57.4 8.9Private for-profit 35.0 65.0 13.4
Degree plans first yearNone 44.7 55.3 11.8Certificate 32.1 67.9 13.7Associate’s degree 43.0 57.0 10.8Bachelor’s degree 45.1 54.9 8.2
Enrollment intensity through 2006Always full-time 42.9 57.1 9.9Mixed 42.1 57.9 10.4Always part-time 42.1 57.9 11.9
Recent (2003) high school graduates enrolled full time fall 2003Certificate plans 36.4 63.6 10.9Associate’s degree plans 46.8 53.2 8.7Bachelor’s degree plans 43.7 56.3 7.3
Age first year enrolled18 years or younger 41.9 58.1 8.419 years 48.8 51.2 9.320–23 years 44.8 55.2 11.424–29 years 39.5 60.5 12.930 or older 33.5 66.5 15.4
Race/ethnicityWhite 43.8 56.2 11.1Black 38.1 61.9 7.3Hispanic 39.4 60.6 8.9Asian/Pacific Islander 48.3 51.7 5.9American Indian 39.3 60.7 19.9Multiple races/other 45.4 54.6 16.7
See notes at end of table.

Section 1: Student Characteristics
47
Table 1.6.—Percentage distribution of beginning postsecondary students’ gender and the percentage reporting a Table 1.5.—disability, by student and institutional characteristics: 2003–04—Continued
Student and institutional characteristics Male Female Any disability
Dependency status first yearDependent 46.2 53.8 8.8Independent 33.8 66.2 13.9
Unmarried, no dependents 52.7 47.3 16.5Single parent 19.7 80.3 13.3Married 35.0 65.0 12.9
Highest education of parentsHigh school or less 38.4 61.6 10.1Some postsecondary 39.8 60.2 10.7Bachelor’s degree or higher 48.2 51.8 9.9
Dependent student family income Less than $32,000 41.8 58.2 9.2$32,000–59,999 44.7 55.3 8.3$60,000–91,999 47.7 52.3 7.9$92,000 or more 51.2 48.8 9.9
Admissions test taken (ACT/SAT)1
Did not take tests 44.2 55.8 11.6Took tests 44.5 55.5 8.5
Admissions test scores (ACT/SAT)1
Lowest 40.3 59.7 8.5Low middle 42.5 57.5 9.2High middle 46.9 53.1 8.7Highest 48.7 51.3 7.5
Highest level of high school mathematics1
Below Algebra II 43.8 56.2 13.2Algebra II 43.3 56.7 9.8Trigonometry 42.1 57.9 8.8Pre-calculus 45.0 55.0 7.9Calculus 49.0 51.0 6.0
Federal Pell Grant received in first yearDependent Pell Grant recipients 41.7 58.3 8.6Independent Pell Grant recipients 25.0 75.0 15.7
1 Beginners under age 24 only.NOTE: “Degree” includes certificates in vocational programs. Full-time enrollment is 12 or more credits per term or 24 credits per year. Black includes African American, Hispanic includes Latino, American Indian includes Alaska Native, Pacific Islander includes Native Hawaiian, and Other includes respondents having origins in a race not listed. Pacific Islanders have been combined with Asians because of small sample sizes. Race categories exclude Hispanic origin unless specified. Dependent students were under age 24, unmarried, and had no dependents of their own in 2003. Family income of dependent students is the annual income of the parents in 2002. Categories represent the income quartile ranges of all dependent student families. Totals include students in private not-for-profit less-than-2-year institutions; sample size was too small to show as a separate category. “Any disability” includes students who reported having a “long-lasting” condition such as blindness, deafness, a severe vision or hearing impairment; a condition that limits “one or more of the basic physical activities such as walking, climbing stairs, reaching, lifting, or carrying”; or who responded they had any other physical, mental, or emotional condition that lasted 6 or more months and who had difficulty doing one of the following five activities: getting to school, getting around campus, learning, dressing, or working at a job. This table includes students enrolled at postsecondary institutions in Puerto Rico. Detail may not sum to totals because of rounding.SOURCE: U.S. Department of Education, National Center for Education Statistics, 2003–04 Beginning Postsecondary StudentsLongitudinal Study, First Follow-up (BPS:04/06).

Section 1: Student Characteristics
48
Table 1.7.—Percentage distribution of beginning postsecondary students’ age, by student and institutional Table 1.6.—characteristics: 2003–04
Student and institutional 18 years 30 yearscharacteristics or younger 19 years 20–23 years 24–29 years or older
Total 42.6 23.4 12.8 7.9 13.3
Type of first institution4-year
Public 61.5 28.8 5.4 2.0 2.4Private not-for-profit 58.9 28.7 5.7 2.7 4.1Private for-profit 27.4 11.8 18.6 19.1 23.2
2-yearPublic 34.2 22.0 16.0 8.9 18.8Private not-for-profit 35.2 19.6 18.8 10.5 15.9Private for-profit 20.9 16.3 25.4 17.6 19.8
Less-than-2-yearPublic 8.0 10.5 11.7 21.2 48.5Private for-profit 19.7 14.9 23.9 19.4 22.1
Level of first institution4-year 58.0 27.4 6.5 3.5 4.52-year 32.9 21.4 17.0 9.8 18.9Less-than-2-year 18.0 13.9 22.0 19.4 26.6
Control of first institutionPublic 44.0 24.3 12.0 6.5 13.2Private not-for-profit 56.9 27.8 6.8 3.2 5.3Private for-profit 21.8 14.6 23.1 18.8 21.6
Degree plans first yearNone 36.5 18.8 15.5 8.6 20.5Certificate 20.5 15.1 20.9 17.1 26.3Associate’s degree 33.4 22.5 16.5 10.3 17.2Bachelor’s degree 59.8 28.2 6.1 2.3 3.5
Enrollment intensity through 2006Always full-time 49.5 25.5 11.3 6.4 7.3Mixed 40.7 23.9 13.4 8.2 13.7Always part-time 16.3 13.1 18.5 13.5 38.5
Recent (2003) high school graduates enrolled full time fall 2003Certificate plans 62.1 33.7 4.2 # #Associate’s degree plans 63.4 34.7 1.9 # #Bachelor’s degree plans 69.3 29.9 0.9 # #
GenderMale 42.0 26.8 13.5 7.3 10.4Female 43.1 20.9 12.3 8.3 15.4
Race/ethnicityWhite 44.1 26.0 10.5 6.7 12.7Black 33.3 17.5 19.2 12.0 18.0Hispanic 41.2 19.0 16.3 9.6 13.9Asian/Pacific Islander 52.4 21.4 13.3 6.6 6.3American Indian 23.7 24.7 18.7 14.2 18.7Multiple races/other 47.0 22.1 13.4 5.4 12.0
See notes at end of table.

Section 1: Student Characteristics
49
Table 1.7.—Percentage distribution of beginning postsecondary students’ age, by student and institutional Table 1.6.—characteristics: 2003–04—Continued
Student and institutional 18 years 30 yearscharacteristics or younger 19 years 20–23 years 24–29 years or older
Dependency status first yearDependent 57.7 31.0 11.2 † †Independent 5.8 4.9 16.7 27.0 45.6
Unmarried, no dependents 7.5 4.4 11.3 39.0 37.8Single parent 8.2 6.6 24.6 24.0 36.7Married 2.6 3.6 12.8 22.4 58.6
Highest education of parentsHigh school or less 30.8 18.5 15.2 11.1 24.3Some postsecondary 45.1 24.8 13.4 7.8 8.9Bachelor’s degree or higher 53.0 27.8 9.9 4.5 4.8
Dependent student family income Less than $32,000 52.9 30.4 16.7 # #$32,000–59,999 56.0 33.1 10.9 # #$60,000–91,999 61.8 29.4 8.9 # #$92,000 or more 61.1 31.3 7.6 # #
Admissions test taken (ACT/SAT)1
Did not take tests 36.8 26.9 36.2 † †Took tests 58.5 30.4 11.1 † †
Admissions test scores (ACT/SAT)1
Lowest 49.1 30.1 20.8 † †Low middle 59.3 30.1 10.6 † †High middle 59.8 31.6 8.5 † †Highest 65.8 29.9 4.3 † †
Highest level of high school mathematics1
Below Algebra II 40.7 28.2 31.1 † †Algebra II 50.5 29.2 20.3 † †Trigonometry 54.4 30.8 14.7 † †Pre-calculus 61.1 30.4 8.5 † †Calculus 64.4 30.0 5.6 † †
Federal Pell Grant received in first yearDependent Pell Grant recipients 57.9 30.4 11.7 † †Independent Pell Grant recipients 6.5 5.4 21.5 30.0 36.6
† Not applicable.# Rounds to zero.1 Beginners under age 24 only.NOTE: “Degree” includes certificates in vocational programs. Full-time enrollment is 12 or more credits per term or 24 credits per year. Black includes African American, Hispanic includes Latino, American Indian includes Alaska Native, Pacific Islander includes Native Hawaiian, and Other includes respondents having origins in a race not listed. Pacific Islanders have been combined with Asians because of small sample sizes. Race categories exclude Hispanic origin unless specified. Dependent students were under age 24, unmarried, and had no dependents of their own in 2003. Family income of dependent students is the annual income of the parents in 2002. Categories represent the income quartile ranges of all dependent student families. Totals include students in private not-for-profit less-than-2-year institutions; sample size was too small to show as a separate category. This table includes students enrolled at postsecondary institutions in Puerto Rico. Detail may not sum to totals because of rounding.SOURCE: U.S. Department of Education, National Center for Education Statistics, 2003–04 Beginning Postsecondary StudentsLongitudinal Study, First Follow-up (BPS:04/06).

Section 1: Student Characteristics
50
Table 1.8.—Percentage distribution of beginning postsecondary students’ race/ethnicity, by student and Table 1.7.—institutional characteristics: 2003–04
Asian/Student and institutional Pacific American Multiplecharacteristics White Black Hispanic Islander Indian races/other
Total 61.7 13.5 15.0 5.1 0.7 4.1
Type of first institution4-year
Public 69.7 8.8 9.6 7.0 0.7 4.2Private not-for-profit 69.9 11.4 9.8 5.3 0.2 3.4Private for-profit 45.6 21.3 19.7 4.0 1.0 8.4
2-yearPublic 61.2 13.8 15.6 4.7 0.7 3.9Private not-for-profit 44.9 16.4 28.2 3.5 2.9 4.1Private for-profit 53.3 22.7 17.9 1.4 0.4 4.1
Less-than-2-yearPublic 65.2 8.2 17.0 4.5 2.0 3.1Private for-profit 33.3 24.9 35.0 2.4 0.6 3.8
Level of first institution4-year 67.9 10.5 10.4 6.2 0.5 4.32-year 60.1 14.7 16.1 4.4 0.7 4.0Less-than-2-year 37.8 21.9 33.0 2.9 0.8 3.7
Control of first institutionPublic 64.5 11.8 13.4 5.6 0.7 4.0Private not-for-profit 67.6 11.6 11.8 5.3 0.4 3.4Private for-profit 42.3 23.4 26.2 2.5 0.6 5.0
Degree plans first yearNone 62.7 8.0 17.8 6.8 0.4 4.3Certificate 45.8 21.2 25.6 2.7 0.8 3.9Associate’s degree 60.0 16.1 14.7 4.2 0.9 4.0Bachelor’s degree 68.1 10.0 11.1 6.2 0.4 4.1
Enrollment intensity through 2006Always full-time 63.5 13.5 13.5 5.0 0.5 4.0Mixed 57.6 13.6 17.0 6.1 0.9 4.9Always part-time 61.7 13.2 17.9 3.4 1.0 2.8
Recent (2003) high school graduates enrolled full time fall 2003Certificate plans 46.5 13.8 32.5 2.0 0.3 5.0Associate’s degree plans 65.0 14.2 13.2 3.5 0.5 3.6Bachelor’s degree plans 71.1 8.6 9.7 5.9 0.4 4.3
GenderMale 63.3 12.1 13.9 5.8 0.6 4.3Female 60.4 14.5 15.9 4.6 0.7 3.9
Age first year enrolled18 years or younger 63.8 10.5 14.5 6.2 0.4 4.519 years 68.5 10.1 12.2 4.6 0.7 3.920–23 years 50.3 20.1 19.1 5.3 1.0 4.324–29 years 52.7 20.7 18.3 4.2 1.2 2.830 or older 58.9 18.3 15.8 2.4 0.9 3.7
See notes at end of table.
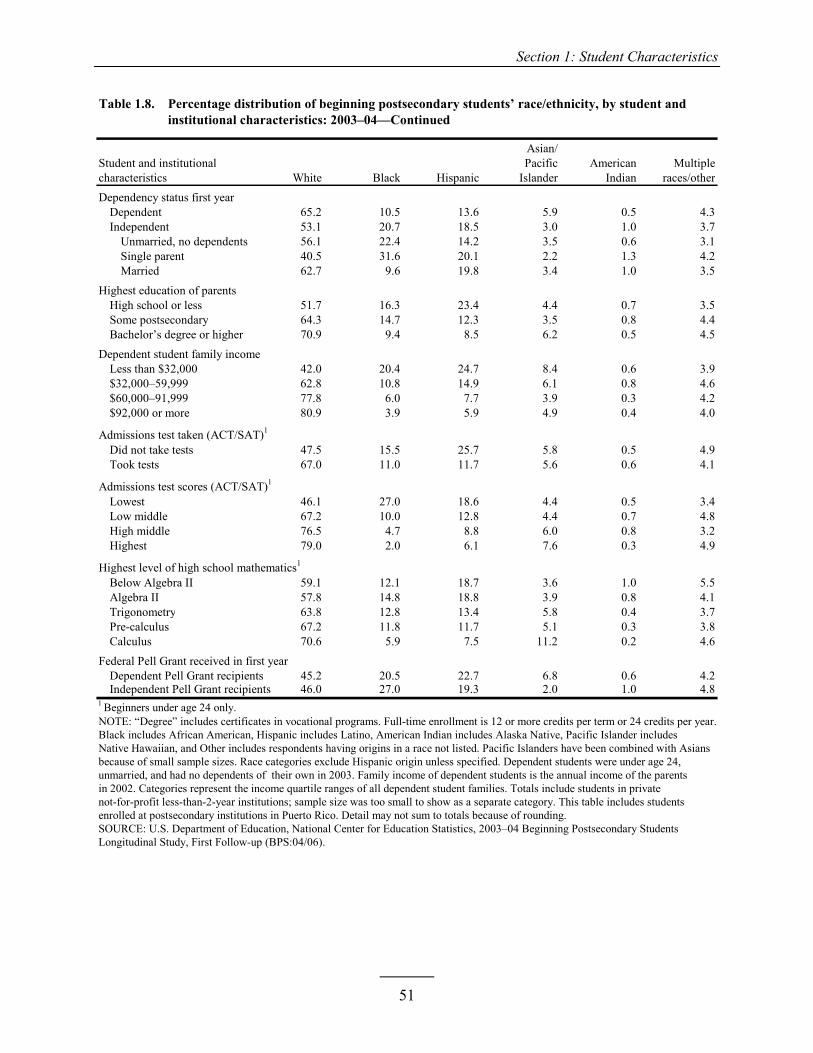
Section 1: Student Characteristics
51
Table 1.8.—Percentage distribution of beginning postsecondary students’ race/ethnicity, by student and Table 1.7.—institutional characteristics: 2003–04—Continued
Asian/Student and institutional Pacific American Multiplecharacteristics White Black Hispanic Islander Indian races/other
Dependency status first yearDependent 65.2 10.5 13.6 5.9 0.5 4.3Independent 53.1 20.7 18.5 3.0 1.0 3.7
Unmarried, no dependents 56.1 22.4 14.2 3.5 0.6 3.1Single parent 40.5 31.6 20.1 2.2 1.3 4.2Married 62.7 9.6 19.8 3.4 1.0 3.5
Highest education of parentsHigh school or less 51.7 16.3 23.4 4.4 0.7 3.5Some postsecondary 64.3 14.7 12.3 3.5 0.8 4.4Bachelor’s degree or higher 70.9 9.4 8.5 6.2 0.5 4.5
Dependent student family income Less than $32,000 42.0 20.4 24.7 8.4 0.6 3.9$32,000–59,999 62.8 10.8 14.9 6.1 0.8 4.6$60,000–91,999 77.8 6.0 7.7 3.9 0.3 4.2$92,000 or more 80.9 3.9 5.9 4.9 0.4 4.0
Admissions test taken (ACT/SAT)1
Did not take tests 47.5 15.5 25.7 5.8 0.5 4.9Took tests 67.0 11.0 11.7 5.6 0.6 4.1
Admissions test scores (ACT/SAT)1
Lowest 46.1 27.0 18.6 4.4 0.5 3.4Low middle 67.2 10.0 12.8 4.4 0.7 4.8High middle 76.5 4.7 8.8 6.0 0.8 3.2Highest 79.0 2.0 6.1 7.6 0.3 4.9
Highest level of high school mathematics1
Below Algebra II 59.1 12.1 18.7 3.6 1.0 5.5Algebra II 57.8 14.8 18.8 3.9 0.8 4.1Trigonometry 63.8 12.8 13.4 5.8 0.4 3.7Pre-calculus 67.2 11.8 11.7 5.1 0.3 3.8Calculus 70.6 5.9 7.5 11.2 0.2 4.6
Federal Pell Grant received in first yearDependent Pell Grant recipients 45.2 20.5 22.7 6.8 0.6 4.2Independent Pell Grant recipients 46.0 27.0 19.3 2.0 1.0 4.8
1 Beginners under age 24 only.NOTE: “Degree” includes certificates in vocational programs. Full-time enrollment is 12 or more credits per term or 24 credits per year. Black includes African American, Hispanic includes Latino, American Indian includes Alaska Native, Pacific Islander includes Native Hawaiian, and Other includes respondents having origins in a race not listed. Pacific Islanders have been combined with Asians because of small sample sizes. Race categories exclude Hispanic origin unless specified. Dependent students were under age 24, unmarried, and had no dependents of their own in 2003. Family income of dependent students is the annual income of the parents in 2002. Categories represent the income quartile ranges of all dependent student families. Totals include students in private not-for-profit less-than-2-year institutions; sample size was too small to show as a separate category. This table includes students enrolled at postsecondary institutions in Puerto Rico. Detail may not sum to totals because of rounding.SOURCE: U.S. Department of Education, National Center for Education Statistics, 2003–04 Beginning Postsecondary StudentsLongitudinal Study, First Follow-up (BPS:04/06).
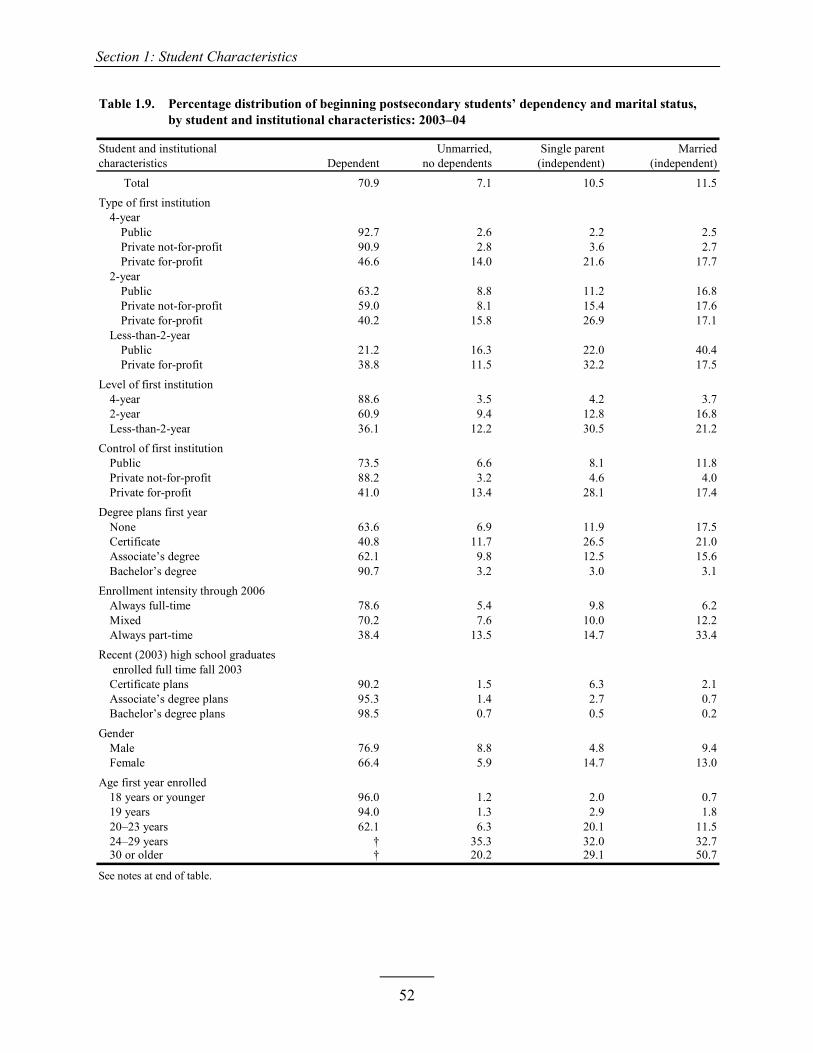
Section 1: Student Characteristics
52
Table 1.9.—Percentage distribution of beginning postsecondary students’ dependency and marital status, Table 1.8.—by student and institutional characteristics: 2003–04
Student and institutional Unmarried, Single parent Marriedcharacteristics Dependent no dependents (independent) (independent)
Total 70.9 7.1 10.5 11.5Type of first institution
4-yearPublic 92.7 2.6 2.2 2.5Private not-for-profit 90.9 2.8 3.6 2.7Private for-profit 46.6 14.0 21.6 17.7
2-yearPublic 63.2 8.8 11.2 16.8Private not-for-profit 59.0 8.1 15.4 17.6Private for-profit 40.2 15.8 26.9 17.1
Less-than-2-yearPublic 21.2 16.3 22.0 40.4Private for-profit 38.8 11.5 32.2 17.5
Level of first institution4-year 88.6 3.5 4.2 3.72-year 60.9 9.4 12.8 16.8Less-than-2-year 36.1 12.2 30.5 21.2
Control of first institutionPublic 73.5 6.6 8.1 11.8Private not-for-profit 88.2 3.2 4.6 4.0Private for-profit 41.0 13.4 28.1 17.4
Degree plans first yearNone 63.6 6.9 11.9 17.5Certificate 40.8 11.7 26.5 21.0Associate’s degree 62.1 9.8 12.5 15.6Bachelor’s degree 90.7 3.2 3.0 3.1
Enrollment intensity through 2006Always full-time 78.6 5.4 9.8 6.2Mixed 70.2 7.6 10.0 12.2Always part-time 38.4 13.5 14.7 33.4
Recent (2003) high school graduates enrolled full time fall 2003Certificate plans 90.2 1.5 6.3 2.1Associate’s degree plans 95.3 1.4 2.7 0.7Bachelor’s degree plans 98.5 0.7 0.5 0.2
GenderMale 76.9 8.8 4.8 9.4Female 66.4 5.9 14.7 13.0
Age first year enrolled18 years or younger 96.0 1.2 2.0 0.719 years 94.0 1.3 2.9 1.820–23 years 62.1 6.3 20.1 11.524–29 years † 35.3 32.0 32.730 or older † 20.2 29.1 50.7
See notes at end of table.

Section 1: Student Characteristics
53
Table 1.9.—Percentage distribution of beginning postsecondary students’ dependency and marital status, Table 1.8.—by student and institutional characteristics: 2003–04—Continued
Student and institutional Unmarried, Single parent Marriedcharacteristics Dependent no dependents (independent) (independent)
Race/ethnicityWhite 74.9 6.5 6.9 11.7Black 55.3 11.8 24.7 8.2Hispanic 64.1 6.7 14.0 15.1Asian/Pacific Islander 82.9 4.9 4.5 7.7American Indian 55.6 6.9 20.6 16.9Multiple races/other 73.9 5.4 10.9 9.8
Highest education of parentsHigh school or less 54.2 10.5 15.6 19.7Some postsecondary 74.9 6.1 10.8 8.2Bachelor’s degree or higher 85.7 3.8 5.0 5.5
Admissions test taken (ACT/SAT)1
Did not take tests 78.2 3.0 12.1 6.6Took tests 92.9 1.8 3.4 1.8
Admissions test scores (ACT/SAT)1
Lowest 85.9 3.9 7.1 3.1Low middle 93.3 1.5 3.0 2.2High middle 94.5 1.1 3.0 1.3Highest 98.1 0.8 0.7 0.5
Highest level of high school mathematics1
Below Algebra II 80.1 3.2 10.8 5.9Algebra II 87.3 2.1 6.9 3.6Trigonometry 91.3 1.5 4.9 2.3Pre-calculus 94.5 2.7 1.7 1.1Calculus 97.0 0.9 1.4 0.6
Federal Pell Grant received in first year 58.7 8.5 21.0 11.8† Not applicable.1 Beginners under age 24 only.NOTE: “Degree” includes certificates in vocational programs. Full-time enrollment is 12 or more credits per term or 24 credits per year. Black includes African American, Hispanic includes Latino, American Indian includes Alaska Native, Pacific Islander includes Native Hawaiian, and Other includes respondents having origins in a race not listed. Pacific Islanders have been combined with Asians because of small sample sizes. Race categories exclude Hispanic origin unless specified. Dependent students were under age 24, unmarried, and had no dependents of their own in 2003. Family income of dependent students is the annual income of the parents in 2002. Categories represent the income quartile ranges of all dependent student families. Totals include students in private not-for-profit less-than-2-year institutions; sample size was too small to show as a separate category. This table includes students enrolled at postsecondary institutions in Puerto Rico. Detail may not sum to totals because of rounding.SOURCE: U.S. Department of Education, National Center for Education Statistics, 2003–04 Beginning Postsecondary StudentsLongitudinal Study, First Follow-up (BPS:04/06).
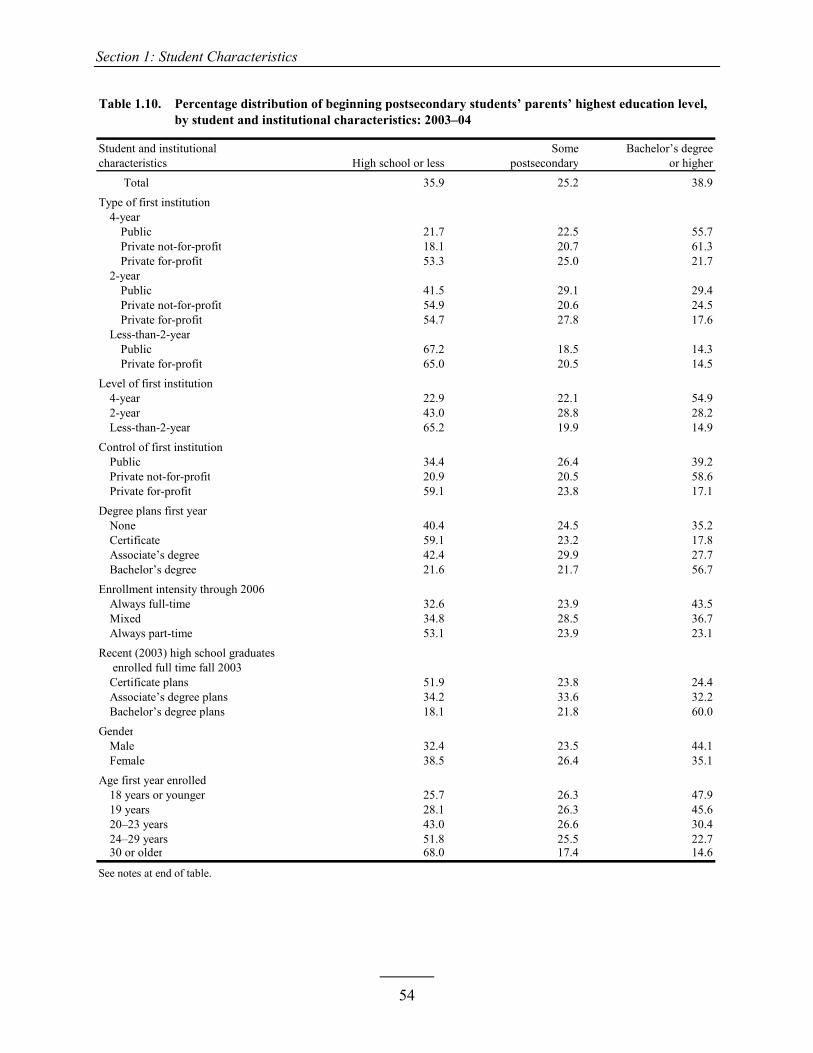
Section 1: Student Characteristics
54
Table 1.10.—Percentage distribution of beginning postsecondary students’ parents’ highest education level, Table 1.10.—by student and institutional characteristics: 2003–04
Student and institutional Some Bachelor’s degreecharacteristics High school or less postsecondary or higher
Total 35.9 25.2 38.9Type of first institution
4-yearPublic 21.7 22.5 55.7Private not-for-profit 18.1 20.7 61.3Private for-profit 53.3 25.0 21.7
2-yearPublic 41.5 29.1 29.4Private not-for-profit 54.9 20.6 24.5Private for-profit 54.7 27.8 17.6
Less-than-2-yearPublic 67.2 18.5 14.3Private for-profit 65.0 20.5 14.5
Level of first institution4-year 22.9 22.1 54.92-year 43.0 28.8 28.2Less-than-2-year 65.2 19.9 14.9
Control of first institutionPublic 34.4 26.4 39.2Private not-for-profit 20.9 20.5 58.6Private for-profit 59.1 23.8 17.1
Degree plans first yearNone 40.4 24.5 35.2Certificate 59.1 23.2 17.8Associate’s degree 42.4 29.9 27.7Bachelor’s degree 21.6 21.7 56.7
Enrollment intensity through 2006Always full-time 32.6 23.9 43.5Mixed 34.8 28.5 36.7Always part-time 53.1 23.9 23.1
Recent (2003) high school graduates enrolled full time fall 2003Certificate plans 51.9 23.8 24.4Associate’s degree plans 34.2 33.6 32.2Bachelor’s degree plans 18.1 21.8 60.0
GenderMale 32.4 23.5 44.1Female 38.5 26.4 35.1
Age first year enrolled18 years or younger 25.7 26.3 47.919 years 28.1 26.3 45.620–23 years 43.0 26.6 30.424–29 years 51.8 25.5 22.730 or older 68.0 17.4 14.6
See notes at end of table.

Section 1: Student Characteristics
55
Table 1.10.—Percentage distribution of beginning postsecondary students’ parents’ highest education level, Table 1.10.—by student and institutional characteristics: 2003–04—Continued
Student and institutional Some Bachelor’s degreecharacteristics High school or less postsecondary or higherRace/ethnicity
White 29.8 25.9 44.3Black 44.3 28.0 27.7Hispanic 56.6 20.9 22.4Asian/Pacific Islander 32.2 18.2 49.7American Indian 40.6 30.0 29.4Multiple races/other 30.6 26.9 42.5
Dependency status first yearDependent 27.2 26.3 46.5Independent 58.0 22.3 19.7
Unmarried, no dependents 55.5 22.6 21.9Single parent 54.5 26.5 19.0Married 62.7 18.3 19.1
Dependent student family income Less than $32,000 47.0 29.0 23.9$32,000–59,999 30.4 30.6 39.0$60,000–91,999 20.1 27.6 52.4$92,000 or more 9.1 16.8 74.1
Admissions test taken (ACT/SAT)1
Did not take tests 44.4 29.2 26.4Took tests 25.3 25.7 49.0
Admissions test scores (ACT/SAT)1
Lowest 41.4 28.6 30.0Low middle 28.8 29.5 41.7High middle 19.7 26.0 54.3Highest 10.8 18.2 70.9
Highest level of high school mathematics1
Below Algebra II 41.4 30.4 28.2Algebra II 35.7 28.9 35.4Trigonometry 26.9 27.6 45.5Pre-calculus 22.6 24.4 52.9Calculus 16.1 18.9 65.0
Federal Pell Grant received in first yearDependent Pell Grant recipients 44.0 29.9 26.1Independent Pell Grant recipients 61.6 22.6 15.8
1 Beginners under age 24 only.NOTE: “Degree” includes certificates in vocational programs. Full-time enrollment is 12 or more credits per term or 24 credits per year.Black includes African American, Hispanic includes Latino, American Indian includes Alaska Native, Pacific Islander includes Native Hawaiian, and Other includes respondents having origins in a race not listed. Pacific Islanders have been combined with Asians because of small sample sizes. Race categories exclude Hispanic origin unless specified. Dependent students were under age 24, unmarried, and had no dependents of their own in 2003. Family income of dependent students is the annual income of the parents in 2002. Categories represent the income quartile ranges of all dependent student families. Totals include students in private not-for-profit less-than-2-year institutions; sample size was too small to show as a separate category. This table includes students enrolled at postsecondary institutions in Puerto Rico. Detail may not sum to totals because of rounding.SOURCE: U.S. Department of Education, National Center for Education Statistics, 2003–04 Beginning Postsecondary StudentsLongitudinal Study, First Follow-up (BPS:04/06).

Section 1: Student Characteristics
56
Table 1.11.—Percentage distribution of dependent beginning postsecondary students’ family income, by Table 1.10.—student and institutional characteristics: 2003–04
Student and institutional characteristics Less than $32,000 $32,000–59,999 $60,000–91,999 $92,000 or more
Total 25.1 26.7 24.9 23.3Type of first institution
4-yearPublic 18.4 24.4 28.3 28.9Private not-for-profit 18.6 23.7 23.5 34.2Private for-profit 48.6 32.2 11.9 7.3
2-yearPublic 26.8 30.0 26.1 17.1Private not-for-profit 49.8 19.6 13.9 16.7Private for-profit 42.6 32.2 16.6 8.6
Less-than-2-yearPublic 39.9 35.1 21.1 3.9Private for-profit 66.8 23.8 4.9 4.5
Level of first institution4-year 19.7 24.5 26.1 29.72-year 28.2 29.9 25.3 16.6Less-than-2-year 64.7 24.6 6.4 4.3
Control of first institutionPublic 22.9 27.3 27.1 22.7Private not-for-profit 20.3 23.4 23.0 33.3Private for-profit 54.7 28.6 10.3 6.4
Degree plans first yearNone 18.5 28.4 28.5 24.6Certificate 48.5 27.7 14.2 9.6Associate’s degree 30.8 30.5 24.0 14.7Bachelor’s degree 19.3 24.0 26.4 30.3
Enrollment intensity through 2006Always full-time 26.2 25.5 24.0 24.4Mixed 22.4 29.0 26.7 21.9Always part-time 24.9 29.9 27.4 17.8
Recent (2003) high school graduates enrolled full time fall 2003Certificate plans 47.6 30.2 11.6 10.6Associate’s degree plans 29.9 31.7 23.6 14.7Bachelor’s degree plans 18.1 23.2 27.1 31.6
GenderMale 22.7 25.8 25.7 25.8Female 27.2 27.5 24.2 21.1
Age first year enrolled18 years or younger 22.9 25.9 26.6 24.619 years 24.5 28.5 23.6 23.420–23 years 37.8 26.3 19.9 16.024–29 years † † † †30 or older † † † †
See notes at end of table.

Section 1: Student Characteristics
57
Table 1.11.—Percentage distribution of dependent beginning postsecondary students’ family income, by Table 1.10.—student and institutional characteristics: 2003–04—Continued
Student and institutional characteristics Less than $32,000 $32,000–59,999 $60,000–91,999 $92,000 or moreRace/ethnicity
White 16.1 25.6 29.6 28.7Black 49.1 27.7 14.4 8.8Hispanic 46.0 29.6 14.2 10.2Asian/Pacific Islander 36.0 28.0 16.7 19.3American Indian 28.8 38.6 16.5 16.1Multiple races/other 23.3 29.2 25.2 22.3
Highest education of parentsHigh school or less 43.2 30.2 18.7 7.9Some postsecondary 27.4 31.3 26.4 15.0Bachelor’s degree or higher 12.6 22.3 28.0 37.0
Admissions test taken (ACT/SAT)1
Did not take tests 41.1 28.4 19.0 11.5Took tests 21.7 26.4 26.2 25.8
Admissions test scores (ACT/SAT)1
Lowest 37.6 29.0 20.4 13.0Low middle 24.4 28.6 25.9 21.1High middle 13.8 26.7 30.1 29.4Highest 11.9 21.3 28.1 38.7
Highest level of high school mathematics1
Below Algebra II 36.9 28.5 19.7 14.9Algebra II 30.2 29.0 24.4 16.5Trigonometry 23.7 27.7 25.9 22.7Pre-calculus 19.4 24.9 27.5 28.2Calculus 15.6 22.7 25.9 35.8
Federal Pell Grant received in first yearDependent Pell Grant recipients 63.7 34.6 1.7 #Independent Pell Grant recipients † † † †
† Not applicable.# Rounds to zero.1 Beginners under age 24 only.NOTE: “Degree” includes certificates in vocational programs. Full-time enrollment is 12 or more credits per term or 24 credits per year. Black includes African American, Hispanic includes Latino, American Indian includes Alaska Native, Pacific Islander includes Native Hawaiian, and Other includes respondents having origins in a race not listed. Pacific Islanders have been combined with Asians because of small sample sizes. Race categories exclude Hispanic origin unless specified. Dependent students were under age 24, unmarried, and had no dependents of their own in 2003. Family income of dependent students is the annual income of the parents in 2002. Categories represent the income quartile ranges of all dependent student families. Totals include students in private not-for-profit less-than-2-year institutions; sample size was too small to show as a separate category. This table includes students enrolled at postsecondary institutions in Puerto Rico. Detail may not sum to totals because of rounding.SOURCE: U.S. Department of Education, National Center for Education Statistics, 2003–04 Beginning Postsecondary StudentsLongitudinal Study, First Follow-up (BPS:04/06).
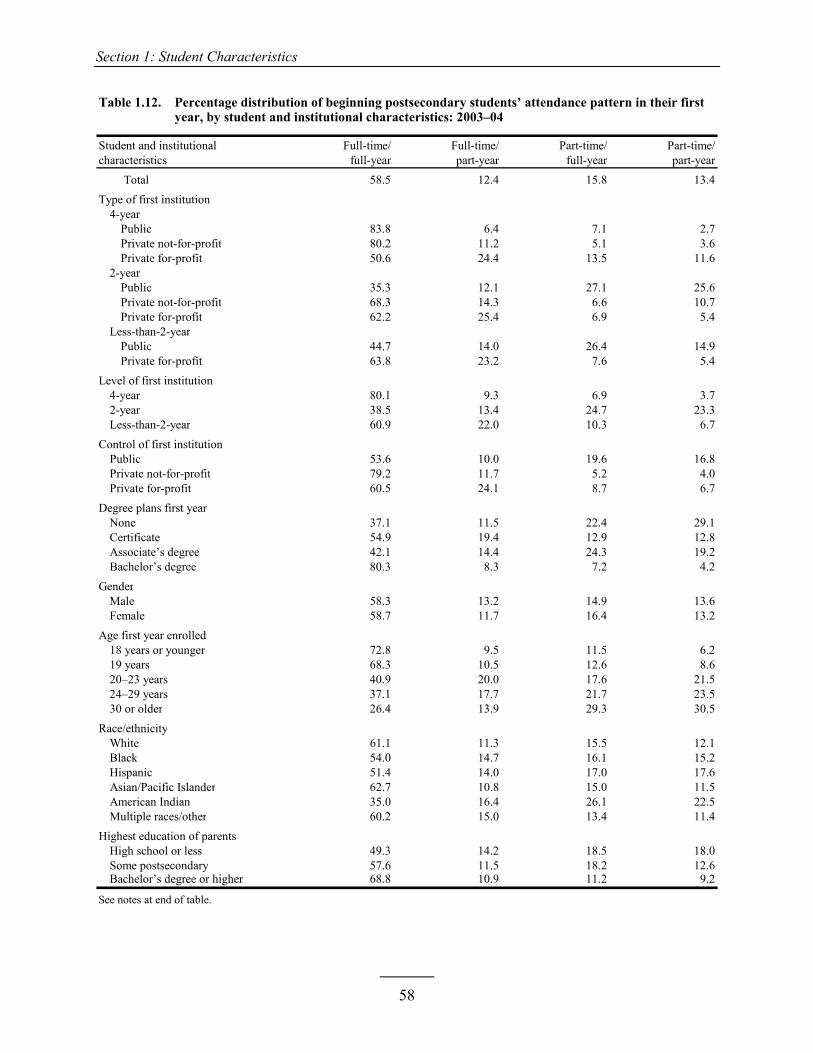
Section 1: Student Characteristics
58
Table 1.12.—Percentage distribution of beginning postsecondary students’ attendance pattern in their first Table 1.12.—year, by student and institutional characteristics: 2003–04
Student and institutional Full-time/ Full-time/ Part-time/ Part-time/characteristics full-year part-year full-year part-year
Total 58.5 12.4 15.8 13.4Type of first institution
4-yearPublic 83.8 6.4 7.1 2.7Private not-for-profit 80.2 11.2 5.1 3.6Private for-profit 50.6 24.4 13.5 11.6
2-yearPublic 35.3 12.1 27.1 25.6Private not-for-profit 68.3 14.3 6.6 10.7Private for-profit 62.2 25.4 6.9 5.4
Less-than-2-yearPublic 44.7 14.0 26.4 14.9Private for-profit 63.8 23.2 7.6 5.4
Level of first institution4-year 80.1 9.3 6.9 3.72-year 38.5 13.4 24.7 23.3Less-than-2-year 60.9 22.0 10.3 6.7
Control of first institutionPublic 53.6 10.0 19.6 16.8Private not-for-profit 79.2 11.7 5.2 4.0Private for-profit 60.5 24.1 8.7 6.7
Degree plans first yearNone 37.1 11.5 22.4 29.1Certificate 54.9 19.4 12.9 12.8Associate’s degree 42.1 14.4 24.3 19.2Bachelor’s degree 80.3 8.3 7.2 4.2
GenderMale 58.3 13.2 14.9 13.6Female 58.7 11.7 16.4 13.2
Age first year enrolled18 years or younger 72.8 9.5 11.5 6.219 years 68.3 10.5 12.6 8.620–23 years 40.9 20.0 17.6 21.524–29 years 37.1 17.7 21.7 23.530 or older 26.4 13.9 29.3 30.5
Race/ethnicityWhite 61.1 11.3 15.5 12.1Black 54.0 14.7 16.1 15.2Hispanic 51.4 14.0 17.0 17.6Asian/Pacific Islander 62.7 10.8 15.0 11.5American Indian 35.0 16.4 26.1 22.5Multiple races/other 60.2 15.0 13.4 11.4
Highest education of parentsHigh school or less 49.3 14.2 18.5 18.0Some postsecondary 57.6 11.5 18.2 12.6Bachelor’s degree or higher 68.8 10.9 11.2 9.2
See notes at end of table.
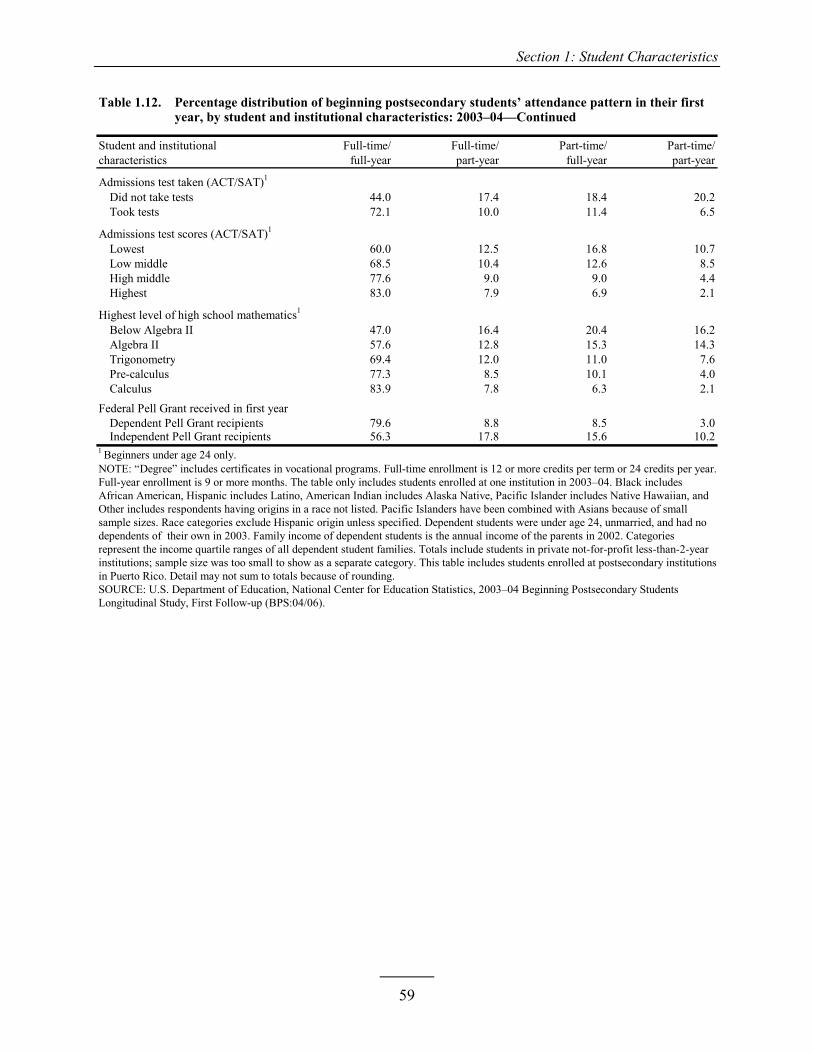
Section 1: Student Characteristics
59
Table 1.12.—Percentage distribution of beginning postsecondary students’ attendance pattern in their first Table 1.12.—year, by student and institutional characteristics: 2003–04—Continued
Student and institutional Full-time/ Full-time/ Part-time/ Part-time/characteristics full-year part-year full-year part-year
Admissions test taken (ACT/SAT)1
Did not take tests 44.0 17.4 18.4 20.2Took tests 72.1 10.0 11.4 6.5
Admissions test scores (ACT/SAT)1
Lowest 60.0 12.5 16.8 10.7Low middle 68.5 10.4 12.6 8.5High middle 77.6 9.0 9.0 4.4Highest 83.0 7.9 6.9 2.1
Highest level of high school mathematics1
Below Algebra II 47.0 16.4 20.4 16.2Algebra II 57.6 12.8 15.3 14.3Trigonometry 69.4 12.0 11.0 7.6Pre-calculus 77.3 8.5 10.1 4.0Calculus 83.9 7.8 6.3 2.1
Federal Pell Grant received in first yearDependent Pell Grant recipients 79.6 8.8 8.5 3.0Independent Pell Grant recipients 56.3 17.8 15.6 10.2
1 Beginners under age 24 only.NOTE: “Degree” includes certificates in vocational programs. Full-time enrollment is 12 or more credits per term or 24 credits per year. Full-year enrollment is 9 or more months. The table only includes students enrolled at one institution in 2003–04. Black includes African American, Hispanic includes Latino, American Indian includes Alaska Native, Pacific Islander includes Native Hawaiian, and Other includes respondents having origins in a race not listed. Pacific Islanders have been combined with Asians because of small sample sizes. Race categories exclude Hispanic origin unless specified. Dependent students were under age 24, unmarried, and had no dependents of their own in 2003. Family income of dependent students is the annual income of the parents in 2002. Categories represent the income quartile ranges of all dependent student families. Totals include students in private not-for-profit less-than-2-year institutions; sample size was too small to show as a separate category. This table includes students enrolled at postsecondary institutions in Puerto Rico. Detail may not sum to totals because of rounding.SOURCE: U.S. Department of Education, National Center for Education Statistics, 2003–04 Beginning Postsecondary StudentsLongitudinal Study, First Follow-up (BPS:04/06).

THIS PAGE INTENTIONALLY LEFT BLANK

61
Section 2: Academic Preparation and Performance
Not all beginning students enter postsecondary education with the same level of academic preparation or performance, and this information is useful for understanding rates of persistence and attainment. For all beginning students, information is available on the type of high school diploma they earned (if any) and the type of high school from which they graduated. For students under age 24 when they began their postsecondary education, information was usually available on their high school grade point average, the highest level of high school mathematics courses taken, any college credits they earned during high school, and the scores on college admission tests (ACT or SAT). The latter type of information is less relevant for older students who have been out of high school for a long time, and is only reported for students who were age 24 or older when they first started postsecondary education. With the exception of the admissions test scores, all data related to academic preparation and performance in high school in this report are student reported.
Type of High School
• Most (79 percent) beginning postsecondary students were public school graduates who earned a regular high school diploma (table 2.1). Another 8 percent graduated from a private high school, and 3 percent graduated from a foreign high school. The remaining 10 percent did not have a regular high school diploma—that is, they had a GED or other certificate of completion, had been homeschooled (less than 1 percent), or had not finished high school.
• Proportionately more students beginning at private not-for-profit 4-year institutions (19 percent) graduated from a private high school than students beginning at public 4-year institutions (10 percent).
• Twenty-three percent of beginning postsecondary students seeking a certificate at their first institution did not have a regular high school diploma.
• About one-quarter (26 percent) of students who began their postsecondary education when they were 24–29 years old and 22 percent of those who began when they were 30 years or older did not have a regular high school diploma.
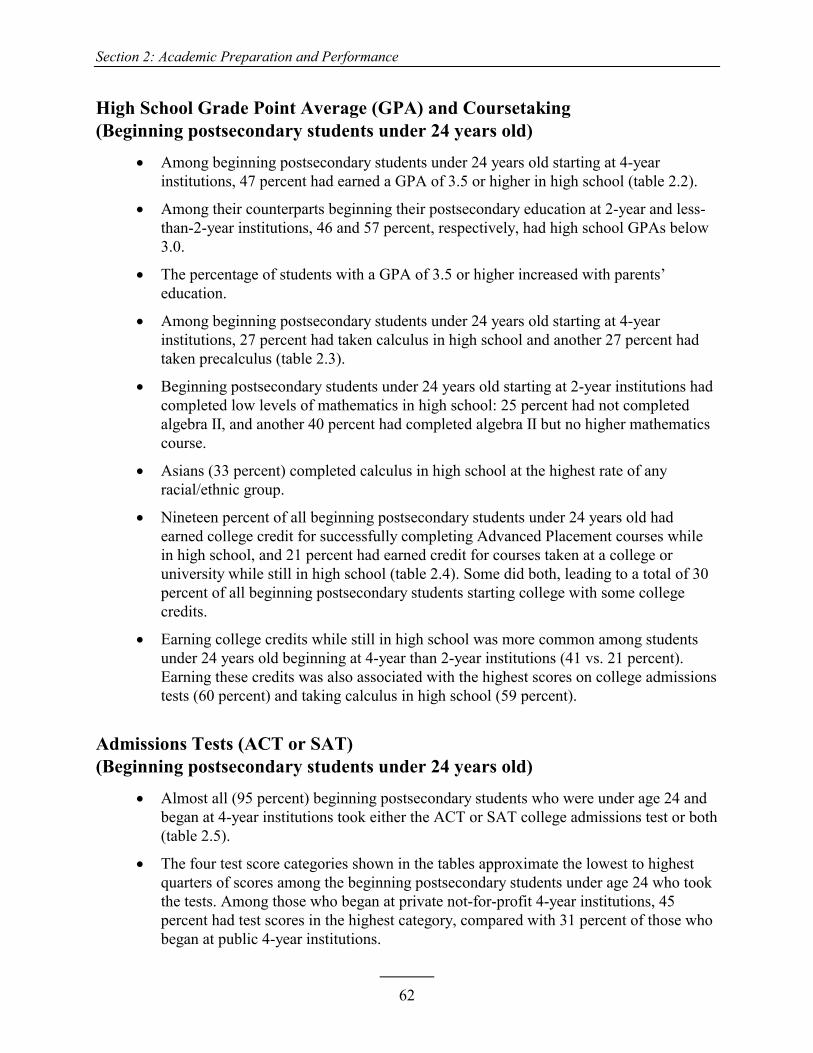
Section 2: Academic Preparation and Performance
62
High School Grade Point Average (GPA) and Coursetaking (Beginning postsecondary students under 24 years old)
• Among beginning postsecondary students under 24 years old starting at 4-year institutions, 47 percent had earned a GPA of 3.5 or higher in high school (table 2.2).
• Among their counterparts beginning their postsecondary education at 2-year and less-than-2-year institutions, 46 and 57 percent, respectively, had high school GPAs below 3.0.
• The percentage of students with a GPA of 3.5 or higher increased with parents’ education.
• Among beginning postsecondary students under 24 years old starting at 4-year institutions, 27 percent had taken calculus in high school and another 27 percent had taken precalculus (table 2.3).
• Beginning postsecondary students under 24 years old starting at 2-year institutions had completed low levels of mathematics in high school: 25 percent had not completed algebra II, and another 40 percent had completed algebra II but no higher mathematics course.
• Asians (33 percent) completed calculus in high school at the highest rate of any racial/ethnic group.
• Nineteen percent of all beginning postsecondary students under 24 years old had earned college credit for successfully completing Advanced Placement courses while in high school, and 21 percent had earned credit for courses taken at a college or university while still in high school (table 2.4). Some did both, leading to a total of 30 percent of all beginning postsecondary students starting college with some college credits.
• Earning college credits while still in high school was more common among students under 24 years old beginning at 4-year than 2-year institutions (41 vs. 21 percent). Earning these credits was also associated with the highest scores on college admissions tests (60 percent) and taking calculus in high school (59 percent).
Admissions Tests (ACT or SAT) (Beginning postsecondary students under 24 years old)
• Almost all (95 percent) beginning postsecondary students who were under age 24 and began at 4-year institutions took either the ACT or SAT college admissions test or both (table 2.5).
• The four test score categories shown in the tables approximate the lowest to highest quarters of scores among the beginning postsecondary students under age 24 who took the tests. Among those who began at private not-for-profit 4-year institutions, 45 percent had test scores in the highest category, compared with 31 percent of those who began at public 4-year institutions.
Section 2: Academic Preparation and Performance
63
• Admissions tests are not typically required for attending a community college; however, 68 percent of students starting at public 2-year institutions took an admissions test. Forty percent were in the lowest test score category among all beginning postsecondary students, and another 33 percent were in the low middle test score category.
• High admission test scores were associated with high-level mathematics coursetaking; 60 percent of beginning postsecondary students who took calculus in high school were in the top category of college admissions test scores.
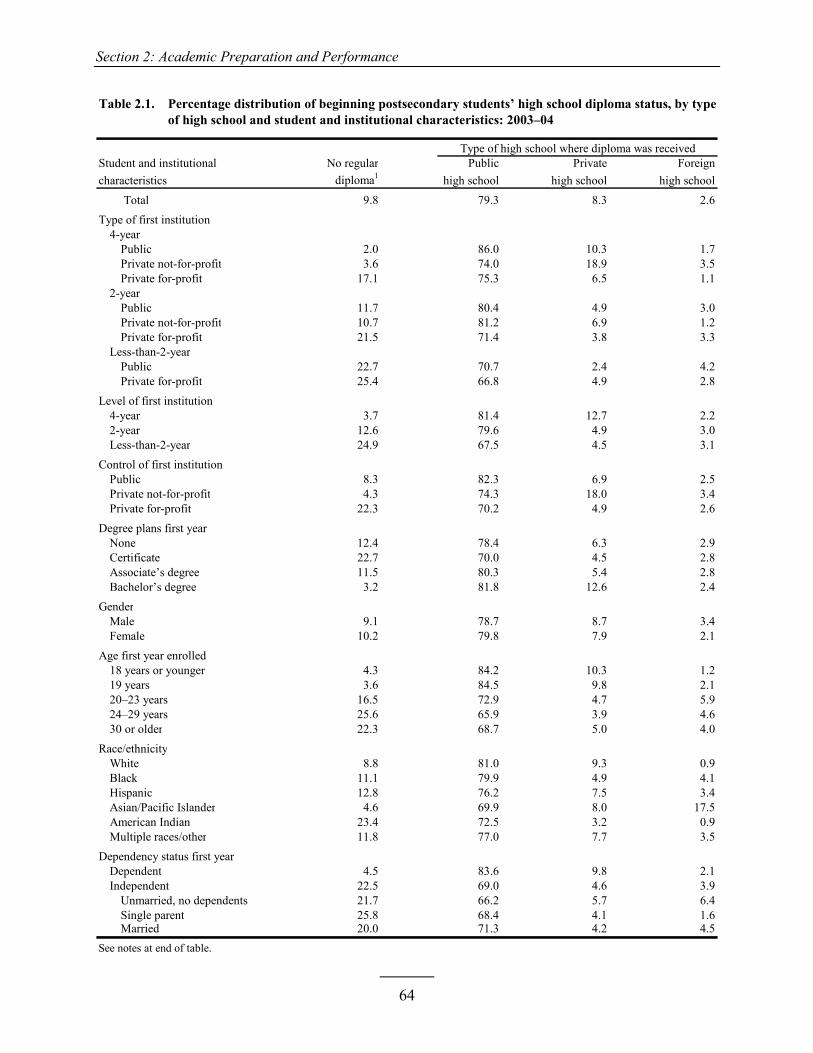
Section 2: Academic Preparation and Performance
64
Table 2.1.—Percentage distribution of beginning postsecondary students’ high school diploma status, by type Table 2.1.—of high school and student and institutional characteristics: 2003–04
Student and institutional No regular Public Private Foreigncharacteristics diploma1 high school high school high school
Total 9.8 79.3 8.3 2.6Type of first institution
4-yearPublic 2.0 86.0 10.3 1.7Private not-for-profit 3.6 74.0 18.9 3.5Private for-profit 17.1 75.3 6.5 1.1
2-yearPublic 11.7 80.4 4.9 3.0Private not-for-profit 10.7 81.2 6.9 1.2Private for-profit 21.5 71.4 3.8 3.3
Less-than-2-yearPublic 22.7 70.7 2.4 4.2Private for-profit 25.4 66.8 4.9 2.8
Level of first institution4-year 3.7 81.4 12.7 2.22-year 12.6 79.6 4.9 3.0Less-than-2-year 24.9 67.5 4.5 3.1
Control of first institutionPublic 8.3 82.3 6.9 2.5Private not-for-profit 4.3 74.3 18.0 3.4Private for-profit 22.3 70.2 4.9 2.6
Degree plans first yearNone 12.4 78.4 6.3 2.9Certificate 22.7 70.0 4.5 2.8Associate’s degree 11.5 80.3 5.4 2.8Bachelor’s degree 3.2 81.8 12.6 2.4
GenderMale 9.1 78.7 8.7 3.4Female 10.2 79.8 7.9 2.1
Age first year enrolled18 years or younger 4.3 84.2 10.3 1.219 years 3.6 84.5 9.8 2.120–23 years 16.5 72.9 4.7 5.924–29 years 25.6 65.9 3.9 4.630 or older 22.3 68.7 5.0 4.0
Race/ethnicityWhite 8.8 81.0 9.3 0.9Black 11.1 79.9 4.9 4.1Hispanic 12.8 76.2 7.5 3.4Asian/Pacific Islander 4.6 69.9 8.0 17.5American Indian 23.4 72.5 3.2 0.9Multiple races/other 11.8 77.0 7.7 3.5
Dependency status first yearDependent 4.5 83.6 9.8 2.1Independent 22.5 69.0 4.6 3.9
Unmarried, no dependents 21.7 66.2 5.7 6.4Single parent 25.8 68.4 4.1 1.6Married 20.0 71.3 4.2 4.5
See notes at end of table.
Type of high school where diploma was received

Section 2: Academic Preparation and Performance
65
Table 2.1.—Percentage distribution of beginning postsecondary students’ high school diploma status, by type Table 2.1.—of high school and student and institutional characteristics: 2003–04—Continued
Student and institutional No regular Public Private Foreigncharacteristics diploma1 high school high school high schoolHighest education of parents
High school or less 13.2 79.5 4.7 2.6Some postsecondary 9.4 83.0 6.1 1.4Bachelor’s degree or higher 5.7 78.0 13.1 3.1
Dependent student family income Less than $32,000 8.1 83.3 5.9 2.7$32,000–59,999 3.9 85.9 8.2 2.0$60,000–91,999 3.0 85.5 10.1 1.5$92,000 or more 2.6 80.0 15.8 1.7
Admissions test taken (ACT/SAT)2
Did not take tests 17.6 74.4 3.2 4.8Took tests 3.1 84.5 10.8 1.6
Admissions test scores (ACT/SAT)2
Lowest 5.3 85.2 7.0 2.5Low middle 2.9 86.1 9.9 1.0High middle 2.5 84.8 11.4 1.3Highest 1.6 81.9 15.1 1.5
Highest level of high school mathematics2
Below Algebra II 19.5 73.6 3.9 3.0Algebra II 6.6 85.6 6.9 0.9Trigonometry 4.4 82.7 10.5 2.4Pre-calculus 0.7 84.8 12.4 2.1Calculus 0.5 82.1 13.5 4.0
Federal Pell Grant received in first yearDependent Pell Grant recipients 6.3 86.2 6.6 0.8Independent Pell Grant recipients 26.9 67.6 3.6 1.9
1 Includes students with a GED or other equivalency, students who were home schooled, and students with no high school diploma or certificate.2 Beginners under age 24 only.NOTE: “Degree” includes certificates in vocational programs. Full-time enrollment is 12 or more credits per term or 24 credits per year. Black includes African American, Hispanic includes Latino, American Indian includes Alaska Native, Pacific Islander includes Native Hawaiian, and Other includes respondents having origins in a race not listed. Pacific Islanders have been combined with Asians because of small sample sizes. Race categories exclude Hispanic origin unless specified. Dependent students were under age 24, unmarried, and had no dependents of their own in 2003. Family income of dependent students is the annual income of the parentsin 2002. Categories represent the income quartile ranges of all dependent student families. Totals include students in private not-for-profit less-than-2-year institutions; sample size was too small to show as a separate category. This table includes students enrolled at postsecondary institutions in Puerto Rico. Detail may not sum to totals because of rounding.SOURCE: U.S. Department of Education, National Center for Education Statistics, 2003–04 Beginning Postsecondary StudentsLongitudinal Study, First Follow-up (BPS:04/06).
Type of high school where diploma was received

Section 2: Academic Preparation and Performance
66
Table 2.2.—For beginning postsecondary students under age 24, percentage distribution of their high school Table 2.2.—grade point average (GPA), by student and institutional characteristics: 2003–04
Student and institutional characteristics Below 3.0 3.0–3.4 3.5–4.0 Total 31.7 35.7 32.6
Type of first institution4-year
Public 17.0 36.7 46.3Private not-for-profit 15.5 31.4 53.1Private for-profit 43.0 39.8 17.3
2-yearPublic 45.9 37.0 17.2Private not-for-profit 32.2 45.0 22.8Private for-profit 54.6 32.1 13.4
Less-than-2-yearPublic 56.4 29.2 14.3Private for-profit 57.1 33.3 9.6
Level of first institution4-year 17.7 35.1 47.22-year 46.2 36.8 17.0Less-than-2-year 57.2 32.6 10.2
Control of first institutionPublic 32.4 36.8 30.8Private not-for-profit 16.6 32.0 51.4Private for-profit 53.0 34.4 12.6
Degree plans first yearNone 37.8 38.0 24.1Certificate 51.6 34.0 14.4Associate’s degree 44.2 37.8 18.0Bachelor’s degree 19.0 34.2 46.8
Recent (2003) high school graduates enrolled full time fall 2003Certificate plans 48.9 32.7 18.5Associate’s degree plans 42.0 38.1 19.9Bachelor’s degree plans 16.1 33.8 50.1
GenderMale 36.4 35.4 28.2Female 27.9 36.0 36.2
Age first year enrolled18 years or younger 27.1 37.6 35.419 years 31.4 33.0 35.620–23 years 50.9 34.1 15.0
Race/ethnicityWhite 28.3 33.8 37.9Black 47.5 36.5 16.0Hispanic 37.7 43.7 18.6Asian/Pacific Islander 21.5 34.5 44.0American Indian 42.0 23.8 34.2Multiple races/other 28.6 38.4 33.0
See notes at end of table.

Section 2: Academic Preparation and Performance
67
Table 2.2.—For beginning postsecondary students under age 24, percentage distribution of their high school Table 2.2.—grade point average (GPA), by student and institutional characteristics: 2003–04—Continued
Student and institutional characteristics Below 3.0 3.0–3.4 3.5–4.0Dependency status first year
Dependent 30.1 35.7 34.2Independent 48.8 35.3 15.9
Unmarried, no dependents 50.9 33.1 15.9Single parent 51.4 33.7 14.9Married 42.9 39.5 17.7
Highest education of parentsHigh school or less 40.0 37.2 22.8Some postsecondary 35.3 36.2 28.6Bachelor’s degree or higher 23.6 34.4 42.0
Dependent student family income Less than $32,000 36.8 37.2 25.9$32,000–59,999 33.1 37.2 29.7$60,000–91,999 26.8 35.5 37.7$92,000 or more 23.0 32.8 44.2
Admissions test taken (ACT/SAT)Did not take tests 58.2 35.2 6.7Took tests 26.1 35.8 38.1
Admissions test scores (ACT/SAT)Lowest 50.2 38.7 11.1Low middle 31.4 43.0 25.7High middle 15.9 38.2 45.8Highest 6.4 22.8 70.8
Highest level of high school mathematicsBelow Algebra II 55.9 31.8 12.3Algebra II 44.9 39.0 16.1Trigonometry 27.7 41.7 30.6Pre-calculus 19.7 39.6 40.7Calculus 7.8 21.6 70.6
Federal Pell Grant received in first yearDependent Pell Grant recipients 34.9 38.0 27.1Independent Pell Grant recipients 53.1 32.7 14.2
NOTE: “Degree” includes certificates in vocational programs. Full-time enrollment is 12 or more credits per term or 24 credits per year. Black includes African American, Hispanic includes Latino, American Indian includes Alaska Native, Pacific Islander includes Native Hawaiian, and Other includes respondents having origins in a race not listed. Pacific Islanders have been combined with Asians because of small sample sizes. Race categories exclude Hispanic origin unless specified. Dependent students were under age 24, unmarried, and had no dependents of their own in 2003. Family income of dependent students is the annual income of the parents in 2002. Categories represent the income quartile ranges of all dependent student families. Totals include students in private not-for-profit less-than-2-year institutions; sample size was too small to show as a separate category. High school grades and courses are self-reported by the students and only include those with regular high school diplomas. This table includes students enrolled at postsecondaryinstitutions in Puerto Rico. Detail may not sum to totals because of rounding.SOURCE: U.S. Department of Education, National Center for Education Statistics, 2003–04 Beginning Postsecondary StudentsLongitudinal Study, First Follow-up (BPS:04/06).

Section 2: Academic Preparation and Performance
68
Table 2.3.—For beginning postsecondary students under age 24, percentage distribution of the highest level Table 2.3.—of high school mathematics taken, by student and institutional characteristics: 2003–04
Student and institutional Belowcharacteristics Algebra II Algebra II Trigonometry Pre-calculus Calculus
Total 15.7 30.4 17.6 19.9 16.3Type of first institution
4-yearPublic 5.1 20.4 20.4 28.4 25.7Private not-for-profit 6.3 18.1 16.9 25.1 33.7Private for-profit 22.8 31.9 23.0 20.0 2.2
2-yearPublic 24.4 39.9 16.3 13.5 5.9Private not-for-profit 23.2 36.8 15.4 20.0 4.6Private for-profit 30.5 44.2 13.0 10.8 1.4
Less-than-2-yearPublic 33.3 48.1 1.8 14.9 1.9Private for-profit 29.3 46.9 15.1 6.2 2.5
Level of first institution4-year 6.3 20.2 19.4 27.0 27.12-year 24.9 40.2 16.0 13.4 5.5Less-than-2-year 29.5 46.7 14.2 6.8 2.8
Control of first institutionPublic 15.8 31.2 18.1 20.2 14.7Private not-for-profit 7.3 19.1 16.9 24.6 32.1Private for-profit 28.2 42.7 16.2 10.8 2.1
Degree plans first yearNone 21.5 35.8 13.4 19.3 10.0Certificate 28.9 43.5 15.0 8.6 4.0Associate’s degree 23.9 39.7 17.5 13.6 5.3Bachelor’s degree 6.3 20.3 19.1 26.7 27.6
Recent (2003) high school graduates enrolled full time fall 2003Certificate plans 25.4 42.6 13.1 12.8 6.0Associate’s degree plans 18.6 39.4 18.0 16.9 7.1Bachelor’s degree plans 4.2 18.5 19.2 28.3 29.9
GenderMale 15.5 29.7 16.7 20.2 18.0Female 15.9 31.0 18.4 19.7 14.9
Age first year enrolled18 years or younger 11.9 28.4 17.8 22.5 19.419 years 14.9 29.9 18.3 20.4 16.520–23 years 30.1 38.0 16.0 10.4 5.6
Race/ethnicityWhite 14.7 27.9 17.8 21.3 18.3Black 16.0 37.5 18.9 19.6 8.0Hispanic 20.2 39.2 16.3 16.0 8.3Asian/Pacific Islander 10.2 20.9 18.2 18.1 32.6American Indian 27.0 41.1 13.8 12.1 6.1Multiple races/other 20.1 28.9 15.4 18.0 17.7
See notes at end of table.
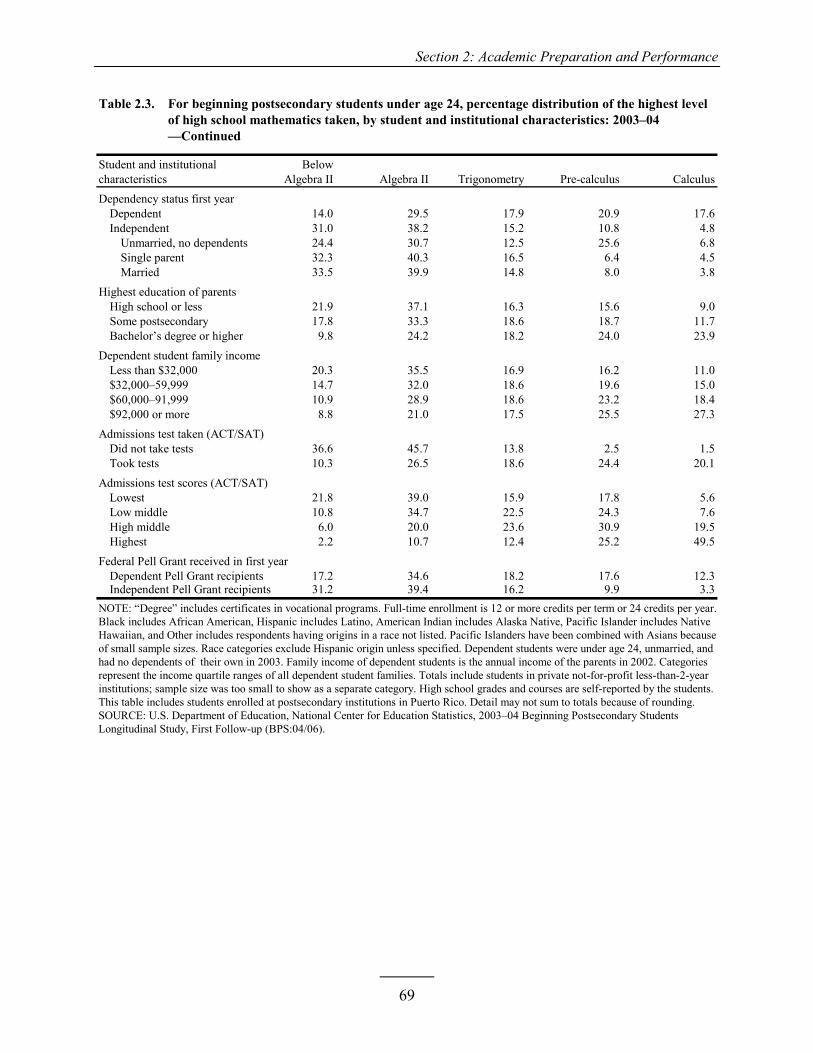
Section 2: Academic Preparation and Performance
69
Table 2.3.—For beginning postsecondary students under age 24, percentage distribution of the highest level Table 2.3.—of high school mathematics taken, by student and institutional characteristics: 2003–04Table 2.3.——Continued
Student and institutional Belowcharacteristics Algebra II Algebra II Trigonometry Pre-calculus CalculusDependency status first year
Dependent 14.0 29.5 17.9 20.9 17.6Independent 31.0 38.2 15.2 10.8 4.8
Unmarried, no dependents 24.4 30.7 12.5 25.6 6.8Single parent 32.3 40.3 16.5 6.4 4.5Married 33.5 39.9 14.8 8.0 3.8
Highest education of parentsHigh school or less 21.9 37.1 16.3 15.6 9.0Some postsecondary 17.8 33.3 18.6 18.7 11.7Bachelor’s degree or higher 9.8 24.2 18.2 24.0 23.9
Dependent student family income Less than $32,000 20.3 35.5 16.9 16.2 11.0$32,000–59,999 14.7 32.0 18.6 19.6 15.0$60,000–91,999 10.9 28.9 18.6 23.2 18.4$92,000 or more 8.8 21.0 17.5 25.5 27.3
Admissions test taken (ACT/SAT)Did not take tests 36.6 45.7 13.8 2.5 1.5Took tests 10.3 26.5 18.6 24.4 20.1
Admissions test scores (ACT/SAT)Lowest 21.8 39.0 15.9 17.8 5.6Low middle 10.8 34.7 22.5 24.3 7.6High middle 6.0 20.0 23.6 30.9 19.5Highest 2.2 10.7 12.4 25.2 49.5
Federal Pell Grant received in first yearDependent Pell Grant recipients 17.2 34.6 18.2 17.6 12.3Independent Pell Grant recipients 31.2 39.4 16.2 9.9 3.3
NOTE: “Degree” includes certificates in vocational programs. Full-time enrollment is 12 or more credits per term or 24 credits per year. Black includes African American, Hispanic includes Latino, American Indian includes Alaska Native, Pacific Islander includes Native Hawaiian, and Other includes respondents having origins in a race not listed. Pacific Islanders have been combined with Asians because of small sample sizes. Race categories exclude Hispanic origin unless specified. Dependent students were under age 24, unmarried, and had no dependents of their own in 2003. Family income of dependent students is the annual income of the parents in 2002. Categories represent the income quartile ranges of all dependent student families. Totals include students in private not-for-profit less-than-2-year institutions; sample size was too small to show as a separate category. High school grades and courses are self-reported by the students. This table includes students enrolled at postsecondary institutions in Puerto Rico. Detail may not sum to totals because of rounding.SOURCE: U.S. Department of Education, National Center for Education Statistics, 2003–04 Beginning Postsecondary StudentsLongitudinal Study, First Follow-up (BPS:04/06).

Section 2: Academic Preparation and Performance
70
Table 2.4.—For beginning postsecondary students under age 24, percentage with advanced placement and Table 2.4.—college credits, by student and institutional characteristics: 2003–04
Advanced Earned credit EarnedStudent and institutional Placement for courses any college-characteristics credits accepted at a college level credits
Total 18.8 21.0 30.1Type of first institution
4-yearPublic 28.4 27.2 40.7Private not-for-profit 31.9 25.1 44.0Private for-profit 4.8 13.8 15.5
2-yearPublic 10.5 18.0 21.9Private not-for-profit 6.3 21.1 23.2Private for-profit 1.5 7.0 7.3
Less-than-2-yearPublic 0.6 4.6 4.8Private for-profit 2.3 7.6 8.7
Level of first institution4-year 28.4 25.9 40.52-year 9.7 17.1 20.7Less-than-2-year 2.6 7.4 8.8
Control of first institutionPublic 18.5 22.0 30.2Private not-for-profit 30.5 24.7 42.8Private for-profit 2.6 8.8 9.8
Degree plans first yearNone 14.7 22.5 28.2Certificate 5.0 10.0 12.0Associate’s degree 9.4 15.9 20.0Bachelor’s degree 28.9 26.5 41.0
Recent (2003) high school graduates enrolled full time fall 2003Certificate plans 7.1 14.0 17.0Associate’s degree plans 12.9 20.8 25.9Bachelor’s degree plans 31.4 28.0 44.1
GenderMale 18.5 20.2 29.0Female 19.0 21.7 31.0
Age first year enrolled18 years or younger 22.1 23.9 34.519 years 19.7 22.1 31.620–23 years 6.1 9.4 12.7
Race/ethnicityWhite 20.5 22.9 32.6Black 9.1 13.7 18.5Hispanic 15.9 17.6 25.2Asian/Pacific Islander 28.8 25.2 40.5American Indian 8.2 11.7 17.0Multiple races/other 18.9 20.8 30.3
See notes at end of table.
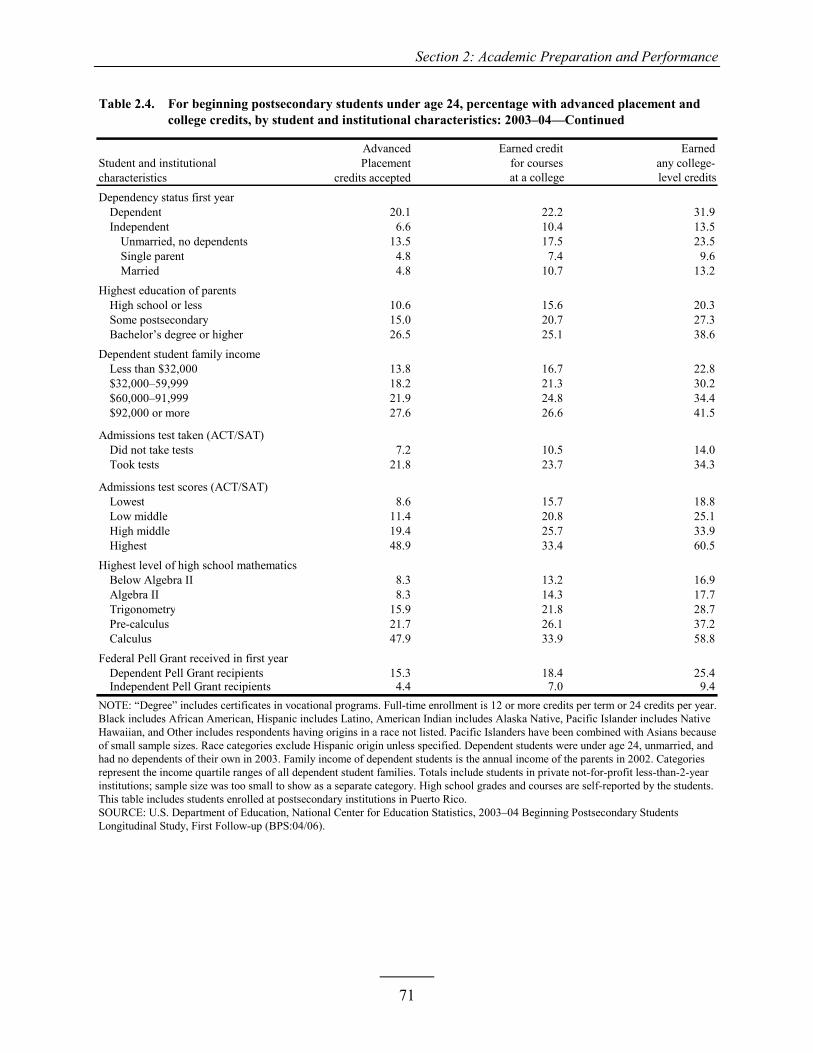
Section 2: Academic Preparation and Performance
71
Table 2.4.—For beginning postsecondary students under age 24, percentage with advanced placement and Table 2.4.—college credits, by student and institutional characteristics: 2003–04—Continued
Advanced Earned credit EarnedStudent and institutional Placement for courses any college-characteristics credits accepted at a college level credits
Dependency status first yearDependent 20.1 22.2 31.9Independent 6.6 10.4 13.5
Unmarried, no dependents 13.5 17.5 23.5Single parent 4.8 7.4 9.6Married 4.8 10.7 13.2
Highest education of parentsHigh school or less 10.6 15.6 20.3Some postsecondary 15.0 20.7 27.3Bachelor’s degree or higher 26.5 25.1 38.6
Dependent student family income Less than $32,000 13.8 16.7 22.8$32,000–59,999 18.2 21.3 30.2$60,000–91,999 21.9 24.8 34.4$92,000 or more 27.6 26.6 41.5
Admissions test taken (ACT/SAT)Did not take tests 7.2 10.5 14.0Took tests 21.8 23.7 34.3
Admissions test scores (ACT/SAT)Lowest 8.6 15.7 18.8Low middle 11.4 20.8 25.1High middle 19.4 25.7 33.9Highest 48.9 33.4 60.5
Highest level of high school mathematicsBelow Algebra II 8.3 13.2 16.9Algebra II 8.3 14.3 17.7Trigonometry 15.9 21.8 28.7Pre-calculus 21.7 26.1 37.2Calculus 47.9 33.9 58.8
Federal Pell Grant received in first yearDependent Pell Grant recipients 15.3 18.4 25.4Independent Pell Grant recipients 4.4 7.0 9.4
NOTE: “Degree” includes certificates in vocational programs. Full-time enrollment is 12 or more credits per term or 24 credits per year. Black includes African American, Hispanic includes Latino, American Indian includes Alaska Native, Pacific Islander includes Native Hawaiian, and Other includes respondents having origins in a race not listed. Pacific Islanders have been combined with Asians because of small sample sizes. Race categories exclude Hispanic origin unless specified. Dependent students were under age 24, unmarried, and had no dependents of their own in 2003. Family income of dependent students is the annual income of the parents in 2002. Categories represent the income quartile ranges of all dependent student families. Totals include students in private not-for-profit less-than-2-year institutions; sample size was too small to show as a separate category. High school grades and courses are self-reported by the students. This table includes students enrolled at postsecondary institutions in Puerto Rico.SOURCE: U.S. Department of Education, National Center for Education Statistics, 2003–04 Beginning Postsecondary StudentsLongitudinal Study, First Follow-up (BPS:04/06).

Section 2: Academic Preparation and Performance
72
Table 2.5.—For beginning postsecondary students under age 24, percentage who took college admission tests Table 2.5.—(ACT or SAT) and among those who did, percentage distribution of their admission test score Table 2.5.—rank, by student and institutional characteristics: 2003–04
TookStudent and institutional admission testscharacteristics (ACT or SAT) Lowest Low middle High middle Highest
Total 79.4 24.8 27.4 23.3 24.5Type of first institution
4-yearPublic 97.6 12.7 26.6 29.4 31.3Private not-for-profit 95.0 11.7 20.1 23.4 44.8Private for-profit 63.7 45.8 29.5 17.5 7.1
2-yearPublic 68.3 40.3 32.5 18.0 9.2Private not-for-profit 65.4 47.4 30.3 16.0 6.4Private for-profit 50.0 56.4 25.0 17.9 0.7
Less-than-2-yearPublic 59.8 47.0 40.6 8.0 4.4Private for-profit 33.9 59.9 25.1 9.9 5.2
Level of first institution4-year 95.1 13.4 24.6 27.1 34.92-year 66.7 41.5 32.0 18.0 8.6Less-than-2-year 36.5 57.5 27.2 9.3 6.1
Control of first institutionPublic 81.4 25.5 29.4 24.1 21.0Private not-for-profit 93.1 13.1 20.4 23.0 43.4Private for-profit 45.7 54.3 26.4 15.1 4.2
Degree plans first yearNone 71.5 22.4 31.5 25.9 20.3Certificate 45.4 52.8 25.8 12.2 9.3Associate’s degree 69.9 41.5 33.1 17.6 7.9Bachelor’s degree 94.3 13.9 24.0 26.9 35.2
Recent (2003) high school graduates enrolled full time fall 2003Certificate plans 53.0 45.1 26.6 16.7 11.5Associate’s degree plans 80.9 38.2 33.9 18.9 9.0Bachelor’s degree plans 97.5 12.0 23.3 27.3 37.4
GenderMale 79.5 22.5 26.1 24.6 26.8Female 79.3 26.7 28.4 22.3 22.6
Age first year enrolled18 years or younger 86.0 20.9 27.7 23.8 27.619 years 81.3 24.6 27.1 24.2 24.120–23 years 54.2 46.5 26.1 17.9 9.5
Race/ethnicityWhite 84.5 17.1 27.5 26.6 28.9Black 73.3 60.8 24.9 9.9 4.5Hispanic 63.7 39.5 30.0 17.6 12.9Asian/Pacific Islander 78.9 19.7 21.7 25.0 33.6American Indian 80.3 22.3 33.0 31.3 13.4Multiple races/other 76.2 20.5 32.3 18.1 29.0
See notes at end of table.
Among test takers,admissions test scores1
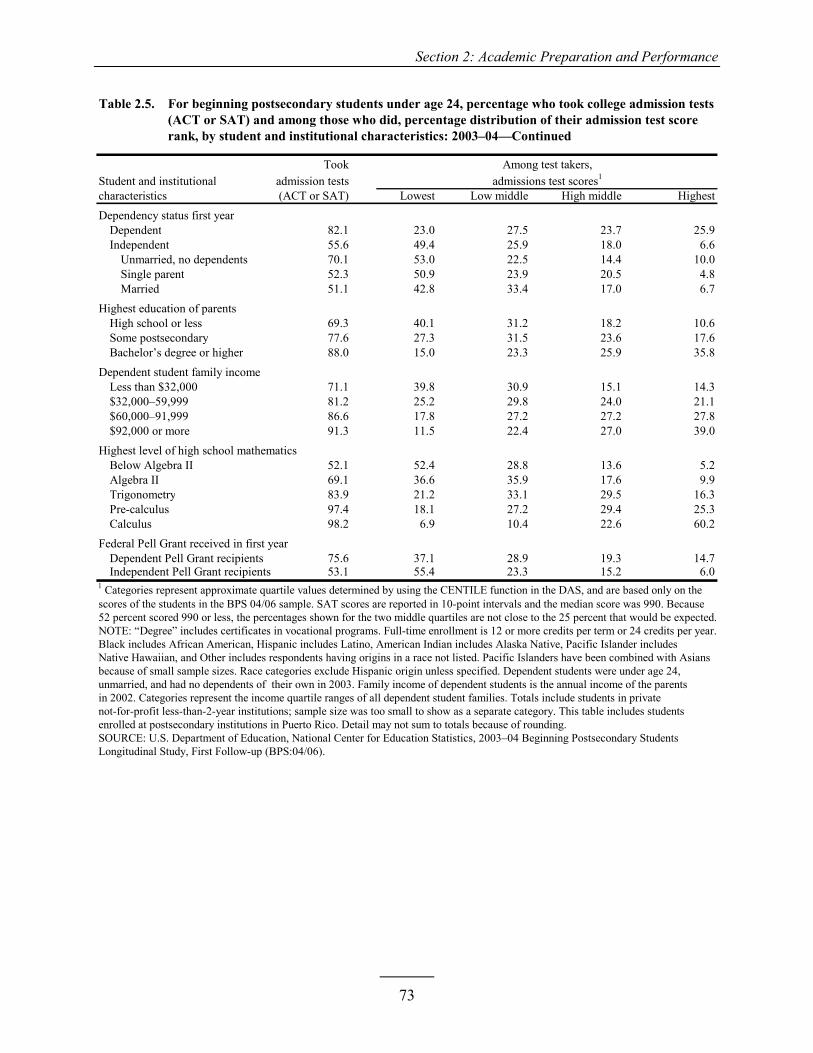
Section 2: Academic Preparation and Performance
73
Table 2.5.—For beginning postsecondary students under age 24, percentage who took college admission tests Table 2.5.—(ACT or SAT) and among those who did, percentage distribution of their admission test score Table 2.5.—rank, by student and institutional characteristics: 2003–04—Continued
TookStudent and institutional admission testscharacteristics (ACT or SAT) Lowest Low middle High middle HighestDependency status first year
Dependent 82.1 23.0 27.5 23.7 25.9Independent 55.6 49.4 25.9 18.0 6.6
Unmarried, no dependents 70.1 53.0 22.5 14.4 10.0Single parent 52.3 50.9 23.9 20.5 4.8Married 51.1 42.8 33.4 17.0 6.7
Highest education of parentsHigh school or less 69.3 40.1 31.2 18.2 10.6Some postsecondary 77.6 27.3 31.5 23.6 17.6Bachelor’s degree or higher 88.0 15.0 23.3 25.9 35.8
Dependent student family income Less than $32,000 71.1 39.8 30.9 15.1 14.3$32,000–59,999 81.2 25.2 29.8 24.0 21.1$60,000–91,999 86.6 17.8 27.2 27.2 27.8$92,000 or more 91.3 11.5 22.4 27.0 39.0
Highest level of high school mathematicsBelow Algebra II 52.1 52.4 28.8 13.6 5.2Algebra II 69.1 36.6 35.9 17.6 9.9Trigonometry 83.9 21.2 33.1 29.5 16.3Pre-calculus 97.4 18.1 27.2 29.4 25.3Calculus 98.2 6.9 10.4 22.6 60.2
Federal Pell Grant received in first yearDependent Pell Grant recipients 75.6 37.1 28.9 19.3 14.7Independent Pell Grant recipients 53.1 55.4 23.3 15.2 6.0
1 Categories represent approximate quartile values determined by using the CENTILE function in the DAS, and are based only on the scores of the students in the BPS 04/06 sample. SAT scores are reported in 10-point intervals and the median score was 990. Because 52 percent scored 990 or less, the percentages shown for the two middle quartiles are not close to the 25 percent that would be expected.NOTE: “Degree” includes certificates in vocational programs. Full-time enrollment is 12 or more credits per term or 24 credits per year. Black includes African American, Hispanic includes Latino, American Indian includes Alaska Native, Pacific Islander includes Native Hawaiian, and Other includes respondents having origins in a race not listed. Pacific Islanders have been combined with Asians because of small sample sizes. Race categories exclude Hispanic origin unless specified. Dependent students were under age 24, unmarried, and had no dependents of their own in 2003. Family income of dependent students is the annual income of the parents in 2002. Categories represent the income quartile ranges of all dependent student families. Totals include students in private not-for-profit less-than-2-year institutions; sample size was too small to show as a separate category. This table includes students enrolled at postsecondary institutions in Puerto Rico. Detail may not sum to totals because of rounding.SOURCE: U.S. Department of Education, National Center for Education Statistics, 2003–04 Beginning Postsecondary StudentsLongitudinal Study, First Follow-up (BPS:04/06).
Among test takers,admissions test scores1

THIS PAGE INTENTIONALLY LEFT BLANK
75
Section 3: Student Experiences
The tables in this section describe beginning students’ experiences in postsecondary education, focusing primarily on their first year. As indicators of their exposure to various instructional practices, beginning postsecondary students at 4-year institutions were asked how often they had graduate instructors, took essay exams, had large classes, and were required to write papers for their courses. To gauge their interactions with faculty, beginning postsecondary students at both 2- and 4-year institutions were asked about their contact with faculty and advisors. Students at both 2- and 4-year institutions were also asked about their attendance at fine arts activities and their participation in school clubs, sports, and study groups. Finally, students at both levels were asked about distance education and remedial coursetaking in their first year. While most of the tables in this section address the first-year experiences of beginning postsecondary students, the last table covers various academic experiences across the first 3 years.
Instructional Practices (4-year institutions)
• Overall, 30 percent of beginning postsecondary students at 4-year institutions sometimes had graduate instructors for their first-year courses, and 17 percent often had them (table 3.1).
• About two-thirds (69 percent) of beginning postsecondary students at private not-for-profit institutions never had graduate instructors, compared with 43 percent of those at public institutions.
• Almost one-half (47 percent) of beginning postsecondary students at 4-year institutions sometimes had essay exams, and another 43 percent often had them (table 3.2). Again, sector made a difference, with students at private not-for-profit institutions reporting that they had essay exams “often” at a higher rate (53 percent) than students at public institutions (40 percent).
• Overall, 35 percent of beginning postsecondary students at 4-year institutions reported that they often had large lecture classes (table 3.3).
• Most beginning postsecondary students at 4-year institutions wrote papers for their courses: 68 percent reported writing them often, and another 28 percent reported writing them sometimes (table 3.4).

Section 3: Student Experiences
76
Faculty Contact and Student Activities (2- and 4-year institutions)
• Overall, 63 percent of beginning postsecondary students at 2- and 4-year institutions reported never having informal contact with faculty outside the classroom during their first year (table 3.5).
• Students at private not-for-profit 4-year institutions reported having informal contact sometimes or often at a higher rate than their peers at public 4-year institutions (48 vs. 34 percent and 11 vs. 6 percent).
• Sixty percent of all beginning postsecondary students reported sometimes talking with faculty about academic matters outside of class, and 14 percent reported often doing so (table 3.6).
• Students who were enrolled exclusively part time reported that they never talked with faculty about academic matters outside of class at a higher rate than those who were enrolled exclusively full time or both full and part time (49 vs. 20 and 29 percent, respectively).
• About one-half (53 percent) of all beginning postsecondary students reported meeting with an advisor sometimes during their first year (table 3.7). Meeting often with an advisor was more common for students at private not-for-profit 4-year institutions (27 percent) than at other types of institutions (14 to 20 percent).
• Overall, a majority of beginning postsecondary students reported that they never attended fine arts activities (68 percent) and never participated in school clubs (73 percent) or sports (79 percent) (tables 3.8–3.10).
• Beginning postsecondary students at 4-year institutions, and especially at private not-for-profit institutions, participated in each of these activities “often” at higher rates than their peers at other institution levels.
• Some 42 percent of all beginning postsecondary students sometimes attended study groups, and another 10 percent often did so (table 3.11).
• Asian students reported sometimes participating in study groups at higher rates than their Black, Hispanic, and American Indian peers (47 percent vs. 28–36 percent).
Distance Education and Remedial Coursetaking
• Among all beginning postsecondary students, 9 percent took a distance education course during their first year (table 3.12). Distance education coursetaking was more common at 2-year than at 4-year institutions (12 vs. 7 percent).
• About one in five (21 percent) beginning postsecondary students took at least one remedial education course during their first year, including 17 percent of students at 4-year institutions and 26 percent of those at 2-year institutions.

Section 3: Student Experiences
77
• Proportionately more students took remedial courses in mathematics (15 percent) than in English (6 percent), reading (6 percent), or writing (8 percent). This was the pattern at both the 2- and 4-year levels.
• Twenty-one percent of students who did not go beyond algebra II in high school and 26 percent of those with the lowest college admissions test scores took remedial mathematics in their first year of postsecondary education.
Academic Experiences in the First 3 Years
• Just under one-third (31 percent) of beginning postsecondary students reported changing their major sometime in their first 3 years, including 40 percent of those who started at a public 4-year institution and 30 percent of those who started at a private not-for-profit 4-year institution (table 3.13). Reflecting their shorter programs, smaller percentages at 2-year and less-than-2-year institutions than at 4-year institutions changed their majors (28 and 17 percent, respectively, vs. 35 percent).
• Some students reported experiencing academic problems by 2006: 16 percent had received an incomplete in one or more courses, 23 percent had repeated a course for a higher grade, and 31 percent had withdrawn from a course after the add/drop deadline.
• At the 4-year level, greater percentages of students at public than at private not-for-profit institutions had repeated courses (29 vs. 15 percent) or withdrawn from courses (36 vs. 25 percent). Students at less-than-2-year institutions had a lower rate of repeating (9 percent) or withdrawing from courses (8 percent) than students at other institution levels.
• Having academic problems was associated with doing less well in high school. For example, 36 percent of those with high school mathematics below algebra II had withdrawn from courses, compared with 29 percent of those who completed calculus. Similarly, 34 percent of students with the lowest admissions test scores had withdrawn from courses, compared with 29 percent of those with the highest scores.
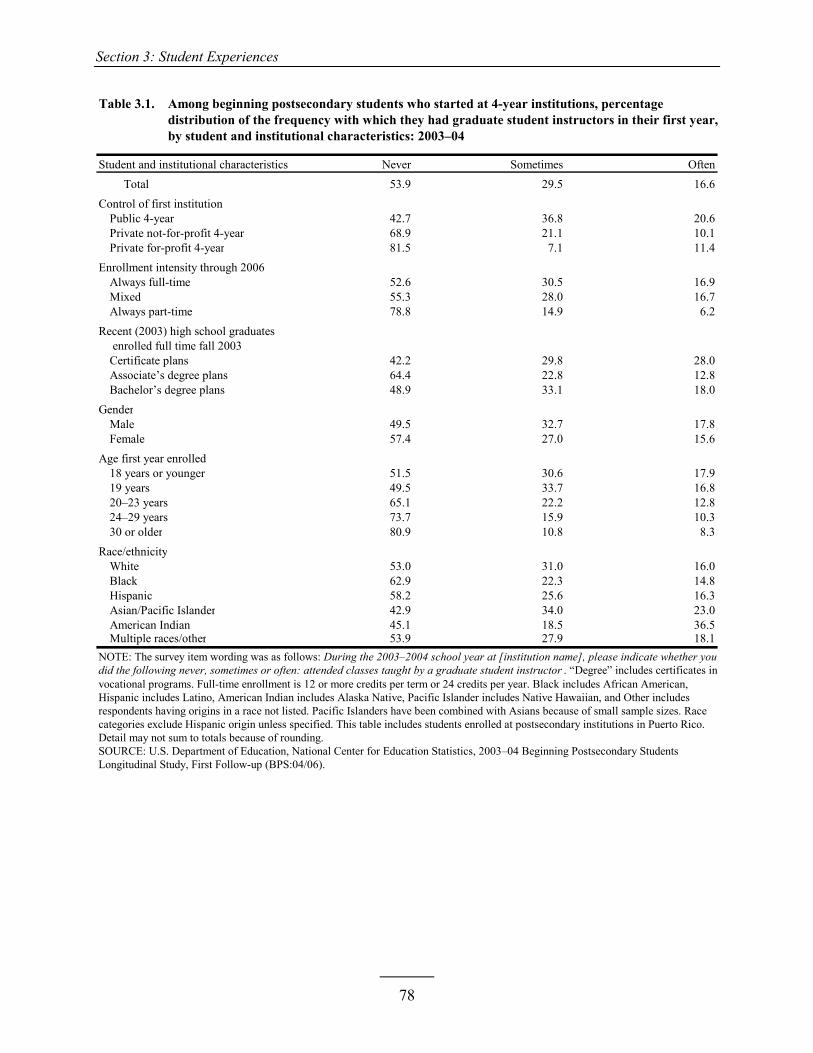
Section 3: Student Experiences
78
Table 3.1.—Among beginning postsecondary students who started at 4-year institutions, percentage Table 3.1.—distribution of the frequency with which they had graduate student instructors in their first year,Table 3.1.—by student and institutional characteristics: 2003–04
Student and institutional characteristics Never Sometimes Often Total 53.9 29.5 16.6
Control of first institutionPublic 4-year 42.7 36.8 20.6Private not-for-profit 4-year 68.9 21.1 10.1Private for-profit 4-year 81.5 7.1 11.4
Enrollment intensity through 2006Always full-time 52.6 30.5 16.9Mixed 55.3 28.0 16.7Always part-time 78.8 14.9 6.2
Recent (2003) high school graduates enrolled full time fall 2003Certificate plans 42.2 29.8 28.0Associate’s degree plans 64.4 22.8 12.8Bachelor’s degree plans 48.9 33.1 18.0
GenderMale 49.5 32.7 17.8Female 57.4 27.0 15.6
Age first year enrolled18 years or younger 51.5 30.6 17.919 years 49.5 33.7 16.820–23 years 65.1 22.2 12.824–29 years 73.7 15.9 10.330 or older 80.9 10.8 8.3
Race/ethnicityWhite 53.0 31.0 16.0Black 62.9 22.3 14.8Hispanic 58.2 25.6 16.3Asian/Pacific Islander 42.9 34.0 23.0American Indian 45.1 18.5 36.5Multiple races/other 53.9 27.9 18.1
NOTE: The survey item wording was as follows: During the 2003–2004 school year at [institution name], please indicate whether you did the following never, sometimes or often: attended classes taught by a graduate student instructor . “Degree” includes certificates in vocational programs. Full-time enrollment is 12 or more credits per term or 24 credits per year. Black includes African American, Hispanic includes Latino, American Indian includes Alaska Native, Pacific Islander includes Native Hawaiian, and Other includes respondents having origins in a race not listed. Pacific Islanders have been combined with Asians because of small sample sizes. Race categories exclude Hispanic origin unless specified. This table includes students enrolled at postsecondary institutions in Puerto Rico. Detail may not sum to totals because of rounding.SOURCE: U.S. Department of Education, National Center for Education Statistics, 2003–04 Beginning Postsecondary StudentsLongitudinal Study, First Follow-up (BPS:04/06).

Section 3: Student Experiences
79
Table 3.2.—Among beginning postsecondary students who started at 4-year institutions, percentage Table 3.2.—distribution of the frequency with which they had essay exams in their first year, by student and Table 3.2.—institutional characteristics: 2003–04
Student and institutional characteristics Never Sometimes Often Total 10.3 46.9 42.8
Control of first institutionPublic 4-year 10.9 49.5 39.7Private not-for-profit 4-year 6.3 40.2 53.5Private for-profit 4-year 21.4 54.1 24.5
Enrollment intensity through 2006Always full-time 9.2 47.1 43.7Mixed 12.3 46.6 41.1Always part-time 24.4 43.4 32.2
Recent (2003) high school graduates enrolled full time fall 2003Certificate plans 16.7 46.4 36.9Associate’s degree plans 16.8 45.7 37.5Bachelor’s degree plans 7.5 46.9 45.6
GenderMale 10.1 48.7 41.2Female 10.4 45.5 44.1
Age first year enrolled18 years or younger 9.5 45.8 44.719 years 7.8 48.9 43.320–23 years 14.6 49.2 36.224–29 years 22.4 41.1 36.530 or older 18.8 50.5 30.8
Race/ethnicityWhite 10.0 47.7 42.4Black 10.0 41.2 48.8Hispanic 13.0 44.7 42.3Asian/Pacific Islander 9.4 50.8 39.8American Indian 18.2 33.5 48.3Multiple races/other 9.0 50.3 40.8
NOTE: The survey item wording was as follows: During the 2003–2004 school year at [institution name], please indicate whether youdid the following never, sometimes or often: wrote essay answers as part of exam . “Degree” includes certificates in vocational programs. Full-time enrollment is 12 or more credits per term or 24 credits per year. Black includes African American, Hispanic includes Latino, American Indian includes Alaska Native, Pacific Islander includes Native Hawaiian, and Other includes respondents having origins in a race not listed. Pacific Islanders have been combined with Asians because of small sample sizes. Race categories exclude Hispanic origin unless specified. This table includes students enrolled at postsecondary institutions in Puerto Rico. Detail may not sum to totals because of rounding.SOURCE: U.S. Department of Education, National Center for Education Statistics, 2003–04 Beginning Postsecondary StudentsLongitudinal Study, First Follow-up (BPS:04/06).

Section 3: Student Experiences
80
Table 3.3.—Among beginning postsecondary students who began at 4-year institutions, percentage Table 3.3.—distribution of the frequency with which they had large lecture classes in their first year, by Table 3.3.—student and institutional characteristics: 2003–04
Student and institutional characteristics Never Sometimes Often Total 29.6 35.2 35.2
Control of first institutionPublic 4-year 17.7 37.2 45.0Private not-for-profit 4-year 41.8 35.8 22.3Private for-profit 4-year 72.9 16.9 10.2
Enrollment intensity through 2006Always full-time 27.4 36.1 36.5Mixed 32.5 33.6 33.8Always part-time 65.6 23.9 10.5
Recent (2003) high school graduates enrolled full time fall 2003Certificate plans 22.0 36.4 41.6Associate’s degree plans 46.0 30.6 23.3Bachelor’s degree plans 22.6 37.4 40.0
GenderMale 27.9 37.1 35.0Female 30.9 33.7 35.3
Age first year enrolled18 years or younger 24.7 37.0 38.319 years 25.8 36.9 37.320–23 years 42.5 33.6 24.024–29 years 63.4 22.2 14.430 or older 70.4 14.3 15.3
Race/ethnicityWhite 28.8 37.1 34.1Black 37.0 31.5 31.5Hispanic 33.3 31.8 34.9Asian/Pacific Islander 16.6 32.5 50.9American Indian 44.3 25.6 30.1Multiple races/other 31.9 28.6 39.5
NOTE: The survey item wording was as follows: During the 2003–2004 school year at [institution name], please indicate whether youdid the following never, sometimes or often: attended large lecture classes . “Degree” includes certificates in vocational programs. Full-time enrollment is 12 or more credits per term or 24 credits per year. Black includes African American, Hispanic includes Latino, American Indian includes Alaska Native, Pacific Islander includes Native Hawaiian, and Other includes respondents having origins in arace not listed. Pacific Islanders have been combined with Asians because of small sample sizes. Race categories exclude Hispanic origin unless specified. This table includes students enrolled at postsecondary institutions in Puerto Rico. Detail may not sum to totals because of rounding.SOURCE: U.S. Department of Education, National Center for Education Statistics, 2003–04 Beginning Postsecondary StudentsLongitudinal Study, First Follow-up (BPS:04/06).

Section 3: Student Experiences
81
Table 3.4.—Among beginning postsecondary students who began at 4-year institutions, percentage Table 3.4.—distribution of the frequency with which they wrote papers in their first year, by student and Table 3.4.—institutional characteristics: 2003–04
Student and institutional characteristics Never Sometimes Often Total 3.7 28.4 67.9
Control of first institutionPublic 4-year 3.4 31.2 65.4Private not-for-profit 4-year 2.5 21.5 76.0Private for-profit 4-year 10.4 35.3 54.3
Enrollment intensity through 2006Always full-time 2.8 27.7 69.5Mixed 5.2 29.6 65.3Always part-time 15.2 41.3 43.6
Recent (2003) high school graduates enrolled full time fall 2003Certificate plans 2.5 37.2 60.3Associate’s degree plans 7.1 29.8 63.1Bachelor’s degree plans 1.9 27.1 71.0
GenderMale 4.2 32.1 63.7Female 3.3 25.6 71.1
Age first year enrolled18 years or younger 2.7 26.8 70.519 years 2.0 30.7 67.320–23 years 8.2 31.4 60.324–29 years 12.8 30.7 56.530 or older 12.3 30.2 57.5
Race/ethnicityWhite 3.0 28.6 68.4Black 4.1 25.8 70.1Hispanic 6.8 30.6 62.7Asian/Pacific Islander 3.9 30.6 65.5American Indian 17.2 17.6 65.2Multiple races/other 4.2 24.9 70.9
NOTE: The survey item wording was as follows: During the 2003–2004 school year at [institution name], please indicate whether you did the following never, sometimes or often: wrote papers for courses . “Degree” includes certificates in vocational programs. Full-time enrollment is 12 or more credits per term or 24 credits per year. Black includes African American, Hispanic includes Latino, American Indian includes Alaska Native, Pacific Islander includes Native Hawaiian, and Other includes respondents having origins in a race not listed. Pacific Islanders have been combined with Asians because of small sample sizes. Race categories exclude Hispanic origin unless specified. This table includes students enrolled at postsecondary institutions in Puerto Rico. Detail may not sum to totals because of rounding.SOURCE: U.S. Department of Education, National Center for Education Statistics, 2003–04 Beginning Postsecondary StudentsLongitudinal Study, First Follow-up (BPS:04/06).

Section 3: Student Experiences
82
Table 3.5.—Among beginning postsecondary students who started at 2- or 4-year institutions, percentage Table 3.5.—distribution of the frequency with which they had informal contact with faculty in their first Table 3.5.—year, by student and institutional characteristics: 2003–04
Student and institutional characteristics Never Sometimes Often Total 63.3 30.6 6.0
Type of first institution4-year
Public 60.0 34.5 5.5Private not-for-profit 40.8 48.2 11.0Private for-profit 71.5 19.8 8.7
2-yearPublic 71.6 24.0 4.4Private not-for-profit 57.2 37.2 5.6Private for-profit 68.9 24.0 7.2
Level of first institution4-year 54.8 37.7 7.52-year 71.1 24.2 4.7
Control of first institutionPublic 67.1 28.0 4.9Private not-for-profit 41.8 47.5 10.6Private for-profit 70.0 22.2 7.8
Enrollment intensity through 2006Always full-time 57.6 35.4 7.1Mixed 67.7 26.5 5.8Always part-time 78.7 19.1 2.2
Recent (2003) high school graduates enrolled full time fall 2003Certificate plans 65.1 29.8 5.2Associate’s degree plans 61.9 30.5 7.6Bachelor’s degree plans 51.8 40.1 8.0
GenderMale 62.0 31.5 6.5Female 64.4 29.9 5.7
Age first year enrolled18 years or younger 58.6 34.3 7.019 years 59.6 34.1 6.220–23 years 66.6 27.2 6.224–29 years 74.7 21.7 3.630 or older 78.8 18.1 3.1
Race/ethnicityWhite 63.6 30.9 5.5Black 61.1 30.1 8.8Hispanic 66.7 27.8 5.5Asian/Pacific Islander 56.9 37.1 6.0American Indian 66.0 29.4 4.7Multiple races/other 62.7 29.5 7.8
NOTE: The survey item wording was as follows: During the 2003–2004 school year at [institution name], please indicate whether you did the following never, sometimes or often: had informal contact with faculty members . “Degree” includes certificates in vocational programs. Full-time enrollment is 12 or more credits per term or 24 credits per year. Black includes African American, Hispanic includes Latino, American Indian includes Alaska Native, Pacific Islander includes Native Hawaiian, and Other includes respondents having origins in a race not listed. Pacific Islanders have been combined with Asians because of small sample sizes. Race categories exclude Hispanic origin unless specified. This table includes students enrolled at postsecondary institutions in Puerto Rico. Detail may not sum to totals because of rounding.SOURCE: U.S. Department of Education, National Center for Education Statistics, 2003–04 Beginning Postsecondary StudentsLongitudinal Study, First Follow-up (BPS:04/06).
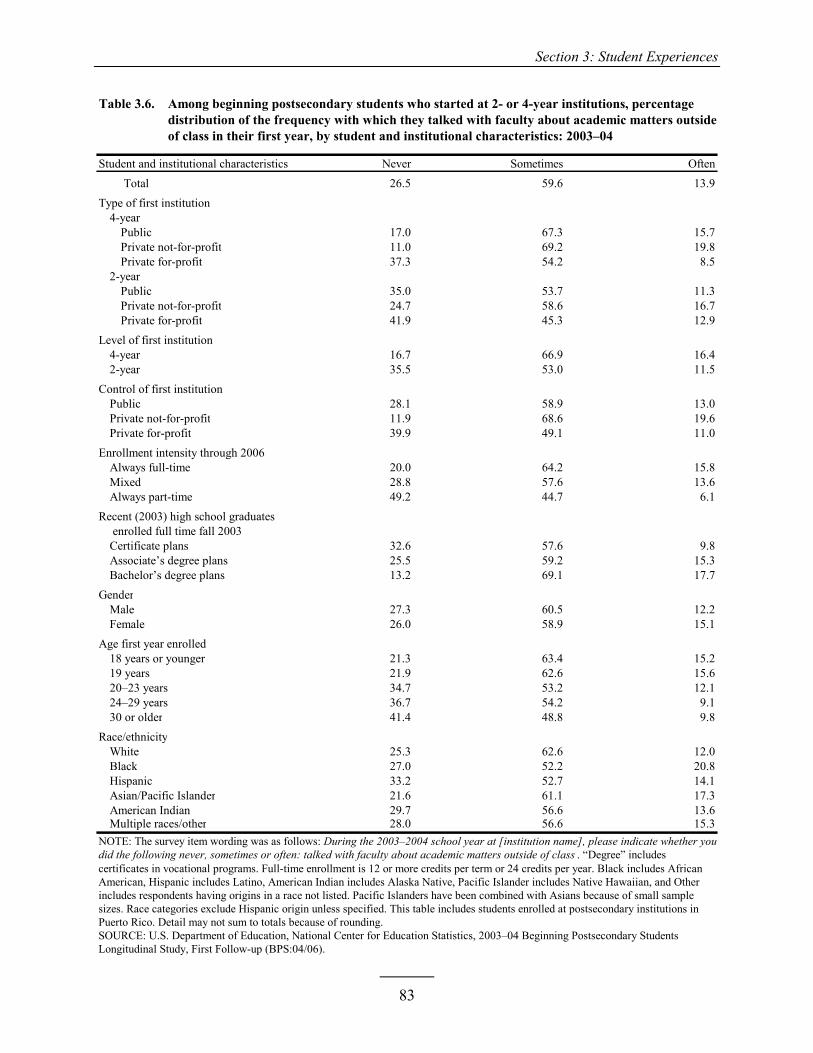
Section 3: Student Experiences
83
Table 3.6.—Among beginning postsecondary students who started at 2- or 4-year institutions, percentage Table 3.6.—distribution of the frequency with which they talked with faculty about academic matters outsideTable 3.6.—of class in their first year, by student and institutional characteristics: 2003–04
Student and institutional characteristics Never Sometimes Often Total 26.5 59.6 13.9
Type of first institution4-year
Public 17.0 67.3 15.7Private not-for-profit 11.0 69.2 19.8Private for-profit 37.3 54.2 8.5
2-yearPublic 35.0 53.7 11.3Private not-for-profit 24.7 58.6 16.7Private for-profit 41.9 45.3 12.9
Level of first institution4-year 16.7 66.9 16.42-year 35.5 53.0 11.5
Control of first institutionPublic 28.1 58.9 13.0Private not-for-profit 11.9 68.6 19.6Private for-profit 39.9 49.1 11.0
Enrollment intensity through 2006Always full-time 20.0 64.2 15.8Mixed 28.8 57.6 13.6Always part-time 49.2 44.7 6.1
Recent (2003) high school graduates enrolled full time fall 2003Certificate plans 32.6 57.6 9.8Associate’s degree plans 25.5 59.2 15.3Bachelor’s degree plans 13.2 69.1 17.7
GenderMale 27.3 60.5 12.2Female 26.0 58.9 15.1
Age first year enrolled18 years or younger 21.3 63.4 15.219 years 21.9 62.6 15.620–23 years 34.7 53.2 12.124–29 years 36.7 54.2 9.130 or older 41.4 48.8 9.8
Race/ethnicityWhite 25.3 62.6 12.0Black 27.0 52.2 20.8Hispanic 33.2 52.7 14.1Asian/Pacific Islander 21.6 61.1 17.3American Indian 29.7 56.6 13.6Multiple races/other 28.0 56.6 15.3
NOTE: The survey item wording was as follows: During the 2003–2004 school year at [institution name], please indicate whether you did the following never, sometimes or often: talked with faculty about academic matters outside of class . “Degree” includes certificates in vocational programs. Full-time enrollment is 12 or more credits per term or 24 credits per year. Black includes African American, Hispanic includes Latino, American Indian includes Alaska Native, Pacific Islander includes Native Hawaiian, and Other includes respondents having origins in a race not listed. Pacific Islanders have been combined with Asians because of small sample sizes. Race categories exclude Hispanic origin unless specified. This table includes students enrolled at postsecondary institutions in Puerto Rico. Detail may not sum to totals because of rounding.SOURCE: U.S. Department of Education, National Center for Education Statistics, 2003–04 Beginning Postsecondary StudentsLongitudinal Study, First Follow-up (BPS:04/06).
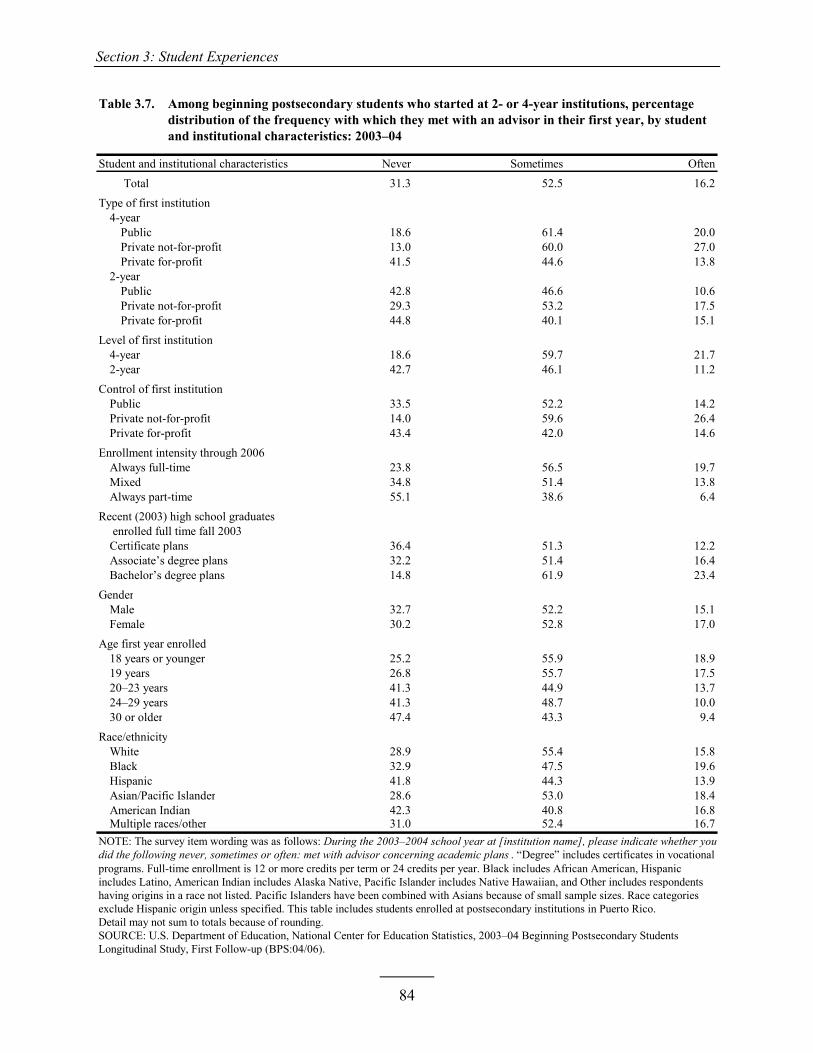
Section 3: Student Experiences
84
Table 3.7.—Among beginning postsecondary students who started at 2- or 4-year institutions, percentage Table 3.7.—distribution of the frequency with which they met with an advisor in their first year, by student Table 3.7.—and institutional characteristics: 2003–04
Student and institutional characteristics Never Sometimes Often Total 31.3 52.5 16.2
Type of first institution4-year
Public 18.6 61.4 20.0Private not-for-profit 13.0 60.0 27.0Private for-profit 41.5 44.6 13.8
2-yearPublic 42.8 46.6 10.6Private not-for-profit 29.3 53.2 17.5Private for-profit 44.8 40.1 15.1
Level of first institution4-year 18.6 59.7 21.72-year 42.7 46.1 11.2
Control of first institutionPublic 33.5 52.2 14.2Private not-for-profit 14.0 59.6 26.4Private for-profit 43.4 42.0 14.6
Enrollment intensity through 2006Always full-time 23.8 56.5 19.7Mixed 34.8 51.4 13.8Always part-time 55.1 38.6 6.4
Recent (2003) high school graduates enrolled full time fall 2003Certificate plans 36.4 51.3 12.2Associate’s degree plans 32.2 51.4 16.4Bachelor’s degree plans 14.8 61.9 23.4
GenderMale 32.7 52.2 15.1Female 30.2 52.8 17.0
Age first year enrolled18 years or younger 25.2 55.9 18.919 years 26.8 55.7 17.520–23 years 41.3 44.9 13.724–29 years 41.3 48.7 10.030 or older 47.4 43.3 9.4
Race/ethnicityWhite 28.9 55.4 15.8Black 32.9 47.5 19.6Hispanic 41.8 44.3 13.9Asian/Pacific Islander 28.6 53.0 18.4American Indian 42.3 40.8 16.8Multiple races/other 31.0 52.4 16.7
NOTE: The survey item wording was as follows: During the 2003–2004 school year at [institution name], please indicate whether you did the following never, sometimes or often: met with advisor concerning academic plans . “Degree” includes certificates in vocational programs. Full-time enrollment is 12 or more credits per term or 24 credits per year. Black includes African American, Hispanic includes Latino, American Indian includes Alaska Native, Pacific Islander includes Native Hawaiian, and Other includes respondents having origins in a race not listed. Pacific Islanders have been combined with Asians because of small sample sizes. Race categories exclude Hispanic origin unless specified. This table includes students enrolled at postsecondary institutions in Puerto Rico. Detail may not sum to totals because of rounding.SOURCE: U.S. Department of Education, National Center for Education Statistics, 2003–04 Beginning Postsecondary StudentsLongitudinal Study, First Follow-up (BPS:04/06).

Section 3: Student Experiences
85
Table 3.8.—Among beginning postsecondary students who started at 2- or 4-year institutions, percentage Table 3.8.—distribution of the frequency with which they attended fine arts activities in their first year, by Table 3.8.—student and institutional characteristics: 2003–04
Student and institutional characteristics Never Sometimes Often Total 68.3 23.1 8.5
Type of first institution4-year
Public 53.1 36.8 10.1Private not-for-profit 40.2 39.8 20.1Private for-profit 90.8 5.8 3.4
2-yearPublic 82.4 12.8 4.9Private not-for-profit 79.5 13.4 7.1Private for-profit 92.0 4.9 3.1
Level of first institution4-year 51.9 35.4 12.72-year 83.2 12.0 4.7
Control of first institutionPublic 71.2 22.0 6.9Private not-for-profit 42.6 38.1 19.3Private for-profit 91.5 5.3 3.2
Enrollment intensity through 2006Always full-time 59.8 29.1 11.0Mixed 75.8 17.7 6.5Always part-time 88.8 9.1 2.1
Recent (2003) high school graduates enrolled full time fall 2003Certificate plans 75.1 20.2 4.8Associate’s degree plans 73.9 18.1 8.0Bachelor’s degree plans 45.7 39.3 15.0
GenderMale 69.2 22.6 8.2Female 67.6 23.6 8.8
Age first year enrolled18 years or younger 59.4 29.4 11.219 years 62.2 27.6 10.220–23 years 81.0 14.5 4.524–29 years 88.3 9.2 2.530 or older 90.1 7.3 2.5
Race/ethnicityWhite 66.5 24.9 8.6Black 72.1 19.8 8.1Hispanic 75.4 17.0 7.7Asian/Pacific Islander 63.8 28.0 8.2American Indian 75.9 14.8 9.3Multiple races/other 67.7 21.2 11.1
NOTE: The survey item wording was as follows: During the 2003–2004 school year at [institution name], please indicate whether you did the following never, sometimes or often: attended fine arts activities . “Degree” includes certificates in vocational programs. Full-time enrollment is 12 or more credits per term or 24 credits per year. Black includes African American, Hispanic includes Latino, American Indian includes Alaska Native, Pacific Islander includes Native Hawaiian, and Other includes respondents having origins in a race not listed. Pacific Islanders have been combined with Asians because of small sample sizes. Race categories exclude Hispanic origin unless specified. This table includes students enrolled at postsecondary institutions in Puerto Rico. Detail may not sum to totals because of rounding.SOURCE: U.S. Department of Education, National Center for Education Statistics, 2003–04 Beginning Postsecondary StudentsLongitudinal Study, First Follow-up (BPS:04/06).

Section 3: Student Experiences
86
Table 3.9.—Among beginning postsecondary students who started at 2- or 4-year institutions, percentage Table 3.9.—distribution of the frequency with which they participated in school clubs in their first year, by Table 3.9.—student and institutional characteristics: 2003–04
Student and institutional characteristics Never Sometimes Often Total 73.0 17.9 9.1
Type of first institution4-year
Public 59.6 26.7 13.7Private not-for-profit 42.6 35.9 21.5Private for-profit 87.8 8.7 3.5
2-yearPublic 88.2 8.4 3.3Private not-for-profit 82.1 11.8 6.2Private for-profit 87.7 8.7 3.6
Level of first institution4-year 56.4 28.2 15.42-year 88.1 8.5 3.4
Control of first institutionPublic 77.3 15.4 7.3Private not-for-profit 45.1 34.4 20.5Private for-profit 87.8 8.7 3.5
Enrollment intensity through 2006Always full-time 64.3 22.9 12.7Mixed 80.4 13.9 5.7Always part-time 94.3 4.8 1.0
Recent (2003) high school graduates enrolled full time fall 2003Certificate plans 71.3 20.5 8.3Associate’s degree plans 79.1 13.6 7.3Bachelor’s degree plans 49.4 32.4 18.3
GenderMale 73.3 17.6 9.1Female 72.8 18.1 9.1
Age first year enrolled18 years or younger 64.4 23.3 12.219 years 67.5 21.1 11.420–23 years 85.0 10.5 4.524–29 years 91.5 6.3 2.230 or older 93.8 5.1 1.1
Race/ethnicityWhite 72.1 18.3 9.6Black 78.3 14.4 7.3Hispanic 77.9 14.7 7.5Asian/Pacific Islander 61.1 27.4 11.6American Indian 77.7 9.5 12.7Multiple races/other 70.2 21.6 8.1
NOTE: The survey item wording was as follows: During the 2003–2004 school year at [institution name], please indicate whether youdid the following never, sometimes or often: participated in school clubs . “Degree” includes certificates in vocational programs. Full-time enrollment is 12 or more credits per term or 24 credits per year. Black includes African American, Hispanic includes Latino, American Indian includes Alaska Native, Pacific Islander includes Native Hawaiian, and Other includes respondents having origins in a race not listed. Pacific Islanders have been combined with Asians because of small sample sizes. Race categories exclude Hispanic origin unless specified. This table includes students enrolled at postsecondary institutions in Puerto Rico. Detail may not sum to totals because of rounding.SOURCE: U.S. Department of Education, National Center for Education Statistics, 2003–04 Beginning Postsecondary StudentsLongitudinal Study, First Follow-up (BPS:04/06).

Section 3: Student Experiences
87
Table 3.10.—Among beginning postsecondary students who started at 2- or 4-year institutions, percentage Table 3.10.—distribution of the frequency with which they participated in sports in their first year, by Table 3.10.—student and institutional characteristics: 2003–04
Student and institutional characteristics Never Sometimes Often Total 78.6 10.8 10.6
Type of first institution4-year
Public 65.1 19.7 15.1Private not-for-profit 53.5 19.5 27.0Private for-profit 96.1 1.8 2.1
2-yearPublic 91.9 4.0 4.1Private not-for-profit 83.4 5.6 11.0Private for-profit 94.9 4.3 0.8
Level of first institution4-year 63.8 18.3 17.92-year 92.0 4.1 4.0
Control of first institutionPublic 81.6 10.0 8.3Private not-for-profit 55.3 18.6 26.0Private for-profit 95.4 3.2 1.4
Enrollment intensity through 2006Always full-time 71.3 14.1 14.6Mixed 85.2 8.1 6.7Always part-time 95.6 2.7 1.7
Recent (2003) high school graduates enrolled full time fall 2003Certificate plans 78.3 11.4 10.2Associate’s degree plans 85.7 5.5 8.8Bachelor’s degree plans 58.4 20.7 21.0
GenderMale 72.4 13.9 13.7Female 83.5 8.4 8.1
Age first year enrolled18 years or younger 71.9 14.1 14.019 years 72.8 13.2 14.020–23 years 88.9 6.0 5.124–29 years 95.3 3.3 1.430 or older 95.6 2.8 1.6
Race/ethnicityWhite 75.8 12.1 12.1Black 85.2 6.5 8.3Hispanic 85.6 8.0 6.5Asian/Pacific Islander 77.8 14.5 7.7American Indian 85.4 6.9 7.7Multiple races/other 79.6 9.7 10.7
NOTE: The survey item wording was as follows: During the 2003–2004 school year at [institution name], please indicate whether youdid the following never, sometimes or often: participated in varsity/intramural/club sports . “Degree” includes certificates in vocational programs. Full-time enrollment is 12 or more credits per term or 24 credits per year. Black includes African American, Hispanic includes Latino, American Indian includes Alaska Native, Pacific Islander includes Native Hawaiian, and Other includes respondents having origins in a race not listed. Pacific Islanders have been combined with Asians because of small sample sizes. Race categories exclude Hispanic origin unless specified. This table includes students enrolled at postsecondary institutions in Puerto Rico. Detail may not sum to totals because of rounding.SOURCE: U.S. Department of Education, National Center for Education Statistics, 2003–04 Beginning Postsecondary StudentsLongitudinal Study, First Follow-up (BPS:04/06).
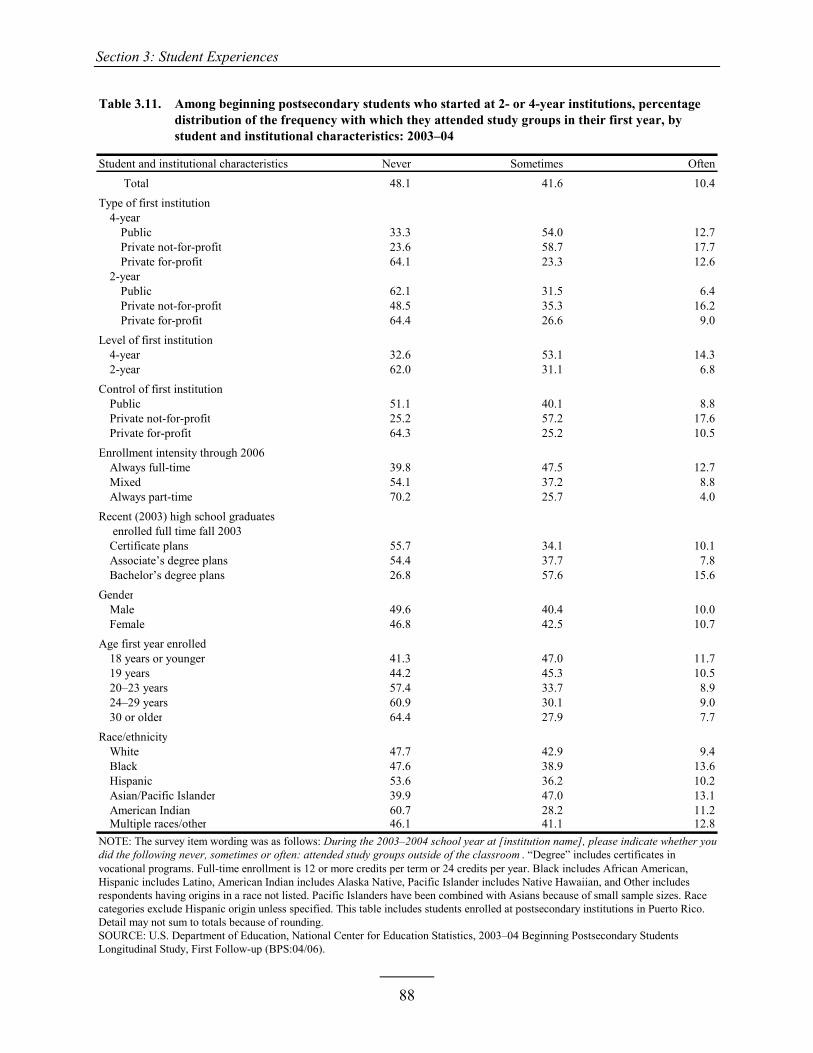
Section 3: Student Experiences
88
Table 3.11.—Among beginning postsecondary students who started at 2- or 4-year institutions, percentage Table 3.11.—distribution of the frequency with which they attended study groups in their first year, by Table 3.11.—student and institutional characteristics: 2003–04
Student and institutional characteristics Never Sometimes Often Total 48.1 41.6 10.4
Type of first institution4-year
Public 33.3 54.0 12.7Private not-for-profit 23.6 58.7 17.7Private for-profit 64.1 23.3 12.6
2-yearPublic 62.1 31.5 6.4Private not-for-profit 48.5 35.3 16.2Private for-profit 64.4 26.6 9.0
Level of first institution4-year 32.6 53.1 14.32-year 62.0 31.1 6.8
Control of first institutionPublic 51.1 40.1 8.8Private not-for-profit 25.2 57.2 17.6Private for-profit 64.3 25.2 10.5
Enrollment intensity through 2006Always full-time 39.8 47.5 12.7Mixed 54.1 37.2 8.8Always part-time 70.2 25.7 4.0
Recent (2003) high school graduates enrolled full time fall 2003Certificate plans 55.7 34.1 10.1Associate’s degree plans 54.4 37.7 7.8Bachelor’s degree plans 26.8 57.6 15.6
GenderMale 49.6 40.4 10.0Female 46.8 42.5 10.7
Age first year enrolled18 years or younger 41.3 47.0 11.719 years 44.2 45.3 10.520–23 years 57.4 33.7 8.924–29 years 60.9 30.1 9.030 or older 64.4 27.9 7.7
Race/ethnicityWhite 47.7 42.9 9.4Black 47.6 38.9 13.6Hispanic 53.6 36.2 10.2Asian/Pacific Islander 39.9 47.0 13.1American Indian 60.7 28.2 11.2Multiple races/other 46.1 41.1 12.8
NOTE: The survey item wording was as follows: During the 2003–2004 school year at [institution name], please indicate whether you did the following never, sometimes or often: attended study groups outside of the classroom . “Degree” includes certificates in vocational programs. Full-time enrollment is 12 or more credits per term or 24 credits per year. Black includes African American, Hispanic includes Latino, American Indian includes Alaska Native, Pacific Islander includes Native Hawaiian, and Other includes respondents having origins in a race not listed. Pacific Islanders have been combined with Asians because of small sample sizes. Race categories exclude Hispanic origin unless specified. This table includes students enrolled at postsecondary institutions in Puerto Rico. Detail may not sum to totals because of rounding.SOURCE: U.S. Department of Education, National Center for Education Statistics, 2003–04 Beginning Postsecondary StudentsLongitudinal Study, First Follow-up (BPS:04/06).

Section 3: Student Experiences
89
Table 3.12.—Percentage of beginning postsecondary students who reported taking various types of courses inTable 3.12.—their first year, by student and institutional characteristics: 2003–04
DistanceStudent and institutional education Mathe- Studycharacteristics courses Any English matics Reading skills Writing
Total 9.3 20.5 6.1 15.5 6.4 2.3 7.9Type of first institution
4-yearPublic 7.0 18.6 5.2 13.9 4.7 1.9 8.1Private not-for-profit 6.5 15.2 4.5 9.8 3.8 2.1 7.3Private for-profit 9.3 10.6 4.9 7.9 3.0 3.1 4.9
2-yearPublic 13.2 28.6 8.4 22.3 10.0 2.8 9.6Private not-for-profit 2.0 17.6 8.4 13.1 5.2 3.6 5.6Private for-profit 5.1 8.3 2.2 5.1 1.7 1.7 4.8
Less-than-2-yearPublic 5.0 11.1 7.0 8.9 5.5 1.6 4.7Private for-profit 3.9 4.1 1.6 2.4 1.8 1.3 2.2
Level of first institution4-year 7.0 16.9 4.9 12.2 4.3 2.1 7.62-year 12.2 26.4 7.8 20.5 9.1 2.7 9.1Less-than-2-year 4.2 5.6 2.6 3.7 2.5 1.4 2.6
Control of first institutionPublic 10.7 24.5 7.2 18.9 7.9 2.4 9.0Private not-for-profit 6.3 15.3 4.8 10.1 3.9 2.2 7.1Private for-profit 5.5 6.9 2.6 4.5 2.0 1.8 3.6
Degree plans first yearNone 11.3 22.2 5.6 16.6 6.0 2.6 9.1Certificate 6.2 12.6 5.3 8.9 5.3 2.1 5.8Associate’s degree 12.5 26.4 7.7 21.0 9.1 2.8 8.6Bachelor’s degree 6.8 17.4 5.2 12.3 4.5 2.0 7.7
Recent (2003) high school graduates enrolled full time fall 2003Certificate plans 5.1 13.3 4.9 9.1 5.6 1.7 7.6Associate’s degree plans 12.2 32.5 9.5 26.4 11.4 3.5 11.1Bachelor’s degree plans 5.6 17.0 4.9 11.6 4.4 1.9 7.9
GenderMale 8.6 19.1 5.6 14.3 5.8 2.0 7.2Female 9.7 21.6 6.5 16.4 6.9 2.6 8.4
Age first year enrolled18 years or younger 7.0 22.5 6.4 16.4 6.8 2.3 9.619 years 9.8 22.3 6.6 17.2 6.5 2.7 8.420–23 years 10.7 19.0 6.4 14.7 6.9 2.5 6.824–29 years 11.7 15.1 4.1 12.1 4.3 1.7 4.230 or older 12.9 15.9 5.3 12.4 5.9 1.8 5.0
Race/ethnicityWhite 9.8 19.9 5.8 14.9 5.5 2.5 7.9Black 7.8 23.7 7.8 18.2 9.5 3.0 7.8Hispanic 8.8 20.5 5.8 15.9 7.3 1.9 7.3Asian/Pacific Islander 9.0 21.7 9.1 14.4 7.4 1.2 9.9American Indian 15.5 29.5 4.6 20.0 15.1 2.7 14.6Multiple races/other 7.8 17.4 4.3 14.8 5.0 1.3 7.8
See notes at end of table.
Remedial courses
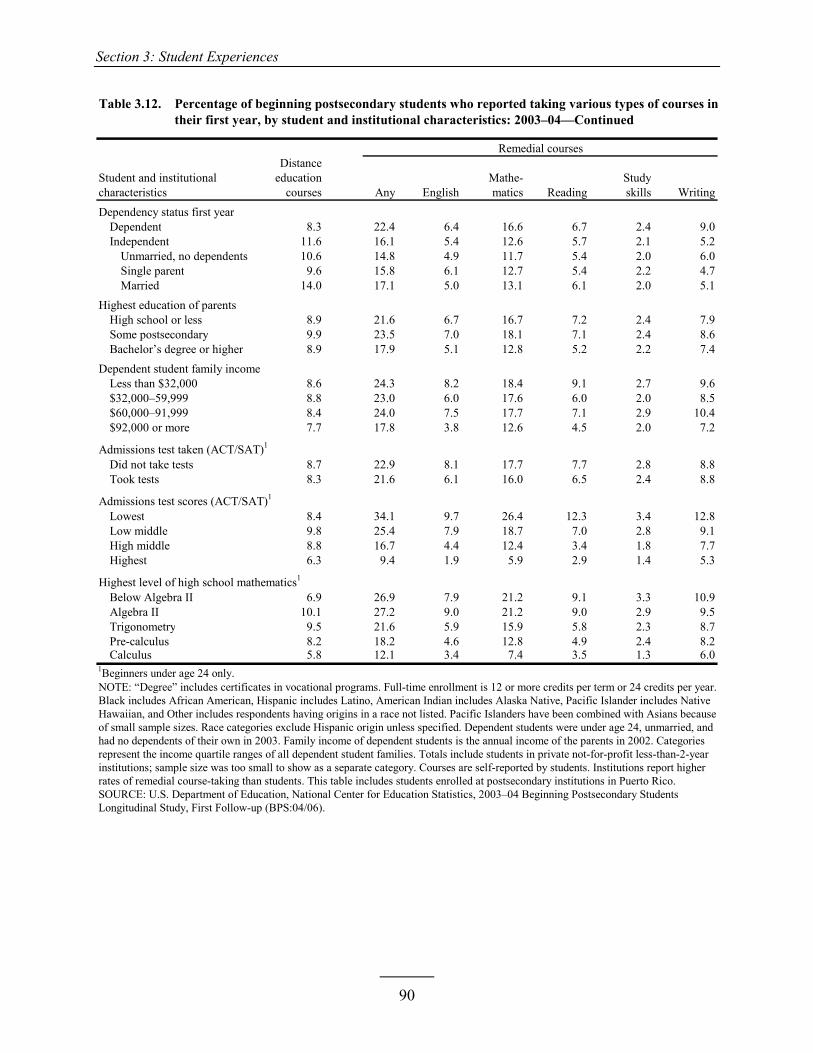
Section 3: Student Experiences
90
Table 3.12.—Percentage of beginning postsecondary students who reported taking various types of courses inTable 3.12.—their first year, by student and institutional characteristics: 2003–04—Continued
DistanceStudent and institutional education Mathe- Studycharacteristics courses Any English matics Reading skills WritingDependency status first year
Dependent 8.3 22.4 6.4 16.6 6.7 2.4 9.0Independent 11.6 16.1 5.4 12.6 5.7 2.1 5.2
Unmarried, no dependents 10.6 14.8 4.9 11.7 5.4 2.0 6.0Single parent 9.6 15.8 6.1 12.7 5.4 2.2 4.7Married 14.0 17.1 5.0 13.1 6.1 2.0 5.1
Highest education of parentsHigh school or less 8.9 21.6 6.7 16.7 7.2 2.4 7.9Some postsecondary 9.9 23.5 7.0 18.1 7.1 2.4 8.6Bachelor’s degree or higher 8.9 17.9 5.1 12.8 5.2 2.2 7.4
Dependent student family income Less than $32,000 8.6 24.3 8.2 18.4 9.1 2.7 9.6$32,000–59,999 8.8 23.0 6.0 17.6 6.0 2.0 8.5$60,000–91,999 8.4 24.0 7.5 17.7 7.1 2.9 10.4$92,000 or more 7.7 17.8 3.8 12.6 4.5 2.0 7.2
Admissions test taken (ACT/SAT)1
Did not take tests 8.7 22.9 8.1 17.7 7.7 2.8 8.8Took tests 8.3 21.6 6.1 16.0 6.5 2.4 8.8
Admissions test scores (ACT/SAT)1
Lowest 8.4 34.1 9.7 26.4 12.3 3.4 12.8Low middle 9.8 25.4 7.9 18.7 7.0 2.8 9.1High middle 8.8 16.7 4.4 12.4 3.4 1.8 7.7Highest 6.3 9.4 1.9 5.9 2.9 1.4 5.3
Highest level of high school mathematics1
Below Algebra II 6.9 26.9 7.9 21.2 9.1 3.3 10.9Algebra II 10.1 27.2 9.0 21.2 9.0 2.9 9.5Trigonometry 9.5 21.6 5.9 15.9 5.8 2.3 8.7Pre-calculus 8.2 18.2 4.6 12.8 4.9 2.4 8.2Calculus 5.8 12.1 3.4 7.4 3.5 1.3 6.0
1Beginners under age 24 only.NOTE: “Degree” includes certificates in vocational programs. Full-time enrollment is 12 or more credits per term or 24 credits per year. Black includes African American, Hispanic includes Latino, American Indian includes Alaska Native, Pacific Islander includes Native Hawaiian, and Other includes respondents having origins in a race not listed. Pacific Islanders have been combined with Asians because of small sample sizes. Race categories exclude Hispanic origin unless specified. Dependent students were under age 24, unmarried, and had no dependents of their own in 2003. Family income of dependent students is the annual income of the parents in 2002. Categories represent the income quartile ranges of all dependent student families. Totals include students in private not-for-profit less-than-2-year institutions; sample size was too small to show as a separate category. Courses are self-reported by students. Institutions report higher rates of remedial course-taking than students. This table includes students enrolled at postsecondary institutions in Puerto Rico.SOURCE: U.S. Department of Education, National Center for Education Statistics, 2003–04 Beginning Postsecondary StudentsLongitudinal Study, First Follow-up (BPS:04/06).
Remedial courses
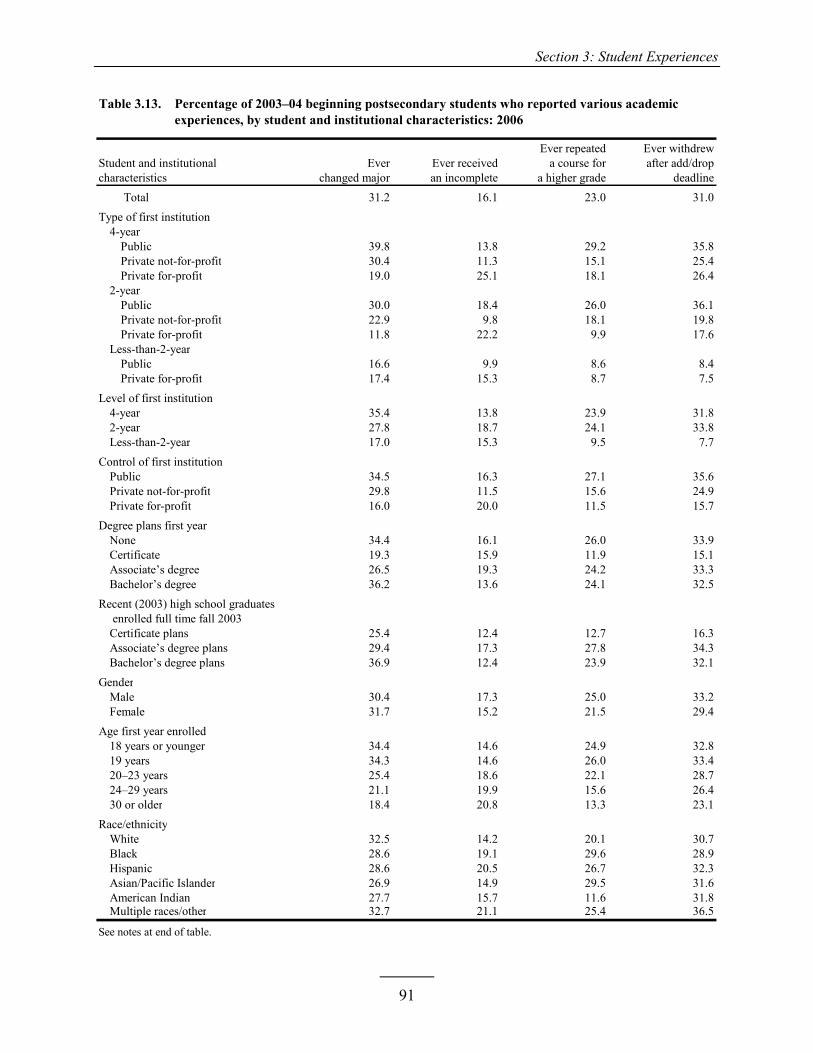
Section 3: Student Experiences
91
Table 3.13.—Percentage of 2003–04 beginning postsecondary students who reported various academic Table 3.13.—experiences, by student and institutional characteristics: 2006
Ever repeated Ever withdrewStudent and institutional Ever Ever received a course for after add/dropcharacteristics changed major an incomplete a higher grade deadline
Total 31.2 16.1 23.0 31.0Type of first institution
4-yearPublic 39.8 13.8 29.2 35.8Private not-for-profit 30.4 11.3 15.1 25.4Private for-profit 19.0 25.1 18.1 26.4
2-yearPublic 30.0 18.4 26.0 36.1Private not-for-profit 22.9 9.8 18.1 19.8Private for-profit 11.8 22.2 9.9 17.6
Less-than-2-yearPublic 16.6 9.9 8.6 8.4Private for-profit 17.4 15.3 8.7 7.5
Level of first institution4-year 35.4 13.8 23.9 31.82-year 27.8 18.7 24.1 33.8Less-than-2-year 17.0 15.3 9.5 7.7
Control of first institutionPublic 34.5 16.3 27.1 35.6Private not-for-profit 29.8 11.5 15.6 24.9Private for-profit 16.0 20.0 11.5 15.7
Degree plans first yearNone 34.4 16.1 26.0 33.9Certificate 19.3 15.9 11.9 15.1Associate’s degree 26.5 19.3 24.2 33.3Bachelor’s degree 36.2 13.6 24.1 32.5
Recent (2003) high school graduates enrolled full time fall 2003Certificate plans 25.4 12.4 12.7 16.3Associate’s degree plans 29.4 17.3 27.8 34.3Bachelor’s degree plans 36.9 12.4 23.9 32.1
GenderMale 30.4 17.3 25.0 33.2Female 31.7 15.2 21.5 29.4
Age first year enrolled18 years or younger 34.4 14.6 24.9 32.819 years 34.3 14.6 26.0 33.420–23 years 25.4 18.6 22.1 28.724–29 years 21.1 19.9 15.6 26.430 or older 18.4 20.8 13.3 23.1
Race/ethnicityWhite 32.5 14.2 20.1 30.7Black 28.6 19.1 29.6 28.9Hispanic 28.6 20.5 26.7 32.3Asian/Pacific Islander 26.9 14.9 29.5 31.6American Indian 27.7 15.7 11.6 31.8Multiple races/other 32.7 21.1 25.4 36.5
See notes at end of table.

Section 3: Student Experiences
92
Table 3.13.—Percentage of 2003–04 beginning postsecondary students who reported various academic Table 3.13.—experiences, by student and institutional characteristics: 2006—Continued
Ever repeated Ever withdrewStudent and institutional Ever Ever received a course for after add/dropcharacteristics changed major an incomplete a higher grade deadlineDependency status first year
Dependent 34.0 14.9 25.3 32.9Independent 20.8 19.6 15.8 25.3
Unmarried, no dependents 25.1 19.2 13.1 26.8Single parent 22.0 20.2 17.8 26.6Married 16.7 19.2 15.6 22.9
Highest education of parentsHigh school or less 26.6 17.9 20.6 28.9Some postsecondary 32.6 17.0 25.8 32.1Bachelor’s degree or higher 33.7 14.0 23.1 32.3
Dependent student family income Less than $32,000 29.4 17.0 26.8 31.8$32,000–59,999 35.7 15.4 25.0 31.7$60,000–91,999 34.2 14.1 25.1 34.3$92,000 or more 36.4 12.9 23.9 33.2
Admissions test taken (ACT/SAT)1
Did not take tests 24.4 20.1 24.0 30.9Took tests 34.9 14.1 25.0 32.7
Admissions test scores (ACT/SAT)1
Lowest 33.2 17.2 31.6 34.3Low middle 34.9 15.5 28.1 34.6High middle 35.5 13.4 24.0 32.7Highest 35.8 10.4 16.9 29.4
Highest level of high school mathematics1
Below Algebra II 30.1 19.7 26.4 36.2Algebra II 31.1 17.2 26.6 31.3Trigonometry 35.2 15.5 26.0 33.3Pre-calculus 34.2 13.0 25.1 33.2Calculus 35.5 10.4 19.3 29.1
1Beginners under age 24 only.NOTE: “Degree” includes certificates in vocational programs. Full-time enrollment is 12 or more credits per term or 24 credits per year.Black includes African American, Hispanic includes Latino, American Indian includes Alaska Native, Pacific Islander includes Native Hawaiian, and Other includes respondents having origins in a race not listed. Pacific Islanders have been combined with Asians because of small sample sizes. Race categories exclude Hispanic origin unless specified. Dependent students were under age 24, unmarried, and had no dependents of their own in 2003. Family income of dependent students is the annual income of the parents in 2002. Categories represent the income quartile ranges of all dependent student families. Totals include students in private not-for-profit less-than-2-year institutions; sample size was too small to show as a separate category. The information in this table is self-reported by students. This table includes students enrolled at postsecondary institutions in Puerto Rico.SOURCE: U.S. Department of Education, National Center for Education Statistics, 2003–04 Beginning Postsecondary StudentsLongitudinal Study, First Follow-up (BPS:04/06).
93
Section 4: Student Persistence and Attainment Anywhere
The tables in this section show the percentages of 2003–04 beginning postsecondary students who attained a degree or certificate and their persistence and attainment status through June 2006. These data refer to persistence and attainment anywhere, not just at the first institution attended. Thus, the outcomes of students who transferred during their first 3 years is captured. Section 5 examines rates of retention and attainment at the first institution.
The 3-year period covered in this report is too brief to determine whether students who had not attained a certificate or degree and were no longer enrolled anywhere in June 2006 had permanently left postsecondary education. Some beginning students may “stop out” by leaving an institution for a semester or more, and then returning to that or a different institution later. Students who have “stopped out” can only be identified as such after they have returned, which may be after the 3-year period of this study. When the term “left postsecondary education” is used in this report, it only refers to the enrollment status of the student at the end of the 3-year period, and includes some “stop-outs” who cannot be identified until later.
All Beginning Postsecondary Students
• By June 2006, some 16 percent of all 2003–04 beginning postsecondary students had attained a certificate or degree, primarily certificates (8 percent) or associate’s degrees (7 percent), but 1 percent had earned a bachelor’s degree (table 4.1).
• About one-half (51 percent) of all beginning postsecondary students had not earned a degree but were still enrolled, and about one-third (33 percent) had not earned a degree and were not enrolled anywhere in 2006.
• Among 2003–04 beginning postsecondary students whose initial plan was to complete a certificate, 44 percent had earned one by 2006, and another 2 percent had earned an associate’s degree; 41 percent had not attained a certificate or degree and were not enrolled anywhere in 2006.
• Among those whose initial plan was to complete an associate’s degree, 15 percent had earned one by 2006. Thirty-six percent had not earned any awards but were still enrolled, and 45 percent had not completed a certificate or degree and were not enrolled anywhere in 2006.
Section 4: Student Persistence and Attainment Anywhere
94
• Among those planning to earn a bachelor’s degree when they first enrolled, 2 percent had earned one by 2006 (i.e., in less than 4 years) and 77 percent were still enrolled. Eighteen percent were not enrolled anywhere and had not completed a degree in 2006.
• Beginning postsecondary students who always attended part time were not enrolled and had not completed any degree at a higher rate (69 percent) than those who always attended full time (28 percent).
• Also leaving without completing at higher rates were males (36 percent) compared with females (32 percent); students 20–23 years old when they started (49 percent) compared with those who started at age 19 (27 percent); and Blacks (43 percent) and Hispanics (37 percent) compared with Whites (31 percent) and Asians (21 percent).
Students Beginning at Public 2-Year Institutions
• Among 2003–04 beginning postsecondary students who started at public 2-year institutions, 5 percent had earned a certificate by June 2006, and 10 percent had earned an associate’s degree (table 4.2). Another 40 percent had earned no degree but were still enrolled, and 45 percent were not enrolled and had not completed a certificate or degree.
• A greater proportion of students seeking degrees in applied than in general education or transfer fields had left without earning a degree (49 vs. 43 percent).
• By 2003, some 60 percent of students who were single parents when they first began were no longer enrolled and had not completed any certificate or degree.
• Among those who were 23 or younger when they began in a public 2-year institution in 2003–04, those whose highest level of high school mathematics was below algebra II had attained a degree by June 2006 at lower rates than those who completed trigonometry, pre-calculus, or calculus in high school.
Students Beginning at 4-Year Institutions
• Because earning a bachelor’s degree typically takes at least 4 years, most students who began at 4-year institutions in 2003–04 were still enrolled in 2006 (74 percent), although 19 percent were not enrolled and had left without completing their degree (table 4.3). A few had earned a bachelor’s degree (2 percent), certificate (1 percent), or associate’s degree (4 percent).
• Students attending private for-profit 4-year institutions differed from those at other 4-year institutions. Among students beginning at private for-profit 4-year institutions, 16 percent earned an associate’s degree and 48 percent were not enrolled and had not completed a degree. In contrast, relatively fewer students earned associate’s degrees at public or private not-for-profit institutions (2 and 4 percent, respectively), and fewer had left without completing their degree (17 and 16 percent).

Section 4: Student Persistence and Attainment Anywhere
95
• Students who scored in the highest category of college admissions test scores had a lower departure rate (8 percent) than students who had lower scores (14 to 31 percent).
• Similarly, students who took calculus in high school had a lower departure rate (8 percent) than those who had only taken lower levels of mathematics courses (13 to 37 percent).
• The percentage of students who were no longer enrolled and had not completed a degree by 2006 varied by gender, age, race/ethnicity, and family background. Those with the lowest departure rates were females, students 18 years or younger or 19 years when they started, Asians, students who had at least one parent with a bachelor’s degree, and students from families with high incomes.

Section 4: Student Persistence and Attainment Anywhere
96
Table 4.1.—Percentage of 2003–04 beginning postsecondary students who attained a degree and percentage Table 4.1.—distribution of their persistence and attainment status anywhere through June 2006, by student Table 4.1.—and institutional characteristics
Attained Attained No No Associ- Bach- degree, degree, degree, degree,Student and institutional Any Certif- ate’s elor’s not still still notcharacteristics degree icate degree degree Total enrolled enrolled enrolled enrolled
Total 15.9 7.8 7.0 1.0 100.0 8.9 7.0 50.7 33.5Type of first institution
4-yearPublic 5.5 0.6 2.4 2.5 100.0 3.2 2.4 77.2 17.3Private not-for-profit 7.1 1.0 3.9 2.2 100.0 4.0 3.1 76.8 16.1Private for-profit 18.2 1.3 15.9 1.0 100.0 8.5 9.7 34.3 47.6
2-yearPublic 15.5 5.5 10.0 0.1 100.0 5.5 10.1 39.8 44.6Private not-for-profit 31.0 10.2 20.8 # 100.0 18.3 12.7 29.6 39.3Private for-profit 34.1 15.8 18.4 # 100.0 25.6 8.5 13.2 52.6
Less-than-2-yearPublic 63.1 62.3 0.6 0.1 100.0 51.8 11.3 6.9 30.0Private for-profit 50.3 50.2 0.1 # 100.0 41.3 9.0 8.2 41.5
Level of first institution4-year 7.0 0.8 3.9 2.3 100.0 3.8 3.2 73.8 19.22-year 17.6 6.5 11.0 0.1 100.0 7.6 10.0 37.1 45.3Less-than-2-year 52.2 51.9 0.2 # 100.0 42.8 9.4 8.3 39.5
Control of first institutionPublic 12.6 4.7 7.0 1.0 100.0 5.4 7.2 53.3 34.1Private not-for-profit 9.1 2.2 4.9 2.1 100.0 5.4 3.8 73.0 17.8Private for-profit 38.0 28.4 9.3 0.2 100.0 29.0 9.0 15.7 46.3
Degree plans first yearNone 9.4 4.8 4.3 0.3 100.0 4.3 5.1 46.9 43.7Certificate 45.8 43.7 2.0 0.1 100.0 36.4 9.5 13.2 41.0Associate’s degree 18.6 3.5 14.9 0.2 100.0 6.7 11.9 36.2 45.2Bachelor’s degree 5.1 0.6 2.2 2.3 100.0 3.0 2.1 77.2 17.7
Enrollment intensity through 2006Always full-time 18.3 8.6 8.3 1.4 100.0 11.1 7.2 53.8 27.9Mixed 14.9 7.2 7.0 0.7 100.0 6.3 8.6 57.2 28.0Always part-time 7.0 5.6 1.5 # 100.0 4.3 2.7 23.9 69.1
Transfer status through 2006Did not transfer 15.4 8.0 6.1 1.2 100.0 10.1 5.2 47.2 37.4Transferred 17.9 6.9 10.7 0.3 100.0 3.7 14.2 65.2 16.9
Recent (2003) high school graduates enrolled full time fall 2003Certificate plans 52.4 47.6 4.3 0.5 100.0 36.6 15.9 19.0 28.6Associate’s degree plans 28.5 2.4 25.7 0.4 100.0 8.2 20.2 40.1 31.4Bachelor’s degree plans 5.2 0.3 2.2 2.7 100.0 3.2 2.0 82.6 12.2
See notes at end of table.
Persistence anywhere through 2006Attained degree anywhere through 2006Highest degree

Section 4: Student Persistence and Attainment Anywhere
97
Table 4.1.—Percentage of 2003–04 beginning postsecondary students who attained a degree and percentage Table 4.1.—distribution of their persistence and attainment status anywhere through June 2006, by student Table 4.1.—and institutional characteristics—Continued
Attained Attained No No Associ- Bach- degree, degree, degree, degree,Student and institutional Any Certif- ate’s elor’s not still still notcharacteristics degree icate degree degree Total enrolled enrolled enrolled enrolledAge first year enrolled
18 years or younger 13.0 3.9 7.6 1.5 100.0 5.7 7.3 64.5 22.419 years 15.2 5.4 8.2 1.5 100.0 7.6 7.5 57.7 27.220–23 years 17.4 10.9 6.3 0.2 100.0 11.3 6.2 33.7 48.924–29 years 21.5 16.2 5.2 0.1 100.0 15.7 5.8 26.1 52.430 or older 21.4 16.4 4.9 0.1 100.0 15.1 6.3 24.7 53.9
Race/ethnicityWhite 15.0 6.1 7.7 1.3 100.0 8.0 7.0 53.8 31.2Black 15.5 9.7 5.3 0.4 100.0 8.8 6.6 41.1 43.4Hispanic 20.5 14.1 6.0 0.4 100.0 13.4 7.1 42.3 37.2Asian/Pacific Islander 14.3 5.5 6.7 2.2 100.0 7.2 7.1 64.7 21.0American Indian 14.1 10.4 3.6 # 100.0 9.6 4.5 50.5 35.4Multiple races/other 14.8 6.7 7.3 0.8 100.0 7.5 7.3 48.9 36.3
Dependency status first yearDependent 13.7 4.7 7.6 1.4 100.0 6.6 7.1 60.7 25.6Independent 21.2 15.4 5.6 0.2 100.0 14.6 6.6 26.2 52.7
Unmarried, no dependents 18.9 11.6 7.0 0.3 100.0 11.4 7.5 29.9 51.3Single parent 22.4 17.1 5.1 0.2 100.0 16.7 5.7 22.5 55.1Married 21.4 16.3 5.1 0.1 100.0 14.6 6.8 27.2 51.3
Highest education of parentsHigh school or less 20.9 12.6 7.9 0.4 100.0 12.8 8.2 35.8 43.2Some postsecondary 15.7 6.9 8.1 0.7 100.0 8.1 7.5 48.4 36.0Bachelor’s degree or higher 11.0 3.4 5.7 1.9 100.0 5.5 5.5 67.2 21.9
Dependent student family income Less than $32,000 17.6 8.8 7.9 0.8 100.0 9.6 7.9 48.6 33.8$32,000–59,999 16.4 5.4 9.7 1.2 100.0 7.2 9.1 55.6 28.1$60,000–91,999 11.3 2.6 7.3 1.4 100.0 5.2 6.1 65.9 22.8$92,000 or more 9.1 1.4 5.4 2.4 100.0 4.1 5.0 74.5 16.4
Federal Pell Grant received in first yearDependent Pell Grant recipients 19.2 9.9 8.4 1.0 100.0 10.9 8.3 50.2 30.6Independent Pell Grant recipients 28.6 21.7 6.7 0.2 100.0 21.6 7.0 21.3 50.1
Worked while enrolled in 2003–04Did not work 16.8 9.4 5.9 1.6 100.0 11.0 5.8 55.4 27.8Worked part time 15.7 6.1 8.5 1.1 100.0 7.6 8.1 55.6 28.7Worked full time 14.9 9.0 5.6 0.2 100.0 8.6 6.2 34.7 50.4
# Rounds to zero.NOTE: “Persistence and attainment anywhere” include students who transferred out of the first institution attended. “Degree” includescertificates in vocational programs. Full-time enrollment is 12 or more credits per term or 24 credits per year. Black includes AfricanAmerican, Hispanic includes Latino, American Indian includes Alaska Native, Pacific Islander includes Native Hawaiian, and Other includes respondents having origins in a race not listed. Pacific Islanders have been combined with Asians because of small sample sizes. Race categories exclude Hispanic origin unless specified. Dependent students were under age 24, unmarried, and had no dependents of their own in 2003. Family income of dependent students is the annual income of the parents in 2002. Categories represent the income quartile ranges of all dependent student families. Totals include students in private not-for-profit less-than-2-year institutions; sample size was too small to show as a separate category. This table includes students enrolled at postsecondary institutions in Puerto Rico. Detail may not sum to totals because of rounding.SOURCE: U.S. Department of Education, National Center for Education Statistics, 2003–04 Beginning Postsecondary StudentsLongitudinal Study, First Follow-up (BPS:04/06).
Persistence anywhere through 2006Highest degree
Attained degree anywhere through 2006
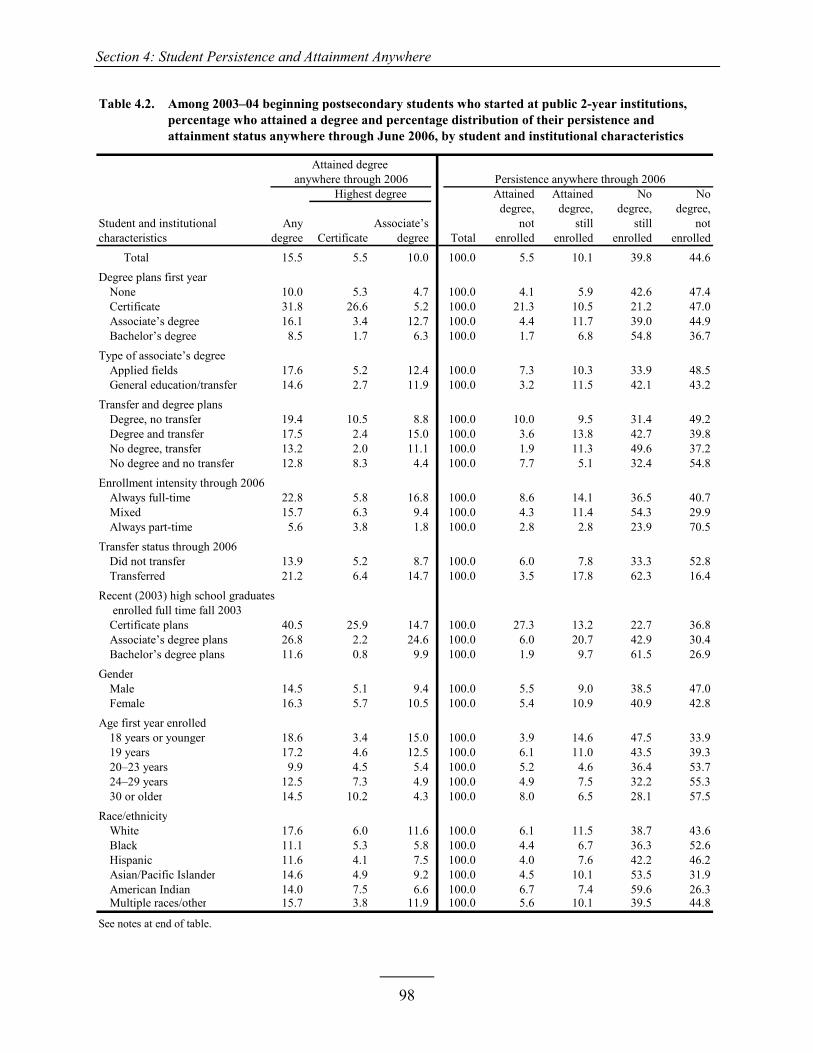
Section 4: Student Persistence and Attainment Anywhere
98
Table 4.2.—Among 2003–04 beginning postsecondary students who started at public 2-year institutions, Table 4.2.—percentage who attained a degree and percentage distribution of their persistence and Table 4.2.—attainment status anywhere through June 2006, by student and institutional characteristics
Attained Attained No No degree, degree, degree, degree,Student and institutional Any Associate’s not still still notcharacteristics degree Certificate degree Total enrolled enrolled enrolled enrolled
Total 15.5 5.5 10.0 100.0 5.5 10.1 39.8 44.6Degree plans first year
None 10.0 5.3 4.7 100.0 4.1 5.9 42.6 47.4Certificate 31.8 26.6 5.2 100.0 21.3 10.5 21.2 47.0Associate’s degree 16.1 3.4 12.7 100.0 4.4 11.7 39.0 44.9Bachelor’s degree 8.5 1.7 6.3 100.0 1.7 6.8 54.8 36.7
Type of associate’s degreeApplied fields 17.6 5.2 12.4 100.0 7.3 10.3 33.9 48.5General education/transfer 14.6 2.7 11.9 100.0 3.2 11.5 42.1 43.2
Transfer and degree plansDegree, no transfer 19.4 10.5 8.8 100.0 10.0 9.5 31.4 49.2Degree and transfer 17.5 2.4 15.0 100.0 3.6 13.8 42.7 39.8No degree, transfer 13.2 2.0 11.1 100.0 1.9 11.3 49.6 37.2No degree and no transfer 12.8 8.3 4.4 100.0 7.7 5.1 32.4 54.8
Enrollment intensity through 2006Always full-time 22.8 5.8 16.8 100.0 8.6 14.1 36.5 40.7Mixed 15.7 6.3 9.4 100.0 4.3 11.4 54.3 29.9Always part-time 5.6 3.8 1.8 100.0 2.8 2.8 23.9 70.5
Transfer status through 2006Did not transfer 13.9 5.2 8.7 100.0 6.0 7.8 33.3 52.8Transferred 21.2 6.4 14.7 100.0 3.5 17.8 62.3 16.4
Recent (2003) high school graduates enrolled full time fall 2003Certificate plans 40.5 25.9 14.7 100.0 27.3 13.2 22.7 36.8Associate’s degree plans 26.8 2.2 24.6 100.0 6.0 20.7 42.9 30.4Bachelor’s degree plans 11.6 0.8 9.9 100.0 1.9 9.7 61.5 26.9
GenderMale 14.5 5.1 9.4 100.0 5.5 9.0 38.5 47.0Female 16.3 5.7 10.5 100.0 5.4 10.9 40.9 42.8
Age first year enrolled18 years or younger 18.6 3.4 15.0 100.0 3.9 14.6 47.5 33.919 years 17.2 4.6 12.5 100.0 6.1 11.0 43.5 39.320–23 years 9.9 4.5 5.4 100.0 5.2 4.6 36.4 53.724–29 years 12.5 7.3 4.9 100.0 4.9 7.5 32.2 55.330 or older 14.5 10.2 4.3 100.0 8.0 6.5 28.1 57.5
Race/ethnicityWhite 17.6 6.0 11.6 100.0 6.1 11.5 38.7 43.6Black 11.1 5.3 5.8 100.0 4.4 6.7 36.3 52.6Hispanic 11.6 4.1 7.5 100.0 4.0 7.6 42.2 46.2Asian/Pacific Islander 14.6 4.9 9.2 100.0 4.5 10.1 53.5 31.9American Indian 14.0 7.5 6.6 100.0 6.7 7.4 59.6 26.3Multiple races/other 15.7 3.8 11.9 100.0 5.6 10.1 39.5 44.8
See notes at end of table.
Attained degree Persistence anywhere through 2006
Highest degreeanywhere through 2006
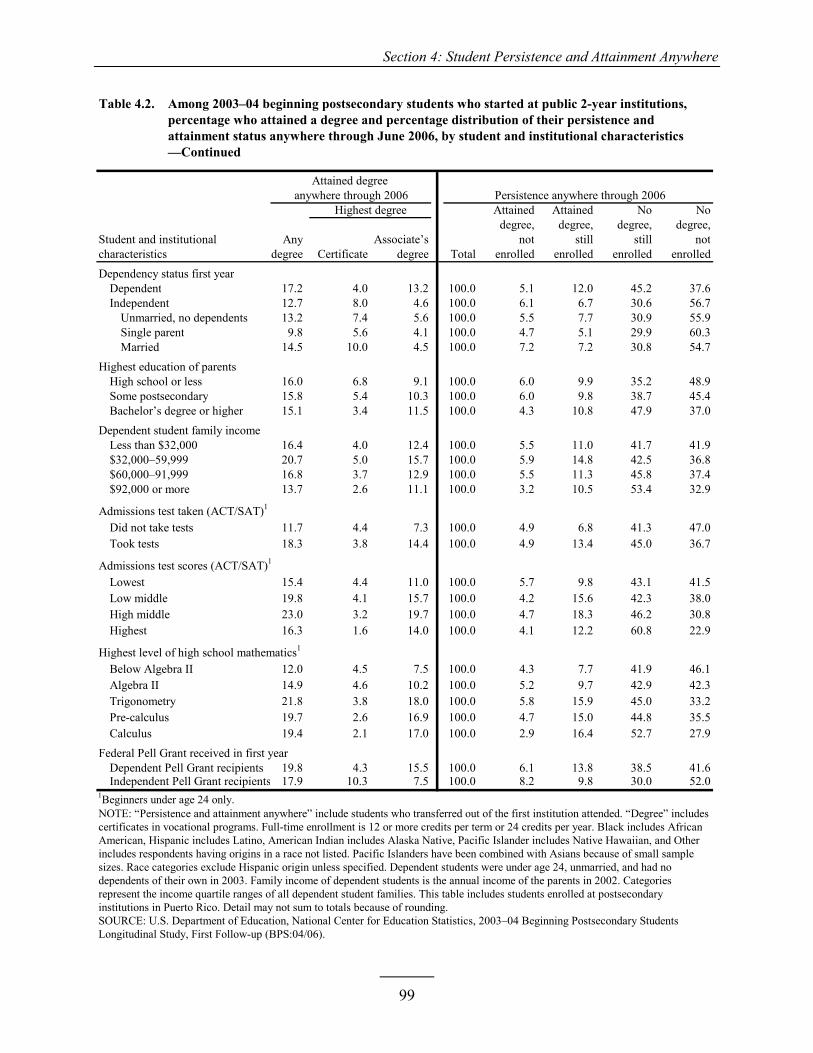
Section 4: Student Persistence and Attainment Anywhere
99
Table 4.2.—Among 2003–04 beginning postsecondary students who started at public 2-year institutions, Table 4.2.—percentage who attained a degree and percentage distribution of their persistence and Table 4.2.—attainment status anywhere through June 2006, by student and institutional characteristicsTable 4.2.——Continued
Attained Attained No No degree, degree, degree, degree,Student and institutional Any Associate’s not still still notcharacteristics degree Certificate degree Total enrolled enrolled enrolled enrolledDependency status first year
Dependent 17.2 4.0 13.2 100.0 5.1 12.0 45.2 37.6Independent 12.7 8.0 4.6 100.0 6.1 6.7 30.6 56.7
Unmarried, no dependents 13.2 7.4 5.6 100.0 5.5 7.7 30.9 55.9Single parent 9.8 5.6 4.1 100.0 4.7 5.1 29.9 60.3Married 14.5 10.0 4.5 100.0 7.2 7.2 30.8 54.7
Highest education of parentsHigh school or less 16.0 6.8 9.1 100.0 6.0 9.9 35.2 48.9Some postsecondary 15.8 5.4 10.3 100.0 6.0 9.8 38.7 45.4Bachelor’s degree or higher 15.1 3.4 11.5 100.0 4.3 10.8 47.9 37.0
Dependent student family income Less than $32,000 16.4 4.0 12.4 100.0 5.5 11.0 41.7 41.9$32,000–59,999 20.7 5.0 15.7 100.0 5.9 14.8 42.5 36.8$60,000–91,999 16.8 3.7 12.9 100.0 5.5 11.3 45.8 37.4$92,000 or more 13.7 2.6 11.1 100.0 3.2 10.5 53.4 32.9
Admissions test taken (ACT/SAT)1
Did not take tests 11.7 4.4 7.3 100.0 4.9 6.8 41.3 47.0Took tests 18.3 3.8 14.4 100.0 4.9 13.4 45.0 36.7
Admissions test scores (ACT/SAT)1
Lowest 15.4 4.4 11.0 100.0 5.7 9.8 43.1 41.5Low middle 19.8 4.1 15.7 100.0 4.2 15.6 42.3 38.0High middle 23.0 3.2 19.7 100.0 4.7 18.3 46.2 30.8Highest 16.3 1.6 14.0 100.0 4.1 12.2 60.8 22.9
Highest level of high school mathematics1
Below Algebra II 12.0 4.5 7.5 100.0 4.3 7.7 41.9 46.1Algebra II 14.9 4.6 10.2 100.0 5.2 9.7 42.9 42.3Trigonometry 21.8 3.8 18.0 100.0 5.8 15.9 45.0 33.2Pre-calculus 19.7 2.6 16.9 100.0 4.7 15.0 44.8 35.5Calculus 19.4 2.1 17.0 100.0 2.9 16.4 52.7 27.9
Federal Pell Grant received in first yearDependent Pell Grant recipients 19.8 4.3 15.5 100.0 6.1 13.8 38.5 41.6Independent Pell Grant recipients 17.9 10.3 7.5 100.0 8.2 9.8 30.0 52.0
1Beginners under age 24 only.NOTE: “Persistence and attainment anywhere” include students who transferred out of the first institution attended. “Degree” includescertificates in vocational programs. Full-time enrollment is 12 or more credits per term or 24 credits per year. Black includes AfricanAmerican, Hispanic includes Latino, American Indian includes Alaska Native, Pacific Islander includes Native Hawaiian, and Other includes respondents having origins in a race not listed. Pacific Islanders have been combined with Asians because of small sample sizes. Race categories exclude Hispanic origin unless specified. Dependent students were under age 24, unmarried, and had no dependents of their own in 2003. Family income of dependent students is the annual income of the parents in 2002. Categories represent the income quartile ranges of all dependent student families. This table includes students enrolled at postsecondary institutions in Puerto Rico. Detail may not sum to totals because of rounding.SOURCE: U.S. Department of Education, National Center for Education Statistics, 2003–04 Beginning Postsecondary StudentsLongitudinal Study, First Follow-up (BPS:04/06).
Highest degreeanywhere through 2006
Attained degree Persistence anywhere through 2006

Section 4: Student Persistence and Attainment Anywhere
100
Table 4.3.—Among 2003–04 beginning postsecondary students who started at 4-year institutions, percentage Table 4.3.—who attained a degree and percentage distribution of their persistence and attainment status Table 4.3.—anywhere through June 2006, by student and institutional characteristics
Attained Attained No No Associ- Bach- degree, degree, degree, degree,Student and institutional Any Certif- ate’s elor’s not still still notcharacteristics degree icate degree degree Total enrolled enrolled enrolled enrolled
Total 7.0 0.8 3.9 2.3 100.0 3.8 3.2 73.8 19.2Control of first institution
Public 4-year 5.5 0.6 2.4 2.5 100.0 3.2 2.4 77.2 17.3Private not-for-profit 4-year 7.1 1.0 3.9 2.2 100.0 4.0 3.1 76.8 16.1Private for-profit 4-year 18.2 1.3 15.9 1.0 100.0 8.5 9.7 34.3 47.6
Doctorate-granting status of first institutionDoctorate-granting 5.7 0.6 2.2 2.9 100.0 3.4 2.3 81.4 12.9Non-doctorate-granting 4-year 8.3 1.0 5.6 1.7 100.0 4.3 4.0 66.1 25.6
Degree plans first yearNone 5.8 0.9 3.7 1.2 100.0 2.5 3.3 65.7 28.5Certificate 14.1 11.2 0.8 2.1 100.0 12.1 2.0 49.0 36.9Associate’s degree 23.7 1.7 20.7 1.2 100.0 9.0 14.6 34.7 41.6Bachelor’s degree 4.5 0.4 1.6 2.5 100.0 3.0 1.5 80.5 15.0
Enrollment intensity through 2006Always full-time 7.4 0.6 4.3 2.5 100.0 4.0 3.4 76.1 16.5Mixed 6.5 1.5 3.0 2.0 100.0 3.9 2.7 71.1 22.4Always part-time 0.7 0.7 # # 100.0 0.6 0.1 30.1 69.2
Transfer status through 2006Did not transfer 6.8 0.5 3.6 2.7 100.0 4.2 2.6 73.5 19.7Transferred 7.8 1.8 5.5 0.5 100.0 2.3 5.5 75.0 17.2
Recent (2003) high school graduates enrolled full time fall 2003Certificate plans 11.6 6.6 1.5 3.5 100.0 8.2 3.4 71.1 17.3Associate’s degree plans 32.2 1.4 28.7 2.0 100.0 11.2 21.0 37.7 30.1Bachelor’s degree plans 4.8 0.3 1.7 2.8 100.0 3.3 1.5 84.2 11.1
GenderMale 6.9 0.6 4.3 2.0 100.0 3.6 3.3 71.1 22.0Female 7.1 0.9 3.6 2.5 100.0 4.0 3.0 75.8 17.1
Age first year enrolled18 years or younger 6.1 0.6 3.1 2.4 100.0 3.5 2.6 79.6 14.319 years 8.1 0.5 4.6 3.0 100.0 4.5 3.5 77.0 14.920–23 years 7.0 1.2 4.9 0.9 100.0 2.7 4.2 51.4 41.624–29 years 10.4 2.5 7.8 0.1 100.0 5.9 4.5 39.3 50.330 or older 9.1 2.5 6.2 0.4 100.0 4.4 4.7 38.2 52.8
Race/ethnicityWhite 7.1 0.6 4.0 2.6 100.0 4.1 3.1 75.4 17.5Black 6.3 1.7 3.4 1.1 100.0 3.0 3.3 66.7 27.1Hispanic 6.0 0.8 3.8 1.4 100.0 3.6 2.4 69.8 24.2Asian/Pacific Islander 9.3 1.1 4.5 3.7 100.0 4.5 4.8 79.5 11.2American Indian 1.0 0.3 0.7 # 100.0 # 1.0 59.0 40.1Multiple races/other 6.2 0.7 3.8 1.7 100.0 2.6 3.6 68.6 25.2
See notes at end of table.
Persistence anywhere through 2006Highest degree
Attained degree anywhere through 2006
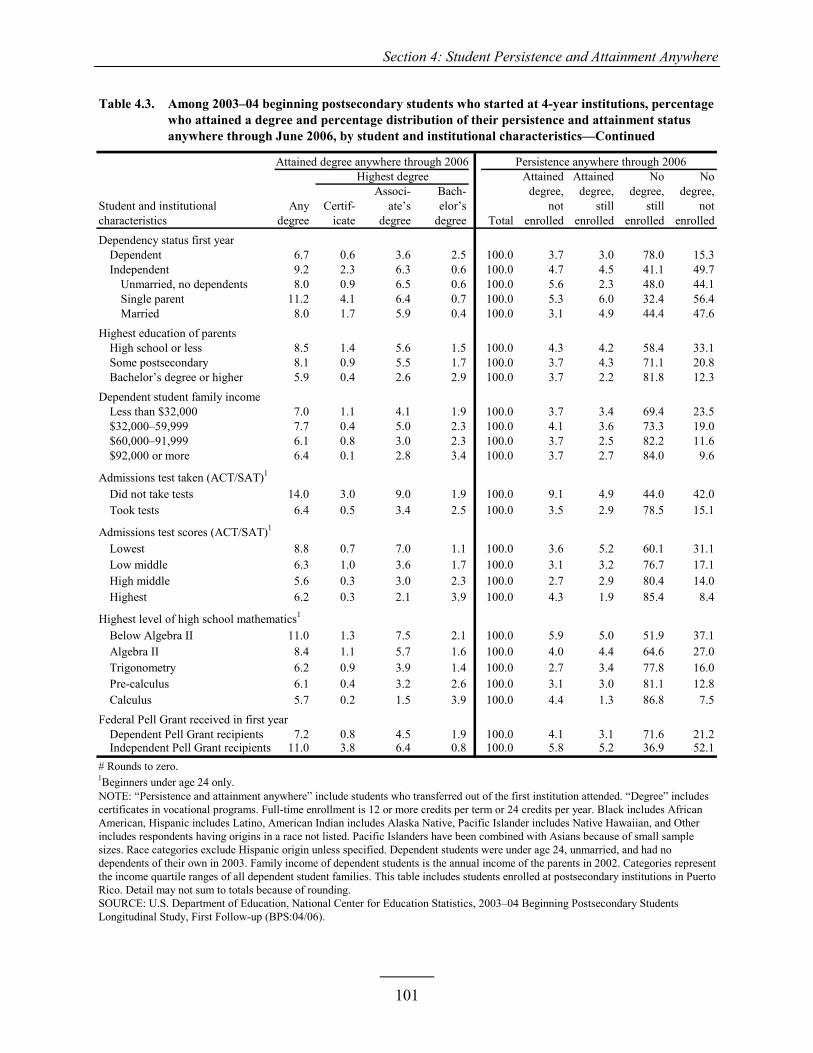
Section 4: Student Persistence and Attainment Anywhere
101
Table 4.3.—Among 2003–04 beginning postsecondary students who started at 4-year institutions, percentage Table 4.3.—who attained a degree and percentage distribution of their persistence and attainment status Table 4.3.—anywhere through June 2006, by student and institutional characteristics—Continued
Attained Attained No No Associ- Bach- degree, degree, degree, degree,Student and institutional Any Certif- ate’s elor’s not still still notcharacteristics degree icate degree degree Total enrolled enrolled enrolled enrolledDependency status first year
Dependent 6.7 0.6 3.6 2.5 100.0 3.7 3.0 78.0 15.3Independent 9.2 2.3 6.3 0.6 100.0 4.7 4.5 41.1 49.7
Unmarried, no dependents 8.0 0.9 6.5 0.6 100.0 5.6 2.3 48.0 44.1Single parent 11.2 4.1 6.4 0.7 100.0 5.3 6.0 32.4 56.4Married 8.0 1.7 5.9 0.4 100.0 3.1 4.9 44.4 47.6
Highest education of parentsHigh school or less 8.5 1.4 5.6 1.5 100.0 4.3 4.2 58.4 33.1Some postsecondary 8.1 0.9 5.5 1.7 100.0 3.7 4.3 71.1 20.8Bachelor’s degree or higher 5.9 0.4 2.6 2.9 100.0 3.7 2.2 81.8 12.3
Dependent student family income Less than $32,000 7.0 1.1 4.1 1.9 100.0 3.7 3.4 69.4 23.5$32,000–59,999 7.7 0.4 5.0 2.3 100.0 4.1 3.6 73.3 19.0$60,000–91,999 6.1 0.8 3.0 2.3 100.0 3.7 2.5 82.2 11.6$92,000 or more 6.4 0.1 2.8 3.4 100.0 3.7 2.7 84.0 9.6
Admissions test taken (ACT/SAT)1
Did not take tests 14.0 3.0 9.0 1.9 100.0 9.1 4.9 44.0 42.0Took tests 6.4 0.5 3.4 2.5 100.0 3.5 2.9 78.5 15.1
Admissions test scores (ACT/SAT)1
Lowest 8.8 0.7 7.0 1.1 100.0 3.6 5.2 60.1 31.1Low middle 6.3 1.0 3.6 1.7 100.0 3.1 3.2 76.7 17.1High middle 5.6 0.3 3.0 2.3 100.0 2.7 2.9 80.4 14.0Highest 6.2 0.3 2.1 3.9 100.0 4.3 1.9 85.4 8.4
Highest level of high school mathematics1
Below Algebra II 11.0 1.3 7.5 2.1 100.0 5.9 5.0 51.9 37.1Algebra II 8.4 1.1 5.7 1.6 100.0 4.0 4.4 64.6 27.0Trigonometry 6.2 0.9 3.9 1.4 100.0 2.7 3.4 77.8 16.0Pre-calculus 6.1 0.4 3.2 2.6 100.0 3.1 3.0 81.1 12.8Calculus 5.7 0.2 1.5 3.9 100.0 4.4 1.3 86.8 7.5
Federal Pell Grant received in first yearDependent Pell Grant recipients 7.2 0.8 4.5 1.9 100.0 4.1 3.1 71.6 21.2Independent Pell Grant recipients 11.0 3.8 6.4 0.8 100.0 5.8 5.2 36.9 52.1
# Rounds to zero.1Beginners under age 24 only.NOTE: “Persistence and attainment anywhere” include students who transferred out of the first institution attended. “Degree” includes certificates in vocational programs. Full-time enrollment is 12 or more credits per term or 24 credits per year. Black includes African American, Hispanic includes Latino, American Indian includes Alaska Native, Pacific Islander includes Native Hawaiian, and Other includes respondents having origins in a race not listed. Pacific Islanders have been combined with Asians because of small sample sizes. Race categories exclude Hispanic origin unless specified. Dependent students were under age 24, unmarried, and had no dependents of their own in 2003. Family income of dependent students is the annual income of the parents in 2002. Categories represent the income quartile ranges of all dependent student families. This table includes students enrolled at postsecondary institutions in Puerto Rico. Detail may not sum to totals because of rounding.SOURCE: U.S. Department of Education, National Center for Education Statistics, 2003–04 Beginning Postsecondary StudentsLongitudinal Study, First Follow-up (BPS:04/06).
Persistence anywhere through 2006Highest degree
Attained degree anywhere through 2006

THIS PAGE INTENTIONALLY LEFT BLANK
103
Section 5: Student Retention and Attainment at the First Institution Attended
The tables in this section show the percentages of 2003–04 beginning postsecondary students who attained a degree or certificate at the first institution attended or were still enrolled there in any part of the 2005–06 academic year. Since institutional retention is often based on the percentage of students who are still enrolled in the fall term, the tables in this section show the percentage of beginning students who were not enrolled at all in 2005–06, those enrolled only in the fall of 2005, and those still enrolled at the end of the spring term in June 2006 at the first institution attended.
The 3-year period covered in this report is too brief to determine whether students who had not attained a certificate or degree and were no longer enrolled in 2005–06 had permanently left the first institution attended. Some beginning students may “stop out” by leaving an institution for a semester or more, and then returning to that institution later. Students who have “stopped out” can only be identified as such after they have returned, which may be after the 3-year period of this study. When the term “left" is used below, it only refers to the enrollment status of the student at the end of the 3-year period in relation to the first institution attended, and includes some “stop-outs” who may return to that institution after 2006.
All Beginning Postsecondary Students
• Among all 2003–04 beginning postsecondary students, 14 percent had earned a degree by 2006 at the first institution they attended, 36 percent were still enrolled at that institution without a degree in June 2006, 5 percent were last enrolled there in the fall of 2005, 17 percent had transferred to a different institution, and 25 percent had not attained a degree and were not enrolled anywhere in 2005–06 (table 5.1).
• Forty-three percent of students seeking a certificate and 14 percent of students seeking an associate’s degree had earned one by 2006 at the institution they first attended.
Students Beginning at Public 2-Year Institutions
• Among students who began at a public 2-year institution, 4 percent had earned a certificate and 9 percent had earned an associate’s degree by 2006 at the first institution attended (table 5.2). Another 25 percent were still enrolled in that institution without a degree in June 2006, 7 percent were last enrolled there in the fall of 2005,

Section 5: Student Retention and Attainment at the First Institution Attended
104
and 20 percent had transferred elsewhere without completing a program. The remaining 35 percent had not completed a certificate or degree and were not enrolled anywhere in 2005–06.
• Among those who always attended full time, 20 percent had attained a degree or certificate, with 5 percent earning a certificate and 16 percent an associate’s degree at their first institution. Beginning students who mixed full- and part-time attendance or attended exclusively part time had lower attainment rates (13 and 6 percent, respectively).
• Among recent (2003) high school graduates who enrolled full time in fall 2003, some 38 percent had earned an award (23 percent a certificate and 15 percent an associate’s degree) from their first institution.
Students Beginning at 4-Year Institutions
• Among beginning postsecondary students at 4-year institutions, 6 percent had attained an award by 2006 at the first institution attended. Another 60 percent were still enrolled there without a degree in June 2006, 4 percent were last enrolled there in the fall of 2005, and 13 percent had not attained any award and were not enrolled anywhere in 2005–06 (table 5.3).
• By 2006, 18 percent of the beginners at 4-year institutions had transferred elsewhere before completing a degree.
• The bachelor’s degree attainment rate at the first institution after 3 years was 2 percent at both public and private not-for-profit institutions.
• There was no measurable difference in the transfer rates from public and private not-for-profit 4-year institutions (19 and 18 percent, respectively).
• At private for-profit 4-year institutions, 17 percent of the first time beginning students had attained a certificate or degree at their first institution by June 2006; for 15 percent, the degree earned was an associate’s degree.
• Students who always attended full time transferred from their first institution at a lower rate (16 percent) than those whose attendance intensity was mixed (28 percent), but at a higher rate than those who attended only part time (7 percent).
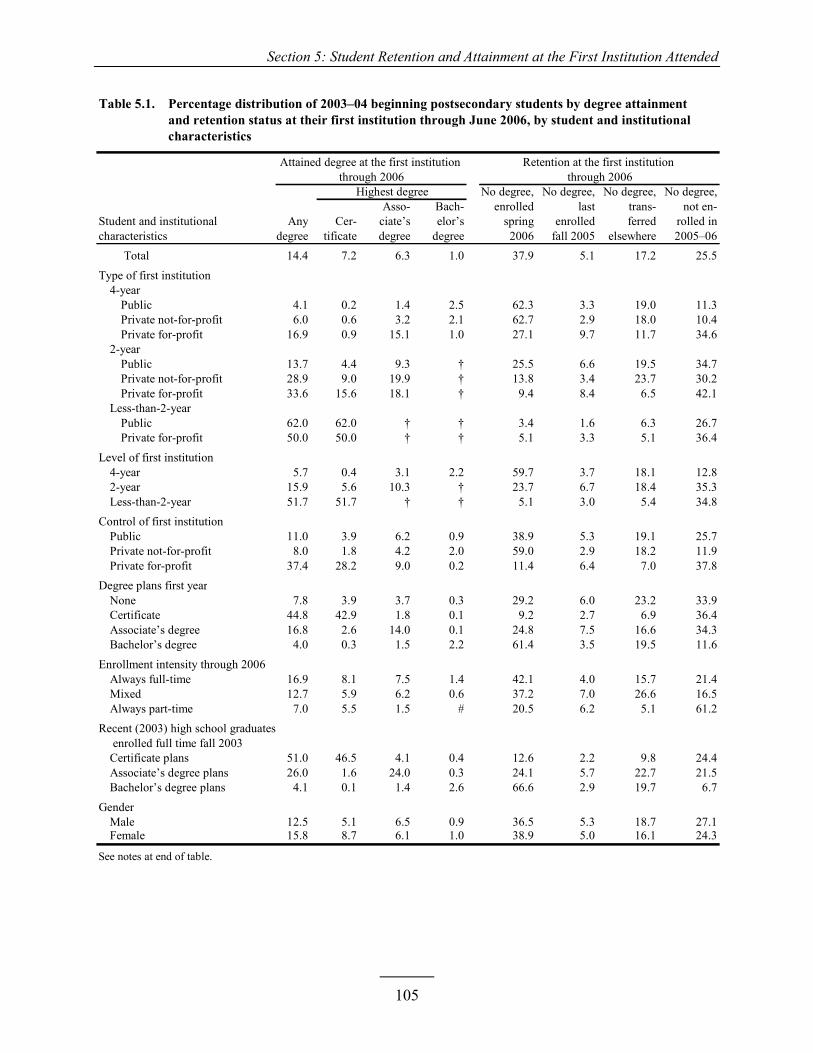
Section 5: Student Retention and Attainment at the First Institution Attended
105
Table 5.1.—Percentage distribution of 2003–04 beginning postsecondary students by degree attainment Table 5.1.—and retention status at their first institution through June 2006, by student and institutional Table 5.1.—characteristics
No degree, No degree, No degree, No degree,Asso- Bach- enrolled last trans- not en-
Student and institutional Any Cer- ciate’s elor’s spring enrolled ferred rolled incharacteristics degree tificate degree degree 2006 fall 2005 elsewhere 2005–06
Total 14.4 7.2 6.3 1.0 37.9 5.1 17.2 25.5
Type of first institution4-year
Public 4.1 0.2 1.4 2.5 62.3 3.3 19.0 11.3Private not-for-profit 6.0 0.6 3.2 2.1 62.7 2.9 18.0 10.4Private for-profit 16.9 0.9 15.1 1.0 27.1 9.7 11.7 34.6
2-yearPublic 13.7 4.4 9.3 † 25.5 6.6 19.5 34.7Private not-for-profit 28.9 9.0 19.9 † 13.8 3.4 23.7 30.2Private for-profit 33.6 15.6 18.1 † 9.4 8.4 6.5 42.1
Less-than-2-yearPublic 62.0 62.0 † † 3.4 1.6 6.3 26.7Private for-profit 50.0 50.0 † † 5.1 3.3 5.1 36.4
Level of first institution4-year 5.7 0.4 3.1 2.2 59.7 3.7 18.1 12.82-year 15.9 5.6 10.3 † 23.7 6.7 18.4 35.3Less-than-2-year 51.7 51.7 † † 5.1 3.0 5.4 34.8
Control of first institutionPublic 11.0 3.9 6.2 0.9 38.9 5.3 19.1 25.7Private not-for-profit 8.0 1.8 4.2 2.0 59.0 2.9 18.2 11.9Private for-profit 37.4 28.2 9.0 0.2 11.4 6.4 7.0 37.8
Degree plans first yearNone 7.8 3.9 3.7 0.3 29.2 6.0 23.2 33.9Certificate 44.8 42.9 1.8 0.1 9.2 2.7 6.9 36.4Associate’s degree 16.8 2.6 14.0 0.1 24.8 7.5 16.6 34.3Bachelor’s degree 4.0 0.3 1.5 2.2 61.4 3.5 19.5 11.6
Enrollment intensity through 2006Always full-time 16.9 8.1 7.5 1.4 42.1 4.0 15.7 21.4Mixed 12.7 5.9 6.2 0.6 37.2 7.0 26.6 16.5Always part-time 7.0 5.5 1.5 # 20.5 6.2 5.1 61.2
Recent (2003) high school graduates enrolled full time fall 2003Certificate plans 51.0 46.5 4.1 0.4 12.6 2.2 9.8 24.4Associate’s degree plans 26.0 1.6 24.0 0.3 24.1 5.7 22.7 21.5Bachelor’s degree plans 4.1 0.1 1.4 2.6 66.6 2.9 19.7 6.7
GenderMale 12.5 5.1 6.5 0.9 36.5 5.3 18.7 27.1Female 15.8 8.7 6.1 1.0 38.9 5.0 16.1 24.3
See notes at end of table.
Attained degree at the first institution Retention at the first institution
Highest degreethrough 2006 through 2006
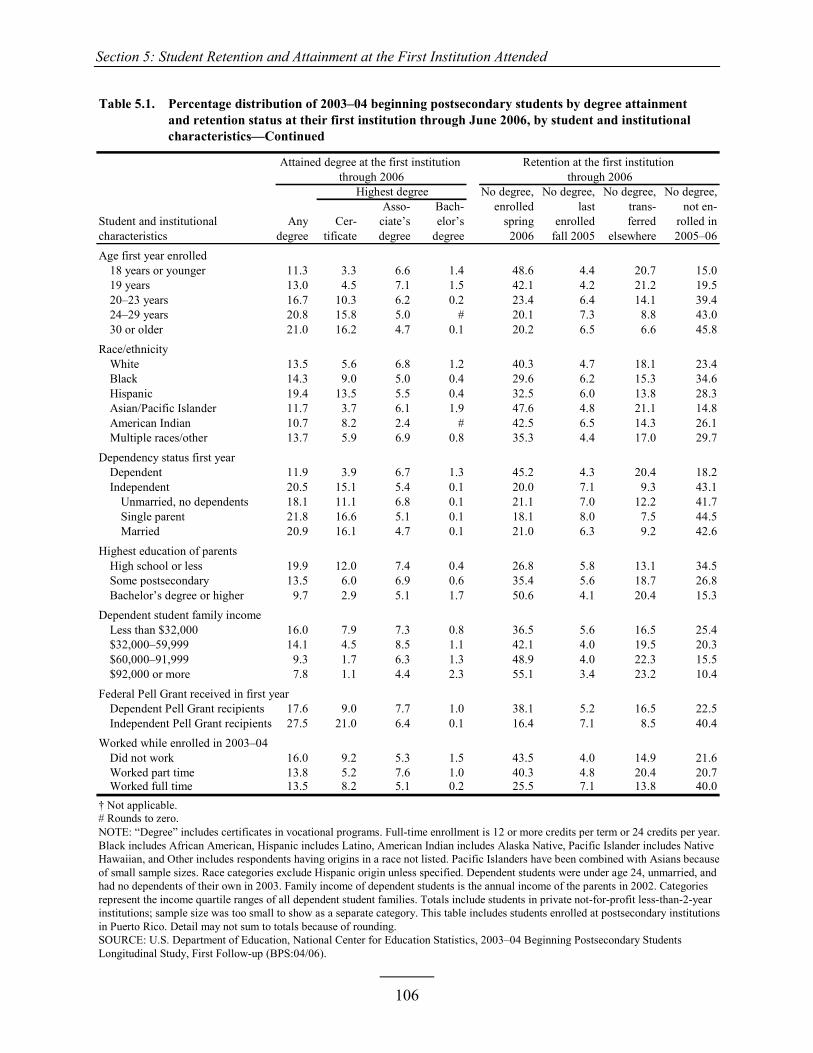
Section 5: Student Retention and Attainment at the First Institution Attended
106
Table 5.1.—Percentage distribution of 2003–04 beginning postsecondary students by degree attainment Table 5.1.—and retention status at their first institution through June 2006, by student and institutional Table 5.1.—characteristics—Continued
No degree, No degree, No degree, No degree,Asso- Bach- enrolled last trans- not en-
Student and institutional Any Cer- ciate’s elor’s spring enrolled ferred rolled incharacteristics degree tificate degree degree 2006 fall 2005 elsewhere 2005–06Age first year enrolled
18 years or younger 11.3 3.3 6.6 1.4 48.6 4.4 20.7 15.019 years 13.0 4.5 7.1 1.5 42.1 4.2 21.2 19.520–23 years 16.7 10.3 6.2 0.2 23.4 6.4 14.1 39.424–29 years 20.8 15.8 5.0 # 20.1 7.3 8.8 43.030 or older 21.0 16.2 4.7 0.1 20.2 6.5 6.6 45.8
Race/ethnicityWhite 13.5 5.6 6.8 1.2 40.3 4.7 18.1 23.4Black 14.3 9.0 5.0 0.4 29.6 6.2 15.3 34.6Hispanic 19.4 13.5 5.5 0.4 32.5 6.0 13.8 28.3Asian/Pacific Islander 11.7 3.7 6.1 1.9 47.6 4.8 21.1 14.8American Indian 10.7 8.2 2.4 # 42.5 6.5 14.3 26.1Multiple races/other 13.7 5.9 6.9 0.8 35.3 4.4 17.0 29.7
Dependency status first yearDependent 11.9 3.9 6.7 1.3 45.2 4.3 20.4 18.2Independent 20.5 15.1 5.4 0.1 20.0 7.1 9.3 43.1
Unmarried, no dependents 18.1 11.1 6.8 0.1 21.1 7.0 12.2 41.7Single parent 21.8 16.6 5.1 0.1 18.1 8.0 7.5 44.5Married 20.9 16.1 4.7 0.1 21.0 6.3 9.2 42.6
Highest education of parentsHigh school or less 19.9 12.0 7.4 0.4 26.8 5.8 13.1 34.5Some postsecondary 13.5 6.0 6.9 0.6 35.4 5.6 18.7 26.8Bachelor’s degree or higher 9.7 2.9 5.1 1.7 50.6 4.1 20.4 15.3
Dependent student family income Less than $32,000 16.0 7.9 7.3 0.8 36.5 5.6 16.5 25.4$32,000–59,999 14.1 4.5 8.5 1.1 42.1 4.0 19.5 20.3$60,000–91,999 9.3 1.7 6.3 1.3 48.9 4.0 22.3 15.5$92,000 or more 7.8 1.1 4.4 2.3 55.1 3.4 23.2 10.4
Federal Pell Grant received in first yearDependent Pell Grant recipients 17.6 9.0 7.7 1.0 38.1 5.2 16.5 22.5Independent Pell Grant recipients 27.5 21.0 6.4 0.1 16.4 7.1 8.5 40.4
Worked while enrolled in 2003–04Did not work 16.0 9.2 5.3 1.5 43.5 4.0 14.9 21.6Worked part time 13.8 5.2 7.6 1.0 40.3 4.8 20.4 20.7Worked full time 13.5 8.2 5.1 0.2 25.5 7.1 13.8 40.0
† Not applicable.# Rounds to zero.NOTE: “Degree” includes certificates in vocational programs. Full-time enrollment is 12 or more credits per term or 24 credits per year.Black includes African American, Hispanic includes Latino, American Indian includes Alaska Native, Pacific Islander includes Native Hawaiian, and Other includes respondents having origins in a race not listed. Pacific Islanders have been combined with Asians because of small sample sizes. Race categories exclude Hispanic origin unless specified. Dependent students were under age 24, unmarried, and had no dependents of their own in 2003. Family income of dependent students is the annual income of the parents in 2002. Categories represent the income quartile ranges of all dependent student families. Totals include students in private not-for-profit less-than-2-year institutions; sample size was too small to show as a separate category. This table includes students enrolled at postsecondary institutions in Puerto Rico. Detail may not sum to totals because of rounding. SOURCE: U.S. Department of Education, National Center for Education Statistics, 2003–04 Beginning Postsecondary StudentsLongitudinal Study, First Follow-up (BPS:04/06).
through 2006 through 2006Highest degree
Attained degree at the first institution Retention at the first institution

Section 5: Student Retention and Attainment at the First Institution Attended
107
Table 5.2.—Among 2003–04 beginning postsecondary students who started at public 2-year institutions, Table 5.2.—percentage distribution by attainment and retention status at their first institution through Table 5.2.—June 2006, by student and institutional characteristics
No degree, No degree, No degree, No degree,enrolled last trans- not en-
Student and institutional Any Cer- Associate’s spring enrolled ferred rolled incharacteristics degree tificate degree 2006 fall 2005 elsewhere 2005–06
Total 13.7 4.4 9.3 25.5 6.6 19.5 34.7Degree plans first year
None 8.3 4.1 4.3 23.9 6.5 23.7 37.5Certificate 29.4 24.2 5.2 15.8 3.9 10.0 40.9Associate’s degree 14.3 2.5 11.8 26.5 7.0 17.6 34.6Bachelor’s degree 7.0 1.4 5.6 29.7 6.6 31.5 25.2
Type of associate’s degreeApplied fields 16.4 4.4 12.0 22.5 6.9 15.7 38.5General education/transfer 12.7 1.8 11.0 28.0 7.2 19.5 32.6
Transfer and degree plansDegree, no transfer 17.9 9.5 8.4 24.1 7.3 11.2 39.6Degree and transfer 15.9 1.9 14.0 29.7 7.1 17.6 29.8No degree, transfer 11.5 1.2 10.3 27.2 6.5 27.7 27.1No degree and no transfer 10.2 6.4 3.8 20.2 5.7 19.1 44.7
Enrollment intensity through 2006Always full-time 20.5 4.6 15.9 20.3 5.2 22.4 31.5Mixed 13.0 4.7 8.4 33.9 8.5 27.3 17.3Always part-time 5.5 3.8 1.8 20.7 5.9 4.8 63.1
Recent (2003) high school graduates enrolled full time fall 2003Certificate plans 38.0 23.4 14.7 13.7 4.2 14.7 29.4Associate’s degree plans 24.5 1.4 23.1 24.8 5.7 24.3 20.6Bachelor’s degree plans 9.8 0.4 9.4 29.9 6.7 38.7 14.9
GenderMale 12.9 4.0 8.9 23.1 6.7 20.6 36.7Female 14.4 4.8 9.6 27.3 6.6 18.7 33.1
Age first year enrolled18 years or younger 15.8 2.2 13.7 27.8 6.8 25.8 23.719 years 14.2 2.5 11.6 25.4 5.7 25.7 28.920–23 years 9.0 3.9 5.2 25.1 7.0 15.6 43.224–29 years 11.4 6.8 4.6 23.7 7.9 13.2 43.830 or older 14.4 10.1 4.3 22.5 6.5 7.1 49.6
Race/ethnicityWhite 15.7 5.1 10.7 23.7 5.8 20.6 34.3Black 10.0 4.6 5.4 24.5 9.1 16.0 40.4Hispanic 10.3 3.2 7.1 31.9 7.6 14.9 35.4Asian/Pacific Islander 10.2 1.6 8.6 28.3 8.0 31.6 22.0American Indian 7.0 3.0 4.0 47.7 2.8 20.9 21.6Multiple races/other 14.2 2.7 11.5 24.4 7.0 19.5 34.9
See notes at end of table.
Highest degree
Attained degree at the first Retention at the first institutioninstitution through 2006 through 2006

Section 5: Student Retention and Attainment at the First Institution Attended
108
Table 5.2.—Among 2003–04 beginning postsecondary students who started at public 2-year institutions, Table 5.2.—percentage distribution by attainment and retention status at their first institution through Table 5.2.—June 2006, by student and institutional characteristics—Continued
No degree, No degree, No degree, No degree,enrolled last trans- not en-
Student and institutional Any Cer- Associate’s spring enrolled ferred rolled incharacteristics degree tificate degree 2006 fall 2005 elsewhere 2005–06
Dependency status first yearDependent 14.6 2.5 12.1 27.0 6.2 24.4 27.7Independent 12.1 7.7 4.4 22.9 7.3 11.1 46.6
Unmarried, no dependents 12.0 6.7 5.2 20.1 8.9 15.4 43.6Single parent 9.3 5.3 4.1 24.5 8.5 8.4 49.3Married 14.0 9.8 4.3 23.2 5.8 10.6 46.5
Highest education of parentsHigh school or less 14.7 6.2 8.5 24.8 6.7 14.4 39.3Some postsecondary 13.4 4.0 9.4 25.3 7.1 20.0 34.2Bachelor’s degree or higher 13.1 2.3 10.8 26.6 6.1 26.5 27.7
Dependent student family income Less than $32,000 14.4 2.8 11.6 28.9 6.8 18.6 31.4$32,000–59,999 17.2 3.0 14.2 26.5 6.2 23.2 26.9$60,000–91,999 14.2 2.2 12.0 26.1 6.4 26.2 27.0$92,000 or more 11.8 1.9 9.9 25.9 5.4 33.0 23.9
Admissions test taken (ACT/SAT)1
Did not take tests 10.0 3.1 6.9 29.0 6.7 17.3 37.0Took tests 15.6 2.4 13.2 25.3 6.5 26.4 26.2
Admissions test scores (ACT/SAT)1
Lowest 13.4 3.2 10.2 26.9 8.0 22.6 29.1Low middle 16.2 2.3 13.9 22.0 6.5 27.9 27.3High middle 20.4 1.5 18.9 24.5 3.5 29.2 22.4Highest 13.9 1.5 12.4 31.5 5.0 32.8 16.8
Highest level of high school mathematics1
Below Algebra II 10.2 3.5 6.6 30.2 7.0 17.0 35.7Algebra II 12.4 2.8 9.5 25.8 6.3 23.6 31.9Trigonometry 18.9 1.9 17.0 26.8 5.2 24.1 25.0Pre-calculus 17.3 2.1 15.2 22.0 6.7 30.6 23.4Calculus 17.0 1.4 15.6 25.1 9.3 31.8 16.9
Federal Pell Grant received in first yearDependent Pell Grant recipients 17.6 2.9 14.7 24.2 8.2 19.9 30.1Independent Pell Grant recipients 16.3 9.3 7.0 23.2 7.9 11.7 40.9
1Beginners under age 24 only.NOTE: “Degree” includes certificates in vocational programs. Full-time enrollment is 12 or more credits per term or 24 credits per year.Black includes African American, Hispanic includes Latino, American Indian includes Alaska Native, Pacific Islander includes Native Hawaiian, and Other includes respondents having origins in a race not listed. Pacific Islanders have been combined with Asians becauseof small sample sizes. Race categories exclude Hispanic origin unless specified. Dependent students were under age 24, unmarried, and had no dependents of their own in 2003. Family income of dependent students is the annual income of the parents in 2002. Categories represent the income quartile ranges of all dependent student families. This table includes students enrolled at postsecondary institutionsin Puerto Rico. Detail may not sum to totals because of rounding.SOURCE: U.S. Department of Education, National Center for Education Statistics, 2003–04 Beginning Postsecondary StudentsLongitudinal Study, First Follow-up (BPS:04/06).
institution through 2006 through 2006Highest degree
Attained degree at the first Retention at the first institution

Section 5: Student Retention and Attainment at the First Institution Attended
109
Table 5.3.—Among 2003–04 beginning postsecondary students who started at 4-year institutions, percentage Table 5.3.—distribution by attainment and retention status at their first institution through June 2006, by Table 5.3.—student and institutional characteristics
No degree, No degree, No degree, No degree,Asso- Bach- enrolled last trans- not en-
Student and institutional Any Cer- ciate’s elor’s spring enrolled ferred rolled incharacteristics degree tificate degree degree 2006 fall 2005 elsewhere 2005–06
Total 5.7 0.4 3.1 2.2 59.7 3.7 18.1 12.8Control of first institution
Public 4-year 4.1 0.2 1.4 2.5 62.3 3.3 19.0 11.3Private not-for-profit 4-year 6.0 0.6 3.2 2.1 62.7 2.9 18.0 10.4Private for-profit 4-year 16.9 0.9 15.1 1.0 27.1 9.7 11.7 34.6
Doctorate-granting status of first institutionDoctorate-granting 4.6 0.3 1.5 2.8 67.9 3.0 16.9 7.7Non-doctorate-granting 4-year 6.8 0.5 4.6 1.7 51.6 4.4 19.3 18.0
Degree plans first yearNone 4.1 0.6 2.4 1.1 49.3 4.5 23.6 18.6Certificate 11.1 9.1 0.4 1.6 37.4 2.7 19.1 29.7Associate’s degree 21.1 0.9 19.1 1.1 25.4 7.6 16.2 29.8Bachelor’s degree 3.5 0.1 0.9 2.5 65.9 3.1 18.0 9.6
Enrollment intensity through 2006Always full-time 6.0 0.3 3.3 2.4 63.6 3.3 15.9 11.2Mixed 5.2 0.8 2.5 1.9 49.8 4.6 28.0 12.5Always part-time 0.2 0.2 # # 26.8 7.9 7.5 57.7
Recent (2003) high school graduates enrolled full time fall 2003Certificate plans 6.4 3.1 0.8 2.5 52.5 1.1 26.7 13.4Associate’s degree plans 28.4 0.7 26.0 1.6 25.7 4.8 20.5 20.6Bachelor’s degree plans 3.7 # 0.9 2.8 69.1 2.7 18.4 6.1
GenderMale 5.5 0.3 3.2 2.0 56.3 4.0 19.4 14.8Female 5.9 0.4 3.0 2.5 62.4 3.4 17.1 11.3
Age first year enrolled18 years or younger 4.9 0.3 2.3 2.4 64.8 3.1 18.9 8.319 years 6.4 0.2 3.4 2.9 61.6 2.9 19.7 9.320–23 years 5.9 0.4 4.6 0.9 38.6 6.1 17.3 32.224–29 years 10.0 2.5 7.4 0.1 33.7 8.1 5.7 42.430 or older 7.2 1.1 5.8 0.4 34.0 8.6 9.3 40.8
Race/ethnicityWhite 5.8 0.4 3.0 2.5 61.6 3.3 18.2 11.1Black 4.7 0.7 3.0 1.0 51.4 4.7 18.7 20.5Hispanic 4.7 0.4 2.9 1.4 54.6 5.8 19.7 15.1Asian/Pacific Islander 8.0 0.3 4.1 3.6 66.9 2.7 14.7 7.7American Indian 0.7 # 0.7 # 53.0 8.3 11.6 26.3Multiple races/other 5.1 0.1 3.3 1.7 53.8 2.4 17.2 21.5
See notes at end of table.
Highest degree
Attained degree at the first Retention at the first institution institution through 2006 through 2006

Section 5: Student Retention and Attainment at the First Institution Attended
110
Table 5.3.—Among 2003–04 beginning postsecondary students who started at 4-year institutions, percentage Table 5.3.—distribution by attainment and retention status at their first institution through June 2006, by Table 5.3.—student and institutional characteristics—Continued
No degree, No degree, No degree, No degree,Asso- Bach- enrolled last trans- not en-
Student and institutional Any Cer- ciate’s elor’s spring enrolled ferred rolled incharacteristics degree tificate degree degree 2006 fall 2005 elsewhere 2005–06Dependency status first year
Dependent 5.4 0.2 2.7 2.5 63.0 3.0 19.1 9.5Independent 8.2 1.7 6.0 0.5 34.2 8.5 10.7 38.4
Unmarried, no dependents 7.7 0.9 6.3 0.6 38.3 5.8 11.0 37.2Single parent 9.8 2.9 6.4 0.5 26.8 10.9 10.9 41.6Married 6.9 1.2 5.3 0.4 38.5 8.4 10.1 36.1
Highest education of parentsHigh school or less 7.2 0.7 5.0 1.5 47.0 5.1 16.5 24.2Some postsecondary 5.9 0.6 3.6 1.7 56.1 3.9 20.7 13.5Bachelor’s degree or higher 5.0 0.2 2.0 2.8 66.9 2.8 18.0 7.3
Dependent student family income Less than $32,000 5.6 0.4 3.5 1.8 55.1 5.5 18.3 15.5$32,000–59,999 6.2 0.2 3.7 2.3 60.4 2.2 18.1 13.1$60,000–91,999 4.6 0.3 2.1 2.2 66.6 2.2 20.0 6.6$92,000 or more 5.3 0.1 1.9 3.3 68.1 2.6 19.1 4.9
Admissions test taken (ACT/SAT)1
Did not take tests 12.4 1.7 8.7 1.9 31.4 5.9 17.8 32.5Took tests 5.1 0.2 2.5 2.4 63.5 3.1 19.1 9.2
Admissions test scores (ACT/SAT)1
Lowest 6.7 0.3 5.3 1.0 42.9 6.1 22.8 21.5Low middle 4.8 0.5 2.8 1.5 59.1 3.1 22.8 10.2High middle 4.3 # 2.1 2.2 64.6 2.9 20.0 8.3Highest 5.3 0.1 1.4 3.8 73.8 2.1 14.3 4.5
Highest level of high school mathematics1
Below Algebra II 8.2 0.5 5.6 2.1 37.1 6.0 24.0 24.6Algebra II 6.9 0.5 4.9 1.5 47.7 3.8 23.4 18.4Trigonometry 5.0 0.6 3.0 1.4 60.6 3.5 21.0 9.9Pre-calculus 4.5 0.0 2.0 2.4 65.4 2.9 19.6 7.6Calculus 5.0 0.1 1.0 3.8 76.0 2.5 12.6 4.0
Federal Pell Grant received in first yearDependent Pell Grant recipients 5.7 0.2 3.7 1.9 58.0 4.3 18.1 13.8Independent Pell Grant recipients 9.6 2.7 6.2 0.7 31.0 9.5 10.0 39.9
# Rounds to zero.1Beginners under age 24 only.NOTE: “Degree” includes certificates in vocational programs. Full-time enrollment is 12 or more credits per term or 24 credits per year.Black includes African American, Hispanic includes Latino, American Indian includes Alaska Native, Pacific Islander includes Native Hawaiian, and Other includes respondents having origins in a race not listed. Pacific Islanders have been combined with Asians becauseof small sample sizes. Race categories exclude Hispanic origin unless specified. Dependent students were under age 24, unmarried, and had no dependents of their own in 2003. Family income of dependent students is the annual income of the parents in 2002. Categories represent the income quartile ranges of all dependent student families. This table includes students enrolled at postsecondary institutionsin Puerto Rico. Detail may not sum to totals because of rounding.SOURCE: U.S. Department of Education, National Center for Education Statistics, 2003–04 Beginning Postsecondary StudentsLongitudinal Study, First Follow-up (BPS:04/06).
Retention at the first institution institution through 2006 through 2006
Highest degree
Attained degree at the first

111
Section 6: Student Attainment and Dates of Last Enrollment
This section examines when students who had not attained a certificate or degree were last enrolled in postsecondary education, considering all students first, and then those starting at public 2-year institutions and at any type of 4-year institutions separately.
The 3-year period covered in this report is too brief to determine whether students who had not attained a certificate or degree and were no longer enrolled anywhere in June 2006 had permanently left postsecondary education. Some beginning students may “stop out” by leaving an institution for a semester or more, and then returning to that or a different institution later. Students who have “stopped out” can only be identified as such after they have returned, which may be after the 3-year period of this study. When the term “left” is used in this section, it means that the student had not completed a certificate or degree and was no longer enrolled after the end of 1 of the 3 years covered in this study; this includes some “stop-outs” who cannot be identified until they return later.
All Beginning Postsecondary Students
• Among all 2003–04 beginning postsecondary students, 16 percent had attained a certificate or degree by 2006 (table 6.1). Among those who had not attained, 14 percent were last enrolled during or at the end of their first year (2003–04), and another 13 percent were last enrolled in their second year (2004–05). Six percent were last enrolled in fall 2005, and the rest (51 percent) remained enrolled in spring 2006.
• Men left at a higher rate in their first year than women (16 vs. 13 percent).
• Up to age 24, there was no measurable difference in the percentages last enrolled in 2003–04 and 2004–05. However, students who were 30 years or older when they began their postsecondary education left at a higher rate in the first year than in the second, with 28 percent last enrolled in 2003–04 and 19 percent last enrolled in 2004–05.
Students Beginning at Public 2-Year Institutions
• Among 2003–04 beginning postsecondary students who started at a public 2-year institution, 23 percent left without completion during or at the end of their first year (table 6.2). Fewer (14 percent) left during or after their second year (2004–05), and even fewer during or after fall 2005 (8 percent).

Section 6: Student Attainment and Dates of Last Enrollment
112
• Among students who were always enrolled part time, 51 percent left without completion during or at the end of their first year, compared with 19 percent of those who always attended full time and 6 percent of those with a mixed attendance intensity.
• Thirty-one percent of students who were 24–29 years old and 36 percent of those 30 years or older when they started their postsecondary education did not complete a program and were no longer enrolled after their first year. In contrast, 15 percent of those 18 years or younger left without completion after their first year.
Students Beginning at 4-Year Institutions
• Because of the length of bachelor’s degree programs, the majority of 2003–04 beginning postsecondary students who started at a 4-year institution (74 percent) were still enrolled in spring 2006, including 77 percent each at public and private not-for-profit institutions (table 6.3). A smaller proportion (35 percent) were still enrolled among those who started at private for-profit 4-year institutions.
• There was no measurable difference between public and private not-for-profit institutions in the percentages of students who left without completion during or at the end of their first or second year: about 6 percent at each type of institution in each year.
• Forty-seven percent of students who always attended part time were no longer enrolled after their first year, in contrast to 6 percent of those who always attended full time.
• Students who began when they were 20 years or older left without completion after their first year at a higher rate than those 18 years or younger or 19 years (16 to 19 percent vs. 4 and 5 percent).
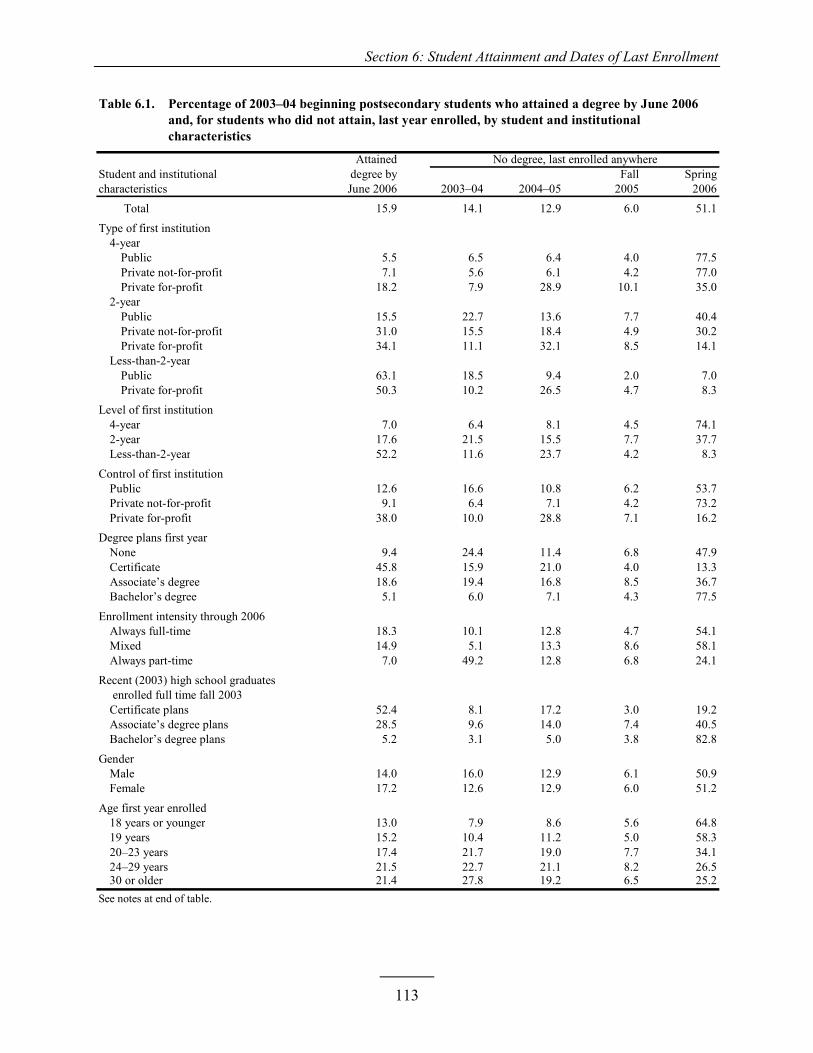
Section 6: Student Attainment and Dates of Last Enrollment
113
Table 6.1.—Percentage of 2003–04 beginning postsecondary students who attained a degree by June 2006 Table 6.1.—and, for students who did not attain, last year enrolled, by student and institutional Table 6.1.—characteristics
AttainedStudent and institutional degree by Fall Springcharacteristics June 2006 2003–04 2004–05 2005 2006
Total 15.9 14.1 12.9 6.0 51.1
Type of first institution4-year
Public 5.5 6.5 6.4 4.0 77.5Private not-for-profit 7.1 5.6 6.1 4.2 77.0Private for-profit 18.2 7.9 28.9 10.1 35.0
2-yearPublic 15.5 22.7 13.6 7.7 40.4Private not-for-profit 31.0 15.5 18.4 4.9 30.2Private for-profit 34.1 11.1 32.1 8.5 14.1
Less-than-2-yearPublic 63.1 18.5 9.4 2.0 7.0Private for-profit 50.3 10.2 26.5 4.7 8.3
Level of first institution4-year 7.0 6.4 8.1 4.5 74.12-year 17.6 21.5 15.5 7.7 37.7Less-than-2-year 52.2 11.6 23.7 4.2 8.3
Control of first institutionPublic 12.6 16.6 10.8 6.2 53.7Private not-for-profit 9.1 6.4 7.1 4.2 73.2Private for-profit 38.0 10.0 28.8 7.1 16.2
Degree plans first yearNone 9.4 24.4 11.4 6.8 47.9Certificate 45.8 15.9 21.0 4.0 13.3Associate’s degree 18.6 19.4 16.8 8.5 36.7Bachelor’s degree 5.1 6.0 7.1 4.3 77.5
Enrollment intensity through 2006Always full-time 18.3 10.1 12.8 4.7 54.1Mixed 14.9 5.1 13.3 8.6 58.1Always part-time 7.0 49.2 12.8 6.8 24.1
Recent (2003) high school graduates enrolled full time fall 2003Certificate plans 52.4 8.1 17.2 3.0 19.2Associate’s degree plans 28.5 9.6 14.0 7.4 40.5Bachelor’s degree plans 5.2 3.1 5.0 3.8 82.8
GenderMale 14.0 16.0 12.9 6.1 50.9Female 17.2 12.6 12.9 6.0 51.2
Age first year enrolled18 years or younger 13.0 7.9 8.6 5.6 64.819 years 15.2 10.4 11.2 5.0 58.320–23 years 17.4 21.7 19.0 7.7 34.124–29 years 21.5 22.7 21.1 8.2 26.530 or older 21.4 27.8 19.2 6.5 25.2
See notes at end of table.
No degree, last enrolled anywhere
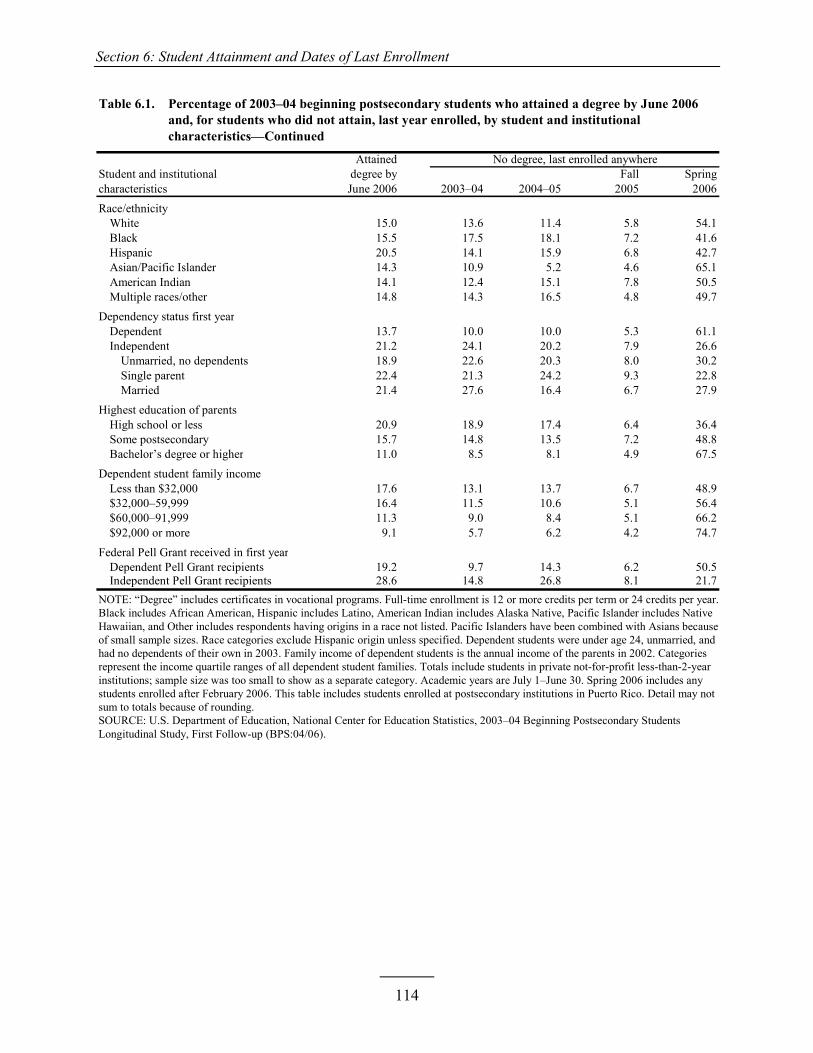
Section 6: Student Attainment and Dates of Last Enrollment
114
Table 6.1.—Percentage of 2003–04 beginning postsecondary students who attained a degree by June 2006 Table 6.1.—and, for students who did not attain, last year enrolled, by student and institutional Table 6.1.—characteristics—Continued
AttainedStudent and institutional degree by Fall Springcharacteristics June 2006 2003–04 2004–05 2005 2006Race/ethnicity
White 15.0 13.6 11.4 5.8 54.1Black 15.5 17.5 18.1 7.2 41.6Hispanic 20.5 14.1 15.9 6.8 42.7Asian/Pacific Islander 14.3 10.9 5.2 4.6 65.1American Indian 14.1 12.4 15.1 7.8 50.5Multiple races/other 14.8 14.3 16.5 4.8 49.7
Dependency status first yearDependent 13.7 10.0 10.0 5.3 61.1Independent 21.2 24.1 20.2 7.9 26.6
Unmarried, no dependents 18.9 22.6 20.3 8.0 30.2Single parent 22.4 21.3 24.2 9.3 22.8Married 21.4 27.6 16.4 6.7 27.9
Highest education of parentsHigh school or less 20.9 18.9 17.4 6.4 36.4Some postsecondary 15.7 14.8 13.5 7.2 48.8Bachelor’s degree or higher 11.0 8.5 8.1 4.9 67.5
Dependent student family income Less than $32,000 17.6 13.1 13.7 6.7 48.9$32,000–59,999 16.4 11.5 10.6 5.1 56.4$60,000–91,999 11.3 9.0 8.4 5.1 66.2$92,000 or more 9.1 5.7 6.2 4.2 74.7
Federal Pell Grant received in first yearDependent Pell Grant recipients 19.2 9.7 14.3 6.2 50.5Independent Pell Grant recipients 28.6 14.8 26.8 8.1 21.7
NOTE: “Degree” includes certificates in vocational programs. Full-time enrollment is 12 or more credits per term or 24 credits per year. Black includes African American, Hispanic includes Latino, American Indian includes Alaska Native, Pacific Islander includes Native Hawaiian, and Other includes respondents having origins in a race not listed. Pacific Islanders have been combined with Asians because of small sample sizes. Race categories exclude Hispanic origin unless specified. Dependent students were under age 24, unmarried, and had no dependents of their own in 2003. Family income of dependent students is the annual income of the parents in 2002. Categories represent the income quartile ranges of all dependent student families. Totals include students in private not-for-profit less-than-2-year institutions; sample size was too small to show as a separate category. Academic years are July 1–June 30. Spring 2006 includes any students enrolled after February 2006. This table includes students enrolled at postsecondary institutions in Puerto Rico. Detail may not sum to totals because of rounding. SOURCE: U.S. Department of Education, National Center for Education Statistics, 2003–04 Beginning Postsecondary StudentsLongitudinal Study, First Follow-up (BPS:04/06).
No degree, last enrolled anywhere

Section 6: Student Attainment and Dates of Last Enrollment
115
Table 6.2.—Among 2003–04 beginning postsecondary students who started at public 2-year institutions, Table 6.2.—percentage who attained a degree by June 2006 and, for students who did not attain, last year Table 6.2.—enrolled, by student and institutional characteristics
AttainedStudent and institutional degree by Fall Springcharacteristics June 2006 2003–04 2004–05 2005 2006
Total 15.5 22.7 13.6 7.7 40.4Degree plans first year
None 10.0 28.0 11.0 7.2 43.7Certificate 31.8 26.9 14.9 4.9 21.5Associate’s degree 16.1 21.9 14.5 8.1 39.5Bachelor’s degree 8.5 15.8 12.0 8.5 55.2
Type of associate’s degreeApplied fields 17.6 26.0 13.7 8.3 34.3General education/transfer 14.6 20.1 14.6 8.1 42.6
Transfer and degree plansDegree, no transfer 19.4 27.2 13.6 8.3 31.5Degree and transfer 17.5 16.8 13.8 8.6 43.3No degree, transfer 13.2 16.1 12.9 7.6 50.2No degree and no transfer 12.8 33.2 14.3 6.4 33.3
Enrollment intensity through 2006Always full-time 22.8 19.1 14.7 6.7 36.7Mixed 15.7 6.2 12.9 9.5 55.6Always part-time 5.6 50.7 13.1 6.6 24.1
Recent (2003) high school graduates enrolled full time fall 2003Certificate plans 40.5 15.7 16.2 4.8 22.7Associate’s degree plans 26.8 9.9 12.5 7.5 43.4Bachelor’s degree plans 11.6 7.1 10.4 9.1 61.7
GenderMale 14.5 25.4 13.3 7.5 39.2Female 16.3 20.6 13.9 7.9 41.3
Age first year enrolled18 years or younger 18.6 14.8 10.6 8.1 47.919 years 17.2 17.4 13.9 6.9 44.620–23 years 9.9 27.0 17.5 8.8 36.824–29 years 12.5 30.6 15.9 8.5 32.530 or older 14.5 36.0 14.5 6.6 28.5
Race/ethnicityWhite 17.6 22.8 13.2 7.2 39.3Black 11.1 24.8 17.2 9.7 37.2Hispanic 11.6 22.2 15.1 8.8 42.3Asian/Pacific Islander 14.6 18.1 6.2 7.2 53.9American Indian 14.0 13.5 8.2 4.7 59.6Multiple races/other 15.7 24.0 12.4 6.6 41.3
See notes at end of table.
No degree, last enrolled anywhere
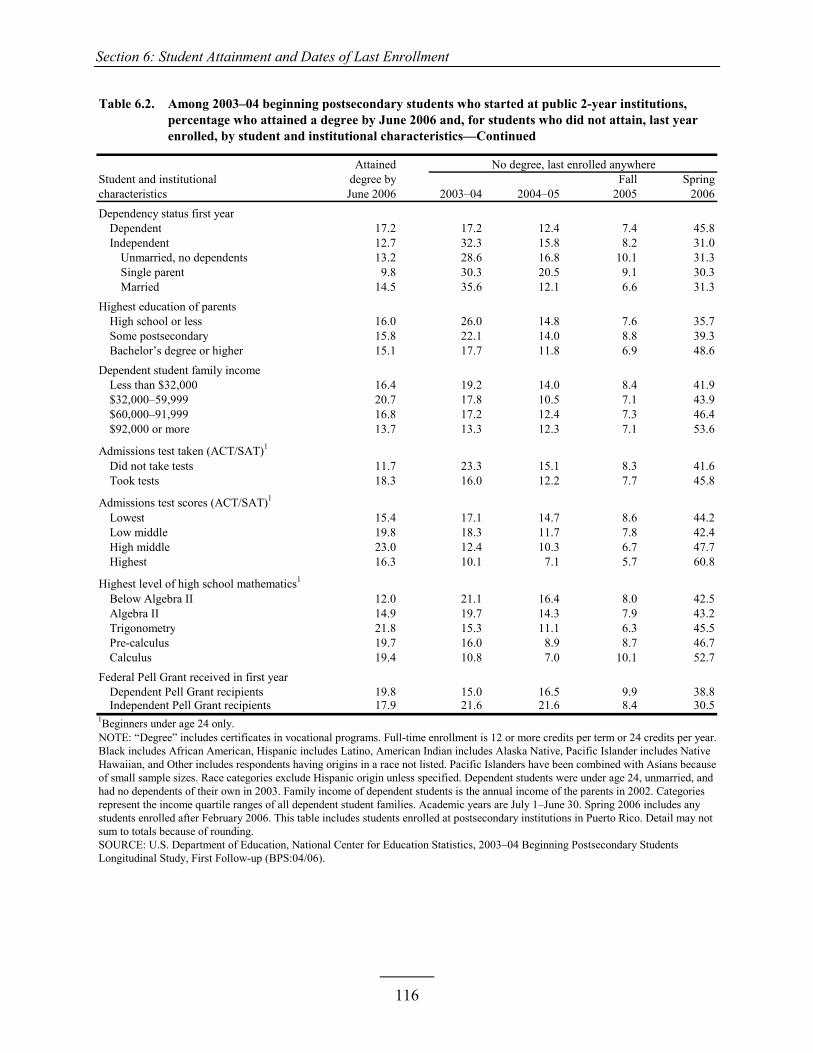
Section 6: Student Attainment and Dates of Last Enrollment
116
Table 6.2.—Among 2003–04 beginning postsecondary students who started at public 2-year institutions, Table 6.2.—percentage who attained a degree by June 2006 and, for students who did not attain, last year Table 6.2.—enrolled, by student and institutional characteristics—Continued
AttainedStudent and institutional degree by Fall Springcharacteristics June 2006 2003–04 2004–05 2005 2006Dependency status first year
Dependent 17.2 17.2 12.4 7.4 45.8Independent 12.7 32.3 15.8 8.2 31.0
Unmarried, no dependents 13.2 28.6 16.8 10.1 31.3Single parent 9.8 30.3 20.5 9.1 30.3Married 14.5 35.6 12.1 6.6 31.3
Highest education of parentsHigh school or less 16.0 26.0 14.8 7.6 35.7Some postsecondary 15.8 22.1 14.0 8.8 39.3Bachelor’s degree or higher 15.1 17.7 11.8 6.9 48.6
Dependent student family income Less than $32,000 16.4 19.2 14.0 8.4 41.9$32,000–59,999 20.7 17.8 10.5 7.1 43.9$60,000–91,999 16.8 17.2 12.4 7.3 46.4$92,000 or more 13.7 13.3 12.3 7.1 53.6
Admissions test taken (ACT/SAT)1
Did not take tests 11.7 23.3 15.1 8.3 41.6Took tests 18.3 16.0 12.2 7.7 45.8
Admissions test scores (ACT/SAT)1
Lowest 15.4 17.1 14.7 8.6 44.2Low middle 19.8 18.3 11.7 7.8 42.4High middle 23.0 12.4 10.3 6.7 47.7Highest 16.3 10.1 7.1 5.7 60.8
Highest level of high school mathematics1
Below Algebra II 12.0 21.1 16.4 8.0 42.5Algebra II 14.9 19.7 14.3 7.9 43.2Trigonometry 21.8 15.3 11.1 6.3 45.5Pre-calculus 19.7 16.0 8.9 8.7 46.7Calculus 19.4 10.8 7.0 10.1 52.7
Federal Pell Grant received in first yearDependent Pell Grant recipients 19.8 15.0 16.5 9.9 38.8Independent Pell Grant recipients 17.9 21.6 21.6 8.4 30.5
1Beginners under age 24 only.NOTE: “Degree” includes certificates in vocational programs. Full-time enrollment is 12 or more credits per term or 24 credits per year. Black includes African American, Hispanic includes Latino, American Indian includes Alaska Native, Pacific Islander includes Native Hawaiian, and Other includes respondents having origins in a race not listed. Pacific Islanders have been combined with Asians because of small sample sizes. Race categories exclude Hispanic origin unless specified. Dependent students were under age 24, unmarried, and had no dependents of their own in 2003. Family income of dependent students is the annual income of the parents in 2002. Categories represent the income quartile ranges of all dependent student families. Academic years are July 1–June 30. Spring 2006 includes any students enrolled after February 2006. This table includes students enrolled at postsecondary institutions in Puerto Rico. Detail may not sum to totals because of rounding.SOURCE: U.S. Department of Education, National Center for Education Statistics, 2003–04 Beginning Postsecondary StudentsLongitudinal Study, First Follow-up (BPS:04/06).
No degree, last enrolled anywhere
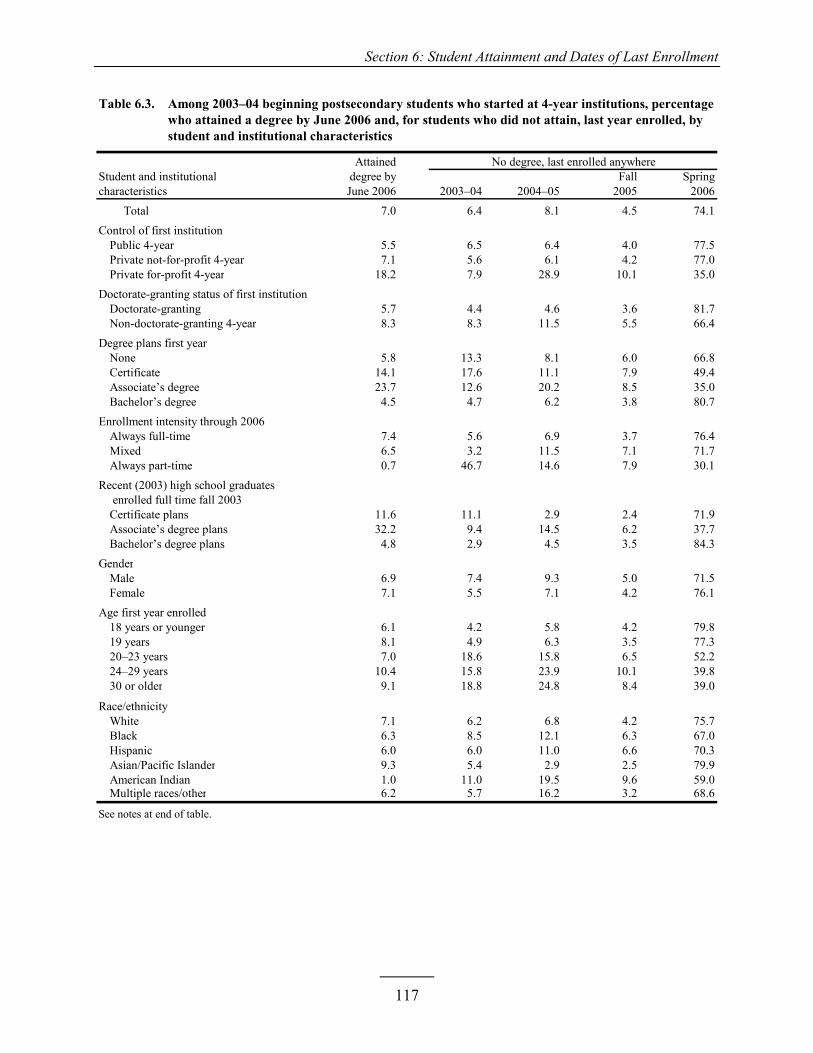
Section 6: Student Attainment and Dates of Last Enrollment
117
Table 6.3.—Among 2003–04 beginning postsecondary students who started at 4-year institutions, percentage Table 6.3.—who attained a degree by June 2006 and, for students who did not attain, last year enrolled, by Table 6.3.—student and institutional characteristics
AttainedStudent and institutional degree by Fall Springcharacteristics June 2006 2003–04 2004–05 2005 2006
Total 7.0 6.4 8.1 4.5 74.1Control of first institution
Public 4-year 5.5 6.5 6.4 4.0 77.5Private not-for-profit 4-year 7.1 5.6 6.1 4.2 77.0Private for-profit 4-year 18.2 7.9 28.9 10.1 35.0
Doctorate-granting status of first institutionDoctorate-granting 5.7 4.4 4.6 3.6 81.7Non-doctorate-granting 4-year 8.3 8.3 11.5 5.5 66.4
Degree plans first yearNone 5.8 13.3 8.1 6.0 66.8Certificate 14.1 17.6 11.1 7.9 49.4Associate’s degree 23.7 12.6 20.2 8.5 35.0Bachelor’s degree 4.5 4.7 6.2 3.8 80.7
Enrollment intensity through 2006Always full-time 7.4 5.6 6.9 3.7 76.4Mixed 6.5 3.2 11.5 7.1 71.7Always part-time 0.7 46.7 14.6 7.9 30.1
Recent (2003) high school graduates enrolled full time fall 2003Certificate plans 11.6 11.1 2.9 2.4 71.9Associate’s degree plans 32.2 9.4 14.5 6.2 37.7Bachelor’s degree plans 4.8 2.9 4.5 3.5 84.3
GenderMale 6.9 7.4 9.3 5.0 71.5Female 7.1 5.5 7.1 4.2 76.1
Age first year enrolled18 years or younger 6.1 4.2 5.8 4.2 79.819 years 8.1 4.9 6.3 3.5 77.320–23 years 7.0 18.6 15.8 6.5 52.224–29 years 10.4 15.8 23.9 10.1 39.830 or older 9.1 18.8 24.8 8.4 39.0
Race/ethnicityWhite 7.1 6.2 6.8 4.2 75.7Black 6.3 8.5 12.1 6.3 67.0Hispanic 6.0 6.0 11.0 6.6 70.3Asian/Pacific Islander 9.3 5.4 2.9 2.5 79.9American Indian 1.0 11.0 19.5 9.6 59.0Multiple races/other 6.2 5.7 16.2 3.2 68.6
See notes at end of table.
No degree, last enrolled anywhere
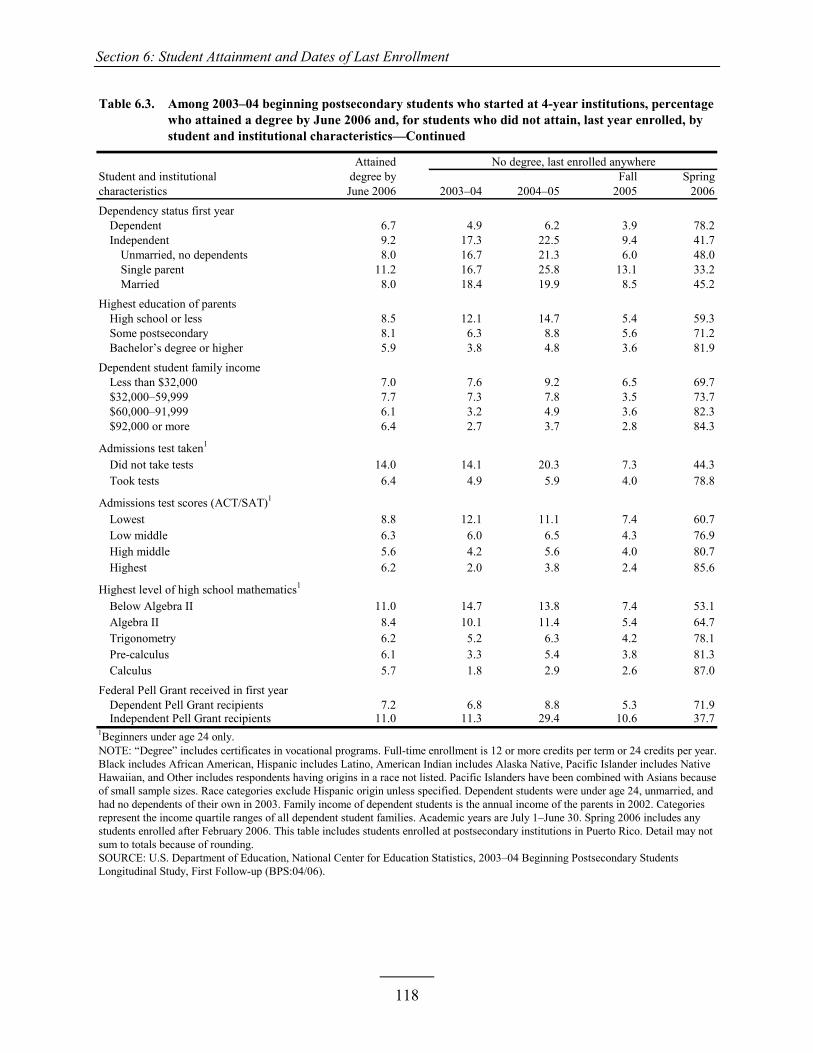
Section 6: Student Attainment and Dates of Last Enrollment
118
Table 6.3.—Among 2003–04 beginning postsecondary students who started at 4-year institutions, percentage Table 6.3.—who attained a degree by June 2006 and, for students who did not attain, last year enrolled, by Table 6.3.—student and institutional characteristics—Continued
AttainedStudent and institutional degree by Fall Springcharacteristics June 2006 2003–04 2004–05 2005 2006Dependency status first year
Dependent 6.7 4.9 6.2 3.9 78.2Independent 9.2 17.3 22.5 9.4 41.7
Unmarried, no dependents 8.0 16.7 21.3 6.0 48.0Single parent 11.2 16.7 25.8 13.1 33.2Married 8.0 18.4 19.9 8.5 45.2
Highest education of parentsHigh school or less 8.5 12.1 14.7 5.4 59.3Some postsecondary 8.1 6.3 8.8 5.6 71.2Bachelor’s degree or higher 5.9 3.8 4.8 3.6 81.9
Dependent student family income Less than $32,000 7.0 7.6 9.2 6.5 69.7$32,000–59,999 7.7 7.3 7.8 3.5 73.7$60,000–91,999 6.1 3.2 4.9 3.6 82.3$92,000 or more 6.4 2.7 3.7 2.8 84.3
Admissions test taken1
Did not take tests 14.0 14.1 20.3 7.3 44.3Took tests 6.4 4.9 5.9 4.0 78.8
Admissions test scores (ACT/SAT)1
Lowest 8.8 12.1 11.1 7.4 60.7Low middle 6.3 6.0 6.5 4.3 76.9High middle 5.6 4.2 5.6 4.0 80.7Highest 6.2 2.0 3.8 2.4 85.6
Highest level of high school mathematics1
Below Algebra II 11.0 14.7 13.8 7.4 53.1Algebra II 8.4 10.1 11.4 5.4 64.7Trigonometry 6.2 5.2 6.3 4.2 78.1Pre-calculus 6.1 3.3 5.4 3.8 81.3Calculus 5.7 1.8 2.9 2.6 87.0
Federal Pell Grant received in first yearDependent Pell Grant recipients 7.2 6.8 8.8 5.3 71.9Independent Pell Grant recipients 11.0 11.3 29.4 10.6 37.7
1Beginners under age 24 only.NOTE: “Degree” includes certificates in vocational programs. Full-time enrollment is 12 or more credits per term or 24 credits per year. Black includes African American, Hispanic includes Latino, American Indian includes Alaska Native, Pacific Islander includes Native Hawaiian, and Other includes respondents having origins in a race not listed. Pacific Islanders have been combined with Asians because of small sample sizes. Race categories exclude Hispanic origin unless specified. Dependent students were under age 24, unmarried, and had no dependents of their own in 2003. Family income of dependent students is the annual income of the parents in 2002. Categories represent the income quartile ranges of all dependent student families. Academic years are July 1–June 30. Spring 2006 includes any students enrolled after February 2006. This table includes students enrolled at postsecondary institutions in Puerto Rico. Detail may not sum to totals because of rounding.SOURCE: U.S. Department of Education, National Center for Education Statistics, 2003–04 Beginning Postsecondary StudentsLongitudinal Study, First Follow-up (BPS:04/06).
No degree, last enrolled anywhere

119
Section 7: Reasons for Leaving in the First Year or Transferring
Beginning postsecondary students have a variety of reasons for leaving the institution where they were enrolled in the first year without completing a program. The tables in this section describe what students reported as their reasons for leaving their institution after their first year. They could provide more than one reason.
Some of the students left to transfer to a different institution, some left and did not enroll anywhere else by June 2006, and some “stopped out” after the first year and returned by June 2006. The 3-year period covered in this report is too short to determine whether students who had not attained a certificate or degree and were no longer enrolled anywhere in June 2006 had permanently left postsecondary education. Some beginning students may “stop out” by leaving an institution for a semester or more, and then returning to that or a different institution later. Students who have “stopped out” can only be identified as such after they have returned, which may be after the 3-year period of this study. When the term “left” is used in this section, it only refers to the enrollment status of the student at the end of the first year in relation to the first institution attended, and includes some “stop-outs” who cannot be identified until later.
• Students most frequently reported personal reasons (53 percent) for leaving without completing a degree (table 7.1). Financial reasons were next (31 percent), followed by “other” reasons (24 percent) and family responsibilities (21 percent).
• Reasons directly related to their programs were less common: not satisfied (17 percent), academic problems (13 percent), and scheduling problems (8 percent).
• Students who began at 4-year institutions left for financial reasons at a greater rate than students at other levels (40 percent vs. 30 percent at 2-year institutions and 26 percent at less-than-2-year institutions).
• Students who began at a 2-year institution and transferred to another institution by 2006 most frequently did so to pursue a bachelor’s degree (82 percent) (table 7.2). Other commonly reported reasons were finishing the classes they wanted (34 percent) and personal (27 percent).
• Among students who began at 4-year institutions, 54 percent cited personal reasons for transferring. Students transferring from private not-for-profit 4-year institutions were more likely than those transferring from public ones to report financial problems (34 vs. 13 percent) or not being satisfied (34 vs. 30 percent). On the other hand, those

Section 7: Reasons for Leaving in the First Year or Transferring
120
transferring from public institutions at this level were more likely than those at private not-for-profit institutions to report scheduling problems as a reason for transferring (24 vs. 17 percent).

Section 7: Reasons for Leaving in the First Year or Transferring
121
Table 7.1.—Percentage of 2003–04 beginning postsecondary students who reported various reasons for leaving in 2004 without completing, by Table 7.1.—student and institutional characteristics
Student and institutional Academic Scheduling Not Financial Family Personal Finished Othercharacteristics problems problems satisfied reasons responsibilities reasons classes reason
Total 13.0 8.0 16.7 30.8 21.0 53.4 3.6 24.0
Type of first institution4-year
Public 22.6 6.2 12.0 44.3 21.1 85.0 9.8 #Private not-for-profit # # 25.0 27.2 31.5 60.0 # 16.7Private for-profit 5.4 6.4 45.1 48.3 25.2 43.4 # 20.7
2-yearPublic 12.8 10.4 12.4 28.7 17.3 48.2 2.5 29.7Private not-for-profit 6.9 # 33.5 44.4 20.0 40.1 # 6.9Private for-profit 12.4 4.8 40.3 38.2 18.4 38.3 # 41.1
Less-than-2-yearPublic 4.4 # 2.5 27.7 52.6 77.6 # 14.3Private for-profit 15.9 2.6 30.8 26.6 29.4 51.2 8.7 13.1
Level of first institution4-year 14.5 4.5 18.9 39.8 24.4 73.9 6.1 6.72-year 12.7 9.9 14.4 29.5 17.4 47.5 2.3 30.1Less-than-2-year 12.8 3.5 24.9 25.8 33.8 56.7 6.5 16.7
Control of first institutionPublic 13.8 9.4 11.9 30.9 19.3 54.6 3.4 24.9Private not-for-profit 1.0 3.7 27.7 27.4 27.8 55.4 # 22.6Private for-profit 14.0 3.5 34.5 31.6 26.3 47.3 5.7 20.7
Degree plans first yearNone 13.3 9.5 12.0 31.6 15.6 47.2 4.1 26.2Certificate 11.4 5.9 22.9 25.6 30.6 53.3 4.5 25.2Associate’s degree 12.9 9.1 15.5 30.0 17.8 51.1 2.6 27.7Bachelor’s degree 15.8 6.7 15.5 40.4 21.0 67.2 4.5 8.9
Enrollment intensity through 2006Always full-time 18.3 6.9 23.0 33.0 20.6 51.4 3.6 22.4Mixed 6.3 10.0 13.0 35.4 23.2 51.9 1.1 20.7Always part-time 8.7 8.8 10.5 27.3 21.1 56.0 4.1 26.6
See notes at end of table.

Section 7: Reasons for Leaving in the First Year or Transferring
122
Table 7.1.—Percentage of 2003–04 beginning postsecondary students who reported various reasons for leaving in 2004 without completing, by Table 7.1.—student and institutional characteristics—Continued
Student and institutional Academic Scheduling Not Financial Family Personal Finished Othercharacteristics problems problems satisfied reasons responsibilities reasons classes reason
Recent (2003) high school graduates enrolled full time fall 2003Certificate plans 16.4 8.0 40.6 21.8 28.3 57.7 13.2 11.0Associate’s degree plans 14.0 17.5 21.2 39.9 26.1 51.9 # 24.2Bachelor’s degree plans 25.6 7.3 19.4 45.6 17.8 72.6 0.5 6.2
GenderMale 9.7 8.9 18.1 40.0 21.4 42.7 1.6 29.9Female 15.9 7.2 15.6 22.8 20.8 62.6 5.3 19.0
Age first year enrolled18 years or younger 16.2 3.8 20.3 33.2 17.8 61.3 1.6 25.819 years 7.4 11.1 17.3 35.0 25.2 61.5 4.2 17.720–23 years 11.9 10.8 17.5 35.3 18.4 49.9 6.0 21.424–29 years 9.8 15.0 11.2 26.4 24.9 38.4 6.3 30.730 or older 16.4 4.1 15.6 24.9 21.2 51.9 1.8 25.1
Race/ethnicityWhite 11.2 11.0 15.4 30.7 19.3 52.2 4.3 24.2Black 10.3 3.7 19.8 28.7 24.7 46.0 2.8 31.2Hispanic 26.0 6.0 23.9 35.2 19.1 53.9 2.8 12.6Asian/Pacific Islander 3.8 0.7 4.3 18.7 28.3 87.8 1.5 27.7American Indian ‡ ‡ ‡ ‡ ‡ ‡ ‡ ‡Multiple races/other 5.7 0.6 4.7 32.9 29.7 65.7 2.2 37.1
Dependency status first yearDependent 12.8 7.9 18.3 35.5 19.9 57.5 3.2 22.8Independent 13.2 8.1 15.3 26.4 22.1 49.7 3.9 25.1
Unmarried, no dependents 10.7 8.8 22.9 32.2 19.1 41.9 4.7 27.1Single parent 13.0 6.0 14.0 24.4 24.1 56.6 2.8 23.4Married 14.7 9.4 12.4 25.1 22.1 48.4 4.3 25.5
Highest education of parentsHigh school or less 14.0 5.8 15.9 30.8 18.7 55.3 4.1 21.2Some postsecondary 10.8 10.8 13.4 31.3 21.2 51.7 1.8 28.2Bachelor’s degree or higher 10.9 10.3 22.6 30.1 26.0 53.3 4.3 25.7
See notes at end of table.
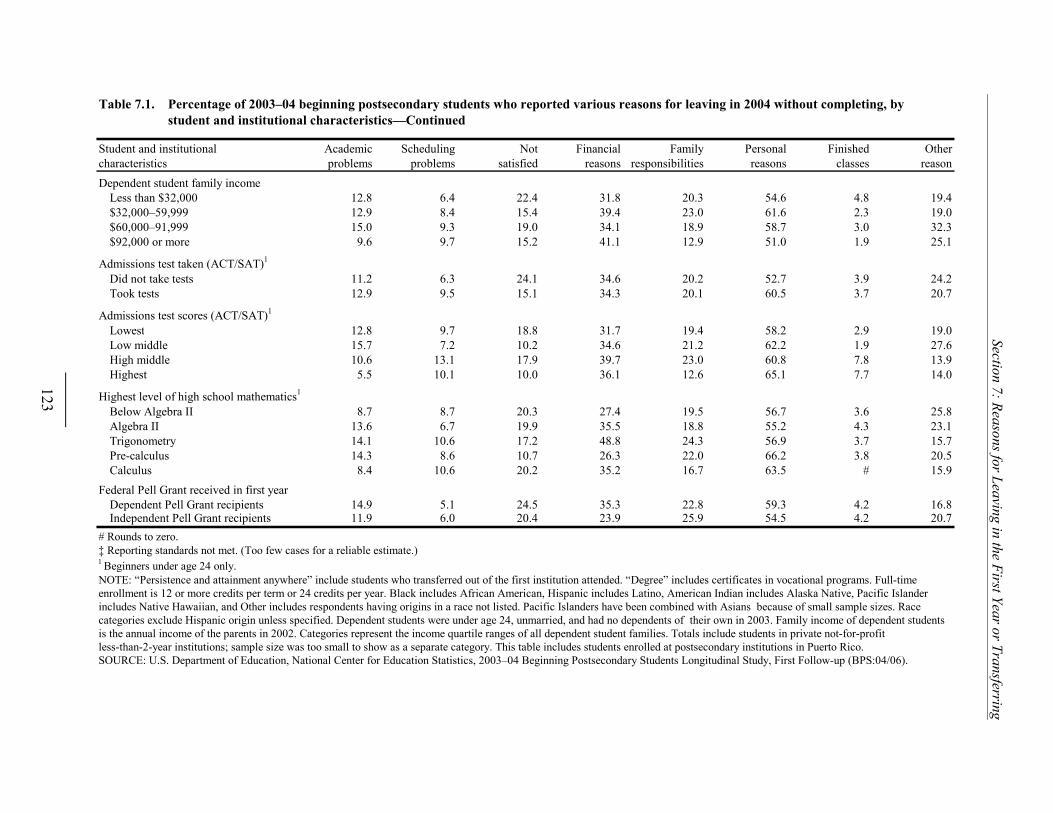
Section 7: Reasons for Leaving in the First Year or Transferring
123
Table 7.1.—Percentage of 2003–04 beginning postsecondary students who reported various reasons for leaving in 2004 without completing, by Table 7.1.—student and institutional characteristics—Continued
Student and institutional Academic Scheduling Not Financial Family Personal Finished Othercharacteristics problems problems satisfied reasons responsibilities reasons classes reasonDependent student family income
Less than $32,000 12.8 6.4 22.4 31.8 20.3 54.6 4.8 19.4$32,000–59,999 12.9 8.4 15.4 39.4 23.0 61.6 2.3 19.0$60,000–91,999 15.0 9.3 19.0 34.1 18.9 58.7 3.0 32.3$92,000 or more 9.6 9.7 15.2 41.1 12.9 51.0 1.9 25.1
Admissions test taken (ACT/SAT)1
Did not take tests 11.2 6.3 24.1 34.6 20.2 52.7 3.9 24.2Took tests 12.9 9.5 15.1 34.3 20.1 60.5 3.7 20.7
Admissions test scores (ACT/SAT)1
Lowest 12.8 9.7 18.8 31.7 19.4 58.2 2.9 19.0Low middle 15.7 7.2 10.2 34.6 21.2 62.2 1.9 27.6High middle 10.6 13.1 17.9 39.7 23.0 60.8 7.8 13.9Highest 5.5 10.1 10.0 36.1 12.6 65.1 7.7 14.0
Highest level of high school mathematics1
Below Algebra II 8.7 8.7 20.3 27.4 19.5 56.7 3.6 25.8Algebra II 13.6 6.7 19.9 35.5 18.8 55.2 4.3 23.1Trigonometry 14.1 10.6 17.2 48.8 24.3 56.9 3.7 15.7Pre-calculus 14.3 8.6 10.7 26.3 22.0 66.2 3.8 20.5Calculus 8.4 10.6 20.2 35.2 16.7 63.5 # 15.9
Federal Pell Grant received in first yearDependent Pell Grant recipients 14.9 5.1 24.5 35.3 22.8 59.3 4.2 16.8Independent Pell Grant recipients 11.9 6.0 20.4 23.9 25.9 54.5 4.2 20.7
# Rounds to zero.‡ Reporting standards not met. (Too few cases for a reliable estimate.)1 Beginners under age 24 only.NOTE: “Persistence and attainment anywhere” include students who transferred out of the first institution attended. “Degree” includes certificates in vocational programs. Full-timeenrollment is 12 or more credits per term or 24 credits per year. Black includes African American, Hispanic includes Latino, American Indian includes Alaska Native, Pacific Islanderincludes Native Hawaiian, and Other includes respondents having origins in a race not listed. Pacific Islanders have been combined with Asians because of small sample sizes. Racecategories exclude Hispanic origin unless specified. Dependent students were under age 24, unmarried, and had no dependents of their own in 2003. Family income of dependent studentsis the annual income of the parents in 2002. Categories represent the income quartile ranges of all dependent student families. Totals include students in private not-for-profitless-than-2-year institutions; sample size was too small to show as a separate category. This table includes students enrolled at postsecondary institutions in Puerto Rico. SOURCE: U.S. Department of Education, National Center for Education Statistics, 2003–04 Beginning Postsecondary Students Longitudinal Study, First Follow-up (BPS:04/06).

Section 7: Reasons for Leaving in the First Year or Transferring
124
Table 7.2.—Percentage of 2003–04 beginning postsecondary students who reported various reasons for transferring from their first institution, by Table 7.2.—student and institutional characteristics: 2006
Family PursueStudent and institutional Academic Scheduling Not Financial respon- Personal Finished bachelor’s Othercharacteristics problems problems satisfied reasons sibilities reasons classes degree reason
Total 3.1 18.0 16.6 11.1 5.9 38.1 27.8 56.8 19.1
Type of first institution4-year
Public 4.8 23.8 29.8 13.0 5.5 56.8 18.1 22.7 30.3Private not-for-profit 6.2 17.3 33.7 34.3 6.6 53.2 16.9 27.8 24.8Private for-profit 1.3 19.6 23.4 11.4 9.4 18.5 36.6 37.6 11.3
2-yearPublic 1.7 15.5 4.7 3.2 4.8 26.1 34.0 82.5 11.5Private not-for-profit 0.5 14.8 13.8 7.1 1.9 16.7 33.6 83.5 30.8Private for-profit # 11.7 34.4 33.2 11.9 48.5 29.0 78.1 42.2
Less-than-2-yearPublic 2.0 15.8 26.2 3.5 17.1 18.2 49.7 23.5 16.9Private for-profit 3.5 16.3 7.7 11.5 12.5 31.5 37.5 50.4 8.2
Level of first institution4-year 5.1 21.6 30.7 19.6 6.1 53.6 18.6 25.1 27.62-year 1.6 15.3 6.3 4.6 5.1 26.9 33.8 82.4 13.4Less-than-2-year 3.1 17.0 11.0 9.7 13.0 28.6 39.9 45.4 9.8
Control of first institutionPublic 2.8 18.4 13.5 6.5 5.2 36.5 28.8 61.5 18.0Private not-for-profit 5.6 17.3 31.4 31.3 6.1 49.2 18.7 33.5 25.2Private for-profit 1.9 15.9 19.5 17.7 11.5 33.0 34.8 55.0 18.8
Degree plans first yearNone 3.1 17.7 9.5 10.6 7.5 29.7 32.0 69.9 13.7Certificate 4.0 19.7 12.8 10.8 10.8 35.0 37.6 54.0 14.9Associate’s degree 1.8 15.2 8.8 5.6 4.5 27.8 32.1 77.1 13.7Bachelor’s degree 4.1 20.3 26.9 16.3 5.6 50.7 20.6 34.7 26.5
Enrollment intensity through 2006Always full-time 3.5 16.9 19.5 13.0 4.4 40.1 24.1 52.1 20.6Mixed 2.7 19.3 13.5 8.5 7.4 36.6 32.2 63.1 16.6Always part-time 1.5 20.3 7.5 10.2 11.2 22.5 35.5 59.0 24.0
See notes at end of table.

Section 7: Reasons for Leaving in the First Year or Transferring
125
Table 7.2.—Percentage of 2003–04 beginning postsecondary students who reported various reasons for transferring from their first institution, by Table 7.2.—student and institutional characteristics: 2006—Continued
Family PursueStudent and institutional Academic Scheduling Not Financial respon- Personal Finished bachelor’s Othercharacteristics problems problems satisfied reasons sibilities reasons classes degree reasonRecent (2003) high school graduates
enrolled full time fall 2003Certificate plans 5.2 15.0 12.4 15.2 13.3 43.1 42.3 49.9 17.9Associate’s degree plans 3.0 15.7 8.9 4.2 4.2 25.8 34.0 79.5 11.1Bachelor’s degree plans 4.1 20.2 30.5 17.6 6.0 54.4 17.8 29.0 28.3
GenderMale 3.2 17.6 17.1 11.8 5.6 37.0 25.3 58.2 21.1Female 3.0 18.3 16.3 10.4 6.1 38.9 29.9 55.7 17.4
Age first year enrolled18 years or younger 3.4 19.0 19.6 11.5 5.7 40.5 25.7 54.0 20.319 years 3.1 17.1 14.8 10.9 5.6 40.9 29.4 56.1 16.920–23 years 3.5 15.8 13.4 15.2 6.7 34.5 29.4 64.8 18.724–29 years 1.7 20.5 8.6 4.9 6.7 22.0 29.3 80.1 13.930 or older 1.0 15.8 11.8 4.4 6.9 20.1 34.4 53.7 23.7
Race/ethnicityWhite 3.5 18.2 16.6 10.2 4.7 38.2 26.4 57.5 19.1Black 1.8 16.4 20.1 16.7 6.9 40.9 35.8 51.5 23.0Hispanic 3.2 19.5 15.6 12.5 9.1 35.8 28.1 57.2 14.6Asian/Pacific Islander 2.3 15.7 10.1 5.6 4.6 35.2 27.7 61.9 18.9American Indian ‡ ‡ ‡ ‡ ‡ ‡ ‡ ‡ ‡Multiple races/other 1.6 18.7 21.5 11.4 10.7 36.2 23.6 55.3 18.7
Dependency status first yearDependent 3.5 17.9 17.3 11.3 5.7 39.7 26.5 54.9 18.6Independent 1.3 18.6 13.6 9.8 6.9 30.1 34.3 66.2 21.5
Unmarried, no dependents 1.2 17.6 22.6 13.7 8.0 32.7 35.3 67.0 30.7Single parent 0.6 19.7 8.7 9.3 9.3 30.1 41.3 52.4 10.8Married 2.0 18.6 9.3 6.8 4.0 27.8 27.9 76.0 21.6
Highest education of parentsHigh school or less 3.1 20.5 15.3 11.2 5.8 34.1 29.6 61.3 18.5Some postsecondary 2.4 16.2 14.7 10.8 5.2 34.5 29.7 59.9 15.6Bachelor’s degree or higher 3.6 17.5 19.0 11.0 6.5 43.6 25.5 51.5 21.3
See notes at end of table.
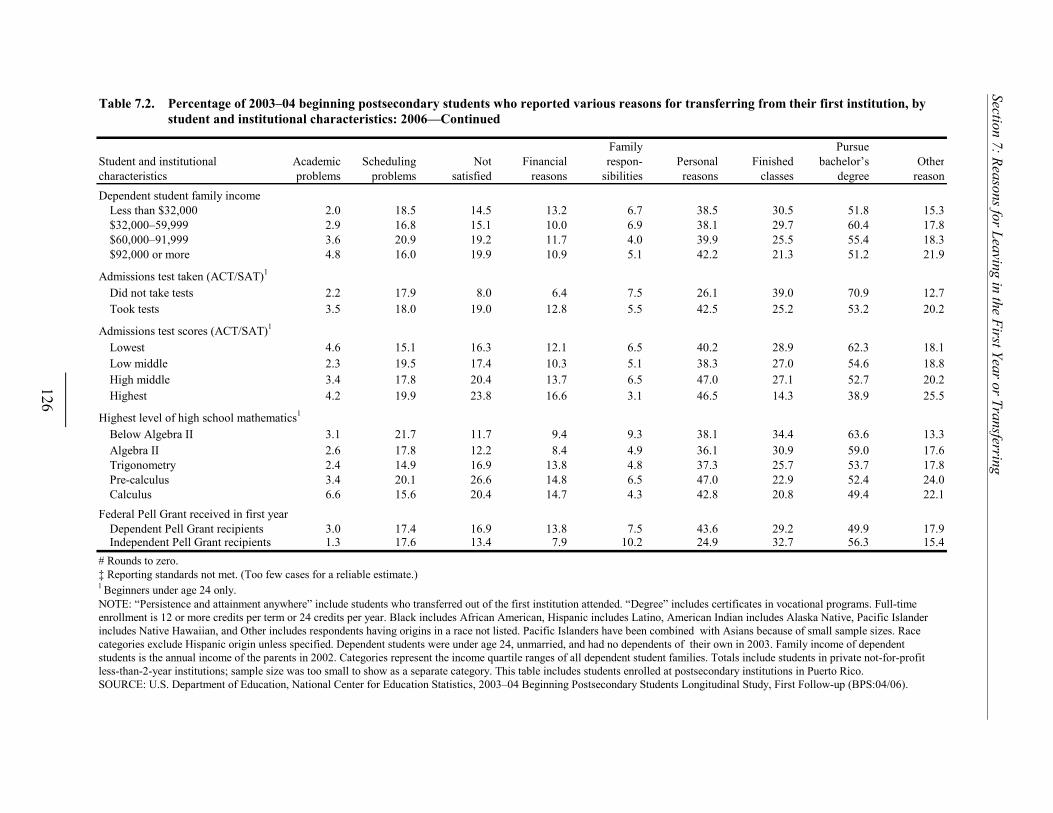
Section 7: Reasons for Leaving in the First Year or Transferring
126
Table 7.2.—Percentage of 2003–04 beginning postsecondary students who reported various reasons for transferring from their first institution, by Table 7.2.—student and institutional characteristics: 2006—Continued
Family PursueStudent and institutional Academic Scheduling Not Financial respon- Personal Finished bachelor’s Othercharacteristics problems problems satisfied reasons sibilities reasons classes degree reasonDependent student family income
Less than $32,000 2.0 18.5 14.5 13.2 6.7 38.5 30.5 51.8 15.3$32,000–59,999 2.9 16.8 15.1 10.0 6.9 38.1 29.7 60.4 17.8$60,000–91,999 3.6 20.9 19.2 11.7 4.0 39.9 25.5 55.4 18.3$92,000 or more 4.8 16.0 19.9 10.9 5.1 42.2 21.3 51.2 21.9
Admissions test taken (ACT/SAT)1
Did not take tests 2.2 17.9 8.0 6.4 7.5 26.1 39.0 70.9 12.7Took tests 3.5 18.0 19.0 12.8 5.5 42.5 25.2 53.2 20.2
Admissions test scores (ACT/SAT)1
Lowest 4.6 15.1 16.3 12.1 6.5 40.2 28.9 62.3 18.1Low middle 2.3 19.5 17.4 10.3 5.1 38.3 27.0 54.6 18.8High middle 3.4 17.8 20.4 13.7 6.5 47.0 27.1 52.7 20.2Highest 4.2 19.9 23.8 16.6 3.1 46.5 14.3 38.9 25.5
Highest level of high school mathematics1
Below Algebra II 3.1 21.7 11.7 9.4 9.3 38.1 34.4 63.6 13.3Algebra II 2.6 17.8 12.2 8.4 4.9 36.1 30.9 59.0 17.6Trigonometry 2.4 14.9 16.9 13.8 4.8 37.3 25.7 53.7 17.8Pre-calculus 3.4 20.1 26.6 14.8 6.5 47.0 22.9 52.4 24.0Calculus 6.6 15.6 20.4 14.7 4.3 42.8 20.8 49.4 22.1
Federal Pell Grant received in first yearDependent Pell Grant recipients 3.0 17.4 16.9 13.8 7.5 43.6 29.2 49.9 17.9Independent Pell Grant recipients 1.3 17.6 13.4 7.9 10.2 24.9 32.7 56.3 15.4
# Rounds to zero.‡ Reporting standards not met. (Too few cases for a reliable estimate.)1 Beginners under age 24 only.NOTE: “Persistence and attainment anywhere” include students who transferred out of the first institution attended. “Degree” includes certificates in vocational programs. Full-time enrollment is 12 or more credits per term or 24 credits per year. Black includes African American, Hispanic includes Latino, American Indian includes Alaska Native, Pacific Islander includes Native Hawaiian, and Other includes respondents having origins in a race not listed. Pacific Islanders have been combined with Asians because of small sample sizes. Race categories exclude Hispanic origin unless specified. Dependent students were under age 24, unmarried, and had no dependents of their own in 2003. Family income of dependent students is the annual income of the parents in 2002. Categories represent the income quartile ranges of all dependent student families. Totals include students in private not-for-profit less-than-2-year institutions; sample size was too small to show as a separate category. This table includes students enrolled at postsecondary institutions in Puerto Rico.SOURCE: U.S. Department of Education, National Center for Education Statistics, 2003–04 Beginning Postsecondary Students Longitudinal Study, First Follow-up (BPS:04/06).

127
Section 8: Community Service
In their first year and again in the 2006 interview, the students who began postsecondary education in 2003–04 were asked whether they had performed any community service during the previous year, and if so, how often and what type. The tables in this section report their responses. They include all students who began in 2003–04, regardless of their enrollment and completion status at the time of the interview. In 2006, they were also asked about the benefits they received from their community service.
• A total of 41 percent of all 2003–04 beginning postsecondary students performed some type of community service the first year they enrolled (table 8.1). For 14 percent, the service was required as part of their program. On average, they volunteered for 16 hours per month.
• For one-third of the students, their volunteer work took the form of service to a church. Working with kids (31 percent), tutoring or mentoring (25 percent), and working on neighborhood improvement projects (24 percent) were other common types of activities.
• A greater proportion of students at 4-year institutions than at 2-year or less-than-2-year institutions volunteered (54 vs. 31 and 24 percent, respectively). However, students at less-than-2-year institutions were the most likely to report that it was required for their programs—24 percent, compared with 17 percent at 4-year institutions and 10 percent at 2-year institutions.
• Dependent students from the highest income families ($92,000 or more) volunteered at a higher rate (56 percent) than those from lower income families (38 to 49 percent).
• When asked about community service in the 2006 interview, 38 percent reported volunteering during the previous year, slightly lower than the 41 percent reported in 2003–04 (table 8.2).
• Students who volunteered in 2006 reported a number of benefits from participating in community service. More than one-half reported that it expanded their skills (62 percent), made them more aware of social issues (60 percent), or made them a more compassionate person (57 percent) (table 8.3). In addition, 47 percent reported that they learned to apply their skills.
• Students also reported benefits related to their career or academic program: 44 percent noted that it added to their resume, helped with their career choice (18 percent), or clarified their choice of major (14 percent).
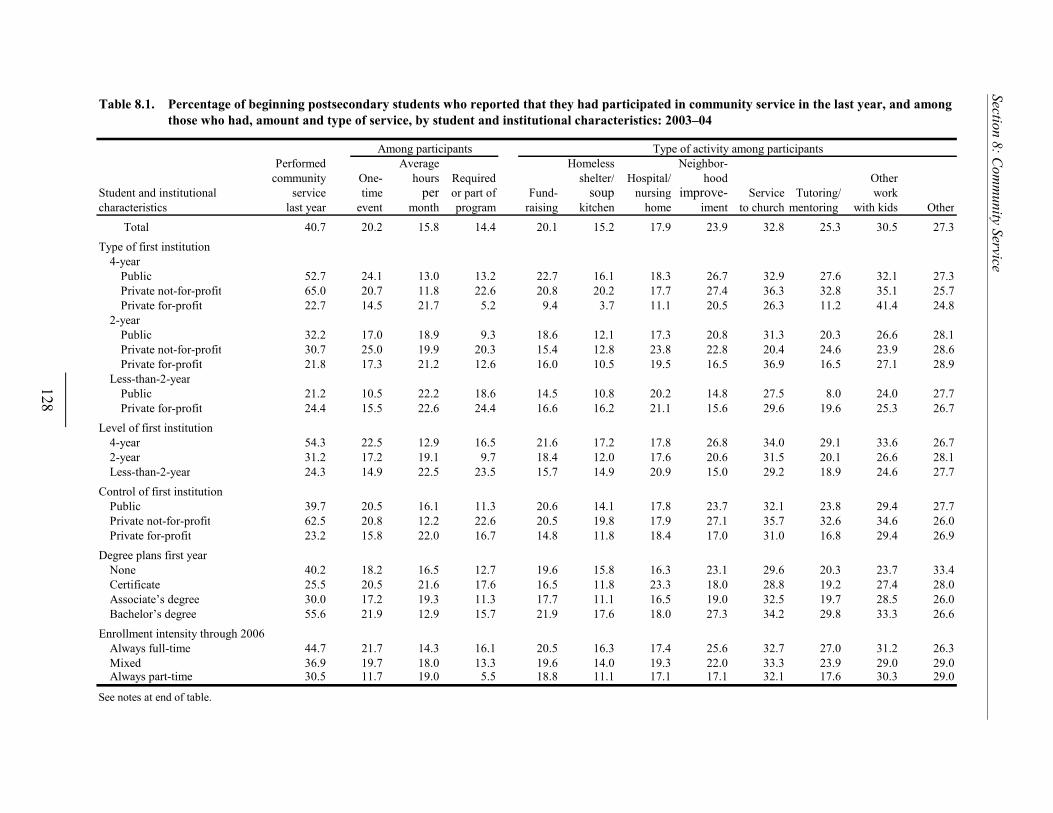
Section 8: Com
munity Service
128
Table 8.1.—Percentage of beginning postsecondary students who reported that they had participated in community service in the last year, and among Table 8.1.—those who had, amount and type of service, by student and institutional characteristics: 2003–04
Performed Average Homeless Neighbor-community One- hours Required shelter/ Hospital/ hood Other
Student and institutional service time per or part of Fund- soup nursing improve- Service Tutoring/ workcharacteristics last year event month program raising kitchen home iment to church mentoring with kids Other
Total 40.7 20.2 15.8 14.4 20.1 15.2 17.9 23.9 32.8 25.3 30.5 27.3Type of first institution
4-yearPublic 52.7 24.1 13.0 13.2 22.7 16.1 18.3 26.7 32.9 27.6 32.1 27.3Private not-for-profit 65.0 20.7 11.8 22.6 20.8 20.2 17.7 27.4 36.3 32.8 35.1 25.7Private for-profit 22.7 14.5 21.7 5.2 9.4 3.7 11.1 20.5 26.3 11.2 41.4 24.8
2-yearPublic 32.2 17.0 18.9 9.3 18.6 12.1 17.3 20.8 31.3 20.3 26.6 28.1Private not-for-profit 30.7 25.0 19.9 20.3 15.4 12.8 23.8 22.8 20.4 24.6 23.9 28.6Private for-profit 21.8 17.3 21.2 12.6 16.0 10.5 19.5 16.5 36.9 16.5 27.1 28.9
Less-than-2-yearPublic 21.2 10.5 22.2 18.6 14.5 10.8 20.2 14.8 27.5 8.0 24.0 27.7Private for-profit 24.4 15.5 22.6 24.4 16.6 16.2 21.1 15.6 29.6 19.6 25.3 26.7
Level of first institution4-year 54.3 22.5 12.9 16.5 21.6 17.2 17.8 26.8 34.0 29.1 33.6 26.72-year 31.2 17.2 19.1 9.7 18.4 12.0 17.6 20.6 31.5 20.1 26.6 28.1Less-than-2-year 24.3 14.9 22.5 23.5 15.7 14.9 20.9 15.0 29.2 18.9 24.6 27.7
Control of first institutionPublic 39.7 20.5 16.1 11.3 20.6 14.1 17.8 23.7 32.1 23.8 29.4 27.7Private not-for-profit 62.5 20.8 12.2 22.6 20.5 19.8 17.9 27.1 35.7 32.6 34.6 26.0Private for-profit 23.2 15.8 22.0 16.7 14.8 11.8 18.4 17.0 31.0 16.8 29.4 26.9
Degree plans first yearNone 40.2 18.2 16.5 12.7 19.6 15.8 16.3 23.1 29.6 20.3 23.7 33.4Certificate 25.5 20.5 21.6 17.6 16.5 11.8 23.3 18.0 28.8 19.2 27.4 28.0Associate’s degree 30.0 17.2 19.3 11.3 17.7 11.1 16.5 19.0 32.5 19.7 28.5 26.0Bachelor’s degree 55.6 21.9 12.9 15.7 21.9 17.6 18.0 27.3 34.2 29.8 33.3 26.6
Enrollment intensity through 2006Always full-time 44.7 21.7 14.3 16.1 20.5 16.3 17.4 25.6 32.7 27.0 31.2 26.3Mixed 36.9 19.7 18.0 13.3 19.6 14.0 19.3 22.0 33.3 23.9 29.0 29.0Always part-time 30.5 11.7 19.0 5.5 18.8 11.1 17.1 17.1 32.1 17.6 30.3 29.0
See notes at end of table.
Among participants Type of activity among participants

Section 8: Com
munity Service
129
Table 8.1.—Percentage of beginning postsecondary students who reported that they had participated in community service in the last year, and among Table 8.1.—those who had, amount and type of service, by student and institutional characteristics: 2003–04—Continued
Performed Average Homeless Neighbor-community One- hours Required shelter/ Hospital/ hood Other
Student and institutional service time per or part of Fund- soup nursing improve- Service Tutoring/ workcharacteristics last year event month program raising kitchen home iment to church mentoring with kids OtherRecent (2003) high school graduates
enrolled full time fall 2003Certificate plans 36.7 21.1 17.7 19.4 19.1 14.8 20.8 21.1 35.0 20.2 25.6 31.7Associate’s degree plans 36.7 19.7 16.2 15.4 17.4 10.6 18.5 24.2 33.0 20.0 26.8 26.4Bachelor’s degree plans 60.4 23.0 12.2 16.4 22.6 18.3 17.9 28.3 34.3 31.5 33.6 26.1
GenderMale 38.7 21.5 15.5 13.5 18.4 13.8 13.0 28.4 31.1 20.2 30.7 28.0Female 42.2 19.2 15.9 14.9 21.2 16.2 21.2 20.8 34.0 28.7 30.4 26.8
Age first year enrolled18 years or younger 48.7 21.8 14.8 16.3 20.8 16.1 17.9 25.3 32.6 27.6 31.2 26.719 years 45.4 22.1 13.9 14.9 21.3 17.3 18.7 25.8 33.0 26.1 31.6 27.420–23 years 26.1 16.6 18.7 11.7 16.1 9.9 16.7 19.1 28.8 18.7 27.7 28.324–29 years 22.1 15.2 22.7 9.8 17.8 10.7 16.0 21.3 28.7 19.7 27.5 26.630 or older 31.8 12.0 19.2 7.3 17.9 11.3 17.2 17.0 38.2 19.0 28.4 29.1
Race/ethnicityWhite 44.1 20.8 13.6 14.4 21.2 15.3 16.8 25.1 33.2 24.3 32.1 27.9Black 32.2 18.8 21.9 14.4 12.6 14.4 19.2 23.4 36.1 26.3 29.3 21.6Hispanic 33.2 17.2 19.4 17.3 19.4 15.0 19.1 19.6 31.5 26.3 26.3 26.9Asian/Pacific Islander 42.8 23.7 19.7 10.1 24.2 15.8 26.7 20.4 27.9 33.4 25.4 27.5American Indian 33.0 22.3 13.5 16.7 23.4 9.3 19.9 37.4 21.1 38.7 47.2 23.3Multiple races/other 43.4 17.2 18.1 10.6 18.5 15.4 16.0 20.9 29.8 22.7 25.5 32.5
Dependency status first yearDependent 46.2 21.6 14.7 15.8 20.7 16.2 18.3 25.3 32.6 26.8 31.4 27.0Independent 27.3 14.3 19.8 8.2 17.8 11.2 16.3 18.2 33.7 18.8 26.9 28.2
Unmarried, no dependents 27.7 17.1 19.6 7.4 17.6 14.3 14.6 15.9 26.5 14.9 23.7 33.5Single parent 23.4 16.0 21.5 10.6 15.4 11.3 16.6 13.4 27.9 17.5 25.3 28.0Married 30.6 11.5 18.9 7.0 19.6 9.3 17.0 22.9 41.8 21.9 29.8 25.3
See notes at end of table.
Among participants Type of activity among participants
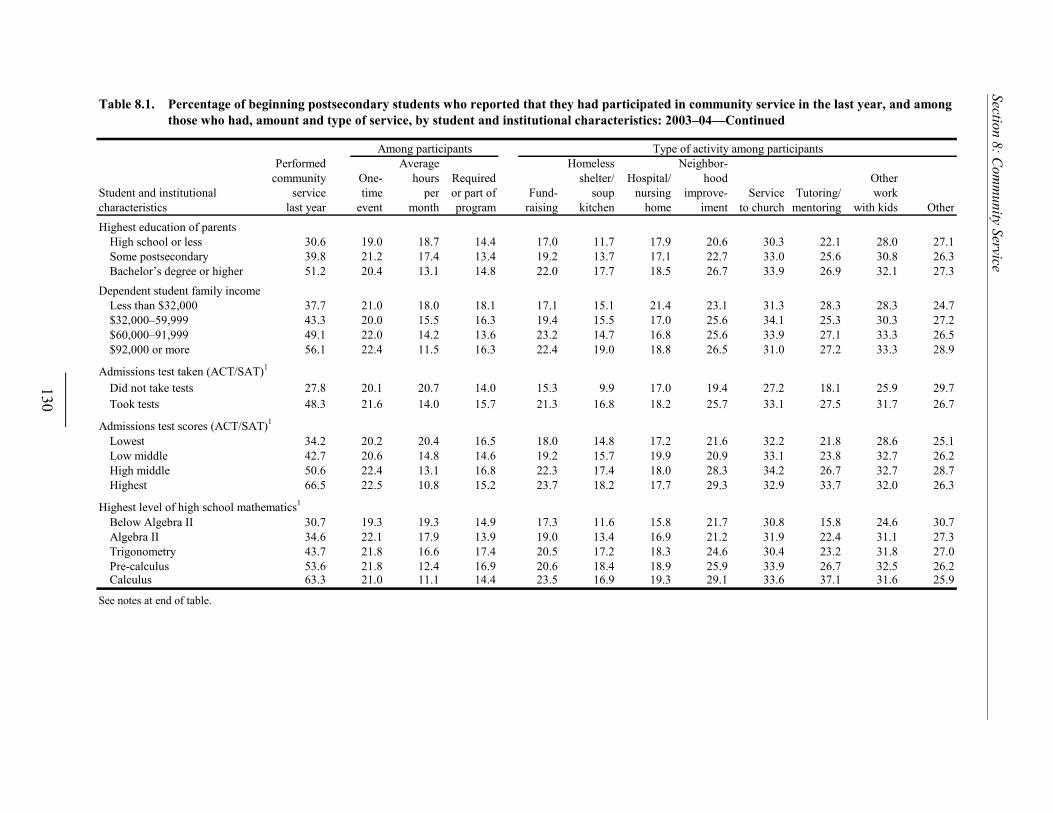
Section 8: Com
munity Service
130
Table 8.1.—Percentage of beginning postsecondary students who reported that they had participated in community service in the last year, and among Table 8.1.—those who had, amount and type of service, by student and institutional characteristics: 2003–04—Continued
Performed Average Homeless Neighbor-community One- hours Required shelter/ Hospital/ hood Other
Student and institutional service time per or part of Fund- soup nursing improve- Service Tutoring/ workcharacteristics last year event month program raising kitchen home iment to church mentoring with kids OtherHighest education of parents
High school or less 30.6 19.0 18.7 14.4 17.0 11.7 17.9 20.6 30.3 22.1 28.0 27.1Some postsecondary 39.8 21.2 17.4 13.4 19.2 13.7 17.1 22.7 33.0 25.6 30.8 26.3Bachelor’s degree or higher 51.2 20.4 13.1 14.8 22.0 17.7 18.5 26.7 33.9 26.9 32.1 27.3
Dependent student family income Less than $32,000 37.7 21.0 18.0 18.1 17.1 15.1 21.4 23.1 31.3 28.3 28.3 24.7$32,000–59,999 43.3 20.0 15.5 16.3 19.4 15.5 17.0 25.6 34.1 25.3 30.3 27.2$60,000–91,999 49.1 22.0 14.2 13.6 23.2 14.7 16.8 25.6 33.9 27.1 33.3 26.5$92,000 or more 56.1 22.4 11.5 16.3 22.4 19.0 18.8 26.5 31.0 27.2 33.3 28.9
Admissions test taken (ACT/SAT)1
Did not take tests 27.8 20.1 20.7 14.0 15.3 9.9 17.0 19.4 27.2 18.1 25.9 29.7Took tests 48.3 21.6 14.0 15.7 21.3 16.8 18.2 25.7 33.1 27.5 31.7 26.7
Admissions test scores (ACT/SAT)1
Lowest 34.2 20.2 20.4 16.5 18.0 14.8 17.2 21.6 32.2 21.8 28.6 25.1Low middle 42.7 20.6 14.8 14.6 19.2 15.7 19.9 20.9 33.1 23.8 32.7 26.2High middle 50.6 22.4 13.1 16.8 22.3 17.4 18.0 28.3 34.2 26.7 32.7 28.7Highest 66.5 22.5 10.8 15.2 23.7 18.2 17.7 29.3 32.9 33.7 32.0 26.3
Highest level of high school mathematics1
Below Algebra II 30.7 19.3 19.3 14.9 17.3 11.6 15.8 21.7 30.8 15.8 24.6 30.7Algebra II 34.6 22.1 17.9 13.9 19.0 13.4 16.9 21.2 31.9 22.4 31.1 27.3Trigonometry 43.7 21.8 16.6 17.4 20.5 17.2 18.3 24.6 30.4 23.2 31.8 27.0Pre-calculus 53.6 21.8 12.4 16.9 20.6 18.4 18.9 25.9 33.9 26.7 32.5 26.2Calculus 63.3 21.0 11.1 14.4 23.5 16.9 19.3 29.1 33.6 37.1 31.6 25.9
See notes at end of table.
Type of activity among participantsAmong participants

Section 8: Com
munity Service
131
Table 8.1.—Percentage of beginning postsecondary students who reported that they had participated in community service in the last year, and among Table 8.1.—those who had, amount and type of service, by student and institutional characteristics: 2003–04—Continued
Performed Average Homeless Neighbor-community One- hours Required shelter/ Hospital/ hood Other
Student and institutional service time per or part of Fund- soup nursing improve- Service Tutoring/ workcharacteristics last year event month program raising kitchen home iment to church mentoring with kids OtherFederal Pell Grant received in first year
Dependent Pell Grant recipients 41.0 21.1 17.1 18.3 17.8 15.3 19.7 23.6 33.9 27.8 28.6 24.0Independent Pell Grant recipients 22.3 16.6 22.3 12.2 15.9 12.9 15.4 14.9 29.8 17.4 26.4 26.6
1 Beginners under age 24 only.NOTE: “Persistence and attainment anywhere” include students who transferred out of the first institution attended. “Degree” includes certificates in vocational programs. Full-timeenrollment is 12 or more credits per term or 24 credits per year. Black includes African American, Hispanic includes Latino, American Indian includes Alaska Native, Pacific Islander includes Native Hawaiian, and Other includes respondents having origins in a race not listed. Pacific Islanders have been combined with Asians because of small sample sizes. Race categories exclude Hispanic origin unless specified. Dependent students were under age 24, unmarried, and had no dependents of their own in 2003. Family income of dependent students is the annual income of the parents in 2002. Categories represent the income quartile ranges of all dependent student families. Totals include students in private not-for-profit less-than-2-year institutions; sample size was too small to show as a separate category. This table includes students enrolled at postsecondary institutions in Puerto Rico.SOURCE: U.S. Department of Education, National Center for Education Statistics, 2003–04 Beginning Postsecondary Students Longitudinal Study, First Follow-up (BPS:04/06).
Among participants Type of activity among participants
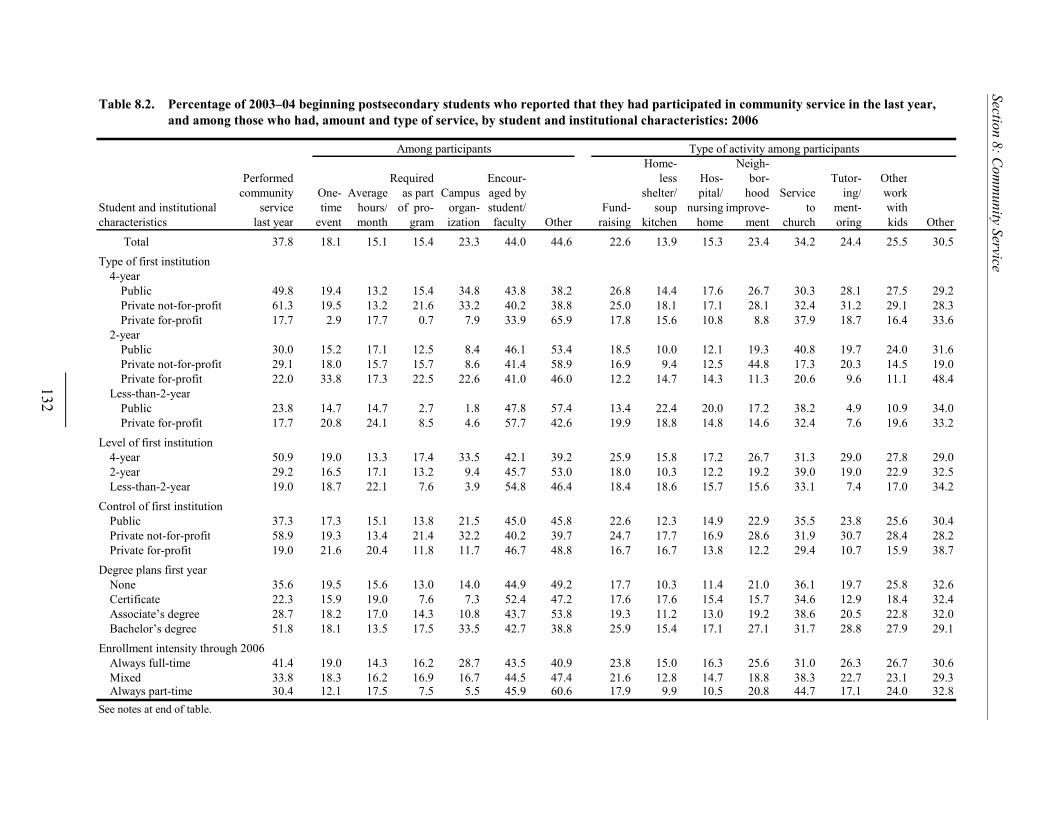
Section 8: Com
munity Service
132
Table 8.2.—Percentage of 2003–04 beginning postsecondary students who reported that they had participated in community service in the last year, Table 8.2.—and among those who had, amount and type of service, by student and institutional characteristics: 2006
Home- Neigh-Performed Required Encour- less Hos- bor- Tutor- Other
community One- Average as part Campus aged by shelter/ pital/ hood Service ing/ workStudent and institutional service time hours/ of pro- organ- student/ Fund- soup nursing improve- to ment- withcharacteristics last year event month gram ization faculty Other raising kitchen home ment church oring kids Other
Total 37.8 18.1 15.1 15.4 23.3 44.0 44.6 22.6 13.9 15.3 23.4 34.2 24.4 25.5 30.5Type of first institution
4-yearPublic 49.8 19.4 13.2 15.4 34.8 43.8 38.2 26.8 14.4 17.6 26.7 30.3 28.1 27.5 29.2Private not-for-profit 61.3 19.5 13.2 21.6 33.2 40.2 38.8 25.0 18.1 17.1 28.1 32.4 31.2 29.1 28.3Private for-profit 17.7 2.9 17.7 0.7 7.9 33.9 65.9 17.8 15.6 10.8 8.8 37.9 18.7 16.4 33.6
2-yearPublic 30.0 15.2 17.1 12.5 8.4 46.1 53.4 18.5 10.0 12.1 19.3 40.8 19.7 24.0 31.6Private not-for-profit 29.1 18.0 15.7 15.7 8.6 41.4 58.9 16.9 9.4 12.5 44.8 17.3 20.3 14.5 19.0Private for-profit 22.0 33.8 17.3 22.5 22.6 41.0 46.0 12.2 14.7 14.3 11.3 20.6 9.6 11.1 48.4
Less-than-2-yearPublic 23.8 14.7 14.7 2.7 1.8 47.8 57.4 13.4 22.4 20.0 17.2 38.2 4.9 10.9 34.0Private for-profit 17.7 20.8 24.1 8.5 4.6 57.7 42.6 19.9 18.8 14.8 14.6 32.4 7.6 19.6 33.2
Level of first institution4-year 50.9 19.0 13.3 17.4 33.5 42.1 39.2 25.9 15.8 17.2 26.7 31.3 29.0 27.8 29.02-year 29.2 16.5 17.1 13.2 9.4 45.7 53.0 18.0 10.3 12.2 19.2 39.0 19.0 22.9 32.5Less-than-2-year 19.0 18.7 22.1 7.6 3.9 54.8 46.4 18.4 18.6 15.7 15.6 33.1 7.4 17.0 34.2
Control of first institutionPublic 37.3 17.3 15.1 13.8 21.5 45.0 45.8 22.6 12.3 14.9 22.9 35.5 23.8 25.6 30.4Private not-for-profit 58.9 19.3 13.4 21.4 32.2 40.2 39.7 24.7 17.7 16.9 28.6 31.9 30.7 28.4 28.2Private for-profit 19.0 21.6 20.4 11.8 11.7 46.7 48.8 16.7 16.7 13.8 12.2 29.4 10.7 15.9 38.7
Degree plans first yearNone 35.6 19.5 15.6 13.0 14.0 44.9 49.2 17.7 10.3 11.4 21.0 36.1 19.7 25.8 32.6Certificate 22.3 15.9 19.0 7.6 7.3 52.4 47.2 17.6 17.6 15.4 15.7 34.6 12.9 18.4 32.4Associate’s degree 28.7 18.2 17.0 14.3 10.8 43.7 53.8 19.3 11.2 13.0 19.2 38.6 20.5 22.8 32.0Bachelor’s degree 51.8 18.1 13.5 17.5 33.5 42.7 38.8 25.9 15.4 17.1 27.1 31.7 28.8 27.9 29.1
Enrollment intensity through 2006Always full-time 41.4 19.0 14.3 16.2 28.7 43.5 40.9 23.8 15.0 16.3 25.6 31.0 26.3 26.7 30.6Mixed 33.8 18.3 16.2 16.9 16.7 44.5 47.4 21.6 12.8 14.7 18.8 38.3 22.7 23.1 29.3Always part-time 30.4 12.1 17.5 7.5 5.5 45.9 60.6 17.9 9.9 10.5 20.8 44.7 17.1 24.0 32.8
See notes at end of table.
Among participants Type of activity among participants

Section 8: Com
munity Service
133
Table 8.2.—Percentage of 2003–04 beginning postsecondary students who reported that they had participated in community service in the last year, Table 8.2.—and among those who had, amount and type of service, by student and institutional characteristics: 2006—Continued
Home- Neigh-Performed Required Encour- less Hos- bor- Tutor- Other
community One- Average as part Campus aged by shelter- pital/ hood Service ing/ workStudent and institutional service time hours/ of pro- organ- student/ Fund- soup nursing improve- to ment- withcharacteristics last year event month gram ization faculty Other raising kitchen home ment church oring kids Other Recent (2003) high school graduates
enrolled full time fall 2003Certificate plans 26.0 22.5 19.1 11.2 16.4 51.2 34.5 23.5 23.7 17.8 15.2 20.3 16.9 17.5 31.3Associate’s degree plans 31.8 21.9 16.3 16.3 13.5 47.3 49.1 18.6 11.5 13.0 18.3 35.4 19.1 22.5 33.7Bachelor’s degree plans 55.9 18.3 12.9 18.3 36.1 42.9 36.7 27.1 15.8 17.5 27.4 30.4 30.6 29.3 29.7
GenderMale 36.6 19.9 14.7 11.7 22.3 45.0 44.5 20.4 11.1 11.3 28.7 32.6 20.7 24.2 32.1Female 38.8 16.8 15.4 18.0 24.0 43.3 44.7 24.2 15.9 18.1 19.7 35.4 27.0 26.4 29.4
Age first year enrolled18 years or younger 43.8 19.3 14.0 17.6 28.9 43.9 39.8 24.4 14.6 16.5 24.8 31.5 27.8 27.7 30.219 years 41.7 20.4 13.7 15.5 27.0 44.9 41.5 23.5 14.5 15.2 26.1 31.5 25.7 25.1 30.520–23 years 26.7 18.2 18.9 17.6 13.2 44.0 50.0 19.4 11.6 14.6 25.4 35.6 17.2 21.7 31.824–29 years 24.4 17.8 17.9 11.6 8.9 48.3 50.5 18.8 14.7 11.0 13.9 34.5 13.9 24.4 33.530 or older 30.4 6.7 18.3 5.1 3.8 39.9 67.2 16.7 10.7 12.4 13.5 52.4 16.7 20.4 29.4
Race/ethnicityWhite 41.1 18.0 13.1 16.2 24.7 44.0 44.1 23.2 12.6 15.1 25.0 34.4 23.5 27.0 32.1Black 33.5 17.0 20.4 14.4 19.9 42.5 46.6 18.6 19.4 15.6 20.1 38.1 22.9 25.0 26.7Hispanic 27.4 18.0 19.2 14.9 19.7 43.3 46.4 19.1 13.7 14.5 19.0 31.6 22.6 22.9 27.6Asian/Pacific Islander 43.0 21.1 17.1 14.6 24.6 43.9 42.1 30.1 17.3 20.8 18.1 32.0 37.8 15.2 23.4American Indian 30.0 16.7 22.0 2.1 19.2 62.3 42.1 25.6 21.8 16.9 37.4 33.4 26.5 15.0 37.6Multiple races/other 35.7 18.5 18.6 10.3 18.0 47.7 46.5 22.3 12.7 11.8 24.7 30.8 29.5 25.1 32.7
Dependency status first yearDependent 42.1 19.5 14.3 16.8 27.2 44.5 41.0 24.0 14.3 16.0 25.5 31.7 26.7 27.0 30.3Independent 27.3 12.6 17.9 10.2 8.4 42.0 58.2 17.5 12.3 12.5 15.6 43.9 15.9 19.9 31.5
Unmarried, no dependents 25.1 17.2 17.0 12.8 14.7 39.8 54.4 13.9 16.1 11.5 12.3 37.7 11.7 16.3 40.8Single parent 23.3 11.6 19.1 10.0 4.9 41.6 58.2 19.5 11.9 15.3 13.7 35.2 16.5 16.3 32.1Married 32.4 11.1 17.5 9.1 7.6 43.4 60.1 17.8 10.8 11.1 18.4 52.7 17.6 24.0 26.6
See notes at end of table.
Among participants Type of activity among participants

Section 8: Com
munity Service
134
Table 8.2.—Percentage of 2003–04 beginning postsecondary students who reported that they had participated in community service in the last year, Table 8.2.—and among those who had, amount and type of service, by student and institutional characteristics: 2006—Continued
Home- Neigh-Performed Required Encour- less Hos- bor- Tutor- Other
community One- Average as part Campus aged by shelter- pital/ hood Service ing/ workStudent and institutional service time hours/ of pro- organ- student/ Fund- soup nursing improve- to ment- withcharacteristics last year event month gram ization faculty Other raising kitchen home ment church oring kids OtherHighest education of parents
High school or less 28.9 16.5 16.7 13.4 16.1 44.6 47.7 19.4 12.8 12.6 19.9 34.4 20.4 24.7 30.8Some postsecondary 36.9 17.8 16.6 15.5 19.9 44.0 49.0 23.3 14.1 15.5 20.7 36.2 24.7 25.5 31.6Bachelor’s degree or higher 47.5 19.1 13.2 16.6 29.5 43.6 40.3 24.3 14.4 16.7 27.1 33.1 26.9 26.3 29.8
Dependent student family income Less than $32,000 31.9 18.3 17.6 16.7 21.7 45.0 44.1 21.3 12.4 15.0 20.5 31.9 27.0 23.5 29.9$32,000–59,999 40.3 20.1 15.7 17.9 23.6 44.8 40.8 23.9 15.6 15.5 22.0 32.7 29.7 27.1 29.3$60,000–91,999 46.7 19.8 13.5 16.7 27.2 46.6 40.8 22.7 14.0 15.6 28.0 34.0 24.8 28.8 30.1$92,000 or more 51.3 19.5 11.6 16.3 34.5 41.8 38.7 27.4 14.8 17.5 29.7 28.6 25.4 27.6 31.8
Admissions test taken (ACT/SAT)1
Did not take tests 24.4 16.0 18.7 12.3 11.8 52.1 44.6 20.1 13.0 12.4 24.2 32.8 20.8 21.9 33.7Took tests 44.6 20.0 13.8 17.6 28.7 43.1 41.0 24.1 14.4 16.4 25.4 31.8 26.7 26.8 30.0
Admissions test scores (ACT/SAT)1
Lowest 31.7 21.1 18.3 18.3 17.3 44.6 45.2 19.4 16.4 13.5 22.9 34.8 22.5 21.6 30.5Low middle 39.7 19.3 15.0 17.3 23.8 43.4 44.7 23.2 11.6 15.7 21.7 31.6 25.1 30.3 30.0High middle 49.2 19.8 12.3 18.7 30.4 42.4 38.2 25.4 14.7 17.4 25.1 32.0 26.4 28.6 27.2Highest 58.7 20.2 11.8 16.6 37.3 42.6 38.0 26.3 15.2 17.8 29.9 30.2 30.5 25.8 32.0
Highest level of high school mathematics1
Below Algebra II 26.2 19.8 16.9 15.3 11.4 45.7 48.7 19.0 11.5 15.9 24.0 37.0 22.9 25.2 29.0Algebra II 32.2 19.7 15.6 15.0 18.5 45.2 44.6 21.6 13.5 12.9 24.4 34.0 21.0 22.5 29.5Trigonometry 40.9 19.0 15.8 18.4 27.1 45.0 42.0 23.8 16.6 16.0 23.8 29.7 24.0 26.4 32.0Pre-calculus 49.3 20.8 12.8 19.4 32.1 43.5 38.4 26.1 14.0 14.4 24.4 30.5 26.4 28.3 31.3Calculus 58.1 18.4 12.9 16.2 35.5 42.7 37.5 24.9 14.6 20.6 28.8 30.7 33.6 28.3 30.1
See notes at end of table.
Among participants Type of activity among participants
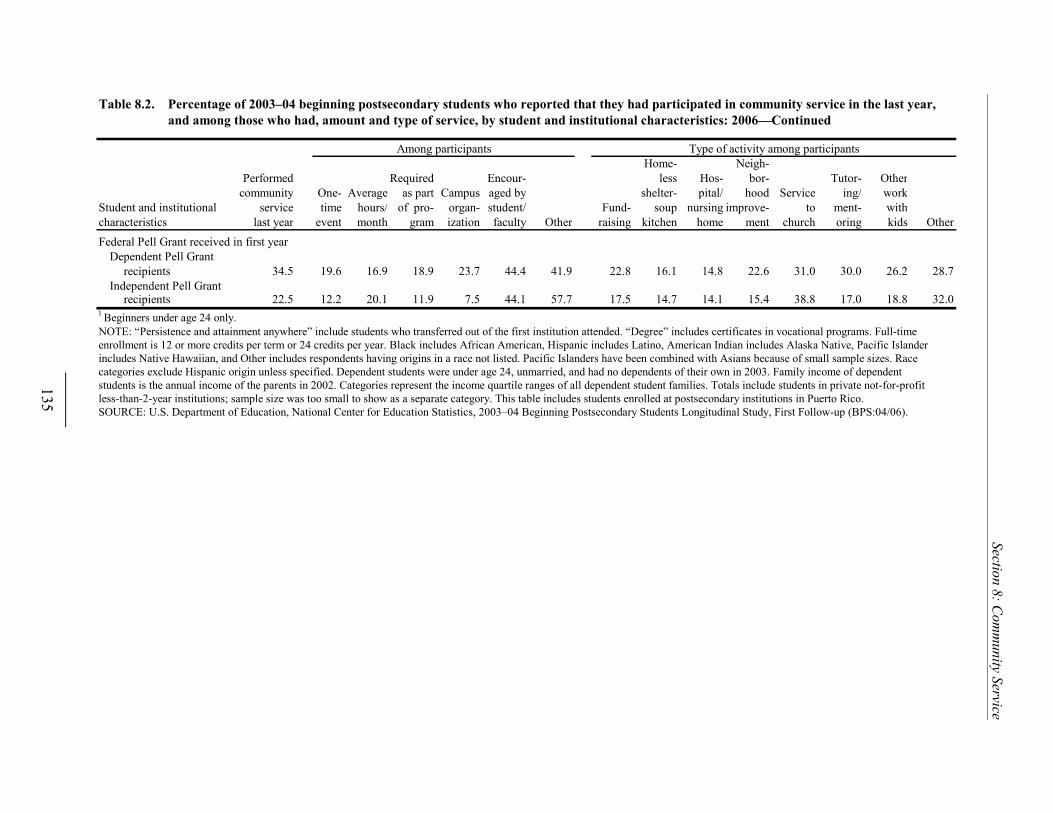
Section 8: Com
munity Service
135
Table 8.2.—Percentage of 2003–04 beginning postsecondary students who reported that they had participated in community service in the last year, Table 8.2.—and among those who had, amount and type of service, by student and institutional characteristics: 2006—Continued
Home- Neigh-Performed Required Encour- less Hos- bor- Tutor- Other
community One- Average as part Campus aged by shelter- pital/ hood Service ing/ workStudent and institutional service time hours/ of pro- organ- student/ Fund- soup nursing improve- to ment- withcharacteristics last year event month gram ization faculty Other raising kitchen home ment church oring kids OtherFederal Pell Grant received in first year
Dependent Pell Grant recipients 34.5 19.6 16.9 18.9 23.7 44.4 41.9 22.8 16.1 14.8 22.6 31.0 30.0 26.2 28.7
Independent Pell Grant recipients 22.5 12.2 20.1 11.9 7.5 44.1 57.7 17.5 14.7 14.1 15.4 38.8 17.0 18.8 32.0
1 Beginners under age 24 only.NOTE: “Persistence and attainment anywhere” include students who transferred out of the first institution attended. “Degree” includes certificates in vocational programs. Full-timeenrollment is 12 or more credits per term or 24 credits per year. Black includes African American, Hispanic includes Latino, American Indian includes Alaska Native, Pacific Islander includes Native Hawaiian, and Other includes respondents having origins in a race not listed. Pacific Islanders have been combined with Asians because of small sample sizes. Race categories exclude Hispanic origin unless specified. Dependent students were under age 24, unmarried, and had no dependents of their own in 2003. Family income of dependent students is the annual income of the parents in 2002. Categories represent the income quartile ranges of all dependent student families. Totals include students in private not-for-profit less-than-2-year institutions; sample size was too small to show as a separate category. This table includes students enrolled at postsecondary institutions in Puerto Rico.SOURCE: U.S. Department of Education, National Center for Education Statistics, 2003–04 Beginning Postsecondary Students Longitudinal Study, First Follow-up (BPS:04/06).
Type of activity among participantsAmong participants

Section 8: Community Service
136
Table 8.3.—Among 2003–04 beginning postsecondary students who had performed community service in the Table 8.3.—last year, percentage who reported various benefits and effects of their community service, by Table 8.3.—student and institutional characteristics: 2006
Became IncreasedHelped a more aware-
with Learned Clarified compas- ness ofStudent and institutional career to apply Expanded Added to choice sionate socialcharacteristics choice my skills skills resume of major person issues Other
Total 17.7 47.1 61.9 43.6 14.4 57.3 59.7 10.9Type of first institution
4-yearPublic 15.4 42.4 60.4 49.0 13.1 51.6 58.3 10.4Private not-for-profit 17.4 44.5 61.6 44.1 14.5 55.3 62.7 9.4Private for-profit 23.0 54.7 67.5 34.3 14.1 58.4 56.5 11.3
2-yearPublic 18.8 50.9 62.6 38.5 14.1 62.5 58.7 12.4Private not-for-profit 24.0 44.7 51.9 40.6 20.6 58.2 54.8 28.3Private for-profit 34.3 61.4 67.4 57.3 38.3 62.9 67.3 13.4
Less-than-2-yearPublic 20.0 44.3 58.4 24.2 8.0 66.1 48.8 7.3Private for-profit 12.9 60.9 66.7 34.0 11.2 72.8 63.7 7.2
Level of first institution4-year 16.3 43.5 61.1 46.7 13.7 53.2 59.9 10.02-year 20.0 51.5 62.8 39.9 16.0 62.5 59.2 12.7Less-than-2-year 15.0 58.5 65.1 33.6 11.0 69.9 59.6 7.4
Control of first institutionPublic 17.1 46.5 61.5 43.6 13.6 57.1 58.4 11.3Private not-for-profit 17.7 44.8 61.4 44.2 14.8 55.2 62.3 10.0Private for-profit 22.7 59.7 67.1 42.3 21.5 66.2 63.4 10.3
Degree plans first yearNone 15.5 47.6 57.4 39.4 11.1 57.4 52.2 16.4Certificate 16.8 53.2 63.4 33.5 12.4 65.2 61.1 10.1Associate’s degree 21.2 52.7 64.5 41.1 17.0 63.8 61.3 10.6Bachelor’s degree 16.3 43.4 61.1 47.1 14.0 53.0 59.9 10.3
Enrollment intensity through 2006Always full-time 17.0 46.1 61.7 46.0 14.2 56.2 60.2 10.6Mixed 17.8 46.7 61.5 41.2 15.4 55.9 56.5 11.9Always part-time 21.0 54.1 63.7 35.2 13.6 67.6 63.3 10.9
Recent (2003) high school graduates enrolled full time fall 2003Certificate plans 13.1 61.5 68.6 41.9 14.8 68.4 64.1 8.6Associate’s degree plans 18.5 50.4 62.4 40.7 15.6 59.4 56.4 13.1Bachelor’s degree plans 16.5 43.2 61.9 48.5 14.1 53.0 60.5 10.1
GenderMale 14.7 44.8 59.0 41.0 11.5 51.8 54.0 13.9Female 19.7 48.7 63.9 45.5 16.5 61.2 63.6 8.8
Age first year enrolled18 years or younger 17.0 46.5 63.1 46.9 14.6 55.1 59.9 10.419 years 16.9 44.5 61.4 44.6 14.2 55.5 57.9 10.520–23 years 19.0 47.9 59.9 46.5 13.3 61.2 59.0 9.024–29 years 19.3 62.2 68.3 29.8 15.1 67.9 64.6 7.830 or older 20.4 48.5 55.8 30.5 15.0 63.8 61.1 17.5
See notes at end of table.

Section 8: Community Service
137
Table 8.3.—Among 2003–04 beginning postsecondary students who had performed community service in the Table 8.3.—last year, percentage who reported various benefits and effects of their community service, by Table 8.3.—student and institutional characteristics: 2006—Continued
Became IncreasedHelped a more aware-
with Learned Clarified compas- ness ofStudent and institutional career to apply Expanded Added to choice sionate socialcharacteristics choice my skills skills resume of major person issues OtherRace/ethnicity
White 15.9 43.4 59.7 42.9 12.7 55.5 57.8 11.6Black 23.4 57.5 68.2 48.7 20.2 65.9 72.1 7.4Hispanic 18.8 51.6 63.6 37.6 14.8 56.6 57.0 11.8Asian/Pacific Islander 24.4 56.2 69.4 52.6 22.1 60.9 62.4 8.2American Indian 17.4 48.0 59.0 39.1 14.1 61.6 70.0 13.0Multiple races/other 16.6 53.7 63.7 45.5 13.7 58.7 56.4 11.8
Dependency status first yearDependent 16.9 45.3 61.8 46.0 14.0 55.2 58.7 10.4Independent 20.4 53.8 62.0 34.7 16.1 65.3 63.1 13.0
Unmarried, no dependents 20.8 52.7 61.3 38.0 20.0 62.2 61.9 13.9Single parent 22.2 57.3 65.0 37.1 13.5 64.1 63.2 11.3Married 19.1 51.9 60.3 31.5 16.0 67.7 63.6 13.6
Highest education of parentsHigh school or less 19.8 50.5 63.1 39.5 16.3 61.5 61.7 10.5Some postsecondary 19.6 49.3 62.0 43.3 15.7 57.0 60.4 11.4Bachelor’s degree or higher 15.4 43.7 60.7 46.2 12.9 55.2 58.2 11.0
Dependent student family income Less than $32,000 17.6 52.8 63.8 45.3 14.9 58.7 59.0 8.4$32,000–59,999 19.1 47.5 65.1 47.2 16.6 58.2 61.7 9.5$60,000–91,999 16.2 43.9 60.2 44.5 12.6 54.2 56.9 11.1$92,000 or more 15.3 39.7 58.5 46.7 12.3 51.0 57.8 12.0
Federal Pell Grant received in first yearDependent Pell Grant recipients 19.1 51.5 65.6 49.0 16.8 58.2 60.1 8.1Independent Pell Grant recipients 20.8 55.7 67.2 37.4 16.0 66.4 63.3 9.6
NOTE: “Persistence and attainment anywhere” include students who transferred out of the first institution attended. “Degree” includescertificates in vocational programs. Full-time enrollment is 12 or more credits per term or 24 credits per year. Black includes AfricanAmerican, Hispanic includes Latino, American Indian includes Alaska Native, Pacific Islander includes Native Hawaiian, and Other includes respondents having origins in a race not listed. Pacific Islanders have been combined with Asians because of small sample sizes. Race categories exclude Hispanic origin unless specified. Dependent students were under age 24, unmarried, and had no dependents of their own in 2003. Family income of dependent students is the annual income of the parents in 2002. Categories represent the income quartile ranges of all dependent student families. Totals include students in private not-for-profit less-than-2-year institutions; sample size was too small to show as a separate category. This table includes students enrolled at postsecondary institutions in Puerto Rico.SOURCE: U.S. Department of Education, National Center for Education Statistics, 2003–04 Beginning Postsecondary StudentsLongitudinal Study, First Follow-up (BPS:04/06).

THIS PAGE INTENTIONALLY LEFT BLANK
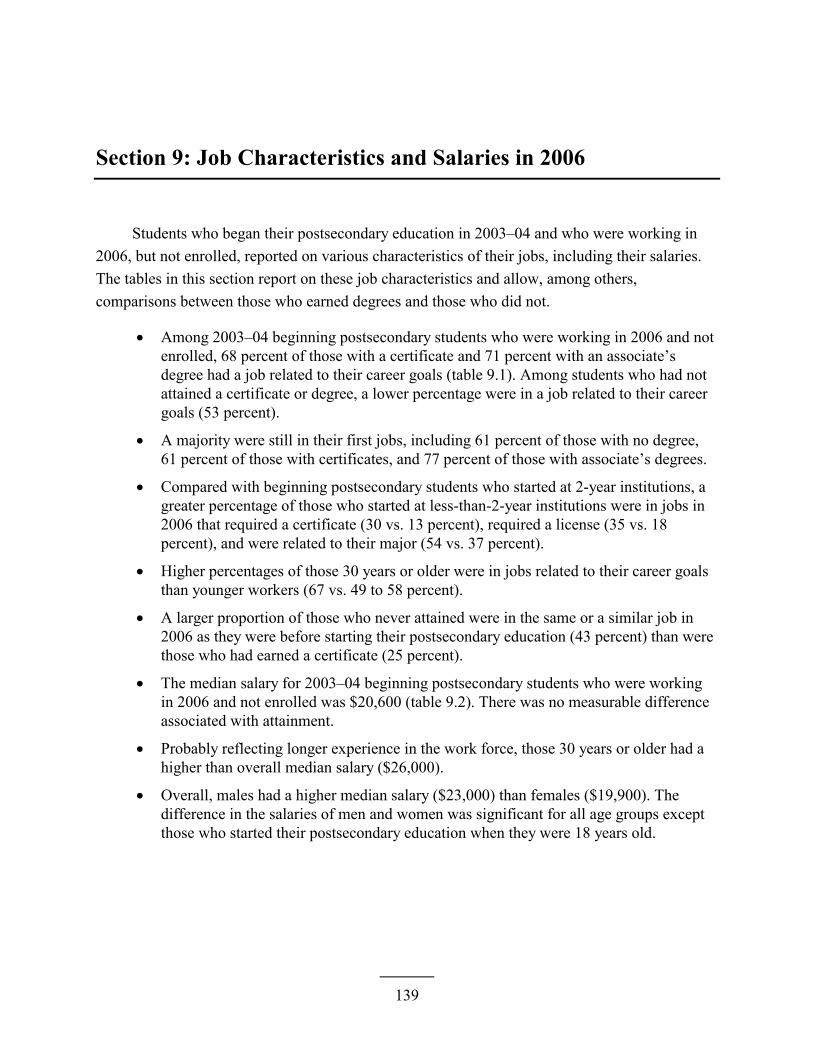
139
Section 9: Job Characteristics and Salaries in 2006
Students who began their postsecondary education in 2003–04 and who were working in 2006, but not enrolled, reported on various characteristics of their jobs, including their salaries. The tables in this section report on these job characteristics and allow, among others, comparisons between those who earned degrees and those who did not.
• Among 2003–04 beginning postsecondary students who were working in 2006 and not enrolled, 68 percent of those with a certificate and 71 percent with an associate’s degree had a job related to their career goals (table 9.1). Among students who had not attained a certificate or degree, a lower percentage were in a job related to their career goals (53 percent).
• A majority were still in their first jobs, including 61 percent of those with no degree, 61 percent of those with certificates, and 77 percent of those with associate’s degrees.
• Compared with beginning postsecondary students who started at 2-year institutions, a greater percentage of those who started at less-than-2-year institutions were in jobs in 2006 that required a certificate (30 vs. 13 percent), required a license (35 vs. 18 percent), and were related to their major (54 vs. 37 percent).
• Higher percentages of those 30 years or older were in jobs related to their career goals than younger workers (67 vs. 49 to 58 percent).
• A larger proportion of those who never attained were in the same or a similar job in 2006 as they were before starting their postsecondary education (43 percent) than were those who had earned a certificate (25 percent).
• The median salary for 2003–04 beginning postsecondary students who were working in 2006 and not enrolled was $20,600 (table 9.2). There was no measurable difference associated with attainment.
• Probably reflecting longer experience in the work force, those 30 years or older had a higher than overall median salary ($26,000).
• Overall, males had a higher median salary ($23,000) than females ($19,900). The difference in the salaries of men and women was significant for all age groups except those who started their postsecondary education when they were 18 years old.
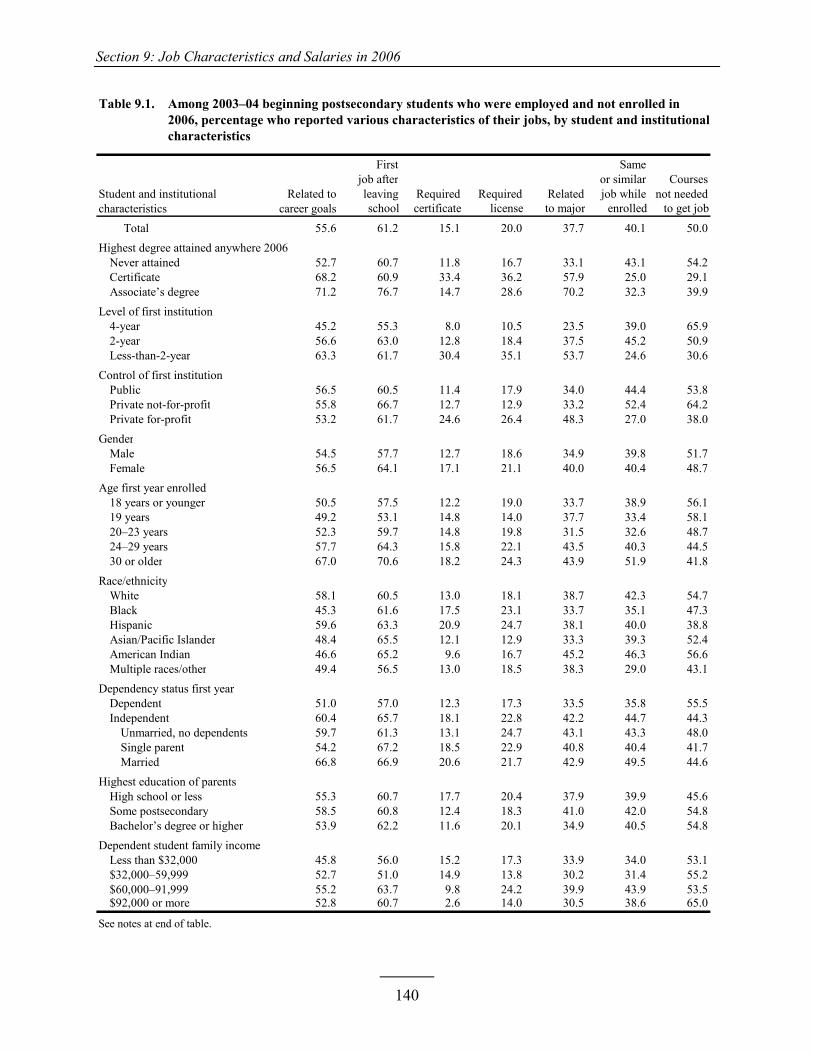
Section 9: Job Characteristics and Salaries in 2006
140
Table 9.1.—Among 2003–04 beginning postsecondary students who were employed and not enrolled in Table 9.1.—2006, percentage who reported various characteristics of their jobs, by student and institutional Table 9.1.—characteristics
First Samejob after or similar Courses
Student and institutional Related to leaving Required Required Related job while not neededcharacteristics career goals school certificate license to major enrolled to get job
Total 55.6 61.2 15.1 20.0 37.7 40.1 50.0Highest degree attained anywhere 2006
Never attained 52.7 60.7 11.8 16.7 33.1 43.1 54.2Certificate 68.2 60.9 33.4 36.2 57.9 25.0 29.1Associate’s degree 71.2 76.7 14.7 28.6 70.2 32.3 39.9
Level of first institution4-year 45.2 55.3 8.0 10.5 23.5 39.0 65.92-year 56.6 63.0 12.8 18.4 37.5 45.2 50.9Less-than-2-year 63.3 61.7 30.4 35.1 53.7 24.6 30.6
Control of first institutionPublic 56.5 60.5 11.4 17.9 34.0 44.4 53.8Private not-for-profit 55.8 66.7 12.7 12.9 33.2 52.4 64.2Private for-profit 53.2 61.7 24.6 26.4 48.3 27.0 38.0
GenderMale 54.5 57.7 12.7 18.6 34.9 39.8 51.7Female 56.5 64.1 17.1 21.1 40.0 40.4 48.7
Age first year enrolled18 years or younger 50.5 57.5 12.2 19.0 33.7 38.9 56.119 years 49.2 53.1 14.8 14.0 37.7 33.4 58.120–23 years 52.3 59.7 14.8 19.8 31.5 32.6 48.724–29 years 57.7 64.3 15.8 22.1 43.5 40.3 44.530 or older 67.0 70.6 18.2 24.3 43.9 51.9 41.8
Race/ethnicityWhite 58.1 60.5 13.0 18.1 38.7 42.3 54.7Black 45.3 61.6 17.5 23.1 33.7 35.1 47.3Hispanic 59.6 63.3 20.9 24.7 38.1 40.0 38.8Asian/Pacific Islander 48.4 65.5 12.1 12.9 33.3 39.3 52.4American Indian 46.6 65.2 9.6 16.7 45.2 46.3 56.6Multiple races/other 49.4 56.5 13.0 18.5 38.3 29.0 43.1
Dependency status first yearDependent 51.0 57.0 12.3 17.3 33.5 35.8 55.5Independent 60.4 65.7 18.1 22.8 42.2 44.7 44.3
Unmarried, no dependents 59.7 61.3 13.1 24.7 43.1 43.3 48.0Single parent 54.2 67.2 18.5 22.9 40.8 40.4 41.7Married 66.8 66.9 20.6 21.7 42.9 49.5 44.6
Highest education of parentsHigh school or less 55.3 60.7 17.7 20.4 37.9 39.9 45.6Some postsecondary 58.5 60.8 12.4 18.3 41.0 42.0 54.8Bachelor’s degree or higher 53.9 62.2 11.6 20.1 34.9 40.5 54.8
Dependent student family income Less than $32,000 45.8 56.0 15.2 17.3 33.9 34.0 53.1$32,000–59,999 52.7 51.0 14.9 13.8 30.2 31.4 55.2$60,000–91,999 55.2 63.7 9.8 24.2 39.9 43.9 53.5$92,000 or more 52.8 60.7 2.6 14.0 30.5 38.6 65.0
See notes at end of table.
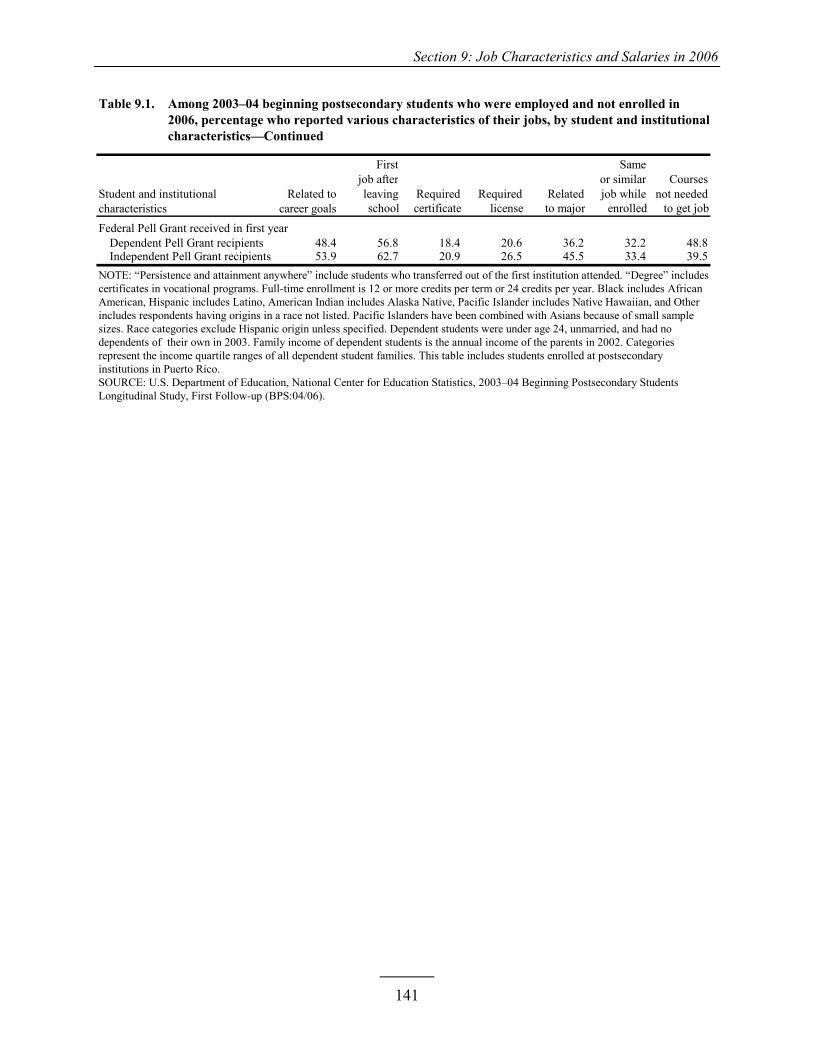
Section 9: Job Characteristics and Salaries in 2006
141
Table 9.1.—Among 2003–04 beginning postsecondary students who were employed and not enrolled in Table 9.1.—2006, percentage who reported various characteristics of their jobs, by student and institutional Table 9.1.—characteristics—Continued
First Samejob after or similar Courses
Student and institutional Related to leaving Required Required Related job while not neededcharacteristics career goals school certificate license to major enrolled to get job
Federal Pell Grant received in first yearDependent Pell Grant recipients 48.4 56.8 18.4 20.6 36.2 32.2 48.8Independent Pell Grant recipients 53.9 62.7 20.9 26.5 45.5 33.4 39.5
NOTE: “Persistence and attainment anywhere” include students who transferred out of the first institution attended. “Degree” includescertificates in vocational programs. Full-time enrollment is 12 or more credits per term or 24 credits per year. Black includes AfricanAmerican, Hispanic includes Latino, American Indian includes Alaska Native, Pacific Islander includes Native Hawaiian, and Other includes respondents having origins in a race not listed. Pacific Islanders have been combined with Asians because of small sample sizes. Race categories exclude Hispanic origin unless specified. Dependent students were under age 24, unmarried, and had no dependents of their own in 2003. Family income of dependent students is the annual income of the parents in 2002. Categories represent the income quartile ranges of all dependent student families. This table includes students enrolled at postsecondary institutions in Puerto Rico.SOURCE: U.S. Department of Education, National Center for Education Statistics, 2003–04 Beginning Postsecondary StudentsLongitudinal Study, First Follow-up (BPS:04/06).

Section 9: Job Characteristics and Salaries in 2006
142
Table 9.2.—Median annual salaries of 2003–04 beginning postsecondary students who were employed and Table 9.2.—not enrolled in 2006, by student and institutional characteristics
Student and institutional characteristics Total Male Female
Total $20,600 $23,000 $19,900Highest degree attained anywhere 2006
Never attained 20,700 22,000 20,000Certificate 20,000 25,500 18,500Associate’s degree 19,700 23,900 16,000
Level of first institution4-year 20,000 21,000 19,8002-year 21,500 23,900 20,100Less-than-2-year 19,000 21,000 18,000
Control of first institutionPublic 21,500 23,000 20,400Private not-for-profit 21,500 24,000 19,700Private for-profit 19,900 21,500 18,900
Age first year enrolled18 years or younger 18,700 19,900 18,50019 years 19,300 20,000 18,10020–23 years 20,900 23,500 19,70024–29 years 20,900 24,000 20,00030 or older 26,000 31,100 23,400
Race/ethnicityWhite 20,900 23,000 20,000Black 19,800 21,000 19,200Hispanic 20,400 23,400 19,900Asian/Pacific Islander 20,000 20,000 20,000American Indian 20,000 ‡ ‡Multiple races/other 20,800 25,000 19,000
Dependency status first yearDependent 19,900 20,400 18,500Independent 22,900 26,800 20,800
Unmarried, no dependents 22,000 25,200 19,800Single parent 21,100 24,000 20,800Married 25,000 28,300 21,800
Highest education of parentsHigh school or less 20,400 23,900 19,900Some postsecondary 20,800 20,900 20,400Bachelor’s degree or higher 20,800 22,100 20,000
Dependent student family income Less than $32,000 18,400 20,000 17,500$32,000–59,999 19,800 20,800 18,500$60,000–91,999 19,800 20,000 19,800$92,000 or more 20,800 22,800 19,700
See notes at end of table.

Section 9: Job Characteristics and Salaries in 2006
143
Table 9.2.—Median annual salaries of 2003–04 beginning postsecondary students who were employed and Table 9.2.—not enrolled in 2006, by student and institutional characteristics—Continued
Student and institutional characteristics Total Male FemaleFederal Pell Grant received in first year
Dependent Pell Grant recipients 18,000 20,000 17,000Independent Pell Grant recipients 20,400 23,900 19,800
‡ Reporting standards not met. (Too few cases for a reliable estimate.)NOTE: “Persistence and attainment anywhere” include students who transferred out of the first institution attended. “Degree” includescertificates in vocational programs. Full-time enrollment is 12 or more credits per term or 24 credits per year. Black includes AfricanAmerican, Hispanic includes Latino, American Indian includes Alaska Native, Pacific Islander includes Native Hawaiian, and Other includes respondents having origins in a race not listed. Pacific Islanders have been combined with Asians because of small sample sizes. Race categories exclude Hispanic origin unless specified. Dependent students were under age 24, unmarried, and had no dependents of their own in 2003. Family income of dependent students is the annual income of the parents in 2002. Categories represent the income quartile ranges of all dependent student families. This table includes students enrolled at postsecondary institutions in Puerto Rico.SOURCE: U.S. Department of Education, National Center for Education Statistics, 2003–04 Beginning Postsecondary StudentsLongitudinal Study, First Follow-up (BPS:04/06).

THIS PAGE INTENTIONALLY LEFT BLANK
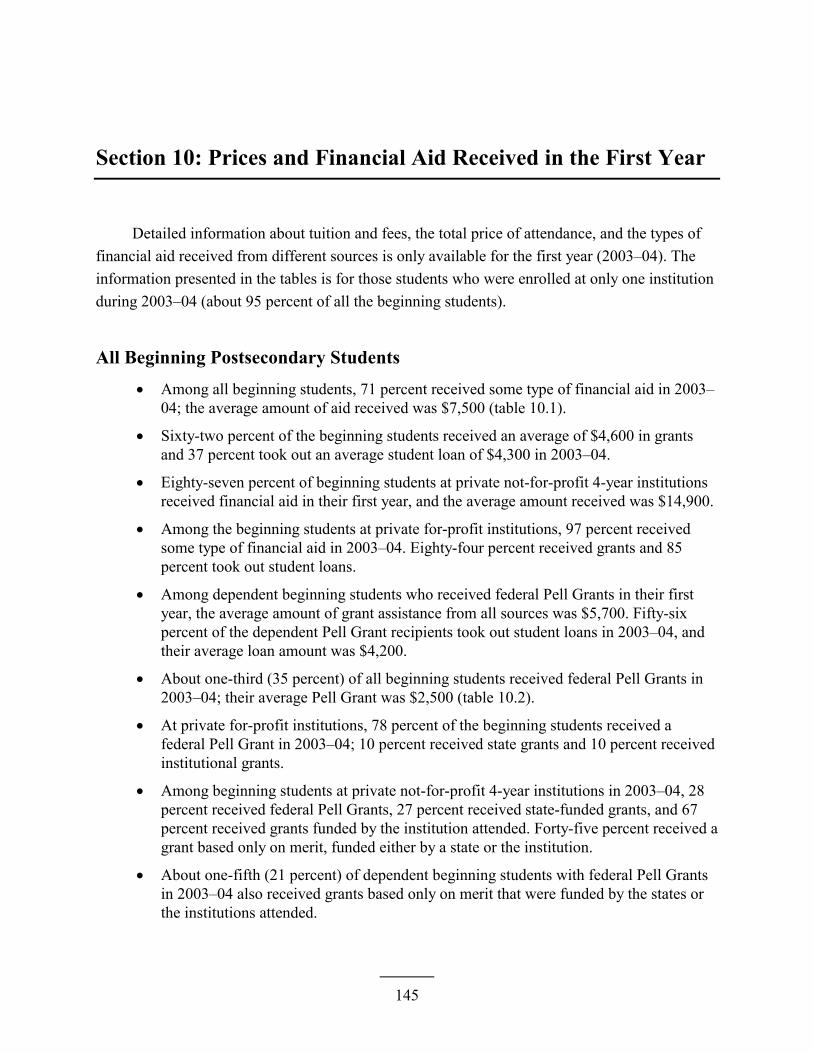
145
Section 10: Prices and Financial Aid Received in the First Year
Detailed information about tuition and fees, the total price of attendance, and the types of financial aid received from different sources is only available for the first year (2003–04). The information presented in the tables is for those students who were enrolled at only one institution during 2003–04 (about 95 percent of all the beginning students).
All Beginning Postsecondary Students
• Among all beginning students, 71 percent received some type of financial aid in 2003–04; the average amount of aid received was $7,500 (table 10.1).
• Sixty-two percent of the beginning students received an average of $4,600 in grants and 37 percent took out an average student loan of $4,300 in 2003–04.
• Eighty-seven percent of beginning students at private not-for-profit 4-year institutions received financial aid in their first year, and the average amount received was $14,900.
• Among the beginning students at private for-profit institutions, 97 percent received some type of financial aid in 2003–04. Eighty-four percent received grants and 85 percent took out student loans.
• Among dependent beginning students who received federal Pell Grants in their first year, the average amount of grant assistance from all sources was $5,700. Fifty-six percent of the dependent Pell Grant recipients took out student loans in 2003–04, and their average loan amount was $4,200.
• About one-third (35 percent) of all beginning students received federal Pell Grants in 2003–04; their average Pell Grant was $2,500 (table 10.2).
• At private for-profit institutions, 78 percent of the beginning students received a federal Pell Grant in 2003–04; 10 percent received state grants and 10 percent received institutional grants.
• Among beginning students at private not-for-profit 4-year institutions in 2003–04, 28 percent received federal Pell Grants, 27 percent received state-funded grants, and 67 percent received grants funded by the institution attended. Forty-five percent received a grant based only on merit, funded either by a state or the institution.
• About one-fifth (21 percent) of dependent beginning students with federal Pell Grants in 2003–04 also received grants based only on merit that were funded by the states or the institutions attended.

Section 10: Prices and Financial Aid Received in the First Year
146
Beginning Students Enrolled Full-Time/Full-Year
• The average tuition and fees charged full-time/full-year beginning students in 2003–04 ranged from $2,000 at public 2-year institutions to $18,900 at private not-for-profit 4-year institutions (table 10.3).
• The average price of attendance (which includes room and board, books, and other expenses as well as tuition and fees) for full-time/full-year beginning students in 2003–04 ranged from $9,700 at public 2-year institutions to $28,600 at private not-for-profit 4-year institutions.
• Among dependent full-time/full-year beginning students in 2003–04 whose family income was less than $32,000, 94 percent received financial aid in their first year; 93 percent received grants ($6,500 average) and 50 percent took out student loans ($4,200 average).
• Forty-two percent of all full-time/full-year 2003–04 beginning students received a federal Pell Grant in their first year; about one-third (34 percent) received institutional grants and about one-fourth (25 percent) received state grants (table 10.4).
• About one-fourth (24 percent) of all full-time/full-year beginning students received a grant based only on merit from institutional or state funds. At private not-for-profit 4-year institutions, about one-half (49 percent) of all full-time/full-year beginning students received a merit-only grant.
• About one-fourth (24 percent) of full-time/full-year dependent students who received federal Pell Grants in their first year also received merit-only grants from state or institutional sources.

Section 10: Prices and Financial Aid Received in the First Year
147
Table 10.1.—Among beginning postsecondary students, average tuition, average price of attendance, and Table 10.1.—percentage who received any financial aid, any grants, or any student loans and the average Table 10.1.—amounts received, by type of institution and selected student characteristics: 2003–04
Averagetotal
Average price ofStudent and institutional tuition atten- Average Average Averagecharacteristics and fees dance Percent amount Percent amount Percent amount
Total $5,600 $12,800 70.8 $7,500 61.7 $4,600 37.2 $4,300
Attendance status first yearFull-time/full-year 7,800 16,600 82.2 9,100 74.3 5,600 46.8 4,300Part-time or part-year 2,500 7,300 54.6 4,200 43.9 2,200 23.6 4,300
Type of first institution4-year
Public 5,100 13,900 76.2 7,300 64.5 4,600 42.2 3,700Private not-for-profit 17,200 26,300 87.0 14,900 81.6 9,900 55.3 4,800Private for-profit 9,000 16,500 97.2 10,700 77.2 4,200 90.5 6,000
2-yearPublic 1,200 6,600 52.6 2,900 45.3 2,300 11.9 2,700Private not-for-profit 6,700 14,200 89.6 8,900 79.1 5,800 49.0 5,000Private for-profit 8,800 16,300 95.8 9,900 79.9 3,600 91.4 5,800
Less-than-2-yearPublic 2,100 8,000 64.7 3,800 55.5 2,500 16.4 4,300Private for-profit 7,800 15,100 96.7 7,400 89.5 3,200 77.7 4,500
Level of first institution4-year 9,300 18,100 81.3 10,200 70.9 6,500 50.0 4,4002-year 2,100 7,700 57.5 4,200 49.3 2,600 20.2 4,200Less-than-2-year 6,900 14,000 91.8 6,900 84.3 3,100 67.0 4,500
Control of first institutionPublic 2,700 9,400 61.7 5,000 52.7 3,300 23.3 3,400Private not-for-profit 16,400 25,400 87.2 14,400 81.5 9,500 54.5 4,800Private for-profit 8,400 15,800 96.5 8,900 83.8 3,500 84.7 5,300
GenderMale 5,700 12,800 66.8 7,800 56.4 4,700 34.7 4,500Female 5,600 12,700 73.6 7,400 65.6 4,600 39.0 4,300
Age first year enrolled18 years or younger 7,000 14,900 72.4 8,800 64.3 5,700 38.4 4,10019 years 6,300 13,800 70.4 8,200 61.5 5,200 36.4 4,00020–23 years 3,900 9,900 67.9 5,700 56.9 3,100 38.8 4,30024–29 years 3,800 9,900 76.4 5,700 65.1 2,800 43.9 5,10030 or older 2,900 8,500 65.6 4,900 56.2 2,500 29.4 5,300
Race/ethnicityWhite 5,900 13,200 69.6 7,500 59.0 4,600 36.7 4,200Black 5,000 11,900 82.7 7,300 75.2 4,300 47.2 4,400Hispanic 4,500 11,100 68.4 7,100 62.6 4,200 34.4 4,600Asian/Pacific Islander 7,000 14,700 61.4 9,100 55.6 6,500 25.1 4,600American Indian 2,900 8,900 72.3 5,200 65.8 3,800 26.7 3,900Multiple races/other 6,000 13,500 68.9 8,400 60.7 5,000 38.2 4,700
See notes at end of table.
Total aid Total grants Student loans

Section 10: Prices and Financial Aid Received in the First Year
148
Table 10.1.—Among beginning postsecondary students, average tuition, average price of attendance, and Table 10.1.—percentage who received any financial aid, any grants, or any student loans and the average Table 10.1.—amounts received, by type of institution and selected student characteristics: 2003–04Table 10.1.——Continued
Averagetotal
Average price ofStudent and institutional tuition atten- Average Average Averagecharacteristics and fees dance Percent amount Percent amount Percent amount
Dependency status first yearDependent 6,500 14,200 70.4 8,400 61.3 5,400 37.2 4,000Independent 3,400 9,400 71.7 5,400 62.5 2,800 37.2 5,100
Unmarried, no dependents 3,600 9,600 69.5 6,000 56.1 2,900 39.7 5,400Single parent 4,000 10,300 80.8 5,800 77.4 3,100 43.7 4,700Married 2,800 8,400 64.5 4,700 52.6 2,400 29.8 5,200
Dependent student family income Less than $32,000 5,500 12,600 85.4 8,200 82.6 5,600 41.6 4,100$32,000–59,999 5,800 13,300 73.4 8,600 65.8 5,300 41.8 4,200$60,000–91,999 6,100 13,800 62.8 8,300 49.1 4,900 36.4 4,000$92,000 or more 9,100 17,600 59.7 8,600 46.9 5,700 28.6 3,800
Admissions test taken (ACT/SAT)1
Did not take tests 3,700 9,700 64.1 5,800 55.7 3,000 35.2 4,200Took tests 6,900 14,900 72.9 8,700 64.0 5,600 38.6 4,100
Admissions test scores (ACT/SAT)1
Lowest 4,200 11,000 72.4 6,900 63.8 4,200 37.6 4,200Low middle 5,200 12,600 68.7 7,900 58.2 4,800 37.9 4,200High middle 7,100 15,300 72.7 8,900 63.2 5,700 40.0 4,000Highest 11,400 20,700 78.2 10,900 71.4 7,700 38.9 4,000
Federal Pell Grant received in first yearDependent Pell Grant recipients 6,400 14,300 100.0 9,100 100.0 5,700 56.2 4,200Independent Pell Grant recipients 5,000 12,000 100.0 6,300 100.0 3,100 58.7 5,000
1 Beginners under age 24 only.NOTE: The total price of attendance includes tuition and fees, room and board, and other expenses as estimated by the institutions.Aid averages are for those who received the specified type of aid. “Total aid” includes all types of financial aid from any source except parents, friends, or relatives. It also does not include federal tax credits for education (Hope and Lifetime Learning). “Total grants” include grants, scholarships or tuition waivers from federal, state, institutional, or private sources, including employers. “Student loans” may be from any source, but exclude other forms of financing such as credit cards, home equity loans, loans from individuals, and federal Parent Loans for Undergraduate Students (PLUS). Federal PLUS loans and other types of aid such as veterans’ benefits and job training funds are included in total aid. Students may receive more than one type of aid. Full-time/full-year students were enrolled full time for 9 or more months from July 1, 2003 to June 30, 2004. Independent students are age 24 or over and students under 24 who are married, have dependents, are veterans, or are an orphan or ward of the courts. Other undergraduates under age 24 are considered to be dependent. For dependent students, income is the income of their parents. Income is total income in 2002. Prior year (2002) income is used in federal need analysis. Estimates include students at postsecondary institutions in Puerto Rico. The table only includes students enrolled at one institution in 2003–04.SOURCE: U.S. Department of Education, National Center for Education Statistics, 2003–04 Beginning Postsecondary StudentsLongitudinal Study, First Follow-up (BPS:04/06).
Total aid Total grants Student loans
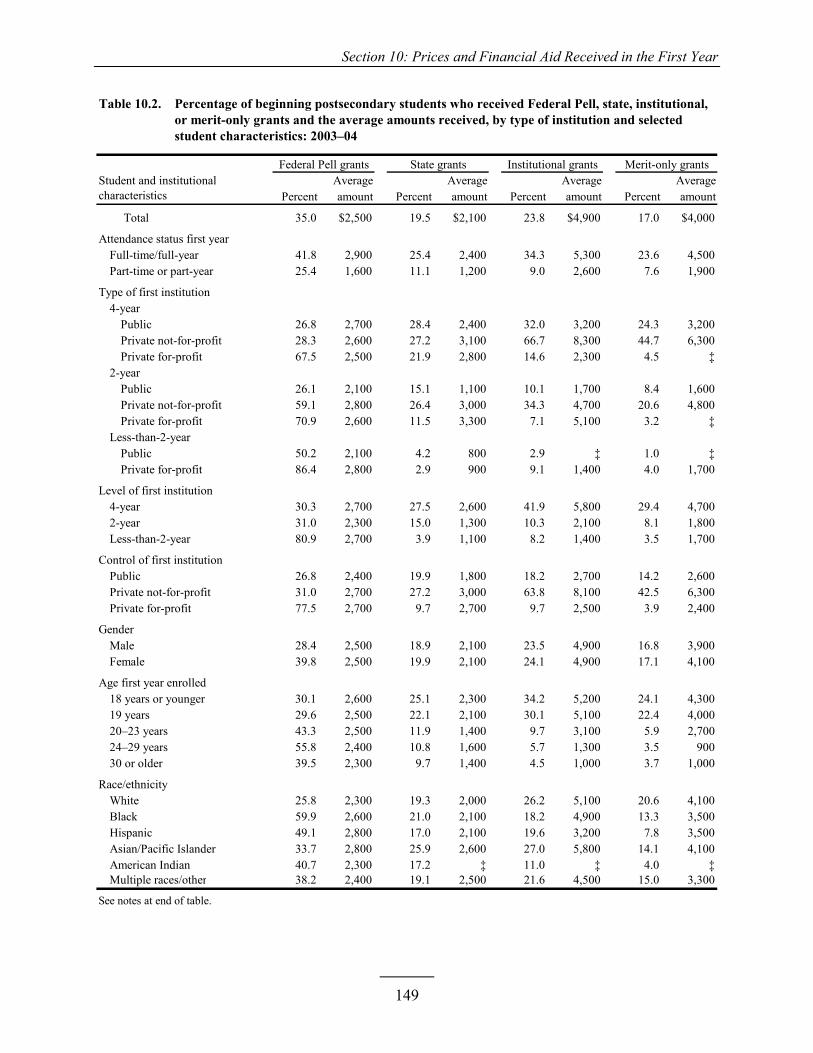
Section 10: Prices and Financial Aid Received in the First Year
149
Table 10.2.—Percentage of beginning postsecondary students who received Federal Pell, state, institutional, Table 10.2.—or merit-only grants and the average amounts received, by type of institution and selected Table 10.2.—student characteristics: 2003–04
Student and institutional Average Average Average Averagecharacteristics Percent amount Percent amount Percent amount Percent amount
Total 35.0 $2,500 19.5 $2,100 23.8 $4,900 17.0 $4,000
Attendance status first yearFull-time/full-year 41.8 2,900 25.4 2,400 34.3 5,300 23.6 4,500Part-time or part-year 25.4 1,600 11.1 1,200 9.0 2,600 7.6 1,900
Type of first institution4-year
Public 26.8 2,700 28.4 2,400 32.0 3,200 24.3 3,200Private not-for-profit 28.3 2,600 27.2 3,100 66.7 8,300 44.7 6,300Private for-profit 67.5 2,500 21.9 2,800 14.6 2,300 4.5 ‡
2-yearPublic 26.1 2,100 15.1 1,100 10.1 1,700 8.4 1,600Private not-for-profit 59.1 2,800 26.4 3,000 34.3 4,700 20.6 4,800Private for-profit 70.9 2,600 11.5 3,300 7.1 5,100 3.2 ‡
Less-than-2-yearPublic 50.2 2,100 4.2 800 2.9 ‡ 1.0 ‡Private for-profit 86.4 2,800 2.9 900 9.1 1,400 4.0 1,700
Level of first institution4-year 30.3 2,700 27.5 2,600 41.9 5,800 29.4 4,7002-year 31.0 2,300 15.0 1,300 10.3 2,100 8.1 1,800Less-than-2-year 80.9 2,700 3.9 1,100 8.2 1,400 3.5 1,700
Control of first institutionPublic 26.8 2,400 19.9 1,800 18.2 2,700 14.2 2,600Private not-for-profit 31.0 2,700 27.2 3,000 63.8 8,100 42.5 6,300Private for-profit 77.5 2,700 9.7 2,700 9.7 2,500 3.9 2,400
GenderMale 28.4 2,500 18.9 2,100 23.5 4,900 16.8 3,900Female 39.8 2,500 19.9 2,100 24.1 4,900 17.1 4,100
Age first year enrolled18 years or younger 30.1 2,600 25.1 2,300 34.2 5,200 24.1 4,30019 years 29.6 2,500 22.1 2,100 30.1 5,100 22.4 4,00020–23 years 43.3 2,500 11.9 1,400 9.7 3,100 5.9 2,70024–29 years 55.8 2,400 10.8 1,600 5.7 1,300 3.5 90030 or older 39.5 2,300 9.7 1,400 4.5 1,000 3.7 1,000
Race/ethnicityWhite 25.8 2,300 19.3 2,000 26.2 5,100 20.6 4,100Black 59.9 2,600 21.0 2,100 18.2 4,900 13.3 3,500Hispanic 49.1 2,800 17.0 2,100 19.6 3,200 7.8 3,500Asian/Pacific Islander 33.7 2,800 25.9 2,600 27.0 5,800 14.1 4,100American Indian 40.7 2,300 17.2 ‡ 11.0 ‡ 4.0 ‡Multiple races/other 38.2 2,400 19.1 2,500 21.6 4,500 15.0 3,300
See notes at end of table.
Federal Pell grants State grants Institutional grants Merit-only grants

Section 10: Prices and Financial Aid Received in the First Year
150
Table 10.2.—Percentage of beginning postsecondary students who received Federal Pell, state, institutional, Table 10.2.—or merit-only grants and the average amounts received, by type of institution and selected Table 10.2.—student characteristics: 2003–04—Continued
Student and institutional Average Average Average Averagecharacteristics Percent amount Percent amount Percent amount Percent amount
Dependency status first yearDependent 28.9 2,600 22.9 2,200 31.2 5,100 22.2 4,200Independent 49.6 2,400 11.2 1,500 6.1 1,600 4.3 1,400
Unmarried, no dependents 41.6 2,300 12.7 1,800 7.9 2,600 4.3 2,900Single parent 69.5 2,600 12.7 1,600 6.7 1,200 4.2 1,000Married 36.1 2,100 8.8 1,100 4.4 1,100 4.4 1,000
Dependent student family income Less than $32,000 72.6 3,000 33.1 2,300 29.1 4,000 16.5 3,400$32,000–59,999 36.9 1,700 28.5 2,300 34.1 5,100 22.2 3,900$60,000–91,999 1.9 1,200 18.2 2,000 31.1 5,300 24.0 4,200$92,000 or more # ‡ 10.8 2,200 30.9 6,300 27.2 5,100
Admissions test taken (ACT/SAT)1
Did not take tests 44.5 2,500 12.6 1,400 10.8 1,700 5.7 1,700Took tests 28.8 2,600 24.5 2,300 33.8 5,300 24.6 4,300
Admissions test scores (ACT/SAT)1
Lowest 46.5 2,700 23.4 1,900 21.6 3,200 13.1 2,600Low middle 29.6 2,600 23.1 2,100 27.2 4,000 20.1 3,100High middle 23.5 2,500 26.7 2,300 36.6 5,100 26.6 4,200Highest 15.7 2,500 25.2 2,700 50.4 7,200 38.9 5,600
Federal Pell Grant received in first yearDependent Pell Grant recipients 100.0 2,600 41.9 2,300 37.4 4,200 21.1 3,400Independent Pell Grant recipients 100.0 2,400 15.9 1,700 7.8 1,500 4.1 1,500
# Round to zero.‡ Reporting standards not met. (Too few cases for a reliable estimate.)1 Beginners under age 24 only.NOTE: Aid averages are for those who received the specified type of aid. Federal Pell grants are based only on need. State and institutional grants include any grants, scholarships, or tuition waivers based on need, merit, or both, that are funded by a state or by the institution attended, respectively. Merit-only grants are grants from state or institutional sources based only on academic, athletic, or other special talents. Students may receive grants from more than one source. Full-time/full-year students were enrolled full time for 9 ormore months from July 1, 2003 to June 30, 2004. Independent students are age 24 or over and students under 24 who are married, have dependents, are veterans, or are an orphan or ward of the courts. Other undergraduates under age 24 are considered to be dependent. For dependent students, income is the income of their parents. Income is total income in 2002. Prior year (2002) income is used in federalneed analysis. Estimates include students at postsecondary institutions in Puerto Rico. The table only includes students enrolled at one institution in 2003–04.SOURCE: U.S. Department of Education, National Center for Education Statistics, 2003–04 Beginning Postsecondary StudentsLongitudinal Study, First Follow-up (BPS:04/06).
Federal Pell grants State grants Institutional grants Merit-only grants

Section 10: Prices and Financial Aid Received in the First Year
151
Table 10.3.—Among full-time/full-year beginning postsecondary students, average tuition, price of Table 10.3.—attendance, and percentage who received any financial aid, grants, and loans and the average Table 10.3.—amounts received, by type of institution and selected student characteristics: 2003–04
Averagetotal
Average price ofStudent and institutional tuition atten- Average Average Averagecharacteristics and fees dance Percent amount Percent amount Percent amount
Total full-time/full-year $7,800 $16,600 82.2 $9,100 74.3 $5,600 46.8 $4,300
Type of first institution4-year
Public 5,500 14,900 79.4 7,700 68.1 4,900 44.5 3,700Private not-for-profit 18,900 28,600 90.4 16,200 85.6 10,800 59.7 4,800Private for-profit 11,900 20,700 98.9 13,000 86.9 5,000 95.6 6,000
2-yearPublic 2,000 9,700 69.1 4,000 62.9 3,300 16.9 2,800Private not-for-profit 8,000 16,300 94.7 9,500 90.4 6,300 46.7 5,200Private for-profit 10,100 18,700 98.5 11,000 87.4 4,100 95.5 5,900
Less-than-2-yearPublic 3,500 12,100 88.6 5,000 77.4 3,200 31.7 4,600Private for-profit 8,400 16,500 99.7 7,800 98.8 3,500 79.9 4,400
Level of first institution4-year 10,100 19,500 83.8 11,000 74.6 7,000 51.8 4,3002-year 3,400 11,300 74.5 5,700 67.6 3,600 30.1 4,400Less-than-2-year 7,800 16,000 98.4 7,500 96.2 3,500 73.1 4,400
Control of first institutionPublic 4,100 12,800 75.4 6,300 66.1 4,200 33.3 3,500Private not-for-profit 18,200 27,800 90.7 15,700 85.9 10,400 58.6 4,800Private for-profit 9,600 18,000 99.2 9,800 93.0 4,000 87.7 5,200
GenderMale 8,000 17,000 79.3 9,300 69.9 5,600 45.8 4,400Female 7,600 16,400 84.3 8,900 77.6 5,600 47.6 4,300
Age first year enrolled18 years or younger 8,400 17,400 80.5 9,700 72.4 6,300 44.8 4,10019 years 7,900 16,700 79.6 9,200 70.9 5,900 44.0 4,00020–23 years 6,300 14,500 84.2 7,400 78.1 4,000 54.1 4,60024–29 years 6,400 14,800 95.2 7,500 88.4 3,700 63.5 5,50030 or older 6,000 14,500 94.3 7,000 89.2 3,700 52.6 5,600
Race/ethnicityWhite 8,100 16,900 79.5 9,000 70.0 5,600 45.5 4,200Black 7,100 15,800 93.5 9,200 89.0 5,500 60.0 4,600Hispanic 6,600 15,200 87.9 8,400 83.3 5,200 46.5 4,500Asian/Pacific Islander 9,400 18,800 76.6 10,200 71.6 7,200 33.1 4,500American Indian 5,400 14,300 72.2 9,000 69.6 6,800 35.9 ‡Multiple races/other 8,000 17,200 79.3 10,000 71.3 5,900 48.3 4,800
See notes at end of table.
Total aid Total grants Student loans
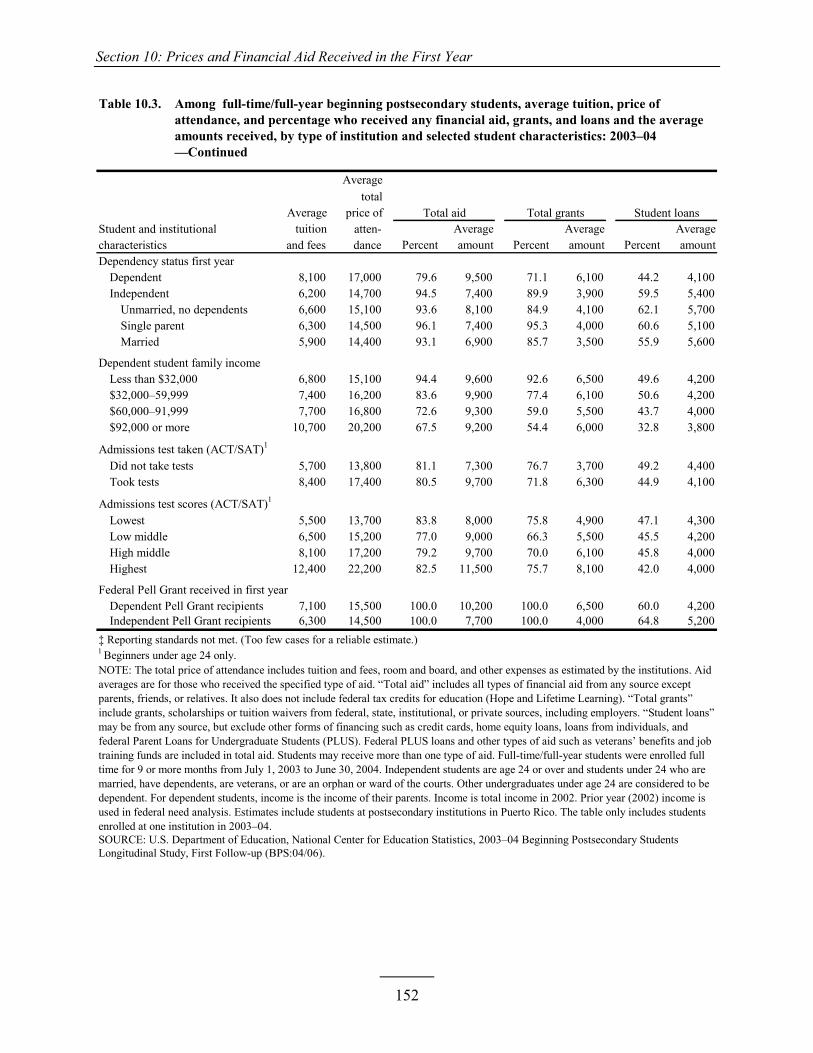
Section 10: Prices and Financial Aid Received in the First Year
152
Table 10.3.—Among full-time/full-year beginning postsecondary students, average tuition, price of Table 10.3.—attendance, and percentage who received any financial aid, grants, and loans and the average Table 10.3.—amounts received, by type of institution and selected student characteristics: 2003–04Table 10.3.——Continued
Averagetotal
Average price ofStudent and institutional tuition atten- Average Average Averagecharacteristics and fees dance Percent amount Percent amount Percent amountDependency status first year
Dependent 8,100 17,000 79.6 9,500 71.1 6,100 44.2 4,100Independent 6,200 14,700 94.5 7,400 89.9 3,900 59.5 5,400
Unmarried, no dependents 6,600 15,100 93.6 8,100 84.9 4,100 62.1 5,700Single parent 6,300 14,500 96.1 7,400 95.3 4,000 60.6 5,100Married 5,900 14,400 93.1 6,900 85.7 3,500 55.9 5,600
Dependent student family income Less than $32,000 6,800 15,100 94.4 9,600 92.6 6,500 49.6 4,200$32,000–59,999 7,400 16,200 83.6 9,900 77.4 6,100 50.6 4,200$60,000–91,999 7,700 16,800 72.6 9,300 59.0 5,500 43.7 4,000$92,000 or more 10,700 20,200 67.5 9,200 54.4 6,000 32.8 3,800
Admissions test taken (ACT/SAT)1
Did not take tests 5,700 13,800 81.1 7,300 76.7 3,700 49.2 4,400Took tests 8,400 17,400 80.5 9,700 71.8 6,300 44.9 4,100
Admissions test scores (ACT/SAT)1
Lowest 5,500 13,700 83.8 8,000 75.8 4,900 47.1 4,300Low middle 6,500 15,200 77.0 9,000 66.3 5,500 45.5 4,200High middle 8,100 17,200 79.2 9,700 70.0 6,100 45.8 4,000Highest 12,400 22,200 82.5 11,500 75.7 8,100 42.0 4,000
Federal Pell Grant received in first yearDependent Pell Grant recipients 7,100 15,500 100.0 10,200 100.0 6,500 60.0 4,200Independent Pell Grant recipients 6,300 14,500 100.0 7,700 100.0 4,000 64.8 5,200
‡ Reporting standards not met. (Too few cases for a reliable estimate.)1 Beginners under age 24 only.NOTE: The total price of attendance includes tuition and fees, room and board, and other expenses as estimated by the institutions. Aid averages are for those who received the specified type of aid. “Total aid” includes all types of financial aid from any source exceptparents, friends, or relatives. It also does not include federal tax credits for education (Hope and Lifetime Learning). “Total grants” include grants, scholarships or tuition waivers from federal, state, institutional, or private sources, including employers. “Student loans” may be from any source, but exclude other forms of financing such as credit cards, home equity loans, loans from individuals, and federal Parent Loans for Undergraduate Students (PLUS). Federal PLUS loans and other types of aid such as veterans’ benefits and job training funds are included in total aid. Students may receive more than one type of aid. Full-time/full-year students were enrolled full time for 9 or more months from July 1, 2003 to June 30, 2004. Independent students are age 24 or over and students under 24 who are married, have dependents, are veterans, or are an orphan or ward of the courts. Other undergraduates under age 24 are considered to be dependent. For dependent students, income is the income of their parents. Income is total income in 2002. Prior year (2002) income is used in federal need analysis. Estimates include students at postsecondary institutions in Puerto Rico. The table only includes students enrolled at one institution in 2003–04.SOURCE: U.S. Department of Education, National Center for Education Statistics, 2003–04 Beginning Postsecondary StudentsLongitudinal Study, First Follow-up (BPS:04/06).
Total aid Total grants Student loans

Section 10: Prices and Financial Aid Received in the First Year
153
Table 10.4.—Percentage of full-time/full-year beginning postsecondary students who received Federal Pell, Table 10.4.—state, institutional, or merit-only grants and the average amounts received, by type of Table 10.4.—institution and selected student characteristics: 2003–04
Student and institutional Average Average Average Averagecharacteristics Percent amount Percent amount Percent amount Percent amount
Total full-time/full-year 41.8 $2,900 25.4 $2,400 34.3 $5,300 23.6 $4,500
Type of first institution4-year
Public 28.2 2,900 30.8 2,400 35.7 3,200 26.6 3,300Private not-for-profit 30.6 2,800 30.9 3,200 72.1 8,800 48.8 6,700Private for-profit 76.1 2,900 32.3 2,500 19.6 2,800 6.6 ‡
2-yearPublic 40.2 2,900 22.5 1,200 18.3 2,100 12.5 2,100Private not-for-profit 67.3 3,200 29.4 3,300 42.6 5,000 26.3 5,100Private for-profit 77.0 2,800 11.7 3,900 9.5 5,600 4.0 ‡
Less-than-2-yearPublic 74.4 2,600 6.9 900 5.5 ‡ 2.0 ‡Private for-profit 96.9 3,100 3.8 900 11.6 1,500 4.8 1,700
Level of first institution4-year 31.2 2,900 30.9 2,700 46.7 6,000 32.8 4,9002-year 46.8 2,900 21.0 1,600 17.8 2,600 11.7 2,400Less-than-2-year 94.2 3,000 5.1 1,100 11.0 1,500 4.4 1,700
Control of first institutionPublic 33.7 2,900 27.1 2,000 28.3 2,900 20.6 3,000Private not-for-profit 33.2 2,900 30.9 3,200 69.8 8,600 47.1 6,600Private for-profit 86.8 3,000 11.5 2,700 12.4 2,900 4.9 2,800
GenderMale 35.9 2,800 25.5 2,400 33.6 5,300 23.6 4,300Female 46.1 3,000 25.4 2,300 34.9 5,300 23.6 4,600
Age first year enrolled18 years or younger 33.6 2,900 29.2 2,500 41.0 5,600 28.6 4,60019 years 34.1 2,800 26.0 2,300 38.8 5,300 28.0 4,30020–23 years 64.2 3,100 15.1 1,900 15.2 3,700 6.7 4,20024–29 years 83.8 3,000 14.5 2,300 6.5 1,500 2.6 ‡30 or older 79.1 2,900 15.0 1,900 8.5 1,100 3.1 ‡
Race/ethnicityWhite 30.1 2,700 24.2 2,300 36.8 5,500 27.9 4,600Black 72.3 3,100 25.9 2,500 27.8 5,500 16.5 4,600Hispanic 67.3 3,200 26.8 2,300 29.0 3,700 12.6 3,700Asian/Pacific Islander 43.9 3,100 35.4 2,800 37.9 5,900 18.9 4,400American Indian 60.4 2,800 22.3 ‡ 28.8 ‡ 10.0 ‡Multiple races/other 43.4 2,700 25.7 2,700 28.3 5,200 20.5 3,500
Dependency status first yearDependent 33.5 2,800 27.4 2,400 39.5 5,500 27.7 4,500Independent 81.8 3,100 16.0 2,200 9.5 2,100 3.9 2,600
Unmarried, no dependents 68.8 3,000 18.5 2,800 12.1 4,000 5.0 5,400Single parent 92.5 3,300 15.9 2,200 8.7 1,300 3.2 ‡Married 76.2 2,700 14.2 1,500 8.8 1,200 4.2 ‡
See notes at end of table.
Federal Pell grants State grants Institutional grants Merit-only grants

Section 10: Prices and Financial Aid Received in the First Year
154
Table 10.4.—Percentage of full-time/full-year beginning postsecondary students who received Federal Pell, Table 10.4.—state, institutional, or merit-only grants and the average amounts received, by type of Table 10.4.—institution and selected student characteristics: 2003–04—Continued
Student and institutional Average Average Average Averagecharacteristics Percent amount Percent amount Percent amount Percent amountDependent student family income
Less than $32,000 84.4 3,300 40.0 2,500 36.4 4,400 20.6 3,700$32,000–59,999 44.4 1,900 34.6 2,500 44.2 5,400 28.1 4,200$60,000–91,999 2.2 1,200 22.1 2,200 39.9 5,600 30.2 4,500$92,000 or more # ‡ 12.2 2,400 37.4 6,500 32.1 5,300
Admissions test taken (ACT/SAT)1
Did not take tests 67.2 3,000 16.7 1,600 15.8 2,000 6.4 2,400Took tests 31.9 2,900 28.4 2,500 41.2 5,600 29.4 4,600
Admissions test scores (ACT/SAT)1
Lowest 57.0 3,100 30.4 2,100 28.0 3,400 16.1 2,900Low middle 34.2 2,900 26.4 2,400 34.3 4,400 23.9 3,400High middle 26.8 2,600 30.4 2,500 43.1 5,200 30.9 4,400Highest 16.6 2,600 27.2 2,800 55.2 7,400 42.4 5,800
Federal Pell Grant received in first yearDependent Pell Grant recipients 100.0 2,800 44.4 2,500 42.2 4,400 23.7 3,600Independent Pell Grant recipients 100.0 3,100 17.3 2,100 8.7 1,700 3.5 2,000
# Round to zero.‡ Reporting standards not met. (Too few cases for a reliable estimate.)1 Beginners under age 24 only.NOTE: Aid averages are for those who received the specified type of aid. Federal Pell grants are based only on need. State and institutional grants include any grants, scholarships, or tuition waivers based on need, merit, or both, that are funded by a state or by the institution attended, respectively. Merit-only grants are grants from state or institutional sources based only on academic, athletic, or other special talents. Students may receive grants from more than one source. Full-time/full-year students were enrolled full time for 9 or more months from July 1, 2003 to June 30, 2004. Independent students are age 24 or over and students under 24 who are married, have dependents, are veterans, or are an orphan or ward of the courts. Other undergraduates under age 24 are considered to be dependent. For dependent students, income is the income of their parents. Income is total income in 2002. Prior year (2002) income is used in federal need analysis. Estimates include students at postsecondary institutions in Puerto Rico. The table only includes students enrolled at one institution in 2003–04.SOURCE: U.S. Department of Education, National Center for Education Statistics, 2003–04 Beginning Postsecondary StudentsLongitudinal Study, First Follow-up (BPS:04/06).
Federal Pell grants State grants Institutional grants Merit-only grants

A-1
Appendix A—Glossary
All variables used in this report are described in this glossary. Variables were taken directly from the 2004/06 Beginning Postsecondary Students Longitudinal Study (BPS:04/06) Data Analysis System (DAS), an NCES software application that generates tables from the BPS:04/06 data (see appendix B for a description of the DAS). The index below organizes the variables by category. The glossary items are listed in alphabetical order by variable name in the DAS (displayed in letters along the right-hand side of each column).
Glossary Index INSTITUTIONAL CHARACTERISTICS Level of first institution .....................................FLEVEL Control of first institution .......................... FCONTROL Doctorate-granting status of first institution ...FSECDOC Type of first institution ...................................FSECTOR ENROLLMENT CHARACTERISTICS Degree plans first year .................................. DGPLNY1 Enrollment intensity through 2006 ............... ENINPT3Y Recent (2003) high school graduates enrolled
full time in fall 2003 .................................FALLHSFT Transfer and degree plans..............................DGTRNY1 Type of associate’s degree............................UGDEGAA Transfer status through June 2006.................TFNUM3Y Attendance pattern first year........................ATTNSTAT STUDENT CHARACTERISTICS Age first year enrolled ............................................. AGE Dependency status first year ........................DEPEND5B Highest education of parents .........................PAREDUC Dependent student family income .................... DEPINC Gender ............................................................. GENDER Any disability ..................................................DISABLE Race/ethnicity ........................................................RACE Federal Pell Grant received in first year ......... PELLDEP ACADEMIC PREPARATION Admissions test taken (ACT/SAT) .................. TETOOK Admissions test scores (ACT/SAT)............. TESATDER High school grade point average (GPA)......HCGPAREP Highest level of high school mathematics ...... HCMATH Advanced Placement credits accepted ........... CRDAP04 Earned credits for courses at a college while in high school.............................................. CRDCL04 Earned any college-level credits in high
school.......................................................... CRDHS04 Type of high school .......................................... HSTYPE
STUDENT EXPERIENCES FIRST YEAR 2003–04 Graduate student instructors .......................... ACAD04A Essay exams................................................... ACAD04B Large classes.................................................. ACAD04C Wrote papers ................................................. ACAD04D Informal contact with faculty .......................... FREQ04A Talked with faculty about academic
matters outside of class ............................... FREQ04B Met with academic advisor ............................. FREQ04C Attended fine arts activities ............................ FREQ04D Participated in school clubs .............................FREQ04E Participated in school sports ............................FREQ04F Attended study groups .................................... FREQ04G Worked while enrolled in 2003–04 ................ JOBENR2 COURSES TAKEN FIRST YEAR 2003–04 Distance education courses .......................... DISTEDUC Any remedial courses 2003–04..................REMETOOK Remedial English........................................... REMEDIA Remedial mathematics ................................... REMEDIB Remedial reading ........................................... REMEDIC Remedial study skills .....................................REMEDID Remedial writing............................................ REMEDIE ACADEMIC PERFORMANCE THROUGH 2006 Ever received an incomplete 2006................CINCMP06 Ever repeated course for higher grade 2006 ...... CRPT06 Ever withdrew after add/drop deadline
2006 .......................................................... CWTHD06 Ever changed major 2006 ............................MAJ06CHG PERSISTENCE AND ATTAINMENT THROUGH 2006 Highest degree attained at the first institution
through 2006 ............................................ATHTYF3Y Highest degree attained anywhere through
2006 ..........................................................ATHTY3Y Retention at the first institution through
2006 ...........................................................PROUTF3
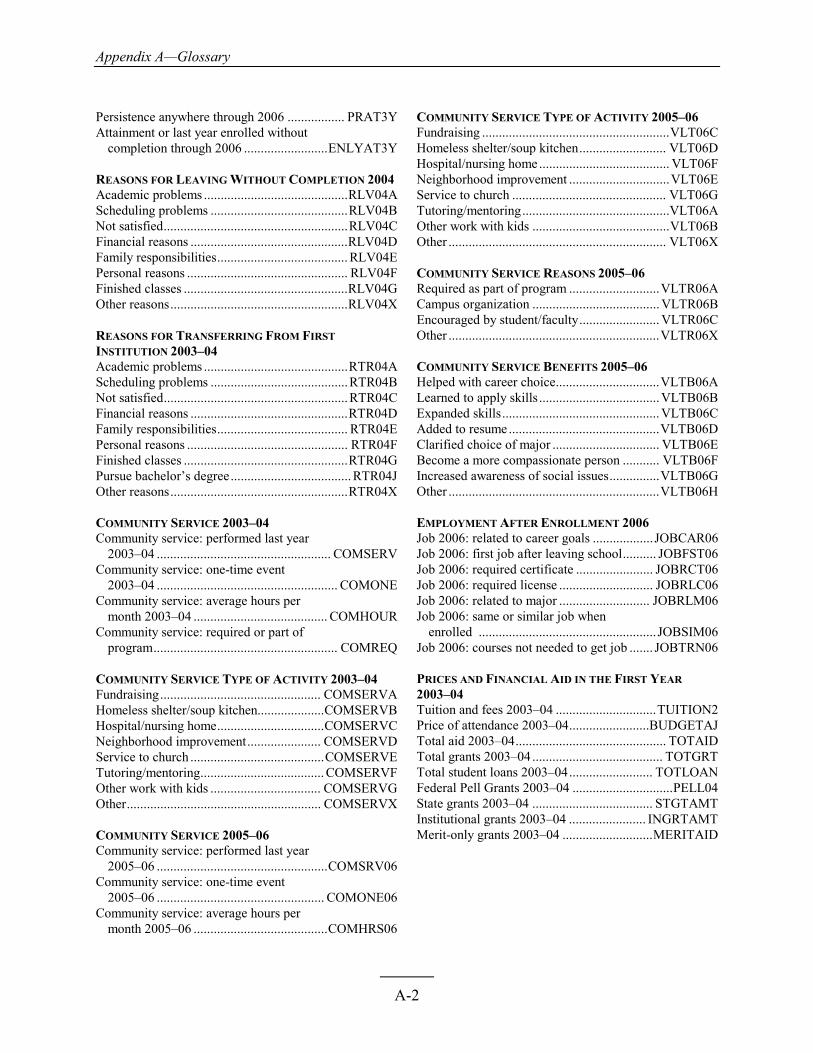
Appendix A—Glossary
A-2
Persistence anywhere through 2006 ................. PRAT3Y Attainment or last year enrolled without
completion through 2006 .........................ENLYAT3Y REASONS FOR LEAVING WITHOUT COMPLETION 2004 Academic problems ...........................................RLV04A Scheduling problems .........................................RLV04B Not satisfied.......................................................RLV04C Financial reasons ...............................................RLV04D Family responsibilities....................................... RLV04E Personal reasons ................................................ RLV04F Finished classes .................................................RLV04G Other reasons.....................................................RLV04X REASONS FOR TRANSFERRING FROM FIRST INSTITUTION 2003–04 Academic problems ...........................................RTR04A Scheduling problems .........................................RTR04B Not satisfied.......................................................RTR04C Financial reasons ...............................................RTR04D Family responsibilities....................................... RTR04E Personal reasons ................................................ RTR04F Finished classes .................................................RTR04G Pursue bachelor’s degree.................................... RTR04J Other reasons.....................................................RTR04X COMMUNITY SERVICE 2003–04 Community service: performed last year
2003–04 .................................................... COMSERV Community service: one-time event
2003–04 ...................................................... COMONE Community service: average hours per
month 2003–04 ........................................ COMHOUR Community service: required or part of
program....................................................... COMREQ COMMUNITY SERVICE TYPE OF ACTIVITY 2003–04 Fundraising................................................ COMSERVA Homeless shelter/soup kitchen....................COMSERVB Hospital/nursing home................................COMSERVC Neighborhood improvement...................... COMSERVD Service to church ........................................COMSERVE Tutoring/mentoring..................................... COMSERVF Other work with kids ................................. COMSERVG Other.......................................................... COMSERVX COMMUNITY SERVICE 2005–06 Community service: performed last year
2005–06 ...................................................COMSRV06 Community service: one-time event
2005–06 .................................................. COMONE06 Community service: average hours per
month 2005–06 ........................................COMHRS06
COMMUNITY SERVICE TYPE OF ACTIVITY 2005–06 Fundraising ........................................................VLT06C Homeless shelter/soup kitchen.......................... VLT06D Hospital/nursing home ....................................... VLT06F Neighborhood improvement ..............................VLT06E Service to church .............................................. VLT06G Tutoring/mentoring............................................VLT06A Other work with kids .........................................VLT06B Other ................................................................. VLT06X COMMUNITY SERVICE REASONS 2005–06 Required as part of program ...........................VLTR06A Campus organization ...................................... VLTR06B Encouraged by student/faculty........................ VLTR06C Other ...............................................................VLTR06X COMMUNITY SERVICE BENEFITS 2005–06 Helped with career choice...............................VLTB06A Learned to apply skills ....................................VLTB06B Expanded skills............................................... VLTB06C Added to resume .............................................VLTB06D Clarified choice of major ................................ VLTB06E Become a more compassionate person ........... VLTB06F Increased awareness of social issues...............VLTB06G Other ...............................................................VLTB06H EMPLOYMENT AFTER ENROLLMENT 2006 Job 2006: related to career goals .................. JOBCAR06 Job 2006: first job after leaving school.......... JOBFST06 Job 2006: required certificate ....................... JOBRCT06 Job 2006: required license ............................ JOBRLC06 Job 2006: related to major ........................... JOBRLM06 Job 2006: same or similar job when
enrolled ..................................................... JOBSIM06 Job 2006: courses not needed to get job ....... JOBTRN06 PRICES AND FINANCIAL AID IN THE FIRST YEAR 2003–04 Tuition and fees 2003–04 ..............................TUITION2 Price of attendance 2003–04........................BUDGETAJ Total aid 2003–04............................................. TOTAID Total grants 2003–04....................................... TOTGRT Total student loans 2003–04......................... TOTLOAN Federal Pell Grants 2003–04 ..............................PELL04 State grants 2003–04 .................................... STGTAMT Institutional grants 2003–04 ....................... INGRTAMT Merit-only grants 2003–04 ...........................MERITAID
Appendix A—Glossary DAS Variable Name
A-3
Student experiences first year 2003–04 ACAD04A–D During the 2004 interview, students enrolled at 4-year institutions were asked the following questions about their academic experience, “During the 2003–2004 school year at [institution name], please indicate whether you did the following never, sometimes or often.”
Never Sometimes Often
Graduate student instructors ACAD04A Attended classes taught by a graduate student instructor in 2003–04. Essay exams ACAD04B Wrote essay answers as part of exam in 2003–04. Large classes ACAD04C Attended large lecture classes in 2003–04. Wrote papers ACAD04D Wrote papers for courses in 2003–04. Age first year enrolled AGE Indicates the student’s age on December 31, 2003.
18 years or younger 19 years 20–23 years 24–29 years 30 years or older
Highest degree attained anywhere through 2006 ATHTY3Y Indicates the highest degree attained by the student at any postsecondary institution by June 2006.
Certificate The student’s highest level of attainment at any institution by
June 2006 was a vocational certificate. Associate’s degree The student’s highest level of attainment at any institution by
June 2006 was an associate’s degree.

Appendix A—Glossary DAS Variable Name
A-4
Highest degree attained anywhere through 2006—continued ATHTY3Y Bachelor’s degree The student’s highest level of attainment at any institution by
June 2006 was a bachelor’s degree.
Any degree The student had attained a certificate, an associate’s degree, or a bachelor’s degree at some postsecondary institution by June 2006.
Highest degree attained at the first institution through 2006 ATHTYF3Y Indicates the highest degree attainment by the student at the first institution attended as of June 2006.
Any degree The student had attained a certificate, an associate’s degree, or a
bachelor’s degree by June 2006 at the first institution attended. Certificate The student’s highest level of attainment by June 2006 at the first
institution attended was a vocational certificate. Associate’s degree The student’s highest level of attainment by June 2006 at the first
institution attended was an associate’s degree. Bachelor’s degree The student’s highest level of attainment by June 2006 at the first
institution attended was a bachelor’s degree. Attendance pattern first year ATTNSTAT Combined attendance intensity and persistence at all institutions during 2003–04. Intensity refers to the student’s full- or part-time attendance while enrolled. Persistence refers to the number of months a student was enrolled during the year. Students were considered to have been enrolled for a full year if they were enrolled 9 or more months during 2003–04. Months did not have to be contiguous or at the same institution, and students did not have to be enrolled for a full month in order to be considered enrolled for that month.
Full-time/full-year Student was enrolled full time for at least 9 months during 2003–04. Additional months enrolled could be part time (during the summer, for example).
Full-time/part-year Student was enrolled full time for less than 9 months during
2003–04 but attended full time in all of these months. Part-time/full-year Student was enrolled 9 or more months during 2003–04, but less
than 9 months were full time. Part-time/part-year Student was enrolled less than 9 months during 2003–04, and all
or some of these months were part time.

Appendix A—Glossary DAS Variable Name
A-5
Price of attendance 2003–04 BUDGETAJ The attendance-adjusted student budget at the NPSAS sample institution for students who attended only one institution during 2003–04. Includes tuition and fees, books and supplies, room and board, transportation, and personal and any other expenses allowed for federal cost of attendance budgets. Based on institution-reported student budgets for students who applied for financial aid. Budgets for students who did not apply for financial aid were imputed by calculating the average nontuition budget amounts for aided students at the institution by dependency status and then adding the tuition and fees paid. Nontuition expenses for part-time or part-year students were adjusted to reflect the number of months enrolled and the attendance intensity. Ever received an incomplete 2006 CINCMP06 Indicates whether the student had ever received a grade of incomplete. The 2006 interview question was: “While enrolled at [institution name], did you ever receive a grade of incomplete?” Community service: average hours per month 2003–04 COMHOUR Average hours per month the student performed community service or volunteer work during 2003–2004 academic year, among students for whom community service was not a one time event. The 2004 interview question was: “In the last 12 months, how many hours per month (on average) did you volunteer?” Community service: average hours per month 2005–06 COMHRS06 Average hours per month the respondent performed community service or volunteer work in 2005–06, among students for whom community service was not a one time event. The 2006 interview question was: “On average, how many hours did you volunteer each month during the last year?” Community service: one-time event 2003–04 COMONE Student performed a one-time event community service or volunteer work during the 2003–2004 academic year. Community service: one-time event 2005–06 COMONE06 The respondent performed a one-time event community service or volunteer work in 2005–06. Community service: required or part of program COMREQ Community service or volunteer work was part of the student’s undergraduate program or required for graduation in 2003–04. The 2004 interview question was: “Was any of your community service or volunteer work part of your undergraduate program or required for graduation?”
Appendix A—Glossary DAS Variable Name
A-6
Community service: performed last year 2003–04 COMSERV Student performed community service or volunteer work during the 2003–2004 academic year. The 2004 interview question was: “Did you perform any community service or volunteer work during the past year? Please exclude charitable donations (such as food, clothing, money, etc.), paid community service, and court-ordered service.” Community service type of activity 2003–04 COMSERVA–G, X During the 2004 interview, students were asked the following questions about their community service/volunteer experience, “What type of community service or volunteer work did you perform? (Please check all that apply.)” Fundraising COMSERVA Fundraising in 2003–04 Homeless shelter/soup kitchen COMSERVB Homeless shelter or soup kitchen in 2003–04 Hospital/nursing home COMSERVC Hospital or nursing home in 2003–04 Neighborhood improvement COMSERVD Neighborhood improvement or cleanup in 2003–04 Service to church COMSERVE Service to a church in 2003–04 Tutoring/mentoring COMSERVF Tutoring or mentoring in 2003–04 Other work with kids COMSERVG Work with kids other than tutoring or mentoring Other COMSERVX Any other activity not listed

Appendix A—Glossary DAS Variable Name
A-7
Community service: performed last year 2005–06 COMSRV06 The respondent had performed community service or volunteer work during 2005–06. The 2006 interview question was: “Have you performed any community service or volunteer work in the last 12 months? Please do not include charitable donations (such as food, clothing, money, etc.), paid community service, or court-ordered service.” Advanced Placement credits accepted CRDAP04 Indicates whether the student had any Advanced Placement (AP) credits that were accepted by the institution in the first year. The 2004 interview question was: “When you first enrolled in college, did you have any advanced placement (AP) credits that were accepted by [name of institution]?” Earned credits for courses at a college while in high school CRDCL04 Indicates that the respondent took courses at a college or university for which college credit was earned while he/she was in high school. The 2004 interview question was: “While you were in high school, did you take any courses at a college or university for which you earned college credit?” Earned any college-level credits in high school CRDHS04 The respondent earned college credits while he/she was in high school. The respondent either earned advanced placement credits (CRDAP04) or/and took courses at a college or university (CRDCL04). Ever repeated course for higher grade 2006 CRPT06 The student had ever repeated a course for a higher grade while enrolled. The 2006 interview question was: “While enrolled at [name of institution], did you ever repeat a course for a higher grade?” Ever withdrew after add/drop deadline 2006 CWTHD06 Indicates whether the student had ever withdrawn from a course after the normal drop/add deadline. The 2006 interview question was: “While enrolled at [name of institution], did you ever withdraw from a course after the normal drop/add deadline?” Dependency status first year DEPEND5B
Dependent Independent Unmarried, no dependents Single parent Married
Indicates whether the student was financially dependent or independent for federal financial aid purposes in 2003–04, and subcategories of independent students based on marital status and whether they had legal dependents.

Appendix A—Glossary DAS Variable Name
A-8
Dependency status first year—continued DEPEND5B Students were considered to be financially independent for federal financial aid purposes in 2003–04 if they met any of the following criteria:
The student was 24 years old or older as of 12/31/2003. The student had legal dependents other than spouse. The student was married. The student was an orphan or ward of the court. The student was a veteran of the U.S. Armed Forces. The student was enrolled in a graduate or professional program (beyond a bachelor’s degree).
All other students under 24 were considered to be financially dependent of their parents unless they could demonstrate that they were receiving no parental support and were classified as independent by a financial aid officer using professional judgment. For the independent student subcategories, “unmarried” and “single parent” include students who were separated, divorced, or widowed as well as never married. “Married” students include those with or without dependents. Dependent student family income DEPINC Indicates dependent student parents’ total income for 2002. Based on amounts reported in the financial aid application, estimates by students in the student interview, and stochastic imputation. Federal financial aid need analysis uses the family income in the calendar year prior to the academic year of enrollment. The low and high categories used in this report are approximately the lowest and highest 25 percent of the income range for all dependent student families.
Less than $32,000 $32,000–59,999 $60,000–91,999 $92,000 or more
Degree plans first year DGPLNY1 Student’s degree plans during the 2003–04 academic year. Based first on the 2004 interview question “What degree were you working on at [name of institution]?” If this was not available, the program reported by the NPSAS institution was used. If neither was available, the program reported by the student in the financial aid application was used.
None The student was not working on any degree. Certificate The student was working on a vocational certificate or diploma
below an associate’s degree. Associate’s degree The student was working on an associate’s degree. Bachelor’s degree The student was working on a bachelor’s degree, including those
enrolled at less-than-4-year institutions who planned to transfer to a 4-year institution to complete a bachelor’s degree.
Appendix A—Glossary DAS Variable Name
A-9
Transfer and degree plans DGTRNY1 Indicates whether students at less-than-4-year institutions in 2003–04 planned to transfer to a 4-year institution and whether they had plans to complete a certificate or associate’s degree. Based on the 2004 interview questions about reasons for enrolling at the NPSAS sample school and plans to transfer in order to pursue a bachelor’s degree.
Degree, no transfer The student’s reason for enrolling was to complete a certificate or associate’s degree, but not to transfer to a 4-year institution.
Degree and transfer The student’s reasons for enrolling were to complete a certificate
or associate’s degree, and to transfer to a 4-year institution. No degree, transfer The student’s reason for enrolling was to transfer to a 4-year
institution, but not to complete a certificate or associate’s degree. No degree, no transfer The student’s reasons for enrolling did not include completing a
certificate or associate’s degree or transfer to a 4-year institution. Any disability DISABLE Indicates whether the student reported any type of disability in 2004. To identify students with disabilities, NPSAS participants were first asked three questions to determine (1) whether they had “long-lasting conditions” such as blindness, deafness, or a severe vision or hearing impairment; (2) whether they had “a condition that substantially limits one or more basic physical activities such as walking, climbing stairs, reaching, lifting, or carrying”; and (3) whether they had “any other physical, mental, or emotional condition that has lasted 6 months or more.” Students who answered “yes” to questions 1 or 2 (i.e., vision, hearing, or mobility impairment) were identified as having a disability. Of the students who answered “no” to question 1 and 2, the students who answered “yes” to question 3 and also reported having difficulty doing any one of five activities—getting to school, getting around on campus, learning, dressing, or working at a job—were also considered to have a disability
No disability reported Any disability reported
Distance education courses DISTEDUC Indicates that the student took distance education courses for credit during academic year 2003–04. The 2004 interview question was: “During the 2003–2004 school year, did you take any courses for credit that were distance education courses? (Distance education courses are primarily delivered off campus using live, interactive TV or audio, pre-recorded TV or video, CD-ROM, or a computer-based system such as the Internet. Distance education does not include correspondence courses.)” Enrollment intensity through 2006 ENINPT3Y Indicates the pattern of full-time, part-time, or mixed full-time and part-time attendance intensity in the months enrolled at any postsecondary institution between July 2003 and June 2006. Full time generally means enrollment in 12 or more credit hours per term or 24 credit hours per academic year. Students enrolled full time in an academic year except for summer months (which may have been part time) were considered to be always full time.
Always full time The student attended full time in all months while enrolled.

Appendix A—Glossary DAS Variable Name
A-10
Enrollment intensity through 2006—continued ENINPT3Y Always part time The student attended part time in all months while enrolled. Mixed The student attended full time in some months and part time in
some months while enrolled. Attainment or last year enrolled without completion through 2006 ENLYAT3Y Indicates whether or not the respondents had attained a certificate or degree by June 2006; if not, when they were last enrolled.
No degree, last enrolled in 2003–04 No degree, last enrolled in 2004–05 No degree, last enrolled in Fall 2005 No degree, last enrolled in Spring 2006 Attained degree by June 2006.
Recent (2003) high school graduates enrolled full time in fall 2003 FALLHSFT Indicates categories of beginning students who graduated from high school with a regular diploma in 2003, were enrolled full time in the fall of 2003, and were working on a degree or certificate in the first year (DGPLNY1).
Certificate plans Recent high school graduates who were enrolled full time in fall
2003 and working on a certificate Associate’s degree plans Recent high school graduates who were enrolled full time in fall
2003 and working on an associate’s degree Bachelor’s degree plans Recent high school graduates who were enrolled full time in fall
2003 and working on a bachelor’s degree Control of first institution FCONTROL Control of first institution attended during the 2003–04 academic year.
Public Private not-for-profit Private for-profit
Level of first institution FLEVEL
The highest degree or award offered in any program by the first institution attended.
4-year Institutions that can award bachelor’s degrees or higher degrees. Some of these institutions may also offer associate’s degrees or certificates.
Appendix A—Glossary DAS Variable Name
A-11
Level of first institution—continued FLEVEL 2-year Institutions offering certificate or associate’s degree programs, or
2-year programs that fulfill part of the requirements for a bachelor’s degree or higher at 4-year institutions. These institutions do not award bachelor’s degrees.
Less-than-2-year At least one of the programs offered at these institutions is 3
months or longer, and produces a terminal award or certificate. No program at these institutions lasts longer than 2 years.
Student experiences first year 2003–04 FREQ04A–G During the 2004 interview, students enrolled in 4-year or 2-year institutions were asked the following questions about their academic experience, “During the 2003–2004 school year at [name of institution], please indicate whether you did the following never, sometimes or often.” Informal contact with faculty FREQ04A Had informal contact with faculty members in 2003–04. Talked with faculty about academic matters outside of class FREQ04B Talked with faculty about academic matters outside of class in 2003–04. Met with academic advisor FREQ04C Met with advisor concerning academic plans in 2003–04. Attended fine arts activities FREQ04D Attended fine arts activities in 2003–04. Participated in school clubs FREQ04E Participated in school clubs in 2003–04. Participated in school sports FREQ04F Participated in varsity/intramural/club sports in 2003–04. Attended study groups FREQ04G Attended study groups outside of the classroom in 2003–04.

Appendix A—Glossary DAS Variable Name
A-12
Doctorate-granting status of first institution FSECDOC Indicates whether the first 4-year institution attended granted doctorates. Less-than-4-year institutions are not included in this variable.
Doctorate-granting Non-doctorate-granting 4-year
Type of first institution FSECTOR The level and control of the first institution attended by the student in 2003–04, based on the classification in the 2003 IPEDS Institutional Characteristics file. Control concerns the source of revenue and control of operations (public, private not-for-profit, private for-profit) and level concerns the highest degree or award offered by the institution in any program. Four-year institutions award at least a bachelor’s degree; 2-year institutions award at least an associate’s degree; less-than-2-year institutions award certificates or other credentials in vocational programs lasting less than 2 years. In most cases, the first institution attended in 2003–04 is also the institution at which the student was sampled for NPSAS:04. However, if the student was enrolled at another institution for more than 3 months in 2003–04 prior to enrolling at the NPSAS sample institution, the prior institution was classified as the first institution attended. The sample size for private not-for-profit less-than-2-year institutions was too small to show as a separate category.
4-year Public Private not-for-profit Private for-profit 2-year Public Private not-for-profit Private for-profit Less-than-2-year Public Private for-profit
Gender GENDER
Male Female
High school grade point average (GPA) HCGPAREP High school grade point average as self-reported on the SAT or ACT admissions test questionnaire. This variable only includes students under age 24 who had received a regular high school diploma.
Below 3.0 (below B) 3.0–3.4 (B to A-) 3.5–4.0 (A- to A)

Appendix A—Glossary DAS Variable Name
A-13
Highest level of high school mathematics HCMATH Highest level of high school mathematics taken, as self-reported in the 2004 student interview and the SAT or ACT admissions test questionnaires.
Below algebra II Algebra II Trigonometry Pre-calculus Calculus
Type of high school HSTYPE Indicates the type of high school where the student received a regular diploma, according to the 2004 student interview. Students with a GED or equivalent, who were home-schooled, or did not complete high school, were classified as “no regular diploma.”
No regular diploma Public high school Private high school Foreign high school
Institutional grants 2003–04 INGRTAMT Indicates the total grant aid from institutional funds received in 2003–04. Includes all institutional grants, scholarships, and tuition waivers received during the NPSAS year. Includes need-based and non-need-based awards. At public institutions in some states, the distinction between state and institutional grant funds is not always clear because grants are funded by the state but are allocated by the institutions. Job 2006: related to career goals JOBCAR06 The current job in 2006 was considered to be part of a career the respondent was pursuing in occupation or industry. The 2006 interview question was: “Do you consider your current job to be part of a career you are pursuing in your occupation or industry?” Worked while enrolled in 2003–04 JOBENR2 Intensity of work, including work-study, assistantship, and traineeship, while enrolled during the 2003–04 academic year.
Did not work Not employed during 2003–04 academic year. Part time Worked less than 35 hours per week.
Full time Worked 35 hours per week or more.

Appendix A—Glossary DAS Variable Name
A-14
Job 2006: first job after leaving school JOBFST06 The current job in 2006 was the first job the respondent had after leaving school. The 2006 interview question was: “Was this job the first job you had after leaving [name of institution]?” Job 2006: required certificate JOBRCT06 The respondent indicated that the current job in 2006 required a diploma or certificate from a college or trade school as a condition of employment. Job 2006: required license JOBRLC06 The respondent indicated that the current job in 2006 required an occupational license or professional certificate as a condition for working. Job 2006: related to major JOBRLM06 The respondent indicated that the current job in 2006 was related to his/her major or field of study at school. The 2006 interview question was: “Would you say your job is related to your major or field of study at [name of institution]?” Job 2006: same or similar job when enrolled JOBSIM06 The respondent indicated that the current job in 2006 was the same or similar to the job held while enrolled. The 2006 interview question was: “Did you have your current job, or a similar job, while you were enrolled at [Primary School]?” Job 2006: courses not needed to get job JOBTRN06 The respondent indicated that the postsecondary courses taken were not necessary for the current job in 2006. The 2006 interview question was: “Would you have been able to get your current job without the courses you took at [Primary school]?” Ever changed major 2006 MAJ06CHG Whether the student formally changed majors at the most recent school attended as of 2006. The 2006 interview question was: “How many times did you formally change your major at [name of institution]?”
Never One or more times
Merit-only grants 2003–04 MERITAID Institutional and/or state funded merit-only grants and scholarships received in 2003–04. Includes all athletic scholarships. Merit-only scholarships are not based on need, but they may be awarded to students who also qualify for need-based aid.

Appendix A—Glossary DAS Variable Name
A-15
Highest education of parents PAREDUC Indicates the highest level of education completed by the student’s mother or father, whoever had the highest level. The variable was aggregated to the following categories in this report:
High school or less Neither parent earned more than a high school diploma or
equivalent or they did not complete high school. Some postsecondary At least one parent received some postsecondary education, but
did not earn a bachelor’s degree. Bachelor’s degree or higher At least one parent attained a bachelor’s or advanced degree.
Federal Pell Grants 2003–04 PELL04 Total amount of federal Pell Grants received at all institutions attended during 2003–04 academic year. Pell Grants are need-based grants awarded to undergraduates who have not yet received a bachelor’s degree and students in teaching certificate programs. The amount of a Pell Grant depends on the expected family contribution (EFC) and attendance status (full-time or part-time, full-year or part-year). The maximum Pell Grant amount was $4,050 in 2003–04. Federal Pell Grant received in first year PELLDEP Indicates whether the student received a federal Pell Grant in 2003–04, and the dependency status of the recipient in that first academic year. Dependent students represent a smaller proportion of first-year Pell Grant recipients than the proportion of dependent students among all first-time beginners.
Dependent Pell Grant recipients Dependent students who received Pell Grants in 2003–04. Independent Pell Grant recipients Independent students who received Pell Grants in 2003–04.
Persistence anywhere through 2006 PRAT3Y Indicates whether the student had attained any degree and/or was still enrolled at any postsecondary institution as of June 2006. Students enrolled in any months after February 2006 were considered to be still enrolled through June 2006, including those who attained a certificate or associate’s degree after February 2006.
Attained, not enrolled The student had attained a certificate or degree and was no longer enrolled in June 2006.
Attained, still enrolled The student had attained a certificate or degree and was still
enrolled at some postsecondary institution in June 2006. No degree, still enrolled The student had not attained any certificate or degree but was
still enrolled at some postsecondary institution in June 2006. No degree, not enrolled The student had not attained any certificate or degree and was
not enrolled at any postsecondary institution in June 2006.
Appendix A—Glossary DAS Variable Name
A-16
Retention at the first institution through 2006 PROUTF3 Indicates the student’s enrollment status in the 2005–06 academic year at the first institution attended. Students enrolled at the institution between July 2005 and February 2006 were considered last enrolled in the fall of 2005; those enrolled in any months after February 2006 were considered to be still enrolled through June 2006.
Attained any degree The student had attained a certificate, an associate’s degree, or a bachelor’s degree by June 2006 at the first institution.
No degree, enrolled spring 2006 The student had not attained any degree at the first institution
attended but was still enrolled there in June 2006. No degree, last enrolled fall 2005 The student had not attained any degree at the first institution
attended and was last enrolled there before March 2006. No degree, transferred elsewhere The student had left the first institution attended without a
degree and transferred to a different institution by June 2006. No degree, not enrolled in 2005–06 The student had left the first institution attended without a
degree and had not enrolled anywhere else in the 2005–06 academic year.
Race/ethnicity RACE Student’s race/ethnicity with Hispanic or Latino origin as a separate category. Based on the census race categories. All of the race categories exclude Hispanic origin unless specified.
White A person having origins in any of the original peoples of Europe, North Africa, or the Middle East.
Black A person having origins in any of the black racial groups of
Africa. Hispanic A person of Mexican, Puerto Rican, Cuban, Central or South
American, or other Spanish culture or origin, regardless of race.
Asian/Pacific Islander A person having origins in any of the peoples of the Far East, Southeast Asia, or the Indian subcontinent. This includes people from China, Japan, Korea, the Philippine Islands, India, and Vietnam. Pacific Islander is a person having origins in the Pacific Islands, including Hawaii and Samoa.
American Indian/Alaska Native A person having origins in any of the original peoples of North
America and who maintains cultural identification through tribal affiliation or community recognition.
Multiple races/Other A person having origins in more than one race or in a race not
listed above.
Appendix A—Glossary DAS Variable Name
A-17
Remedial courses taken first year REMEDIA–E The type of remedial or developmental courses taken during the 2003–04 academic year that were reported by the student in the 2004 interview. The 2004 interview question was: “In what area(s) did you take remedial or developmental courses? (Please check all that apply.)” Remedial English REMEDIA Remedial mathematics REMEDIB Remedial reading REMEDIC Remedial study skills REMEDID Remedial writing REMEDIE Any remedial courses 2003–04 REMETOOK Indicates whether the student reported taking any remedial or developmental courses during the first year enrolled (2003–04 academic year). The 2004 interview question was: “Did you take any remedial or developmental courses during the 2003–2004 school year?” Reasons for leaving without completion 2003–04 RLV04A–G, X Students who had left an institution without completing a program in 2003–04 and were not enrolled in 2004–05 were asked to indicate the reasons for leaving in the 2004 interview. The question allowed for multiple responses. The 2004 interview question was: “You indicated earlier that you are no longer enrolled at [name of institution]. Why did you decide to leave? (Please check all that apply.)” Academic problems RLV04A Academic problems Scheduling problems RLV04B Classes not available/scheduling not convenient Not satisfied RLV04C Dissatisfaction with program/school/campus Financial reasons RLV04D Financial reasons
Appendix A—Glossary DAS Variable Name
A-18
Family responsibilities RLV04E Family responsibilities Personal reasons RLV04F Personal reasons Finished classes RLV04G Finished taking desired classes Other reasons RLV04X Other reasons not listed Reasons for transferring from first institution 2003–04 RTR04A–G, J, X Students who had transferred from an institution during or after 2003–04 were asked to indicate the reasons for leaving the original institution in the 2004 interview. The question allowed for multiple responses. The 2004 interview question was: “Earlier you indicated that you transferred out of [name of institution]. What were your reasons for deciding to leave? (Please check all that apply.)” Academic problems RTR04A Academic problems Scheduling problems RTR04B Classes not available/scheduling not convenient Not satisfied RTR04C Dissatisfaction with program/school/campus Financial reasons RTR04D Financial reasons Family responsibilities RTR04E Family responsibilities

Appendix A—Glossary DAS Variable Name
A-19
Personal reasons RTR04F Personal reasons Finished classes RTR04G Finished taking desired classes Pursue bachelor’s degree RTR04J Pursue bachelor’s degree at a 4-year college Other reasons RTR04X Other reasons not listed State grants 2003–04 STGTAMT Total amount of state grants and scholarships (including the federal portion of Leveraging Educational Assistance Partnerships (LEAP) funds to states) received by the student in 2003–04. At public institutions in some states, the distinction between state and institutional grant funds is not always clear because grants are funded by the state but are allocated by the institutions. Admissions test scores (ACT/SAT) TESATDER SAT I combined scores, derived as either the sum of SAT I verbal and mathematics scores or the ACT composite score converted to an estimated SAT I combined score. Only reported for students under age 24. Test scores came from ACT and/or College Board files or from the first institution attended. Categories represent approximate quartile values determined by using the CENTILE function in the DAS, and are based only on the scores of the students in the BPS:04/06 sample. SAT scores are reported in 10-point intervals and the median score was 990. Because 52 percent scored 990 or less, the percentages shown for the two middle quartiles are not close to the 25 percent that would be expected. Derived from data provided by ACT and The College Board. SAT scores are copyright © 2005 by The College Board. All rights reserved. www.collegeboard.com
SAT I combined scores Lowest 400–840 Low middle 850–990 High middle 1000–1130 Highest 1140–1600

Appendix A—Glossary DAS Variable Name
A-20
Admissions test taken (ACT/SAT) TETOOK Indicates whether the students who were under age 24 when they started postsecondary education in 2003–04 had taken the ACT or SAT I college entrance examinations. Based on matching ACT and/or College Board files and supplemented by the student interview if there was no file match.
Did not take either test Took one or both tests
Transfer status through June 2006 TFNUM3Y Indicates whether the student left one postsecondary institution and then enrolled in another postsecondary institution at any time before June 2006. The student may or may not have transferred any credits between the institutions. Some students transferred more than once. Students who enrolled in more than one institution at the same time are not considered to be transfers.
Never transferred The student never left one institution and enrolled in another before June 2006.
Transferred The student left one or more institutions and enrolled in another
before June 2006. Total aid 2003–04 TOTAID Total amount of financial aid received by a student in 2003–04. Includes grants, loans, work-study, or any other types of aid, as well as loans to parents under the PLUS program, and veterans benefits. Does not include federal education tax benefits. Total grants 2003–04 TOTGRT Total amount of grants received by a student in 2003–04. Grants are a type of student financial aid that does not require repayment or employment. Grants include merit-only scholarships, tuition waivers, and employer tuition reimbursements. Total student loans 2003–04 TOTLOAN Total student loan amount received in 2003–04. This includes all student loans through federal, state, institutional, or private programs except PLUS loans (which are made to parents). Loans are a type of student financial aid that advances funds and that are evidenced by a promissory note requiring the recipient to repay the specified amounts under prescribed conditions. Does not include loans from family or friends. Tuition and fees 2003–04 TUITION2 Tuition and fees charged at the sampled NPSAS institution for students who attended only one institution during 2003–04.
Appendix A—Glossary DAS Variable Name
A-21
Type of associate’s degree UGDEGAA Student’s associate’s degree type during 2003–04 academic year. Based on the 2004 student interview or the type of program reported by the institution attended.
Applied fields The student was working on an applied associate’s degree in occupational or technical programs that are generally terminal degrees.
General education/transfer The student was working on an academic associate’s degree in
general education or in preparation for transfer to a 4-year institution.
Community service type of activity 2005–06 VLT06A–G, X Indicates the type of community service or volunteer work that the respondents performed in 2005–06 (whether or not they had been enrolled in 2005–06), as reported in the 2006 interview. The question allowed for multiple response options. The 2006 interview question was: “What type of community service or volunteer work did you perform? (Please check all that apply.)” Tutoring/mentoring VLT06A Tutoring/mentoring in 2005–06 Other work with kids VLT06B Other work with kids in 2005–06 Fundraising VLT06C Fundraising in 2005–06 Homeless shelter/ soup kitchen VLT06D Homeless shelter or soup kitchen in 2005–06 Neighborhood improvement VLT06E Neighborhood improvement/clean-up in 2005–06 Hospital/nursing home VLT06F Hospital/nursing home in 2005–06
Appendix A—Glossary DAS Variable Name
A-22
Service to church VLT06G Service to a church in 2005–06 Other VLT06X Other type of community service in 2005–06 Community service benefits 2005–06 VLTB06A–H The 2006 interview question was: “Which of the following statements best describe your experience in your community service or volunteer work activities. (Please check all that apply.)” Helped with career choice VLTB06A Helped with career choice in 2005–06. Learned to apply skills VLTB06B Learned to apply skills in 2005–06. Expanded skills VLTB06C Expanded skills in 2005–06. Added to resume VLTB06D Added to resume in 2005–06. Clarified choice of major VLTB06E Clarified choice of major in 2005–06. Become a more compassionate person VLTB06F Become a more compassionate person in 2005–06. Increased awareness of social issues VLTB06G Increased awareness of social issues in 2005–06.

Appendix A—Glossary DAS Variable Name
A-23
Other VLTB06H Other benefits not listed in 2005–06. Community service reasons 2005–06 VLTR06A–C, X Indicates the reason why the respondent became involved in a community service or volunteer work in 2005–06. The 2006 interview question was: “Why did you become involved in your community service or volunteer work? (Please check all that apply.)” Required as part of program VLTR06A Required as part of program in 2005–06. Campus organization VLTR06B Participated through a campus organization in 2005–06. Encouraged by student/faculty VLTR06C Encouraged to participate by student/faculty in 2005–06. Other VLTR06X Another reason not listed in 2005–06.

THIS PAGE INTENTIONALLY LEFT BLANK

B-1
Appendix B—Technical Notes and Methodology
Overview
The 2004/06 Beginning Postsecondary Students Longitudinal Study (BPS:04/06) is sponsored by the U.S. Department of Education to respond to the need for a national, comprehensive database concerning issues students may face in enrollment, persistence, progress, and attainment in postsecondary education and in consequent early rates of return to society. The BPS study follows the paths of first-time beginner (FTB) students for a number of years as they navigate the system of postsecondary education, and captures transfer patterns, co-enrollment, and periods of nonenrollment (stopouts).
Unlike the typical retention and attainment studies that follow entering freshmen at a single institution, BPS:04/06 allows researchers and others to study the persistence and attainment of students who enroll in multiple institutions. BPS:04/06 also represents a departure from previous longitudinal studies of high school age cohorts: it starts with a cohort of individuals beginning their postsecondary studies, regardless of when they completed high school. Consequently, BPS:04/06 data include information about nontraditional postsecondary students who have delayed continuing their education after high school due to military service, family responsibilities, or other reasons.
BPS:04/06 is a follow-up to the 2003–04 National Postsecondary Student Aid Study (NPSAS:04), a recurring survey of a nationally representative, cross-sectional sample of postsecondary students. The NPSAS surveys have been implemented every 3 or 4 years since 1986–87, and the data for the most recent survey (for the 2003–04 school year) were released in early 2005. BPS:04/06 represents the first follow-up of the NPSAS:04 FTB students. An additional follow-up interview will occur in 2009.
The BPS:04/06 data collection effort involved interviews of both respondents and nonrespondents to the NPSAS:04 study. The interview took place in one of three modes: self-administered through a web-based instrument, interviewer-administered via computer-assisted telephone interviewing (CATI), or interviewer-administered in person via computer-assisted personal interviewing (CAPI). A single web-based instrument was used for all administration modes.
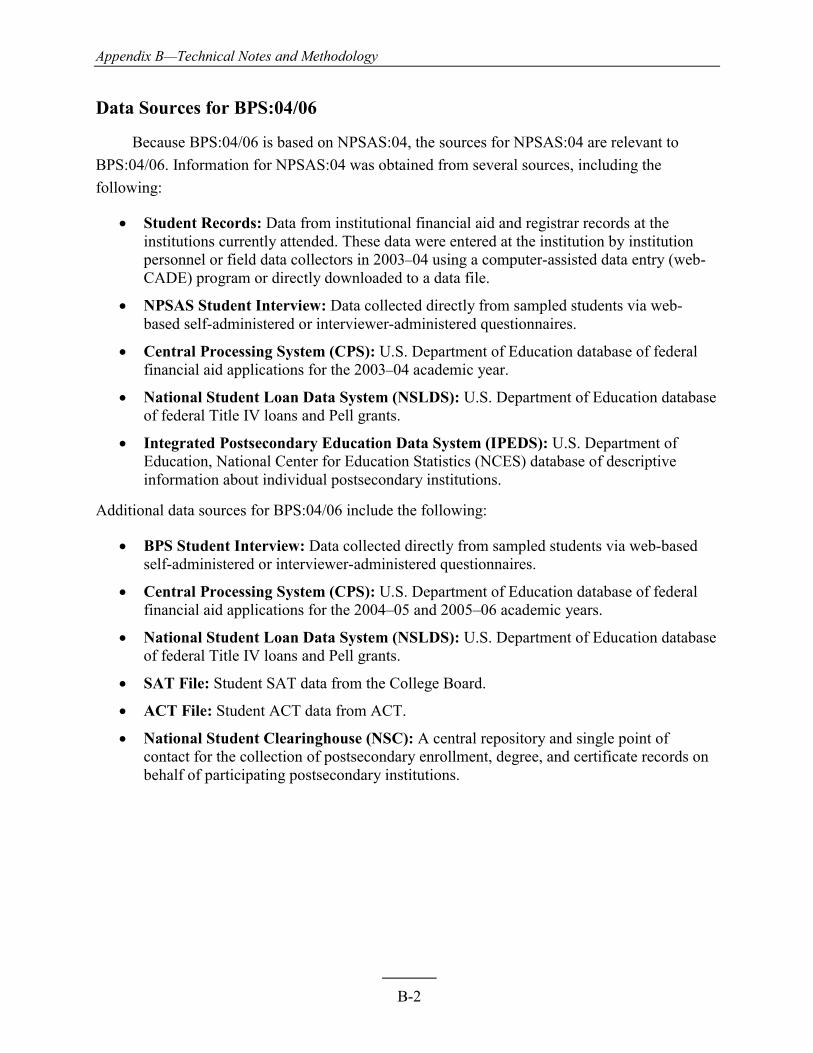
Appendix B—Technical Notes and Methodology
B-2
Data Sources for BPS:04/06
Because BPS:04/06 is based on NPSAS:04, the sources for NPSAS:04 are relevant to BPS:04/06. Information for NPSAS:04 was obtained from several sources, including the following:
• Student Records: Data from institutional financial aid and registrar records at the institutions currently attended. These data were entered at the institution by institution personnel or field data collectors in 2003–04 using a computer-assisted data entry (web-CADE) program or directly downloaded to a data file.
• NPSAS Student Interview: Data collected directly from sampled students via web-based self-administered or interviewer-administered questionnaires.
• Central Processing System (CPS): U.S. Department of Education database of federal financial aid applications for the 2003–04 academic year.
• National Student Loan Data System (NSLDS): U.S. Department of Education database of federal Title IV loans and Pell grants.
• Integrated Postsecondary Education Data System (IPEDS): U.S. Department of Education, National Center for Education Statistics (NCES) database of descriptive information about individual postsecondary institutions.
Additional data sources for BPS:04/06 include the following:
• BPS Student Interview: Data collected directly from sampled students via web-based self-administered or interviewer-administered questionnaires.
• Central Processing System (CPS): U.S. Department of Education database of federal financial aid applications for the 2004–05 and 2005–06 academic years.
• National Student Loan Data System (NSLDS): U.S. Department of Education database of federal Title IV loans and Pell grants.
• SAT File: Student SAT data from the College Board.
• ACT File: Student ACT data from ACT.
• National Student Clearinghouse (NSC): A central repository and single point of contact for the collection of postsecondary enrollment, degree, and certificate records on behalf of participating postsecondary institutions.

Appendix B—Technical Notes and Methodology
B-3
Sample Design
This section provides an overview of the sample design, including the respondent universe and the statistical methodology.
Respondent Universe
The respondent universe for the BPS:04/06 full-scale study consisted of all students who began their postsecondary education for the first time during the 2003–04 academic year at any postsecondary institution in the United States or Puerto Rico that was eligible for NPSAS:04. The BPS:04/06 sample students included potential FTBs from NPSAS:04, which included confirmed FTBs from the NPSAS:04 student interview, respondents to NPSAS:04 who were initially determined to be non-FTBs but were potentially FTBs based on data from other sources, and NPSAS:04 nonrespondents. The institution and student universes are defined in greater detail in the subsections that follow.
Institution Universe for NPSAS:04
The institutions eligible for NPSAS:04 were required during the 2003–04 academic year to meet all the requirements for distributing federal Title IV aid, including
• offering an educational program designed for persons who have completed a high school education;
• offering at least one academic, occupational, or vocational program of study lasting at least 3 months or 300 clock hours;
• offering courses that are open to more than the employees or members of the company or group (e.g., union) that administers the institution; and
• being located in the 50 states, the District of Columbia, or Puerto Rico.
Institutions providing only vocational, recreational, or remedial courses or only in-house courses for their own employees were excluded. U.S. service academies were excluded because of their unique funding/tuition base.
The institutional sampling frame for NPSAS:04 was constructed from the 2000–01 Integrated Postsecondary Education Data System (IPEDS) Institutional Characteristics (IC) file and header files, and the 2000 Fall Enrollment file. The sample of institutions was freshened using the 2002–03 IPEDS, to include a sample of newly formed institutions. Records on the IPEDS files that did not represent NPSAS-eligible institutions were deleted. Hence, records that represented central offices, U.S. service academies, or institutions located outside the United States and Puerto Rico were deleted.
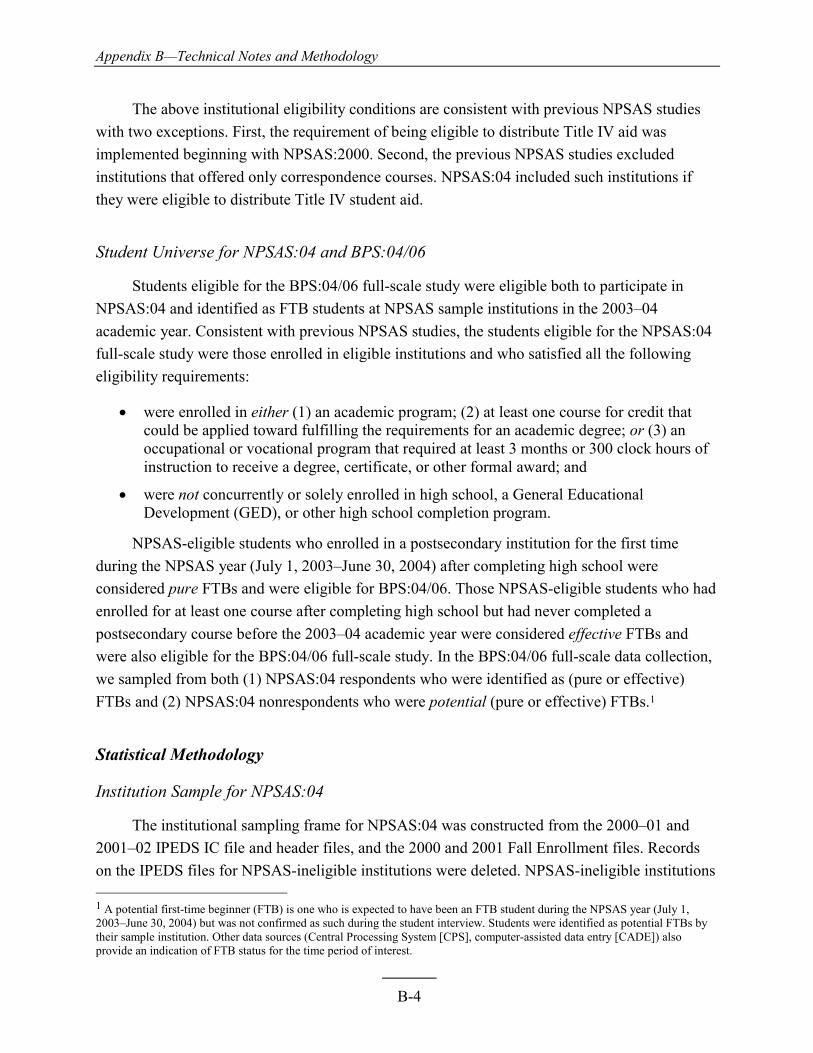
Appendix B—Technical Notes and Methodology
B-4
The above institutional eligibility conditions are consistent with previous NPSAS studies with two exceptions. First, the requirement of being eligible to distribute Title IV aid was implemented beginning with NPSAS:2000. Second, the previous NPSAS studies excluded institutions that offered only correspondence courses. NPSAS:04 included such institutions if they were eligible to distribute Title IV student aid.
Student Universe for NPSAS:04 and BPS:04/06
Students eligible for the BPS:04/06 full-scale study were eligible both to participate in NPSAS:04 and identified as FTB students at NPSAS sample institutions in the 2003–04 academic year. Consistent with previous NPSAS studies, the students eligible for the NPSAS:04 full-scale study were those enrolled in eligible institutions and who satisfied all the following eligibility requirements:
• were enrolled in either (1) an academic program; (2) at least one course for credit that could be applied toward fulfilling the requirements for an academic degree; or (3) an occupational or vocational program that required at least 3 months or 300 clock hours of instruction to receive a degree, certificate, or other formal award; and
• were not concurrently or solely enrolled in high school, a General Educational Development (GED), or other high school completion program.
NPSAS-eligible students who enrolled in a postsecondary institution for the first time during the NPSAS year (July 1, 2003–June 30, 2004) after completing high school were considered pure FTBs and were eligible for BPS:04/06. Those NPSAS-eligible students who had enrolled for at least one course after completing high school but had never completed a postsecondary course before the 2003–04 academic year were considered effective FTBs and were also eligible for the BPS:04/06 full-scale study. In the BPS:04/06 full-scale data collection, we sampled from both (1) NPSAS:04 respondents who were identified as (pure or effective) FTBs and (2) NPSAS:04 nonrespondents who were potential (pure or effective) FTBs.1
Statistical Methodology
Institution Sample for NPSAS:04
The institutional sampling frame for NPSAS:04 was constructed from the 2000–01 and 2001–02 IPEDS IC file and header files, and the 2000 and 2001 Fall Enrollment files. Records on the IPEDS files for NPSAS-ineligible institutions were deleted. NPSAS-ineligible institutions 1 A potential first-time beginner (FTB) is one who is expected to have been an FTB student during the NPSAS year (July 1, 2003–June 30, 2004) but was not confirmed as such during the student interview. Students were identified as potential FTBs by their sample institution. Other data sources (Central Processing System [CPS], computer-assisted data entry [CADE]) also provide an indication of FTB status for the time period of interest.
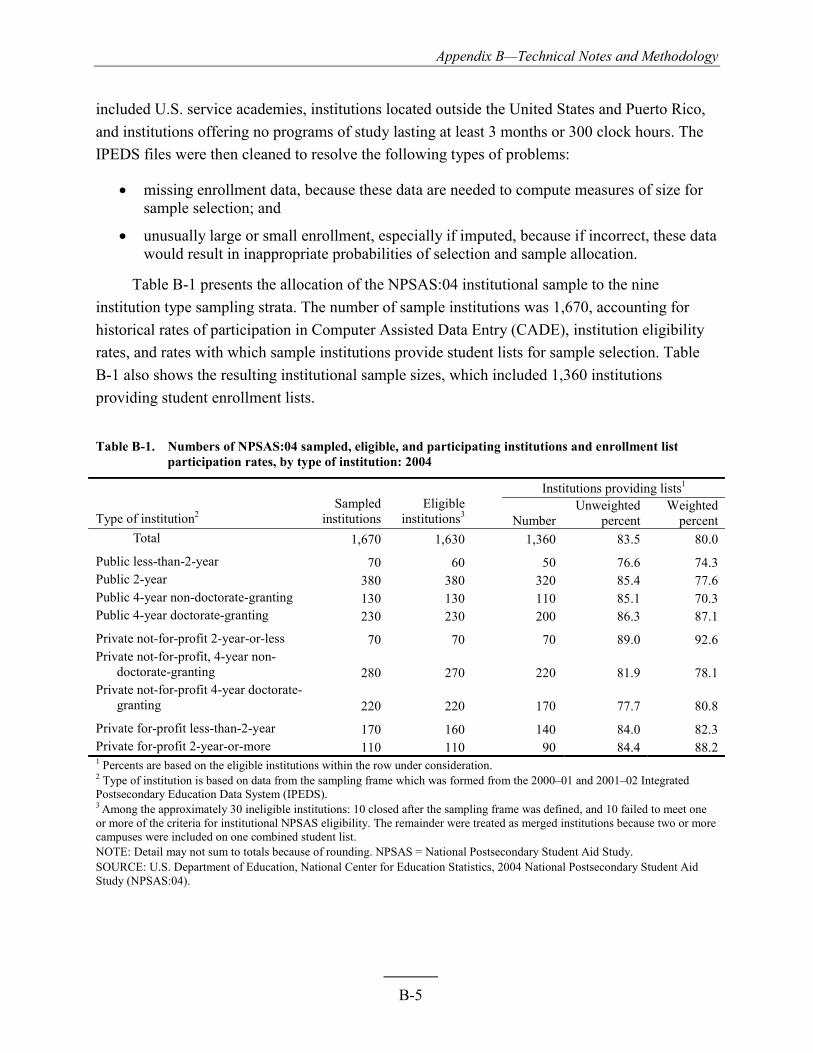
Appendix B—Technical Notes and Methodology
B-5
included U.S. service academies, institutions located outside the United States and Puerto Rico, and institutions offering no programs of study lasting at least 3 months or 300 clock hours. The IPEDS files were then cleaned to resolve the following types of problems:
• missing enrollment data, because these data are needed to compute measures of size for sample selection; and
• unusually large or small enrollment, especially if imputed, because if incorrect, these data would result in inappropriate probabilities of selection and sample allocation.
Table B-1 presents the allocation of the NPSAS:04 institutional sample to the nine institution type sampling strata. The number of sample institutions was 1,670, accounting for historical rates of participation in Computer Assisted Data Entry (CADE), institution eligibility rates, and rates with which sample institutions provide student lists for sample selection. Table B-1 also shows the resulting institutional sample sizes, which included 1,360 institutions providing student enrollment lists.
Table B-1. Numbers of NPSAS:04 sampled, eligible, and participating institutions and enrollment list participation rates, by type of institution: 2004
Institutions providing lists1
Type of institution2 Sampled
institutionsEligible
institutions3 NumberUnweighted
percent Weighted
percent Total 1,670 1,630 1,360 83.5 80.0
Public less-than-2-year 70 60 50 76.6 74.3 Public 2-year 380 380 320 85.4 77.6 Public 4-year non-doctorate-granting 130 130 110 85.1 70.3 Public 4-year doctorate-granting 230 230 200 86.3 87.1
Private not-for-profit 2-year-or-less 70 70 70 89.0 92.6 Private not-for-profit, 4-year non-
doctorate-granting 280 270 220 81.9 78.1 Private not-for-profit 4-year doctorate-
granting 220 220 170 77.7 80.8
Private for-profit less-than-2-year 170 160 140 84.0 82.3 Private for-profit 2-year-or-more 110 110 90 84.4 88.2 1 Percents are based on the eligible institutions within the row under consideration. 2 Type of institution is based on data from the sampling frame which was formed from the 2000–01 and 2001–02 Integrated Postsecondary Education Data System (IPEDS). 3 Among the approximately 30 ineligible institutions: 10 closed after the sampling frame was defined, and 10 failed to meet one or more of the criteria for institutional NPSAS eligibility. The remainder were treated as merged institutions because two or more campuses were included on one combined student list. NOTE: Detail may not sum to totals because of rounding. NPSAS = National Postsecondary Student Aid Study. SOURCE: U.S. Department of Education, National Center for Education Statistics, 2004 National Postsecondary Student Aid Study (NPSAS:04).
Appendix B—Technical Notes and Methodology
B-6
A direct, unclustered sample of institutions was selected for NPSAS:04, like the sample selected for NPSAS:2000 and NPSAS:96, rather than a clustered sample used for earlier NPSAS studies. In addition, to allow analysis of the effects of state tuition and student aid policies in individual states, representative samples of institutions were selected from three strata—public 2-year institutions, public 4-year institutions, and private not-for-profit 4-year institutions—in each of the following 12 states: California, Connecticut, Delaware, Georgia, Illinois, Indiana, Minnesota, Nebraska, New York, Oregon, Tennessee, and Texas for NPSAS:04.
Student Sample for NPSAS:04
The NPSAS:04 student sampling design was based on fixed stratum sampling rates, not fixed stratum sample sizes. The design used two student sampling strata for undergraduates (FTB and other undergraduates), three student sampling strata for graduate students (master’s, doctoral, and other graduate students), and one stratum for first-professional students. Differential sampling rates were used for the three types of graduate students to get adequate representation of students pursuing doctoral degrees and to limit the sample size for “other” graduate students, who are of limited inferential interest.
The NPSAS:04 student interview data collection procedures were expected to produce about a 70 percent student response rate based on historical experience. The sample sizes were determined using prior NPSAS experience regarding institutional CADE response rates and sample student eligibility rates. A total of 109,210 sample students were selected for NPSAS:04, including 49,410 potential FTBs; 47,680 other undergraduate students; and 12,120 graduate and first-professional students (see table B-2).
Postsecondary institutions are sometimes unable to accurately identify their FTB students. Therefore, students classified as potential FTBs for sampling for NPSAS:04 included both pure FTBs who began their postsecondary education for the first time during the NPSAS year and effective FTBs who had enrolled in but not completed a postsecondary class prior to the NPSAS year. The NPSAS sampling rates for students identified as FTBs and other undergraduate students by the sample institutions were adjusted to yield the desired sample sizes after accounting for expected false positive and false negative FTB rates. The false positive and false negative FTB rates experienced in NPSAS:96 were used to set appropriate sampling rates for NPSAS:04.2
2 The NPSAS:96 false positive rate was 28 percent for students identified as potential first-time beginners (FTBs) by the sample institutions, and the false negative rate was 9 percent for those identified as other undergraduate students.

Appendix B—Technical Notes and Methodology
B-7
Table B-2. Numbers of NPSAS:04 sampled and eligible students and response rates, by type of institution and student type: 2004
Responding students1,2
Type of institution and student type3 Sampled students
Eligible students4
Unweighted percent
Weighted percent
All students 109,210 101,010 89.8 91.0
Type of institution Public less-than-2-year 3,180 2,580 84.2 90.6 Public 2-year 36,300 32,450 81.3 83.9 Public 4-year non-doctorate-granting 9,200 8,880 91.9 93.3 Public 4-year doctorate-granting 22,350 21,620 93.7 94.2 Private not-for-profit less-than-4-year 3,060 2,770 94.3 94.6 Private not-for-profit 4-year non-doctorate-granting 9,740 9,300 96.3 96.9 Private not-for-profit 4-year doctorate-granting 9,930 9,590 94.5 95.4 Private for-profit less-than-2-year 9,270 8,030 94.9 94.3 Private for-profit 2-year-or-more 6,190 5,790 95.0 96.7
Student type Total undergraduates 97,090 89,480 89.3 90.3
Potential FTB 49,410 44,670 91.2 91.4 Other undergraduates 47,680 44,810 87.3 90.0
Graduate/first professional 12,120 11,530 94.2 95.1 1 A responding student is defined as any eligible student for whom sufficient data were obtained from one or more sources, including student interview, institutional records, and the Department of Education’s Central Processing System (CPS). 2 Percents are based on the eligible students within the row under consideration. 3 Type of institution is based on data from the sampling frame which was formed from the 2000–01 and 2001–02 Integrated Postsecondary Education Data System (IPEDS). Student type is based on data from the sampling frames which were the enrollment lists received from participating institutions. 4 Ineligible students were identified during the student interview or from institutional records if student eligibility was not determined from a student interview. NOTE: Detail may not sum to totals because of rounding. FTB = first-time beginner. NPSAS = National Postsecondary Student Aid Study. SOURCE: U.S. Department of Education, National Center for Education Statistics, 2004 National Postsecondary Student Aid Study (NPSAS:04).
BPS:04/06 Full-Scale Sample
The BPS:04/06 student sample consisted of four groups according to their base-year response status:
(1) NPSAS:04 study respondents who completed the student interview and were determined to be FTBs;
(2) NPSAS:04 study respondents who completed the student interview but were initially determined to be non-FTB other undergraduates, and who were potential FTBs based on data from other sources;
Appendix B—Technical Notes and Methodology
B-8
(3) a subsample of potential FTBs3 who were NPSAS:04 study respondents but student interview nonrespondents; and
(4) a subsample of potential FTBs who were NPSAS:04 study nonrespondents.
Multiple data sources were used to provide information regarding a student’s FTB status during the NPSAS year, including the NPSAS:04 student interview, records from the student’s base-year institution via CADE, and federal financial aid sources. The data elements that were examined to estimate a student’s likelihood of being an FTB and to construct the frame for the BPS:04/06 sample included the following:
• FTB status from the institution enrollment lists used for NPSAS:04 student sampling;
• FTB status from the CPS;4
• FTB status from student-level data obtained from institutional records via CADE;
• student reports (obtained during the NPSAS:04 interview) indicating that they were FTBs during the 2003–04 academic year;
• year of high school graduation;
• receipt of Stafford loan (date loan was first received and number of years loan was received);
• receipt of Pell grant (date grant was first received and number of years grant was received); and
• undergraduate class level.
Using the above indicators, an index was created to estimate the likelihood of being an FTB. A positive index value was assigned to cases with more positive indicators than negative indicators. For example, students for whom all of the indicators listed above suggested that the student was an FTB were assigned an index value of 8. This index was then used to create a set of decision rules to identify which cases would be included or excluded from the follow-up sample, and which among those included would require additional eligibility screening.
The determination of “low,” “medium,” and “high” likelihood of being an FTB differed for base-year study respondents and base-year study nonrespondents because more data elements were available for the base-year study respondents. Base-year study respondents were considered to have a “low” likelihood of being an FTB if (1) they were not identified as a potential FTB based on CADE or CPS data, (2) they had a negative index value, or (3) they had any Stafford loans or Pell grants that began prior to 2003 (indicating enrollment prior to the NPSAS year). Students with a “low” likelihood of being an FTB were excluded from the BPS sample. If the 3 A “potential FTB” is one who is expected to have been a first-time beginning student during the “NPSAS year” (July 1, 2003–June 30, 2004) but was not confirmed as such during the student interview. Students were identified as potential FTBs by their sample institution. Other data sources (CPS, CADE) also provide an indication of FTB status for the time period of interest. 4 The U.S. Department of Education’s Central Processing System (CPS) contains financial aid application data.
Appendix B—Technical Notes and Methodology
B-9
index was between 0 and 2, the student was classified as having a “medium” likelihood of being an FTB. If the index was 2 or more, then the student was classified as having a “high” likelihood of being an FTB.
Base-year study nonrespondents had very little extant data. Students were considered to have a “low” likelihood of being an FTB if they were not identified as a potential FTB by either CADE or CPS. These students were excluded from the BPS sample. Students who were identified as a potential FTB from CADE (but not CPS) were classified as having a “medium” likelihood of being an FTB. Students who had an indicator from CPS that they were an FTB were classified as having a “high” likelihood of being an FTB.
The NPSAS:04 sample yielded the numbers of students below who either indicated that they were FTBs during the interview and had other institutional records or federal financial aid sources that supported this, or were identified as potential FTBs based on institutional records or federal financial aid sources.
1. Approximately 24,990 students responding to the student interview indicated that they were FTBs during the 2003–04 academic year. Based on a review of the FTB status indicators above, approximately 21,170 of these were identified for inclusion in the follow-up sample. Of the approximately 21,170 included in the follow-up sample, approximately 19,800 had other data that strongly supported their FTB status, and approximately 1,370 of these students had some indications that they were not FTBs; these potential false positives were rescreened during the BPS:04/06 interview to confirm their status. The remaining approximately 3,820 of the original 24,990 were identified for exclusion from the follow-up when multiple data sources confirmed that they could not have been FTBs during the NPSAS year.
2. Approximately 1,420 students were not originally classified as FTBs, but were potential FTBs based on CPS data or because they had a high school graduation date in 2003 or 2004. These potential false negatives were also screened during the BPS:04/06 interview to verify their status.
3. Approximately 8,860 students did not respond to the NPSAS:04 student interview but were classified as NPSAS:04 study respondents and were potential FTBs based on CADE or CPS data, having more positive than negative indicators among the other variables, and having any Stafford loans or Pell grants that began after 2003.
4. Approximately 720 NPSAS:04 sample members were potential FTBs based on information from CADE or CPS, but did not respond to the student interview and did not have sufficient data to be classified as study respondents.
The sample distribution for BPS:04/06 is summarized in table B-3.
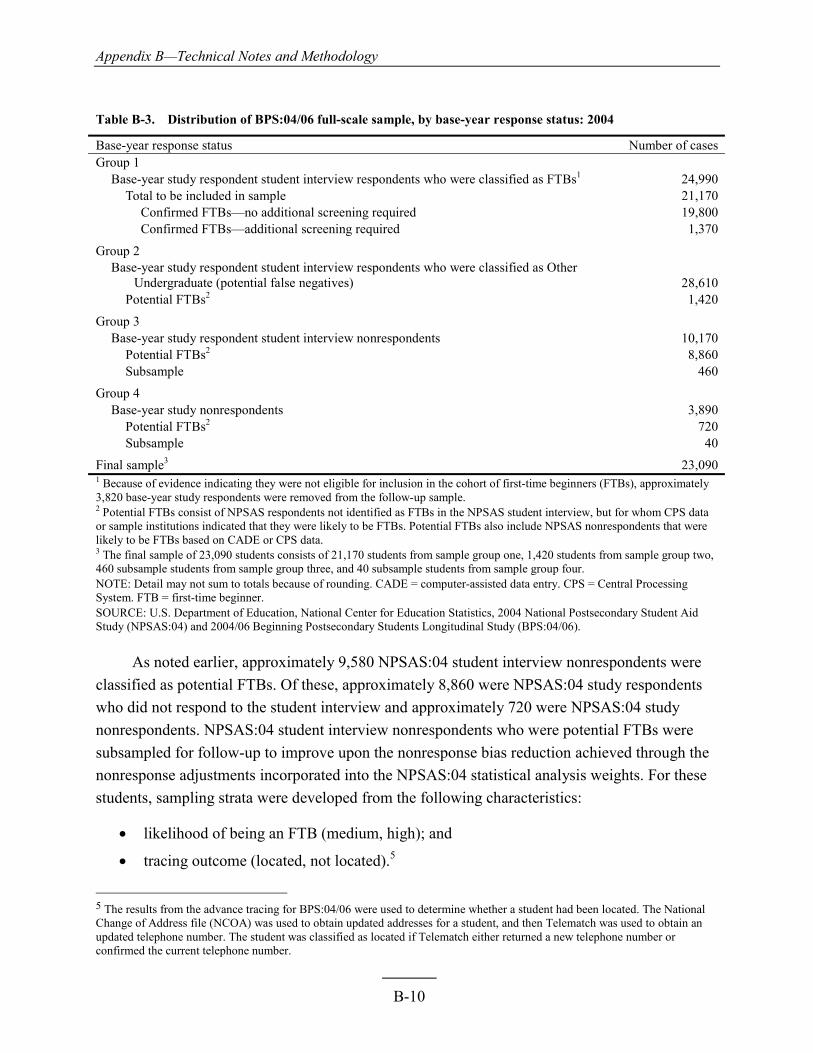
Appendix B—Technical Notes and Methodology
B-10
Table B-3. Distribution of BPS:04/06 full-scale sample, by base-year response status: 2004
Base-year response status Number of casesGroup 1
Base-year study respondent student interview respondents who were classified as FTBs1 24,990 Total to be included in sample 21,170
Confirmed FTBs—no additional screening required 19,800 Confirmed FTBs—additional screening required 1,370
Group 2 Base-year study respondent student interview respondents who were classified as Other
Undergraduate (potential false negatives) 28,610 Potential FTBs2 1,420
Group 3 Base-year study respondent student interview nonrespondents 10,170
Potential FTBs2 8,860 Subsample 460
Group 4 Base-year study nonrespondents 3,890
Potential FTBs2 720 Subsample 40
Final sample3 23,090 1 Because of evidence indicating they were not eligible for inclusion in the cohort of first-time beginners (FTBs), approximately 3,820 base-year study respondents were removed from the follow-up sample. 2 Potential FTBs consist of NPSAS respondents not identified as FTBs in the NPSAS student interview, but for whom CPS data or sample institutions indicated that they were likely to be FTBs. Potential FTBs also include NPSAS nonrespondents that were likely to be FTBs based on CADE or CPS data. 3 The final sample of 23,090 students consists of 21,170 students from sample group one, 1,420 students from sample group two, 460 subsample students from sample group three, and 40 subsample students from sample group four. NOTE: Detail may not sum to totals because of rounding. CADE = computer-assisted data entry. CPS = Central Processing System. FTB = first-time beginner. SOURCE: U.S. Department of Education, National Center for Education Statistics, 2004 National Postsecondary Student Aid Study (NPSAS:04) and 2004/06 Beginning Postsecondary Students Longitudinal Study (BPS:04/06).
As noted earlier, approximately 9,580 NPSAS:04 student interview nonrespondents were classified as potential FTBs. Of these, approximately 8,860 were NPSAS:04 study respondents who did not respond to the student interview and approximately 720 were NPSAS:04 study nonrespondents. NPSAS:04 student interview nonrespondents who were potential FTBs were subsampled for follow-up to improve upon the nonresponse bias reduction achieved through the nonresponse adjustments incorporated into the NPSAS:04 statistical analysis weights. For these students, sampling strata were developed from the following characteristics:
• likelihood of being an FTB (medium, high); and
• tracing outcome (located, not located).5
5 The results from the advance tracing for BPS:04/06 were used to determine whether a student had been located. The National Change of Address file (NCOA) was used to obtain updated addresses for a student, and then Telematch was used to obtain an updated telephone number. The student was classified as located if Telematch either returned a new telephone number or confirmed the current telephone number.
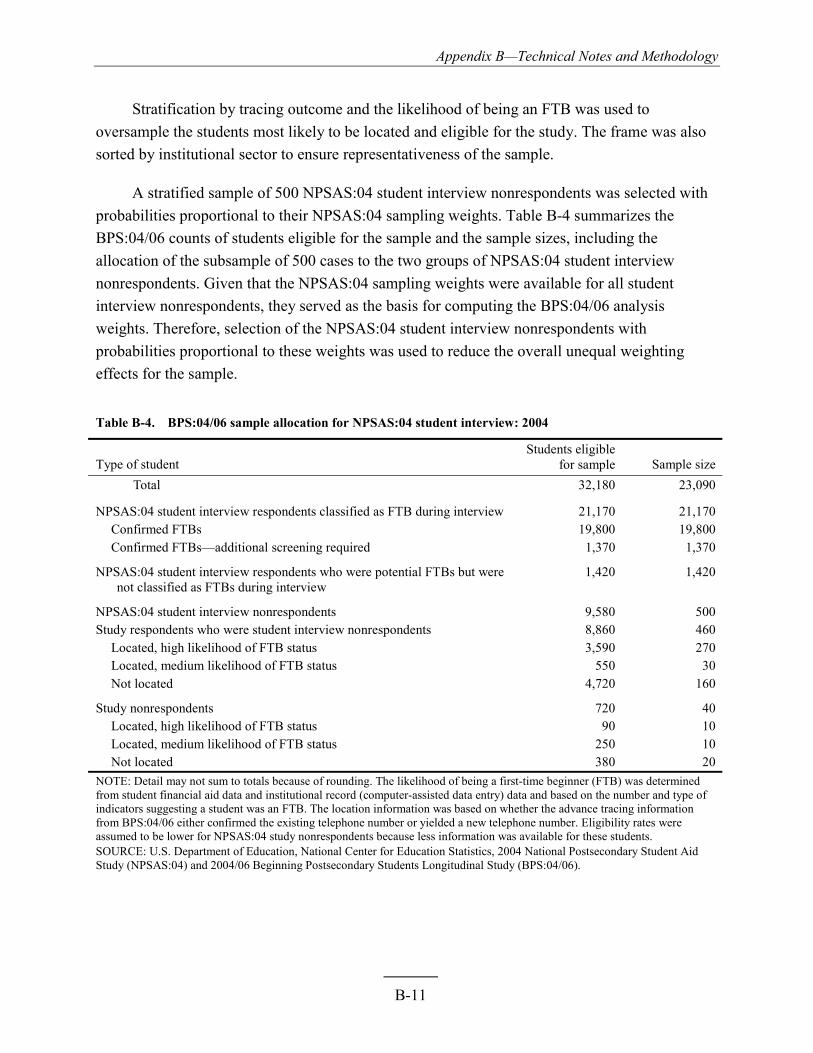
Appendix B—Technical Notes and Methodology
B-11
Stratification by tracing outcome and the likelihood of being an FTB was used to oversample the students most likely to be located and eligible for the study. The frame was also sorted by institutional sector to ensure representativeness of the sample.
A stratified sample of 500 NPSAS:04 student interview nonrespondents was selected with probabilities proportional to their NPSAS:04 sampling weights. Table B-4 summarizes the BPS:04/06 counts of students eligible for the sample and the sample sizes, including the allocation of the subsample of 500 cases to the two groups of NPSAS:04 student interview nonrespondents. Given that the NPSAS:04 sampling weights were available for all student interview nonrespondents, they served as the basis for computing the BPS:04/06 analysis weights. Therefore, selection of the NPSAS:04 student interview nonrespondents with probabilities proportional to these weights was used to reduce the overall unequal weighting effects for the sample.
Table B-4. BPS:04/06 sample allocation for NPSAS:04 student interview: 2004
Type of student Students eligible
for sample Sample sizeTotal 32,180 23,090
NPSAS:04 student interview respondents classified as FTB during interview 21,170 21,170 Confirmed FTBs 19,800 19,800 Confirmed FTBs—additional screening required 1,370 1,370
NPSAS:04 student interview respondents who were potential FTBs but were not classified as FTBs during interview
1,420 1,420
NPSAS:04 student interview nonrespondents 9,580 500 Study respondents who were student interview nonrespondents 8,860 460
Located, high likelihood of FTB status 3,590 270 Located, medium likelihood of FTB status 550 30 Not located 4,720 160
Study nonrespondents 720 40 Located, high likelihood of FTB status 90 10 Located, medium likelihood of FTB status 250 10 Not located 380 20
NOTE: Detail may not sum to totals because of rounding. The likelihood of being a first-time beginner (FTB) was determined from student financial aid data and institutional record (computer-assisted data entry) data and based on the number and type of indicators suggesting a student was an FTB. The location information was based on whether the advance tracing information from BPS:04/06 either confirmed the existing telephone number or yielded a new telephone number. Eligibility rates were assumed to be lower for NPSAS:04 study nonrespondents because less information was available for these students. SOURCE: U.S. Department of Education, National Center for Education Statistics, 2004 National Postsecondary Student Aid Study (NPSAS:04) and 2004/06 Beginning Postsecondary Students Longitudinal Study (BPS:04/06).

Appendix B—Technical Notes and Methodology
B-12
As listed above, several data sources were used to estimate a student’s likelihood of being an FTB prior to the start of first follow-up data collection. After data collection ended, logistic regression models for predicting eligibility among BPS nonrespondents were developed using data from BPS:04/06 respondents and the variables available for the BPS frame construction (date of birth; dates the student began receiving Stafford loans or Pell grants; FTB status according to the institution, CPS, or CADE; and institutional sector). All BPS:04/06 nonrespondents who had responded to the NPSAS:04 interview and were classified as FTBs were initially classified as eligible for BPS. Separate logistic regression models were fitted for each of the remaining sampling groups (NPSAS:04 respondents who were not initially classified as FTB and NPSAS:04 nonrespondents). At the conclusion of the modeling, 99 percent (4,480) of the nonrespondents were predicted to have a high probability of being eligible for BPS. Added together with the eligible respondents to the BPS interview, a total of 22,180 sample members were initially classified as eligible for BPS.
One additional source of data on the BPS:04/06 sample, the NSC Tracker (http://www.studentclearinghouse.org), was obtained following completion of full-scale data collection and the modeling described above to facilitate imputation of key variables. However, as an additional check on the eligibility of the BPS:04 sample, the Tracker data were also used in combination with interview and other extant data to verify the eligibility status of all sample members retained for inclusion in the cohort.
An analysis of enrollment and financial aid data within and across data sources identified a subset of the sample who, based on the results, were determined to be ineligible for membership in the BPS:04 cohort. Table B-5 presents the distribution of these cases by type of student and BPS:04/06 interview response status. The large majority of cases come from the group of NPSAS:04 respondents who were determined during that base-year interview to be FTBs based on a series of questions in the eligibility section. The distribution of final eligible FTBs is shown in the top half of table B-5.
Table B-5. Allocation of ineligible and final eligible BPS:04/06 sample members by interview status: 2006
BPS:04/06
Type of student Total Respondent Nonrespondent
(modeled eligible) Total 23,090 17,710 5,390
Exclusions1 900 † 900
Eligible 18,640 14,900 3,740 NPSAS:04 student interview respondents classified as FTB
during interview 17,170 13,950 3,220
NPSAS:04 student interview respondents who were potential 1,090 800 290
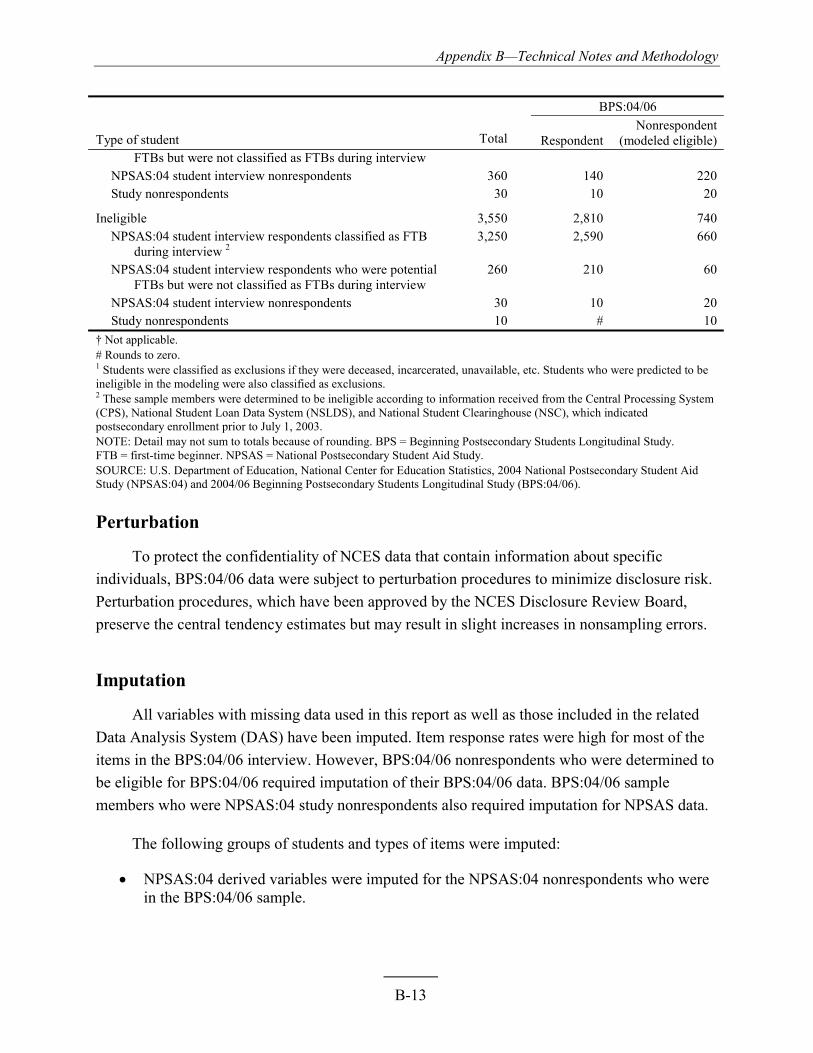
Appendix B—Technical Notes and Methodology
B-13
BPS:04/06
Type of student Total Respondent Nonrespondent
(modeled eligible) FTBs but were not classified as FTBs during interview
NPSAS:04 student interview nonrespondents 360 140 220 Study nonrespondents 30 10 20
Ineligible 3,550 2,810 740 NPSAS:04 student interview respondents classified as FTB
during interview 2 3,250 2,590 660
NPSAS:04 student interview respondents who were potential FTBs but were not classified as FTBs during interview
260 210 60
NPSAS:04 student interview nonrespondents 30 10 20 Study nonrespondents 10 # 10
† Not applicable. # Rounds to zero. 1 Students were classified as exclusions if they were deceased, incarcerated, unavailable, etc. Students who were predicted to be ineligible in the modeling were also classified as exclusions. 2 These sample members were determined to be ineligible according to information received from the Central Processing System (CPS), National Student Loan Data System (NSLDS), and National Student Clearinghouse (NSC), which indicated postsecondary enrollment prior to July 1, 2003. NOTE: Detail may not sum to totals because of rounding. BPS = Beginning Postsecondary Students Longitudinal Study. FTB = first-time beginner. NPSAS = National Postsecondary Student Aid Study. SOURCE: U.S. Department of Education, National Center for Education Statistics, 2004 National Postsecondary Student Aid Study (NPSAS:04) and 2004/06 Beginning Postsecondary Students Longitudinal Study (BPS:04/06).
Perturbation
To protect the confidentiality of NCES data that contain information about specific individuals, BPS:04/06 data were subject to perturbation procedures to minimize disclosure risk. Perturbation procedures, which have been approved by the NCES Disclosure Review Board, preserve the central tendency estimates but may result in slight increases in nonsampling errors.
Imputation
All variables with missing data used in this report as well as those included in the related Data Analysis System (DAS) have been imputed. Item response rates were high for most of the items in the BPS:04/06 interview. However, BPS:04/06 nonrespondents who were determined to be eligible for BPS:04/06 required imputation of their BPS:04/06 data. BPS:04/06 sample members who were NPSAS:04 study nonrespondents also required imputation for NPSAS data.
The following groups of students and types of items were imputed:
• NPSAS:04 derived variables were imputed for the NPSAS:04 nonrespondents who were in the BPS:04/06 sample.
Appendix B—Technical Notes and Methodology
B-14
• Students who were not FTBs based on NPSAS:04 interview data but were determined to be FTBs in BPS:04/06 received imputed data for NPSAS:04 interview items that were administered only to FTBs (e.g., attitudes, experiences, plans).
• Scholastic Assessment Test (SAT)/ACT test scores, high school mathematics courses, and other high school courses and grades were obtained from a merge with the ACT and SAT files. Information on mathematics courses was also obtained in the BPS interview. Values were imputed for any without this information.
• BPS:04/06 first follow-up interview data were imputed for cases with completed interviews with some missing items, abbreviated interviews with some missing sections, and cases who did not have a BPS interview.
The imputation procedures employed a two-step process. First, the matching criteria and imputation classes that were used to stratify the dataset were identified such that all imputation was processed independently within each class. Second, the weighted sequential hot-deck process was implemented,6 whereby missing data were replaced with valid data from donor records that match the recipients with respect to the matching criteria.
Variables requiring imputation were not imputed simultaneously. Basic demographic variables were imputed first. Then, variables with increasing levels of missing data were imputed using previously imputed variables in the determination of optimal matching criteria. The order in which variables were imputed was also determined to some extent by the substantive nature of the variables. For example, basic demographics (such as age) were imputed first, and these were used to process education variables (such as student level and enrollment intensity) that, in turn, were used to impute the financial aid variables (such as aid receipt and loan amounts).
For variables with less than 5 percent missing data, the variables used for matching criteria were selected based on prior knowledge about the dataset and the known relationships between variables. For example, in almost all cases, the student’s age and enrollment intensity (full-time/part-time status) were used as matching variables in the imputation process. Variables with less than 5 percent missing were those, such as student demographic characteristics, that were obtained from the sampling frame or other records such as CPS and also variables from NPSAS:04 that were available for all of the BPS cohort except the NPSAS:04 CATI nonrespondents.
The variables were imputed using the combined file of BPS:04/06 interview respondents and nonrespondents. For variables with more than 5 percent missing data, a statistical process called Classification and Regression Tree (CART) was used to identify the matching criteria that were most closely related to the variable being imputed. CART (Breiman et al. 1984) is similar 6 The term “hot deck” refers to the fact that the set of potential donors changes for each recipient. In contrast, cold deck imputation defines one static set of donors for all recipients. In all such imputation schemes the selection of the donor from the entire deck is a random process.

Appendix B—Technical Notes and Methodology
B-15
to Chi-Square Automatic Interaction Detection (CHAID) (Kass 1980), which was used for the imputation procedures in NPSAS:04. CART, however, is a nonparametric approach to forming imputation classes. This step produced a number of imputation classes that contain sets of donors used to impute recipients belonging to that class. Most of the variables derived from the BPS:04/06 interview had more than 5 percent missing because interview nonrespondents were included in the imputation.
Next, the imputation classes were used as input to a SAS macro that implemented the weighted sequential hot-deck procedure. Additionally, data were sorted within each imputation class to increase the chance of obtaining a close match between donor and recipient. The hot-deck process was sequential in that the search for donors occurred sequentially, starting with the recipient and progressing up and down the sorted file to find the set of eligible donors from which a random selection of one was made. The process was weighted because it incorporated the sample weight of each record in the search and selection routine.7
In some cases, further intervention was needed to ensure accuracy and consistency of imputation, as determined by preexisting edit rules. For example, to impute the level of parents’ education when it was known that the parents had some college but the specific education level was unknown, the potential pool of donors was limited to those with at least some college education to prevent imputing parents’ education level as less-than-college.
Weighting
All estimates in this report are weighted to represent the target population described in the sample design section. The weights compensate for the unequal probability of selection of institutions and students in the NPSAS:04 sample. The weights also adjust for multiplicity at the institution and student levels8 and unknown student eligibility for NPSAS. Because the students in the BPS:04/06 sample are a subset of the NPSAS:04 sample, the BPS weights were derived from the NPSAS weights. The BPS:04/06 base weight is the product of the first eight NPSAS weight components given in table B-6. The weight for the subsample of NPSAS CATI nonrespondents who were included in the BPS:04/06 data collection was adjusted by the inverse of the subsampling fraction. The BPS:04/06 weights were then trimmed and smoothed within the original NPSAS:04 institution and student strata to reduce the unequal weighting. Finally,
7 For further details, see Cox (1980) and Iannacchione (1982). 8 After the 2004 National Postsecondary Student Aid Study (NPSAS:04) institution sample selection, it was determined that in some cases either (1) an institution had merged with another institution, or (2) student enrollment lists for two or more campuses were submitted as one combined student list. In these instances, the institution weights were adjusted for the joint probability of selection. Likewise, students who attended more than one institution during the NPSAS year also had multiple chances of selection. If it was determined from any source (the student interview, or the student loan files [Pell or Stafford]) that a student had attended more than one institution, then the student’s weight was adjusted to account for multiple chances of selection.

Appendix B—Technical Notes and Methodology
B-16
poststratification was used to adjust the BPS:04/06 weights so that they matched NPSAS:04 weight sums and known population enrollment and aid totals. All of the weight components, including the probabilities of selection and adjustments, are summarized in table B-6. The weight variable for the student analysis weight is BPS06WT.
The weights were not adjusted for BPS:04/06, nonresponse because the BPS:04/06 data file contains BPS:04/06 nonrespondents with imputed data as well as BPS:04/06 respondents. Logistic regression models for predicting BPS:04/06 eligibility were developed using the BPS:04/06 respondents and the variables available for the BPS:04/06 frame construction; these models were then used to predict eligibility for the BPS:04/06 nonrespondents. The BPS:04/06 nonrespondents predicted to be eligible were included on the data file with imputed data.
Table B-6. Summary of BPS:04/06 weight components: 2006
Weight component Purpose Institution sampling weight Account for the institution’s probability of selection Institution multiplicity adjustment Adjust the weights for institutions that had multiple chances of selection Institution poststratification adjustment Adjust the institution weights to match population enrollment totals to
ensure population coverage Institution nonresponse adjustment Adjust the weights to compensate for nonresponding institutions Student sampling weight Account for the student’s probability of selection Student subsampling weight Account for the subsampling of students on paper lists Student multiplicity adjustment Adjust the weights for students who attended more than one institution Student unknown eligibility adjustment Adjust the weights of nonresponding NPSAS students with unknown
eligibility Student subsampling adjustment Adjust the weights of the subset of NPSAS CATI nonrespondents who
were included in the BPS:04/06 sample Student trimming and smoothing
adjustment Adjust the weights for outliers, to reduce the design effect due to unequal
weighting Student poststratification adjustment Adjust the student weights to match known population enrollment and
aid totals to ensure population coverage NOTE: CATI = computer-assisted telephone interview. NPSAS = National Postsecondary Student Aid Study. SOURCE: U.S. Department of Education, National Center for Education Statistics, 2004 National Postsecondary Student Aid Study (NPSAS:04) and 2004/06 Beginning Postsecondary Students Longitudinal Study (BPS:04/06).
Quality of Estimates
Unit Response Rates and Bias Analysis
The bias in an estimated mean based on respondents, Ry , is the difference between this mean and the target parameter, π (i.e., the mean that would be estimated if a complete census of the target population was conducted and everyone responded). This bias can be expressed as follows:
B( )y–R = y–R – π

Appendix B—Technical Notes and Methodology
B-17
The estimated mean based on nonrespondents, NRy , can be computed if data for the
particular variable are available for most of the nonrespondents. The true target parameter, π, can be estimated for these variables as follows:
( )ˆ 1 R NRy yπ η η= − + ,
where η is the weighted unit (or item) nonresponse rate. For the variables that are from the frame, rather than from the sample, π can be estimated without sampling error. The bias can then be estimated as follows:
( )ˆ ˆR RB y y π= −
or equivalently:
( ) ( )ˆR R NRB y y yη= − .
This formula shows that the estimate of the nonresponse bias is the difference between the mean for respondents and nonrespondents multiplied by the weighted nonresponse rate. Nonresponse bias could come from a variety of sources, including failure of the institution to provide lists for NPSAS:04, student nonresponse to BPS:04/06, and item nonresponse to the BPS:04/06 interview.
Institution-Level Bias Analysis
An institution respondent is defined as any sample institution for which
• a student list was received that was sufficient for selecting a sample; or
• a sample of students was selected from an NSLDS file of Stafford loan and Pell grant recipients in cases where such a student file was believed to include at least 85 percent of the student population.
Of the 1,630 eligible NPSAS:04 sample institutions, 1,360 were respondents (84 unweighted percent and 80 weighted percent). The institution weighted response rate is also below 85 percent for six of the nine types of institutions. The weighted response rates by type of institution range from 70 percent for public 4-year non-doctorate-granting institutions to 93 percent for private not-for-profit less-than-4-year institutions.
A nonresponse bias analysis was conducted for all institutions and for the six types of institutions with a weighted response rate below 85 percent. The nonresponse bias was estimated
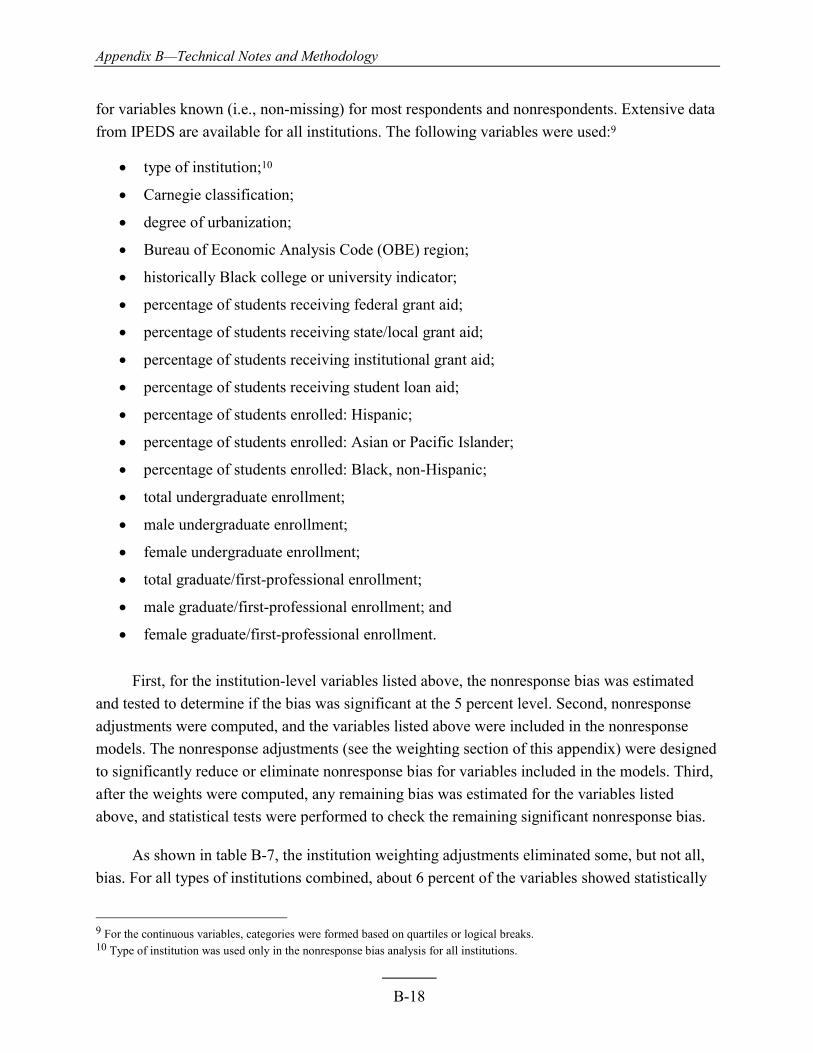
Appendix B—Technical Notes and Methodology
B-18
for variables known (i.e., non-missing) for most respondents and nonrespondents. Extensive data from IPEDS are available for all institutions. The following variables were used:9
• type of institution;10
• Carnegie classification;
• degree of urbanization;
• Bureau of Economic Analysis Code (OBE) region;
• historically Black college or university indicator;
• percentage of students receiving federal grant aid;
• percentage of students receiving state/local grant aid;
• percentage of students receiving institutional grant aid;
• percentage of students receiving student loan aid;
• percentage of students enrolled: Hispanic;
• percentage of students enrolled: Asian or Pacific Islander;
• percentage of students enrolled: Black, non-Hispanic;
• total undergraduate enrollment;
• male undergraduate enrollment;
• female undergraduate enrollment;
• total graduate/first-professional enrollment;
• male graduate/first-professional enrollment; and
• female graduate/first-professional enrollment.
First, for the institution-level variables listed above, the nonresponse bias was estimated and tested to determine if the bias was significant at the 5 percent level. Second, nonresponse adjustments were computed, and the variables listed above were included in the nonresponse models. The nonresponse adjustments (see the weighting section of this appendix) were designed to significantly reduce or eliminate nonresponse bias for variables included in the models. Third, after the weights were computed, any remaining bias was estimated for the variables listed above, and statistical tests were performed to check the remaining significant nonresponse bias.
As shown in table B-7, the institution weighting adjustments eliminated some, but not all, bias. For all types of institutions combined, about 6 percent of the variables showed statistically
9 For the continuous variables, categories were formed based on quartiles or logical breaks. 10 Type of institution was used only in the nonresponse bias analysis for all institutions.
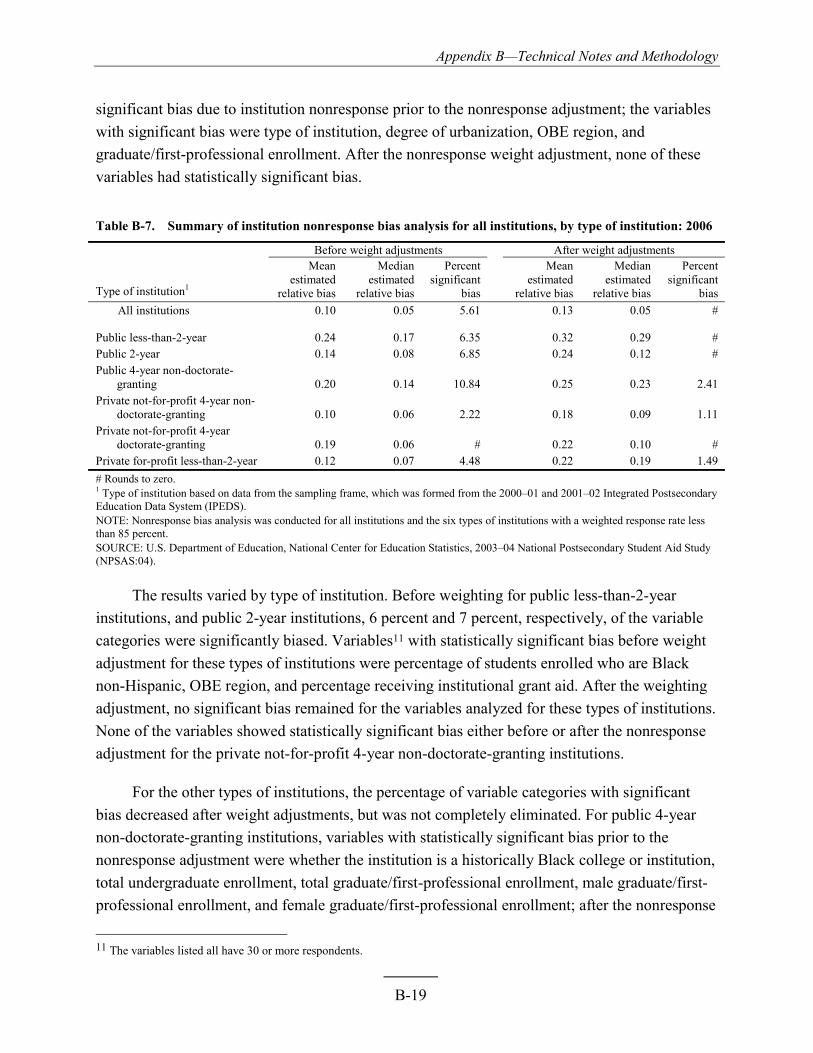
Appendix B—Technical Notes and Methodology
B-19
significant bias due to institution nonresponse prior to the nonresponse adjustment; the variables with significant bias were type of institution, degree of urbanization, OBE region, and graduate/first-professional enrollment. After the nonresponse weight adjustment, none of these variables had statistically significant bias.
Table B-7. Summary of institution nonresponse bias analysis for all institutions, by type of institution: 2006
Before weight adjustments After weight adjustments
Type of institution1
Mean estimated
relative bias
Median estimated
relative bias
Percent significant
bias
Mean estimated
relative bias
Median estimated
relative bias
Percent significant
bias All institutions 0.10 0.05 5.61 0.13 0.05 #
Public less-than-2-year 0.24 0.17 6.35 0.32 0.29 # Public 2-year 0.14 0.08 6.85 0.24 0.12 # Public 4-year non-doctorate-
granting 0.20 0.14 10.84 0.25 0.23 2.41 Private not-for-profit 4-year non-
doctorate-granting 0.10 0.06 2.22 0.18 0.09 1.11 Private not-for-profit 4-year
doctorate-granting 0.19 0.06 # 0.22 0.10 # Private for-profit less-than-2-year 0.12 0.07 4.48 0.22 0.19 1.49 # Rounds to zero. 1 Type of institution based on data from the sampling frame, which was formed from the 2000–01 and 2001–02 Integrated Postsecondary Education Data System (IPEDS). NOTE: Nonresponse bias analysis was conducted for all institutions and the six types of institutions with a weighted response rate less than 85 percent. SOURCE: U.S. Department of Education, National Center for Education Statistics, 2003–04 National Postsecondary Student Aid Study (NPSAS:04).
The results varied by type of institution. Before weighting for public less-than-2-year institutions, and public 2-year institutions, 6 percent and 7 percent, respectively, of the variable categories were significantly biased. Variables11 with statistically significant bias before weight adjustment for these types of institutions were percentage of students enrolled who are Black non-Hispanic, OBE region, and percentage receiving institutional grant aid. After the weighting adjustment, no significant bias remained for the variables analyzed for these types of institutions. None of the variables showed statistically significant bias either before or after the nonresponse adjustment for the private not-for-profit 4-year non-doctorate-granting institutions.
For the other types of institutions, the percentage of variable categories with significant bias decreased after weight adjustments, but was not completely eliminated. For public 4-year non-doctorate-granting institutions, variables with statistically significant bias prior to the nonresponse adjustment were whether the institution is a historically Black college or institution, total undergraduate enrollment, total graduate/first-professional enrollment, male graduate/first-professional enrollment, and female graduate/first-professional enrollment; after the nonresponse
11 The variables listed all have 30 or more respondents.
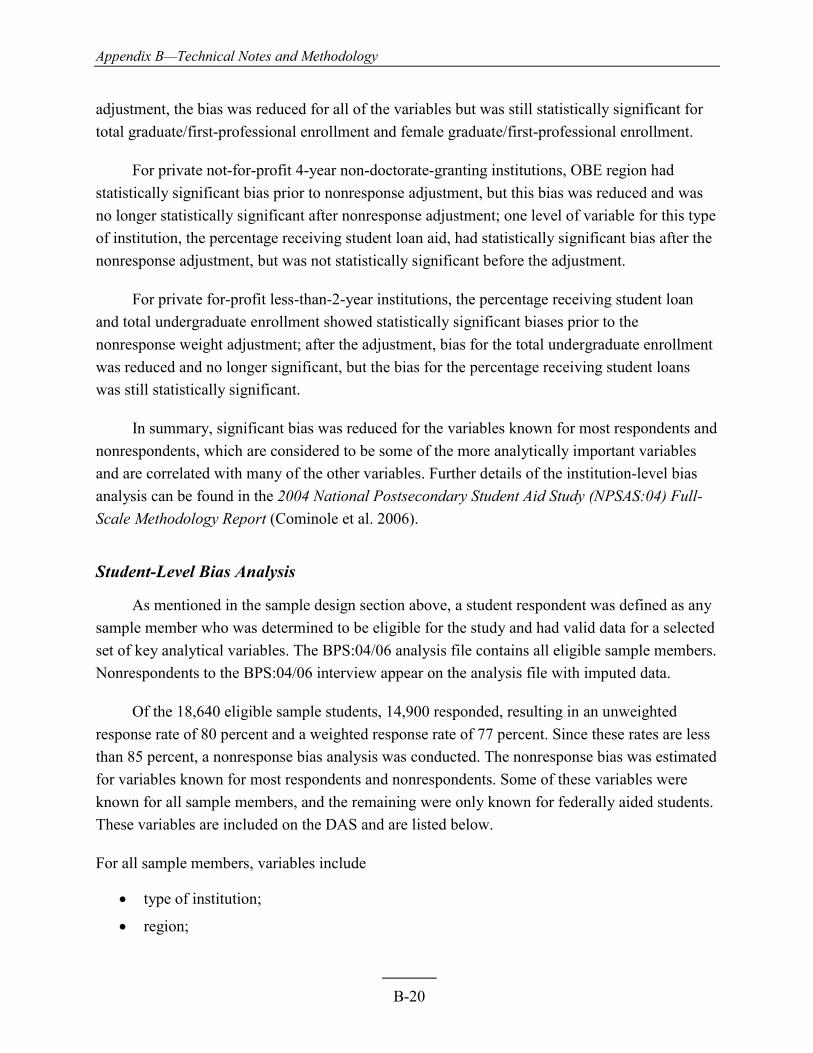
Appendix B—Technical Notes and Methodology
B-20
adjustment, the bias was reduced for all of the variables but was still statistically significant for total graduate/first-professional enrollment and female graduate/first-professional enrollment.
For private not-for-profit 4-year non-doctorate-granting institutions, OBE region had statistically significant bias prior to nonresponse adjustment, but this bias was reduced and was no longer statistically significant after nonresponse adjustment; one level of variable for this type of institution, the percentage receiving student loan aid, had statistically significant bias after the nonresponse adjustment, but was not statistically significant before the adjustment.
For private for-profit less-than-2-year institutions, the percentage receiving student loan and total undergraduate enrollment showed statistically significant biases prior to the nonresponse weight adjustment; after the adjustment, bias for the total undergraduate enrollment was reduced and no longer significant, but the bias for the percentage receiving student loans was still statistically significant.
In summary, significant bias was reduced for the variables known for most respondents and nonrespondents, which are considered to be some of the more analytically important variables and are correlated with many of the other variables. Further details of the institution-level bias analysis can be found in the 2004 National Postsecondary Student Aid Study (NPSAS:04) Full-Scale Methodology Report (Cominole et al. 2006).
Student-Level Bias Analysis
As mentioned in the sample design section above, a student respondent was defined as any sample member who was determined to be eligible for the study and had valid data for a selected set of key analytical variables. The BPS:04/06 analysis file contains all eligible sample members. Nonrespondents to the BPS:04/06 interview appear on the analysis file with imputed data.
Of the 18,640 eligible sample students, 14,900 responded, resulting in an unweighted response rate of 80 percent and a weighted response rate of 77 percent. Since these rates are less than 85 percent, a nonresponse bias analysis was conducted. The nonresponse bias was estimated for variables known for most respondents and nonrespondents. Some of these variables were known for all sample members, and the remaining were only known for federally aided students. These variables are included on the DAS and are listed below.
For all sample members, variables include
• type of institution;
• region;

Appendix B—Technical Notes and Methodology
B-21
• institution total enrollment;
• CPS match (yes/no);
• Pell grant recipient (yes/no); and
• Stafford loan recipient (yes/no).
For federally aided students, variables include
• Pell grant amount; and
• Stafford loan amount.
The nonresponse bias was estimated for the above variables, and tested (adjusting for multiple comparisons) to determine if the bias was significant at the 5 percent level. This bias analysis was conducted for the entire sample and for each of the institutional strata. As shown in table B-8 for the entire sample, the bias was significant for many of these variables; almost half of the categories had significant bias. However, the relative bias was generally very small; for 7 of the 18 significant variables the relative bias was less than 5 percent, and for another 5 the relative bias was less than 10 percent. This analysis looks at the difference between respondents and nonrespondents. However, a separate weight adjustment for unit nonresponse was not made, because the data file contains both respondents and nonrespondents (with imputed data). As a result, the bias after nonresponse adjustment was not compared or evaluated. Because all of the nonrespondents were included in the data file, there was no nonresponse bias for the variables listed in table B-8. As noted earlier, the variables used in this analysis were known for almost all of the sample members (respondents as well as nonrespondents). Only the Pell amount and Stafford amount variables had any missing values. Of the 18,640 eligible students in BPS:04/06, the Pell amount variable was missing for 27 students and was imputed during NPSAS:04 for 40 students. The Stafford amount variable was missing for 27 students and was imputed during NPSAS:04 for 87 students.
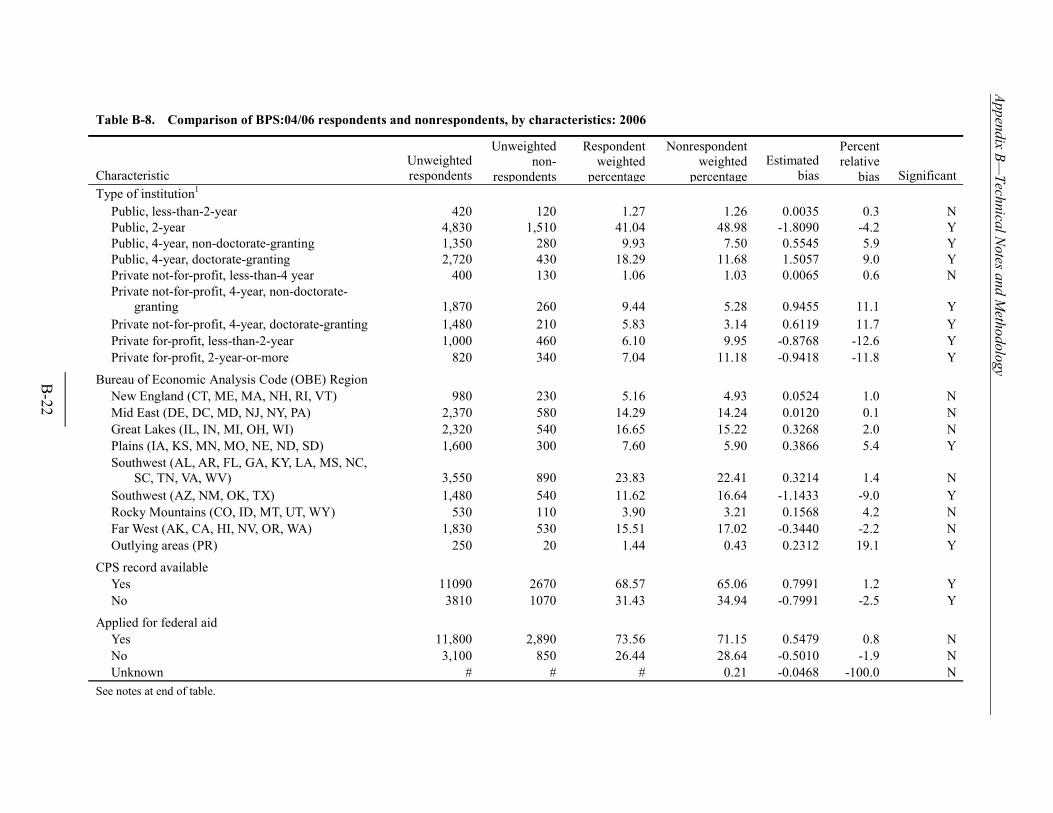
Appendix B—Technical N
otes and Methodology
B-22
Table B-8. Comparison of BPS:04/06 respondents and nonrespondents, by characteristics: 2006
Characteristic Unweighted respondents
Unweighted non-
respondents
Respondent weighted
percentage
Nonrespondent weighted
percentageEstimated
bias
Percent relative
bias SignificantType of institution1
Public, less-than-2-year 420 120 1.27 1.26 0.0035 0.3 NPublic, 2-year 4,830 1,510 41.04 48.98 -1.8090 -4.2 YPublic, 4-year, non-doctorate-granting 1,350 280 9.93 7.50 0.5545 5.9 YPublic, 4-year, doctorate-granting 2,720 430 18.29 11.68 1.5057 9.0 YPrivate not-for-profit, less-than-4 year 400 130 1.06 1.03 0.0065 0.6 NPrivate not-for-profit, 4-year, non-doctorate-
granting 1,870 260 9.44 5.28 0.9455 11.1 Y Private not-for-profit, 4-year, doctorate-granting 1,480 210 5.83 3.14 0.6119 11.7 Y Private for-profit, less-than-2-year 1,000 460 6.10 9.95 -0.8768 -12.6 Y Private for-profit, 2-year-or-more 820 340 7.04 11.18 -0.9418 -11.8 Y
Bureau of Economic Analysis Code (OBE) Region New England (CT, ME, MA, NH, RI, VT) 980 230 5.16 4.93 0.0524 1.0 N Mid East (DE, DC, MD, NJ, NY, PA) 2,370 580 14.29 14.24 0.0120 0.1 N Great Lakes (IL, IN, MI, OH, WI) 2,320 540 16.65 15.22 0.3268 2.0 N Plains (IA, KS, MN, MO, NE, ND, SD) 1,600 300 7.60 5.90 0.3866 5.4 Y Southwest (AL, AR, FL, GA, KY, LA, MS, NC,
SC, TN, VA, WV) 3,550 890 23.83 22.41 0.3214 1.4 N Southwest (AZ, NM, OK, TX) 1,480 540 11.62 16.64 -1.1433 -9.0 Y Rocky Mountains (CO, ID, MT, UT, WY) 530 110 3.90 3.21 0.1568 4.2 N Far West (AK, CA, HI, NV, OR, WA) 1,830 530 15.51 17.02 -0.3440 -2.2 N Outlying areas (PR) 250 20 1.44 0.43 0.2312 19.1 Y
CPS record available Yes 11090 2670 68.57 65.06 0.7991 1.2 Y No 3810 1070 31.43 34.94 -0.7991 -2.5 Y
Applied for federal aid Yes 11,800 2,890 73.56 71.15 0.5479 0.8 N No 3,100 850 26.44 28.64 -0.5010 -1.9 N Unknown # # # 0.21 -0.0468 -100.0 N
See notes at end of table.
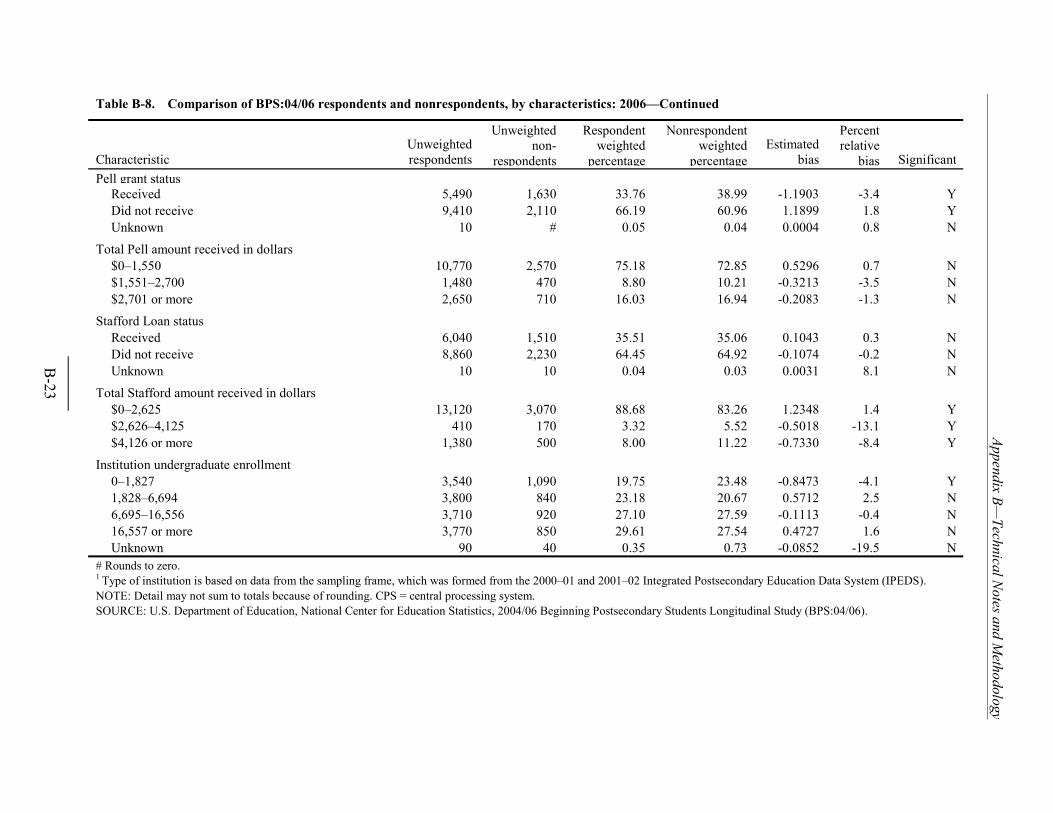
Appendix B—Technical N
otes and Methodology
B-23
Table B-8. Comparison of BPS:04/06 respondents and nonrespondents, by characteristics: 2006—Continued
Characteristic Unweighted respondents
Unweighted non-
respondents
Respondent weighted
percentage
Nonrespondent weighted
percentageEstimated
bias
Percent relative
bias SignificantPell grant status
Received 5,490 1,630 33.76 38.99 -1.1903 -3.4 Y Did not receive 9,410 2,110 66.19 60.96 1.1899 1.8 Y Unknown 10 # 0.05 0.04 0.0004 0.8 N
Total Pell amount received in dollars $0–1,550 10,770 2,570 75.18 72.85 0.5296 0.7 N $1,551–2,700 1,480 470 8.80 10.21 -0.3213 -3.5 N $2,701 or more 2,650 710 16.03 16.94 -0.2083 -1.3 N
Stafford Loan status Received 6,040 1,510 35.51 35.06 0.1043 0.3 N Did not receive 8,860 2,230 64.45 64.92 -0.1074 -0.2 N Unknown 10 10 0.04 0.03 0.0031 8.1 N
Total Stafford amount received in dollars $0–2,625 13,120 3,070 88.68 83.26 1.2348 1.4 Y $2,626–4,125 410 170 3.32 5.52 -0.5018 -13.1 Y $4,126 or more 1,380 500 8.00 11.22 -0.7330 -8.4 Y
Institution undergraduate enrollment 0–1,827 3,540 1,090 19.75 23.48 -0.8473 -4.1 Y 1,828–6,694 3,800 840 23.18 20.67 0.5712 2.5 N 6,695–16,556 3,710 920 27.10 27.59 -0.1113 -0.4 N 16,557 or more 3,770 850 29.61 27.54 0.4727 1.6 N Unknown 90 40 0.35 0.73 -0.0852 -19.5 N
# Rounds to zero. 1 Type of institution is based on data from the sampling frame, which was formed from the 2000–01 and 2001–02 Integrated Postsecondary Education Data System (IPEDS). NOTE: Detail may not sum to totals because of rounding. CPS = central processing system. SOURCE: U.S. Department of Education, National Center for Education Statistics, 2004/06 Beginning Postsecondary Students Longitudinal Study (BPS:04/06).

Appendix B—Technical Notes and Methodology
B-24
Table B-9 summarizes the bias analysis for each institution type. For the total BPS:04 cohort, approximately 45 percent of the variables examined in table B-9 had statistically significant bias, but the mean and median relative bias was low: less than 3 percent. The percentage of variables with statistically significant bias varied from 0 to 22 percent, by type of institution. The public less-than-2-year institutions and public 4-year doctorate-granting institutions had the largest percentage of variables with significant bias due to student nonresponse; however, the mean relative bias was less than 5 percent for these categories. As noted earlier, all respondents and nonrespondents are included on the BPS:04/06 data file, which eliminates bias due to student nonresponse.
Table B-9. Summary of student nonresponse bias for all students, by type of institution: 2006
Type of institution1 Mean estimated
percent relative biasMedian estimated
percent relative bias Percent
significant biasTotal -2.65 0.46 45.00
Public, less-than-2-year -3.59 0.00 21.43 Public, 2-year -3.02 0.00 0.00 Public, 4-year, non-doctorate-granting -8.78 -0.02 6.67 Public, 4-year, doctorate-granting -4.52 -0.30 20.69 Private not-for-profit, less-than-4 year -8.27 -1.41 0.00 Private not-for-profit, 4-year, non-doctorate-
granting -12.51 0.16 6.25 Private not-for-profit, 4-year, doctorate-
granting -0.78 0.00 3.33 Private for-profit, less-than-2-year -0.50 0.15 3.45 Private for-profit, 2-year-or-more -6.96 0.20 0.00 1 Type of institution is based on data from the sampling frame, which was formed from the 2000–01 and 2001–02 Integrated Postsecondary Education Data System (IPEDS). SOURCE: U.S. Department of Education, National Center for Education Statistics, 2004/06 Beginning Postsecondary Students Longitudinal Study (BPS:04/06).
Item-Level Bias Analysis
Another analysis examined the items with response rates less than 85 percent among respondents. Item response rates (RRI) are calculated as the ratio of the number of respondents for whom an in-scope response was obtained (Ix for item x) to the number of respondents who are asked to answer that item. The number asked to answer an item is the number of unit-level respondents (I) minus the number of respondents with a valid skip item for item x (Vx). When an abbreviated questionnaire is used to convert refusals, the eliminated questions are treated as item nonresponse (U.S. Department of Education 2003).
RRIx = Ix / (I – Vx)
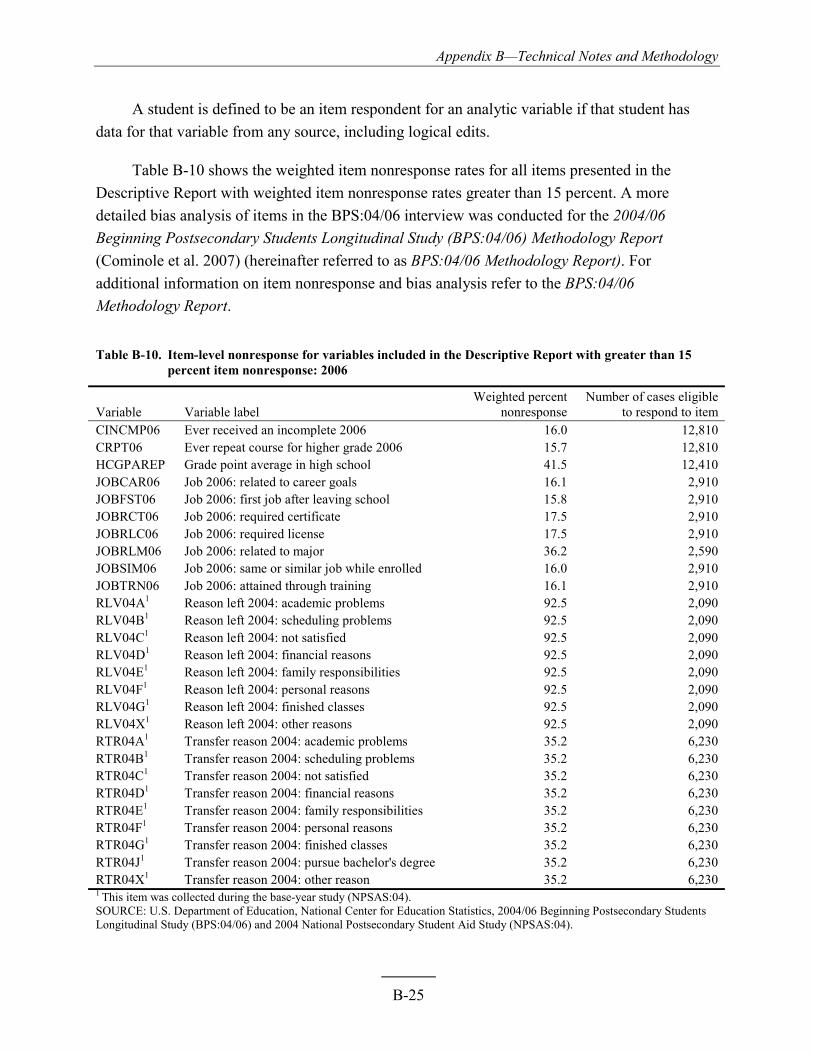
Appendix B—Technical Notes and Methodology
B-25
A student is defined to be an item respondent for an analytic variable if that student has data for that variable from any source, including logical edits.
Table B-10 shows the weighted item nonresponse rates for all items presented in the Descriptive Report with weighted item nonresponse rates greater than 15 percent. A more detailed bias analysis of items in the BPS:04/06 interview was conducted for the 2004/06 Beginning Postsecondary Students Longitudinal Study (BPS:04/06) Methodology Report (Cominole et al. 2007) (hereinafter referred to as BPS:04/06 Methodology Report). For additional information on item nonresponse and bias analysis refer to the BPS:04/06 Methodology Report.
Table B-10. Item-level nonresponse for variables included in the Descriptive Report with greater than 15 percent item nonresponse: 2006
Variable Variable label Weighted percent
nonresponseNumber of cases eligible
to respond to itemCINCMP06 Ever received an incomplete 2006 16.0 12,810 CRPT06 Ever repeat course for higher grade 2006 15.7 12,810 HCGPAREP Grade point average in high school 41.5 12,410 JOBCAR06 Job 2006: related to career goals 16.1 2,910 JOBFST06 Job 2006: first job after leaving school 15.8 2,910 JOBRCT06 Job 2006: required certificate 17.5 2,910 JOBRLC06 Job 2006: required license 17.5 2,910 JOBRLM06 Job 2006: related to major 36.2 2,590 JOBSIM06 Job 2006: same or similar job while enrolled 16.0 2,910 JOBTRN06 Job 2006: attained through training 16.1 2,910 RLV04A1 Reason left 2004: academic problems 92.5 2,090 RLV04B1 Reason left 2004: scheduling problems 92.5 2,090 RLV04C1 Reason left 2004: not satisfied 92.5 2,090 RLV04D1 Reason left 2004: financial reasons 92.5 2,090 RLV04E1 Reason left 2004: family responsibilities 92.5 2,090 RLV04F1 Reason left 2004: personal reasons 92.5 2,090 RLV04G1 Reason left 2004: finished classes 92.5 2,090 RLV04X1 Reason left 2004: other reasons 92.5 2,090 RTR04A1 Transfer reason 2004: academic problems 35.2 6,230 RTR04B1 Transfer reason 2004: scheduling problems 35.2 6,230 RTR04C1 Transfer reason 2004: not satisfied 35.2 6,230 RTR04D1 Transfer reason 2004: financial reasons 35.2 6,230 RTR04E1 Transfer reason 2004: family responsibilities 35.2 6,230 RTR04F1 Transfer reason 2004: personal reasons 35.2 6,230 RTR04G1 Transfer reason 2004: finished classes 35.2 6,230 RTR04J1 Transfer reason 2004: pursue bachelor's degree 35.2 6,230 RTR04X1 Transfer reason 2004: other reason 35.2 6,230 1 This item was collected during the base-year study (NPSAS:04). SOURCE: U.S. Department of Education, National Center for Education Statistics, 2004/06 Beginning Postsecondary Students Longitudinal Study (BPS:04/06) and 2004 National Postsecondary Student Aid Study (NPSAS:04).

Appendix B—Technical Notes and Methodology
B-26
A byproduct of the imputation (described in the imputation section of this appendix) is the reduction or elimination of item-level nonresponse bias. Imputation reduces or eliminates nonresponse bias by replacing missing data with statistically reasonable values. Missing data and the associated nonresponse bias for variables such as other grants, dependent student income, and independent student income are usually non-ignorable (i.e., the respondents’ distribution patterns differ from those in the full population). Therefore, replacing missing data with reasonable values produces imputed sample distributions that resemble full population distributions, thus reducing, if not eliminating, nonresponse bias. The use of carefully constructed imputation classes, donor-imputee matching criteria, and random hot-deck searches within imputation cells are all designed to ensure that imputed data are reasonable and that the nonresponse bias is ignorable within the imputation classes. The effectiveness of imputation implemented to reduce item nonresponse bias was presented in the BPS:04/06 Methodology Report.
Standard Errors
To facilitate computation of standard errors for both linear and nonlinear statistics, a vector of bootstrap sample weights was added to the analysis file. These weights are zero for units not selected in a particular bootstrap sample; weights for other units are inflated for the bootstrap subsampling. The initial analytic weights for the complete sample are also included for the purposes of computing the desired estimates. The vector of replicate weights allows for computing additional estimates for the sole purpose of estimating a variance. Assuming B sets of replicate weights, the variance of any estimate, θ̂ , can be estimated by replicating the estimation procedure for each replicate and computing a simple variance of the replicate estimates (i.e.,
BVar
B
bb
2
1
)ˆˆ()ˆ(
θθθ
−=
∑−
•
where •bθ̂ is the estimate based on the b-th replicate weight [where b = 1 to the number of
replicates] and B is the total number of sets of replicate weights. A total of B = 200 replicates are used for BPS:04/06. Once the replicate weights are provided, this estimate can be produced by most survey software packages (e.g., SUDAAN).
The replicate weights were produced using a methodology and computer software developed by Kaufman (2004). This methodology allows for finite population correction factors at two stages of sampling. The NPSAS and BPS:04/06 application of the method incorporated the finite population correction factor at the first stage only where sampling fractions were

Appendix B—Technical Notes and Methodology
B-27
generally high. At the second stage, where the sampling fraction was generally low, the finite population correction factor was set to 1.00.
Cautions for Analysts
Sources of Error
The estimates in this report are subject to sampling and nonsampling errors. Nonsampling errors are due to a number of sources, including but not limited to nonresponse, coding and data entry errors, misspecification of composite variables, and inaccurate imputations. In a study like BPS:04/06, there are multiple sources of data for some variables (CPS, CADE, Student Interview, etc.) and reporting differences can occur in each. Data swapping and other forms of perturbation, implemented to protect respondent confidentiality, can also lead to inconsistencies.
Sampling errors exist in all sample-based datasets, including BPS:04/06. Estimates calculated from a sample will differ from estimates calculated from other samples even if all the samples used the same sample design and methods.
The standard error is a measure of the precision of the estimate. In this tabulation, each estimate’s standard error was calculated using bootstrap replication procedures and can be produced using the BPS DAS software. Standard errors for table 1.3 are presented in table B-11.
Table B-11. Standard errors for table 1.3: Percentage distribution of beginning postsecondary students’ degree plans at their first institution, by student and institutional characteristics: 2003–04
Student and institutional characteristics None Certificate Associate’s degree Bachelor’s degree
Total 0.63 0.43 0.79 0.69
Type of first institution 4-year
Public 0.45 0.22 0.80 1.01 Private not-for-profit 0.51 0.36 1.85 2.03 Private for-profit 0.34 1.01 8.31 8.59
2-year Public 1.30 0.59 1.55 1.08 Private not-for-profit 2.31 4.71 5.66 4.22 Private for-profit 1.37 6.89 8.15 1.46
See notes at end of table.

Appendix B—Technical Notes and Methodology
B-28
Table B-11. Standard errors for table 1.3: Percentage distribution of beginning postsecondary students’ degree plans at their first institution, by student and institutional characteristics: 2003–04—Continued
Student and institutional characteristics None Certificate Associate’s degree Bachelor’s degree
Less-than-2-year Public 0.32 2.22 2.17 0.46 Private for-profit 0.32 0.91 0.84 0.30
Level of first institution 4-year 0.33 0.19 1.33 1.34 2-year 1.22 0.83 1.59 0.98 Less-than-2-year 0.26 0.84 0.79 0.27
Control of first institution Public 0.85 0.37 0.92 0.85 Private not-for-profit 0.50 0.46 1.77 1.90 Private for-profit 0.47 2.37 3.04 2.02
Enrollment intensity through 2006 Always full-time 0.45 0.60 0.98 0.80 Mixed 0.96 0.63 1.22 1.06 Always part-time 2.07 1.04 2.04 0.91
Gender Male 0.85 0.71 1.37 0.97 Female 0.63 0.56 0.89 0.93
Age first year enrolled 18 years or younger 0.69 0.37 1.22 0.99 19 years 0.90 0.55 1.24 1.21 20–23 years 1.12 1.45 2.11 1.56 24–29 years 1.32 1.69 2.56 1.45 30 or older 1.66 1.39 2.05 1.28
Race/ethnicity White 0.82 0.56 1.16 1.07 Black 0.65 1.29 2.24 2.25 Hispanic 1.31 1.49 1.74 1.53 Asian/Pacific Islander 2.03 1.24 3.06 2.68 American Indian 3.26 4.32 9.33 6.25 Multiple races/other 1.65 1.62 3.28 2.57
Dependency status first year Dependent 0.64 0.34 0.94 0.80 Independent 0.97 0.97 1.44 0.91
Unmarried, no dependents 1.36 1.52 2.56 1.91 Single parent 1.29 1.71 2.24 1.22 Married 1.75 1.33 2.05 1.32
See notes at end of table.
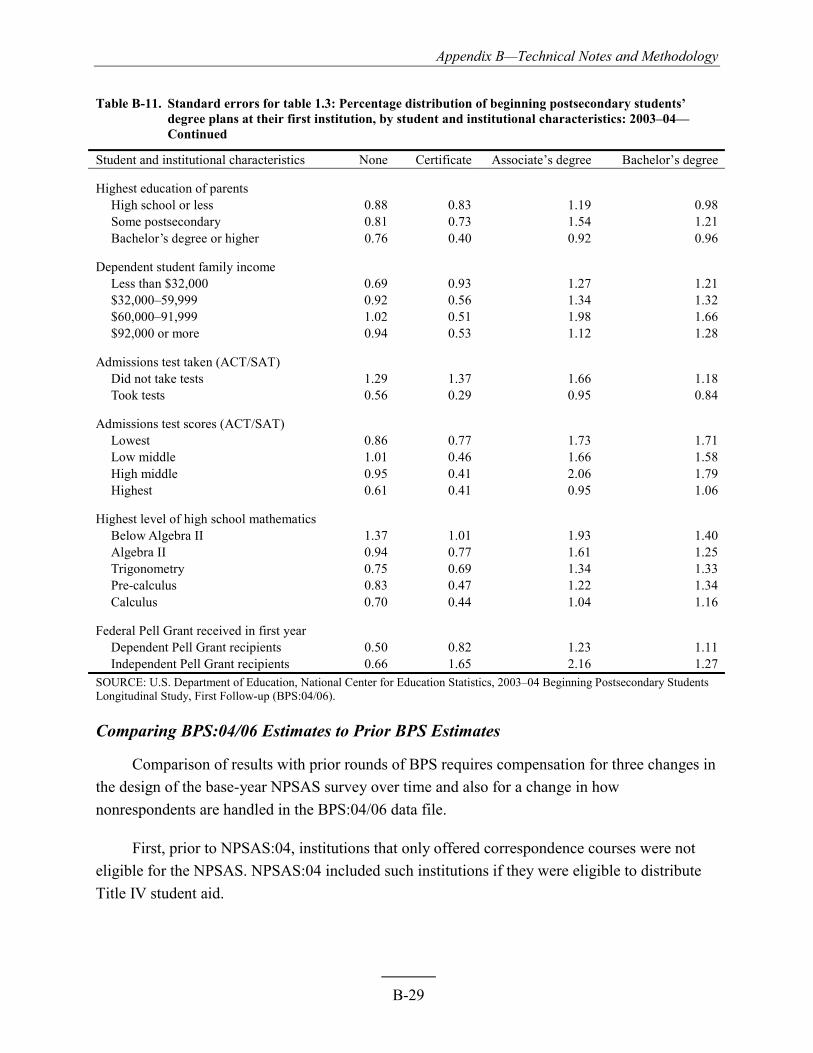
Appendix B—Technical Notes and Methodology
B-29
Table B-11. Standard errors for table 1.3: Percentage distribution of beginning postsecondary students’ degree plans at their first institution, by student and institutional characteristics: 2003–04—Continued
Student and institutional characteristics None Certificate Associate’s degree Bachelor’s degree
Highest education of parents High school or less 0.88 0.83 1.19 0.98 Some postsecondary 0.81 0.73 1.54 1.21 Bachelor’s degree or higher 0.76 0.40 0.92 0.96
Dependent student family income Less than $32,000 0.69 0.93 1.27 1.21 $32,000–59,999 0.92 0.56 1.34 1.32 $60,000–91,999 1.02 0.51 1.98 1.66 $92,000 or more 0.94 0.53 1.12 1.28
Admissions test taken (ACT/SAT) Did not take tests 1.29 1.37 1.66 1.18 Took tests 0.56 0.29 0.95 0.84
Admissions test scores (ACT/SAT) Lowest 0.86 0.77 1.73 1.71 Low middle 1.01 0.46 1.66 1.58 High middle 0.95 0.41 2.06 1.79 Highest 0.61 0.41 0.95 1.06
Highest level of high school mathematics Below Algebra II 1.37 1.01 1.93 1.40 Algebra II 0.94 0.77 1.61 1.25 Trigonometry 0.75 0.69 1.34 1.33 Pre-calculus 0.83 0.47 1.22 1.34 Calculus 0.70 0.44 1.04 1.16
Federal Pell Grant received in first year Dependent Pell Grant recipients 0.50 0.82 1.23 1.11 Independent Pell Grant recipients 0.66 1.65 2.16 1.27
SOURCE: U.S. Department of Education, National Center for Education Statistics, 2003–04 Beginning Postsecondary Students Longitudinal Study, First Follow-up (BPS:04/06).
Comparing BPS:04/06 Estimates to Prior BPS Estimates
Comparison of results with prior rounds of BPS requires compensation for three changes in the design of the base-year NPSAS survey over time and also for a change in how nonrespondents are handled in the BPS:04/06 data file.
First, prior to NPSAS:04, institutions that only offered correspondence courses were not eligible for the NPSAS. NPSAS:04 included such institutions if they were eligible to distribute Title IV student aid.
Appendix B—Technical Notes and Methodology
B-30
Second, for NPSAS:2000, the survey was restricted for the first time to institutions participating in Title IV student aid programs. According to the DAS for NPSAS:96, only about 1 percent of the sampled undergraduates were attending an institution not eligible to participate in Title IV aid programs. When students attending non-Title IV-eligible institutions were excluded from the NPSAS:96 sample, the percentage of undergraduates who received financial aid increased by less than 1 percent. This small change primarily affects comparisons of students enrolled in less-than-2-year and private for-profit institutions. When using the DAS from prior BPS studies for comparison to the BPS:04 cohort, analysts may want to filter cases in the prior studies (BPS:90 cohort, BPS:96 cohort) based on the variable that identifies whether the student was sampled from an institution that was eligible to participate in Title IV aid programs (T4ELIG).
Finally, a design change in the NPSAS was made, beginning with NPSAS:90, to improve full-year estimates. NPSAS:90 sampled students were enrolled at four discrete points in time: summer (August), fall (October), winter (February), and spring (June). Since implementation of NPSAS in 1993, institutions have been asked to provide one list that represents students enrolled at any time during the respective financial aid award year. In NPSAS:90, those students who were initially sampled in the fall could have been enrolled for the full academic year.
The BPS:04/06 also differs from prior rounds of BPS in that the BPS:04/06 dataset contains data items and a positive analysis weight for all sample members who were determined to be eligible; this includes nonrespondents as well as respondents to the BPS:04/06 data collection. Nonrespondents to the interview appear on the data file with imputed data for all variables. In previous rounds of BPS, the nonrespondents appeared on the file but did not have data items and had a value of zero for the analysis weight.
Additional Notes on the Accuracy of Estimates
RTI conducted a bias analysis to determine if any variables were significantly biased due to institutional- and student-level nonresponse. Several variables were found to have significant bias before weighting. The weighting procedures appear to have reduced the amount of significant bias for these variables. Additional information on the nonresponse bias analysis and weighting procedures can be found in the quality of estimates and weighting sections of this appendix.
Appendix B—Technical Notes and Methodology
B-31
Data Analysis System
The estimates presented in the report were produced using the BPS:04/06 Data Analysis System (DAS), a web-based software application that enables users to generate tables for most of the postsecondary surveys conducted by NCES. The DAS produces the design-adjusted standard errors necessary for testing the statistical significance of differences in the estimates. The DAS also contains a detailed description of how each variable was created, and includes question wording for items coming directly from an interview.
With the DAS, users can replicate or expand upon the tables presented in this report. The output from the DAS includes the table estimates (e.g., percentages or means), the proper standard errors,12 and weighted sample sizes for the estimates. If the number of valid cases is too small to produce a reliable estimate (fewer than 30 cases), the DAS prints the message “low-N” instead of the estimate.
In addition to tables, DAS users may conduct covariance analyses, either with Weighted Least Squares or Logistic regressions. Many options are available for output with the regression results. For example, a Winsor filter can be used to eliminate cases with extreme values by deleting a certain percentage of cases from the top and bottom of the range. For a description of all the options available, users should access the DAS website: http://nces.ed.gov/dasolv2. If users are new to the DAS, the DAS Help Center provides online tutorials offering step-by-step instructions in how to use all the functions of the DAS: http://nces.ed.gov/dasol/help.
The DAS can be accessed electronically at http://nces.ed.gov/. For more information, contact:
Aurora D’Amico Postsecondary Studies Division National Center for Education Statistics 1990 K Street NW Washington, DC 20006-5652 (202) 502–7334 Aurora.D’[email protected]
12 The BPS samples are not simple random samples; therefore, simple random sample techniques for estimating sampling error cannot be applied to these data. The DAS takes into account the complexity of the sampling procedures and calculates standard errors appropriate for such samples. The method for computing sampling errors used by the DAS involves approximating the estimator by replication of the sampled population. The procedure used is a bootstrap technique.
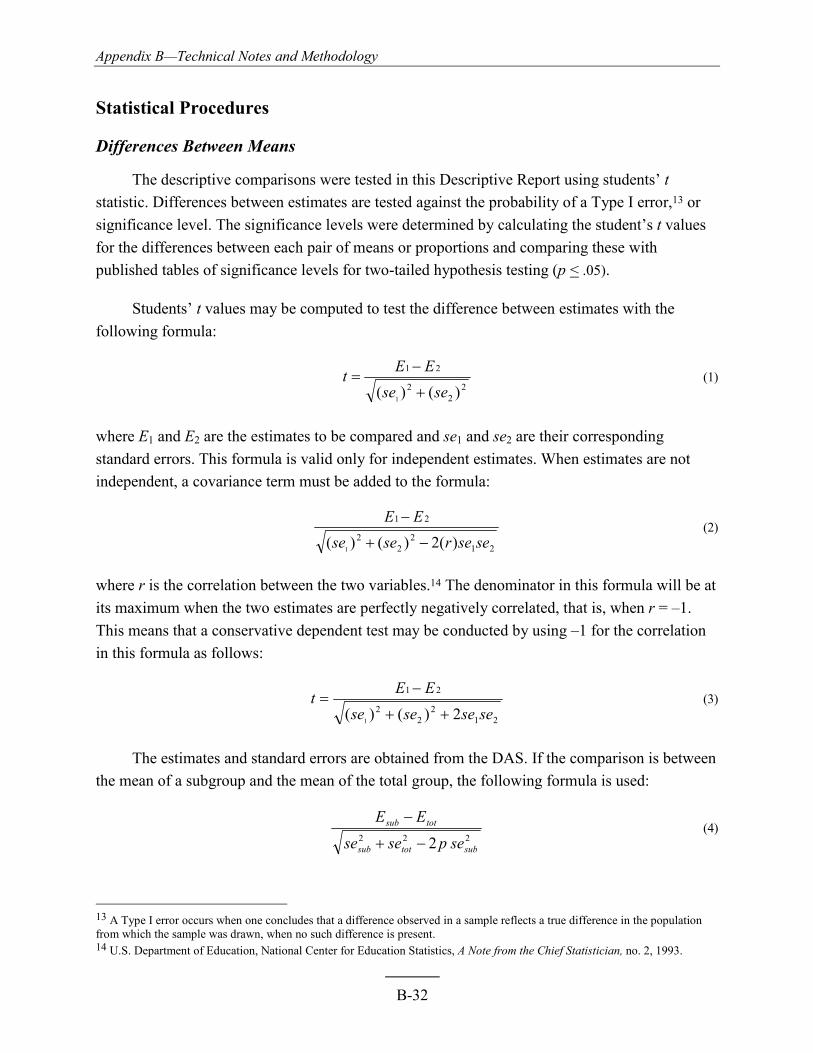
Appendix B—Technical Notes and Methodology
B-32
Statistical Procedures
Differences Between Means
The descriptive comparisons were tested in this Descriptive Report using students’ t statistic. Differences between estimates are tested against the probability of a Type I error,13 or significance level. The significance levels were determined by calculating the student’s t values for the differences between each pair of means or proportions and comparing these with published tables of significance levels for two-tailed hypothesis testing (p < .05).
Students’ t values may be computed to test the difference between estimates with the following formula:
2
22
21
)()( 1 seseEEt
+
−= (1)
where E1 and E2 are the estimates to be compared and se1 and se2 are their corresponding standard errors. This formula is valid only for independent estimates. When estimates are not independent, a covariance term must be added to the formula:
212
22
21
)(2)()( 1 seserseseEE−+
− (2)
where r is the correlation between the two variables.14 The denominator in this formula will be at its maximum when the two estimates are perfectly negatively correlated, that is, when r = –1. This means that a conservative dependent test may be conducted by using –1 for the correlation in this formula as follows:
212
22
21
2)()( 1 seseseseEEt
++
−= (3)
The estimates and standard errors are obtained from the DAS. If the comparison is between the mean of a subgroup and the mean of the total group, the following formula is used:
222 2 subtotsub
totsub
sepsese
EE
−+
− (4)
13 A Type I error occurs when one concludes that a difference observed in a sample reflects a true difference in the population from which the sample was drawn, when no such difference is present. 14 U.S. Department of Education, National Center for Education Statistics, A Note from the Chief Statistician, no. 2, 1993.
Appendix B—Technical Notes and Methodology
B-33
where p is the proportion of the total group contained in the subgroup.15 The estimates, standard errors, and correlations can all be obtained from the DAS.
There are hazards in reporting statistical tests for each comparison. First, comparisons based on large t statistics may appear to merit special attention. This can be misleading since the magnitude of the t statistic is related not only to the observed differences in means or percentages but also to the number of respondents in the specific categories used for comparison. Hence, a small difference compared across a large number of respondents would produce a large t statistic.
A second hazard in reporting statistical tests is the possibility that one can report a “false positive” or Type I error. In the case of a t statistic, this false positive would result when a difference measured with a particular sample showed a statistically significant difference when there is no difference in the underlying population. Statistical tests are designed to control this type of error, denoted by alpha. The alpha level of .05 selected for findings in this Descriptive Report indicates that a difference of a certain magnitude or larger would be produced no more than 1 time out of 20 when there was no actual difference in the quantities in the underlying population. When we test hypotheses that show t values at the .05 level or smaller, we treat this finding as rejecting the null hypothesis that there is no difference between the two quantities.
15 Ibid.