Descriptive Statisticsnhmath.lonestar.edu/Faculty/HortonP/Math 1332/Math 1332 Lecture... ·...
35
Descriptive Statistics: Describes, organizes, and presents data(information) about populations and samples. Inferential Statistics: Draws conclusions about populations based upon samples. This class focuses on descriptive statistics!
Transcript of Descriptive Statisticsnhmath.lonestar.edu/Faculty/HortonP/Math 1332/Math 1332 Lecture... ·...

Descriptive Statistics:
Describes, organizes, and presents data(information) about
populations and samples.
Inferential Statistics:
Draws conclusions about populations based upon samples.
This class focuses on descriptive statistics!

Frequency Distribution:
A table that lists all the values of a data set along with their respective
frequencies.
Data Set: 1,2,2,1,5,4,3,2,1,1
Value Frequency
1 4
2 3
3 1
4 1
5 1
Total 10

Grouped Frequency Distribution:
Disjoint classes(ranges) are established for the data
values. The grouped frequency distribution lists all
the classes along with their respective frequencies.
Data Set: 10,21,22,12,50,42,33,20,15,17
Class Frequency
10-19 4
20-29 3
30-39 1
40-49 1
50-59 1
Total 10
There is a loss of detail in a grouped frequency distribution-the actual data values are
lost!

0
1
2
3
4
5
1 2 3 4 5
Frequency Polygon
Graphs of frequency distributions:
Frequency Polygon:
The dots represent frequencies, and their connected with segments.
Allows easy visual determination of the most and least frequently occurring values!
Value Frequency
1 4
2 3
3 1
4 1
5 1
Total 10

4
3
1 1 1
0
1
2
3
4
5
10-19 20-29 30-39 40-49 50-59
Fre
qu
en
cy
value
Histogram
Histogram:
Special bar graph where the bars are centered at the values, touch adjacent bars, and the
height is the frequency.
Allows easy visual determination of the most and least frequently occurring values!
1 2 3 4 5

4
3
1 1 1
0
1
2
3
4
5
10-19 20-29 30-39 40-49 50-59
Fre
qu
en
cy
value
Grouped Histogram
Grouped Histogram:
Similar to a histogram
Class Frequency
10-19 4
20-29 3
30-39 1
40-49 1
50-59 1
Total 10

Here is a data set consisting of 1,000 values from 0 to 9.
9 4 6 5 8 3 7 5 3 5
2 3 7 6 1 5 9 5 5 6
3 5 5 8 8 3 8 7 7 7
5 6 6 5 2 4 4 7 4 6
5 6 4 5 4 6 4 5 7 3
2 4 5 4 6 6 3 5 6 2
4 3 4 7 5 2 5 5 5 6
7 3 5 6 4 3 8 3 4 6
6 6 5 6 6 6 6 3 5 6
7 2 5 8 9 5 7 4 4 4
7 5 4 3 7 4 5 6 6 8
5 4 6 6 6 7 6 7 2 6
6 5 4 6 2 7 5 5 3 6
3 7 4 4 6 2 6 6 4 5
3 5 8 4 6 5 2 4 4 5
8 7 7 6 3 6 4 5 5 3
4 5 5 3 5 4 2 6 6 5
6 4 4 6 4 6 4 4 6 7
4 5 4 7 5 5 9 4 5 4
6 6 4 3 8 6 5 4 5 4
2 4 6 6 5 5 5 6 6 6
7 7 5 5 6 2 2 4 4 6
8 9 9 7 3 6 4 6 4 5
5 7 5 2 4 3 4 4 5 6
4 4 8 4 6 8 4 5 8 5
8 7 5 1 3 6 4 6 6 7

8 5 4 5 2 2 5 8 5 5
1 6 7 4 9 1 6 6 7 4
5 5 6 5 5 6 6 2 7 2
7 6 3 6 5 6 4 8 3 5
3 5 6 4 8 7 5 6 8 6
3 4 6 2 6 4 8 4 5 5
5 3 6 6 4 5 6 5 4 5
2 7 7 7 4 4 6 5 4 8
6 4 5 4 5 6 8 5 4 7
2 2 2 7 6 3 3 5 4 5
6 4 3 5 8 4 3 4 6 2
3 6 6 3 3 4 7 4 3 2
6 3 6 3 6 4 3 4 3 3
2 6 6 4 5 6 3 5 4 3
6 3 3 3 7 4 4 5 1 5
3 3 5 6 4 3 5 5 4 4
6 6 7 6 6 3 4 8 2 5
6 5 5 5 5 7 8 4 1 5
3 4 4 3 4 5 6 4 5 5
4 5 6 5 4 4 7 6 7 3
5 4 4 5 5 5 6 4 4 5
5 3 7 7 2 3 7 6 6 5
2 5 3 3 4 3 4 4 7 6
6 6 3 6 4 5 2 3 6 4
6 6 6 3 6 5 5 2 7 3
4 5 5 3 2 4 6 7 2 2
6 4 5 7 3 4 6 4 5 2
5 7 4 4 3 5 2 7 6 5
5 5 3 4 5 2 6 3 4 4
3 4 6 4 6 5 6 5 5 1

4 3 5 6 5 6 7 6 3 5
6 8 5 3 5 5 6 4 6 3
4 4 5 5 6 5 1 4 6 5
4 4 5 5 5 4 5 5 7 7
6 6 4 5 5 5 2 7 6 4
6 5 6 4 5 6 5 4 3 4
5 5 4 4 6 4 4 5 3 3
7 5 4 6 4 3 3 2 5 5
8 6 7 6 6 4 8 6 5 5
2 6 4 5 4 4 5 5 5 5
5 4 5 4 4 5 4 4 6 2
7 5 5 6 5 4 4 8 6 5
5 4 6 5 6 6 6 2 6 5
1 5 7 6 6 5 8 5 8 7
3 2 5 5 3 6 5 3 6 4
5 7 6 7 3 7 2 4 4 6
7 6 9 6 6 4 4 6 6 5
5 5 5 6 6 5 4 4 4 5
6 4 8 3 8 4 4 5 7 5
3 7 3 5 4 5 5 5 7 3
8 4 4 4 5 6 5 5 3 4
5 6 7 4 5 6 5 4 2 5
3 8 7 5 5 3 9 4 5 4
5 3 3 5 5 8 4 6 7 5
8 5 6 5 3 7 6 7 6 5
6 2 3 1 5 4 7 5 5 4
5 6 6 5 8 4 6 5 6 4
6 6 7 7 6 3 7 5 6 3
2 5 7 7 3 6 6 4 7 5
3 7 8 5 5 5 3 5 5 5

6 4 7 4 3 4 5 5 4 6
4 6 7 7 6 4 5 6 6 8
7 3 8 6 3 7 5 8 5 7
4 4 4 5 6 4 8 7 6 6
4 5 5 2 6 4 6 4 5 6
3 0 4 5 7 5 4 6 8 6
5 6 6 7 7 5 6 4 7 5
3 4 6 6 5 4 6 8 3 4
6 7 5 7 7 5 6 5 5 4
6 6 4 4 5 3 6 6 5 4
4 5 5 5 4 5 5 4 2 5
3 3 7 3 4 7 4 1 4 6
4 6 8 3 5 3 6 4 7 4
5 6 7 4 3 2 4 7 8 6
Excel can automatically construct a frequency distribution and histogram for this
large data set.

x Frequency
0 1
1 11
2 51
3 110
4 206
5 250
6 214
7 100
8 48
9 9
Total 1,000
A nice compact summary of this large data set!

1
11
51
110
206
250
214
100
48
9
0
50
100
150
200
250
300
0 1 2 3 4 5 6 7 8 9
Fre
qu
en
cy
x
Histogram
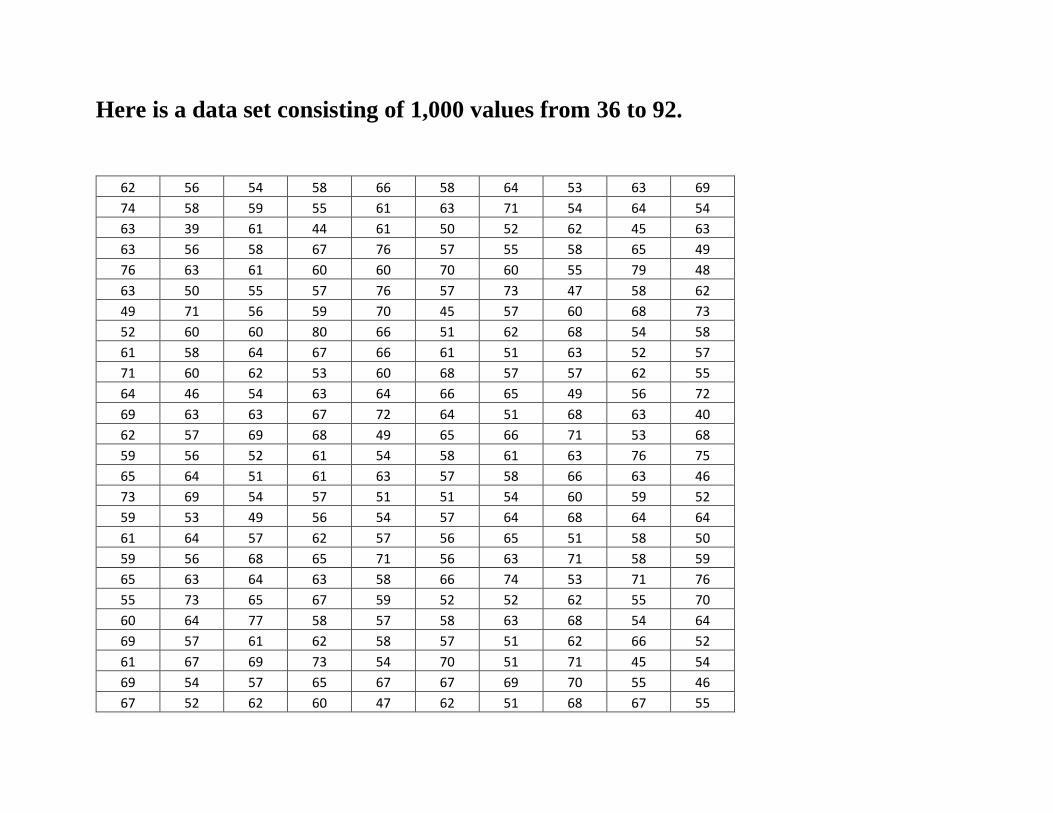
Here is a data set consisting of 1,000 values from 36 to 92.
62 56 54 58 66 58 64 53 63 69
74 58 59 55 61 63 71 54 64 54
63 39 61 44 61 50 52 62 45 63
63 56 58 67 76 57 55 58 65 49
76 63 61 60 60 70 60 55 79 48
63 50 55 57 76 57 73 47 58 62
49 71 56 59 70 45 57 60 68 73
52 60 60 80 66 51 62 68 54 58
61 58 64 67 66 61 51 63 52 57
71 60 62 53 60 68 57 57 62 55
64 46 54 63 64 66 65 49 56 72
69 63 63 67 72 64 51 68 63 40
62 57 69 68 49 65 66 71 53 68
59 56 52 61 54 58 61 63 76 75
65 64 51 61 63 57 58 66 63 46
73 69 54 57 51 51 54 60 59 52
59 53 49 56 54 57 64 68 64 64
61 64 57 62 57 56 65 51 58 50
59 56 68 65 71 56 63 71 58 59
65 63 64 63 58 66 74 53 71 76
55 73 65 67 59 52 52 62 55 70
60 64 77 58 57 58 63 68 54 64
69 57 61 62 58 57 51 62 66 52
61 67 69 73 54 70 51 71 45 54
69 54 57 65 67 67 69 70 55 46
67 52 62 60 47 62 51 68 67 55

71 76 56 53 63 60 57 41 64 66
59 62 64 53 54 64 52 73 73 62
68 58 58 70 68 74 65 43 65 52
81 57 57 58 54 64 72 71 58 66
56 64 62 68 48 53 41 56 68 73
60 49 56 55 70 53 59 61 71 60
44 79 64 60 56 67 45 57 50 58
54 54 46 69 59 51 66 53 58 64
65 59 55 60 53 58 85 59 60 70
67 58 79 64 61 68 57 53 45 56
67 57 69 40 71 61 74 61 63 56
57 59 63 49 66 53 57 51 47 50
57 56 65 63 65 71 60 70 64 60
51 69 53 53 71 54 65 48 47 62
81 58 55 73 65 59 65 70 65 58
65 69 49 53 60 59 56 60 55 53
56 58 61 67 59 68 64 59 66 58
63 61 58 66 62 67 66 59 75 54
55 55 71 47 58 70 48 57 49 55
52 55 60 53 68 63 51 64 64 77
54 70 67 49 59 52 57 69 92 65
78 74 54 67 55 57 69 59 55 58
52 73 60 69 47 55 64 61 53 60
48 54 59 54 62 63 68 57 72 71
43 58 58 70 57 50 53 63 61 69
68 61 53 60 60 59 81 63 51 53
42 47 49 64 68 60 68 71 55 41
59 56 52 54 50 54 60 69 61 50
70 55 56 48 64 70 53 51 54 56
62 70 67 57 68 56 60 54 60 71

59 61 60 54 62 71 56 79 59 55
49 50 63 59 47 64 53 62 56 50
68 58 72 60 55 50 57 59 54 68
65 44 57 61 79 58 54 66 72 65
69 57 62 57 72 61 58 56 61 36
59 52 58 68 50 57 63 48 83 57
46 53 69 65 59 45 61 72 61 71
50 58 64 63 64 62 66 72 62 53
62 50 73 72 58 51 59 66 52 47
62 49 72 57 65 66 55 67 52 53
54 63 59 61 60 49 52 59 60 61
65 59 66 68 59 53 70 66 56 49
62 56 58 66 51 58 83 69 49 54
72 52 59 55 56 70 62 60 70 57
58 56 53 54 60 74 62 64 60 63
64 53 62 56 56 72 53 66 60 57
63 60 59 67 52 69 53 53 49 66
76 64 58 63 51 63 44 69 74 61
54 51 67 44 56 66 56 53 54 66
58 46 54 61 53 62 50 58 55 59
55 51 55 52 65 61 58 60 69 55
65 66 72 56 58 63 49 47 69 54
64 69 54 68 60 71 58 66 53 59
72 69 51 62 55 45 47 59 69 61
65 61 56 59 64 65 64 56 60 61
69 79 54 74 65 62 64 51 58 55
46 54 54 67 66 45 53 70 51 69
47 53 70 63 66 42 47 47 62 51
64 53 57 60 69 56 61 54 57 51
54 48 65 57 57 61 62 59 70 73

69 46 56 52 64 65 52 63 63 57
60 65 59 58 52 51 50 64 53 44
59 68 59 54 63 49 62 64 52 53
65 53 47 57 52 48 59 61 61 40
60 73 54 60 70 49 47 60 55 53
51 52 60 63 59 51 52 69 58 52
54 63 69 51 74 54 57 54 59 62
76 61 70 70 51 70 65 73 53 60
61 55 70 57 52 59 53 51 58 68
40 53 64 50 69 48 59 56 58 68
56 61 54 60 56 55 58 41 63 63
58 66 54 62 53 55 49 53 48 59
61 59 72 54 50 49 65 50 57 78
68 60 51 69 53 62 63 56 53 74
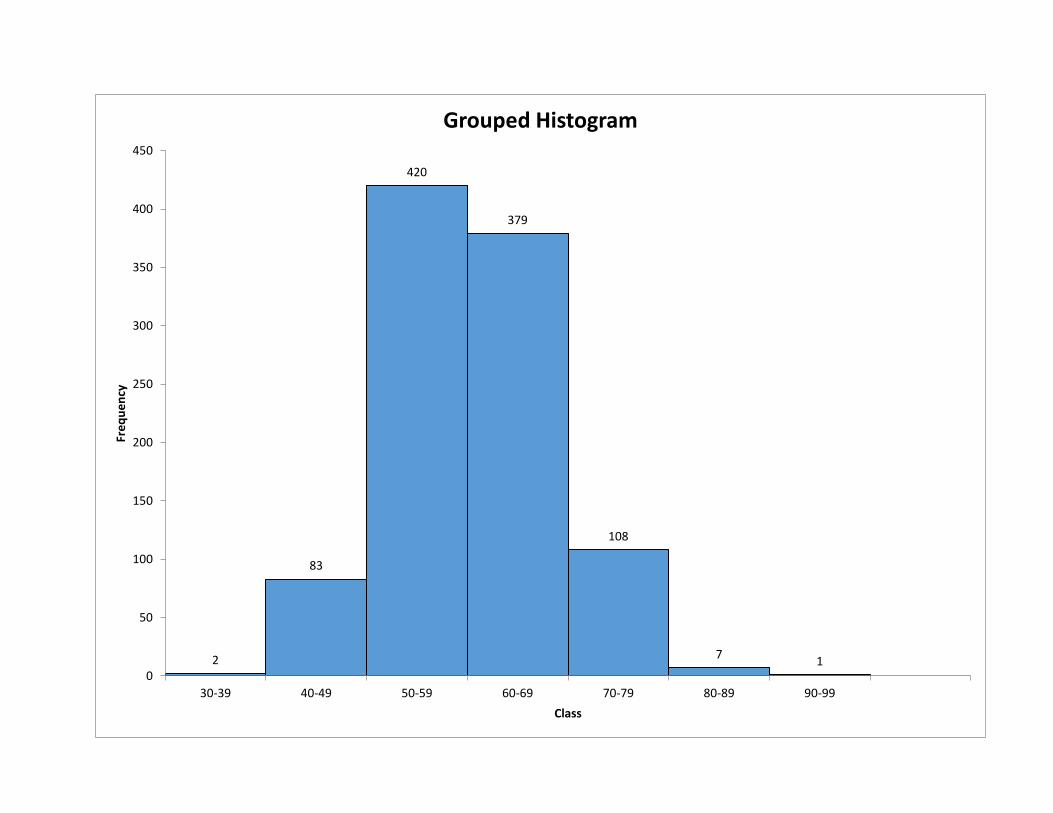
Excel can automatically construct a grouped frequency distribution and histogram
for this large data set.

Class Frequency
30-39 2
40-49 83
50-59 420
60-69 379
70-79 108
80-89 7
90-99 1
Total 1,000
A nice compact summary of this large data set!
2
83
420
379
108
71
0
50
100
150
200
250
300
350
400
450
30-39 40-49 50-59 60-69 70-79 80-89 90-99
Fre
qu
en
cy
Class
Grouped Histogram

Stem and Leaf Plot:
The actual data values themselves are used to create a frequency
distribution of the data set.
Data Set: 10,22,31,11,22,36,46,45,50,42
1 0 1
2 2 2
3 1 6
4 6 5 2
5 0
Allows easy visual determination of the most and least frequently occurring decades!

Ordered Stem and Leaf Plot:
The leaves are listed in ascending order.
1 0 1
2 2 2
3 1 6
4 2 5 6
5 0
Allows easy visual determination of the smallest and largest values!
Example:
3 2 3 5 8
4 0 3 9
5 1 1
6 2 2 7
7 0 0 0 5
How many values are in the data set? 16 What’s the smallest value? 32
What’s the largest value? 75 What’s the most frequently occurring value? 70
How many values are in the 60’s? 3 Which decade has the fewest values? 50’s

Measures of Central Tendency:
One value will be used to characterize or summarize an entire data set. In the case
of numerical data, it’s thought to represent the center or middle of the values.
Some data sets are very large with a wide range of values, so trying to characterize
all of the values with one value is a pretty bold undertaking!

Our textbook discusses four such measures of center:
Mean
Median
Mode
Midrange
The Mean of a list of numerical data 1 2 3, , , , nx x x x is defined to be
1 2 3 nx x x x
n
+ + + +.
The formula is sometimes written in abbreviated form as x
n
, where the Greek
letter is the abbreviation for add them up.
If the data set represents a sample, the mean value is abbreviated as x and called
the sample mean.
If the data set represents an entire population, the mean value is abbreviated with
the Greek letter and called the population mean.

Examples of Mean Calculations:
1. 1,2,2,3
1 2 2 3 82
4 4
+ + += =
Sometimes the value of the mean will be an actual value in the data set.
2. 1,2,2,3,4
1 2 2 3 4 122 4
5 5.
+ + + += =
Sometimes the value of the mean won’t be an actual value in the data set.
If you give a rounded value for the mean, always round to one more decimal place
than the data values.

3.
0 2 3
1 0 3 9
2 1 1
2 3 10 13 19 21 21 8912.7
7 7
+ + + + + += =
4.
Value Frequency
1 11
2 13
3 22
Total 46
1 1 1 2 2 2 3 3 3 1 11 2 13 3 22 11 26 66 1032 2
46 46 46 46.
+ + + + + + + + + + + + + + += = = =

To determine the Median of a list of numerical data, you first arrange the values in
order.
If there is an odd number of values in the data set, the median is the middle value.
If there is an even number of values in the data set, the median is the average of the
middle two values.
Examples of Median Calculations:
1. 5,2,6,3,8
2 3 5 6 8, , , ,
The median is 5.
When the number of values is odd, the median value will definitely be an actual
value in the data set.
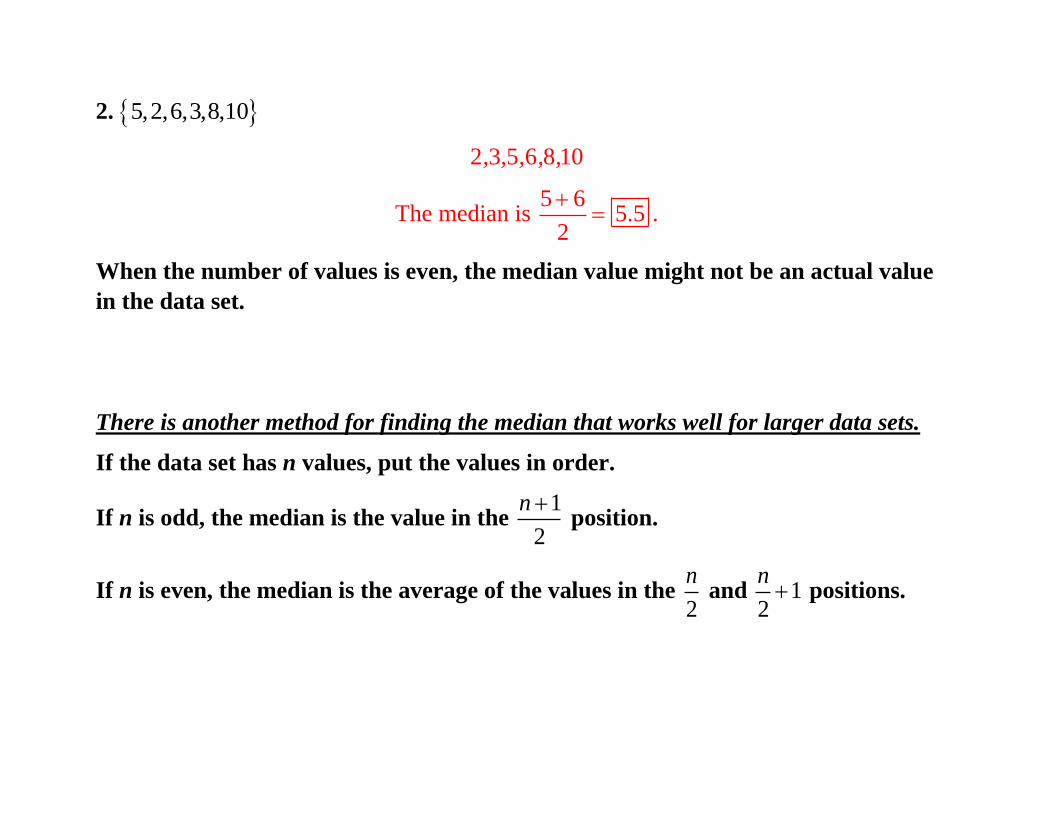
2. 5,2,6,3,8,10
2 3 5 6 8 10, , , , ,
The median is 5 6
5.52
+= .
When the number of values is even, the median value might not be an actual value
in the data set.
There is another method for finding the median that works well for larger data sets.
If the data set has n values, put the values in order.
If n is odd, the median is the value in the 1
2
n + position.
If n is even, the median is the average of the values in the 2
n and 1
2
n+ positions.

More Examples of Median Calculations:
3. 5,2,6,3,8
1 65 3
2 2
nn
+= = =
2 3 5 6 8, , , ,
The third value is the median value, and it’s 5.
4. 5,2,6,3,8,10
66 3 1 4
2 2 2
n nn ,= = = + =
2 3 5 6 8 10, , , , ,
The average of the third and fourth values is the median, and it’s 5 6
5.52
+= .

5.
3 2 3 5 8 9 9
4 0 3 4 7 9 9
5 1 1 2 2 8 9
6 2 2 7 7 8 9 9
1 2625 13
2 2
nn
+= = =
The median is the thirteenth value, and it’s 51.
6.
3 2 3 5 8 9 9
4 0 3 4 7 9 9
5 1 1 2 2 8 9
6 2 2 7 7 8 9
2424 12 1 13
2 2 2
n nn ,= = = + =
The median is the average of the twelfth and thirteenth values, and it’s 49 51
502
+= .

7.
Value Frequency
1 12
2 13
3 22
Total 47
1 4847 24
2 2
nn
+= = =
The median is the 24th value, and it’s 2.
8.
Value Frequency
1 12
2 11
3 23
Total 46
4646 23 1 24
2 2 2
n nn ,= = = + =
The median is the average of the 23rd and 24th values, and it’s 2 3
2.52
+= .

The Mode of a list of numerical or descriptive data is defined to be the most
frequently occurring value.
Unlike the textbook, I don’t allow for two modes(bimodal), or three
modes(trimodal), etc.. For me either there is one most frequently occurring value or
there isn’t.
Mode Examples:
1. 1,2,2,3
The mode is 2.
2. 1,1,2,2,3
There is no mode.
Sometimes a data set won’t have a mode.

3. , , ,red blue green green
The mode is green.
Means and Medians only work for numerical data, but this isn’t the case for Modes.
4.
3 2 3 5 8 9 9
4 0 3 4 7 9 9
5 1 1 2 2 8 9
6 2 2 7 7 7 9 9
The mode is 67.

5.
Value Frequency
1 12
2 11
3 23
Total 46
The mode is 3.
6.
Value Frequency
Small 10
Medium 11
Large 40
X-Large 23
Total 84
The mode is Large.

The Midrange of a list of numerical data is defined to be the average of the smallest
and largest data values.
smallest value largest valuemidrange
2
+=
Examples of Midrange Calculations:
1. 1,2,2,3
The midrange is 1 3
22
+= .
Sometimes the value of the midrange will be an actual value in the data set.
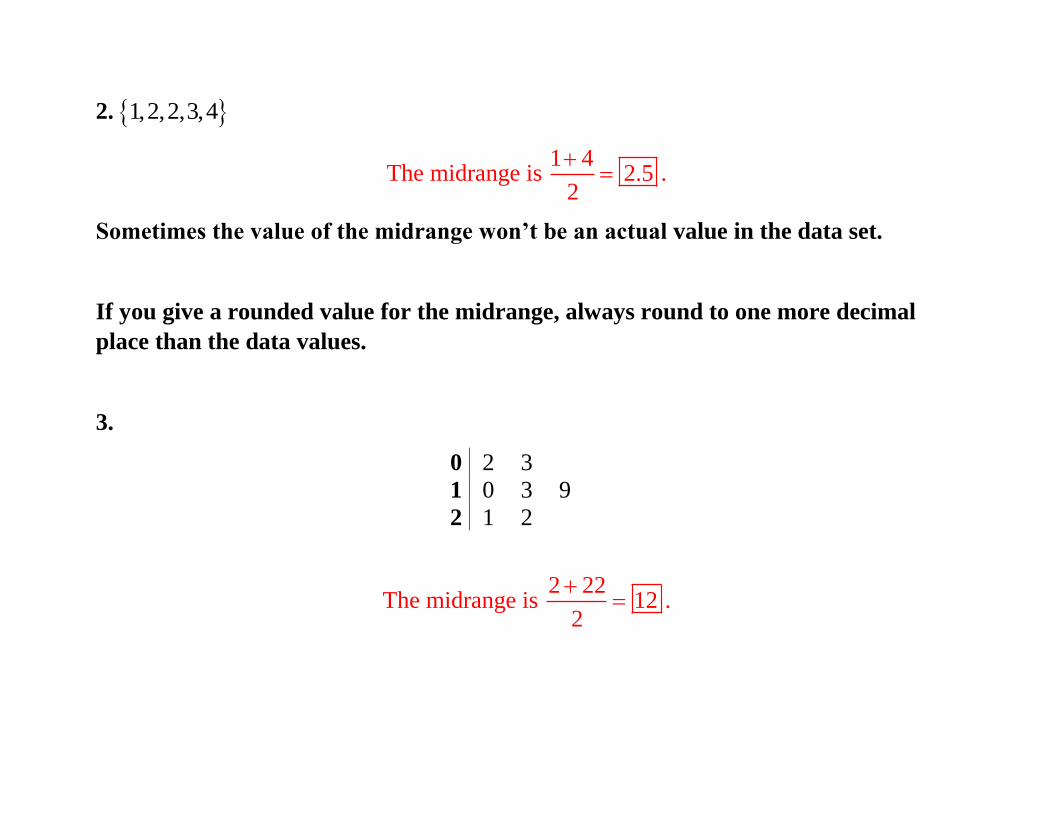
2. 1,2,2,3,4
The midrange is 1 4
2.52
+= .
Sometimes the value of the midrange won’t be an actual value in the data set.
If you give a rounded value for the midrange, always round to one more decimal
place than the data values.
3.
0 2 3
1 0 3 9
2 1 2
The midrange is 2 22
122
+= .

4.
Value Frequency
1 11
2 13
3 22
Total 46
The midrange is 1 3
22
+= .