DESCRIPTION OF SCL-90-R DIKENSIONS* · DESCRIPTION OF SCL-90-R DIKENSIONS* ANXIETY The anxiety...
50
DESCRIPTION OF SCL-90-R DIKENSIONS* ANXIETY The anxiety dimension is composed of a set of symptoms and signs that are associated clinically with high levels of manifest anxiety. General signs such as nervousness, tension, and trembling are included in the definition, as are panic attacks and feelings of terror. Cognitive components involving feelings of apprehension and dread, and some of the somatic correlates of anxiety are also included as dimensional components. The symptoms comprising the anxiety dimension are experiencing nervousness or shakiness inside, trembling, being suddenly scared for no reason, feeling fearful, experiencing heart pounding or racing, feeling tense and keyed up, having spells of terror and panic, feeling so restless you couldn;t sit still, feeling that something bad is going to happen, and experiencing frightening thoughts and images. DEPRESSION The symptoms of the depression dimension reflect a broad range of the manifestations of clinical depression. Symptoms of dysphoric mood and affect are represented, as are signs of withdrawal of life interest, lack of motiva- tion, and loss of vital energy. In addition, feelings of hopelessness, thoughts of suicide, and other cognitive and somatic correlates of depression are included. The symptoms comprising the depression dimension are losing sexual interest or pleasure, feeling low in energy or slowed down, thinking of ending your life, crying easily, feeling trapped or caught, blaming yourself for things, feeling lonely, feeling blue, worrying too much about things, feeling no interest in things, feeling hopeless about the future, feeling everything is an effort, and feeling worthless. HOSTILITY The hostility dimension reflects thoughts, feelings, or actions that are characteristic of the negative affect state of anger. The selection of items includes all three modes of manifestation and reflects qualities such as aggression, irritability, rage, and resentment. The symptoms comprising the hostility dimension are feeling easily annoyed or irritated; having uncontrollable temper outbursts; having urges to beat, injure, or harm someone; having urges to break or smash things; getting into frequent arguments; and shouting or throwing things. INTERPERSONAL SENSITIVITY The interpersonal sensitivity dimension focuses on feelings of personal inadequacy and inferiority, particularly in comparison with others. Self- deprecation, feelings of uneasiness, and marked discomfort during inter- personal interactions are characteristic manifestations of this syndrome. In addition, individuals with high scores on interpersonal sensitivity report acute self-consciousness and negative expectancies concerning the communi- cations and interpersonal behaviors with others. The symptoms comprising the *Taken from the SCL-90-R. 1-1
Transcript of DESCRIPTION OF SCL-90-R DIKENSIONS* · DESCRIPTION OF SCL-90-R DIKENSIONS* ANXIETY The anxiety...

DESCRIPTION OF SCL-90-R DIKENSIONS*
ANXIETY
The anxiety dimension is composed of a set of symptoms and signs that are associated clinically with high levels of manifest anxiety. General signs such as nervousness, tension, and trembling are included in the definition, as are panic attacks and feelings of terror. Cognitive components involving feelings of apprehension and dread, and some of the somatic correlates of anxiety are also included as dimensional components. The symptoms comprising the anxiety dimension are experiencing nervousness or shakiness inside, trembling, being suddenly scared for no reason, feeling fearful, experiencing heart pounding or racing, feeling tense and keyed up, having spells of terror and panic, feeling so restless you couldn;t sit still, feeling that something bad is going to happen, and experiencing frightening thoughts and images.
DEPRESSION
The symptoms of the depression dimension reflect a broad range of the manifestations of clinical depression. Symptoms of dysphoric mood and affect are represented, as are signs of withdrawal of life interest, lack of motivation, and loss of vital energy. In addition, feelings of hopelessness, thoughts of suicide, and other cognitive and somatic correlates of depression are included. The symptoms comprising the depression dimension are losing sexual interest or pleasure, feeling low in energy or slowed down, thinking of ending your life, crying easily, feeling trapped or caught, blaming yourself for things, feeling lonely, feeling blue, worrying too much about things, feeling no interest in things, feeling hopeless about the future, feeling everything is an effort, and feeling worthless.
HOSTILITY
The hostility dimension reflects thoughts, feelings, or actions that are characteristic of the negative affect state of anger. The selection of items includes all three modes of manifestation and reflects qualities such as aggression, irritability, rage, and resentment. The symptoms comprising the hostility dimension are feeling easily annoyed or irritated; having uncontrollable temper outbursts; having urges to beat, injure, or harm someone; having urges to break or smash things; getting into frequent arguments; and shouting or throwing things.
INTERPERSONAL SENSITIVITY
The interpersonal sensitivity dimension focuses on feelings of personal inadequacy and inferiority, particularly in comparison with others. Selfdeprecation, feelings of uneasiness, and marked discomfort during interpersonal interactions are characteristic manifestations of this syndrome. In addition, individuals with high scores on interpersonal sensitivity report acute self-consciousness and negative expectancies concerning the communications and interpersonal behaviors with others. The symptoms comprising the
*Taken from the SCL-90-R.
1-1
interpersonal sensitivity dimension are feeling critical of others, feeling shy or uneasy with the opposite sex, having feelings easily hurt, feeling others do not understand or are unsympathetic, feeling that people are unfriendly or dislike you, feeling inferior to others, feeling uneasy when people are watching or talking about you, feeling very self-conscious with others, and feeling uncomfortable about eating or drinking in public.
OBSESSIVE-COMPULSIVE
The obsessive-compulsive dimension reflects symptoms that are highly identified with the standard clinical syndrome of the same name. This measure focuses on thoughts, impulses, and actions that are experienced as unremitting and irresistible by the individual but are of an ego-alien or unwanted nature. Behaviors and experiences of a more general cognitive performance attenuation are also included in this measure. The symptoms comprising the obsessivecompulsive dimension are experiencing repeated unpleasant thoughts that won't leave the mind, having trouble remembering things, worrying about sloppiness or carelessness, feeling blocked in getting things done, having to do things very slowly to ensure correctness, having to check and double-check what is done, having difficulty making decisions, having mind go blank, having trouble concentrating, and having to repeat the same actions (e.g., touching, counting, washing).
PARANOID IDEATION
The present dimension represents paranoid behavior fundamentally as a disordered mode of thinking. The cardinal characteristics of projective thought, hostility, suspiciousness, grandiosity, centrality, fear of loss of autonomy, and delusions are viewed as primary reflections of this disorder; item selection was oriented toward representing this conceptualization. The symptoms comprising the paranoid ideation dimension are feeling others are to blame. for most. of your troubles, feeling that most people cannot be trusted, feeling that you are watched or talked about by others, having ideas and beliefs that others do not share, not receiving proper credit from others for your achievements, and feeling that people will take advantage of you if you let them.
PHOBIC ANXIETY
Phobic anxiety is defined as a persistent fear response to a specific person, place, object, or situation that is characterized as being irrational and disproportionate to the stimulus, and which leads to avoidance or escape behavior. The items of the present dimension focus on the more pathognomic and disruptive manifestations or phobic behavior. The actual structure of the dimension is in close agreement with the definition of "agoraphobia" (Marks, 1969), also termed "phobic anxiety depersonalization syndrome" by Roth (1959). The symptoms comprising the phobic anxiety dimension are feeling afraid in open spaces or on the street; feeling afraid to go out of the house alone; feeling afraid to travel on buses, subways, or trains; having to avoid certain things, places, or activities because they are frightening; feeling uneasy in crowds, such as shopping or at a movie; feeling nervous when left alone; and feeling afraid of fainting in public.
1-2
PSYCBOTICISM
The psychoticism scale was developed in a fashion to represent the construct as a continuous dimension of human experience. Items indicative of a withdrawn, isolated, schizoid lifestyle were included, as were first-rank symptoms of schizophrenia, such as hallucinations and thought-broadcasting. The psychoticism scale provides a graduated continuum from mild interpersonal alienation to dramatic evidence of psychosis. In this respect, the present definition owes much to the work of Eysenck (1968). The symptoms comprising the psychoticism dimension are having the idea that someone else can control your thoughts, hearing voices that other people do not hear, believing that other people are aware of your private thoughts, having thoughts that are not your own, feeling lonely even when you are with people, having thoughts about sex that bother you a lot, .believing that you should be punished for your sins, thinking that something serious is wrong with your body, never feeling close to another person, and thinking that something is wrong with your mind.
SOMATIZATION
The somatization dimension reflects distress arising from perceptions of bodily dysfunction. Complaints focusing on cardiovascultr, gastrointestinal, respiratory, and other systems with strong autonomic mediation are included. Headaches, pain, and discomfort of the gross musculature and additional somatic equivalents of anxiety are components of the definition. These symptoms and signs have all been demonstrated to have high prevalence in disorders demonstrated to have a functional etiology, although all may be reflections of true physical disease. The symptoms comprising the somatization dimension are headaches, faintness or dizziness, pains in heart or chest, pains in lower back, nausea or upset stomach, soreness of muscles, trouble getting breath, hot or cold spells, numbness or tingling in parts of body, lump in throat, weakness in parts of body, and heavy feelings in arms or legs.
ADDITIONAL ITEMS
Seven items that are a part of the SCL-90-R which are not subsumed under any of the primary symptom dimensions; these symptoms actually "load" on several of the dimensions but are not univocal to any of them. Vhile in this sense they violate one of the statistical criteria for inclusion in the test, they are a part of the item set because they are clinically important. These items contribute to the global scores on the SCL-90-R and are intended to be used configurally. Thus, a high depression score with "early morning awakening" and "poor appetite" may mean something quite different from a similar score with these symptoms absent. By the same token, the presence of conscious "feelings of guilt" is an important clinical indicator that communicates important information to the .clinician. The additional items are not scored collectively as a dimension but are summed into the global scores. The additional items in the SCL-90-R are having a poor appetite, overeating, having trouble falling asleep, awakening in the early morning, experiencing restless or disturbed sleep, thinking of death or dying, and feeling guilty.
1-3
The Global Indices of Distress
There are three global indices of distress associated with the SCL-90-R: the GSI, the PSDI, and the PST. The function of each of these global measures is to communicate in a single score the level or depth of the individual's psychopathology. Each measure does this in a somewhat distinct fashion and reflects somewhat different aspects of psychopathology (Derogatis, Yevzeroff, & Vittelsberger, 1975). The GSI represents the best single indicator of the current level or depth of the disorder and should be utilized in most instances where a single summary measure is required. The GSl combines information on numbers of symptoms and intensity of perceived distress. The PSDl is a pure intensity measure, in a sense, "corrected" for numbers of symptoms. It functions very much as a measure of response style in the sense of communicating whether the patient is "augmenting" or "attenuating" symptomatic distress in his style of reporting his disorder. The PST is simply a count of the number of symptoms the patient reports as positive--that is, that he experiences as having to any degree. Vhen used configurally in conjunction with the GSI, information on style of response and numbers of symptoms endorsed can be very helpful in appreciating the clinical picture.
1-4

DESCRIPTION OF HCHI SCALES*
BASIC PERSONALITY PATTERNS
The following descriptions of high-scale scorers focus on everyday ways of functioning that characterize these patients even when they are not suffering acute symptom states. They reflect relatively enduring and pervasive traits that typify patient styles of behaving, perceiving, thinking, feeling, and relating to others. Although patients may currently exhibit more distinctive pathological symptoms, the features noted refer to their premorbid characterological pattern.
Schizoid (Asocial)
1. Affectivity deficit (e.g., exhibits intrinsic emotional blandness I reports weak affectionate needs and an inability to display enthusiasm or experience pleasure).
2. Mild cognitive slippage (e.g., evidences impoverished and obscure thought processes inappropriate to intellectual level; social communication often tangential and irrelevant).
3. Interpersonal indifference (e.g., possesses minimal "human" interestsl prefers a peripheral role in social and family relationships).
4. Behavioral apathy (e.g., experiences fatigue, low energy, and lack of vitalitYI displays deficits in activation, motoric expressiveness, and spontanei ty).
5. Perceptual insensitivity (e.g., reveals minimal introspection and awareness of self; is impervious to subtleties of everyday social and emotional life).
Avoidant
1. Affective dysphoria (e.g., describes a constant and confusing undercurrent of tension, sadness, and angerl vacillates between desire for affection, fear, and numbness of feeling).
2. Mild cognitive interference (e.g., is bothered and distracted by disruptive inner thoughts I irrelevant and digressive ideation disrupts social communication) •
3. Alienated self-image (e.g., describes life as one of social isolation and rejection; devalues self and reports periodic feelings of emptiness and depersonalization).
*Taken from the ReMI.
1-5

4. Aversive interpersonal behavior (e.g., tells of social pan-anxiety and distrust; seeks privacy to avoid anticipated social derogation).
5. Perceptual hypersensitivity (e.g., vigilantly scans for potential threats; over interprets innocuous behavior as a sign of ridicule and humiliation).
Dependent (Submissive)
1. Pacific temperament (e.g., is characteristically docile and noncompetitive; avoids social tension and interpersonal conflicts).
2. Interpersonal sub~issiveness (e.g., needs a stronger, nurturing figure, and without one feels anxiously helpless; is often conciliatory, placating, and self-sacrificing).
3. Inadequate self-image (e.g., perceives self as weak, fragile, and ineffectual; exhibits lack of confidence by belittling own aptitudes and competencies).
4. Pollyanna cognitive style (e.g., reveals a naive or benign attitude toward interpersonal difficulties; smooths over troubling events).
5. Initiative deficit (e.g., prefers a subdued, uneventful, and passive lifestyle; avoids self-assertion and refuses autonomous responsibilities).
Histrionic (Gregarious)
1. Fickle affectivity (e.g., displays short-lived, dramatic, and 'superficial affects; reports tendency to be easily excited and as easily bored).
2. Sociable self-image (e.g., perceives self as gregarious, stimulating, and charming; attracts fleeting acquaintances and enjoys rapidly paced social life).
3. Interpersonal seductiveness (e.g., actively solicits praise and manipulates others to gain attention and approval; exhibits self-dramatizing and childishly exhibitionistic behaviors).
4. Cognitive dissociation (e.g., integrates experiences poorly, which results in scattered learning and unexamined thought; reveals undependable, erratic, and flighty judgment).
5. Immature stimulus-seeking behavior (e.g., is intolerant of inactivity, leading to unreflected and impulsive responsiveness; describes penchant for momentary excitements, fleeting adventures, and short-sighted hedonism).
1-6

Narcissistic
1. Inflated self-image (e.g., displays pretentious self-assurance and exaggerates achievements; is seen by others as egotistic, haughty, and arrogant).
2. Interpersonal exploitiveness (e.g., takes others for granted and uses them to enhance self and indulge desires; expects special favors without assuming reciprocal responsibilities).
3. Cognitive expansiveness (e.g., exhibits immature fantasies and an undisciplined imagination; is minimally constrained by objective reality, takes liberties with facts, and often lies to redeem self-illusions).
4. Insouciant temperament (e.g., manifests a general air of nonchalance and imperturbability; appears coolly unimpressionable or buoyantly optimistic except when narcissistic confidence is shaken).
5. Deficient social conscience (e.g., flouts conventional rules of shared social living, viewing them as naive or inapplicable to self; reveals a careless disregard for personal integrity and an indifference to the rights of others).
Antisocial (Aggressive)
1. Hostile affectivity (e.g., has a pugnacious and irascible temper that flares readily into argument and attack; exhibits frequent verbally abusive and physically cruel behaviors).
2. Assertive self-image (e.g., proudly characterizes self as independent, vigorously energetic, and hardheaded; values tough, competitive, and power-oriented life style).
3. Interpersonal vindictiveness (e.g., reveals satisfaction in derogating and humiliating others; is contemptuous of sentimentality, social compaSSion, and humanistic values).
4. Hyperthymic fearlessness (e.g., exhibits high activation level in impulsive, accelerated, and forceful responding; is attracted to and undaunted by danger and punishment).
5. Malevolent projection (e.g., claims that most persons are devious, controlling, and punitive; justifies own mistrustful, hostile, and vengeful attitudes by ascribing them to others).
Compulsive (Conforming)
1. Restrained affectivity (e.g., is unrelaxed, tense, joyless, and grim; keeps emotional expression under tight control).
2. Conscientious self-image (e.g., sees self as industrious, dependable, and efficient; values self-discipline, prudence, and loyalty).
1-7
3. Interpersonal respectfulness (e.g., exhibits unusual adherence to social conventions and proprieties; prefers polite, formal, and correct personal relationships).
4. Cognitive constriction (e.g., constructs world in terms of rules, regulations, and hierarchies; is unimaginative, indecisive, and upset by unfamiliar or novel ideas and customs).
S. Behavioral rigidity (e.g., keeps a well-structured, highly regulated, and repetitive life pattern; prefers organized, methodical, and meticulous work).
Passive-Aggressive (Negativistic)
1. Labile affectivity (e.g., is frequently irritable and displays erratic moodiness; reports being easily frustrated and explosive).
2. Behavioral contrariness (e.g., frequently exhibits passively aggressive, petulant, and fault-finding behaviors; reveals gratification in demoralizing and undermining the pleasures of others).
3. Discontented self-image (e.g., reports feeling misunderstood, unappreciated, and demeaned by others; is characteristically pessimistic, disgruntled, and disillusioned with life).
4. Deficient regulatory controls (e.g., expresses fleeting thoughts and impulsive emotions in unmodulated form; external stimuli evoke capricious and vacillating reactions).
S. Interpersonal ambivalence (e.g., assumes conflicting and changing roles in social relationships, particularly dependent acquiescence and assertive independence; uses unpredictable and sulking behavior to provoke edgy discomfort in others).
PATHOLOGICAL PERSONALITY DISORDERS
The following three scales describe patients who clearly evidence a chronic or periodically severe pathology in the overall structure of personality. There is a checkered history of disruptions, predicaments, and disappointments in personal relationships and in school and work performance. These patients achieve modest levels of social competence because of an apparent inability to learn from previous difficulties; a tendency to precipitate self-defeating vicious circles, digressions, and setbacks; and a failure to achieve a niche in life that is consonant with natural aptitudes and potentials. Although frequently able to function on an ambulatory basis, they may have had transient but repetitive psychotic episodes involving extreme or bizarre behaviors.
1-8

Schizotypal (Schizoid)
1. Social detachment (e.g., prefers life of isolation with minimal personal attachments and obligations; over time, has drifted into increasingly peripheral social and vocational roles).
2. Behavioral eccentricity (e.g., exhibits peculiar habits frequently; is perceived by others as unobtrusively strange or different).
3. Nondelusional autistic thinking (e.g., mixes social communication with personal irrelevancies, obscurities, and tangential asides; appears selfabsorbed and lost in daydreams with occasional blurring of fantasy and reality).
4. Either (a) anxious wariness (e.g., reports being hypersensitive and apprehensively ill-at-ease, particularly in social encounters; is guarded, suspicious of others, and secretive in behavior), or (b) emotional flatness (e.g., manifests a drab, sluggish, joyless, and spiritless appearance; reveals marked deficiencies in activation and affect).
5. Disquieting estrangement (e.g., reports periods of depersonalization, derealization, and dissociation; experiences anxious feelings of emptiness and meaninglessness).
Borderline (Cycloid)
1. Intense endogenous moods (e.g., continually fails to accord mood with external events; is either depressed or excited or has recurring periods of dejection and apathy interspersed with spells of anger, anxiety, or euphoria).
2. Oysregulated activation (e.g., experiences desultory energy level and irregular sleep-wake cycle, describes time periods that suggest that affective-activation equilibrium is constantly in jeopardy).
3. Self-condemnatory conscience (e.g., reveals recurring self-mutilating and suicidal thoughts; periodically redeems moody behavior through contrition and self-derogation).
4. Dependency anxiety (e.g., is preoccupied with securing affection and maintaining emotional support; reacts intensely to separation and reports haunting fear of isolation and loss).
5. Cognitive-affective ambivalence (e.g., repeatedly struggles to express attitudes contrary to inner feelings; simultaneously experiences conflicting emotions and thoughts toward others, notably love, rage, and guilt).
Paranoid
1. Vigilant mistrust (e.g., exhibits edgy defensiveness against anticipated criticism and deception; conveys extreme suspicion, envy, and jealousy of others).
1-9

2. Provocative interpersonal behavior (e.g., displays a disputatious, fractious, and abrasive irritability; precipitates exasperation and anger by hostile, deprecatory demeanor).
3. Tenacious autonomy (e.g., expresses fear of losing independence and power of self-determination; is grimly resistant to sources of external influence and control).
4. Hinidelusional cognitions (e.g., distorts events into personally logical but essentially irrational beliefs; embellishes trivial achievements to accord with semigrandiose self-image).
5. critical tensions
Persecutory self-references (e.g., construes incidental events as of self; reveals tendency to magnify minor and personally unrelated into proofs of purposeful deception and malice).
CLINICAL SYMPTOM SYNDROMES
Host, but not all, of the symptom disorders described in this section are of the reactive kind that are of substantially briefer duration than the personality disorders. They usually represent states in which an active pathological process is clearly manifested. Many of these symptoms are precipitated by external events. Most typically, they appear in somewhat striking or dramatic form, often accentuating or intensifying the more prosaic features of the premorbid or basic personality style; that is, in their active
,form, these symptoms tend to stand out in sharp relief within the context of the more enduring and characteristic mode of functioning. During periods of active pathology, it is not uncommon for several symptoms to covary at anyone time and to change over time in their degrees of prominence. The first six scales represent disorders of moderate severity; the last three scales reflect disorders of marked severity.
Anxiety
.The high-scoring patient often reports feeling either vaguely apprehensive or specifically phobic; is typically tense, indecisive, restless; and tends to complain about a variety of physical discomforts, such as tightness, excessive perspiration, ill-defined muscular aches, and nausea.
Soutoform
The high-scoring patient expresses psychological difficulties through somatic channels, reports persistent periods of fatigue and weakness, and may be preoccupied with ill health and a variety of dramatic, but largely nonspecific pains in different and unrelated regions of the body.
BYpoll8llic
The high-scoring patient evidences periods of superficial, elevated but unstable moods; restless overactivity and distractibility; pressured speech; and impulsiveness and irritability.
1-10
pysthymic
The high-scoring patient remains involved in everyday life, but is downhearted, preoccupied with feelings of discouragement or guilt, exhibits a lack of initiative and behavioral apathy, and frequently voices futility and self-deprecatory comments.
Alcohol Abuse
The high-scoring patient probably has a history of alcoholism, has made efforts to overcome the difficulty with minimal success, and as a consequence, experiences considerable discomfort in both family and work settings.
Drug Abuse
The high-scoring patient probably has a recurrent or recent history of drug abuse, tends to have difficulty in restraining impulses or keeping them within conventional social limits, and displays an inability to manage the personal consequences of these behaviors.
Psychotic Thinking
The high-scoring patient, usually classified as "schizophrenic," periodically exhibits incongruous, disorganized, or regressive behavior, often appears confused and disoriented; and occasionally displays inappropriate affects, scattered hallucinations, and unsystematic delusions.
Psychotic Depression
The high-scoring patient is usually incapable of functioning in a normal environment, is in a severely depressed mood, and expresses a dread of the future and a sense of hopeless resignation. Some exhibit a marked motor retardation, whereas others display an agitated quality, incessantly pacing about and bemoaning their sorry state.
Psychotic Delusions
The high-scoring patient, usually considered paranoid, becomes periodically belligerent and often voices irrational but interconnected sets of delusions of a persecutory or grandiose nature.
1-11
TABLE 1-1.
Dependent Variable-Covariate Associations for Psychology Assessaent
Age Race
Born Dependent Born 1923- Born p- p-Variable Level ~1942 1941 9922 Value Black Nonb1ack Value
Trouble Falling (n=957) (n=1,253) (n=84) (n=137) (n=2,157) Asleep Yes 13.9% 9.3% 8.3% 0.002 13.1% 11.1% 0.534
Vaking Up During (n=957) (n=1,253) (n=84) (n=137) (n=2,157) the Night Yes 13.2% 14.7% 22.6% 0.053 8.8% 14.7% 0.061
Vaking Up Too Early and can't (n=957) (n=1,253) (n=84) (n=137) (n=2,157) ... Go Back to Sleep Yes 11.2% 10.7% 13.1% 0.768 11. 7% 10.9% 0.874 I ... .., VakingUp (n=957) (n=1,253) (n=84) (n=137) (n=2,157) Unrefreshed Yes 11.7% 8.0% 4.8% 0.004 9.5% 9.4% 0.999
Involuntarily Falling Asleep (n=957) (n=1,253) (n=84) (n=137) (n=2,157) During the Day Yes 3.6% 4.1% 7.1% 0.261 5.1% 3.9% 0.598
Great or Disabling Fatigue (n=957) (n=1,253) (n=84) (n=137) (n=2,157) During the Day Yes 3.3% 2.6% 1.2% 0.393 5.1% 2.7% 0.190
Frightening (n=955) (n=1,249) (n=84) (n=136) (n=2,152) Dreau Yes 5.4% 3.7% 4.8% 0.138 6.6% 4.3% 0.296
Talking in (n=956) (n=1,252) (n=84) (n=137) (n=2,155) Sleep Yes 5.5% 2.6% 3.6% 0.001 2.9% 3.9% 0.772

TABLE 1-1. (continued)
Dependent Variable-Covariate Associations for Psychology Assessaent
Age Race
Born Dependent Born 1923- Born p- p-Variable Level ~1942 1941 9-922 Value Blacle. Nonblacle. Value
Sleepwallc.ing (n=957) (n=I,253) (n=84) (n=137) (n=2,157) Yes 3.1% 1.0% 0.0% 0.001 0.7% 2.0% 0.522
Abnoraal Kov~ntl Activity During (n=957) (n=I,253) (n=84) (n=137) (0=2,157) the Night Yes 4.7% 2.6% 2.4% 0.020 4.4% 3.4% 0.664
Sleep ProblellS .... Requiring (n=957) (n=I,253) (n=84) (n=137) (n=2,157) , ~ Medication Yes . 2.5% 2.0% 1.2% 0.5B6 2.2% 2.2% 0.999 ...,
Snore Loudly in All Sleeping (n=957) (n=1,253) (n=84) (n=137) (n=2,157) Positions Yes 6.6% . 7.8% 4.8% 0.365 5.8% 7.3% 0.670
Insomtia (n=957) (n=1,253) (n=84) (n=137) (2,157) Yes 24.9% 22.6% 31.0% 0.136 20.4% 24.1% 0.392
Overall Sleep (n=955) (n=1,249) (n=84) (n=136) (n=2,152) Disorder Index Abnoraal 37.0% 32.4% 36.9% 0.076 29.4% 34.8% 0.232
Average Sleep (n=2,293) (n=137) (n=2,156) Each Night r=O.090 <0.001 x=6.41 x=6.96 <0.001
SCL-90-R (n=864) (n=I,096) (n=72) (n=121) (n=I,911) Anxiety Abnoraal 8.3% 5.3% 6.9% 0.027 7.4% 6.6% 0.826

~LB 1-1. (cODtinued)
Dependent Variable-C09ariate Associations for Psychology AssesSlleat
Age Race
Born Dependent Born 1923- Born p- p-Variable Level ~1942 1941 9922 Value Black Nonblack Value
SCL-90-R (0=864) (n=1,096) (ns 72) (n=121) (n=1,911) Depression AbnorJlal 10.4% 7.0% 8.3% 0.028 5.8% 8.7% 0.348
SCL-90-R (n:864) (n=1,096) (n=72) (n=121) (n=I,911) Hostility AbnorJlal 7.3% 3.2% 1.4% <0.001 6.6% 4.8% 0.466
SCL-90-R Interpersonal (0=864) (n=I,096) (n=72) (n=121) (n=I,911) .... Sensitivity Abnormal 8.9% 4.5% 8.3% <0.001 6.6% 6.5% 0.999 I
~ ..,. SCL-90-R Obsessive-Co.puisive (n:864) (n=I,096) (n=72) (n=121) (n=I,911) Behavior Abnormal 10.1% 6.2% 9.7% 0.006 8.3% 8.0% 0.999
SCL-90-R Paranoid (n=864) (0=1,096) (n=72) (0=121) (n=I,911) Ideation Abnormal 5.8% 2.9% 1.4% 0.003 7.4% 3.9% 0.109
SCL-90-R Phobic (0=864) (n=I,096) (n=72) (n=121) (n=I,911) Anxiety Abnorul 9.8% 4.7% 6.9% <0.001 10.7% 6.8% 0.149
SCL-90-R (n=864) (n=I,096) (n=72) (n=121) (n=I,911) PsychoticiSll AbnorJlal 11.1% 7.1% 9.7% 0.008 12.4% 8.7% 0.226
SCL-90-R (n:864) (n=I,096) (n=72) (n=121) (n=I,911) Soutization AbnorJlal 8.1% 10.2% 9.7% 0.215 12.4% 9.1% 0.296

~ 1-1. (continued)
Dependent Variable-Covariate Associations for Psychology Assessaent
Age Race
Born Depeodent Born 1923- Born p- p-Variable Level ~1942 1941 9.922 Value Black Nooblack Value
SCL-90-R (n=864) (0=1,096) (0=72) (n=121) (n=1,911) GSI Abnormal 10.2% 5.7% 5.6% 0.001 9.9% 7.5% 0.414
SCL-90-R (0=864) (0=1,096) (0=72) (0=121) (n=1,911) PSDI Abnomal 10.4% 8.8% 9.7% 0.461 10.7% 9.4% 0.722
SCL-90-R (0=864) (n=1,096) (n=72) (n=121) (n=1,911) PST Abnormal 10.2% 5.4% 5.6% <0.001 10.7% 7.2% 0.216 ....
I ... MCMI '" Schizoid (n=2,288) (0=137) (n=2,151)
Score a r=-O.053 0.012 x=24.5 x=24.4 0.919
MCHI Avoid~nt (0=2,288) (0=137) (n=2,151) Score r=-0.051 0.014 x=15.8 x=16.7 0.489
KCHI Dependent (0=955) (n:1,25O) (ns03) (n=137) (n=2,151) Scorec x=42.5 x=40.1 x=45.9 0.003 x=42.7 x=41.2 0.419
"CHI Histrionic (n=2,288) (0=137) (0=2,151) Score r=-O.032 0.121 x=67.2 x=63.4 0.002

~ I-I. (continued)
Dependent Variable--Covariate AssGclations for Psychology Asses_t
Age Race
Born Dependent Born 1923- Born p- p-Variable Level ~1942 1941 51922 Value Black Nooblack Value
KCMI Narcissistic (0=2,288) (0=137) (0=2,151) Score r=-0.007 0.743 x=69.2 x=63.6 <0.001
MCHI Antisocial (0=2,288) (n=137) (0=2,151) Score r=-0.019 0.374 x=62.0 x=60.2 0.288
.... MCHI I ... Co-pulsive (0=2,288) (0=137) (0=2,151) a. Score r:O.138 <0.001 x=69.3 x=68.4 0.300
MCMI Passive-Aggressive (0=2,288) (0=137) (0=2,151) Scorec r=-0.142 <0.001 x=20.5 x=19.0 0.253
MCHI· Schizo typal (0=955) (0:1,250) (0=83) (0=137) (0=2,151) Score x=35.7 x=33.2 i=36.9 0.003 x=33.4 x=34.4 0.523
MCHI Borderline (0=955) (n=I,250) (0=83) (0=137) (0=2,151) Score x=34.7 x=31.8 x=35.1 <0.001 x=34.3 x=33.0 0.408

TABLE 1-1. (contiDued)
Dependent Variable-Covariate Associations for Psychology Assess-ent
Age Race
Born Dependent Born 1923- Born p- p-Variable Level ~1942 1941 9.922 Value Black Nonblaclt Value
KCHI Paranoid (n=2,288) (n=137) (n=2,151) Score r=-O.015 0.471 x=56.5 i=52.0 0.001
MCMI Anxiety (n=2,288) (n=137) (n=2,151) Score r=-O.OO6 0.767 i=48.9 x=47.0 0.318
H MCMI I .... SoIIatofonl (n=2,288) (n=137) (n=2,151) ..... Score r=0.021 0.315 x=53.2 x=51.1 0.181
KCHI Hypomania (n=2,288) (n=137) (n=2,151) Score" r=-O.045 0.031 x=26.3 x=20.9 0.017
KCHI Dysthyaia (n=2,288) (n=137) (0=2,151) Score r=-O.008 0.694 x=50.6 x=50.0 0.779
KCHI Alcohol Abuse (n=2,288) (0=137) (0=2,151) Score r=-0.039 0.065 x=36.5 x=30.8 <0.001

TABI.B 1-1. (cODtiDued)
Dependent Yarlab1e-Covariate Assoc:iatioos for Psychology Assesseent

TABLE 1-1. (c:ontinued)
Dependent Variable-Covariate Associations for Psychology AssesSIIeDt
Educ:atioo Post-Traumatic: Stress Disorder
Dependent High p- p-Variable Level School College Value No Yes Value
Trouble Falling (0=1,150) (0=1,130) (0=2,162) (0=16) Asleep Yes 13.3% 9.0% 0.001 10.7% 81.3% (0.001
Vaking Up During (0=1,150) (0=1,130) (0=2,162) (0=16) the Night Yes 15.0% 13.7% 0.432 14.0% 75.0% (0.001
Valting Up Too Early and can't (0=1,150) (0=1,130) (0=2,162) (0=16) Go Back to Sleep Yes 12.8% 9.U 0.006 10.5% 62.5% (0.001
H I ... Valting Up (0=1,150) (0=1,130) (0=2,162) (0=16) ,.,
Unrefr~shed Yes 11.0% 7.7% 0.009 8.7% 87.5% (0.001
Iovoluntarily Falling Asleep (0=1,150) (0=1,130) (0=2,162) (0=16) During the Day Yes 4.4% 3.4% 0.224 3.8% 31.3% (0.001
Great or Disabling Fatigue (0=1,150) (0=1,130) (0=2,162) (0=16) During the Day Yes 4.3% 1.4% (0.001 2.7% 37.5% (0.001
Frightening (0=1,146) (0=1,128) (0=2,157) (0=15) DreaJIS Yes 5.3% 3.5% 0.038 3.9% 66.7% (0.001
Talldng io (0=1,149) (0=1,129) (0=2,160) (0=16) Sleep Yes 5.2% 2.5% (0.001 3.7% 25.0% 0.005

TABLE 1-1. (continued)
Dependent Variable-Covariate Associations for Psychology Assess-ent
Education Post-Traumatic Stress Disorder
Dependent 8igh p- p-Variable Level School College Value No Yes Value
Sleepwalking (n=I,15O) (n=I,130) (n=2,162) (n=16) Yes 1.7% 1.8% 0.999 1.8% 6.3% 0.514
Abrior.al Mov~t/ Activity During (n=I,15O) (n=I,130) (n=2,162) (n=16) the Might Yes 4.5% 2.3% 0.005 3.1% SO.O% <0.001
Sleep ProblellS Requiring (n2 1,150) (n=I,130) (n=2,162) (0=16) .... Medication Yes 3.0% 1.3% 0.010 1.8% 56.3% <0.001 I
N 0
Snore Loudly in All Sleeping (n2 1,lSO) (n=1,130) (n=2,162) (n=16) Positions Yes 7.4% 6.9% 0.710 7.1% 31.3% 0.009
InsOllllia (n=1,15O) (n=I,130) (n=2,162) (n=16) Yes 26.3% 21.2% 0.005 23.5% 87.5% <0.001
Overall Sleep (031,146) (n=I,128) (n=2,157) (n=15) Disorder Index Abnomal 38.3% 30.4% <0.001 34.2% 100.0% <0.001
Average Sleep (n=I,15O) (n=I,129) (n=2,161) (0216) Each Night x=6.86 x=7.00 0.001 x=6.93 x=6.25 0.138
SCL-90-R (n=1,03O) (n=989) (n=I,914) (0=16) Anxiety Abnomal 9.1% 4.0% <0.001 5.9% 93.8% <0.001

TABLE 1-1. (continued)
Dependent Variable-Co1rarlate Associations for Psychology Assessaent
Education Post-Traumatic Stress Disorder
Dependent High p- p-Variable Level School College Value No Yes Value
SCL-90-R (0=1,030) (0=989) (0=I,914) (0=16) Depressioo Aboormal 11.0% 5.9% <0.001 7.7% 100.0% <0.001
SCL-90-R (0=1,030) (0-989) (0=1,914) (0=16) Hostility Aboormal 6.5% 3.1% 0.001 4.3% 81.3% <0.001
seJ..;,90-R Ioterpersooal (0=1,030) (0=989) (0=1,914) (0=16) Sensitivity Abnormal 9.5% 3.3% <0.001 5.8% 81.3% <0.001
H I
N SCL-90-R ... Obsessive-eo.pulsive (0=1,030) (0=989) (0=1,914) (0=16) Behavior Abnormal 11.1% 4.8% <0.001 7.4% 81.3% <0.001
SCL-90-R Paranoid (nsl,030) (0=989) (0=1,914) (0=16) Ideatioo AbnorJlal. 5.1% 3.0% 0.022 3.5% 75.0% <0.001
SCL-90-R Phobic (0=1,030) (0=989) (0=1,914) (0=16) Anxiety AboorJlal. 9.0% 4.9% <0.001 6.3% 75.0% <0.001
SCL-90-R (0=1,030) (0=989) (0=1,914) (0=16) Psychoticism Aboormal 12.1% 5.6% <0.001 8.2% 93.8% <0.001

TABLE 1-1. (continued)
Dependent Variab1e-Covariate Associations for Psychology Assessaent
Education Post-Traumatic Stress Disorder
Dependent High p- p-
Variable Level School College Value No Yes Value
SCL-90-R (n3 1,03O) (n-989) (n=1,914) (n=16)
Soma tiza tion Abnonal 12.6% 5.9% <0.001 8.7% 87.5% <0.001
SCL-90-R (n.1,030) (n-989) (n=1,914) (n=16)
GSI Abnormal 10.8% 4.3% <0.001 6.8% 93.8% <0.001
SCL-90-R (n=1,030) (n=989) (n=1,914) (n=16)
PSDI Abnonal 11.1% 7.9% 0.018 9.1% 75.0% <0.001
.... SCL-90-R (n=1,030) (n=989) (n=1,914) (n=16) I N PST Abnormal 9.9% 4.8% <0.001 6.7% 93.8% <0.001 N
HCHI Schizoid (n=1,147) (8=1,127) (n=2,158) (n=16)
Scorea i=26.3 x=22.6 <0.001 x=24.1 x=83.0 <0.001
HCMI Avoid~t (n=1,147) (n=1,127) (n=2,158) (n=16)
Score x=19.3 x=14.3 <0.001 x=16.3 x=89.2 <0.001
MCMI Dependent (n=1,147) (n=1,127) (n=2,158) (n=16)
Scorec x=44.0 x=38.6 <0.001 x=41.1 x=52.2 0.148
TABLE 1-1. (continaeel)
Dependent Variable-Ccmlriate Assoeiatioos for Psychology Assesswent
Education Post-Traumatic Stress Disorder
Dependent Higb p- p-
Variable Level School College Value No Yes Value
HCHI Histrionic (n=1,147) (n=1,127) (n=2,158) (n=16)
Score . x=61.4 x=65.9 <0.001 x=63.9 x=41.2 <0.001
HCHI Narcissistic (n=1,147) (n=1,127) (n=2,158) (n=16)
Score x=62.6 x=65.3 <0.001 x=64.1 x=40.1 <0.001
HCHI H Antisocial (n=1,147) (n=1,127) (n=2,158) (n=16) , N Score x=61.0 x=59.5 0.063 x=60.3 i:67.1 0.152 ..,
MCHI =lsive (n=1,147) (n=1,127) (n=2,158) (n=16)
x=68.1 x=68.9 0.035 x=68.7 x=42.2 <0.001
MCHI Passive-Aggressive (n=1,147) (n=1,127) (0=2,158) (n=16)
Scorec x=20.9 x=17 .2 <0.001 x=18.6 x=91.0 <0.001
MCHI Sehizotypal (n=1,147) (n=1,127) (n=2,158) (n=16)
Score x=36.8 x=31.8 <0.001 x=34.0 x=67.3 <0.001
TABLE 1-1. (continued)
Dependent Variable-Covariate Associations for Psychology AssesSllellt
Education Post-Traumatic Stress Disorder
Dependent High p- p-Variable Level School College Value No Yes Value
MCHI Borderline (n=1,147) (n=1,127) (n=2,158) (n=16) Score x=35.4 x=30.7 <0.001 x=32.6 x=71.5 <0.001
MCHI Paranoid (n=1,147) (n=1,127) (n=2,158) (n=16) Score i=54.1 x=50.4 <0.001 x=52.2 x=60.5 0.034
MCHI H Anxiety (n=I,147) (n:l,127) (n=2,158) (n=16) I Nt Score x=49.8 x=44.3 <0.001 x=46.7 x=92.9 <0.001 ..,.
MCHI SoIIatofon (n=I,147) (n=I,127) (n=2,158) (n=16) Score x=52.1 x=50.3 0.011 x=51.0 x=68.5 <0.001
MCHI Hypolllll1ia (n=1,147) (n=1,127) (n=2,158) (n=16) Scorec x=20.1 x:22.4 0.022 x=21.0 x=37.2 0.023
MCHI DysthYlda (n=1,147) (n=1,127) (n=2,158) (n=16) Score x=51.3 x=48.6 0.004 x=49.6 x=89.3 <0.001
MCMI Alcohol Abuse (n=I,147) (n=1.127) (n=2,158) (n=16) Score x=33.5 x=2B.7 <0.001 x=30.6 x=66.0 <0.001

·TABLB 1-1. (continued)
Dependent Variable-Covariate Associations for Psychology AsSesSEllt
Education Post-Traumatic Stress Disorder
Dependent High p- p-Variable Level School College Value No Yes Value
IICHI Drug Abuse (n=I,147) (n=I,127) (n=2,158) (n=16) Score x:48.7 x=46.2 0.003 x=47.2 x=58.1 0.029
IICHI Psychotic Thinlting (n=l, 147) (n=I,127) (n=2,158) (n=16) Score x-36.3 x=27.9 <0.001 x=31.6 x=70.8 <0.001
.... IICMI 1 .., Psychotic VI Depression (n=I,147) (n.l,127) (n=2,158) (n=16) Score x=27.1 x=19.5 <0.001 x=22.8 x=74.9 <0.001
IICMI Psychotic Delusion (n=I,147) (n=1,127) (n=2,158) (n=16) Score x=46.3 x=39.5 <0.001 x=42.8 x-53.8 0.033

TABLE 1-1. (continued)
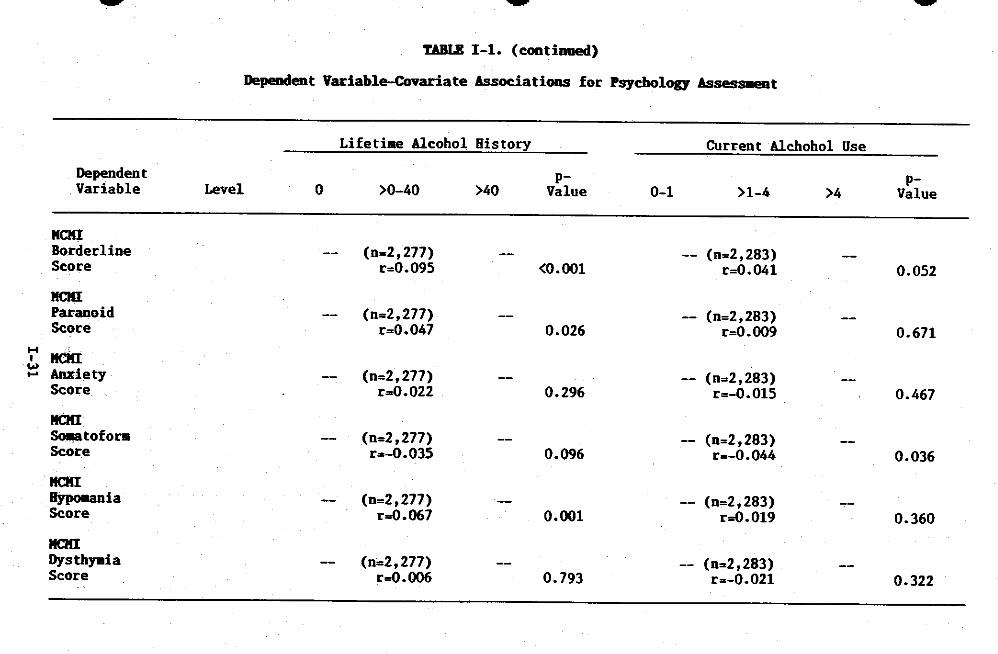
Dependent Variable-Covariate Associations for Psychology Assesseent
Lifetiae Alcohol BistoEl Current Alchohol Use
Dependent p- p-Variable Level 0 >0-40 >40 Value 0-1 >1-4 >4 Value
Trouble Falling (n=205) (n=1,559) (n=517) (n=1,816) (n=398) (n=74) Asleep Yes 6.8% 10.3% 15.5% 0.001 11.0% 11.1% 18.9% 0.104
Valting Up During (n=205) (n=1,559) (n=517) (n=1,816) (n=398) (n=74) the Night Yes 9.8% 12.6% 21.1% <0.001 13.2% 18.6% 18.9% 0.011
Valting Up Too .... Early and Can't (n=205) (n=1,559) (n=517) (n=1,816) (n=398) (n=74) I Go Back to Sleep Yes 7.8% 9.9% 15.5% 0.001 10.2% 13.6% 16.2% 0.050 .., a-
Valting Up (n=205) (n=1,559) (n=517) (n=1,816) (n=398) (n=74) Unrefreshed Yes 6.3% 9.0% 11.6% 0.066 9.5% 9.0% 10.8% 0.888
Involuntarily Falling Asleep (n=205) (n=1,559) (n=517) (n=1,816) (n=398) (n=74) During the Day Yes 2.9% 4.0% 4.4% 0.641 4.4% 2.5% 2.7% 0.201
Great or Disabling Fatigue (n=205) (n=1,559) (n=517) (n=1,816) (n=398) (n=74) During the Day Yes 2.0% 2.5% 4.3% 0.083 3.0% 2.5% 2.7% 0.880
Frightening (n=205) (n=1,554) (n=516) (n=1,810) (n=398) (n=74) Dreaas Yes 3.4% 3.5% 7.9% <0.001 4.0% 5.8% 8.1% 0.095

TABLE 1-1. (continued)
Dependent Variable-Covariate Associations for Psychology Assess-ent
Lifetiae Alcohol Bisto~ Current Alchohol Use
Dependent p- p-Variable Level 0 >0-40 >40 Value 0-1 >1-4 >4 Value
Talking in (n=205) (n=l,558) (n=516) (n=l,814) (n=398) (n=74) Sleep Yes 2.9% 3.4% 5.4% 0.090 3.7% 4.0% 5.4% 0.754
Sleepwalking (n=205) (n=l,559) (n=517) (n=l,816) (n=398) (n=74) Yes 2.0% 1.7% 2.3% 0.693 1. 7% 2.3% 4.1% 0.286
Abnormal Move.entl ... Activity During (n=205) (n=1,559) (n=517) (n=l,816) (n=398) (n=74) I the Night Yes 2.4% 3.1% 4.8% 0.133 3.5% 3.0% 4.1% 0.845
N ..... Sleep Problems Requiring (n=205) (n=l,559) (n=517) (n=l,816) (n=398) (n=74) Medication Yes 2.0% 1.5% 4.4% <0.001 1.9% 2.5% 6.8% 0.018
Snore Loudly in All Sleeping (n=205) (n=l,559) (n=517) (n=l,816) (n=398) (n=74) Positions Yes 4.9% 6.5% 9.5% 0.035 7.2% 6.8% 8.1% 0.913
InsoBDia (n=205) (n=I,559) (n=517) (n=l,816) (n=398) (n=74) Yes 17.1% 22.0% 32.1% <0.001 22.9% 27.6% 28.4% 0.083
Overall Sleep (n=205) (n=I,554) (n=516) (n=1,810) (n=398) (n=74) Disorder Index Abnormal 26.3% 32.4% 43.8% <0.001 33.5% 37.7% 41.9% 0.110
Average Sleep (n=2,281) (n=2,288) Each Night r=0.016 0.452 r=-0.003 0.879
SCL-90-R (n=178) (n=l,373) (n=469) (n=l,609) (n=354) (n=64) Anxiety Abnormal 6.2% 5.7% 9.8% 0.008 5.9% 9.0% 12.5% 0.016

TABLE 1-1. (continued)
Dependent Variable-Covariate Associations for Psychology AsSesSEDt
Lifetime Alcohol Histo~ Current Alchohol Use
Dependent p- p-Variable Level 0 >0-40 >40 Value 0-1 >1-4 >4 Value
SCL-90-R (n=178) (n=I,373) (n=469) (n=I,609) (n=354) (n=64) Depression Abnomal 10.7% 7.1% 11.5% 0.007 7.9% 11.3% 9.4% 0.112
SCL-90-R (n=178) (n=I,373) (n=469) (n=I,609) (n=354) (n=64) Hostility Abnormal 2.8% 4.1% 8.1% 0.001 4.4% 6.2% 9.4% 0.086
SCL-90-R ... Interpersonal (n=178) (n=1,373) (n=469) (n=1,609) (n=354) . (n=64) I Sensitivity Abnormal 5.1% 5.8% 9.4% 0.016 6.3% 7.1% 9.4% 0.553 ... 0>
SCL-90-R Obsessive-Compulsive (n=178) (n=I,373) (n=469) (n=I,609) (n=354) (n=64) Behavior Abnomal 7.3% 7.1% 11.1% 0.020 7.6% 9.3% 9.4% 0.527
SCL-90-R Paranoid (n=178) (n=I,373) (n=469) (n=I,609) (n=354) (n=64) Ideation Abnomal 2.2% 3.6% 6.2% 0.024 3.7% 5.4% 6.3% 0.251
SCL-90-R (n=178) (n=I,373) (n=469) (n=I,609) (n=354) (n=64) Phobic Anxiety Abnomal 10.1% 5.9% 9.0% 0.019 7.0% 6.8% 7.8% 0.956
SCL-90-R (n=178) (n=I,373) (n=469) (n=I,609) (n=354) (n=64) Psychoticis. Abnomal 9.6% 7.8% 12.2% 0.016 8.6% 8.5% 18.8% 0.020
'l'ABLB 1-1. (cODtiDuecl)
Dependent Variable-Covariate Associations for Psychology AssesSIIeDt
Lifeti.e Alcohol HistoEl Current Alchohol Use
Dependent p- p-Variable Level 0 >0-40 >40 Value 0-1 >1-4 >4 Value
SCL-90-R (n=178) (n=l,373) (n=469) (n=l,609) (n=354) (n=64) So_tization Abnor.al 12.4% 8.2% 11.3% 0.042 9.3% 9.0% 10.9% 0.891
SC1,-90-R GSI (n=178) (n=l,373) (n=469) (n=l,609) (n=354) (n=64) Abnomal 7.3% 6.7% 10.4% 0.030 7.1% 8.8% 14.1% 0.086
SCL-90-R PSDI (n=178) (n=l,373) (n=469) (n=l,609) (n=354) (n=64) .... Abnor_l 14.6% 8.7% 9.6% 0.042 9.8% 8.2% 7.8% 0.574 I
N SCL-90-R PST (na 178) (n=l,373) (n=469) (n=l,609) (n=354) (n=64) -D
Abnomal 6.7% 6.4% 10.7% 0.009 6.9% 8.5% 15.6% 0.024
KCItI Schizoid (n=2,277) (n=2,283) Score- r=0.047 0.024 r=O.017 0.427
KCHI Avoi.dfnt (n=204) (n=l,559) (n=514) -- (n=2,283) Score x=17.6 x=15.8 x=19.3 <0.001 r=O.054 0.010
KCItI Dependent (n=2,277) (n=l,812) (n=397) (n=74) Scorec r=-O.OO5 0.794 x=42.1 x=37.5 x=43.6 <0.001
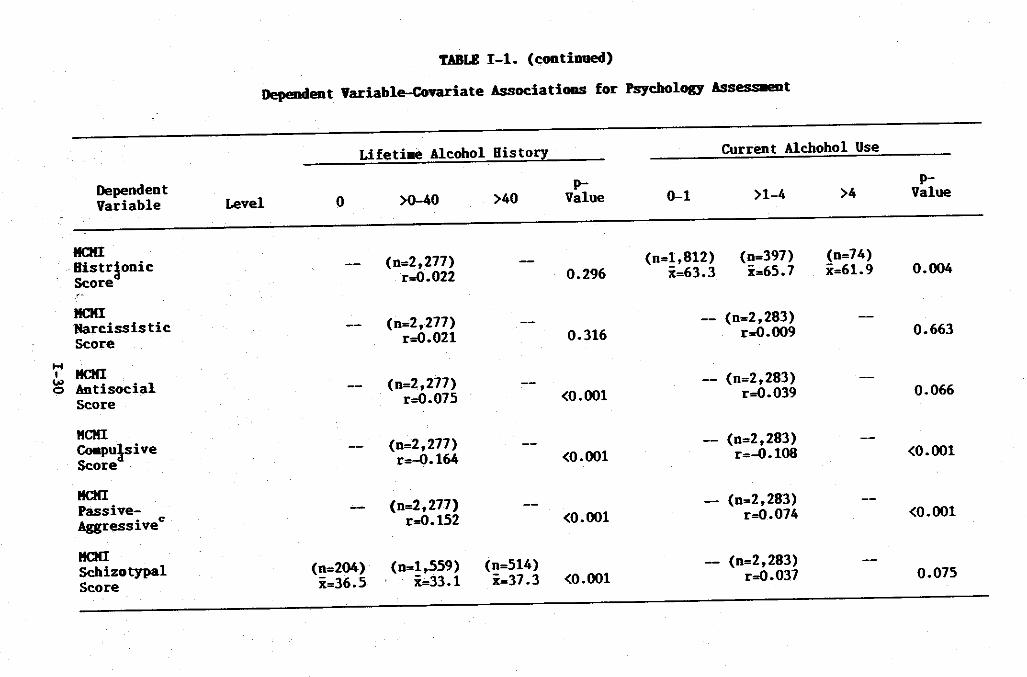
TABLE 1-1. (cODtiDued)
Dependent Yariab1e-Covariate Assoc:iatious for Psychology AsSesSIIeDt
Lifetiae Alcohol Histo~ Current Alchohol Use
Dependent p- p-
Variable Level 0 >0-40 >40 Value 0-1 >1-4 >4 Value
KCHI Histrionic (D=2,277) (D=1,812) (0=397) (D=74)
Score r=O.022 0.296 x=63.3 x=65.7 x-61.9 0.004
KCHI Narcissistic (D=2,277) (D=2,283)
Score r=O.021 0.316 r=O.009 0.663
... KCHI I ..., Antisocial (D=2,277) (D=2,283)
0 Score r=O.075 <0.001 r=O.039 0.066
"CHI Coapulsive (D=2,277) -- (D=2,283)
Score r=-O.164 <0.001 r=-O.108 <0.001
KCHI Passive- (0=2,277) - (0=2,283)
Aggressivec r=O.152 <0.001 r=O.074 <0.001
KCHI Schizo typal (0=204) (D=I,559) (0=514) (D=2,283)
Score x=36.5 x=33.1 x=37.3 <0.001 r=O.037 0.075
- -- --~ 1-1. (contiuued)
Dependent Varlable-Covariate Associations for Psychology Assessaent

Dependent Variable
KCMI Alcohol Abuse Score
lICMI OPlg Abuse Score
'i' KCMI .., .., Psychotic
Thinking Score
KCMI Psychotic Depression Score
KCMI Psychotic Delusion Score
~LE 1-1. (continued)
Dependent Variable-Covariate Associations for Psychology AssesSEDt
Level o
Lifetime Alcohol History
>0-40
(n=2,277) r=O.279
(n=2,277) r=0.109
(n=2,277) r=O.I00
(n=2,277) r=O.118
, (n=2,277) r=O.003
>40 p
Value
<0.001
<0.001
<0.001
<0.001
0.885
0-1
(n=1,812) x=43.7
Current Alchohol Use
>1-4
(n=2,283) r=0.187
(n=2,283) r=0.061
(n=2,283) r=0.063
(n=2,283) r=O.Os2
(n=397) x=38.9
>4
(n=74) x=4s.8
pValue
<0.001
0.004
0.003
0.013
<0.001
fra. natural logaritha scale; correlations based on natural logaritha versus covariate. froB natural logaritha (X+l) scale; correlations based on natural logarithm (X+l) versus
froB square root scale; correlations based on square root versus covariate. froB square scale; correlations based on square versus covariate.
Note~orrelations (r) are based on total sample and a~ot category specific.
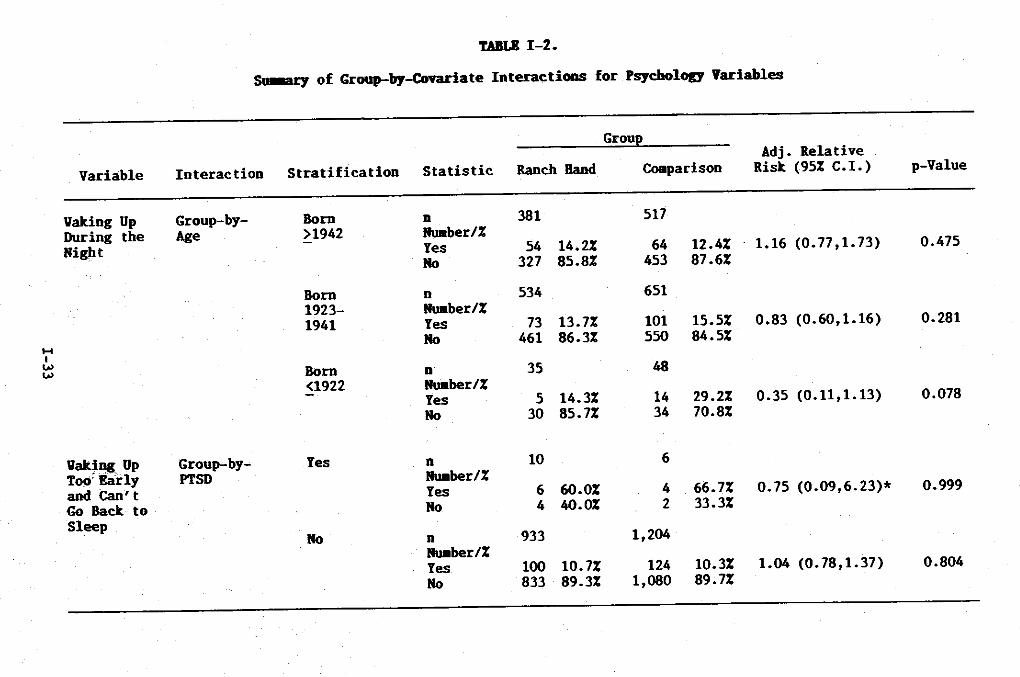
TABLE 1-2.
s-ry of Group--by-covariate Interactions for Psychology Variables
Groul! Adj. Relative
Variable Interaction Stratification Statistic Ranch Band Coaparison Risk (95% C.I.) p-Value
Vaking Up Group-by- Born D 381 517 During the Age >1942 Number!% Night Yes 54 14.2% 64 12.4% 1.16 (0.77,1.73) 0.475
No 327 85.8% 453 87.6%
Born D 534 651 1923- Number!% 1941 Yes 73 13.7% 101 15.5% 0.83 (0.60,1.16) 0.281
... No 461 86.3% 550 84.5% I ....
Born 35 48 .... D (1922 Number!%
Yes 5 14.3% 14 29.2% 0.35 (0.11,1.13) 0.078 No 30 85.7% 34 70.8%
Vaking Up Group-by- Yes D 10 6 Too'Early PTSD Number!% and Can't Yes 6 60.0% 4 66.7% 0.75 (0.09,6.23)* 0.999 Go Back to No 4 40.0% 2 33.3% Sleep
No D 933 1,204 Number!% Yes 100 10.7% 124 10.3% 1.04 (0.78,1.37) 0.804 No 833 89.3% 1,080 89.7%

TABLE 1-2. (continued)
Sa ry of Group-by-Covariate Interactions for Psychology Variables
Groul! Adj. Relative
Variable Interaction Stratification Statistic Ranch Hand eoBparison Risk (95% C. I. ) p-Value
Talking Group-by- Yes n 10 6 in Sleep PTSD Nuatber/%
Yes 3 30.0% 1 16.7% 2.14 (0.17,27.10) 0.999 No 7 70.0% 5 83.3%
No n 932 1,203 HUBber/% Yes 42 4.5% 37 3.1% 1.48 (0.94,2.34) 0.089
... No 890 95.5% 1,166 96.9% I .., ~
Abnoral Group-by- High n 494 605 MoveBent/ Education School HUBber/% Activity Yes 30 6.1% 21 3.5% 1.63 (0.90,2.93) 0.106 During the No 464 93.9% 584 96.5% Night
(;allege n 458 608 Nuatber/% Yes 6 1.3% 16 2.6% 0.52 (0.20,1.35) 0.177 No 452 98.7% 592 97.4%
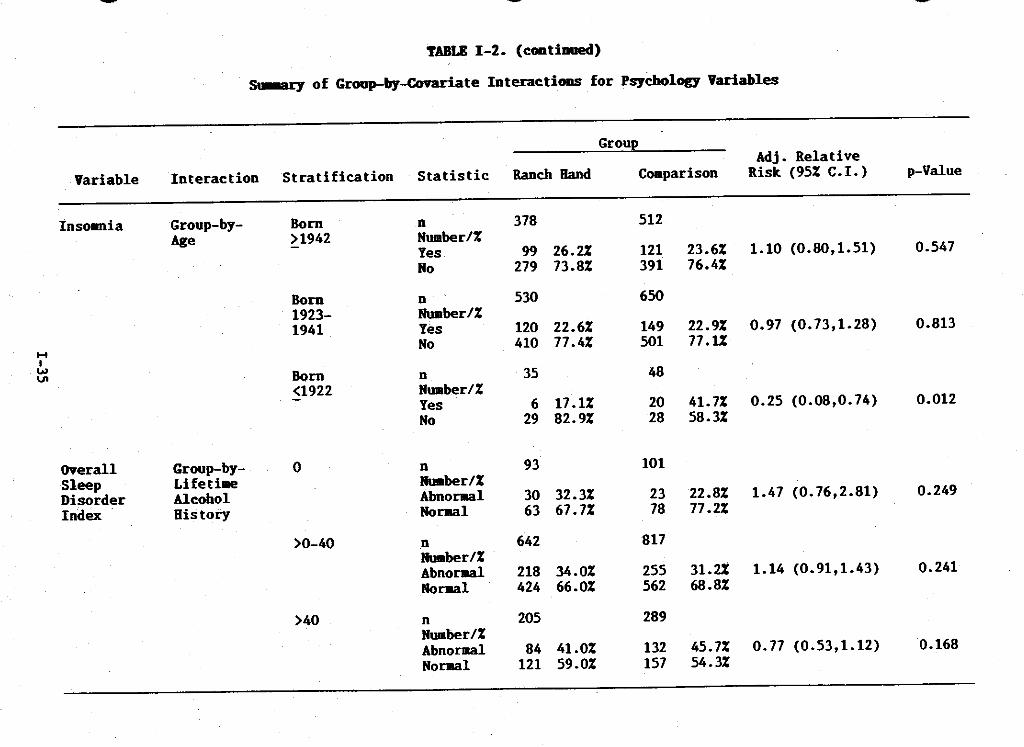
TABLE 1-2. (continued)
S.-ry of Group-by-Covariate Interactions for Psychology Variables
Groul! Adj. Relative
Variable Interaction Stratification Statistic Ranch Band COIBparison Risk (95% C. I. ) p-Value
InsollDia Group-by- Born n 378 512 Age >1942 NUlBber/%
Yes 99 26.2% 121 23.6% 1.10 (0.80,1.51) 0.547 No 279 73.8% 391 76.4%
Born n 530 650 1923- Nullber/% 1941 Yes 120 22.6% 149 22.9% 0.97 (0.73,1.28) 0.813
H No 410 77.4% 501 77.1%
I W Born 35 48 U1 n
<1922 NUlBber/% Yes 6 17.1% 20 41.7% 0.25 (0.08,0.74) 0.012 No 29 82.9% 28 58.3%
OVerall Group-by- 0 n 93 101 Sleep Life t iae Nuaber/% Disorder Alcohol AbnorJlal 30 32.3% 23 22.8% 1.47 (0.76,2.81) 0.249 Index History NorJlal 63 67.7% 78 77.2%
>0-40 n 642 817 Nuaber/% Abnoral 218 34.0% 255 31.2% 1.14 (0.91,1.43) 0.241 Noral 424 66.0% 562 68.8%
>40 n 205 289 NUlBber/% Abnormal 84 41.0% 132 45.7% 0.77 (0.53,1.12) 0.168 NOrJlal 121 59.0% 157 54.3%
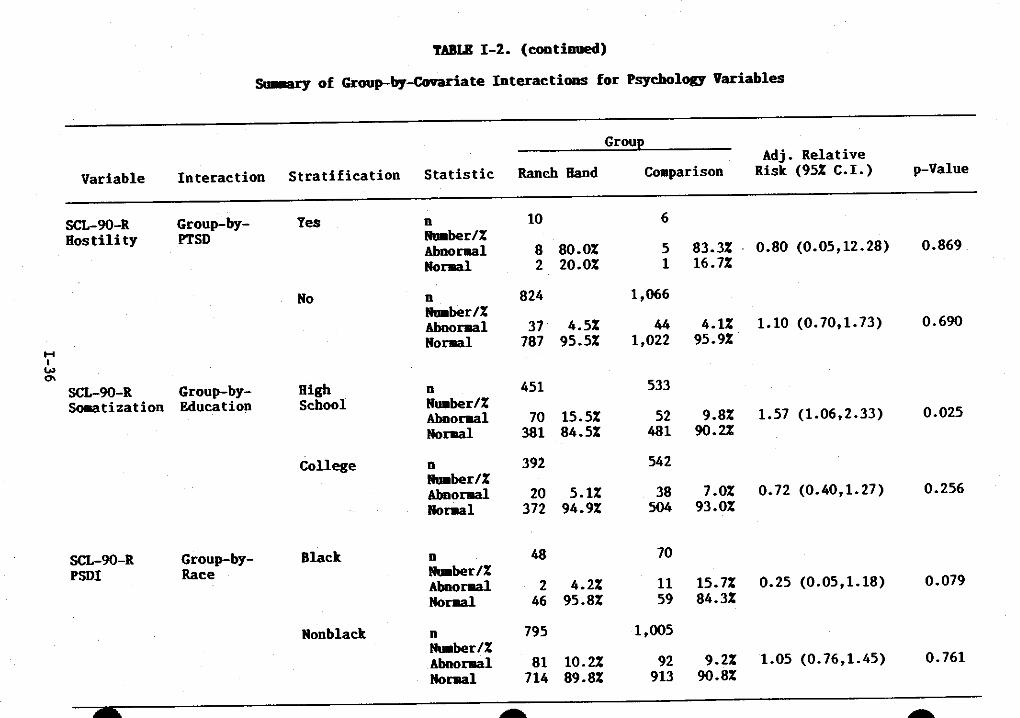
TABLE 1-2. (continued)
SII ry of Group-by-Covariate Interactions for Psychology Variables
Groul! Adj. Relative
Variable Interaction Stratification Statistic Ranch Band Coaparison Risk (95% C.1.) p-Value
SCL-90-R Group-by- Yes n 10 6 Hostility PTSD Nuaber/%
Abnonal 8 80.0% 5 83.3% 0.80 (0.05,12.28) 0.869 Nonal 2 20.0% 1 16.7%
No n 824 1,066 Nuaber/% Abnonal 37 4.5% 44 4.1% 1.10 (0.70,1.73) 0.690
H Nonal 787 95.5% 1,022 95.9%
I .., '" SCL-9O-R Group-by- High n 451 533
Soaatization Education School Rober/% Abnonal 70 15.5% 52 9.8% 1.57 (1.06,2.33) 0.025 Nonal 381 84.5% 481 90.2%
College n 392 542 Nuaber/% Abnonal 20 5.1% 38 7.0% 0.72 (0.40,1.27) 0.256 Nonal 372 94.9% 504 93.0%
SCL-9O-R Group-by- Black n 48 70 PSDI Race Nuaber/%
Abnoraal 2 4.2% 11 15.7% 0.25 (0.05,1.18) 0.079 Noraal 46 95.8% 59 84.3%
Ronblack n 795 1,005 Nuaber/% Abnonal 81 10.2% 92 9.2% 1.05 (0.76,1.45) 0.761 Nonal 714 89.8% 913 90.8%
~ .....
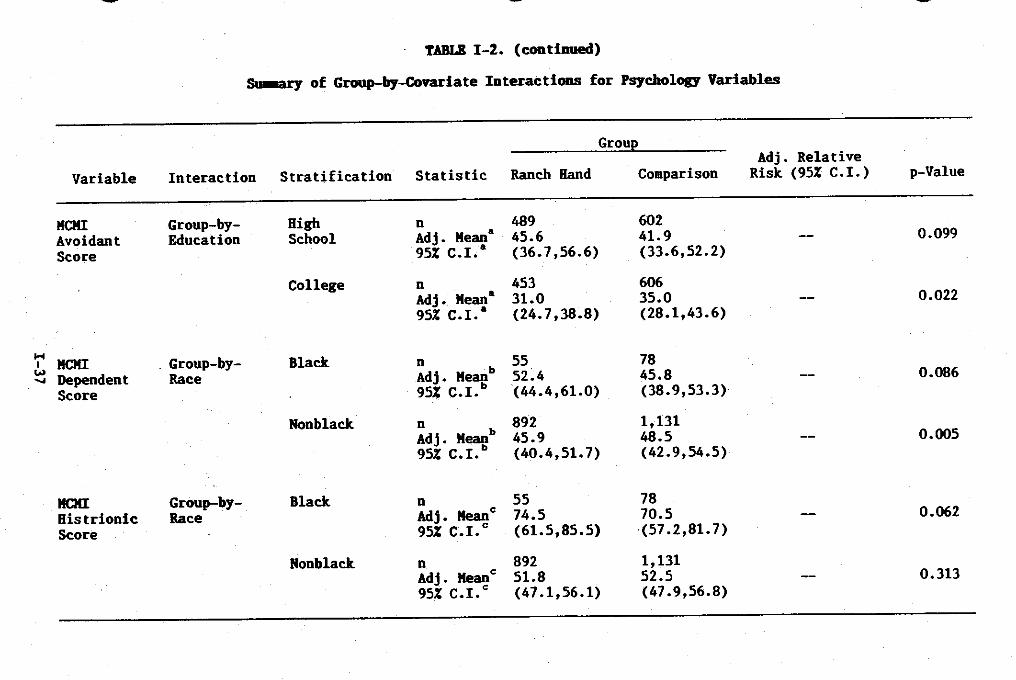
TABLE 1-2. (continued)
~ of Group-by-Covariate Interactious for Psychology Variables
Groue Adj. Relative
Variable Interaction Stratification Statistic Ranch Band Comparison Risk (95% C. I. ) p-Value
KCHI Group-by- High n 489 602 Avoidant Education School Adj. Kean" 45.6 41.9 0.099 Score 95% C.1. a (36.7,56.6) (33.6,52.2)
College n 453 606 Adj. Keana 31.0 35.0 0.022 95% C.I.· (24.7,38.8) (28.1,43.6)
... . Group-by- Black I KCHI n 55 78 w Dependent Race Adj. Keagb 52.4 45.8 0.086 .....
Score 95% C.1. (44.4,61.0) (38.9,53.3)
Nonblack n 892 1,131 Adj. Keagb 45.9 48.5 0.005 95% C.1. (40.4,51. 7) (42.9,54.5)
KCHI Group-by- Black n 55 78 Histrionic Race Adj. Keanc 74.5 70.5 0.062 Score 95% C.1. C (61.5,85.5) (57.2,81.7)
Nonblack n 892 1,131 Adj. Keanc 51.8 52.5 0.313 95% C.1. C (47.1,56.1) (47.9,56.8)

TABLE 1-2. (coatinued)
s-Ey of Group-by-Covariate Interactions for Psychology Variables
Grou! Adj. Relative
Variable Interaction Stratification Statistic Ranch Band Coaparison Risk (95% C.l.) p-Value
HCIII Group-by- Yes n 7 4
Coapulsive PTSD 0-1 Adj. Mean C 51.9 25.7 0.004
Score 95% C.I. c (43.1,59.4) (0.0,41. 9)
Group-by-Current Yes n 3 2
Alcohol >1-4 Adj. Mean C 45.7 51.0 0.614
Use 95% C.l. C (28.6,57.9) (32.3,64.5)
No n 747 951 0-1 Adj. Mean C 69.4 69.8 0.318
... I
95% C.l. C (68.5,70.3) (69.0,70.6) ..., CD
No n 160 206 >1-4 Adj. Mean C 68.4 68~2 0.802
95% C.l. C (66.9,69.8) (66.7,69.6)
No n 25 45 >4 Adj. Mean C 71.4 67.0 0.028
95% C.I. c (67.1,75.4) (63.0,70.7)

TABLE 1-2. (continued)
s.-ry of Group-by-covariate Interactioos for Psychology Variables
Groul! Adj. Relative
Variable Interaction Stratification Statistic Ranch Hand COllparison Risk (95% C. I.) p-Value
HCKI Group-by- High :dj. Heaeb
489 602 Passive- Education School 49.6 46.2 0.014 Aggressive 95% C.1. (43.9,55.7) (40.7,52.1) Score
College n 453 606 Adj. Heae b 43.0 44.2 0.354 95% C.1. (37.6,48.8) (38.9,50.0)
... Grolip:-by-I HCKI 0 n 92 101 ...,
'" Schizo typal Lifetime Adj. Hean 53.0 53.0 0.977 Score Alcohol 95% C.1. (47.0,59.1) (47.0,58.9)
History >0-40 n 645 819
Adj. Hean 48.0 49.9 0.053 95% C.1. (43.2,52.9) (45.1,54.8)
>40 n 205 288 Adj. Hean 55.0 52.1 0.081 95% C.1. (49.9,60.2) (47.0,57.2)
HCHI Group-by- Black n 55 78 Borderline Race Adj. Hean 55.8 50.2 0.057 Score 95% C.1. (49.7,62.0) (44.6,55.8)
Nonblack n 887 1,130 Adj. Hean 51.0 52.9 0.012 95% C.1. (46.7,55.3) (48.5,57.2)

TABLE 1-2. (continued)
S.-ry of Group-by-Covariate Interactions for Psychology Variables
Groul! Adj. Relative
Variable Interaction Stratification Statistic Ranch Band eo.parison Risk (95% C.l.) p-Value
IICMI Group-by- Black n 56 78 Anxiety Race Adj. Rean 15.6 68.3 0.042 Score 95% C.l. (68.2,83.1) (61.5,75.0)
Nonblack n 895 1,132 Adj. Rean 68.1 71.0 0.014 95% C.l. (63.5,73.9) (65.8,76.2)
... IICMI Group~by- Black 0 1 I n ....
0 Alcohol Race Yes Adj. Rean 95.1 Abuse 95% C.l. Score Group-by-
PTSD Black n 55 11 No Adj. Rean 39.3 32.5 0.014
95% C.l. (35.1,43.4) (29.1,36.0)
Nonblack n 10 5 Yes Adj. Rean 57.2 70.0 0.135
95% C.l. (47.6,66.9) (56.3,83.6)
Nonblaclt n 811 1,125 No Adj. Rean 30.5 30.3 0.711
95% C.l. (29.4,31.5) (29.4,31.2)

Variable
MCMI Psychotic Depression Score
tABLE 1-2. (continued)
s-ry of Group-by-Covariate Interactions for Psychology Variables
Group
Interaction Stratification Statistic Ranch Rand Comparison Adj. Relative
Risk (95% C.1.)
Group-by- High n 489 602 Education School Adj. Mean 52.0 50.1
95% C.I. (47.0,56.9) (45.1,55.2)
College n 453 606 Adj. Mean 42.7 45.3 95% C.I • (37.6,47.8) (40.3,50.3)
p-Value
0.125
0.034
.... ~ --Adjusted relative risk not applicable for continuous analysis of a variable; S\lllJllary statistics not given due to ~ zero participants in a particular group.
*Unadjusted relative risk and p-value used.
:i~~~:~ ~~:: !~!!::e(!;!: :~:t:: cTransforaed fro. the square scale.
Note: Refer to Tables 12-5, 12-7, and 12-9 for specification of adjusted model.

TBEI-3.
ExposIn:e InJex EIqlooure Interactim InJex Mj. Relative
Variable (OIx1Ipaticn) StIatificaticn Statistic KediIJll High ODtrast RiSt (95% C.I.) !>-Value
Invohn- Exposure High Scb:Iol n 0 0 6 Ove:all tarlly ~- Bam tbileI:/% Falliqr Fdlcaticn 1923-1941 Yes 0 0 0 O.at M vs. L Asleep 0 ~ 0 0 6 100.at H vs. L JlJrq the Exposure Illy InJex-by- High Scb:Iol n 7 5 11 Ove:all 0.095
Ice Bam tbileI:/% 1923-1941 Yes 2 28.6% 2 ltO.at 0 O.at M vs. L 1.67 (0.15,18.87) 0.999
Exposure )()...It() ~ 5 71.4% 3 6O.at 11 lOO.at H vs. L 0.274 InJex-by-LifetiDe High Scb:Iol n 1 3 4 Ove:all
~ AlcdIDl Bam tbileI:/% Histoty 1923-1941 Yes 0 O.at 0 O.at 0 O.at M Vs. L (Officer) >40 ~ 1 lOO.at 3 lOO.at 4 100.at H vs. L
High Scb:Iol n 0 0 1 Ove:all Bam <1922 tbileI:/% 0 Yes 0 0 0 O.at M vs. L
~ 0 0 1 lOO.at H vs. L
High Scb:Iol n 1 3 1 Ove:all 0.659 80m <1922 ~/% )()...It()- Yes 0 O.at 1 33.3% 0 O.at M vs. L 0.999
~ 1 lOO.at 2 66.7% 1 100.at H vs. L
High Scb:Iol n 0 4 1 Ove:all Bam <1922 tbileI:/% >40- Yes 0 0 O.at 0 O.at M vs. L
~ 0 4 100.at 1 100.at H vs. L

- -TAII.E 1-3. (cmtimed)
Rxpa""! ~ IDteI:actims fir ~ kiab1es
Expa;me InIex &posure Inter.lCtim InIex Mj. Relative
Variable (~tim) StIatificatim Statistic Medim High ODttast Risk (95% c.!.) JrValue
Inwhn- College n 4 0 2 Overall tarily 110m >1942 liBIer-/% Fall.q 0 Yes 0 0.01: 0 0 0.01: " lIS. L Asleep tb 4 100.01: 0 2 100.01: HIlS. L ~the Illy Qill.ege n 38 19 7 Overall O.:m (cmt.) 110m >1942 tlJdler/%
>0-110- Yes 0 0.01: 1 5.3% 0.01: " lIS. L 0.666 tb 38 100.at 18 94.7% 1 100.01: HIlS. L
O.JJege n 4 1 1 Overall
~ 110m> 1942 tlJdler/% ... >«l Yes 0 0.01: 0 0.01: 0 O.at " IIS~ L tb 4 100.at 1 100.at 1 100.at HIlS. L
College n 6 3 4 Overall 110m l'bileI:I% 1923-1941 Yes 0 0.01: 0 0.01: 0 0.01: " lIS. L 0 tb 6 100.at 3 1OO.at 4 100.01: HIlS. L
Qill.ege n 47 61 61 Overall 0.977 110m liBIer-/% 1923-1941 Yes 1 2.1% 1 1.6% 1 1.6% "lIS. L O. n (O.ffi,12.59) 0.999 >0-110 tb 46 'fl.'Jl. 00 98.~ 00 98.~ HIlS. L O. n (O.ffi,12.59) 0.999
Qill.ege n 16 15 25 Overall 0.249 110m liBIer-/% 1923-1941 Yes 0 O.at 1 6.7% 0 0.01: " lIS. L 0.968 >«l tb 16 100.at 14 93.3% 25 100.01: HIlS. L
DIU 1-3. (aDt:irued)
Rqwae IDIeIr:~ Intemctim!I fir ~ kiab1es
Jlgpasure IIIIex Exposure Intetacticn IIIIex Adj. Felative
Variable (Oc:aJpatim) Sttatificatim Statistic MediIllJ Bigb Qnttast Risk (95% C.l.) p-Value
IIMllm- College n 4 4 0 Overall tarlly 80m <1.922 lbilE/% ~ >0-40- Yes 0 O.at 0 O.at 0 K vs. L Asleep tb 4 1oo.at 4 1oo.at 0 H vs. L ~the DIy College n 0 3 0 Overall (cmt.) 80m <l922 lbilE/%
>40 Yes 0 1 33.3% 0 K vs. L tb 0 2 66.7% 0 H vs. L
.... IIMllm- Exposure Bigb 103 117 102 Overall 0.032 k n tarlly IIIIex-by- Sdml lbilE/% ~ Fducatim Yes 8 7.8% 2 1.7% 2 2.at K vs. L 0.21 (O.~,1.OO) 0.065 Asleep (8ilisted tb 95 92.2% 115 98.3% 100 98.at H vs. L 0.24 (0.05,1.15) 0.1~
~the GrotnIcn!v) DIy College n 38 38 31 Overall 0.227
lbilE/% Yes 0 O.at 3 7.9% 2 6.5t K vs. L 0.240 tb 38 1OO.at 35 92.1% 29 93.5t H vs. L 0.396

TAIIE 1-3. (cmtiJu!I)
EIqy"'1I"E! IRIex EKpoom:e Inter:actial :r..Ec Mj. Relative
Variable (Occupatial) Sttatificatim Statistic MediIJD 8igb Qnttast Risk (95% C.l.) p-Va1.ue
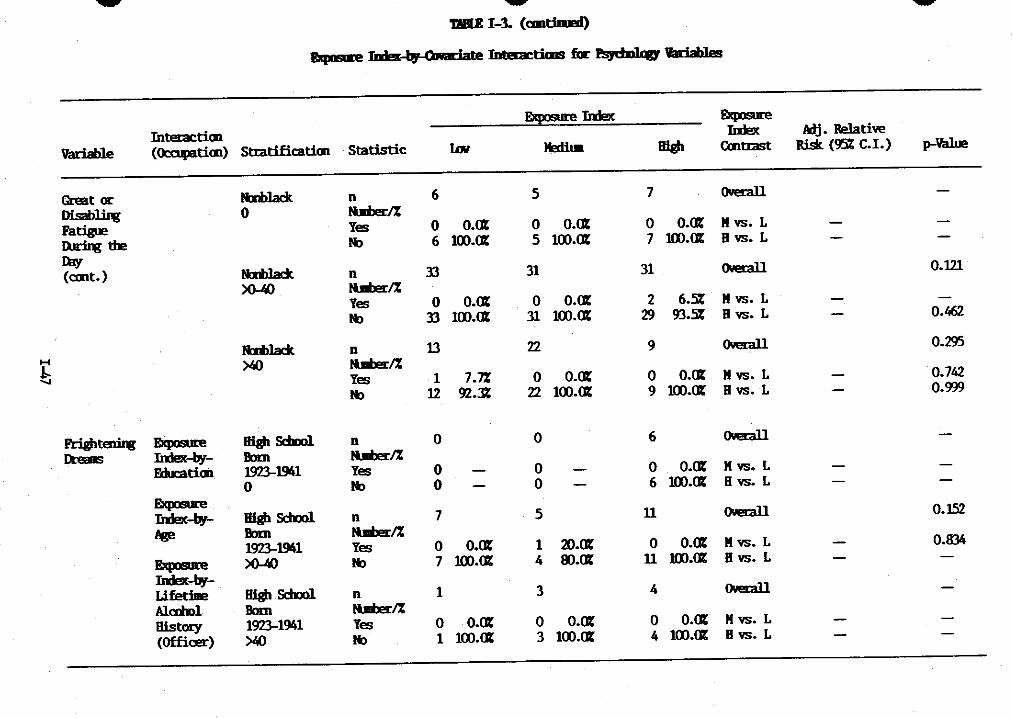
Great or \!xpoIme 80m >1942 n 4 0 2 Overall Dlsabliqr IDIex-4Jy- 0 tbIie:/% Fatigue • Yes 0 O.or: 0 0 O.or: M vs. L I\Jriqr the tb 4 1oo.or: 0 2 1oo.or: B vs. L IllIy \!xpoIme
IRIex-4Jy- 80m >1942 n 38 19 7 Overall 0.7IX> LifetiE >0-40- tbIie:/% AkdJol Yes 1 2.6% 0 O.or: 0 O.or: M vs. L 0.999 History tb Y 'fl.1J. 19 lOO.or: 7 lOO.or: B vs. L 0.999 (Office:)
80m >1942 n 4 1 1 Overall H >«>- tbIie:/% hi Yes 0 O.or: 0 O.or: 0 O.or: M vs. L
tb 4 lOO.or: 1 1oo.or: 1 lOO.or: B vs. L
80m n 6 3 10 Overall 1923-1941 1bD!t"/% 0 Yes 0 O.or: 0 O.or: 0 O.or: M vs. L
tb 6 lOO.or: 3 lOO.or: 10 1oo.or: B vs. L
80m n 54 66 n Overall 0.019 1923-1941 1bD!t"/% >0-40 Yes 0 O.or: 0 O.or: 3 4.2% M vs. L
tb 54 lOO.or: 66 1oo.or: 69 95.8% B vs. L 0.366
80m n 17 18 29 Overall 0.273 1923-1941 1bD!t"/% >«> Yes 0 O.rot 1 5.6% 0 O.at M vs. L 0.999
tb 17 lOO.or: 17 94.1J. 29 1oo.at B vs. L

'I'.AIIE 1-3. (cmtinBl)
""(mae ~te Jntemctims fml"sJdDhv ~
E>i,"""l[e Index Exposure Interactim Index Adj. Relative
Variable (~tim) Sttatificatim Statistic MeditJI High Q:ntmlt Risk (95% C.l.) p-Value
Gmlt or BolD <1.922 n 0 0 1 Ove:all ~ 0 tbiler/%
. Fatigue Yes 0 0 0 O.at M vs. L ~the It> 0 0 1 lOO.at B vs. L Day (ant.) BolD <1.922 n 5 7 1 Ove:all
>tJ....«)- tbiler/% Yes 0 O.at 0 O.at 0 O.at M vs. L It> 5 lOO.at 7 lOO.at 1 lOO.at B vs. L
BolD <1.922 n 0 7 1 Ove:all
~ >40- tbiler/% Yes 0 0 O.at 0 O.at M 118. L It> 0 7 lOO.at 1 1oo.at B vs. L
Gmlt or Iaposute B1aclt n 0 1 0 Ove:all Djsahli'lt InIex-by- 0 tbiler/% Fatigue Race Yes 0 0 O.at 0 M vs. L ~the It> 0 1 lOO.at 0 B vs. L Day Expos!Jl'e
InIex-by- B1aclt n 1 3 1 Ove:all 0.659 Lifetbe >tJ....«) tbiler/% Al.c.dm Yes 0 O.at 1 n.lt 0 O.at M vs. L 0.999 History It> 1 lOO.at 2 66.7% 1 lOO.at B vs. L (&Ilisted Flyer-) B1aclt n 0 0 2 Ove:all
>40 tbiler/% Yes 0 0 0 O.at M vs. L It> 0 0 2 1oo.at B vs. L
- .- .-
- - --DIU 1-3. (cmtiJued)
..... ft 1Ildis~ Intaactims fir ~ 'iIdab1es
~:rmex Elcpos!n-e Interacticn :rmex Mj. Relative
Variable (Oc.al(Bticn) snatificaticn Statistic IIediul O:.ottast Risic. (95% C.I.) p-Value
Great or IbIbladt n 6 5 7 Overall Dislbliqt 0 tbdler/% Fatigue Yes 0 0.0'1: 0 0.0'1: 0 0.0'1: K vs. L ~the lb 6 tOO.O'I: 5 100.0'1: 7 tOO.O'I: H vs. L DIy (COlt.) IbIbladt n :n 31 31 Overall 0.121
)()...1tO tbIber/% Yes 0 0.0'1: 0 0.0'1: 2 6.5% K vs. L lb :n tOO.O'I: 31 100.0'1: 29 93.5% H vs. L 0.462
ftd>lac:k. n 13 22 9 Overall 0.295 .... )I,() tbBber/% !:; Yes 1 7.7% 0 0.0'1: 0 0.0'1: K vs. L 0.7~ lb 12 9'l.lt 22 100.0'1: 9 100.0'1: H vs. L 0.999
FrigbtElliJlr Exposure High School n 0 0 6 Overall Dreams 1Ildis-by- Bam tbdler/%
Fducaticn 19n--1941 Yes 0 0 0 0.0'1: K vs. L 0 lb 0 0 6 tOO.O'I: H vs. L
Exposure 1Ildis-by- High School n 7 5 11 Overall 0.152 I!ge Bam tbD!I:/%
19n--1941 Yes 0 0.0'1: 1 :!>.O'I: 0 0.0'1: K vs. L 0.834 Expasm:e )()...1tO lb 7 tOO.O'I: 4 IK>.O'I: 11 tOO.O'I: H vs. L 1Ildis-by-IJ.fetiE High School n 1 3 4 Overall AJ..ccml Bam tbdler/% History 19n--1941 Yes 0 0.0'1: 0 0.0'1: 0 0.0'1: K vs. L (Officer) )I,() lb 1 100.0'1: 3 100.0'1: 4 100.0'1: H vs. L

'D1IE 1-3. (cmtiuJed)
g,qMlSlla! Index Exposure Jntel'actim Index Mj. Re1ative
variable (OcaJpatim) StIatificatim Statistic IlediID High ODttast lUSt (95% C.I.) (>-Va1ue
FrighteniIw High Sdmol n 0 0 1 0velaIl DteaIas 80m <1922 ~I% (cmt.) 0 Yes 0 0 0 O.<E M vs. L
No 0 0 1 100.<E B vs. L
High Sdmol n 1 3 1 0velaIl 80m <1922 ~I% >O--JI()- Yes 0 O.<E 0 O.<E 0 100.<E M vs. L
No 1 100.<E 3 1OO.<E 1 1OO.<E B vs. L
High Sdmol n 0 4 1 0velaIl ... 80m <1922 ~I% & >40 Yes 0 1 25.<E 1 1OO.<E M vs. L
No 0 3 75.<E 0 0.001: B vs. L
Oill.ege n 4 0 2 0velaIl 0.999 80m >1942 ~I% 0 Yes 1 25.<E 0 0 O.<E M vs. L
No 3 75.<E 0 2 100.<E B vs. L 0.999
Oill.ege n 38 19 7 0velaIl O.D> 80m >1942 ~I% >O--JI()- Yes 0 O.<E 1 5.lt 0 O.<E M vs. L 0.666
No 38 100.<E 18 94.7% 7 100.<E B vs. L
Oill.ege n 4 1 1 0velaIl 80m >1942 tbbd >40- Yes 0 O.<E 0 O.<E 0 O.<E M vs. L
No 4 100.<E 1 1OO.<E 1 100.<E B vs. L

- --TAIU 1-3. (cmtimed)
IIliqxaJl'l!! J:ndex~ IntI!IaI:tims fir ~ 'kiaIiIeJ
Elq:. "'In! IixIex Exposure IntetaCticn IixIex Adj. Relative
Variable (Occupaticn) Sttatificaticn Statistic HediUB High Ccn~t R:iSt (95% C.!.) p-Value
Fright~ Oillege n 6 3 4 0IIerall Dreams Born lbb!rl% (cent.) 1923-1941 Yes 0 O.at 0 O.at 0 O.at H vs. L
0 No 6 m.at 3 loo.at 4 loo.at B vs. L
College n 47 61 61 0IIerall 0.201 Bom tlBJet-I% 1923-1941 Yes 1 2.1% 0 O.at 3 4.9% H vs. L 0.870 >0-40 No 116 97.9% 61 m.at 511 95.1% B vs. L 2.38 (0.24,23.64) 0.826
Oillege n 16 15 25 0IIerall 0.190
~ Bom tbdla-I% 1923-1941 Yes 1 6.3% 2 13.3% 0 O.at Hw. L 2.31 (0.19,28.47) 0.'Bl >40 No 15 93.7% 13 86.7% 25 loo.at B vs. L 0.7!I)
(hi'. D 4 4 0 0IIerall Born <1922 lbb!rl% >0-40- Yes 0 O.at 0 O.at 0 H vs. L
No 4 m.at 4 m.at 0 B vs. L
Oillege D 0 3 0 0IIerall Born <1922 tbdla-I% >40 Yes 0 0 O.at 0 H vs. L
No 0 3 m.at 0 B vs. L

'DIU 1-3. (cmtiDJed)
Bxpawe :rn.IeK~te Inte!actims fir ~ kiab1es
I!xpos>Jre Index I!xpos>Jre Intel:actim Index Mj. Relative
Variable (Occ:upatim) StIatificatim Statistic MeditB High Ontrast RiSt (951: C.l.) p-Value
Fright~ FXposure High Sdml n 7 3 1 0veIall O.TIl IlreaBs :rn.IeK-by- 80m )1942 tlJIileI:l%
&iJcatim 0-1 Yes 1 14.3% 0 O.at 0 O.at H vs. L 0.999 B1adt tb 6 85.7% 3 1OO.at 1 100.at 8 vs. L 0.999
FXposure :rn.IeK-by- High Sdml n 'Jl 61 43 0veIall 0.132
• 80m )1942 tlJIileI:l% 0-1 Yes 3 8.1% 2 3.at 0 O.at H vs. L 0.35 (0.06,2.19) 0.400
FXposure tblbladc tb 34 91.9% 65 97.at 43 100.at H vs. L 0.189 :rn.IeK-by-OInalt High School n 1 2 1 0veIall
'i' Akdm 80m )1942 tbilerl% lS {lge )1-4 Yes 0 O.at 0 O.at 0 O.at H Vs. L
B1adt tb 1 100.at 2 1OO.at 1 1OO.at 8 vs. L FXposure Index-by- High Sdml n 8 12 6 0veIall 0.138 Race 80m )1942 flDIlerl% (Ihlistel )1-4 Yes 0 O.at 3 25.at 0 O.at H vs. L 0.386 Gmnfcrew) Nril1adt tb 8 1OO.at 9 75.at 6 1OO.at 8 vs. L
High Sdml n 0 2 0 0veIall 80m )1942 flDIlerl% >4 Yes 0 0 O.at 0 H vs. L B1adt tb 0 2 1OO.at 0 8 vs. L
High Sdml n 2 0 1 0veIall 80m )1942 tlJIileI:l% >4 Yes 0 O.at 0 0 O.at H vs. L tblbladc tb 2 1OO.at 0 1 1OO.at 8 vs. L