
Description of problems originating from adding a gas ...
38
Description of problems originating from adding a gas bubble to N2 fixation rate measurements (title added by Julie) Prepared by Jonathan Zehr Biological nitrogen fixation rate measurements are critical for determining the nitrogen budget of the oceans. Since nitrogen (N2) is a gas, these measurements require incubation of seawater samples with a gas, either isotopically labeled N2 molecules, or a N2 analogue (such as acetylene). Thus, there is a requirement of incubation of a liquid sample with a gas injection. The logical way to perform these experiments is to add tracer amount of 15 N (a stable isotope form of N) labeled N2 to a bottle filled with seawater that contains microorganisms, including nitrogen fixing microorganisms. The rate of nitrogen fixation is then easily determined by measuring the isotopic enrichment of the particulate nitrogen, which becomes enriched in N-15 through the enzymatic conversion of N2 into ammonium, and subsequently into amino acids and other organic cellular material. Experimentally, the measurement involves adding gas to a water sample through a gas tight septum in an incubation bottle, incubating the bottle in situ or under simulated in situ conditions, terminating the experiment by filtering the material onto a filter, and measuring the 14 N and 15 N isotopic abundances (or relative abundances) with a mass spectrometer. These experiments have typically been performed by injecting a gas bubble (typically a few milliliters) into a bottle filled with seawater, mixing the bottle to dissolve the bubble, and assuming the injected gas rapidly equilibrates with the dissolved N2 pool. The incubation period is typically 6-24 hours. The advantage of this technique is that it is very easy to perform and the water sample is minimally manipulated (water bottle filled, closed with serum stopper cap, and gas injected to start the incubation). Recent research has discovered that the dissolution of the gas bubble is quite slow, taking over 6 hours to reach close to equilibrium (saturation) in the dissolved pool. Thus, the resulting rates are inherently in error, since the N-15 percent labeling is changing over the initial phase of the incubation (see sidebar). One consequence is that the time of initiation of the experiment is critical, as is the nature of the nitrogen fixing microorganisms. For example, some nitrogen fixing microorganisms fix only in the light period (e.g. Trichodesmium) and if the incubation is begun at the beginning of the light period, there will be a large degree of error, since the isotope will not be in equilibrium during the period that nitrogen fixation occurs. In contrast, if the incubation is begun the previous evening, the isotope has time to equilibrate prior to the daytime nitrogen fixation of Trichodesmium. Additionally, some organisms fix only during the dark, and some fix in both the light and dark (e.g. the UCYN-A cyanobacteria). As a result the bubble method is inconsistent in how it underestimates nitrogen fixation. Clearly that the bubble dissolution does not occur completely and therefore represents a source of error that violates the principles of a tracer experiment (i.e. enrichment is incomplete, only slowly reaches equilibrium, and the physical process is slow relative to the biological process, nitrogen fixation, that is being measured).
Transcript of Description of problems originating from adding a gas ...

Description of problems originating from adding a gas bubble to N2 fixation rate measurements (title added by Julie)
Prepared by Jonathan Zehr
Biological nitrogen fixation rate measurements are critical for determining the nitrogen budget of the oceans. Since nitrogen (N2) is a gas, these measurements require incubation of seawater samples with a gas, either isotopically labeled N2 molecules, or a N2 analogue (such as acetylene). Thus, there is a requirement of incubation of a liquid sample with a gas injection. The logical way to perform these experiments is to add tracer amount of 15N (a stable isotope form of N) labeled N2 to a bottle filled with seawater that contains microorganisms, including nitrogen fixing microorganisms. The rate of nitrogen fixation is then easily determined by measuring the isotopic enrichment of the particulate nitrogen, which becomes enriched in N-15 through the enzymatic conversion of N2 into ammonium, and subsequently into amino acids and other organic cellular material. Experimentally, the measurement involves adding gas to a water sample through a gas tight septum in an incubation bottle, incubating the bottle in situ or under simulated in situ conditions, terminating the experiment by filtering the material onto a filter, and measuring the 14N and 15N isotopic abundances (or relative abundances) with a mass spectrometer.
These experiments have typically been performed by injecting a gas bubble (typically a few milliliters) into a bottle filled with seawater, mixing the bottle to dissolve the bubble, and assuming the injected gas rapidly equilibrates with the dissolved N2 pool. The incubation period is typically 6-24 hours. The advantage of this technique is that it is very easy to perform and the water sample is minimally manipulated (water bottle filled, closed with serum stopper cap, and gas injected to start the incubation).
Recent research has discovered that the dissolution of the gas bubble is quite slow, taking over 6 hours to reach close to equilibrium (saturation) in the dissolved pool. Thus, the resulting rates are inherently in error, since the N-15 percent labeling is changing over the initial phase of the incubation (see sidebar). One consequence is that the time of initiation of the experiment is critical, as is the nature of the nitrogen fixing microorganisms. For example, some nitrogen fixing microorganisms fix only in the light period (e.g. Trichodesmium) and if the incubation is begun at the beginning of the light period, there will be a large degree of error, since the isotope will not be in equilibrium during the period that nitrogen fixation occurs. In contrast, if the incubation is begun the previous evening, the isotope has time to equilibrate prior to the daytime nitrogen fixation of Trichodesmium. Additionally, some organisms fix only during the dark, and some fix in both the light and dark (e.g. the UCYN-A cyanobacteria). As a result the bubble method is inconsistent in how it underestimates nitrogen fixation.
Clearly that the bubble dissolution does not occur completely and therefore represents a source of error that violates the principles of a tracer experiment (i.e. enrichment is incomplete, only slowly reaches equilibrium, and the physical process is slow relative to the biological process, nitrogen fixation, that is being measured).

It has been proposed that the 15N labeled gas should be completely dissolved in a stock inoculum, such that when injected, it is immediately in equilibrium with the sample dissolved N2 pool. In order to rapidly equilibrate 15N2, a small volume of seawater is enriched with gaseous 15N2. Lowering the dissolved gas concentration prior to agitation with a 15N bubble can ensure the dissolution of the bubble in this aliquot. The aliquot is then injected into a sample bottle to initiate the experiment. The advantage of this new technique is that it does not violate tracer experimental rules (the isotope enrichment is not changing during the experiment). The major limitations of this approach are the initial preparation of the dissolved 15N tracer solution is involved, and the sample is manipulated by injection of a small volume of liquid containing the tracer (approximately 5% of the incubation volume). This injection could potentially be an additional source of contamination of metals or nutrients, and may therefore have biological effects (i.e. diluting the microorganisms and viruses in the water sample). However, the small volume involved is likely to be a very small perturbation, and given the nature of variability of abundance and activity of nitrogen fixing microorganisms in the oceans, probably is a minor concern.
Summary of the N2 fixation workshop 06 Feb – 08 Feb 2012 in Kiel,
Germany
Prepared by Wiebke Mohr
1) Presentations by workshop participants on their lab/field comparisons with the following
results:
a. Labs which observed differences between gaseous and aqueous addition of 15N2:
LaRoche (GEOMAR), Church/Karl (UH), Berman-Frank (Bar-Ilan U), Law
(NIWA: saturating dissolution curves in field and lab studies), Voss (IOW;
saturating dissolution curve in lab)
b. Labs which did not observe differences between methods: Rees (PML; MIMS
data not yet), Voss (IOW; no difference in N2 fixation rates), White (OSU;
MIMS data not yet)
2) Pros and cons of the two approaches: 15N2 gas bubble addition dissolved 15N2 addition
easy to use more effort to set up
minimal manipulation of the system more manipulation of the system
tracer not known and unstable over incubation
time
tracer known and stable over incubation time
3) Consensus of the workshop participants to the following questions:
“Does a non-instantaneous addition of tracer introduce artifacts theoretically?” The
answer: Yes.
“Do we need to change the 15N2 tracer method, i.e. not use bubble injections and have
something else?” The answer: Yes.
4) What are the drawbacks of switching the method and what kind of experiments need to
be done to validate that adding enriched water could be a standard method? (also:
Requirements for a standard method).
a. Requirements: 15N enrichment has to be stable and known for the incubation,
minimal impact/manipulation, adjustable to different ecosystems, i.e. salinity,
temperature, trophic status etc., method should be standardized
b. Experiments needed: Degassing efficiencies with different approaches, level of
saturation that can be achieved with 15N2 (supersaturation?), reproducibility of
enriching, possibility of preparation prior to cruises/field trips (is there an effect
by shipping enriched water/MIMS samples via airfreight?), natural vs. artificial
water, contamination tests (trace metals, organics), field work, dilution effects of
adding filtered water to an incubation, alternative methods (microbubbles)
c. Drawbacks: additional tests needed, possibility that method will require more
material/set-up in the future including MIMS samples for every batch/incubation

After the initial presentations/data of lab and field comparisons by workshop participants,
the group joined in discussions on the necessity of changing the method and how this
should be done at best. Everyone agreed that a future method should be standardized in
several ways: 1) inter-lab calibrations including: precision and accuracy of mass specs; this could be
possible by collecting many replicate samples in the field (or possibly different cultures)
and send the samples to the various labs offering mass spec analysis of the POC/PON
samples as generally used (GF/F filters with nominal pore size 0.7um and a range of
biomass necessary/maximum for the mass spec);
method should be
2) method should be practicable under various conditions and by ‘anyone’ in the field and
lab (field work planned for this, possibly at UH because of ship time and access to
facilities; time frame fall 2012?; also using field work to assess the biological variability
by eliminating differences in methods)
3) Experimental set-up: which bottles to use, how to incubate, how to filter (which filters,
vacuum or peristaltic), etc.
Once a new method has been established, the question remained whether historic data can
be recovered/salvaged and the workshop participants agreed that the following could be
pursued to address this question: 1) Attempt to place a limit on the underestimation, i.e. how big and how small could the
underestimation have been? This could be done by dissolution curves and modeling the
15N enrichment with different circumstance, i.e. bottle size, injection volume,
temperature, community composition, organics etc and comparing these to literature data.
The estimates of underestimation would be present a minimum range of underestimation
as the biological N2 fixation patterns are mostly unknown for studies (these may enhance
the modeled underestimations). Rachel Foster will talk to Scott Doney about the N2
fixation database that currently exists and what other data may be in there and/or what
other data may be needed.
2) This approach does not try to correct historic data, just trying to give an estimate on how
big the problem is with the historic data.
3) This question will also be addressed in an initial perspective paper to be submitted to
Frontiers in Aquatic Microbiology.
Timeline for future experiments/achievements:
08 Feb – 15 Feb 2012: set up Wiki/website (SOLAS?) - spreadsheet for reporting data
- online calculator for 15N enrichment
- spreadsheet for theoretical detection limit calculation
15 Feb – 01 Apr 2012: samples to MIMS labs - exetainer tests (MPI and UH)
- degassing tests: everyone

- microbubbles (Margie and Mark)
15 Feb – 15 Apr 2012: SCOR proposal (Julie, Lucas, Eric, Wiebke), perspective
manuscript (lead authors: Eric Achterberg, Julie LaRoche, Wiebke Mohr, Jon Zehr)
May – July 2012: field dilution tests (UH, Bar-Ilan U, IOW)
July 2012 – July 2013: (2) workshops (SCOR?), inter-calibration field campaign (UH?)
Until December 2013: Best practice guide / methods paper
2013 ASLO or 2014 Ocean Sciences: session at a conference

N2 fixation Conference minutes 6-8 February 2012
Helmholtz Centre for Ocean Research Kiel
Prepared by Rebecca Langlois 6 February 2012 Major concerns voiced by group to be addressed:
• Can data be recovered? <-- a list of factors needed for this
• Method improvements?
• Steps needed to be covered for a proper N2 fixation measurement
o MIMS
o Standards??
o N2 gas source?
• Make enrichments easier?
• How do water characteristics affect bubble dissolution/enriching water?
• Need to identify/list pros and cons of both methods
Afternoon large group discussion: 7 points touched on
1) List of factors needed for a good fixation measurement
a. Effect of dilution
b. Possible air contamination while adding enriched water
c. Getting a good enrichment measurements (i.e. MIMS, standards)
2) How to make enriched water?
a. Biology controls
b. Degassing (how to measure, how to control, how to test)
c. MIMS controls
d. Raising enrichment factor
e. Microbubbles??
f. Central lab making water or one protocol?
g. Storing issues
h. Introduction of nutrients/trace metals/contamination
i. Transportation issues?
j. Titration curve?
3) Other potential methods to explore
a. Microbubbles
b. Nanosims??
c. Stal method with filters???
d. Supersaturating water with 15N2?
4) Make list of unkowns and experiments to be done
a. Inter-calibration exercise/protocol (MIMS/Mass spec)
b. Compare errors of both methods
c. Compare filters/filtration pressure

5) Can error be made smaller in measurements?
6) What to do with the historical rates?
a. Need to get an idea of actual enrichment
b. Can an error bar be added to the measurements?
7) Do different 15N2 supplies matter?
7 February 2012 To Do List:
• Gaute/Sam:
o Write MIMS protocol (including standards)
o Storage procedures
o Keep temperatures stable
o Sam- enriched seawater experiment table
o Gaute- overpressure 15N2 vortex procedure
• Address how % enrichment changes with water type and community composition
Split into two groups discussing (1) making enriched water and (2) experiments/field work to thoroughly test the viability of the new method(s) Afternoon discussion: Implications on historical data set and why (needs to be explicitly addressed)
1) Tricho- floats, maybe less error, but other organisms dominant, then higher
2) Point out that time started and diazo. comp. is critical info before looking into
historical rates
3) Need to determine the magnitude of problem
4) Are the conclusions that have been drawn based on flawed method correct??
MIMS: equilibration curves needed to determine concentrations? 8 February 2012 Group goal: Best practice guide for N2 fixation in 2.5 years Sections needed:
• MIMS
• Mass spec
• Equilibrated water
Joint Experiments: Locations:
• Hawaii/CMORE/D.Karl- need to be this year, but schedule a bit tight
• Meteor (Oct)- schedule a bit tight
• Baltic- definite fixation (2013)
• Cape Verde- definite fixation, available 2012/2013

Funding possibilities • NSF
• SOLAS
• BMBF
• CMORE
Lab based experiment with Croco- everyone does the same? Field based: test incubators/trace metal contamination, etc 6 month priorities brainstorm:
1) Set up a wiki- add spreadsheet for calculations (SOLAS ?)
2) SCOR funding
3) Finalize enriched seawater protocol, reliability tests
4) Video journal of enriched seawater production
a. Everyone participates
b. Internal only
c. Eventually best method for public
5) Paper of implications and error- submitted to EOS, Frontiers
6) Table of N2 fixation incubation info
7) Error- bubble method is lower limit, need upper limit (Mark and Margie)
8) On-line calculator with the numbers you need to measure
9) Spreadsheet
10) Dilution calculation example
Deadlines/People/Tasks
1) SCOR proposal- Eric, Julie, Lucas 15 April
a. Product: Best Practice Guide to N2 Fixation Measurements
b. 10 people covered
c. Need to include ‘developing nations’ (i.e. non- EU, USA)
i. NZ
ii. Aus
iii. Japan
iv. South Africa
2) Enriched seawater tests/protocol- Zehr/MPI/UH/NIOS/Mahaffey-Rees
a. MIMS groups test exetainer (MPI/UH)
b. Degassed water test (nearly all groups)- report/register to/with MIMS labs
c. Microbubbles- Margie/Mark/Eric
d. Eventually collect samples for trace metal analysis
3) Paper- submit to Frontiers in Aq. Sci.- Perspectives
a. Curves
b. Comparisons done
c. Mark’s figures/table
d. Incubations info (supplemental) (Rachel)
e. Error range estimates

f. Error calculations (Margie/Mark)
g. Recommendations
h. Pros/Cons of each method
4) Field work-dilution experiment (UH-May, Eyel-May, Jenny-July)
5) Cruise Options- Wiki
6) All send Mark At% enrichment in PON/st. dev./nat. abundance


Monday 3/6/12 09:00: “Using the 15N2 tracer in N2 fixation studies” – Comparison of gaseous and aqueous in lab and field
1. Mohr: Lab data
- N2 fixation growth rate: doesn’t match microscopic growth rate (much lower) - Could be because equilibration didn’t happen
o Measured: incomplete and show equilibration in lab ▪ 15 N2 increases over time ▪ When bubble is immediately taken out, N2 fixation = 13% ▪ After 24 hours, N2 fixation = 80% ▪ To degass: vacuum, bubble goes into solution
o At sea: degassed seawater, at high amount of gas, “highly enriched” ▪ 15N2 steady over time
o Looking at N and C specific growth rates with both methods: C specific is the same w/ bub and enrich, N is much higher with enrich
o Higher amount of N2 and larger bottles takes longer to equilibrate (% of calculated is lower)
o Agitation increases % calc – could matter w/ diff sea conditions o She didn’t test effect of temp (cooling could increase equil) o Someone mentioned sonicating bath while degas? o Diff in species composition and diel cycles make it impossible to back-
calculate in mixed communities o Field method:
▪ Pump ▪ Filter ▪ Vacuum ▪ Bag – let bubble dissolve ▪ This is enriched water ▪ Used membrane – liqui-cel (?) ▪ Sam asked – did she measure how much degassed? No she didn’t.
Company says she should be around 96% degassing. Now that she has method, it works – ruler hitting bag.
▪ Another question: why does 80% look like an asymptote? Answer: a full equilibration will happen, but it will take 72-96 hours. 80% isn’t an asymptote but equilibration slows
2. Tobias Grobkopf: Comparison on 2 Atlantic Cruises
- Fall 2009 – variety of temps - 117 treatment bottles, 4.5L - Bub vs enriched: C fix: 1:1 line; N fix, they don’t always match
o Comm comp matters: ▪ Northern: dominated by Tricho bub and dissolved methods match ▪ Theory: in bubble is highest label. Bubble floats. Things that float
(tricho) will get higher than things that think (ex diatom) o To test theory: Nodularia spumigena
▪ Injected gas ▪ Filtered top 20% “floating” and bottom 80% “sinking”

▪ Used both bub and enriched methods ▪ Bubble (floating) was higher than bubble (non-floating) but not as
high as enriched treatments ▪ Q: did they filter top 20% and bottom 80% for enriched method?
o Questions: • Jon: was diel timing a confounding factor?
o Maybe. • Sam: precision dissolved vs adding a bubble?
o Similar precisions • Sam: effects of temp along transect?
o Temp could matter, there a temp gradient but also a sp comp gradient, it’s hard to tease them apart in field data
• Were bottles rolling around on ship? o No – not in tropics in incubator in middle of ship. But,
under rougher conditions, more equilibration could happen with bubble
• Enriched water must be made from same water as sample will be (same CTD bottle, same water, it only takes 1-200 mL per 4.5L bottle). This might not be the best way to do it at sea, it’s just the way they did it.
• Shooting for 2-4% atom percent enrichments. 1-2% can lead to large errors as you’re dividing by low number, error inflates. Margie shoots for ten to avoid this computational error. In field they’re adding as little as possible to reduce manipulation (balancing these – precision vs accuracy)
3. Helle Ploug (Dept systems ecology, Stockholm University): Combining
nanoSIMS and microsensor techniques for N2 and Cfixation studies: How do we improve N2 fixation measurements?
a. Cyanobacterial blooms in Baltic sea i. Microsensor: small tip, measures O2 and pH, gross and net
photosynthesis, dark resp, N2 fix, NH4, ii. NanoSIMS: can measure isotopic comp at cellular level. Who is doing
what and at what rates iii. Ammonium levels increase with shaking
1. Very high shear rates ▪ Uses sat water approach – measures O2 as tracer, knows that water
is degassed ▪ Used “calibration” with bub technique under constant light
- Questions
o Margie: ways to model/calibrate 2 methods (case-by-case)? ▪ Mohr: really static bubble? ▪ They do it for isotope solution methods all the time ▪ Jon – can we recover anything from the past? Are there
characteristics of the curve that we could use to recover decades of data?
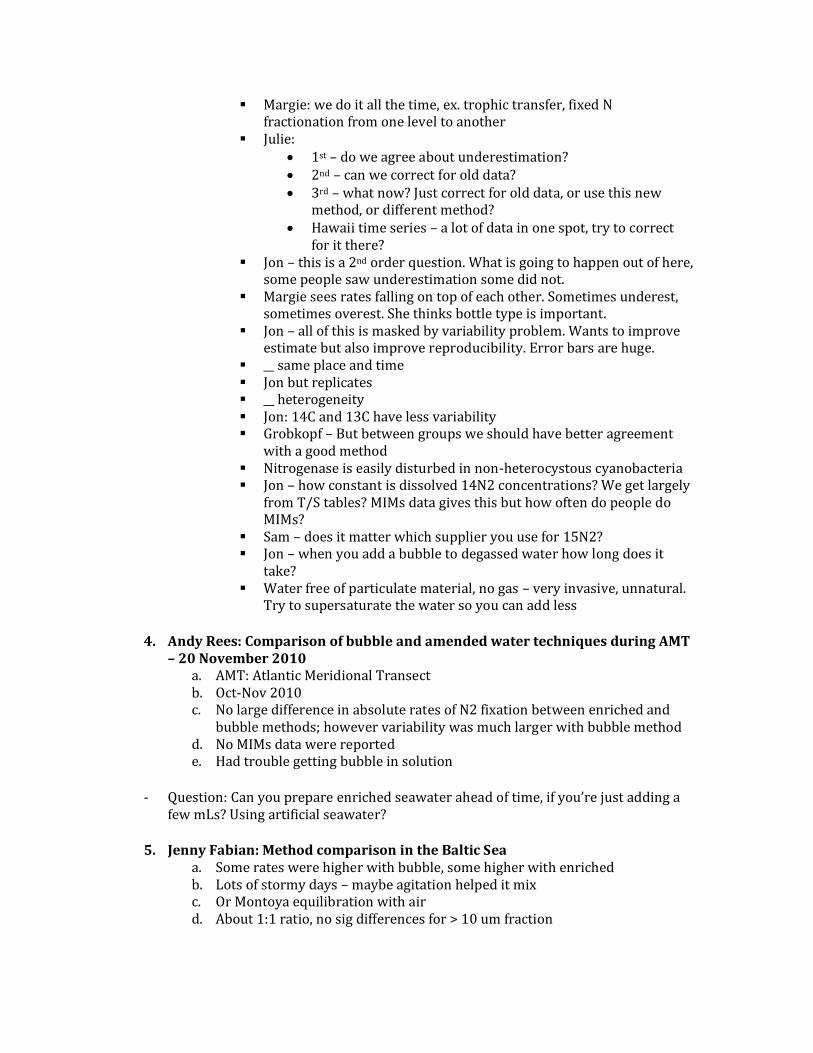
▪ Margie: we do it all the time, ex. trophic transfer, fixed N fractionation from one level to another
▪ Julie: • 1st – do we agree about underestimation? • 2nd – can we correct for old data? • 3rd – what now? Just correct for old data, or use this new
method, or different method? • Hawaii time series – a lot of data in one spot, try to correct
for it there? ▪ Jon – this is a 2nd order question. What is going to happen out of here,
some people saw underestimation some did not. ▪ Margie sees rates falling on top of each other. Sometimes underest,
sometimes overest. She thinks bottle type is important. ▪ Jon – all of this is masked by variability problem. Wants to improve
estimate but also improve reproducibility. Error bars are huge. ▪ __ same place and time ▪ Jon but replicates ▪ __ heterogeneity ▪ Jon: 14C and 13C have less variability ▪ Grobkopf – But between groups we should have better agreement
with a good method ▪ Nitrogenase is easily disturbed in non-heterocystous cyanobacteria ▪ Jon – how constant is dissolved 14N2 concentrations? We get largely
from T/S tables? MIMs data gives this but how often do people do MIMs?
▪ Sam – does it matter which supplier you use for 15N2? ▪ Jon – when you add a bubble to degassed water how long does it
take? ▪ Water free of particulate material, no gas – very invasive, unnatural.
Try to supersaturate the water so you can add less
4. Andy Rees: Comparison of bubble and amended water techniques during AMT – 20 November 2010
a. AMT: Atlantic Meridional Transect b. Oct-Nov 2010 c. No large difference in absolute rates of N2 fixation between enriched and
bubble methods; however variability was much larger with bubble method d. No MIMs data were reported e. Had trouble getting bubble in solution
- Question: Can you prepare enriched seawater ahead of time, if you’re just adding a few mLs? Using artificial seawater?
5. Jenny Fabian: Method comparison in the Baltic Sea
a. Some rates were higher with bubble, some higher with enriched b. Lots of stormy days – maybe agitation helped it mix c. Or Montoya equilibration with air d. About 1:1 ratio, no sig differences for > 10 um fraction

e. Lower rates for bub method for < 10 um fraction (but error rates were really high, so no sig differences)
f. Saw no effect of time in day started
QUESTIONS 1. Fractionation was after experiment, so a large amount of the ammonium released
could be re-taken up by picocyanobacteria 2. How does salinity affect the dissolution? 3. Jon: large error bars 4. Saturation curve: It really doesn’t look like the bubble method will get to 100%
a. Has anyone done full 96 hours to see if they will get to full dissolution? 6. How much is the biological variability, cell to cell the source of heterogeneity? 7. Should we be using a single-cell technique instead of bulk? 8. Across just one colony, huge variability. 9. Jon – If we can’t figure out how to scale this up, who cares? We’re screwed. 10. Maybe we should be doing nanoSIMs measurements in addition to these bulk
measurements 11. In Tricho, across a colongy only 40% of cells will be active for N2 fixation, but 100%
of cells will be active for C fixation 12. If you look at nanosims, how can you figure out exactly what isotopic composition
an individual cell experiences 13. Daniella – has anyone done an experiment with diatoms with one just sitting there
and one on rotary for 24 hours, to test if sinking is really causing species comp effect?
a. No one has done this 6. Sam and Daniella: Methodological details and comparison of N2 fixation measurements
- Measuring N2 fixation using 15N2 tracer addition - 0.2 um filter surface seawater, purge with helium, vacuum, and heat and stir, move
to bag (2 sampling ports) in ice water bath, overflow into serum bottles - Finds higher rates with dissolved than bubble, but there is sometimes high
variability, also large difference between deckboard incubations or in situ array w/ dissolved method. Large temp fluctuations in deckboard incubation, suggested using HOBO logger
- Jon: Deckboard incubators – not well controlled, everyone does it differently. Can we figure out how to do better experiments?
- AR: Why not add acetylene in dissolved form? o HgO -> UV detector – measure rate of ethylene production in oligogrophic
seawater without concentrating biomass o Important to have seawater controls. To, Tf for blanks. Tf ethylene in blanks
at end are higher
- QUESTIONS o Does acetylene readily dissolve? o Needed headspace to water ratio of 2 to have acetylene saturated, 10% of
headspace is acetylene

o Acetylene: to get complete saturation you have to add a lot, change the gas concentration completely
o Does enriched seawater method introduce contaminents, trace metals? Can we use a control like Sam did with degassed but not 15N enriched water?
Next, there was a “general discussion” (I should have taken notes). People said their concerns. 7. Lucas Stal: Acetylene Reduction Techniques AR = measure of nitrogenase activity 15N = amount of N that is fixed AND assimilated They measure 2 different things With fixation of N2, you have the production of hydrogen. This doesn’t happen w/ ARA Online, near real time measurement system; Lawer Photoacoustics (LPA). He puts biomass on a filter, in a little chamber, with gas running on top and medium underneath filter You have to add a lot of acetylene to saturate; saturation also varies by light Nitrogenase – activity higher in the dark, less O2 Conversion factor
- based on hydrogen. By theory, should be: o 1) 1:4: because N2 + 8H -> 2NH3 + H2 o 2) 1:3: because a hydrogen produced can come back to the L side of the
equation - hydrogen only happens when N is saturating nitrogenase - Uses system to look at nitrogenase activity with light curve
8. Eyal Rahav: Comparison of methods in the Mediterranean Sea After lunch: group discussion
1) EXPERIMENTAL a. Collecting water samples
i. CTD rosettes ii. Pumps
b. Bottle size c. Bottle type d. Shaking e. 15N2 injection volume f. Replicate measurements: from same Niskin bottle? Or is it ok to use different
Niskin? 2) ANALYTICAL 3) CALCULATIONS

Lucas Stal: After we all come to a consensus on a new method, we go out and test it, make a bunch of measurements, compare it to the old method, then make calibrations What set of experiments need to be done that validate that adding the enriched water could be a standard method?
- dilution - standard method: take a MIMS measurement for the To enriched? - Way to further enriched water? - Filter method
Come up with list of things we have to test
- within a year: try to have a standard method
Tomorrow – we need to sit and decide 5 labs try enriched water methods Are there certain systems where this will be more problematic than others? Dilution problem.
- You’d have to test for nutrients and metals
Is natural water better? Low nutrient low metal water? Sargasso sea water? We need error bars on how big systematic difference in this can be How to minimize addition volume?
- Supersaturate: degas, add high pressure - If you had a good way of storing it and knew that your supersaturated vial was
stable - But can you take MIMS sample of this? - Sam’s additions are 1% volume: volume - Reproducibility? - Simplest common denominator: distilled water at 4 degrees. People could add salt
after if they wanted Tuesday 9 AM: Gaute Lavik: Mass Spectrometry for N2 Fixation How to Measure? Isotope ratio mass spec (IRMS)
- measures changes in natural abundance isotopes - high sensitivity and very accurate measurements of low amounts of label - disadvantage: only measures relative abundances - Quadropole MS
QUESTIONS

- Sam: Don’t you need a 15N2 standard if you’re measuring 15N2? o No. You use Argon. (?)
- How to store? o Exetainers: Can store for a couple of months. If you store a sample too long
(longer than a couple months) you start getting a significant exchange with the atmosphere. Store at room temperature. Be careful that the temperature doesn’t change, this would enhance the gas exchange. Kill w/ HgCl2 (may not be necessary with N2). Can detect the differences of a few nanomoles per liter.
- It’s not impossible to do with a normal mass spec. If you’re going to do that (normal GC) store w/ He headspace.
- Recommendation for transportation? - NEED TO WRITE 1 PAGE PROTOCOL - Julie showed table of people’s 15N2 field data from literature – will send table to
everyone o Jon – can we add to table the start time of 15N2 incubations, ex dawn or
dusk? - List of what the key potential problems are of (both) or at least enriched water
method? - List that we made yesterday. Priorities? What needs to be done right away, what
needs to be done just at some point, how long will it take to do these experiments? - Life goes on – we need a way that everyone can make enriched seawater if they
want. - Transportation – try shipping enriched seawater somewhere, ship it back - Again – whether we should make some standard enriched seawater ahead of time,
or make it on site o Gaute thinks it’s a bad idea to store it a long time; something will grow o Maybe the method we set up should have the option of preparing it ahead of
time, OR fresh on site o Making it at sea could add contaminants o Time also is an important issue o Teflon coated butyl rubber stopper? o At sea or ahead of time – case by case. Don’t try it the first time at sea! o We want to make this doable for those outide of the N2 fixation elite o Gaute says you can make easy accurate enriched water by putting water in
an exitainer, add half a mL 15N2 as a headspace, add extra as an overpressure, vortex. Mohr said she added overpressure in her studies and shook (rotary shaker) for an hour and still only got to 80% saturation
o As soon as you degas something, if you let it stand there you change your background.
o You shouldn’t necessarily need a MIMS to do this. Need an easy method that gives reproducible results
o Adding 1 mL N2 gas to 10 mL NON-degassed seawater gives 88.8% saturation without headspace removed
o Vortex for a couple of minutes o In oligotrophic waters, we use 4.5L bottle. You’d need a lot of enriched
water. o Maybe if you have elongated tube (this is ideal for mixing) you could use a
larger volume. 10mL is too small for most people

o Push in gas from the bottom, then gas won’t escape out the hole because gas will go to top hole is at bottom
o Sam says it would be good to have a half page cheat sheet for things like this o This may not work for all, large volumes will not be economical o Higher enrichment is desirable o Vol to vol, Sam adds 50 mL to 4.35L bottle <2% enrichment o What % enrichment is enough?
▪ 4% = 40 mL per L 200 mL per 4.5L bottle. Contaminent levels as well
▪ Something we need to include in document: what is the sensitivity? ▪ Margie says, some people can’t go below 2% ▪ Gaute says, in Oligotrphic waters, you should need much less
labeling degree than in eutrophic waters. Go towards 10% in coastal waters, towards 2-3% in Oligotrophic waters
▪ Q: does it matter how many diazotrophs there are or total biomass? • Gaute says total because you combust all. You measure the
difference between 28 and 29 • Jon says at some point, rate matters too
▪ Q: Are we abandoning the old ruler beating bag enriched water method? If we’re going to sea next week, can you use bubble method and take out MIMS sample?
• How much water do you need for MIMS? 6 mL • It matters who is fixing, their diel cycle; this makes it hard to
correct for how saturate the water was • Sam: we’re not planning on dropping any degassed method.
This meeting should inform anyone wanting 15N method. This is our recommendation for preparing it ahead of time, or on the ship, this is an easier way without degassing. If you ARE doing bubble, these are some consideration
• Daniella has been doing this every month in addition to all the core measurements in the time series measurement. Every month they had to decide what to do. She has to do separate CTD cast every time. Different community every time makes it hard to correct.
• Mohr – if she were to use bubble method, would add bubble, invert 200 times, open take MIMS sample, take out bubble, now you know your initial enrichment and it can’t change more because bubble is gone. It won’t be 100% but you will know it. Maybe you should also inject more.
▪ Sam is worried because we need protocol recommendations, and
future experiments. Need plan. - Next step: 2 big groups. 1 will discuss enriched water method. One will discuss How
to correct, experiments o 1 group: “Protocol group”: what is the protocol for enriched watered water,
MIMS protocol o 1 group: “Experiment group”: design experiments over next 6 months o Discuss.

End-Product from “Protocol Group” *Note: this was revised product from 2/8/12. Sam was still going to further revise this document. General Considerations for making enriched seawater
- Need to know Temp, Salinity to estimate %N2 (provide table) - Note: when working with cold temperature water, the enriched seawater should
also be prepared in a cold room Exetainer/vortexing method for making enriched seawater This method is intended to be an easy method for preparing enriched water at sea
1. Prepare FSW: Use vacuum filtration through 0.2 um polycarbonate (type/brand?), pre-HCl-rinsed filter into sterile, HCl-cleaned, trace-metal free Erlenmeyer flask.
2. Aerate the flask by swirling. You can measure oxygen with a microsensor to test your aeration. Note: don’t use stir bar.
3. Pour water into exetainer (make/model/size?), fill to brim, ensure that there are no bubbles.
4. Add 15N2, trying to minimize the time it takes to do this process. Do this at room temperature. Needle size = 0.4 mm gauge, use one without the shut-off valves (they would introduce dead volume) (make/model?) Equilibrate your needle with the atmosphere using a beaker of seawater. To add the N2, turn upside down, apply an outsource needle (the size of the syringe should be the volume of the gas you are injecting). Add half your volume, remove the exhaust needle, then add the other half of your volume. This creates the over-pressure. Always store your bottle upside down, at room temperature. Maximum storage time = several hours to weeks.
5. Vortex. Vortex 5X, 10 seconds each. Ensure that each time you vortex, you get a cylinder going all the way down your exetainer.
6. Add enriched water to sample. First add some of your sample, then add your enriched water only up to neck of the bottle, then fill bottle to the top without overfilling. Ensure that there is zero headspace and no spilling cap, invert 20X
Considerations/Tests
• Test step (2): measure oxygen to ensure that swirling is a sufficient method for aeration.
• Test step (5): is vortexing 5 times for 10 seconds sufficient to dissolve bubble for 38 mL exetainer?
• Test percent enrichment and reproducibility of this enrichment • Test maximum storage length: how long can exetainers sit before equilibration with
the atmosphere? Advantages to this method
• Relatively simple • You can use the water from the station that you’re sampling at sea • Low risk of contamination • This method is possible without a MIMS (though a MIMS sample is still preferable)
Disadvantages to this method • Variability in enrichment (at least until tests are done)

• Time required for making large quantities of water (limited volume of exetainer: largest exetainer = 38 mL)
• Wasteful: you only use 20% of the label that you’re adding (since you’re not degassing)
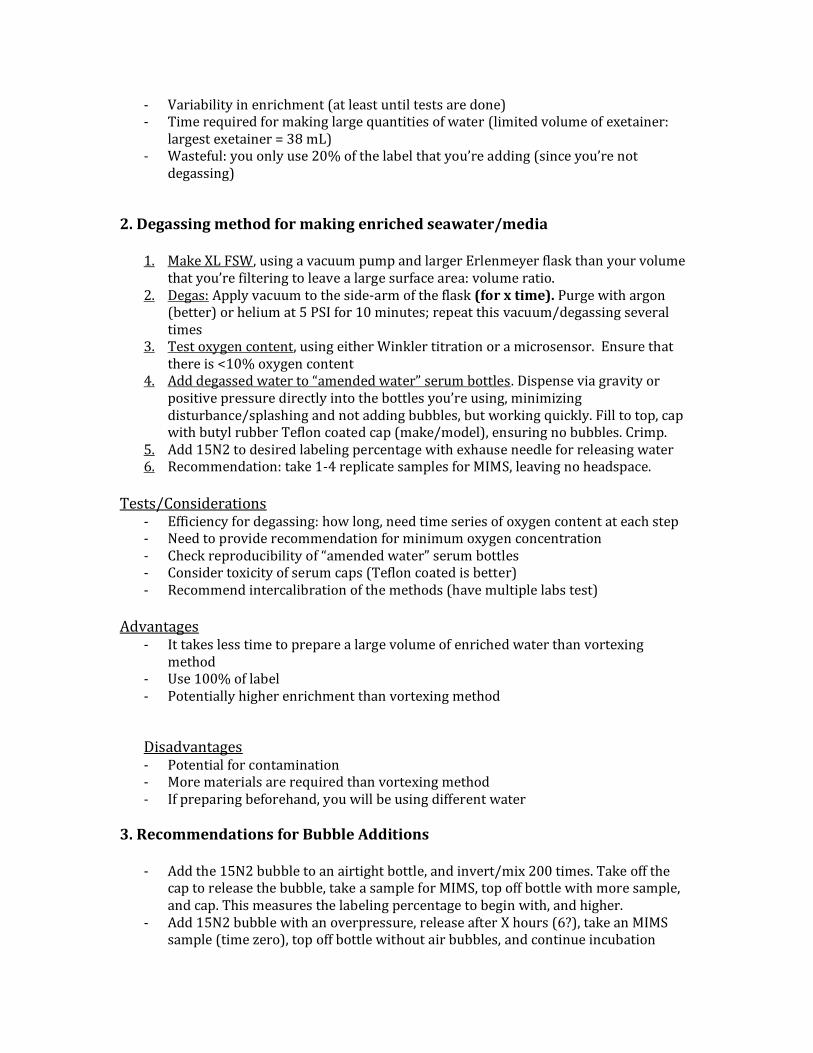
Degassing method for making enriched seawater/media
1. Prepare FSW: Use vacuum filtration through 0.2 um polycarbonate (type/brand?), pre-HCl-rinsed filter into sterile, HCl-cleaned, trace-metal free Erlenmeyer flask. The size of the flask should be considerably larger than the volume you’re filtering to leave a large surface area: volume ratio for the degassing.
2. Degas: Apply vacuum to the side-arm of the flask. One way to quicken degassing is to purge with helium for ten minutes, then repeat the vacuum/purging several times. There is also an option of using a cardridge filter attached between the vacuum and the flask.
3. Test oxygen content, using either microsensor or Winkler titration. Ensure that there is <10% oxygen content
4. Add degassed water to “amended water” serum bottles. Dispense via gravity or positive pressure directly into the bottles you’re using, minimizing disturbance/splashing and not adding bubbles, but working quickly. Fill to top, cap with butyl rubber Teflon coated cap (make/model), ensuring no bubbles. Crimp.
5. Add 15N2 gas with exhaust needle for releasing water 6. Recommendation: take 1-4 replicate samples for MIMS, leaving no headspace.
Tests/Considerations
• Efficiency for degassing: how long, need time series of oxygen content at each step • Need to provide recommendation for minimum oxygen concentration • Check reproducibility of “amended water” serum bottles • Consider toxicity of serum caps (Teflon coated is better) • Recommend intercalibration of the methods (have multiple labs test)
Advantages
• It takes less time to prepare a large volume of enriched water than vortexing method
• Use 100% of label • Potentially higher enrichment than vortexing method
Disadvantages
• Potential for contamination • More materials are required than vortexing method • If preparing beforehand, you will be using different water
Recommendations for Bubble Additions
• Add the 15N2 bubble to an airtight bottle, and invert/mix 50 times. Take off the cap to release the bubble, take a sample for MIMS, top off bottle with more sample, and cap. This measures the labeling percentage to begin with, and higher (It is possible

to do this step by adding 15N2 bubble with an overpressure as this will increase the quantity of 15N2 in the seawater sample.)
• Use more label (use a higher ratio of volume 15N2 : volume incubation) • Concern: Taking a time zero MIMS sample is vitally important with this method.
Experiments/Considerations
• Test the reproducibility of the overpressure Advantages
• NO contamination (except needle) Disadvantages
• Vital to have MIMS measurements for every bottle • You will waste 15N2 gas • Reproducibility of enrichment
MIMS Protocol and Sample Recommendations
• Calibrate MIMS using milli-Q water which is bubbled with air at a controlled temperature (ex room temperature) and also with pump off. This makes up your 2 point calibration.
• Samples should be at same temperature as calibration • Long term storage of samples can lead to equilibration and long-term loss • Masses to be measured: 28, 29, 30, 32, 40. Oxygen is important because you can
quantify the amount of oxygen contamination and determine the change in labeling percentage.
• Note that 0.5% of N2 mass is 29 because of the purity of the gas, therefore you will detect mass 29
• Sample into the MIMS – each bottle is sacrificed, bottle is opened, and tube is added to the bottom of the liquid, pump is turned on. Each sample has about 100 cycles.
• Be aware of the time taken to equilibrate the MIMS with a high 15N2 signal. This isn’t an issue for some MIMS (e.g. Gaute at MPI) but is for others (e.g. Sam at UH). You may need to use 1-2 samples of 15N2 enriched seawater as ‘sacrificial’ samples in addition to your replicates for this.
• Recommend 4-5 replicates. • Accuracy should be <2%
End Product from “Experiment Group” Experiments to be done:
1. Inter-calibration exercise MIMS:
a. Bremen, Hawaii, NIOS, NIWA
2. Testing equilibration on different types of water masses (temp, sal, DOC): 6 months
a. Does the bubble go into solution the same?
b. How does this affect the enrichment of the water?
c. How long does it take to do this?
d. Test in lab

e. Labs test in home waters and report centrally or ship to one institute to
measure
3. Determining contaminations issues (nutrients, TM, etc)
a. Make seawater and send to TM lab
b. Oxygen
c. DOC from filtration
d. Chemicals release from platics/membranes
e. Bacteria from storage
4. Determining detection limits and what they mean
a. Biomass
b. Make a table of theoretical limits of the mass spec (PN, active diazos, etc): 4
(3 month goal- Mark)
i. Collect precision of mass spec standards
5. Standardize/test the storage/shipping of samples for MIMS
a. Bottle material
b. Seals
6. Optimize the enrichment of 15N in stock seawater
7. Intercomparisons:
a. Enrichment dilutions (<1%-?)
8. Test the effect of dilution on biota
a. Look at 13C rates, using dilution in method
i. PP
ii. BP
iii. AFC
b. Releasing bubble and using that water
Important points we need to do: • Show that the water is enriched:
o 1 and 2 (6 Months)
• Show that it doesn’t introduce artifacts
o 3
o 5
o 8
• Show that it is reproducible
o Analytical detection (table, 4)- 3 months
o Reproducibility of enriched water (experiments)
Continued Discussion
- Methods video online journal? - Want error estimates for all the different methods we’ve proposed. - Rachael voiced concern about the costs involved in wasting so much 15N2

Wednesday Feb 8 9 AM Discussion
- Jon asked: Can we recover some of the old data? o Do we need to do more comparative experiments to get a bigger study? o Is it worth doing more comparison studies? o Rachael: here’s a huge database by Doney’s postdoc, we should add more
info to it like labeling % - Sam: It’s important to capture what’s been discussed here, share. We have
POTENTIAL improvement, POTENTIAL underestimation. No consensus method - There’s a difference between correcting data and understanding the magnitude of
the problem. More important than saving numbers: can we save the science? Are some of our conclusions we’ve drawn flawed because of the method we’ve used?
- Factor of??? Different factor for diff sp? - Modeling solution to the problem? Chemistry of dissolution of bubble? - Rachael: Everyone should add methodological info for their own experiments to the
existing database - Gaute: Temp, salinity, way you shake is what should matter: everyone could make
their own theoretical saturation curves - Best practices to N fixation, similar to best practices of OA? -
Mark Presentation - He made graphs and tables on what difference you could get at a certain PON,
certain N fix rate, and certain enrichment (purpose is to decide what % enrichment you need to get significant difference based on what you need for analytical difference; need to add part that shows what you need to get statistical significance when including biological variability)
*Don’t use argon for flushing! It will get N2 out but not let N2 back in.
- Time/place for a joint cruise? o Sam: Could collect seawater from station ALOHA, bring it back, conduct
shore-based experiments (then don’t need ship time) o Jon: C-MORE: Ship time for research cruises. Batch number of days per year.
There is maybe a possibility for this calendar year. If so, it would be before September
o Gaute: German government; Meteor 40 days crossing Atlantic. October (too long).
▪ Sam, Jon think Hawaii would be better. Shorter better. ▪ Cape Verdi? ▪ Baltic: Definitely time in 2013
o Sam: Which are the geographic areas we want to visit? Coastal, eutrophic, oligotrophic?
o Julie: Baltic simple o Jon: Objective? Multiple groups, same experiment? Preferable place with
diverse N fixers? ▪ Cape Verdi: Tricho, group A, in slightly diff spots

o Sam has the space, facilities for anyone who wants to come do work in Hawaii
o 1 week o Need funding for travel, samples, etc.
▪ NSF? ▪ European sources?
o Who actually wants to go? o What would we actually be doing on the cruise?
▪ If the aim is really to just validate that diff groups get the same results? If so, could we just do lab experiments?
• Can different groups make enriched seawater with the same atom %
▪ End product: how to carry out these experiments? How important is trace metal stuff? Bottle type? Etc. Could have some groups doing trace metal free, some groups not trace metal free. Best practices – if you use these guides you’ll get this, if not you’ll get this.
▪ Urgent: are we confident in our new N fix numbers and can we all do it
o Gaute – what about mesocosms on Cape Verdi?
- Margaret: In the meantime: for people running experiments without a MIMS? o First order question: are we enriching seawater? Need MIMS data quickly
- Goals: What will we accomplish in 6th months
o Reliably, reproducibly able to make enriched seawater at sea and in the lab o Put some structures on how this is going to work. Ex., someone will vortex
15N o Blog o Test: 1st making enriched seawater, send to other labs, have each lab test
MIMS ▪ Also test once it’s mixed with sample so you know none had been
lost to atmosphere ▪ Both comparison of how you did on making it and how you did on
measuring it o Video on video-based journal o Database – could be proof to the larger community that there is a problem o How to calculate uncertainty?
▪ N2 fixation rate we measured is the lower bound ▪ Upper number: probability on how big it might be. Ex. there is a 50%
chance it was bigger than this, there is a 20% chance it is bigger than this, etc.
▪ Are the big conclusions we’ve made valid or not? ▪ Maybe we should all go away and try to put a range on it, then
compare on wiki site? ▪ Guidelines for the modeler ▪ Who all has dissolution curves? Can we combine them? ▪ There are certain constants/statistical certainties about dissolution ▪ If you know you’re looking at N2 fixers, know dissolution curve, you
have a way to do an estimate (you would have to put uncertainty bounds on this)
• Once you have your estimates, you could do your compared comparisons with two methods and see if you find what you find
• It may be worth it to do more dissolution experiments under various conditions for the purpose of back-calculating
GOALS (Sam is writing on whiteboard):
1. Communication: Wiki set up by Solas a. Put the initial protocols from this workshop on it
2. Funding: SCOR - 3 years to make end product of Best Practices N fix guide. Would give about 50,000 Euros (Eric will find out deadline. Need involvement from “economies in transition”) This is trying to fund a series of workshops and an end product. Eric, Lucas, Julie.
3. Video: at least 4-5 videos will go up. After we have the MIMS results, will put out best breactices video
4. Manuscript saying what we discussed here a. Workshop output b. Implications c. NOT methods d. Target journal e. Historical datasets
5. Priority: Enriching seawater (6 months) – amount of underestimation 6. Fieldwork – focus on biological variability? 7. Best practice guide 8. Example calc for estimating previous underestimation 9. Online calculator for determining N2 fixation rates, maybe for also calculating your
detection limit based on PON, Enrichment %, etc 10. Timeframe for MIMS analysis
After lunch, continuing discussion
- The ability to measure a low rate goes up but your detection limit goes down as your PON goes down
- Detection limit is much smaller
- Come up with at date when enriched seawater will be analyzed by MIMS?
- April 15th: Book a few days when you’ll run these new samples from the other labs.
So, after Easter, your samples should be at the other lab
- If you get the bubble into solution, it could still be contaminated – eventually down the road send samples to trace metal chemists
o Should we
1. Exetainer Method: Gaute/Sam 2. Degassed Method: Anyone who can should test this. Maybe only some groups should
send. NEED SAMPLES TO RACHAEL APRIL 1ST 3. Microbubbles

Priority #1 = Enriching seawater: trying different techniques, validating that different labs are able to get the same results as measured by different MIMS Manuscript: Thought paper/perspective. Would not work for L&O methods.
- Frontiers in Microbiology? Perspective? - Tables of incubation conditions? - Tables from Mark? - Who wants to be lead author???
Aim of experiments - Check effect of dilution on various communities. Look at different kinds of waters
(not just Hawaii) o Will be tested first on HOT cruise (Daniella) – May o Baltic Sea (Jenny) - July o Mediterranean (Eyal) – May
Cruise: explore options and put them on Wiki SCOR working group. 10+ people. Head a session next year? Go back through dataset and add start of incubation, diazotroph community, etc: Rachael Timeline 08 Feb – 15 Feb 2012: set up Wiki/website
- Spreadsheet for reporting data - Online calculator or at least a spreadsheet for calculations - Spreadsheet for theoretical detection limits -
15 Feb – 15 April: SCOR Proposal (Julie, Lucas, Eric) May – July 2012: Field dilution tests (UH, Har-Ilan, U, IOW July 2012 – July 2013: 2 workshops (SCOR?), inter-calibration field campaign (biological variability?) Till December 2013: Best practice guide/methods paper Short-term perspective in Frontiers in Aquatic Microbiology (June/July 2012?)
- Dissolution curves (IOW, NIWA, PLoSOne) - Comparisons? - Tables/plots, theoretical detection limits with different enrichments and PON load
(Mark), i.e. final atom % in PON and corresponding natural abundance values, including formaulas for calculation
o Wants data on dissolution curves, and data on signal : biological noise - Error range estimates for historical data (Margie, Mark)

- Table information on incubation (Scott Doney, Rachel) - Implications (with description why bubble doesn’t work and changes with
environment and community composition), recommendations, consensus on the problem
- Pros and cons of methods - Status of the problem and what is needed to work on it, future aspects, constraining
factors on methods, what needs testing (e.g. dilution) - Requirements for a 15N2 tracer method to measure N2 fixation
o Constant enrichment o Known enrichment o Applicable to various environments and circumstances
- Assumptions of tracer methods o Only a trace amount added
- Factors that might affect dissolution of a bubble (T, S, organics) 1st draft March 30th
- Send mark representative data of rate measurements (detection over biological/analytical noise) with some replicability. Atom % and PON measurements. Also send data of which mass spec was used
- Conference/meeting session:
- 2014 Ocean Sciences Meeting - 2013 ASLO meeting

Nitrogen Fixation Workshop, Kiel, Germany, February 6-8 2012.
Notes from Rosie Gradoville
Summary of Discussions Multiple groups presented results comparing bubble and enriched water methods.
o Some studies clearly showed a difference (ex. Mohr, Wilson); some did not (ex. Rees, White, Fabian). For those that did not show a difference, it is possible that this is due to missing MIMS measurements and/or masking by replicate variability
o For field data, some showed a difference with some stations but not with others (could be community composition differences, but there are other factors, like temperature, that also could have mattered)
Can we recover any data from the past?
o We got a little caught up on this in the beginning of the meeting. For some participants it seems very important that we are able to make some kind of correcting factor to recover 15 years of data.
o We made it a priority is putting bounds of error on old measurements o Julie compiled a table of field 15N2 incubation conditions of previous studies and
sent it to all workshop participants o There is another table being compiled by Scott Doney’s post-doc, it might help to
add labeling % and time started (dawn/dusk) to this table o It is possible that individuals could make case-by-case corrections for their own
experiments using their records of T, S, shaking method, experiment start time, community composition, etc. They could create their own theoretical bubble saturation curves and back-calculate for integrated rate. They could test the accuracy of their estimations by running parallel bubble and enriched water experiments and compare enriched water measurements to theoretical “true” estimates based on paired bubble experiments.
Multiple 15N2 methods (both bubble additions and enriched water additions) were proposed, discussed, and critiqued. Detailed protocols were written for each new method.
o Traditional bubble method: Add 15N2 bubble, leave it there ▪ Advantages: easy, quick to set up, no new equipment or methods needed, no
dilution effects of enriched water ▪ Disadvantages: Large uncertainty of initial % enrichment; % enrichment is
changing over time of incubation; this will have different effects based on community structure; difficult to tell integrated % enrichment even with initial MIMS measurement
o New bubble method: Add 15N2 bubble, shake, remove bubble, measure MIMS ▪ Advantages: relatively easy, % enrichment doesn’t change over time, no
dilution effects of enriched water ▪ Disadvantages: Variable initial % enrichment; time needed for shaking, need
access to a MIMS, increased cost for 15N2 gas (much gas is wasted)

o Enriched seawater method: Degas water then dissolve 15N2 bubble ▪ Advantages: Easiest way to make large quantities of enriched seawater;
doesn’t waste any 15N2 gas ▪ Disadvantages: Time consuming; requires extra equipment; may have
dilution effects; some labs have had trouble getting bubble to dissolve; if bubble isn’t dissolved there is uncertainty in enrichment
o Enriched seawater method: don’t degas, just vortex to dissolve 15N2 bubble ▪ Advantages: Easiest way to make small quantities of enriched seawater
(especially at sea) ▪ Disadvantages: Possible variability of enrichment, need MIMS for confidence
in initial % enrichment, time consuming to make large quantities (largest exetainer = 38 mL); wastes 15N2 gas
What percent enrichment of 15N2 is enough? o Usually shoot for 2-4% enrichment. 1-2% leads to large errors as you’re dividing by
a low number; error inflates. But for enriched water technique we want to use small additions to minimize possible dilution effects. Percent you need varies by region; you need higher percents in areas with more total PON.
o Mark made graphs showing the relationships between PON, N2 fixation rate, and percent enrichment. This showed what percent enrichment you would need for analytical detection under different % enrichments; however, he needs data on biological variability to show what % enrichment you would need to show statistical significance. Eventually, we want an easy spreadsheet to calculate what % enrichment you’ll need based on your N2 fixation rate, DON level, etc.
Do enrichments need to be done at sea? o When using enriched method in the field, is it necessary to make enriched water
from the same station that the sample water will come from? Same depth? Same CTD cast? Concerns about making enriched water at sea:
▪ Time to prepare, especially for large volumes and many stations ▪ Harder to keep everything sterile and trace metal clean ▪ Don’t try making enriched water for the first time at sea
o It would be helpful to be able to make the enriched water ahead of time. Could you use artificial seawater? Or just enrich distilled water, then add salt to desired salinity? Concerns with making enriched water ahead of time:
▪ Dilution effects: the water will not be the same as at your station ▪ Transportation. Will percent enrichment stay the same after travel? ▪ Time: the longer enriched water sits, the higher likelihood it will not stay
sterile. o This will probably be decided on a case-by-case basis. In some cases it might be
better to make enriched water at sea but this might not always be practical and in some cases (e.g. Sam and Daniella) it might be fine to make it ahead of time. We’d like to make recommendations for best methods, at sea or on land.
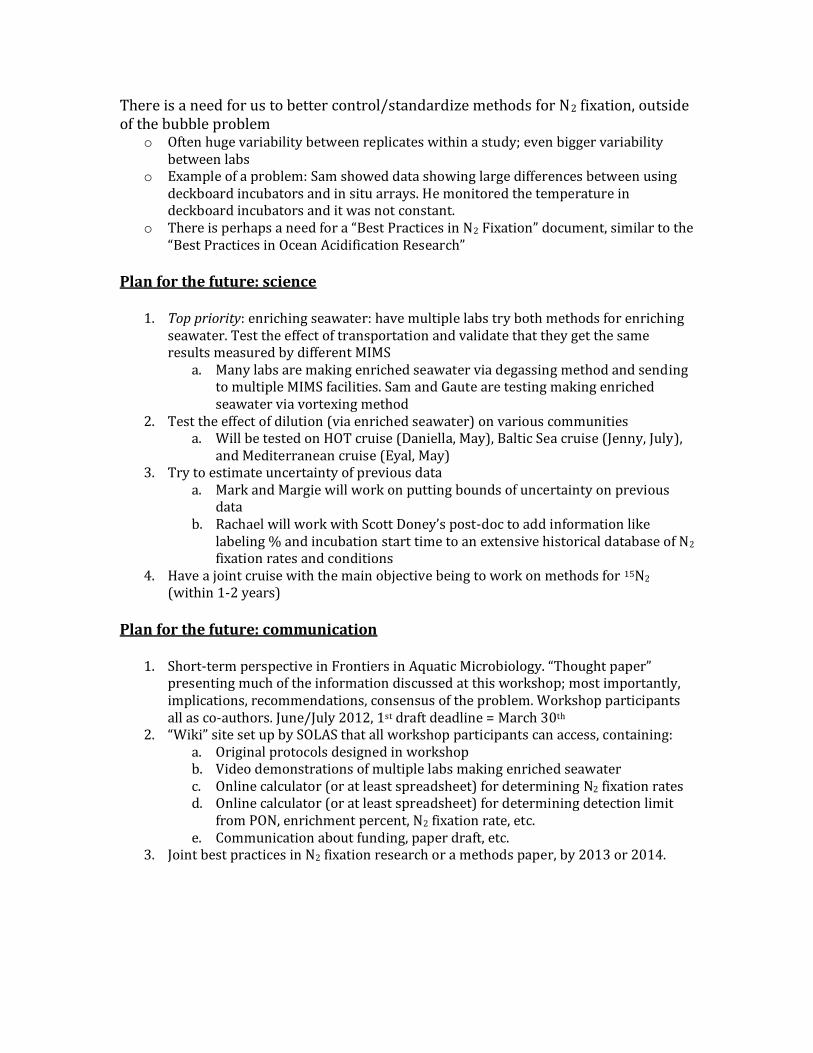
There is a need for us to better control/standardize methods for N2 fixation, outside of the bubble problem
o Often huge variability between replicates within a study; even bigger variability between labs
o Example of a problem: Sam showed data showing large differences between using deckboard incubators and in situ arrays. He monitored the temperature in deckboard incubators and it was not constant.
o There is perhaps a need for a “Best Practices in N2 Fixation” document, similar to the “Best Practices in Ocean Acidification Research”
Plan for the future: science
1. Top priority: enriching seawater: have multiple labs try both methods for enriching seawater. Test the effect of transportation and validate that they get the same results measured by different MIMS
a. Many labs are making enriched seawater via degassing method and sending to multiple MIMS facilities. Sam and Gaute are testing making enriched seawater via vortexing method
2. Test the effect of dilution (via enriched seawater) on various communities a. Will be tested on HOT cruise (Daniella, May), Baltic Sea cruise (Jenny, July),
and Mediterranean cruise (Eyal, May) 3. Try to estimate uncertainty of previous data
a. Mark and Margie will work on putting bounds of uncertainty on previous data
b. Rachael will work with Scott Doney’s post-doc to add information like labeling % and incubation start time to an extensive historical database of N2 fixation rates and conditions
4. Have a joint cruise with the main objective being to work on methods for 15N2 (within 1-2 years)
Plan for the future: communication
1. Short-term perspective in Frontiers in Aquatic Microbiology. “Thought paper” presenting much of the information discussed at this workshop; most importantly, implications, recommendations, consensus of the problem. Workshop participants all as co-authors. June/July 2012, 1st draft deadline = March 30th
2. “Wiki” site set up by SOLAS that all workshop participants can access, containing: a. Original protocols designed in workshop b. Video demonstrations of multiple labs making enriched seawater c. Online calculator (or at least spreadsheet) for determining N2 fixation rates d. Online calculator (or at least spreadsheet) for determining detection limit
from PON, enrichment percent, N2 fixation rate, etc. e. Communication about funding, paper draft, etc.
3. Joint best practices in N2 fixation research or a methods paper, by 2013 or 2014.

N2 Fixation Workshop Protocols (1st draft)
Prepared by Rosie Gradoville 1. Exetainer/vortexing Method for making enriched seawater This method is intended to be an “easy” method for preparing enriched water at sea
1. Filter your water: vacuum filtration through 0.2 um polycarbonate, pre-HCl-rinsed filter into sterile, HCl-cleaned, trace-metal free Erlenmeyer flask. Filtering is important so that you don’t burst cells.
2. Aerate the flask by swirling. You can measure O2 with microsensor to test your aeration. (To be tested how long you need to swirl to aerate) Note: don’t use stir bar.
3. Pour water into exetainer (make/model/size?), fill to brim, ensure that there are no bubbles
4. Add N2, trying to minimize the time it takes to do this process. Do this at room temperature. Needle size = 0.4 mm gauge, use one without the shut-off valves (they would introduce dead volume) (make/model?) Equilibrate your needle with the atmosphere using a beaker of seawater. To add the N2, turn upside down, apply an outsource needle (the size of the syringe should be the volume of the gas you are injecting). Add half your volume, remove the exhaust needle, then add the other half of your volume. This creates the over-pressure. Always store your bottle upside down, at room temperature. Maximum storage time = several hours to weeks. Need to test.
5. Vortex. (To be tested). Vortex 5X, 10 seconds each. Ensure that each time you vortex, you get a cylinder going all the way down your exitainer.
6. Add enriched water to sample. First add some of your sample, then add your enriched water only up to neck of the bottle, then fill bottle to the top without overfilling. Ensure that there is zero headspace and no spilling cap, invert 20X
Considerations/Tests - Aeration step – test how much O2 has gone back in - Need to know Temp, Salinity to estimate %N2 (provide table) - Make tables of what volumes give what enrichments - When working with cold temperature water, need to do enrichment in a cold room
and adjust for the solubility - Depth profile – does it matter in the upper water column and OMZ if you use surface
water - Can we just use artificial seawater? Can a company make this? - Test about the storage length - Test vortexing, what enrichment do you actually get to and how long does it take - What are our recommendations for people making large amounts of FSW in coastal
habitats Advantages to this method
- Seems simple - You can use the water from the station that you’re sampling at sea - Low risk of contamination - Don’t need a MIMS
Disadvantages to this method
- Variability in enrichment (at least until tests are done) - Time required for making large quantities of water (limited volume of exetainer:
largest exetainer = 38 mL) - Wasteful: you only use 20% of the label that you’re adding (since you’re not
degassing)
2. Degassing method for making enriched seawater/media
1. Make XL FSW, using a vacuum pump and larger Erlenmeyer flask than your volume that you’re filtering to leave a large surface area: volume ratio.
2. Degas: Apply vacuum to the side-arm of the flask (for x time). Purge with argon (better) or helium at 5 PSI for 10 minutes; repeat this vacuum/degassing several times
3. Test oxygen content, using either Winkler titration or a microsensor. Ensure that there is <10% oxygen content
4. Add degassed water to “amended water” serum bottles. Dispense via gravity or positive pressure directly into the bottles you’re using, minimizing disturbance/splashing and not adding bubbles, but working quickly. Fill to top, cap with butyl rubber Teflon coated cap (make/model), ensuring no bubbles. Crimp.
5. Add 15N2 to desired labeling percentage with exhause needle for releasing water 6. Recommendation: take 1-4 replicate samples for MIMS, leaving no headspace.
Tests/Considerations
- Efficiency for degassing: how long, need time series of oxygen content at each step - Need to provide recommendation for minimum oxygen concentration - Check reproducibility of “amended water” serum bottles - Consider toxicity of serum caps (Teflon coated is better) - Recommend intercalibration of the methods (have multiple labs test)
Advantages
- It takes less time to prepare a large volume of enriched water than vortexing method
- Use 100% of label - Potentially higher enrichment than vortexing method
Disadvantages - Potential for contamination - More materials are required than vortexing method - If preparing beforehand, you will be using different water
3. Recommendations for Bubble Additions
- Add the 15N2 bubble to an airtight bottle, and invert/mix 200 times. Take off the cap to release the bubble, take a sample for MIMS, top off bottle with more sample, and cap. This measures the labeling percentage to begin with, and higher.
- Add 15N2 bubble with an overpressure, release after X hours (6?), take an MIMS sample (time zero), top off bottle without air bubbles, and continue incubation

- Use more label (use a higher ratio of volume 15N2 : volume incubation) - Concern: Taking a time zero MIMS sample is vitally important with this method.
Experiments/Considerations
- Test the reproducibility of the overpressure - Overpressure effect on microbes – i.e. disruption or agitation
Advantages
- NO contamination (except needle)
Disadvantages - Vital to have MIMS measurements for every bottle - You will waste some of your 15N2 - Reproducibility of enrichment - Overpressuring might affect the microbes in the bottle
4. MIMS Protocol and Sample Recommendations
- Calibarate MIMS using milli-Q water which is bubbled with air at a controlled temperature (ex room temperature) and also with pump off. This makes up your 2 point calibration.
- Samples should be at same temperature as calibration - Long term storage of samples can lead to equilibration and long-term loss - Masses to be measured: 28, 29, 30, 32, 40. Oxygen is important because you can
quantify the amount of oxygen contamination and determine the change in labeling percentage.
- Note that 0.5% of N2 mass is 29 because of the purity of the gas, therefore you will detect mass 29
- Sample into the MIMS – each bottle is sacrificed, bottle is opened, and tube is added to the bottom of the liquid, pump is turned on. Each sample has about 100 cycles.
- Modify the distance to the plateau if you want to use less volume and this will be the equilibration. You cannot buy this, details from Gaute on manufacturer.
- Recommend 4-5 replicates. - Accuracy should be <2%

Calculation of detection limits associated with At% enrichment levels in the dissolved N2 gas
Author: Mark Moore
V (d-1) = (1/t) (At% PONend - At% PONstart)/(At% N2 enrich - At% PONstart) V (d-1) = (1/t) (At% PON)/(At% enrich - At% PONstart) N fix = V/PON Detection limit is dependent on ability to measure the difference in 15PON between the beginning and end of the experiment, alongside ability to measure the enrichment accurately. Note it is the relative difference in the 14/15 ratios of the pools that is important. Absolute values are irrelevant, although it should be noted that standardisation, e.g. between a MIMS and IRMS would be required. Values of At% PONstart are sometimes assumed. It should be noted that the atmospheric 14/15 ratio (equivalent to 0.3663 At% or 0 per mil 15N (by definition) will typically be different to the value for 15PON, which varies from around -1 – 18 in the ocean (equivalent to 0.3659 – 0.3726 per mil, i.e. a difference of 0.0067 At%).
0 1 2 3 4 5 6 7 8 9 100
0.5
1
1.5
2
2.5
3x 10
-3
Enrichment (At%)
V (
d-1
)

Theoretical minimum measurable PON specific N2 fixation rate for a 24 hr incubation assuming that initial 15PON pool is equivalent to 5 per mil and you can measure a difference between 15PONstart and 15PONend of <= 1 per mil (equivalent to a difference of ~0.0003 At%).
Theoretical minimum measurable N2 fixation rates under above assumptions at a number of different PON concentrations.
0 1 2 3 4 5 6 7 8 9 100
5
10
15
20
25
30
Enrichment (At%)
N2 f
ixa
tio
n (
nm
ol n
l-1 d
-1)
PON = 10 mol l-1
PON = 0.1 mol l-1
PON = 1 mol l-1
0 1 2 3 4 5 6 7 8 9 100.001
0.01
0.1
1
10
100
Enrichment (At%)
N2 f
ixa
tio
n (
nm
ol n
l-1 d
-1)
PON = 10 mol l-1
PON = 1 mol l-1
PON = 0.1 mol l-1

As above, note logarithm scale. Examples: Oligotrophic system, PON = 0.5 uM 2% enrichment, LOD = 0.10 nmol l-1 d-1 4% enrichment, LOD = 0.05 nmol l-1 d-1 Table of theoretically achievable limits of detection for N2 fixation at a range of different PON and At% enrichments. 24 hr experiment, assuming that initial 15PON pool is equivalent to 5 per mil and you can measure a difference between 15PONstart and 15PONend of <= 1 per mil (equivalent to a difference of ~0.0003 At%). 1% 2% 4% 8% 10 µM PON 5.8184 2.2529 1.0123 0.4817
5 µM PON 2.9092 1.1265 0.5061 0.2409
1 µM PON 0.5818 0.2253 0.1012 0.0482
0.5 µM PON 0.2909 0.1126 0.0506 0.0241
0.1 µM PON 0.0582 0.0225 0.0101 0.0048
0 1 2 3 4 5 6 7 8 9 100.001
0.01
0.1
1
10
100
Enrichment (At%)
N2 f
ixa
tio
n (
nm
ol n
l-1 d
-1)
PON = 10 mol l-1
PON = 1 mol l-1
PON = 0.1 mol l-1

Calculations for lower discrimination between end and start point PON will scale linearly. i.e. for a standard deviation of 3 per mil difference (0.001 At%), multiply numbers in the table by 3. 2 % enrichment, predicted final 15PON 0.01 0.1 1 10 10 µM PON 5.004 5.045 5.447 9.472
5 µM PON 5.009 5.089 5.894 13.94
1 µM PON 5.045 5.447 9.471 49.72
0.5 µM PON 5.089 5.894 13.94 94.46
0.1 µM PON 5.447 9.472 49.72 452.9
2 % enrichment, predicted final At% 0.01 0.1 1 10 10 µM PON 0.3681 0.3681 0.3683 0.3698
5 µM PON 0.3681 0.3682 0.3685 0.3714
1 µM PON 0.3681 0.3683 0.3698 0.3844
0.5 µM PON 0.3682 0.3685 0.3714 0.4008
0.1 µM PON 0.3683 0.3698 0.3844 0.5313
8 % enrichment, predicted final 15PON 0.01 0.1 1 10 10 µM PON 5.021 5.209 7.091 25.91
5 µM PON 5.041 5.418 9.183 46.83
1 µM PON 5.209 7.091 25.91 214.3
0.5 µM PON 5.418 9.183 46.83 423.9
0.1 µM PON 7.091 25.91 214.3 2112
8 % enrichment, predicted final At% 0.01 0.1 1 10 10 µM PON 0.3681 0.3682 0.3689 0.3758
5 µM PON 0.3681 0.3683 0.3697 0.3834
1 µM PON 0.3682 0.3689 0.3758 0.4444
0.5 µM PON 0.3683 0.3697 0.3834 0.5208
0.1 µM PON 0.3689 0.3758 0.4444 1.1313


