DERIVATIONS OF TISSUE SLICE TECHNOLOGY AS...
191
Derivations of Tissue Slice Technology as Toxicological Screening Systems Item Type text; Electronic Dissertation Authors Catania, Jeffrey Mark Publisher The University of Arizona. Rights Copyright © is held by the author. Digital access to this material is made possible by the University Libraries, University of Arizona. Further transmission, reproduction or presentation (such as public display or performance) of protected items is prohibited except with permission of the author. Download date 03/07/2018 13:34:45 Link to Item http://hdl.handle.net/10150/195419
Transcript of DERIVATIONS OF TISSUE SLICE TECHNOLOGY AS...
Derivations of Tissue Slice Technologyas Toxicological Screening Systems
Item Type text; Electronic Dissertation
Authors Catania, Jeffrey Mark
Publisher The University of Arizona.
Rights Copyright © is held by the author. Digital access to this materialis made possible by the University Libraries, University of Arizona.Further transmission, reproduction or presentation (such aspublic display or performance) of protected items is prohibitedexcept with permission of the author.
Download date 03/07/2018 13:34:45
Link to Item http://hdl.handle.net/10150/195419

DERIVATIONS OF TISSUE SLICE TECHNOLOGY AS
TOXICOLOGICAL SCREENING SYSTEMS
by
Jeffrey Mark Catania
A Dissertation Submitted to the Faculty of the
DEPARTMENT OF PHARMACOLOGY & TOXICOLOGY
In Partial Fulfillment of the Requirements For the Degree of
DOCTOR OF PHILOSOPHY
In the Graduate College
THE UNIVERSITY OF ARIZONA
2 0 0 6
2
THE UNIVERSITY OF ARIZONA GRADUATE COLLEGE
As members of the Dissertation Committee, we certify that we have read the dissertation prepared by Jeffrey Mark Catania, entitled “Derivations of Tissue Slice Technology as Toxicological Screening Systems,” and recommend that it be accepted as fulfilling the dissertation requirement for the Degree of Doctor of Philosophy. _______________________________________________________________________ Date: December 12, 2005
A. Jay Gandolfi _______________________________________________________________________ Date: December 12, 2005
Qin Chen _______________________________________________________________________ Date: December 12, 2005
Robert P. Erickson _______________________________________________________________________ Date: December 12, 2005
Bernard W. Futscher _______________________________________________________________________ Date: December 12, 2005
Charlene A. McQueen Final approval and acceptance of this dissertation is contingent upon the candidate’s submission of the final copies of the dissertation to the Graduate College. I hereby certify that I have read this dissertation prepared under my direction and recommend that it be accepted as fulfilling the dissertation requirement. ________________________________________________ Date: December 12, 2005 Dissertation Director: A. Jay Gandolfi

3
STATEMENT BY AUTHOR
This dissertation has been submitted in partial fulfillment of requirements for an advanced degree at The University of Arizona and is deposited in the University Library to be made available to borrowers under rules of the Library.
Brief quotations from this dissertation are allowable without special permission, provided that accurate acknowledgment of source is made. Requests for permission for extended quotation from or reproduction of this manuscript in whole or in part may be granted by the head of the major department or the Dean of the Graduate College when in his or her judgment the proposed use of the material is in the interests of scholarship. In all other instances, however, permission must be obtained from the author.
SIGNED: Jeffrey Mark Catania

4
ACKNOWLEDGEMENTS I would first like to thank my parents. They have provided for me in more ways than I
know, or can truly imagine. Without their help, support and faith, none of this would
have been possible. They have offered me the world and asked for nothing in return. I
give my sincere appreciation to Dr. A. Jay Gandolfi for his years of tutelage and training.
I believe myself to be one of his most difficult students and to him I owe a debt of
gratitude for his patience, scientific encouragement, professional advice and willingness
to allow me the freedom of exploration throughout my time in his laboratory. To the
members of my committee, Drs. Chen, Futscher, Erickson, and McQueen, I am especially
thankful for their recommendations, expertise and eagerness to share their time. I would
like to acknowledge Dr. Alan Parrish for providing me the initial interests to pursue my
graduate studies. He has been, and continues to be, an excellent mentor and a true friend.
To the members of the lab, past and present, I am thankful to have worked with so many
people who have impacted my life in more ways than I can describe. I am extremely
thankful to have met and made so many friends and colleagues; people with whom I have
shared a multitude of great memories. Thank you for the influence you have had on my
life, and I can only pray that I have provided you the same.

5
TABLE OF CONTENTS
LIST OF FIGURES ................................................................................................................ 7 ABSTRACT........................................................................................................................... 9 CHAPTER 1: INTRODUCTION ............................................................................................ 11
Section 1.1: Need for Toxicity Screens ...................................................................... 11 Section 1.2: Modes of Toxicity ................................................................................... 15 Section 1.3: Current Toxicological Models............................................................... 16
Section 1.3.1: In Vivo .............................................................................................. 17 Section 1.3.2: Transgenics ...................................................................................... 19 Section 1.3.3: Ex Vivo.............................................................................................. 21 Section 1.3.4: In Vitro.............................................................................................. 22
Section 1.4: Precision-cut Tissue Slices ..................................................................... 23 Section 1.5: Precision-cut Tissue Chips .................................................................... 30 Plan of Study ............................................................................................................... 32
CHAPTER 2: TISSUE SLICES FROM TRANSGENIC ANIMALS ............................................ 34 Section 2.1: Background............................................................................................. 34
Section 2.1.1: Methods ............................................................................................ 38 Section 2.2: Viability Studies ..................................................................................... 42
Section 2.2.1: Rationale .......................................................................................... 42 Section 2.2.2: Results .............................................................................................. 43
CYP 1A1/β-gal Transgenic Mice .......................................................................... 43 AP-1/luciferase Transgenic Mice ......................................................................... 43
Section 2.2.3: Section Summary ............................................................................ 46 Section 2.3: Promoter Gene Induction...................................................................... 49
Section 2.3.1: Rationale .......................................................................................... 49 Section 2.3.2: Results .............................................................................................. 49
CYP 1A1/β-gal Transgenic Mice .......................................................................... 49 AP-1/luciferase Transgenic Mice ......................................................................... 49
Section 2.3.3: Section Summary ............................................................................ 51 Section 2.4: Summary ................................................................................................. 53
CHAPTER 3: PRODUCTION OF AN ESTROGEN RESPONSIVE TRANSGENIC MOUSE......... 58 Section 3.1: Background............................................................................................. 58
Section 3.1.1: Methods ............................................................................................ 60 Section 3.2: ERE Determination for Transgenic Mouse Production ..................... 66
Section 3.2.1: Methods ............................................................................................ 67 Section 3.3: Cell Culture Models for ERE Testing .................................................. 70
Section 3.3.1: Addition of Basic Promoter Elements ........................................... 71 Section 3.4: Transgenic Mouse Production .............................................................. 74
Section 3.4.1: ERE Transgenic Mouse Tissue Slice Studies................................ 74 Section 3.5: Summary ................................................................................................. 80
CHAPTER 4: TISSUE CHIPS AS A MODEL SYSTEM FOR IN VITRO TOXICOLOGY STUDIES........................................................................................................................................... 84
Section 4.1 Background .............................................................................................. 84

6 TABLE OF CONTENTS - Continued
Section 4.1.1: Methods ............................................................................................ 86 Section 4.2: Justification for the Use of Smaller Biomass ....................................... 89
Section 4.2.1: Summary .......................................................................................... 95 Section 4.3: Iodoacetamide......................................................................................... 95 Section 4.4: Assessment of Tissue Chip Perturbation by Iodoacetamide .............. 97
Section 4.4.1: Methods ............................................................................................ 99 Section 4.4.2: Tissue Chip Viability .................................................................... 100
5-carboxyfluorescein (5-CF) .............................................................................. 100 Section 4.4.3: Ionic Changes due to Membrane Damage .................................. 100
FURA-2 Derivatives............................................................................................ 102 Section 4.4.4: Mitochondrial Function Assays ................................................... 103
Tetramethylrhodamine Ester .............................................................................. 105 MTT Assay .......................................................................................................... 107
Section 4.4.5: Cellular Targets for Toxic Insult ................................................. 107 Monobromobimane ............................................................................................. 109 Ellman’s Reagent ................................................................................................ 110
Section 4.4.6: Cationic Transport........................................................................ 110 NBD-TMA ................................................................................................... 113
Section 4.5: Summary ............................................................................................... 113 Section 4.5.1: Tissue Chips ................................................................................... 115 Section 4.5.2: Fluorescent Probes as Indicators of Toxicity.............................. 116
CHAPTER 5: DISCUSSION AND CONCLUSIONS ............................................................... 119 Section 5.1: Conclusions ....................................................................................... 119 Section 5.2: Future Studies................................................................................... 124
APPENDIX A: OTHER MODELS OF TRANSGENIC MICE................................................. 128 Section A.1: UbC:GFP Transgenic Mice .................................................................... 128
Section A.1.2: Results ............................................................................................... 129 Section A.1.3: Summary ........................................................................................... 132
Section A.2: Estrogen Responsive Transgenic Mice Studies .................................... 132 APPENDIX B: TISSUE CHIP PRODUCTION AND INCUBATION......................................... 136
Section B.1: Methods of Mass Tissue Chip Production......................................... 136 Section B.2: Tissue Chip Incubation Systems ........................................................ 141 Section B.3: Media Formulation.............................................................................. 155
APPENDIX C: OTHER TOXICANTS ................................................................................. 159 Section C.1: Metabolically Activated Toxicants .................................................... 159
Section C.1.1: Bromobenzene as a Classical Toxicant....................................... 159 Section C.1.2: Thioacetamide............................................................................... 162
Section C.2: Direct Acting Toxicants ...................................................................... 164 Section C.2.1: Mercuric Chloride........................................................................ 164
APPENDIX D: OTHER PROBES........................................................................................ 168 Neutral Red ................................................................................................................. 168 MitoTracker Far Red .................................................................................................. 170
APPENDIX E: STRUCTURE OF MOLECULAR PROBES .................................................... 172 REFERENCES................................................................................................................... 179

7
LIST OF FIGURES Figure 1: Convergence of Various Disciplines on Toxicological Studies........................ 13 Figure 2: Comparison of Some Attributes between In Vivo and In Vitro Studies. ........... 18 Figure 3: Tissue Slice Procedure. .................................................................................... 27 Figure 4: Various Incubation Methods for Precision-cut Tissue Slices........................... 29 Figure 5: Diagrammatic Scheme of Plan of Study. .......................................................... 33 Figure 6: Detail of the CYP 1A1:β-Galactosidase Transgene. ........................................ 36 Figure 7: Detail of the AP-1:Luciferase Transgene. ........................................................ 37 Figure 8: CYP 1A1 Transgenic Mouse Tissue Slice Viability. ......................................... 44 Figure 9: LDH Release from CYP 1A1 Transgenic Mouse Tissue Slices. ....................... 45 Figure 10: AP-1 Transgenic Mouse Tissue Slice Viability............................................... 47 Figure 11: LDH Release from AP-1 Transgenic Mouse Tissue Slices............................. 48 Figure 12: β-Galactosidase Induction in Tissue Slices from CYP 1A1 Transgenic Mice.50 Figure 13: Luciferase Induction in Tissue Slices from AP-1 Transgenic Mice................ 52 Figure 14: Diagrammatic Representation of the Production of Transgenic Mice........... 61 Figure 15: Western Blot Analysis for Estrogen Receptor Alpha Content in both Model Cell Lines. ......................................................................................................................... 68 Figure 16: Schematic of Various Estrogen Responsive Elements Created. ..................... 69 Figure 17: EMSA of Nuclear Lysates Bound to ERE Sequence. ...................................... 72 Figure 18: EMSA Super Shift of MCF-7 Nuclear Lysates................................................ 73 Figure 19: Diagram of Synthesized ERE:GFP Construct Production and Verification.. 76 Figure 20: PCR Analysis of the Founder Generation of Transgenic Mice. ..................... 77 Figure 21: Representative Photograph of the PCR Analysis of N1 Generation of Transgenic Mice from a Single Founder. ......................................................................... 78 Figure 22: ERE:GFP Transgenic Tissue Slices Challenged with Estrogen..................... 79 Figure 23: Photograph of Tissue Chip Production. ......................................................... 92 Figure 24: Effect of Tissue Chip Diameter on Total Intracellular Ion Content............... 94 Figure 25: Reaction Scheme for Iodoacetamide. ............................................................. 96 Figure 26: Effect of Iodoacetamide Concentration on Intracellular Potassium Ion Content.............................................................................................................................. 98 Figure 27: Effect of Iodoacetamide on Carboxyfluorescein Fluorescence. ................... 101 Figure 28: Effect of Iodoacetamide on FURA-2 Fluorescence. ..................................... 104 Figure 29: Effect of Iodoacetamide on TMRE Fluorescence. ........................................ 106 Figure 30: Effect of Iodoacetamide on MTT Reduction. ................................................ 108 Figure 31: Effect of Iodoacetamide on Sulfhydryl Status as Assessed with Monobromobimane. ........................................................................................................ 111 Figure 32: Effect of Iodoacetamide on Glutathione Content as Assessed with Ellman’s Reagent. .......................................................................................................................... 112 Figure 33: Effect of Iodoacetamide on NBD-TMA Fluorescence. ................................. 114 Figure 34: Schematic Diagram of the Various Methods Employed. .............................. 120 Figure 35: Representation of the UbC:GFP Transgene................................................. 130 Figure 36: UbC:GFP Transgenic Mouse Liver Slices. .................................................. 131 Figure 37: Schematic of the ERE:β-Galactosidase Transgene. ..................................... 133 Figure 38: Beta-galactosidase Induction in 3X ERE:β-gal Tissue Slices. ..................... 135

8
Figure 39: Multiple Blade Tool for Mass Production of Tissue Cores from Mouse Liver.......................................................................................................................................... 137 Figure 40: Tools and Modifications used for the Generation of Many Tissue Chips. ... 138 Figure 41: Tissue Slicer Modifications for Large Diameter Cores................................ 139 Figure 42: Multi-core Tissue Slicer Arm........................................................................ 140 Figure 43: Photograph of the Inside of the Modified Tissue Slicer. .............................. 142 Figure 44: Photograph of Tissue Chips in a 24 Well Plate............................................ 143 Figure 45: Photograph of Bacterial Shaker Incubator with Oxygenation Tubing......... 144 Figure 46: Effect of Shaker Speed on Tissue Chip Viability. ......................................... 147 Figure 47: Screen Support System for Tissue Chips in 24 Well Plates. ......................... 149 Figure 48: Modified Photograph of a 24 Well Plate with Oxygenation Holes. ............. 151 Figure 49: Cell Culture Incubator with Rotating Platform for Multi-well Plates Containing Tissue Chips. ................................................................................................ 153 Figure 50: Comparison of Incubation Methods on Tissue Chip Viability...................... 154 Figure 51: Effects of Different Media Formulations on Tissue Chip Viability. ............. 157 Figure 52: Metabolic Scheme of Bromobenzene. ........................................................... 160 Figure 53: Effect of Bromobenzene on Neutral Red Uptake. ......................................... 161 Figure 54: Metabolic Scheme of Thioacetamide. ........................................................... 163 Figure 55: Effect of Thioacetamide on Neutral Red Uptake. ......................................... 165 Figure 56: Effect of Mercuric Chloride on Intracellular Potassium Ion Content.......... 167 Figure 57: Neutral Red as a Viability Indicator Following Iodoacetamide Exposure. . 169 Figure 58: Effect of Iodoacetamide on Mito Fluor Far Red Fluorescence.................... 171 Figure 59: Structure of Neutral Red............................................................................... 172 Figure 60: Structure of 5-Carboxyfluorescein. .............................................................. 173 Figure 61: Structures of the FURA-2 Dyes. ................................................................... 174 Figure 62: Structure of Tetramethyl Rhodamine Ester. ................................................. 175 Figure 63: Structure of Mito Fluor Far Red. ................................................................. 176 Figure 64: Structure of Monobromobimane................................................................... 177 Figure 65: Structure of NBD-TMA. ................................................................................ 178

9
ABSTRACT
In vitro toxicology studies are hindered by the use of specific cellular systems which
solely examine one cell type. Precision-cut tissue slices mimic specific organ toxicity as
normal cellular heterogeneity and organ architecture are retained. Experiments were
performed using tissue slices from transgenic mice with enzyme reporter proteins for
rapid analysis. CYP 1A1/β-galactosidase transgenic mouse liver and kidney slices
challenged with 20 µM BNF for 24 hr remain viable and display organ-specific induction
of β-galactosidase (~30-fold in liver and 3-fold in kidney). AP-1/luciferase transgenic
mouse tissue slices incubated with 9 µM TPA also remained viable while exhibiting a
tissue- and time-dependent induction of luciferase. In kidney slices, luciferase induction
was approximately 1.5-fold at 2 hr, which increased to 2.5-fold at 4 hr. Liver slices
displayed a rapid increase in luciferase at 2 hr (approximately 3-fold) which was
abolished at 4 hr. To quicken experimental design via decreased sample preparation, a
custom transgenic mouse was created based upon a fluorescent reporter protein.
Subsequent studies with slices from this strain and another fluorescent-based transgenic
strain did not display reporter induction. For optimization of the smaller tissues of mice
and to create an easily deployable method of rapid detection, a tissue chip based system
was created for generating large numbers of samples from a single organ and coupled
with fluorescent indicators to maximize detection sensitivity for specific cellular
processes. Fluorescence of 5-carboxyfluorescein increased at high concentrations of
iodoacetamide (IAM), a quick-acting toxicant, indicating disruption of cellular

10
membranes. The mitochondrial probe, TMRE, exhibited an increase in fluorescence with
increasing IAM concentrations. Monobromobimane, a sulfhydryl probe, displayed a
decrease in fluorescent intensity at higher IAM challenge; a finding confirmed with
Ellman’s reagent. A probe used for calcium measurement, FURA-2, demonstrated an
increase in fluorescence with increasing IAM concentrations. Importantly, the number of
samples per organ/mouse was increased at least 3-fold and a significant time reduction
per analysis was realized. These results suggest that both transgenic-based tissue slice
studies and studies with fluorescent probes in naïve tissue chips are two methods of
higher-throughput analyses to evaluate toxicant perturbations with in vitro studies.

11
CHAPTER 1: INTRODUCTION
The creation of chemical libraries has sped the ability of pharmaceutical
companies to produce a more targeted approach to human diseases. These molecular
libraries offer the possibility to rapidly create a large number of potential pharmaceuticals
which maximize the drug:target interaction. With this event horizon comes the need to
test these chemicals in a timely manner, to help to elucidate potential toxicant profiles.
High-throughput screens can offer this ability to quicken the pace of research, while
selecting molecules with beneficial properties early in the drug design process, it is
equally as important to ascertain the toxic side effects as early as possible. This typically
requires the use of more time consuming and cost restrictive in vivo animals models,
before the use of phase I clinical trials. Phase II trials are where the majority of human
toxic side effects are initially identified. Therefore, a tissue slice technique which can use
a targeted approach to better understand these toxic side effects from the onset of animal
studies has the potential to become a significant cost-effective method as well as a high-
throughput screening system which can more accurately demonstrate in vivo toxicity.
Section 1.1: Need for Toxicity Screens
The past few decades have yielded an explosion of techniques to synthesize
chemicals quickly, cheaply and ones which are more potent. With these advances comes
an extreme problem; the large numbers of chemicals that can be rapidly generated also
12
need to be tested for their toxic potential. Combinatorial chemistry alone can create vast
libraries of compounds whose toxic potentials may not be fully understood. Additionally,
drugs that have proceeded through clinical trials can demonstrate severe toxicities in
predisposed populations; populations that could not be realized until the drug has been
formally released (Figure 1). At times, the intricate toxic profiling of a drug, or class of
drugs, takes years to be proven. A recent example of this is the large-scale recall of
cyclooxygenase-2 inhibitors (Kimmel et al., 2005).
These issues are compounded by the immense number of industrial chemicals
created in vast quantities whose exact toxicological profile is not understood. The EPA’s
High Production Volume (HPV) initiative outlines more than 2,800 high production
chemicals which need to be tested for toxicity and environmental fate (Green et al.,
2001). Companies that make large quantities of the compounds are expected and/or
recruited to join the HPV program to help better understand how these chemicals may
affect human and wildlife populations. The fact that some of these chemicals have found
their way into the water supply of major cities also poses a significant health concern.
The increased awareness of the effect of these chemicals on humans and wildlife has
created a new focus on the possibility of environmental estrogens – chemicals that can
mimic and/or modulate the effects of estrogen in both males and females (Witorsch,
2002). The release of certain compounds, more specifically halogenated hydrocarbons,
in the environment has led to numerous deleterious reproductive effects in wildlife

13
PharmaceuticalCompounds
EnvironmentalPollutants
CombinatorialChemistry
Nutraceuticals
Toxicology
In vivo or in vitroIn vivo or in vitro
Target organ(s)Target organ(s)
Specific ResponseSpecific Response
Cosmetics
Figure 1: Convergence of Various Disciplines on Toxicological Studies. Toxicology is the regulatory roadblock for various fields. While compounds can be created quickly, specific toxic mechanisms of insult may take much longer to understand. Additionally, many potential toxicant profiles may not be completely realized until further studies can be performed. The detection of specific responses is crucial to correct identification of toxicant-induced injury, and may vary amongst organs. In vivo and in vitro studies are required to fully ascertain chemical fate.

14
(Harrison et al., 1997; Tyler et al., 1998; Guillette, 2000). Although effects have been
seen in wildlife, the extrapolation to humans has not been easy (Green, 1990).
Studies rely on the number of animals and statistical methods employed to be
sufficient to be able to detect a ‘real’ response. The choice of species is also of the
utmost importance. Certain species may better correlate to human data in one organ, but
poorly in other organs (Haseman and Huff, 1987; Brown et al., 1988; Evans, 1990). In
this way, health safety provides a paradoxical model for testing; making sure that enough
data is generated to produce sufficient relevant data, while attempting to keep the overall
number of animals used as low as possible.
New drug design is an expensive proposition for a company to undertake. A low
percentage of compounds in clinical trials will make it to the market. By the time a drug
has reached the market, and undergone all phases of clinical trials, the total amount spent
is close to $1 billion (Dickson and Gagnon, 2004). Since roughly 75-80% of this cost
comes directly from research/development and clinical trials, a significant savings could
be realized by adopting newer technologies to help identify problems before clinical trials
ever take place (Kuhlmann, 1999; Pritchard et al., 2003).
There are typically four stages in drug discovery; target identification, target
validation, drug design, and lead optimization. It is in the last phase that high throughout
screens (HTS) are needed in order to determine the optimal properties for the drug
(Ansede and Thakker, 2004). Although HTSs can be employed in this stage to increase
drug parameters, the basic design characteristics have already been realized. This last
stage is where in vivo studies are greatly needed in order for the drug to become a

15
candidate for human studies. These in vivo studies are of the utmost importance, not
only to ensure that the compound does what it was designed to do, but to be certain that
significant problems do not occur.
The most important aspect of any screening system is that it needs to be
biologically relevant. The correct target or targets must have been identified, which in
turn must relate to a specific cellular event. Current HTS models usually rely on rapid
toxicity screens, using simple markers (Hellmold et al., 2002; Koop, 2005). Cellular
multiplexing, where multiple cell lines (each designed for a specific drug target) are co-
incubated, have been employed for HTS of multiple chemicals (Beske and Goldbard,
2002). The use of genomic HTSs have become increasingly common to aid in the
determination of carcinogenesis and functional genomics, as well as indicators of
viability (Friedman and Perrimon, 2004).
Section 1.2: Modes of Toxicity
Varied processes can lead to a compound’s toxicity. While the ability of the
compound to enter the cell relies on the pharmacokinetics of the compound, once inside
the cell multiple events can occur to yield toxicity. Major endpoints of toxicity are
altered gene transcription, altered homeostasis, and changes in cellular cascades. Any
combination of these processes will result in cellular dysfunction or dysregulation and, if
uncorrected, potentially cell death.

16
Toxicant-induced cell death can be roughly divided into two parts: necrosis and
apoptosis. In necrotic cells, the homeostasis of the cells is altered, resulting in a decrease
in the amount of energy (ATP) created, leading to failure of necessary processes. This
can be due to the target directly affecting an organelle or an essential energy cascade.
Cellular and/or organelle swelling occurs due to loss of necessary transporters which rely
heavily on ATP stores. This in turn causes the cell to rupture as the influx of sodium ions
causes water to enter the cell (Kaplowitz, 2000). Necrotic cells also usually elicit an
immune response, which can lead to local cellular populations being affected as well.
Apoptosis, or programmed cell death, occurs through different mechanisms that
are the result of changes in cellular cascades (Balla et al., 2001). Activation of key
enzymes, such as cytochrome c, bcl, bax, and caspases, causes self-induced killing of the
cell. In this type of cell death, the cell usually shrinks, organelle membranes remain, and
the chromatin is condensed. The determination of how a chemical causes toxicity within
the target organ is an important consideration and various models have been employed to
observe these effects.
Section 1.3: Current Toxicological Models
To investigate the cellular processes that a compound acts upon, there are mainly
four different models which are used. The first model is in vivo systems, which are used
to help and identify what organs are specifically affected. However, identifying specific
processes within an organ are much harder to realize. Another model system is ex vivo

17
implants of organs, typically involving the use of a perfusate which includes the toxicant
of interest, with endpoints often measured by histopathology or a specific physiologic
function. Cell culture, or in vitro, techniques have been developed to isolate the main cell
type that is affected by a toxicant. In this model system, specific targets within a cell are
much easier to locate and to identify. Tissue slices offer the advantage of bridging the
gap between in vitro and in vivo studies, which will be discussed in more detail in a
subsequent section.
Section 1.3.1: In Vivo
In vivo methods involve the use of the whole animal and often can be both time
consuming and cost-prohibitive (Figure 2). The main advantage of these studies lies in
the ability to detect specific organ toxicities, usually through the use of histopathology.
Additionally, this model studies these effects on a system wide scale, with all organs and
distribution properties intact. Although studies can be performed from whole
homogenates, isolation and identification of specific cells from an organ greatly increases
the amount of time involved. Since compounds given to the whole animal can exhibit
varied responses throughout the body, identifying toxicities of a given compound is more
difficult; effects that are generally realized in necropsy of the animal. Once the target
organ or organs have been identified , determining the mechanism of toxicity becomes a
larger issue. The use of

18
• In Vivo– Determines the effects
on the entire system.– Labor and cost
intensive.– Long time frame.– My be hard to detect
specific changes.
• In Vitro– Detection of cell-specific
changes.– Ease of use for
identifying specific toxicities.
– Relatively inexpensive.– Fast endpoints.
Figure 2: Comparison of Some Attributes between In Vivo and In Vitro Studies. In vivo studies may help in the identification of specific organ toxicity, but at the cost of time and at great expense. In vitro methods are relatively cheaper and much more rapid, but may lack key cellular populations which could be affected.

19
transgenic techniques has increased the pace of understanding specific mechanisms of
disease, especially in whole animal in vivo models.
Section 1.3.2: Transgenics
Transgenic animals are a powerful tool for studying gene function and testing
drugs. Many human genetic diseases can be modeled by introducing the same mutation
into a mouse or other animal. Although similar genetic manipulations can be performed
in tissue culture, the interaction of transgenes with proteins, hormones, neurotransmitters,
and other components of an intact organism provides a much more complete and
physiologically relevant picture of the transgene's function than could be achieved in any
other way. With the development of transgenic livestock and plants, new uses for this
technology have become apparent. These include the ability to produce medically-useful
recombinant proteins and antibodies on an industrial scale, as well as disease-resistant
crops.
A transgenic mouse is simply an organism that has had DNA introduced into
genome artificially. This is commonly done in one of two ways. DNA can be integrated
in a random fashion by injecting it into the pronucleus of a fertilized ovum. In this case,
the DNA can integrate anywhere in the genome, and multiple copies often integrate in a
head-to-tail fashion. Pronuclear injection of DNA is often used to characterize the ability
of a promoter to direct tissue-specific gene expression. Another major use for transgenic
mice produced by pronuclear injection of DNA is to examine the effects of over-
20
expressing and mis-expressing endogenous or foreign genes at specific times and
locations in the animal. The second method of creating transgenic animals is through the
use of embryonic stems cells. This technique creates transgenic stem cells that are then
incorporated into fertilized ova.
The first transgenic mouse was described by Gordon et al. (Gordon and Ruddle,
1982) in the early 1980’s, using elements of the herpes simplex and simian 40 viral DNA
cloned into a bacterial vector. Since this time, huge numbers of transgenic mouse models
have been developed, encompassing a large number of molecular targets. Techniques
have also been developed to knock-out gene function (Pineau et al., 1998; Gonzalez and
Kimura, 1999; Gonzalez and Kimura, 2001; Gonzalez, 2003). The power of knock-out
technology reached new levels when it was discovered that genes can be excised using
the Cre/loxP method (Orban et al., 1992). This method can be used to determine both the
effects of gene deletion within a specific tissue or cell type (Gu et al., 1994) and also the
effects of gene activation following excision of stop sequences (Lakso et al., 1992).
Another transgenic method can be used to determine the effects of gene disruption at
specific instances in the life of the animal. This system uses the tetracycline binding
protein to bind to the promoting region of a gene; providing the benefit of turning on/off
a gene through the simple introduction of tetracycline (Gossen and Bujard, 1992; Furth et
al., 1994).
There are a number of transgenic mice that have been used in toxicology
screening (Gonzalez, 2003; Jacobson-Kram et al., 2004). The Tg.AC mouse couples a
globulin promoter to the v-Ha-ras oncogene. This mouse can be used to study chemicals

21
that can cause skin papillomas. Additionally, the transgenic mouse, Big Blue is used to
study a chemical’s mutagenic ability (Hill et al., 1999). In this system, the genome
contains a gene susceptible to mutating. The animal is dosed with the test compound in
vivo, and the tissue(s) of interest are excised. DNA from the tissue is then extracted and
incubated with a viral packaging system. The now functional virus is incubated with
bacteria and any blue colonies generated are recorded as a positive for carcinogenicity.
This system specifically tells which tissue(s) are affected by the compound.
Many factors influence whether a promoter/transgene construct will express in
transgenic mice. The promoters that are used must be known to function appropriately in
vivo. Perhaps the most important consideration has to do with the transgene insertion site
within the mouse genome. At many chromosomal locations, transgenes will be
transcriptionally silent (Henikoff, 1998). At others they may express, but with a tissue-
and temporal specificity that is not identical to what has previously been seen with the
same promoter construct. The intrinsic ability of a promoter construct to drive transgene
expression reliably and with tissue specificity also varies from promoter to promoter, for
reasons that are not well understood (Bronson et al., 1996).
Section 1.3.3: Ex Vivo
Ex vivo explants best resemble in vivo systems. This method provides the normal
architecture of the organ itself while allowing the ability to adapt the perfusate to best
mimic normal sera. The number of parameters that can affect the usefulness of this

22
model is large. The most important factor appears to be due to the specific type of
perfusate used and the time by which reperfusion of the organ can be achieved
(Groneberg et al., 2002). Additionally, these procedures are somewhat time-consuming
and surgical procedures to isolate and perfuse the organ of interest require prior training.
These models typically monitor physiologic changes within the tissue, such as bile
production and flow (Handler et al., 1994).
Section 1.3.4: In Vitro
Beginning with in vitro studies directly to identify mechanisms of toxicity maybe
easier, but whether the correct organ is being studied is a realistic problem. This problem
can then be exacerbated by the fact of the numerous cell types present in one organ. That
is, the question remains as to whether the correct cell type has been chosen. As these
models are further removed from a living system, the possibility remains that a
compound maybe activated in one organ, transported through the blood, and exert its
affects in another organ, either directly or through further metabolism. The question then
presented is whether or not the whole system has been accurately reproduced.
Liver cell culture models are the most widely employed as compared to the other
models, and offers the advantage of an in vitro system for rapid testing. These studies
typically use isolated hepatocytes in order to maintain and resemble the metabolic
activity of the liver itself. Hepatocytes have been isolated from a wide variety of species,
including human, and use of this system largely leads to identification of specific

23
metabolites and toxic species (Gomez-Lechon et al., 2003). This model is also useful in
determining if a compound is directly toxic to the hepatocyte and if there is a potential
interference in a drug’s disposition. However, no cell-cell interaction information can be
gleaned from these studies, and this, therefore limits the applicability of this system.
Once a potential pharmacologic target or event has been identified, a drug can be
designed to perturb the pathway or to interact with specific proteins. In this same way,
cellular targets have been employed in toxicity screens. Transfected cell culture models
have proven useful for toxicity assays, although these assays typically use a
spectrophotometric assay as an endpoint. These models rely on the production of certain
proteins that have been inserted into the cellular genome (Ristevski, 2005). One such
example is the commons use of β-galactosidase (β-gal). This reporter gene is typically
coupled to the promoter element or gene of interest. When the promoter gene is
functional (induced), then production of the β-gal gene occurs (Grimm and Kachel,
2002).
Section 1.4: Precision-cut Tissue Slices
Precision-cut liver slices offer a bridge between the aforementioned models, while
remaining a valuable in vitro system to understand mechanisms of toxicity. That is, the
normal architecture is maintained along with cellular interaction and cellular
heterogeneity remains. Liver slices have been used in a number of experiments to
determine the histological impact, cell specific responses, enzyme leakage, metabolic

24
schemas, protein synthesis and degradation, to name a few (Azri et al., 1991; Brown et
al., 1992; Lake et al., 1997; Olinga et al., 2001; De Kanter et al., 2002; Romualdi et al.,
2002).
Tissue slices were first described in 1923 by Otto Warburg, however, widespread
use of this system did not evolve until the mid-1980s when advances in incubation and
slicing systems were realized (Brendel et al., 1987). Previous studies had relied on the
use of shaking and proprietary incubation systems. These incubation procedures left
much to be desired, and often produced characteristic banding patterns within the tissue.
These patterns were consistent with degeneration of the tissue itself (Lupp et al., 2005).
With the advent of the dynamic roller culture incubation, efficient gas flow and exchange
within the tissue was finally demonstrated. Tissue slices could now be kept viable for
periods longer than 24 h (Smith et al., 1985; Smith et al., 1986).
Some of the early experiments with tissue slices used rather large slice sizes, and
were therefore limited by the amount of viable tissue. Numerous incubation methods
were employed, but it was not until the 1980s that a reproducible system was created
(Krumdieck et al., 1980; Price et al., 1998). These systems involved the use of a tissue
slicer that could generate tissue slices that were approximately the same depth. At this
same time, a roller incubation system was developed which could adequately provide the
tissues with the required nutrients (Smith et al., 1985).
Recently, tissue slices have been used in microarray and confocal microscopy
studies. When comparing liver slices to liver cell culture models, slices exhibit a gene
expression very similar to the whole organ. One specific study looked at various models

25
of the liver and compared the gene expression profiles of multiple in vitro systems (Boess
et al., 2003). At time points taken at 6 and 24 hours after treatment, tissue slices were
clustered in the same hierarchical group as whole liver samples. Hepatocyte monolayers
and sandwiches were found to be next closest, and finally immortalized cell cultures were
found to be the most dissimilar to normal liver gene expression. Interestingly, another
paper comparing hepatocytes to tissue slices determined that there is a decreased
expression of certain genes in these systems. These genes include receptors, kinases, and
transcription factors (Jessen et al., 2003).
The main advantage of precision-cut tissue slices is the ability to use various
organs, from a number of species. Organs that have been cultured, in addition to liver,
include the heart, lung, intestine, kidney, prostate, brain, and more recently, tumors.
Importantly, the use of human tissue from various organ systems has been studied,
allowing for the direct comparison of animal based models in toxicology. The true power
of this system can be realized by coupling human tissue slices to clinically relevant
biomarkers. The use of genomics, proteomics and metabonomics can aid in the
determination of potential catastrophic or lethal endpoints of pharmaceuticals.
Additionally, co-culture of multiple organs can allow for a bioactivated compound to be
determined earlier in the drug screening process.
Tissue cores are prepared from the organ of interest using a biopsy punch. The
size of the organ dictates which size biopsy punch can be used. The cores are then placed
into an insert which holds the core in a steady, compressed position while being subjected
to the slicing procedure. The size of the generated tissue slice is altered by the use of a

26
screw-based platform on which the blade sits. The distance between the blade and the
slicer base plate can then be either increased or decreased to obtain optimal tissue slice
thickness, which for liver tissue slices has been found to be 250-275 microns.
After slicing, the tissue slices are laid onto titanium rollers with wire-mesh inserts.
Previous studies have implicated the size of the wire in the mesh to also be of
importance. As the wire forms a latticework upon which the slice is suspended, areas
where the wires meet can actually cause a lack of oxygenation. Use of a smaller wire-
mesh screen is now employed in all studies. The titanium rollers, with the tissue slices on
the wire mesh insert, are then placed into a typical 20 ml scintillation vial, containing 1.7
ml of media, and then placed into the dynamic culture incubator (Figure 3). This
incubator allows for the tissue slice to be briefly submerged into the media, then into the
oxygenated environment, and the process is repeated. Tissue slices have the waste
products removed as the media drains off the tissue slice. Groups have now been able to
keep tissue slices viable for up to 21 days using this procedure (Behrsing et al., 2003).
With regards to tissue slices, the major aspect of any incubation system lies in its
ability to supplement nutrients while removing waste products. A number of studies have
shown a wide range of different incubation systems can be used. These systems fall into
two major categories that are based upon how the slices lie. Submerged systems consist

27
A. B. C.
E.
F.D.
Figure 3: Tissue Slice Procedure. Clockwise from top left: (A). The organ of interest is excised and then (B) cored with a coring tool. The cores are then placed in the tissue slicer (C) to generate tissue slices (D). The tissue slices are then laid onto a titanium roller which then inserted into a scintillation vial with 1.7 ml of media (E). The vial with the tissue slices is then placed into a dynamic roller culture incubator (F).

28
of Erlenmeyer flasks and multi-well plates that are placed on shaker platforms and gently
rocked. The second major class of slice incubation is dynamic organ culture, where the
slices are briefly exposed to the oxygenated air and then dipped back into the media
(Figure 4). The latter methods appear to be better suited for supplying nutrients and
removing excreted material, while maintaining oxygen levels.
Shaking incubator platforms, while providing ease of use, have proven to be
difficult to maintain slice viability. These systems typically employ a range of plate sizes
from 6 to 24 well plates. In order to keep the tissue slices near the air:media interface,
groups have used screens supported by steel washers. However, these experiments tend
to slightly tear the tissue slice as the gyratory platform rotates and the somewhat free-
floating slice remains in motion. While the viability of these samples remains consistent
with dynamic roller culture for the first 24 h, significant decreases are seen soon after.
ATP and reduced GSH content decrease dramatically, along with large differences in
histological data, when compared to the dynamic roller system (Gandolfi et al., 1996).
Studies have also demonstrated a minimum oxygenation of 40% to be necessary for
viable cultures to exist (Drobner et al., 2000; Martin et al., 2002). Additionally, gases
containing greater than 70% oxygen appear more viable in regards to histological
sections (Toutain et al., 1998).

29
Titanium Roller Multi-well Plate Flask
DynamicRoller
Culture
Multiple Incubation Techniques:1. Magnetic Stirrer2. Orbital Shaker or Rocker
Platform
Titanium Roller Multi-well Plate Flask
DynamicRoller
Culture
Multiple Incubation Techniques:1. Magnetic Stirrer2. Orbital Shaker or Rocker
Platform
Figure 4: Various Incubation Methods for Precision-cut Tissue Slices. Tissue slices have been used in a number of incubation schemes. Titanium rollers (left) contain a stainless steel mesh on which the tissue slice placed. These rollers are then placed into 20 ml scintillation vials with 1.7 ml of media, and allow optimal gas exchange between the tissue slice and the environment. The multi-well and flask incubation methods result in a submerged tissue slice. Magnetic stirrers can be placed directly in the media, to allow adequate oxygenation and mixing. Additionally, these methods can be placed directly on an orbital shaker or rocker platform.

30
Section 1.5: Precision-cut Tissue Chips
Since only a limited number of precision-cut tissue slices can be generated from
any given organ, a way to increase the number of experiments from an animal would be
to make the tissue slice smaller. In this manner, the ability to create a large data set can
be greatly increased, thus allowing multiple processes to be studied within one organ
from a single animal. This, in effect, would greatly decrease the number of animals
required to complete a study. The combination of using multiple tissue chips from
multiple organs from the same animal would greatly facilitate the amount of data
generated. Currently, 3 tissue chips of a 4 mm size can be obtained from a single 8 mm
tissue slice. Thus the number of analyses that can be performed can be increased at least
3 fold. By combining tissue chips with a newer incubation system, based upon multi-
well plates and a shaker incubator system, raw data can be generated quicker and with
less intrusion. This possibility can be realized with the use of fluorescent probes that can
be incubated in the media while toxicant perturbation occurs.
The real power of this assay lies in the use of a multi-well plate reader, making
the prospect of achieving data real-time a distinct possibility. As toxicant-related effects
of the tissue chip occurs, fluorescent probes for specific processes can be employed to
determine effects on the tissue of interest. Since fluorescence is more sensitive than
spectrophotometric assays, the decreased biomass of the chip can play an important role
in the understanding of what molecular events lead to a given response.

31
A large battery of viability indicators has been attempted with the use of
precision-cut tissue slices. The mainstay in tissue slice studies appears to be the use of
potassium content as a viability indicator, which is normally standardized to either wet
weight or total DNA content. Enzymes within the tissue can also be used to determine
cytotoxicity. Both LDH and ALT have been used extensively, as overt toxicity leads to
an increase in the appearance of these enzymes in the media (Fisher et al., 1991;
Groneberg et al., 2002). Energy status, as determined by ATP content and by MTT
reduction, has also been used extensively in tissue slices.
Other indicators have also been used to determine specific effects. GSH/GSSG
content has been employed in toxicant models that cause oxidation/reduction (Toutain et
al., 1996; Catania et al., 2001). Protein synthesis has been used in studies to determine
the optimal media conditions. Total CYP levels have been analyzed and induction levels
are similar, though not as robust as in whole animal studies (Lake et al., 1996; Lake et
al., 1997; Renwick et al., 2000; Edwards et al., 2003; Meredith et al., 2003).
The use of spectrophotometric assays is time consuming as compared to
fluorescent studies, where simple lysis of the cells will allow sample determination.
Fluorescence is the emission of light given by the return of the molecule to the ground
state from an excited energy state. The main advantage of fluorescence as compared to
absorption spectroscopy lies in the greater sensitivity since fluorescence has essentially
zero background. This phenomenon can be explained by the excitation requirement for
the molecule; without excitation to a higher energy state, fluorescence will not occur.
32
Plan of Study
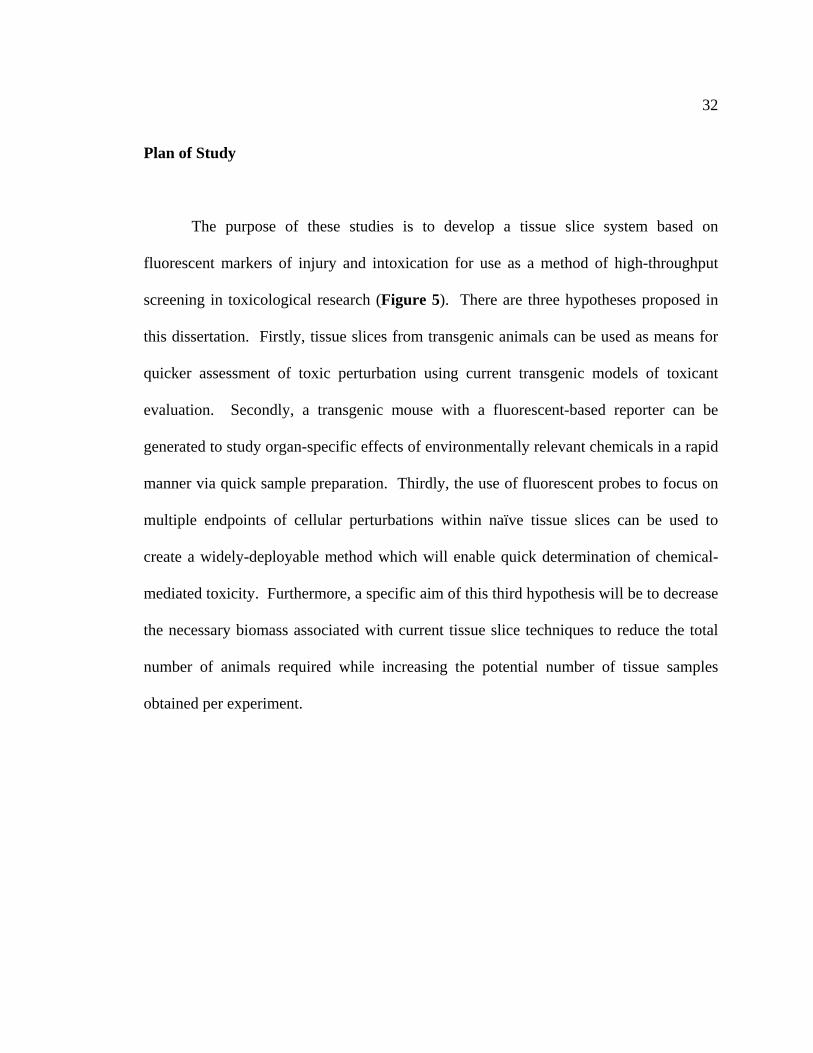
The purpose of these studies is to develop a tissue slice system based on
fluorescent markers of injury and intoxication for use as a method of high-throughput
screening in toxicological research (Figure 5). There are three hypotheses proposed in
this dissertation. Firstly, tissue slices from transgenic animals can be used as means for
quicker assessment of toxic perturbation using current transgenic models of toxicant
evaluation. Secondly, a transgenic mouse with a fluorescent-based reporter can be
generated to study organ-specific effects of environmentally relevant chemicals in a rapid
manner via quick sample preparation. Thirdly, the use of fluorescent probes to focus on
multiple endpoints of cellular perturbations within naïve tissue slices can be used to
create a widely-deployable method which will enable quick determination of chemical-
mediated toxicity. Furthermore, a specific aim of this third hypothesis will be to decrease
the necessary biomass associated with current tissue slice techniques to reduce the total
number of animals required while increasing the potential number of tissue samples
obtained per experiment.

33
Transgenic Mouse
Tissue Slices
Naïve Mouse
Toxicant
Reporter Induction
Tissue Chips
Fluorescent Probe
Fluorescent Product
Transgenic Mouse
Tissue Slices
Naïve Mouse
Toxicant
Reporter Induction
Tissue Chips
Fluorescent Probe
Fluorescent Product
1 2 3
Figure 5: Diagrammatic Scheme of Plan of Study. In solid lines, proposed studies using tissue slices generated from transgenic mice as a screening system (Proposed Studies 1 and 2). Proposed Study 1 will determine if tissue slices from transgenic mice with enzyme-based reporters can be used as an in vitro toxicant screening system. Proposed Study 2 will make use of transgenic mice with fluorescent reporter protein to determine if this method can be used as a more rapid screen as compared to Proposed Study 1. In dashed lines, proposed tissue slice studies from naïve mice with the addition of fluorescent probes as a mechanism for toxicant evaluation (Proposed Study 3).

34
CHAPTER 2: TISSUE SLICES FROM TRANSGENIC ANIMALS
Purpose
The hypothesis of these studies is tissue slices from transgenic mice can be
used as a tool for rapid detection of toxicant perturbation. Multiple strains of mice
will be tested for the purpose of determining if promoter-gene targets remain functional,
thus demonstrating induction of the product gene1.
Section 2.1: Background
The advent of techniques to specifically alter the genome of a cell led to the
production of cellular systems with either an enhanced or absent gene. These cellular
systems have been used to examine the effect of an altered gene system on recognition
and susceptibility to toxicants (Wolf and Henderson, 1998). This ability to modify
genomes has also been used to prepare genetically altered animals; that is the addition or
modification of a gene (transgenic animal) or the deletion of a gene (“knockout” animal).
Transgenic animals have been used to profile toxicants (Pineau et al., 1998), however
these in vivo studies do not provide a savings in the number of animals required to
perform toxicity studies. This approach is to use the genetically altered tissues from
transgenic animals to perform rapid evaluations of the toxic potential of chemicals.
1Published as “Precision-cut Tissue Slices from Transgenic Mice as an In Vitro Toxicology System.” Toxicol In Vitro. April, 2003.

35
Using transgenic animals with specific promoter regions encoding for biomarkers
coupled to reporter genes as the source of tissue allows for an easily detectable signal for
toxic insult, which can readily be measured by in vitro methods.
Two strains were chosen to demonstrate that tissue slices prepared from the livers
and kidneys of transgenic animals remain viable throughout the incubation. The CYP
1A1 transgenic mice contain an 8.5kb fragment of the rat CYP 1A1 gene sequence,
including the promoting region, coupled to a β-gal reporter gene (Campbell et al., 1996)
(Figure 6). The construct design of the AP-1/luciferase transgenic mice couples two
forward and two backward AP-1 binding sites to the luciferase reporter (Rincon and
Flavell, 1994) (Figure 7). Additionally, to demonstrate that the enzymatic activity of the
reporter genes in the slices could be detected, slices from transgenic animals were
challenged with chemicals that stimulate the CYP 1A1 or AP-1 genes.
The CYP 1A1 is a well-characterized gene that has been extensively studied. In
the case of the CYP 1A1, β-napthoflavone (BNF) binds to the aryl hydrocarbon receptor
(AhR) and becomes activated. AhR is then dimerized with the aryl hydrocarbon receptor
nuclear translocator (ARNT) and translocated to the nucleus. The heterodimer complex
then binds to the DNA at known sites (termed dioxin responsive elements) and initiates
transcription of the gene (Ma, 2001). The AP-1 system is slightly different. PMA
(phorbol myristate acetate), a phorbol ester, is a potent activator of protein kinase C
(PKC). PKC then activates a number of proteins, two of which are c-fos and c-jun,
components of the AP-1 protein. The AP-1 protein then binds to phorbol ester
responsive sites in the nucleus to promote transcription of these sites (Naor et al., 1998).

36
Promoter Region Ex. 1 Intron 1 β−galactosidaseEx. 2
β-gal Substrate+ Product
Promoter Region Ex. 1 Intron 1 β−galactosidaseEx. 2
β-gal Substrate+ Product
Figure 6: Detail of the CYP 1A1:β-Galactosidase Transgene. The rat CYP 1A1 promoting region and portions of exons 1 and 2, with intron 1 were coupled to the β-gal reporter gene (Campbell et al., 1996). The diagram below displays this enzyme-based reporter protein incubated with substrate to produce a spectrophotometric product.

37
Luciferase2x TRE2x TRE
LuciferinLuc Luminescence
Luciferase2x TRE2x TRE 2x TRE2x TRE
LuciferinLuc Luminescence
Figure 7: Detail of the AP-1:Luciferase Transgene. Two forward and backward TRE repeats were cloned into the promoter for the luciferase gene (Rincon and Flavell, 1994). Binding of the AP-1 protein to this region will transcribe the luciferase reporter protein. The schematic below shows the reaction between luciferase and luciferin. When luciferin is cleaved by the luciferase gene product, luminescence occurs and a response is detected.

38
In these studies, doses of PMA and BNF were used based upon previous literature.
Section 2.1.1: Methods
Materials
All materials were purchased from Sigma-Aldrich (St. Louis, MO) unless
otherwise indicated. All appropriate safety precautions and disposal procedures were
followed as mandated by the University of Arizona Department of Risk Management and
Safety.
Animals
CYP 1A1/β-galactosidase transgenic mice were obtained from the University of
Dundee, courtesy of Dr. C. J. Henderson. The AP-1/luciferase transgenic mice were
obtained from the University of Arizona, courtesy of Dr. G. Timothy Bowden. The AP-
1/luciferase transgene was bred into an outbred strain of CD-1 mice for five generations
at the University of Arizona. Transgenic mice were housed in the Animal Care Facility
at the University of Arizona College of Medicine. CD-1 mice were obtained from Harlan
Sprague-Dawley (Indianapolis, IN). Mice were anesthetized and killed by cervical
dislocation.
Tissue Slice Generation

39
Tissues were excised from mice, and immediately placed into oxygenated Krebs-
bicarbonate slicing buffer (pH 7.4, 4oC, 95:5 O2:CO2). Livers obtained from the AP-
1/luciferase mice, as well as control CD-1 mice, were chilled for 10 min at 2o C before
coring the tissue with an 8-mm tissue punch. Liver cores were then placed into an 8-mm
insert and sliced as described below. Kidneys were removed decapsulated, and placed
directly into the tissue slicer using a 5-mm insert. Tissue slices (250 µm thick) were
generated with a Brendel/Vitron tissue slicer (Vitron, Tucson, AZ). From a single
mouse, approximately 20-30 liver slices could be prepared. Slices were placed onto
titanium mesh rollers, into scintillation vials containing 1.7 ml of Dulbecco’s Modified
Eagle Medium/F-12 (2.24 g/l sodium bicarbonate, 50 µg/ml gentamicin) and allowed to
pre-incubate for 1 hr in 95:5 O2:CO2 at 37oC to allow sloughing of cells damaged during
slice preparation. Slices were then dosed with the respective compound following the
preincubation period. Test compounds were added to the media and allowed to incubate
for various time courses.
K+/DNA
Slices were collected at the assigned time points by placing them in 1 ml ddH2O.
To disrupt the tissue, slices were sonicated for 10 sec using a Kontes Micro Ultrasonic
Cell Disrupter (Vineland, NJ) at power level 8. Slice homogenate (400 µl), or chip
homogenate (800 µl) was added to a 10 mm x 100 mm plastic tube. To this, 50 µl bovine
serum albumin (5 mg/ml) and 20 µl concentrated perchloric acid were added. Tubes were
briefly vortexed and centrifuged at 3,000 rpm in swinging bucket centrifuge (RT6000
40
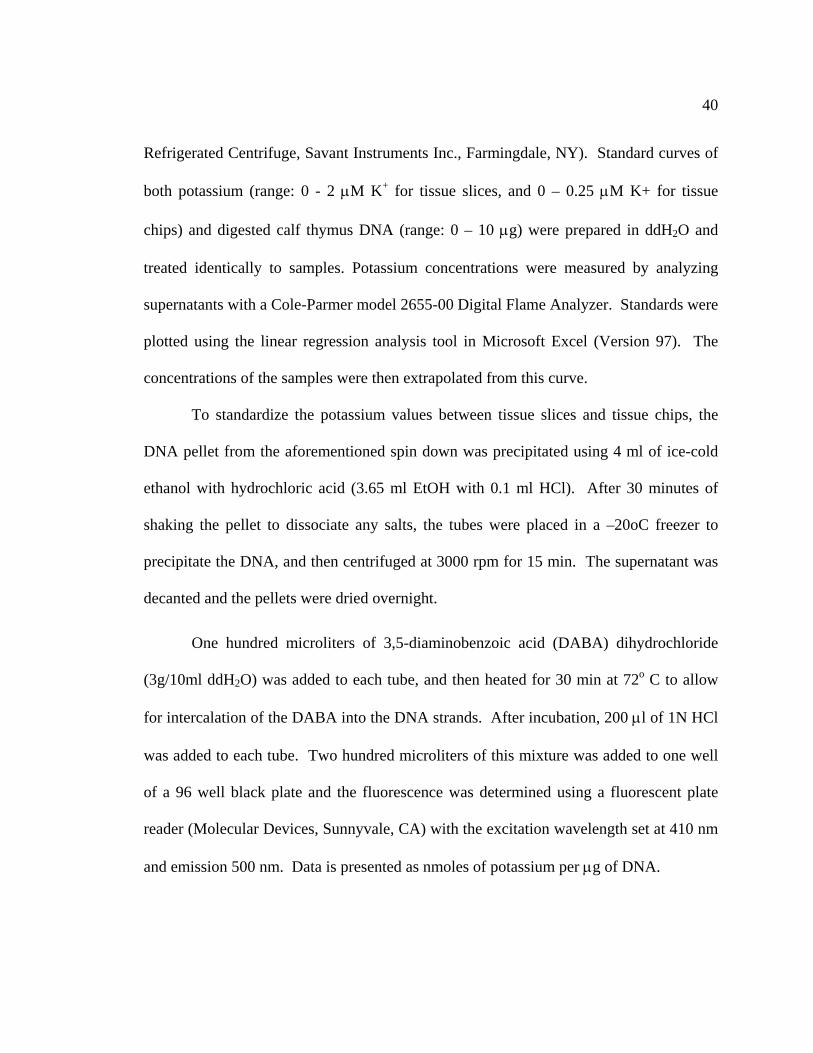
Refrigerated Centrifuge, Savant Instruments Inc., Farmingdale, NY). Standard curves of
both potassium (range: 0 - 2 µM K+ for tissue slices, and 0 – 0.25 µM K+ for tissue
chips) and digested calf thymus DNA (range: 0 – 10 µg) were prepared in ddH2O and
treated identically to samples. Potassium concentrations were measured by analyzing
supernatants with a Cole-Parmer model 2655-00 Digital Flame Analyzer. Standards were
plotted using the linear regression analysis tool in Microsoft Excel (Version 97). The
concentrations of the samples were then extrapolated from this curve.
To standardize the potassium values between tissue slices and tissue chips, the
DNA pellet from the aforementioned spin down was precipitated using 4 ml of ice-cold
ethanol with hydrochloric acid (3.65 ml EtOH with 0.1 ml HCl). After 30 minutes of
shaking the pellet to dissociate any salts, the tubes were placed in a –20oC freezer to
precipitate the DNA, and then centrifuged at 3000 rpm for 15 min. The supernatant was
decanted and the pellets were dried overnight.
One hundred microliters of 3,5-diaminobenzoic acid (DABA) dihydrochloride
(3g/10ml ddH2O) was added to each tube, and then heated for 30 min at 72o C to allow
for intercalation of the DABA into the DNA strands. After incubation, 200 µl of 1N HCl
was added to each tube. Two hundred microliters of this mixture was added to one well
of a 96 well black plate and the fluorescence was determined using a fluorescent plate
reader (Molecular Devices, Sunnyvale, CA) with the excitation wavelength set at 410 nm
and emission 500 nm. Data is presented as nmoles of potassium per µg of DNA.

41
LDH
LDH catalyzes the oxidation of lactate to pyruvate concomitant with reduction of
nicotinamide adenine dinucleotide (NAD) to NADH. The formation of NADH increases
Abs340, and the rate of increase is directly proportional to LDH activity in the sample.
Media from each scintillation vial is collected and 20 µl to 50 µl of each is added with
200 µl of LD-L reagent (Sigma) in a 96 well plate. The reaction is monitored over a 5
minute period with readings taken at 1 minute intervals at a wavelength of 340 nm. The
difference between each 1 minute reading is calculated and averaged over the entire 5
minutes. The formula for calculating LDH activity is:
LDH Activity (U/L) = [Change in Abs340/min x TV x 1000] / [6.22 x SV]
TV = total volume in cuvette (ml)
SV = volume of the sample (ml)
The LDH activity is standardized to the DNA values for all samples within the same
scintillation vial.
β-galactosidase Activity
β-galactosidase activity was quantitated using Promega’s β-galactosidase Assay
System (Madison, WI) and a microtiter plate spectrophotometer. Precision-cut tissue
slices were homogenized in 400 µl of reporter lysis buffer. Fifty µl of the homogenate

42
and 50 µl of Promega concentrated (2x) assay buffer was added to the wells of a
microtiter plate and incubated at 37oC for 30 min. The reaction was terminated with the
addition of 150 µl of 1 M sodium carbonate and analyzed at 405 nm (Skatron, Inc.,
Sterling, VA) for total activity (Sambrook and Gething, 1989). Measurements were
standardized to total protein content as determined by the bicinchoninic acid method
(Sigma Chemical Co., St. Louis, MO).
Luciferase Activity
Precision-cut tissue slices were snap-frozen and stored overnight at –70oC. Slices
were homogenized in 400 µl of reporter lysis buffer (Promega, Madison, WI), incubated
at room temperature for 30 min, and then centrifuged for 10 min at 13,000 rpm. The total
supernatant was analyzed for luciferase activity using luciferase reagent (Promega,
Madison, WI) and measured in a luminometer (BioOrbit, Torku, Finland), as previously
described (Rincon and Flavell, 1994), and normalized to total protein content.
Section 2.2: Viability Studies
Section 2.2.1: Rationale
While a large number of studies have shown that tissue slices can be produced
from multiple tissues, no studies have shown that tissue slices from transgenic mice could
be used for toxicity studies. In order to determine if this procedure is a viable prospect,

43
viability assays using tissue slices from these animals were needed. The goal of these
studies is to determine if tissues from these animals can be used in in vitro assays. To
demonstrate the validity of this approach, two strains of existing transgenic mice, CYP
1A1/β-gal and AP-1/luciferase mice were acquired.
Section 2.2.2: Results
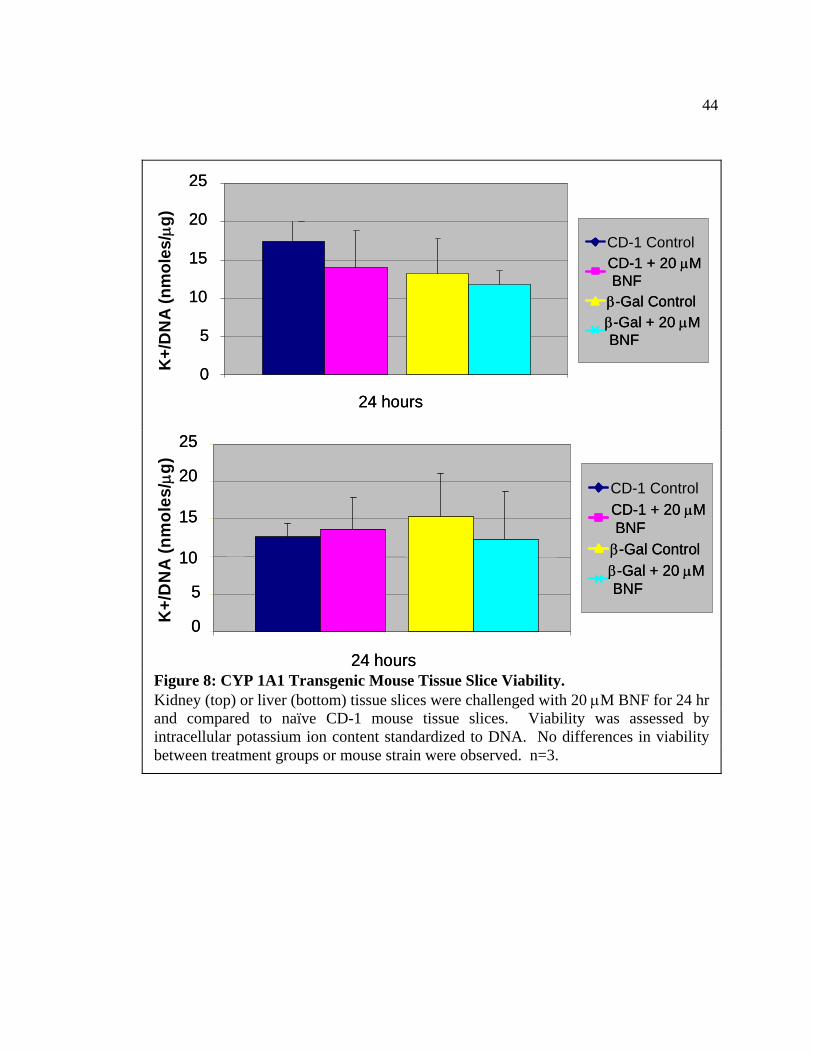
CYP 1A1/β-gal Transgenic Mice
In this model, precision-cut kidney and liver slices from the CYP 1A1/β-gal mice
were exposed to 20 µM of the aryl hydrocarbon, BNF, for 24 hr (Matsuda et al., 1995).
Transgenic mouse slices were compared to CD-1 mouse tissue slices as controls for the
slicing/incubation procedure. Livers and kidneys from these mice were easily cored and
sliced by standard techniques (Hoivik et al., 1996). Slice viability was maintained from
both transgenic and non-transgenic tissues throughout the time course of 24 hr (Figure
8).
LDH studies were also performed to ascertain if an increased leakage of this
enzyme was present in these transgenic tissues as compared to naïve mouse tissues. No
significant increases in LDH leakage were observed in treated versus control tissue slices
(Figure 9).
AP-1/luciferase Transgenic Mice
44
0
5
10
15
20
25
24 hours
0
5
10
15
20
25
24 hours
CD-1 ControlCD-1 + 20 µMBNF
β-Gal Controlβ-Gal + 20 µMBNF
CD-1 ControlCD-1 + 20 µMBNF
CD-1 + 20 µMBNF
β-Gal Controlβ-Gal Controlβ-Gal + 20 µMBNF
β-Gal + 20 µMBNF
K+/
DN
A (n
mol
es/µ
g)
CD-1 ControlCD-1 + 20 µMBNF
β-Gal Controlβ-Gal + 20 µMBNF
CD-1 ControlCD-1 + 20 µMBNF
CD-1 + 20 µMBNF
β-Gal Controlβ-Gal Controlβ-Gal + 20 µMBNF
β-Gal + 20 µMBNF
K+/
DN
A (n
mol
es/µ
g)
0
5
10
15
20
25
24 hours
0
5
10
15
20
25
24 hours Figure 8: CYP 1A1 Transgenic Mouse Tissue Slice Viability. Kidney (top) or liver (bottom) tissue slices were challenged with 20 µM BNF for 24 hr and compared to naïve CD-1 mouse tissue slices. Viability was assessed by intracellular potassium ion content standardized to DNA. No differences in viability between treatment groups or mouse strain were observed. n=3.

45
0
1
2
3
4
5
6
7
0 24 (control) 24 (treated)
Time (hr)
LDH
(U/L
/ug
DNA
)
AP-1CD-1
0
2
4
6
8
10
12
14
16
18
0 24 (control) 24 (treated)
LDH (U/L/ug DNA)
Tim
e (h
r)
AP-1CD-1
Figure 9: LDH Release from CYP 1A1 Transgenic Mouse Tissue Slices. Release of LDH from kidney (top) and liver (bottom) slices incubated for 24 hr with (treated) or without (control) the addition of 20 µM BNF to the incubation media. The transgenic strain (CYP 1A1) was compared to naïve mice (CD-1). Total LDH activity was standardized to DNA content. n=4.

46
Precision-cut liver and kidney slices generated from these animals were treated
with 9 µM phorbol myristate acetate (PMA), a well-characterized inducer of AP-1
activity (Angel et al., 1987). The livers from this strain were much softer than normal
and had to be chilled at 2o C for 10 min to make the tissue rigid enough to obtain
consistent tissue cores. In these experiments, precision-cut tissue slices from transgenic
animals were again compared to CD-1 mice tissue slices. Viability, as assessed by
intracellular ion content, remains comparable not only between treated and control slices,
but also to CD-1 mouse tissue slices (Figure 10).
In order to further demonstrate the viability of these transgenic tissue slices, LDH
studies were also performed on this strain of mice. There were no differences observed
between the treated and control groups (Figure 11).
Section 2.2.3: Section Summary
The purpose of these studies was proof of principal that tissue slices from
transgenic mice could be used for in vitro studies. Both strains of transgenic mice could
be used as per the standard tissue slice procedure. Interestingly, the AP-1/luciferase
transgenic strain appeared to have more fat content within the liver tissue. In order to
core this tissue effectively, the livers from these mice had to be chilled to 2o C for
consistent cores to be produced.

47
0
5
10
15
20
0 2 40
5
10
15
20
0 2 4
Time (hours)
K+/
DN
A (n
mol
es/µ
g) CD-1ControlCD-1 +9 µM TPAAP-1ControlAP-1 + 9 µM TPA
CD-1ControlCD-1 +9 µM TPAAP-1ControlAP-1 + 9 µM TPA
CD-1ControlCD-1ControlCD-1ControlCD-1 +9 µM TPACD-1 +9 µM TPACD-1 +9 µM TPAAP-1ControlAP-1ControlAP-1ControlAP-1 + 9 µM TPAAP-1 + 9 µM TPAAP-1 + 9 µM TPA
Time (hours)
K+/
DN
A (n
mol
es/µ
g) CD-1ControlCD-1 +9 µM TPAAP-1ControlAP-1 + 9 µM TPA
CD-1ControlCD-1 +9 µM TPAAP-1ControlAP-1 + 9 µM TPA
CD-1ControlCD-1ControlCD-1ControlCD-1 +9 µM TPACD-1 +9 µM TPACD-1 +9 µM TPAAP-1ControlAP-1ControlAP-1ControlAP-1 + 9 µM TPAAP-1 + 9 µM TPAAP-1 + 9 µM TPA
0
10
20
30
40
50
0 2 40
10
20
30
40
50
0 2 4
Figure 10: AP-1 Transgenic Mouse Tissue Slice Viability. Kidney (top) and liver (bottom) tissue slices were challenged with 9 µM tetraphorbol acetate (TPA) for 2 or 4 hr and compared to naïve CD-1 mouse tissue slices. Viability was assessed by intracellular potassium ion content standardized to DNA. No differences in viability between treatment groups or mouse strain were observed. n=3.

48
0
1
2
3
4
5
6
7
8
9
0 2 (control) 2 (treated) 4 (control) 4 (treated)
Time (hr)
LDH
(U/L
/ug
DNA)
AP-1CD-1
0
5
10
15
20
25
30
0 2 (control) 2 (treated) 4 (control) 4 (treated)
Time (hr)
LDH
(U/L
/ug
DNA)
AP-1CD-1
Figure 11: LDH Release from AP-1 Transgenic Mouse Tissue Slices. Release of LDH from kidney (top) and liver (bottom) slices incubated for 2 or 4 hr with (treated) or without (control) the addition of 9 µM TPA to the incubation media. The transgenic strain (AP-1) was compared to naïve mice (CD-1). Total LDH activity was standardized to DNA content. n=4.

49
Section 2.3: Promoter Gene Induction
Section 2.3.1: Rationale
The premise of these studies is to determine if transgenic tissue slices can be used
for reporter gene induction studies. Induction of the reporter gene has been demonstrated
with in vivo studies, but not in naïve transgenic tissue slices as an in vitro method. This
hypothesis will be tested using novel gene inducers for each respective strain of
transgenic mice.
Section 2.3.2: Results
CYP 1A1/β-gal Transgenic Mice
Studies to verify the induction of the promoter gene in vitro were performed using
tissues from this transgenic strain. Using a commercially available spectrophotometric
enzyme kit, β-gal activity from the reporter gene was detected in slice homogenates.
Levels of β-gal in BNF-treated precision-cut kidney slices were not greatly induced
compared to the untreated slices (about 3-fold), whereas BNF-exposed liver slices exhibit
a 30-fold increase (Figure 12).
AP-1/luciferase Transgenic Mice
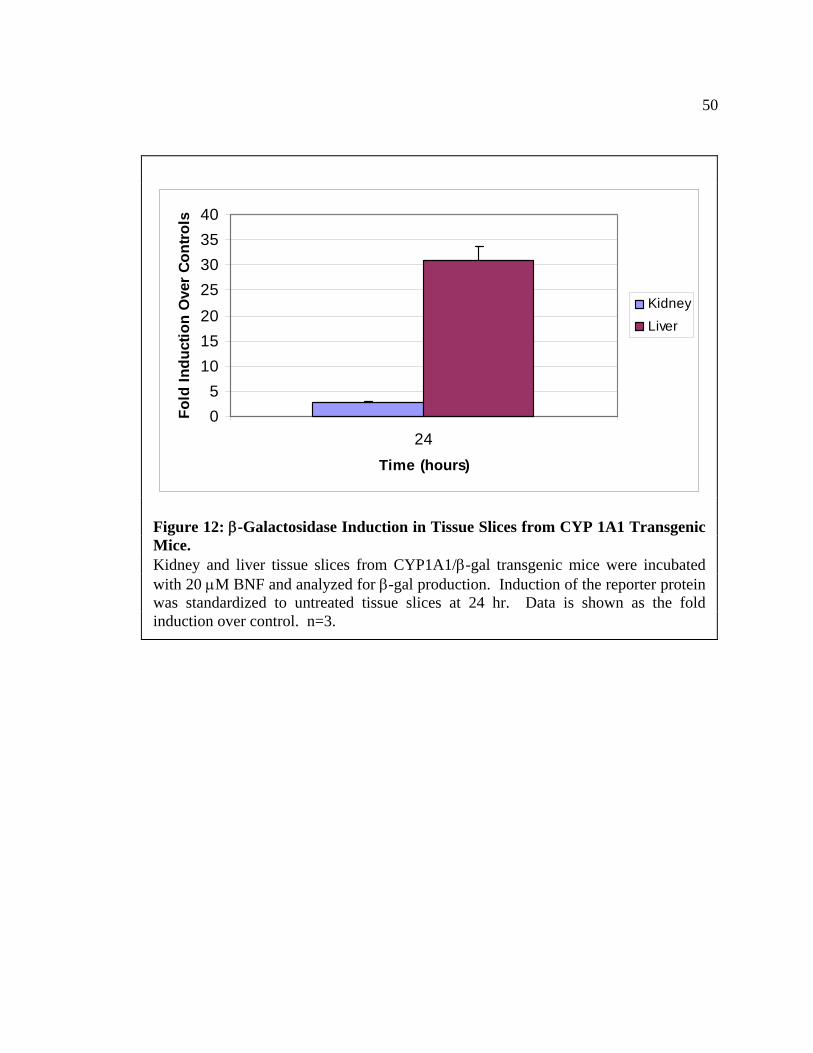
50
05
10152025303540
24Time (hours)
Fold
Indu
ctio
n O
ver
Cont
rols
Kidney
Liver
Figure 12: β-Galactosidase Induction in Tissue Slices from CYP 1A1 Transgenic Mice. Kidney and liver tissue slices from CYP1A1/β-gal transgenic mice were incubated with 20 µM BNF and analyzed for β-gal production. Induction of the reporter protein was standardized to untreated tissue slices at 24 hr. Data is shown as the fold induction over control. n=3.
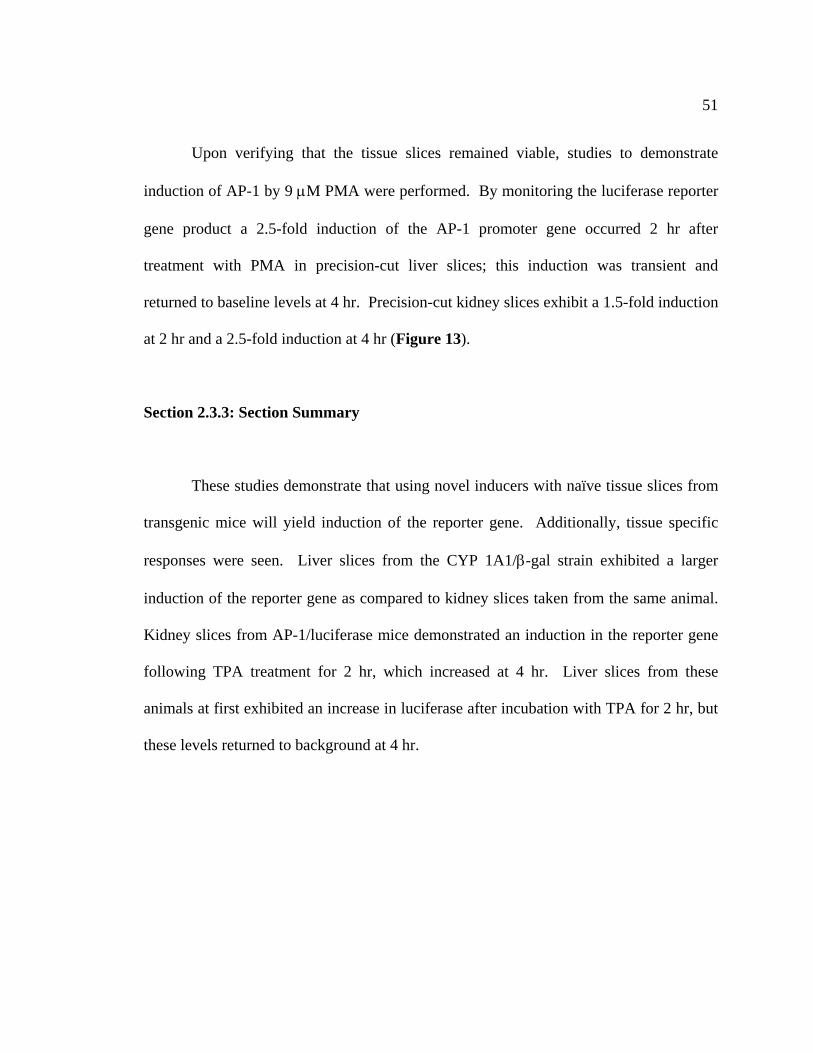
51
Upon verifying that the tissue slices remained viable, studies to demonstrate
induction of AP-1 by 9 µM PMA were performed. By monitoring the luciferase reporter
gene product a 2.5-fold induction of the AP-1 promoter gene occurred 2 hr after
treatment with PMA in precision-cut liver slices; this induction was transient and
returned to baseline levels at 4 hr. Precision-cut kidney slices exhibit a 1.5-fold induction
at 2 hr and a 2.5-fold induction at 4 hr (Figure 13).
Section 2.3.3: Section Summary
These studies demonstrate that using novel inducers with naïve tissue slices from
transgenic mice will yield induction of the reporter gene. Additionally, tissue specific
responses were seen. Liver slices from the CYP 1A1/β-gal strain exhibited a larger
induction of the reporter gene as compared to kidney slices taken from the same animal.
Kidney slices from AP-1/luciferase mice demonstrated an induction in the reporter gene
following TPA treatment for 2 hr, which increased at 4 hr. Liver slices from these
animals at first exhibited an increase in luciferase after incubation with TPA for 2 hr, but
these levels returned to background at 4 hr.

52
0.00
0.50
1.00
1.50
2.00
2.50
3.00
3.50
4.00
2 4
Ti me ( hr )
Fold
Indu
ctio
nO
ver C
ontr
ol
KidneyLiver
Figure 13: Luciferase Induction in Tissue Slices from AP-1 Transgenic Mice. Kidney and liver tissue slices from AP-1/Luciferase transgenic mice were incubated with 9 µM phorbol myristate acetate and analyzed for luciferase induction. Induction of the reporter protein was standardized to untreated tissue slices at 2 or 4 hr. Data is shown as the fold induction over control. n=3.

53
Section 2.4: Summary
Previous work has demonstrated that precision-cut tissue slices from multiple
species are responsive to inducers of both CYP 1A1 and AP-1 (Parrish et al., 1999),
which prompted the use transgenic animals with these promoter elements in these initial
studies. The results from these studies with slices from transgenic mice are very
promising. First, slices could be prepared from transgenic animals. Although one might
assume that transgenic animals should have tissue that behaves similar to tissue from
control animals, this may not be the case. Normally, the livers can be cored and sliced
immediately. However, livers from the AP-1/luciferase mice were much softer than
normal and had to be cooled at 2o C for 10 min before coring. Second, the slices from the
transgenic animals incubated well and maintained their viability throughout the term of
the study. Lastly, and most importantly, the inserted genes in the slices from the
transgenic animals could be stimulated by classic inducers and the associated reported
gene produced its protein product (an enzyme) that could be measured.
The CYP 1A1/β-gal transgenic mice strain have an 8.5 kb fragment of the 5’-
promoter region, transcriptional start site, and exons 1 and 2 of the rat CYP 1A1 coupled
to the β-gal reporter (Campbell et al., 1996). In previous in vivo studies by this group it
was shown that 3-methylcholanthrene exposure produced a greater than 1,000-fold
increase in the β-gal activity after 48 hr. The promoting region of CYP 1A1 is
evolutionarily conserved, and this gene is highly inducible upon exposure to aryl
54
hydrocarbons (Muller et al., 1996; Zhang et al., 1997; Kuhn et al., 1998). Experiments
with tissue slices generated from these transgenic mice found them to remain viable for
the 24 hr time course. Treatment of these slices with a known inducer of CYP 1A1,
BNF, produced multi-fold increases in the product of the reporter gene (β-gal) which
reflects the stimulation of the CYP 1A1 by the inducer. Although BNF has demonstrated
huge increases in CYP 1A1 production in other models, precision-cut tissue slices have
been previously reported to have a decreased capacity for CYP induction (Brandon et al.,
2003). However, the data presented here provide a novel approach towards solving this
problem. Using promoters coupled to reporter genes may be a new approach to better
understand the ability of the molecular machinery within the tissue slices to induce gene
targets.
Typical studies have determined the level of induction with BNF to be almost
1000-fold in vivo and about 150-fold over control values in tissue slices, when analyzed
by real time PCR (Martignoni et al., 2005). Another study determined the induction
levels of CYP 1A1 in rat liver slices to be approximately the same found in these studies
(Meredith et al., 2003). The discrepancy between the tissue slice data and in vivo studies
can be summed by the fact that the cellular machinery contained within the tissue slices is
not able to reflect the entire organ model of in vivo studies. Cross-talk between cells of
the liver is known to occur through the gap junctions between the hepatocytes (Romualdi
et al., 2002). Additional studies with induction of liver enzymes and tissue slices have
been demonstrated in tissue slices taken from pretreated animals (Wueweera et al., 1996).
The original studies with the CYP 1A1 mice demonstrated specific organ induction of the

55
β-gal reporter, which exhibited a 1000 fold increase in β-gal levels following treatment
with 3-methylcholanthrene (Campbell et al., 1996). While this level of induction was not
seen in precision-cut liver and kidney tissue slices taken from these animals, these are the
first studies that have demonstrated the use of tissue slices with transgenic animals.
Studies using tissue slices taken from the liver and kidneys of AP-1/luciferase
transgenic mice show them to remain viable over the selected time course, up to 4 hr.
When the slices were exposed to PMA the promoter gene (AP-1) was stimulated, as
reflected by the enhancement of the reporter gene and its protein product (luciferase).
Angel et. al. (Angel et al., 1987) demonstrated that treatment with PMA for 1 hr in
HepG2 cells causes a rapid increase (3-4 fold) in TRE sequence binding. Additionally,
Zhong et. al. (Zhong et al., 2001b) used neonates from this same strain of transgenic mice
and have shown that 1 day after birth the relative levels of luciferase induction is higher
in the kidney than in the liver, a result that was also similar to these studies (higher
luciferase levels at 4 hr in kidney compared to liver). In a separate study varying the
method of PMA application, Zhong (Zhong et al., 2001a) also demonstrated that
luciferase levels in the liver did not increase after 12 h, whereas a small induction of the
luciferase reporter was seen in the kidney.
Turney et al. (Turney et al., 1999) have shown that c-jun, a component of the AP-
1 pathway is activated (up at 2 hr, levels remain at 4 hr) in rabbit renal cortical slices after
dosing with mercury, a result that is similar to the induction seen here of AP-1 transgenic
kidney slices treated with PMA (increase in luciferase activity at 2 hr, sustained at 4 hr).
56
While two strains of mice demonstrated induction of the reporter gene, two other
strains studied yielded no significant results (Appendix A). One such strain was the
UbC/GFP transgenic mice created for the purpose of looking at specific responses in the
brains of these mice exposed to tin. Although the transgene was detected in all tissues,
the levels of GFP in each tissue were entirely different. A second strain, one which
couples three ERE to β-gal was also attempted. In these studies, no increases in the
production of β-gal were seen after estrogen treatment.
These two strains provided puzzling results for long term studies as to the use of
precision-cut tissue slices taken from transgenic animals. However, since both strains of
mice were shown to have the transgene present in all tissues, the results remain
enigmatical. Although the transgene is present in all tissues, induction of the reporter
protein was not seen; a finding that lends credence to observations which have shown that
specific elements in the promoter of these genes is important and necessary for protein
production within a given tissue.
This study demonstrates the success of this approach for examining toxicants in
slices from transgenic animals, while correlating reporter induction to previous studies.
These studies validate the use of tissues slices generated from transgenic animals as an in
vitro toxicological tool. Finally, the importance of this work lies with the use of
precision-cut tissue slices. This in vitro tool allows the use of multiple organs from one
animal to be used simultaneously, while maintaining the normal cellular heterogeneity
and architecture. These features are not possible with the use of primary cell cultures or
other in vitro systems. The studies presented here are based solely upon the detection of

57
the reporter protein in precision-cut tissue slice lysates. However, tissue slices could be
incubated with compounds and subsequently stained for reporter protein to visualize the
reporter within the context of the tissue for determination of site- or cell-specific
responses.
58
CHAPTER 3: PRODUCTION OF AN ESTROGEN RESPONSIVE TRANSGENIC MOUSE
Purpose
The hypothesis of these studies is to produce tissue slices from a custom
transgenic mouse with a fluorescent reporter for utilization as a high-throughput in
vitro toxicity screen. The benefit of using a fluorescent-based reporter is the ability to
detect induction without complex sample preparation. Additionally, this could aid in
live-time cellular fluorescence to further elucidate which specific cellular populations are
affected in various organs.
Section 3.1: Background
Tissue slices from transgenic mice can aid in the development of more specific
toxicology screens. By combining the power of these technologies with the use of
fluorescent reporters coupled to a given target gene, the ability to rapidly detect insult,
with the potential of live time imagery can be realized. Studies from the previous section
had demonstrated tissue sliced from transgenic mice could be used in toxicity studies
(Catania et al., 2003). These studies used genes coupled to reporter constructs for the
purpose of utilizing gene induction techniques; that is, showing that known genes can
respond in a tissue specific manner.
Increased awareness of xenoestrogens has created a need to screen compounds
that can affect endocrine function, leading to endocrine disruption. A number of

59
compounds released into the environment can modulate hormone functions (Safe, 2000;
Safe, 2004). Xenoestrogens and aromatic hydrocarbons elicit multiple effects including
carcinogenesis, teratogenesis, and reproductive disorders through a variety of known
mechanisms (Nebert et al., 1993). Although estrogens have been traditionally connected
with female reproduction, the importance of these hormones in the male reproductive
system and non-reproductive processes such as cardiovascular health and bone formation
has also been established (Meinhardt and Mullis, 2002).
Estrogen binds to the estrogen receptor (ER) in a ligand dependent manner, and
cytosolic ER dimers bind to estrogen response elements (EREs) to initiate or inhibit
transcription (Klein-Hitpass et al., 1988; Kumar and Chambon, 1988; Klein-Hitpass et
al., 1989). Currently, two types of ER have been identified and characterized.
Structurally, ERα and ERβ have a greater than 95% homology in the DNA binding
domain, but only 55% homology in the ligand binding domain, suggesting altered
modulation of estrogen responsiveness between the two isoforms (Paech et al., 1997;
Loven et al., 2001). ERα is non-discrete in tissue distribution whereas ERβ is primarily
distributed in endocrine responsive tissues such as the prostate and ovary (Kuiper et al.,
1997).
Activation of the estrogen receptor occurs when estrogen binds to the receptor.
Normally sequestered in the cytosol by heat shock protein 90, the receptor undergoes a
conformational change that disrupts the interaction with hsp90 (Caruso et al., 1999). The
receptor then hetero- or homodimerizes with another activated estrogen receptor and they
are translocated to the nucleus. Additionally, ER can act with membrane-bound proteins

60
such as phosphinositol 3-OH kinase to exert “non-genomic” effects which do not rely on
the ER binding to a DNA target sequence (Simoncini et al., 2002). Once inside the
nucleus, the heterodimer binds to specific hormone elements termed estrogen response
elements (ERE). These palindromic sequences, found in a large number of gene targets,
confer the specificity of binding to the heterodimer.
The Xenopus vitellogenin A2 ERE is the prototypical ERE and is the consensus
sequence for all other known EREs (Hayward et al., 1982b; Hayward et al., 1982a;
Perlman et al., 1984; Klein-Hitpass et al., 1986; Dobbeling et al., 1988; Scott et al.,
1997). The promoting region of this gene contains a consensus ERE and two imperfect
EREs. Imperfect EREs can act synergistically to exhibit estrogen inducibility (Chang et
al., 1992), and differ from “perfect” EREs by one or more nucleotides. Numerous studies
have compared the transcriptional activation caused by various EREs (Sathya et al.,
1997; Scott et al., 1997; Driscoll et al., 1998; Wood et al., 1998; Klinge, 1999). Figure
14 is a representative schematic of the studies undertaken within this section.
Section 3.1.1: Methods
Materials
All materials were purchased from Sigma-Aldrich (St. Louis, MO) unless
otherwise indicated. All appropriate safety precautions and disposal procedures were
followed as mandated by the University of Arizona Department of Risk Management and
Safety.

61
AimsTarget Gene Promoter ReporterPromoter ReporterPromoter Reporter
Verification ofSequence
Verification ofSequence
Dose cells
Response
Dose cells
Response
Optimization of ConstructOptimization of ConstructMicro-
injectionMicro-
injection
Implantation Breed TissueTissue SlicesSlices Response
Dose withcompounds
Response
Dose withcompounds
Transfect CellsTransfect Cells
Figure 14: Diagrammatic Representation of the Production of Transgenic Mice. An identified target gene can be coupled to a reporter protein to aid in the determination of gene function. Cell culture work must first be performed to ascertain if the reporter protein is induced. After optimization of the transgene, the sequence is micro-injected using pronuclear injection. Positive mice are then bred and tissues from subsequent generations of these mice can be used for tissue slice generation.

62
Cell Culture
MB-MDA-237 and MCF-7 breast cancer cells were purchased from the Arizona
Cancer Center Cell Culture Facility. Both cell types were grown in Waymouth’s media
supplemented with 10% FBS and 1% antibiotic/antimycotic (Invitrogen, Carlsbad, CA).
Western Blotting
Sodium-dodecyl sulfate-polyacrylamide gel electrophoresis was used for
separation and analysis of samples by western blotting. SDS-PAGE gels were prepared
with a 1.5 cm stacking gel (250 mM Tris pH 6.8, 0.1% SDS, 0.1% ammonium persulfate,
5.2% acrylamide) on top of a separating gel (375 mM Tris pH 8.8, 0.1% SDS, 0.1%
ammonium persulfate, 5%-15% acrylamide (w/v)). All gels were prepared and run using
the Mini-Protean II system (BioRad, Hercules, CA). Proteins were separated at 65 V for
2-4 hr.
For western blots, MDA-MB 231 and MCF-7 cells were rinsed once with cold
PBS and immediately scraped into lysis buffer (10 mM Tris pH 7.4, 1% NP-40, 10 µg/ml
aprotinin 10 µg/ml leupeptin, 10 µg/ml soybean trypsin inhibitor, 1 mM PMSF). Protein
concentrations were determined using the BCA assay. Proteins were diluted 1:1 in SDS-
PAGE sample buffer (105 mM Tris pH 6.8, 4% SDS, 20% glycerol, 0.2% bromophenol
blue, 2% β-mercaptoethanol) and denatured by boiling for 5 min. For each sample,
protein was separated by SDS-PAGE as described above, and transferred to PVDF

63
membrane (Millipore, Bedford, MA). Blocking of the membrane took place overnight
with 10% milk in TBST. The estrogen receptor α (sc-7207) antibody was purchased
from Santa Cruz Biotechnologies (Santa Cruz, CA) and used in a 1:500 dilution in 1%
milk in TBST. Primary was allowed to incubate for 2 hr. The membrane was then
washed 3X in TBST, and blocked again with 10% milk for 15 min. Goat anti-rabbit
secondary (Santa Cruz Biotechnology) was then added at a 1:1000 dilution in 1% milk in
TBST. ECL solution (100 mM Tris pH 8.5, H2O2, luminol, and coumaric acid) was
prepared fresh each use.
Electrophoretic Mobility Shift Assays (EMSA)
Cells were rinsed with 5 ml of ice cold HEGD buffer and scraped into 5 ml of
HEGD, then pelleted by centrifugation (5 min, 1,200 rpm). The supernatant was
aspirated and the cell pellet resuspended in 0.5 ml of ice cold HEGD buffer (plus 0.1
mg/ml PMSF in EtOH), using a glass homogenizer to disrupt the cells (~20-30 strokes).
The homogenate was transferred into a microcentrifuge tube and spun for 15 min at
12,000 rpm. The supernatant was aspirated completely and 500 µl of HEGD was added.
The previous 2 steps were repeated to purify the nuclear isolation. The pellet was then
resuspended in 40 µl of HEGDK buffer and incubated on ice for 1 hr. Samples were then
microfuged at 12,000 rpm for 15 min. Protein concentration was calculated using the
BCA protein determination method. For probe labeling the following mixture was
created for each sample:
Oligonucleotide 8.0 pmol (5 µl)

64
γ32
P[ATP] (6000 Ci/mmol) 10 µl (16.0 pmol)
10X T4 polynucleotide kinase buffer 5 µl
T4 polynucleotide kinase 2 µl
ddH2O 3 µl
The reaction was then incubated for 30 min at 37 oC. The labeled oligonucleotide
was then purified using a G-25 Sephadex column as described in the directions for the
column, and spun for 5 min at maximum speed. To wash the column, 100 µl of ddH2O
was added and then spun again for 5 min at maximum speed. The radiolabelled probe
was then added and spun for 5 min at maximum speed.
The concentration of labeled probe and nuclear extract was calculated based upon
the following consideration to use a total of 5 µl of HEGDK per reaction containing 2.5-5
µg of nuclear protein (i.e. 3.75 µl of extract and 1.25 µl of HEGDK). The sample was
then placed in a new microfuge tube. The reaction mix was prepared so that it contained
1.5 µl of probe, 1.5 µl of dithiothreitol (20 mM), 4 µl glycerol (50%), and 1 µl of
poly(dIdC) (0.25 µg/µl) per reaction for a maximum volume of 15 µl. The remaining
volume was adjusted with 2 µl with ddH2O (or with antibody for super-shifts).
The reaction mix was added to the tubes and incubated for 30 min on ice. For
super-shifts, the antibody was added to the samples for 1-2 hr prior to the addition of the
reaction mix. Two microliters of loading dye was then added. The gel was then

65
electrophoresed at 100 V until completion, placed on blotting paper, dried at 80o C and
exposed to film overnight.
PCR Reactions
The following reaction mixture was used in a final reaction volume of 25 µl: 50
ng DNA in TE buffer (10 mM Tris, pH 8; 1 mM EDTA); 0.3 units of Taq polymerase;
2.5 µl reaction buffer; 1.5 µl of 50 mM MgCl2; 0.2 µl of pre-mixed primer solution; 0.2
µl of dNTPs. Primers were created to flank the multiple cloning site of the pEGFP-N1
vector. Sense primer: GAT AAC CGT ATT ACC GCC AT. Antisense primer: CTC
CTC GCC CTT GCT CAC.
All reactions were carried out on MJ Research Thermal Cycler (San Francisco, CA), with
the following conditions:
Step 1: 95o C melting for 10 min.
Step 2: 95o C melting for 30 sec.
Step 3: 58o C anneal for 45 sec
Step 4: 72o C extend for 30 sec.
Step 5: go to step 2, 34 cycles.
Step 6: 72o C final extension for 10 min.
Step 7: 4o C until removed from thermal cycler.

66
PCR products were separated by agarose gel electrophoresis.
Transgenic Mouse Tail-Typing
A portion (0.7 mm) of the tail was removed from each potential transgenic mouse
and placed in a microfuge tube with 700 µl of modified tail tip buffer (50 mM Tris, pH 8;
10 mM EDTA; 100 mM NaCl; 1% SDS; 85.5 ml ddH2O). Proteinase K (17.5 µl of 20
mg/ml) was then added and agitated in a 55o C shaking water bath overnight. Five-
hundred µl of buffered phenol:chloroform was then added to each tube and gently
inverted. Samples were then centrifuged at 10,000 rpm for 5 min. The supernatant was
removed and placed into a new microfuge tube, and the DNA was extracted again with
phenol:chloroform. To this tube 400 µl of chloroform:isoamyl alcohol (24:1) was added,
gently agitated and centrifuged again at 10,000 rpm for 5 min. Ice-cold EtOH (100%)
was added to the supernatant and placed in a -20o C freezer for at least 2 hr. The EtOH
was poured out following centrifugation at 10,000 rpm for 10 min at 4o C. Seventy
percent EtOH was added to the DNA pellet and centrifuged as in the previous step. The
EtOH was again emptied and the DNA pellet was dried for at least 30 min. The dry
DNA pellet was then resuspended in 50 µl TE buffer (10 mM Tris, pH 8; 1 mM EDTA).
This solution was quantified for DNA concentration using UV absorbance at 260/280
nm. PCR analysis of the transgene was then performed as outlined.
Section 3.2: ERE Determination for Transgenic Mouse Production

67
To first determine which ERE construct to use, various length EREs were coupled
to green fluorescent protein. Initial experiments revolved around the use of a basic ERE
sequences which were placed in optimal binding length for the estrogen receptor. EREs
have been found to be sufficient for gene transcription to occur, and in order to keep this
model simple, minimal ERE sequences based upon the vitellogenin gene were first
employed. Induction comparisons were made using two cell culture based models.
MCF-7 breast cancer cells endogenously contain the estrogen receptor. As a control,
MDA-MB-231 breast cancer cells were chosen, as this cell strain does not contain the
estrogen receptor. For verification purposes, western blot analysis was performed on
both cell lines. Confirmation of estrogen receptor alpha was found in the MCF-7 line,
where MDA-MB-231 cells did not exhibit expression (Figure 15).
Section 3.2.1: Methods
Production of ERE Sequences
ERE sequences, typically less than 40 nucleotides long (Figure 16), were
purchased as oligonucleotides from Sigma Genosys (Woodlands, TX). Oligo pairs were
annealed using a thermal cycler (MJ Research) and allowed to slowly cool to room temp
overnight to ensure proper alignment. Hind III and Bgl II (Promega, Madison, WI)
restriction enzyme sites were engineered into each of the sequences to allow for insertion
into the cloning vector. These complimentary strands were then ligated into the
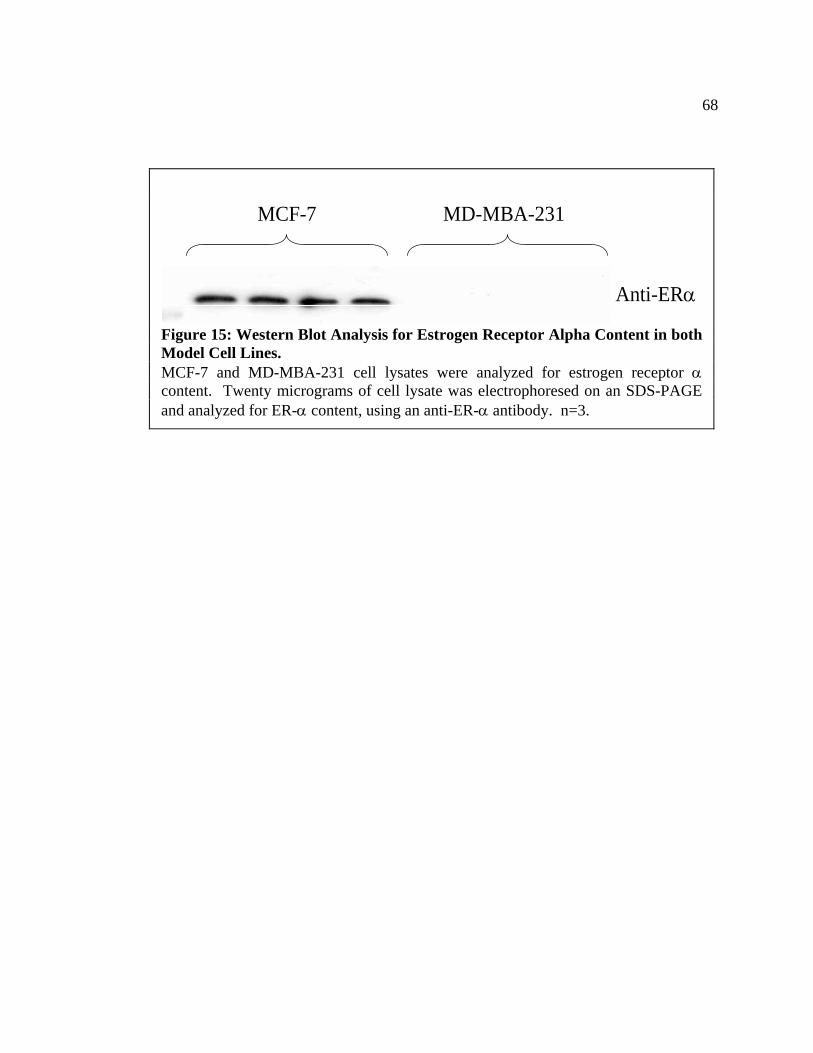
68
MCF-7 MD-MBA-231
Anti-ERα
Figure 15: Western Blot Analysis for Estrogen Receptor Alpha Content in both Model Cell Lines. MCF-7 and MD-MBA-231 cell lysates were analyzed for estrogen receptor α content. Twenty micrograms of cell lysate was electrophoresed on an SDS-PAGE and analyzed for ER-α content, using an anti-ER-α antibody. n=3.

69
GFPEREERE TATA8 bp 20 bp GFPEREERE TATA8 bp 20 bp-Added TATA box at optimal placementBKGD: - Cell viability: - Estrogen Treat: -BKGD: - Cell viability: - Estrogen Treat: -
GFPEREERE TATA8 bp 20 bp GFPEREERE TATA8 bp 20 bp-Added TATA box at optimal placementBKGD: - Cell viability: - Estrogen Treat: -BKGD: - Cell viability: - Estrogen Treat: -
GFPEREERE TATA8 bp 20 bp
GFPEREERE TATA8 bp 20 bp
GFPEREERE TATA8 bp 20 bp GFPEREERE TATA8 bp 20 bp
GFPEREERE TATA8 bp 20 bp GFPEREERE TATA8 bp 20 bp-Changed sequence of TATA box
BKGD: + Cell viability: - Estrogen Treat: BKGD: + Cell viability: - Estrogen Treat:
GFPEREERE TATA8 bp 20 bp GFPEREERE TATA8 bp 20 bp
GFPEREERE TATA8 bp 20 bp GFPEREERE TATA8 bp 20 bp
GFPEREERE TATA8 bp 20 bp GFPEREERE TATA8 bp 20 bp
GFPEREERE TATA8 bp 20 bp GFPEREERE TATA8 bp 20 bp-Changed sequence of TATA box
BKGD: + Cell viability: - Estrogen Treat: BKGD: + Cell viability: - Estrogen Treat:
GFPEREERE 8 bp 8 bp GFPEREERE 8 bp 8 bp
BKGD: + Cell viability: Estrogen Treat: BKGD: + Cell viability: Estrogen Treat:
GFPEREERE 8 bp 8 bp GFPEREERE 8 bp 8 bp
BKGD: + Cell viability: Estrogen Treat: BKGD: + Cell viability: Estrogen Treat:
GFPEREERE TATA27 bp 22 bp GFPEREERE TATA27 bp 22 bp
-Changed spacing between EREs and to TATA boxBKGD: - Cell viability: - Estrogen Treat: -BKGD: - Cell viability: - Estrogen Treat: -
GFPEREERE TATA8 bp 18 bp GFPEREERE TATA8 bp 18 bp-Changed spacing between EREs and to TATA box
BKGD: + Cell viability: + Estrogen Treat: BKGD: + Cell viability: + Estrogen Treat:
GFPEREERE TATA8 bp 55 bp GFPEREERE TATA8 bp 55 bp-Changed spacing to TATA box
BKGD: + Cell viability: - Estrogen Treat: BKGD: + Cell viability: - Estrogen Treat:
Figure 16: Schematic of Various Estrogen Responsive Elements Created. Numerous attempts were made to determine GFP induction following estrogen challenge in transfected cells. Differences between the sequences and the effects of estrogen challenge are listed.

70
promoterless pEGFP-N1 cloning vector (Clontech, Palo Alto, CA) using T4 DNA ligase
(Promega; 10:1 ratio of insert to cut pEGFP-N1). The ERE-pEGFP-N1 ligated construct
(20 µl of the ligase reaction) was then used to transform E. coli HB101 (Promega)
bacterial cells for rapid production of the construct. Bacteria were then grown on LB-
kanamycin agar plates. Selected colonies were then further grown in 3 ml bacterial vials
(Falcon) with LB broth. Mini-prep kits (Qiagen, Valencia, CA) were then used to isolate
the plasmid DNA. Plasmid DNA was then subjected to restriction enzyme digest by
Hind III and Bgl II (37o C, 90 min) again to cut the sequence of interest from the plasmid.
This served as the primary methods of verification. Plasmids of interest were then sent to
the DNA Sequencing Facility for positive verification.
Full length ERE-pEGFP plasmids, 2 µg total DNA, were then transfected into
MCF-7 and MD-MBA-231 breast cancer cells using Fugene 6 (Roche Molecular
Systems, Alameda, CA) transfection reagent (10 µl per microgram DNA) and Opti-Mem
transfection media (Invitrogen). Cells were kept in transfection reagent for 24 hr, at
which time the transfection media was removed and replaced with DMEM with 10%
fetal bovine serum (Invitrogen). Mitogens were previously removed from the media
through the use of dextran-coated charcoal (Sigma), to ensure that no estrogen was
present in the cell culture media. Cells from the same passage number were transfected
with the red variant of GFP, dsRFP (Clontech). This was done to ensure that the
transfection protocol was working correctly.
Section 3.3: Cell Culture Models for ERE Testing

71
Electrophoretic mobility shift assays (EMSAs) were used to determine if the
estrogen receptor could bind to the ERE sequences synthesized. MCF-7 and MDA-MB-
231 cells were harvested and the nuclei were separated. Radiolabelled ERE sequences
were then incubated with nuclear lysates. PAGE separation was then performed to
determine binding of the estrogen receptor to the ERE of interest. As a positive control,
non-radiolabelled sequence was also added to the reaction mix to compete for binding to
the estrogen receptor. Nuclear lysates from MCF-7 cells exhibited binding to the ERE
sequences, whereas the estrogen receptor null MDA-MB-231 cells did not display
binding to the sequence (Figure 17). For further verification, super shift analysis, where
an antibody for the estrogen receptor was added to the nuclear lysate, was also
performed. Further retardation of the bound radiolabelled sequence was displayed,
confirming that the ERE sequences bound to the estrogen receptor (Figure 18).
Section 3.3.1: Addition of Basic Promoter Elements
The use of basic EREs did not exhibit induction of the fluorescent protein.
Current models of estrogen induction are thought to require a basic minimal promoter,
usually based on the thymidine kinase or simian SV40 virus. These promoters contain
the basic binding elements for gene transcription to occur; usually a TATA binding site,
as well as binding sites for EF2-A and Pol2.

72
Free probe
ColdCompetitor10x 50x
MCF-7 MD-MBA-231
Free probe
ColdCompetitor10x 50x
MCF-7 MD-MBA-231
Free probe
ColdCompetitor10x 50x
MCF-7 MD-MBA-231
Figure 17: EMSA of Nuclear Lysates Bound to ERE Sequence. Radiolabelled probe was incubated with nuclear extracts to determine if the estrogen receptor could bind to the ERE sequence. MCF-7 cells produce estrogen receptor whereas the MD-MBA-231 cells do not. Increasing concentrations of unlabelled probe were added to compete for binding. The arrow denotes retardation of the radiolabelled probe. n=3.

73
A B C D E FA B C D E F
Figure 18: EMSA Super Shift of MCF-7 Nuclear Lysates. Radiolabelled probe was incubated with MCF-7 nuclear extracts to determine if the estrogen receptor could bind to the ERE sequence. MCF-7 cells produce estrogen receptor whereas the MD-MBA-231 cells do not. Increasing concentrations of unlabelled probe were added to compete for binding. The arrow denotes retardation of the radiolabelled probe. (A) Free probe; (B) Probe with nuclear extract; (C) Incubation with ER-β antibody; (D) Incubation with ER-α antibody; (E) 50x excess cold probe; (F) 10x excess cold probe.

74
Section 3.4: Transgenic Mouse Production
Transgenic mice were produced to include the promoter sequence of interest,
TCGAGGTCACAGTGACCTGATCAAAGTTAATGTAACCTC, upstream of GFP
which contained the basic minimal promoter shown to induce estrogen related production
of GFP. The construct was cloned into HB101 E. coli bacterial cells and grown in 3 ml
vials to ensure adequate DNA production. Insertion of the sequence was verified by
endonuclease digestion. These products were then run on 2% agarose gels, and the
sequence of interest was cut from the gel. Qiagen Gel Purification kits were then utilized
to isolate the DNA from the gel (Figure 19). This linearized product was then given to
the Southwest Environmental Health Sciences Center Transgenic Animal Facility for
pronuclear injection into F2S of C57BL/6J x DBA/2J. Upon verification of transgene
insertion by tail-typing coupled with PCR amplification, founder mice (8 positive of 20
liveborns) were mated to C57BL/6J mice (Figure 20). N1 generation mice were then
analyzed for transgene insertion. There were a total of 30 mice generated from 3 male
founders, 20 which were positive for transgene integration. A representative photograph
of the PCR analysis of the offspring from one founder can be seen in Figure 21.
Section 3.4.1: ERE Transgenic Mouse Tissue Slice Studies
Precision-cut liver and kidney tissue slices were generated from the ERE
transgenic mice and challenged with 10 and 100 nM estrogen treatment for 24 hr (Figure
75
22). CD-1 liver and kidney tissue slice lystate was added with rGFP to create a standard
curve and compared with estrogen challenged liver and kidney tissue slices. Neither liver
nor kidney slices from these animals exhibited an induction of GFP.
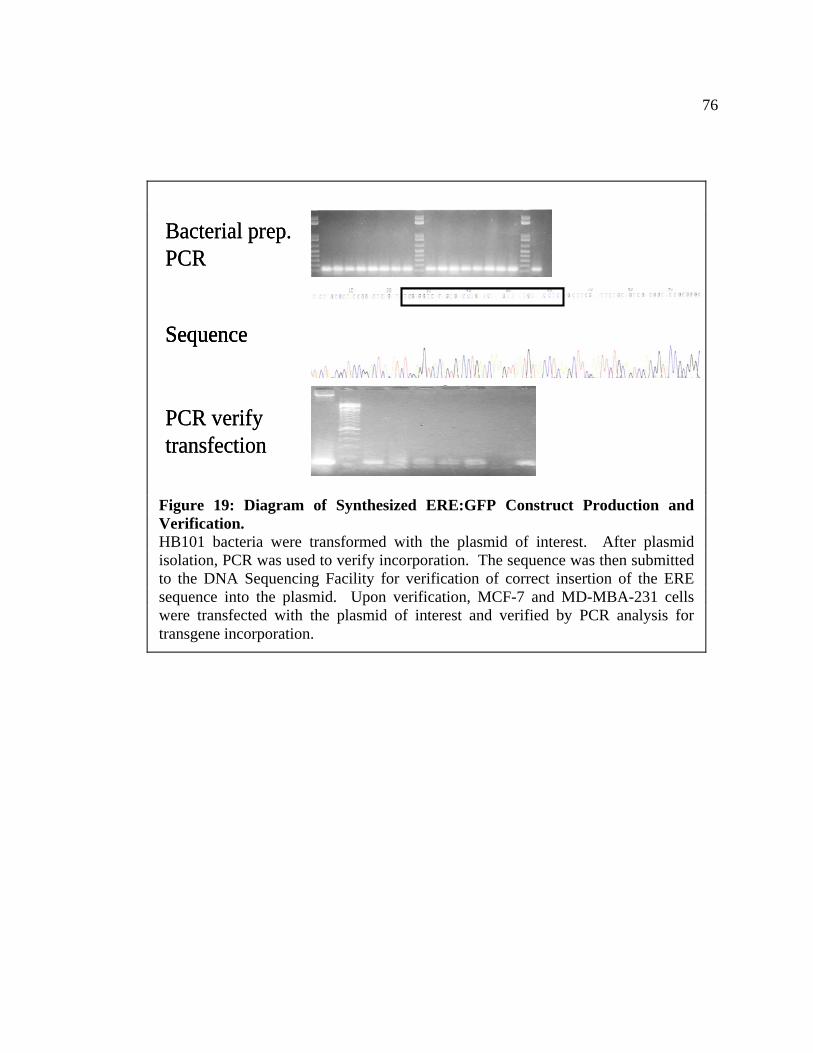
76
PCR verifytransfectionPCR verifytransfection
Bacterial prep.PCRBacterial prep.PCR
SequenceSequenceSequence
Figure 19: Diagram of Synthesized ERE:GFP Construct Production and Verification. HB101 bacteria were transformed with the plasmid of interest. After plasmid isolation, PCR was used to verify incorporation. The sequence was then submitted to the DNA Sequencing Facility for verification of correct insertion of the ERE sequence into the plasmid. Upon verification, MCF-7 and MD-MBA-231 cells were transfected with the plasmid of interest and verified by PCR analysis for transgene incorporation.

77
Figure 20: PCR Analysis of the Founder Generation of Transgenic Mice. Tail tips from liveborn founder mice were digested and analyzed for transgene insertion by PCR analysis. A band was indicative of transgene insertion.

78
Figure 21: Representative Photograph of the PCR Analysis of N1 Generation of Transgenic Mice from a Single Founder. Tail tips from newborn mice were digested and analyzed for transgene insertion by PCR analysis. A band was indicative of transgene insertion.

79
R2 = 0.9931
0
200
400
600
800
1000
1200
0 100 200 300 400 500 600Nanograms GFP
Fluo
resc
ent I
nten
sity
Control (203 U)Control (203 U)
10 nM Estradiol (194 U)10 nM Estradiol (194 U)
100 nM Estradiol (241 U)100 nM Estradiol (241 U)
R2 = 0.9931
0
200
400
600
800
1000
1200
0 100 200 300 400 500 600Nanograms GFP
Fluo
resc
ent I
nten
sity
Control (217 U)
100 nM Estradiol (188 U)
10 nM Estradiol (228 U)
Figure 22: ERE:GFP Transgenic Tissue Slices Challenged with Estrogen. Recombinant GFP was added to CD-1 mouse tissue slice lysate to be certain that if produced, GFP could be detected. Kidney (top) and liver (bottom) tissue slices were incubated with 10 and 100 nM estrogen to determine induction of the GFP transgene. Fluorescent intensity was plotted against increasing amounts of recombinant GFP (U = fluorescent units). n=3.

80
Section 3.5: Summary
The production of a transgenic mouse with an estrogenic responsive fluorescent
protein reporter system was not achieved in these studies. Difficulties relating to GFP
induction, or the ability to detect GFP at quantities generated, were consistent throughout
studies performed on the entire transgenic colony. Tissue autofluorescence is a potential
problem with the ability to accurately detect GFP. Given tissue slices of an 8 mm size
and 250 µm thick, the number of cells is approximately 1.6 million cells. The lowest
amount of recombinant GFP added to liver lysate was 5 ng, which approximates to
1.4x10¹¹ molecules of GFP required to overcome the issue of autofluorescence. Dividing
this number by the total cell count, approximately 100,000 molecules of GFP need to be
produced per cell. The creation of a mouse with these qualities was recently achieved by
Toda et. al (Toda et al., 2004). In this study, a 4X ERE construct was coupled to an
hsp68 sequence, upstream of the GFP coding sequence. Interestingly, the 4X ERE
sequence was based upon the same “perfect” ERE sequence used to create the transgenic
mice in this dissertation work. However, induction of GFP was not seen in the liver, with
only a very modest induction of GFP demonstrated in the kidney in these mice. The most
significant induction was seen in the pituitary, adrenals, ovary and uterus; tissues which
were not explored in the scope of this research.
Given that many groups have attempted to achieve a transgenic mouse with these
qualities, while only one group has succeeded is demonstrative of the potential
difficulties with an estrogen GFP based mouse strain. Although a multitude of promoter
81
based screens have been shown to function in cell culture, translating estrogen screening
to a fluorescent, tissue based system have not proven to be widespread. This led me to
use normal tissue from naïve mice while decreasing the total amount of biomass
necessary for tissue slice studies. In addition, the utilization of fluorescent probes to
determine toxicant-induced injury will be explored to speed processing time as well as to
potentially increase the sensitivity of this proposed system.
The production of a transgenic mouse was based upon sequences of estrogen
responsive elements coupled to a fluorescent protein. The advantage of the fluorescent
reporter protein is an increase in sensitivity with the possibility to look at live time
induction of the fluorescent protein. This mouse strain would also offer insight into the
various methods by which estrogen effects organs, with the ability to look at potential
subcellular populations within the organ directly. The various minimal promoter
elements that were explored aided in the induction of the GFP, especially in cell line
models. Promoter enhancers that were further explored with the various length EREs
were the thymidine kinase and simian SV40 promoters.
While induction of GFP was observed in cell culture models with various ERE
constructs, a useful transgenic ERE-GFP mouse was not realized in these studies. Only
one group has had success in this area. Toda et al (2004) created a transgenic mouse that
coupled 4 ERE sequences upstream of hsp68 and EGFP. Studies in this strain observed
tissue specific induction of EGFP after treatment with estrogen. Liver and kidney from
this strain were found to have a small induction of EGFP following estrogen challenge.
However, the majority of EGFP fluorescence was determined to be in hormonally related
82
tissues, such as the pituitary, uterus, and the ovary. While this is an interesting finding,
the large induction only seen in these tissues is not entirely consistent with other literature
which shows that estrogen can affect almost all organs.
It is interesting to note that this is the only group that has published results of an
estrogen inducible fluorescent reporter transgenic mouse, implying transgenic animals
with these attributes are difficult to produce. The use of other protein coding sequences
(as Toda et. al recently published) proximal to the GFP was not undertaken in these
studies, as effects related to these proteins being induced may not be easy to distinguish
from induction of the estrogenic responses alone. This observation poses interesting
questions into the future of transgenic mouse studies as coupling endogenous proteins to
transgenic proteins may confound results.
To further this observation, two additional strains of transgenic mice were
employed in tissue slice studies (Appendix B). Dr. Susan Nagel provided the ERE-
luciferase mice which were created to determine estrogen responsiveness. Studies
undertaken involved the use of kidney and liver tissue slices, however, induction of the
luciferase reporter was not seen after estrogen stimulation. Dr. Nagel confirmed that
induction in all organs was not observed, and was most likely due to the transgene not
being expressed in all tissues (Nagel et al., 2001). Another transgenic strain used was
produced by Dr. Douglas Gray. This strain of mice coupled GFP to ubiquitin with an
upstream ubiquitin promoter to observe induction of GFP in the brain (Tsirigotis et al.,
2001). While the GFP transgene was present in all tissues, induction of the GFP reporter
protein was not seen in liver or kidney slices treated with 4-hydroxynonenal; a compound
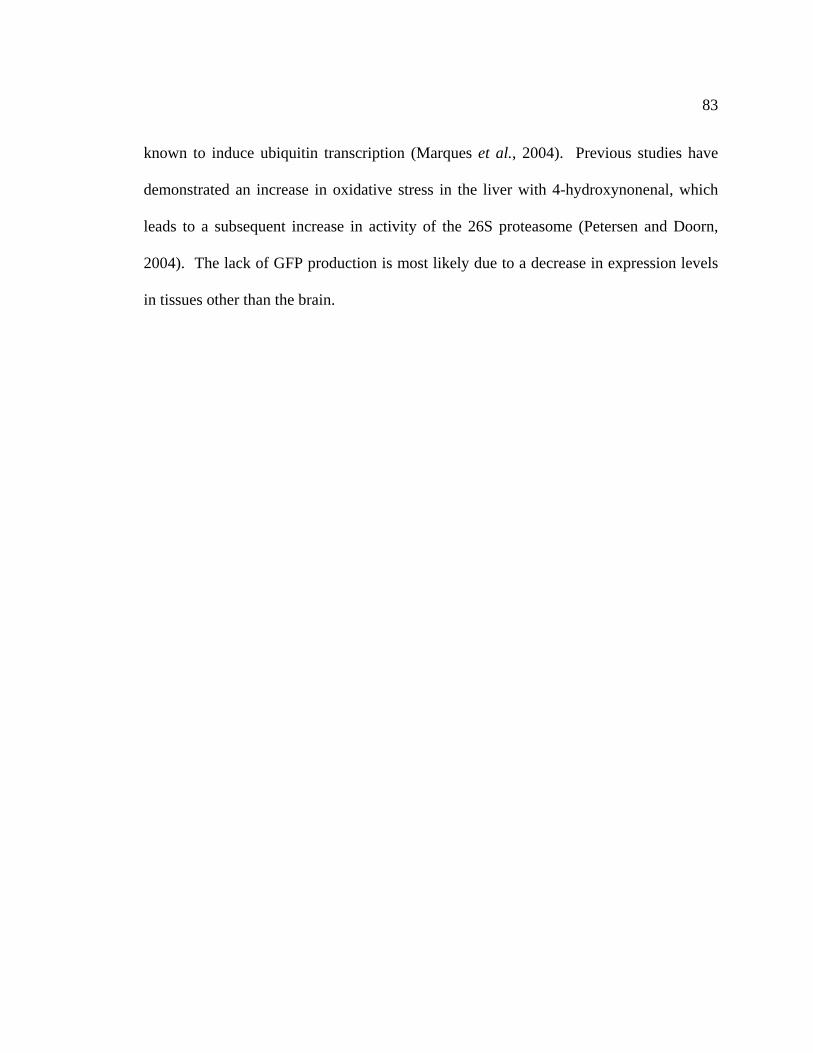
83
known to induce ubiquitin transcription (Marques et al., 2004). Previous studies have
demonstrated an increase in oxidative stress in the liver with 4-hydroxynonenal, which
leads to a subsequent increase in activity of the 26S proteasome (Petersen and Doorn,
2004). The lack of GFP production is most likely due to a decrease in expression levels
in tissues other than the brain.
84
CHAPTER 4: TISSUE CHIPS AS A MODEL SYSTEM FOR IN VITRO TOXICOLOGY STUDIES
Purpose
The hypothesis of these studies is that fluorescent probes for specific cellular
processes can used as specific indicators of cellular insult in naïve precision-cut
tissue chips as a high-throughput, high-volume method for toxicant evaluation.
Given that an increase in sensitivity can be observed with fluorescent-based assays, tissue
slices from naïve mice could be used instead of transgenic mice. This increased
sensitivity could also allow for the use of smaller tissue “chips” to create more samples
from the same organ, or the potential to use some of the smaller organs of the mouse (e.g.
the spleen). The decreased biomass will lead to a direct increase in the number of studies
able to be performed from a single animal, while the use of fluorescent indicators can
provide an increase in time-efficiency and detection.
Section 4.1: Background
The total number of cores that can be retrieved from a mouse liver is typically not
more than three, which is limited by the small size of the organ. The large size of the
tissue slice limits the total amount of tissue that can be retrieved for studies. Typically
tissue slices range from 8 – 10 mm in diameter and from 250 - 275 microns in thickness.
By decreasing the size of the tissue slices, more studies can be performed from the same
organ from a single animal. To study the multiple organ systems within the animal, a
85
smaller core for the generation of tissue samples is necessary. The attributes of the liver
(relatively firm, largest organ in the mouse, most prevalent organ in tissue slicing) make
this organ the ideal candidate to determine methods for a reduction in total biomass.
The liver is the single most important organ in drug-induced toxicity, mainly due
to its key location between the gastrointestinal tract and systemic circulation. The liver is
involved in a large number of processes such as glucose uptake, bile production and
storage, lipid synthesis and release, to name a few. Since the liver is the primary organ of
biotransformation, detoxication of xenobiotics is of the utmost concern. Various
compounds are known to be metabolized by the liver, with the possibility of creating a
compound with more toxic potential. These compounds can then either be hepatotoxic,
or can be distributed throughout the body until the target organ is affected. Additionally,
some compounds can directly bind liver cells and create and autoimmune disorder which
can lead to organ failure.
The lobule is the basic unit of the liver. Within each lobule, hepatocytes are
grouped into three zones, defined by the proximity to the central vein or the portal triads.
The portal triad consists of the portal vein, bile ducts, and the hepatic artery. As the
blood flow crosses the acinus from the portal triad to the central vein, the oxygen tension
is decreased. Zone 1 is nearest the portal triad, whereas Zone 3 is located around the
central vein, where oxygen tension is the lowest. Zone 2 is located between Zone 1 and
Zone 3. The highest concentration of CYP enzymes resides in Zone 1.
The liver consists of a number of cell types. Hepatocytes compromise the
majority of the liver. These cells are involved in multiple functions which include

86
metabolism, glucose uptake, bile production, and steroidogenesis, to name a few. The
canalicular lumen separates two adjacent hepatocytes. Bile is produced within the
hepatocyte and transported out via the canaliculus. These channels form a larger network
of bile ducts that eventually is stored in the bile duct.
Sinusoids are the channels between adjacent rows of hepatocytes, and are highly
fenestrated. The blood supply consists of the oxygen rich blood from the hepatic artery
and the nutrient rich blood from the portal vein. Endothelial cells line the sinusoid and
provide a barrier which presents large proteins to interact with the hepatocytes. These
cells are known to uptake lipoproteins and secrete cytokines. The space between the
hepatocytes and the endothelial cells is called the Space of Disse. Another type of cells
which reside in the sinusoid are the Kupffer cells, which are macrophages of the liver,
and can also act as antigen presenting cells – a mechanism that has been identified in
autoimmunity with halogenated anesthetics. Ito cells reside in the Space of Disse, and
are also known as stellate cells. These cells are store fat and vitamin A, and are known to
secrete collagen.
Many liver toxicants have been identified, with examples of these compounds
varying from small molecules, such as ethanol and carbon tetrachloride, to large
molecules, such as polychlorinated biphenyls. Exposure to these agents results in varied
disease states, from acute cholestasis to complete organ failure, usually from
macromolecular binding which can also lead to an autoimmune disorder.
Section 4.1.1: Methods

87
K+/DNA
Slices were collected as previously described under “Methods” in Chapter 2.
Differences in the assay were: Chip homogenate (800 µL) was added to a 10 mm x 100
mm plastic tube; Standard curve range for potassium 0 – 0.25 µM K+.
Molecular Probes
Tetramethyl Rhodamine Ester (TMRE)
TMRE is a mitochondrial specific probe that is oxidized to a fluorescent
molecule. TMRE (100 µM in DMSO) was added to the tissue slice culture to a final
concentration of 1 µM. Tissue chips were washed twice in PBS (pH 7.4), sonicated in
500 µl PBS, and then subjected to a insoluble fraction spin down (6,000 rpm for 5 min).
Samples were read in a 96 well plate at ex: 550 nm em: 575 nm. Fluorescence was
standardized to soluble protein content.
5-Carboxyfluorescein (5-CF)
5-CF was added to the tissue slice culture to a final concentration of 100 µM in
PBS (pH 7.4). Tissue chips were washed twice in PBS, sonicated in 500 µl PBS, and
then subjected to a insoluble fraction spin down (6,000 rpm for 5 min). Samples were
read in a 96 well plate at ex: 492 nm em: 517 nm. Fluorescence was standardized to
soluble protein content.

88
NBD-TMA
NBD-TMA was added to the tissue slice culture to a final concentration of 100
µM in PBS (pH 7.4). Tissue chips were washed twice in PBS, sonicated in 500 µl PBS,
and then subjected to an insoluble fraction spin down (6,000 rpm for 5 min). Samples
were read in a 96 well plate at ex: 458 nm em: 530 nm. Fluorescence was standardized to
soluble protein content.
Mitotracker Far Red
Mitotracker Far Red (1 mM in DMSO) was added to the tissue slice culture to a
final concentration of 10 µM. Tissue chips were washed twice in PBS (pH 7.4),
sonicated in 500 µl PBS, and then subjected to a insoluble fraction spin down (6,000 rpm
for 5 min). Samples were read in a 96 well plate at ex: 682 nm em: 701 nm.
Fluorescence was standardized to soluble protein content.
Monobromobimane (MBB)
Tissue chips were collected and homogenized in 800 µl PBS. Fifty microliters of
10 mM MBB was added to the homogenate and allowed to react for 45 min. After this
time, 200 µl of the homogenate were read in a 96 well plate at ex: 392 nm em: 492 nm.
Standard curves of reduced GSH (0–25 mM) were performed concurrently. Linear
regression analysis of the GSH standard curve was used to calculate total sulfhydryl
content of the tissue chip.

89
Ellman’s Reagent
Tissue chips were homogenized in 1 ml 10% TCA and then centrifuged at 6,000
rpm for 5 min to remove the insoluble material. Fifty µl of homogenate was added to a
microtiter plate, to which 200 µl of Ellman’s reagent was added [Dithiobis-nitrobenzoic
acid, 39.6 mg/10 ml EtOH, then diluted 1:10 in 0.5 M Tris-1 mM EDTA buffer (pH 8.9)].
A standard curve of reduced GSH (0-2.5 µg) was run at the same time to generate a
standard curve. After addition of the Ellman’s reagent, the plate was read at 405 nm on a
VersaMax (Molecular Devices) spectrophotometric plate reader.
Section 4.2: Justification for the Use of Smaller Biomass
The thickness of the tissue slices is limited by the total number of cell layers
which oxygen can penetrate. Tissue slices are typically 12-14 cell layers deep, which has
proven to be optimal for both nutrient replenishment and oxygenation. Less than 12 cell
layers deep causes the tissue slice to lift off of the titanium insert in the roller culture
incubations, leading to a loss in viability (Vickers and Fisher, 2004). Using tissue slices
with more than 14 cell layers causes the middle, innermost cells to become oxygen
deprived, thus causing necrosis within this region. Since the optimal tissue slice
thickness has been extensively described, changing the diameter of the tissue slice
remains the sole variable.
By decreasing the diameter of the tissue, a significant savings in both the number
of animals used as well as the associated costs could be realized through the use of tissue

90
chips. In instances where human tissues become available, a large increase in the amount
of studies performed from a single organ would be ideal as human tissues are becoming
increasingly rare. This would augment the scope of human experimental data, allowing
the possibility of multiple compounds to be compared from the same tissue. Additional
tissue chips could also provide further insight into the mechanisms involved in a given
compound’s toxicological profile.
A number of different methods were employed to determine how to best produce
the smaller size tissue chips. The first method was to use a smaller core size to directly
produce 4 mm tissue chips. While this generated many more cores for slicing, the actual
slicing procedure became more difficult, presumably due to the smaller core size shearing
more readily as compared to the larger core size typically used for tissue slices. Steps to
slice these smaller cores also included cooling the cores to a lower temperature to make
the core more rigid during the slicing process. Due to the frictional forces involved
during slicing, the smaller cores were quickly brought up to a warmer temperature,
leading to shredding of the tissue chips.
Smaller tissue chips were also created, through the use of a 2 mm biopsy punch.
While these tissue chips remained viable, uncertainties whether enough of all
representative cell types (hepatocytes, Kupffer, stellate and endothelial cells) were
present led to the use of a larger chip size. Qualitative variability from the 2 mm tissue
chips was also noted. Tissue chips of this size were observed to have slight differences
with tissue homogeneity, depending on which region the corresponding tissue slice was
generated. Through the use of larger tissue chips, this problem could be avoided as larger

91
diameters remained more consistent in this aspect. Intracellular potassium ion content of
2 mm tissue chips was also quite low, leading to questions regarding if comparisons
between control and toxicant treated tissue chips could be achieved. Additionally, when
incubated in the dynamic roller culture setup, the 2 mm chips would sometimes float off
of the titanium mesh screen, leading to tissue decomposition from inadequate
replenishment.
The method that proved the most consistent was by producing tissue chips from
tissue slices using a 4 mm biopsy punch (Figure 23). Tissue slices were placed on a
piece of dental wax and then cut from the tissue slice, producing between 3 and 4 tissue
chips per slice. Tissue chips incubated from this preparation method were of consistent
quality and highly reproducible. Additionally, tissue chips could be made from tissue

92
Figure 23: Photograph of Tissue Chip Production. From left to right, an 8 mm tissue slice is laid on a piece of dental wax. Tissue chips (on the right side) are created by using a biopsy punch with a 4 mm diameter. This photograph shows, from the left to the right; a whole tissue slice, the creation of tissue chips from the tissue slice; the remnants of the tissue slices; and tissue chips.

93
slices that would have been previously considered unusable, due to vasculature or
incomplete cutting of the tissue slice.
With a method of consistent tissue chip production was now realized, initial chips
studies were directed to determine if the smaller mass of the tissue chip could suffice for
further experiments. Since both chips and slices are essentially cylinders, the only
variable changing is the square of the radius, as height is kept constant. Given the
average cell is approximately 20 microns in width and depth and using the formula for a
cylinder, where volume is equal to π x r2 x h, the following approximations for total cell
count by core diameter can be found.
2 mm = 100,000 cells
4 mm = 400,000 cells
8 mm = 1.6 million cells
The above example was illustrated by performing sets of experiments that solely
changed the diameter of the tissue core. These studies focused on the total intracellular
potassium content as a function of tissue chip diameter. As the size of the core is
decreased, the total potassium concentration, standardized to total DNA, of the tissue
chips behave in the same manner as the formula for the cylinder (Figure 24).
Additionally, the smaller size of the tissue chips allows for more accurate measurement
of the intracellular ion content.
94
0.0 2.5 5.0 7.5 10.0 12.50
500100015002000250030003500400045005000 R2 = 0.991
Tissue Chip Size (mm)
K+ /D
NA
(nm
oles
/µg)
Figure 24: Effect of Tissue Chip Diameter on Total Intracellular Ion Content. Increasing the size of the diameter of the tissue chip leads to an expected increase in the total intracellular ion content as standardized to DNA.
95
Section 4.2.1: Summary
The use of smaller tissue chips can greatly increase the number of studies and/or
samples which can be attained from a single organ, allowing a large savings in associated
costs as well as in the number of animals required for a study. Numerous methods were
used to determine the best technique for consistently reproducible tissue chips. Smaller
and larger tissue core sizes were examined, but both resulted in the tissue cores shredding
while being subjected to the tissue slice procedure (Appendix C). The creation of tissue
chips through the utilization of tissue slices via a 4 mm biopsy punch was chosen as the
preferred method, and will be used through the remainder of these studies. By decreasing
the diameter size, three 4 mm samples can be generated from a single 8 mm tissue slice.
However, sensitivity becomes a realistic problem with decreasing tissue chip diameter.
Therefore, a method to provide increased sensitivity with the smaller biomass is required,
as well as the necessity of a quick-acting toxicant to address this issue.
Section 4.3: Iodoacetamide
Iodoacetamide is typically used as an alkylating agent, but without the need for
bioactivation. Once the iodine group leaves the molecule via hydrolysis, a sulfone can
then bind to macromolecules (Figure 25). The alkylation rapidly results in cellular
dysfunction and eventually general necrosis at higher concentrations (van De Water et
al., 1999).

96
I
O
NH2I
O
NH2R SHR SH
O
NH2SR
O
NH2SR+
Figure 25: Reaction Scheme for Iodoacetamide. Iodoacetamide can react with free thiols. Dehalogenation of iodoacetamide leaves a reactive intermediate which subsequently binds free thiol groups. The subsequent dehalogenation leaves covalently binds to the sulfur group.

97
Concentrations of up to 1 mM iodoacetamide were used in these studies. This
compound has been used to alkylate proteins for analysis via HPLC for protein separation
as well as for detecting thiol-containing residues during proteomic analysis (Gururaja et
al., 2003). Additionally, iodoacetamide has been shown to induce skin tumors in rodents,
classifying it as a potential human carcinogen. Given that iodoacetamide does not require
a bioactivation step, the direct acting nature of this compound was chosen as a
prototypical toxicant throughout these studies.
Experiments to determine the toxicity of IAM in tissue chips and slices were
performed using a 6 hr time course. Concentrations as low as 50 µM of IAM
demonstrated toxicity, as determined by intracellular potassium content. Increasing the
concentration of IAM to 1 mM caused almost total loss of potassium content from the
tissue chip (Figure 26). To further prove the method of toxicity was due to the total
number of potential alkylation sites within the tissue chips, 8 mm tissue slices were
treated with 1 mM IAM. In these experiments, the tissue slices remain viable as
compared to the 4 mm tissue chips given the same dose.
Section 4.4: Assessment of Tissue Chip Perturbation by Iodoacetamide
A number of methods have been used to determine the viability of tissue slices.
These range from studying effects such as leakage of lactate dehydrogenase into the
media, to studying more localized mechanisms of apoptotic signaling. Techniques to
speed assay development rely on the use of proven methods, with subsequent use of
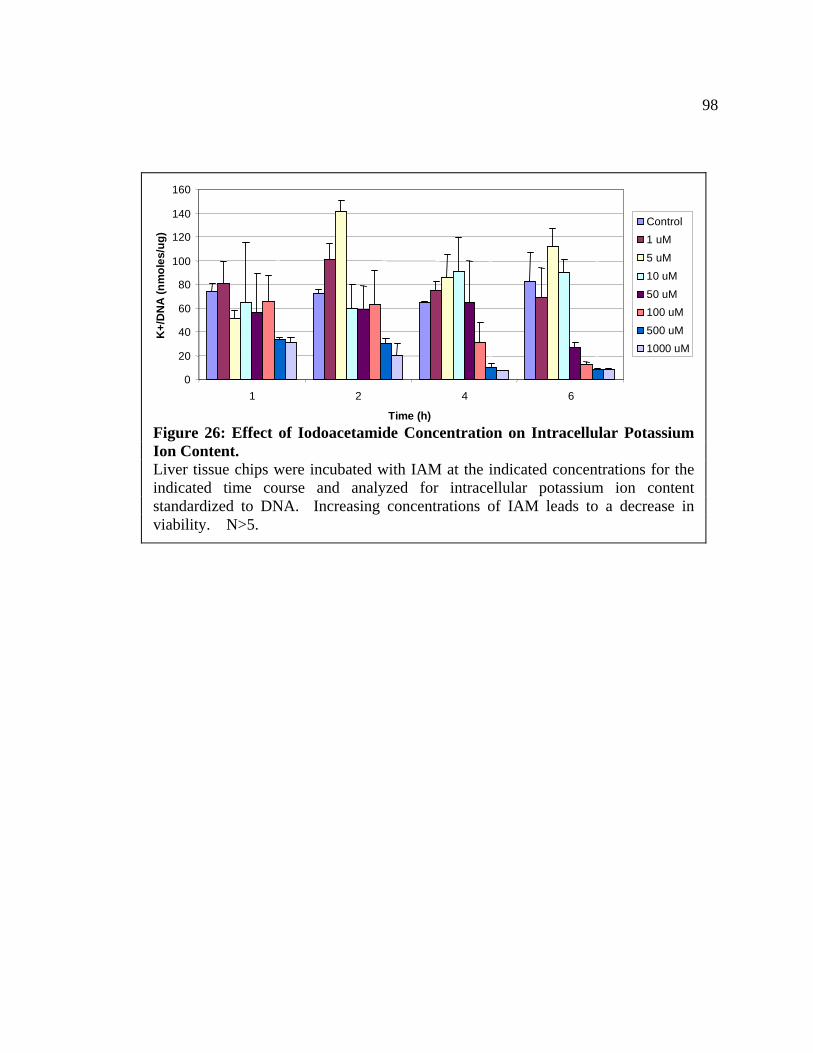
98
0
20
40
60
80
100
120
140
160
1 2 4 6
Time (h)
K+/
DN
A (n
mol
es/u
g)
Control1 uM5 uM10 uM50 uM100 uM500 uM1000 uM
Figure 26: Effect of Iodoacetamide Concentration on Intracellular Potassium Ion Content. Liver tissue chips were incubated with IAM at the indicated concentrations for the indicated time course and analyzed for intracellular potassium ion content standardized to DNA. Increasing concentrations of IAM leads to a decrease in viability. N>5.

99
fluorescent probes (if available) to make toxicant evaluation less time consuming. Since
the cellular machinery relies on a number of processes to sustain homeostasis, the assays
employed rely on various, specific mechanisms.
Crucial to the homeostasis of the cell, damage to the cellular membrane can result
in a myriad of effects, which can eventuate in cell death. During the tissue slice process,
the outer layer of cells is shredded, making a preincubation time period necessary. This
hour long incubation allows the damaged cells to be sloughed off from the living cells.
Overt damage to a cell can lead to a decrease in membrane integrity, allowing essential
ions, cofactors, and enzymes to leak from the cell and eventuate in cellular necrosis.
Typical examples in this category rely on the use of the lactate dehydrogenase assay, and
intracellular potassium ion content, as standardized to DNA. Both of these methods have
been used extensively to determine tissue slice viability, and also used in these studies to
determine tissue chip viability. In this section, comparison of spectrophotometric and
fluorescent analyses of various processes were determined to aid in creating quicker,
more reliable methods of viability.
Section 4.4.1: Methods
In the following studies, the use of specific probes, mainly fluorescent, were used
to determine if they provide a reliable tool for an in vitro screening system in conjunction
with tissue chips. All studies required sonication in PBS (pH 7.4), unless otherwise

100
indicated. Specific incubation methods, concentrations and excitation/emission
wavelengths are given for each individual probe.
Section 4.4.2: Tissue Chip Viability
5-Carboxyfluorescein (5-CF)
Fluoresceins have been used in a wide variety of cell types, from bacteria to
tumor cells. Originally, these compounds were used to study pH changes within cells
(Portoles et al., 1991; Thomas et al., 1991). 5-CF is a cell-impermeant form of
carboxyfluorescein. This form was used to determine the diffusion into damaged cells.
Typically, the fluorescence of fluoresceins can vary greatly due to pH fluctuations.
In these studies, 10 µM 5-carboxyfluorescein was incubated for 45 min following
6 hr of IAM challenge, with subsequent homogenization of the tissue chip in PBS (pH
7.4) to negate any pH effect. Samples were analyzed after a 5 min centrifugation (6,000
rpm) to remove any insoluble proteins with excitation/emission wavelengths of 492/517
nm. Liver tissue chips were challenged with various concentrations of IAM for 6 hr for
determination of the applicability of 5-CF as viability probe (Figure 27).
Section 4.4.3: Ionic Changes due to Membrane Damage
When damage to the membrane occurs, calcium enters the cell as the
concentration of calcium outside the cell is higher than inside, until equilibrium is

101
020406080
100120
0 10 25 1000
Iodoacetamide Conc. (uM)
Fluo
resc
ence
/Sol
uble
Pr
otei
n
Figure 27: Effect of Iodoacetamide on Carboxyfluorescein Fluorescence. Liver tissue chips were incubated with the indicated concentration of IAM for 6 hr, replaced with fresh media containing 10 µM 5-CF and allowed to incubate for an additional 45 min. Tissue chips were then lysed in PBS (pH=7.4), centrifuged to remove the cellular debris, and analyzed for total fluorescence which was standardized to soluble protein content. n=5.

102
reached. Calcium levels and calcium uptake play large roles in the homeostasis of a cell.
Calcium signaling is known to cause an increased stimulation of many cellular pathways,
which results in the phosphorylation of multiple signaling proteins, and initiates the
binding of transcriptional cofactors. Minute alterations in calcium levels can lead to large
changes in cellular functions, and can eventuate in either necrosis or apoptosis. Calcium
levels are tightly regulated by calcium channels located within the membrane.
Additionally, calcitonin and vitamin D both act to regulate calcium levels in the body.
Two methods for calcium analysis were examined in these studies.
FURA-2 Derivatives
FURA-2 is a fluorescent probe with high affinity for calcium, which has been
used extensively to study calcium fluctuations in a variety of cell types (Robb-Gaspers et
al., 1998; Marc et al., 2000; Ueda et al., 2000). Two derivatives of FURA-2 were used in
these studies. FURA-2 AM is an acetyl methoxy ester which is cleaved by cellular
esterases once inside the cell to become a fluorescent molecule. When bound to calcium,
FURA-2 fluoresces, with increased fluorescence occurring with increased calcium levels
(Kim and Southard, 1998). The FURA-2 AM derivative is used solely in live-time
studies and added directly to the incubation media to allow uptake and subsequent
cleavage to occur. After incubation for 45 min post-toxicant treatment, tissue chips were
homogenized via sonication, cleared of cellular debris by centrifugation, and the
supernatant analyzed for fluorescence. Fluorescence in these samples was very low,
indicating either a higher concentration of FURA-2 AM was required, or that the cellular

103
esterases were not functioning in IAM treated tissue chips (Tran et al., 1995). To test this
hypothesis, another FURA-2 derivative was employed.
FURA-2 hexapotassium salt, a cell-impermeant form, was also used in these
studies at a final concentration of 1 µM. This derivative was used to determine the
calcium levels within the tissue chip, without the necessary activation by the cellular
esterases. In theses studies, tissue chips were sonicated in PBS and the cellular debris
was removed via centrifugation. FURA-2 hexapotassium was then incubated in the
supernatant and allowed to bind calcium for 30 min and analyzed for excitation/emission
at 335/505 nm.
The use of FURA-2 as a potential indicator of endpoint ion status in liver tissue
chips was performed by incubation with varying concentrations of IAM for 6 hr (Figure
28).
Section 4.4.4: Mitochondrial Function Assays
Toxicants can have a wide range of effects, which can lead to dysregulation ofkey
organelle processes, such as decoupling of the electron transport chain within the
mitochondria; a necessary process for homeostasis of the energy charge. Known as the
powerhouse of the cell, mitochondria consist of two cell membranes, the outer and inner
membrane. The outer membrane serves to form a boundary between the organelle and
the cytosol. The inner membrane consists of convolutions, called cristae, which contain
most of the enzymes involved in the electron transport chain (the citric acid cycle).

104
0
2000
4000
6000
8000
10000
12000
14000
0 25 1000
Iodoacetamide Conc. (uM)
Fluo
resc
ent U
nits
Figure 28: Effect of Iodoacetamide on FURA-2 Fluorescence. Liver tissue chips were lysed in PBS following 6 hr IAM challenge. The soluble fraction was pelleted and the supernatant was allowed to incubate FURA-2 to determine the relative amounts of calcium per treatment. n=3.
105
Interruption of this chain can lead to disruption of energy production in the cell, while
also leading to increased leakage of the mitochondrial contents into the surrounding
cellular matrix.
Mitochondrial assays are based upon the ability of the mitochondria to oxidize a
molecule, demonstrating that the mitochondria are respiring normally. When injury
occurs to the mitochondria, the electron coupling status of the mitochondria is altered,
thus allowing reactive oxygen species (ROS) into the cellular cytosol. The ROSs are
then able to disrupt the normal homeostatic potential of the cell. Depletion of ATP can
occur very rapidly as the basis for its production is through the electron chain within the
mitochondrial walls. Mitochondrial damage can result in increased apoptosis and cellular
necrosis, depending on the extent of damage to the mitochondrial membranes.
Tetramethylrhodamine Ester
Tetramethylrhodamine ester (TMRE) is closely related to rhodamine 123, which
has been previously used in uptake studies in tissue slices. TMRE is a compound used to
measure mitochondrial potential. This dye has been shown to bind to both the inner and
outer mitochondrial wall (Scaduto and Grotyohann, 1999). However, use of TMRE in
tissue has not been previously demonstrated. Gillessen et al. (Gillessen et al., 2002) have
used TMRE to visualize changes in mitochondrial permeability, live time in neurons.
Given the high lipid content of the neuronal cell walls, this fluorescent probe was chosen
based upon characteristics that would allow entry through the tissue chip, and finally into
the mitochondria (Figure 29). Excitation/emission wavelengths: 492/517 nm; 1 µM.

106
0
20
40
60
80
100
0 10 25 1000
IAM Conc. (uM)
Fluo
resc
ence
/Sol
lubl
ePr
otei
n
Figure 29: Effect of Iodoacetamide on TMRE Fluorescence. Liver tissue chips were incubated with the indicated concentration of IAM for 6 hr. Fresh media was replaced with the addition of the 1 µM TMRE and allowed to incubate for an additional 45 min. The tissue chips were then placed in The relative fluorescence was standardized to soluble protein content. n=5.

107
MTT Assay
Previous studies have used the MTT assay to analyze tissue slices for
mitochondrial function (Sawyer et al., 1994; Olinga et al., 1997; Martin et al., 2000).
Mitochondrial function was measured using the tetrazolium salt MTT (3-(4,5-
dimethylthiazol-2-yl)-2,5-diphenyltetrazolium bromide. For this assay, chips were
incubated for 45 min with 50 µl MTT within the scintillation vials (Figure 30). Media
was removed and the chips were washed in PBS to remove residual MTT reagent. The
chips were then removed and placed into isopropranol HCl, and sonicated to release the
tetrazolium salt from within the chip. Cellular debris was removed via centrifugation at
6,000 rpm for 5 min. Samples were then read on a Molecular Devices VersaMax plate
reader using the 96 well format at 562 nm.
Section 4.4.5: Cellular Targets for Toxic Insult
Glutathione is a major constituent of the sulfhydryl pool within the cell. This
cellular antioxidant consists of a gamma-glutamate, cysteine and glycine amino acid
residues, with the cysteinyl group binding to reactive oxygen species. This serves as a
mechanism to halt the progression of oxidation within the cell, while serving to protect
proteins and other macromolecules. Cysteine residues are typically involved in protein

108
0
2000
4000
6000
8000
10000
12000
14000
0 25 1000
Iodoacetamide Conc. (uM)
Fluo
resc
ent U
nits
Figure 30: Effect of Iodoacetamide on MTT Reduction. Liver tissue chips were incubated with the indicated concentration of IAM for 6 hr. Media was replaced with the addition of MTT and tissue chips were incubated for an additional 45 min. n=3.
109
folding, a necessary step to ensure proper protein function. ROSs can affect the status of
sulfhydryl status of the cell by binding to protein and glutathione, resulting in inhibition
of protein function as well as progression of cellular oxidation when the cellular pool of
glutathione is depleted. To examine the effects of IAM on these groups, two proven
methods of sulfhydryl analysis were performed.
Monobromobimane
Monobromobimane (MBB) has been extensively used to label protein thiols,
whether mono- or di-sulfide bonds exist. Early experiments with this probes had focused
on labeling red blood cells (Kosower et al., 1979; Kosower et al., 1980). More recently
this compound is used in proteomics for visualization of thiol containing proteins after
SDS-PAGE electrophoresis (Wong et al., 2003). MBB has been used in two studies
directly determining the protein thiol concentration within hepatocytes. Rubin et. al
(2000) used MBB to assess conjugates formed from cytosolic, mitochondrial, and
microsomal fractions. The conclusion from this study proposed that MBB could be
effectively used to determine the thiol status within the cellular matrix. Another study
looked at the cellular pools of GSH following hepatocyte intoxication with
acetaminophen by analyzing MBB:GSH conjugates via HPLC (Hartman et al., 2002).
Studies to ascertain the usefulness of MBB with tissue chips were performed as
follows. Liver tissue chips were treated with various concentrations of IAM for 6 hr and
subsequently homogenized in PBS (pH 7.4). The insoluble fraction was removed via
centrifugation (6,000 rpm, 5 min) and then incubated with 10 µM MBB for 15 min.
110
Samples were then analyzed for MBB:sulfhydryl conjugates at excitation/emission of
392/492 nm. After IAM treatment, the amount of MBB:sulfhydryl conjugates is greatly
reduced (Figure 31).
Ellman’s Reagent
Ellman’s reagent, 5,5'-dithio-bis -2-nitrobenzoic acid, is typically used to
determine the overall free sulfhydryl status within samples, and has also been used to
study enzyme kinetics (Rootwelt, 1967; Sedlak and Lindsay, 1968; Haugaard et al.,
1969). Since protein sulfhydryls will also react with the compound a necessary step to
separate the cellular debris before sample reaction is required. The separation of the
insoluble proteins allows for an interpretation of the glutathione content to be determined,
as some small soluble proteins will still be present in the supernatant. Samples were
incubated with IAM at various concentrations for 6 hr, homogenized in 10% TCA, of
which 10 µl of lysate was added to 50 µl of DTNB solution (50 mM sodium acetate, 2
mM DTNB in H2O) and 140 µl of Tris (pH 8.0), mixed thoroughly and analyzed at 412
nm on an absorbance plate reader.
The results of IAM on sulfhydryl status of liver tissue chips are shown in Figure
32.
Section 4.4.6: Cationic Transport

111
0
1000
2000
3000
4000
5000
6000
0 10 25 1000
Iodoacetamide Conc. (µM)
Fluo
resc
ent U
nits
Figure 31: Effect of Iodoacetamide on Sulfhydryl Status as Assessed with Monobromobimane. Treated and control liver tissue chips were analyzed for total sulfhydryl content following IAM challenge for 6 hr. Tissue chips were placed in PBS, homogenized and reacted with MBB for 45 min. After a brief spin, the supernatant was analyzed for fluorescence. n>3.

112
0
2
4
6
8
10
12
14
0 10 25 1000
Iodoacetamide Conc. (uM)
GSH
(ug)
Figure 32: Effect of Iodoacetamide on Glutathione Content as Assessed with Ellman’s Reagent. Liver tissue chips were incubated with the indicated concentration of IAM for 6 hr and analyzed for glutathione content by the spectrophotometric product of Ellman’s reagent. n=3.

113
Given intoxication can effect the membrane of the cell with an overt insult, to
detect the possibility of acute damage, probes that monitor the status of the certain
transporters were studies as well. Cationic transporters are involved in the uptake of
various small organic cations. To study the effects of IAM on cationic transporters, use
of NBD-TMA was employed.
NBD-TMA
NBD-TMA was created for the use of visualizing cation transporters in kidney
cells (Kaewmokul et al., 2003; Simon and McWhorter, 2003). The compound closely
resembles secreted organic cations, and has been found to be specifically transported by
the OCT family of cationic transporters (Bednarczyk et al., 2000). Studies were
performed with this compound as a general viability assay given the necessary use of
ATP during transport. The excitation/emission wavelengths for this compound are
458/530 nm.
Increasing concentration of IAM were used to determine the applicability of this
probe for further studies. Figure 33 shows NBD-TMA has a robust fluorescence for
future studies with this probe, although these results were performed with a relatively
high molar amount of probe (100 µM).
Section 4.5: Summary

114
0
2
4
6
8
10
12
0 2.5 25 250Iodoacetmide Conc. (uM)
Flur
oesc
ence
/Sol
uble
Pro
tein
Figure 33: Effect of Iodoacetamide on NBD-TMA Fluorescence. Liver tissue chips were incubated with the indicated concentration of IAM for 6 hr and analyzed for NBD-TMA fluorescence, an indicator of cationic transporters. n=3.
115
Section 4.5.1: Tissue Chips
The use of smaller diameter tissue chips allows the use of multiple incubation
systems which can greatly increase the number of samples that can be generated at one
time, from the same organ or multiple organs from a single animal. While various
methods to rapidly generate tissue chips, the method that proved to be most consistent
was using a 4 mm biopsy punch on the larger size tissue slices. This procedure also
allowed more selectivity for optimal tissue appearance; that is, when undergoing the
tissue slice procedure, areas with blood vessels are typically cut and can hinder tissue
slice uniformity. With the use of this procedure, the means to generate more similar
sample sets can be realized.
Multiple incubation systems were also used to aid in the determination of a
technique which would provide the quickest, most efficient method of tissue chip studies.
The dynamic roller culture incubator, developed here at The University of Arizona,
proved to be the best means for sustained viability. In most of the shaker platform
systems attempted in these studies, signs of tissue chip trauma (cloudy media appearance,
blanched tissue chips, frayed edges) were most prevalent, most likely due to continued
rubbing against the walls of the multi-well plate or due to submersion and lack of oxygen
to the tissue chip (Appendix B).

116
Some of these effects were thought to be due from potential deprivation of other
essential nutrients. To better ascertain these questions, a diverse set of media
formulations was employed. Typically, liver tissue consumes glucose at a rapid rate.
However, increases in the total glucose concentration and with subsequent insulin
supplementation did not present an increase in tissue chip viability. Additionally,
increases in media protein supplementation were expected to increase viability
parameters since this would decrease the ‘wicking’ effect as the media is rotated along
the inner diameter of the multi-well plates. In fact, this also caused a decrease in
viability, with DMEM without supplements demonstrating consistent results (Appendix
B).
Section 4.5.2: Fluorescent Probes as Indicators of Toxicity
Several possible compounds for use as indicators of cellular viability were
employed in these studies. Both methods to establish sulfhydryl status within the tissue
chips also proved useful. Ellman’s reagent and monobromobimane exhibited similar
decrease in total sulfhydryl content. While this may suggest that GSH perturbations are
present, both of these probes will bind to any sulfhydryl group. The use of
iodoacetamide most likely ravages protein sulfhydryls as well and total exclusion of the
remaining soluble protein cannot be completely verified.
Mitochondrial function was ascertained with the use of multiple fluorescent
probes. While Mito Fluor Far Red was expected to demonstrate superior characteristics

117
due to less protein fluorescent interference, this probe did not exhibit any benefit from
these properties. Interestingly, this compound is no longer available for purchase. A
rhodamine derivative, TMRE, demonstrated good correlation with increases in
fluorescence with increasing iodoacetamide insult.
The use of tissue chips coupled with the use of fluorescent probes allows for naïve
tissues from animals to be employed in toxicity screens. Additionally, these techniques
decrease the amount of time required per experiment, making the goal of a rapid tissue
based toxicity screen a reality. Fluorescent probes targeted towards specific processes
within the tissue of interest permit the means to detect homeostatic disruption and
organelle dysfunction.
Tetramethylrhodamine ester was used to observe the effects of IAM on
mitochondrial function. Increases in fluorescence with the use of this probe were seen
after 6 hours of treatment, indicating either an increase in oxidative stress and/or
disruption of the mitochondrial transport chain (Scaduto and Grotyohann, 1999). MTT
data from these studies demonstrated a decrease in oxidized product, implying that the
latter of these processes is most likely the cause. Given that the TMRE is a more
sensitive indicator than the MTT, it is possible that increased fluorescence of the TMRE
is due to reactive oxygen species in the tissue chip homogenate. This can aided by the
explanation that MTT studies were performed in whole tissue chips, while TMRE studies
were performed in tissue chip lysates.
Experiments with the calcium probe, FURA-2, yielded expected results. As the
tissue chip undergoes necrosis, total calcium fluorescence was increased, as detected in

118
tissue chip lysates. Initial studies with this probe were performed in the whole tissue
chip, but results were irregular when done in this manner. Therefore, lysates of tissue
chip were necessary to yield consistent data with this probe. This probe has been used in
the past to look at calcium loading in hepatocytes isolated from cold-perfused livers (Kim
and Southard, 1998), but has not been used in tissue slice studies.
Sulfhydryl status was determined through the use of monobromobimane (MBB),
which has not been previously used in tissue studies. Since IAM is an alkylating agent
that most likely alkylates sulfhydryl residues, the use of this probe in these studies aided
in the determination of overall global sulfhydryl status, including glutathione. MBB is a
quick acting alkylator of sulfhydryl residues which required the use of tissue chip lysates
in these studies. This probe has been used in previous studies to look at live-time
neuronal GSH content (Sebastia et al., 2003), but the addition of MBB directly to the
incubation media may have given results that may have solely related to residues in the
outermost layers of the tissue chip.

119
CHAPTER 5: DISCUSSION AND CONCLUSIONS
This investigation indicates the continued usefulness of tissue slice technology as
a toxicological tool for bridging studies between in vivo and in vitro methods. Through
the use of existing models, including transgenic mice, the advantages of tissue slicing
techniques are clear, which importantly include the normal cellular interactions which
cannot be fully studied in all cell culture models, and do not require the large expense and
time for in vivo studies. By decreasing the size of the required biomass per sample, a
large increase in the number of studies per mouse can be achieved, while being able to
utilize the smaller organs of mice. This approach combined with the ability to detect
fluorescent probes for specific processes allows a quicker method for assessing
toxicological endpoints. The corresponding decrease in sensitivity with classical
indicators of toxic insult, due to decreased biomass, required the application of
fluorescent indicators to maximize detection. The various techniques applied to this
dissertation are outlined in figure 34. While both of the pathways in this scheme involve
the use of tissue slices from mice, the applicability of each system to study chemical-
mediated toxicity differs.
Section 5.1: Conclusions
Tissue slices from transgenic mice can be used as a high-throughput tool to
determine toxicant-induced exposure. Importantly, in these studies, differences between

120
Mice
Transgenic
TissueSlice
Toxicant
Detection
TissueChip
Toxicant
Probe
Figure 34: Schematic Diagram of the Various Methods Employed. The left pathway of this scheme makes use of reporter protein from transgene induction to detect a cellular event. The right side demonstrates the use of smaller tissue chips from naïve tissues with fluorescent probes to enable detection of cellular insult.

121
organ systems were observed, indicative of the usefulness of this model (Catania et al.,
2003). Comparisons of in vivo studies to these in vitro studies would permit
extrapolations for future use of transgenic mouse tissue slices as a surrogate for in vivo
studies. The ability to compare a variety, or a similar class, of compounds from the same
organ taken from a single animal is the advantage transgenic mouse tissue slices offer
over in vivo studies. How these effects are presented within a given organ could be
further studied with histopathology to determine if a specific subset of cells is affected.
Histopathological studies of tissue slices have demonstrated similar patterns of tissue
damage when compared with in vivo studies (Gandolfi et al., 1996; Ciana et al., 2001;
Hays et al., 2003; van de Bovenkamp et al., 2005).
However, this system inherently relies on the ability of a compound to influence
induction of the reporter protein via the promoter sequence of the transgene. A sequence
of cellular events, due to toxicant perturbation, is required to initiate transcription and
translation of the reporter protein, which is solely based on a gene target; a singular locus
within the transgenic genome. Thus, a transgenic model system could be useful in the
evaluation of classes of compounds which may affect a well-defined promoting sequence.
If the toxicant does not initiate this series of events, production of the reporter protein
will not occur. Therefore, certain classes of compounds may not elicit induction of the
reporter protein for a given promoter, leading to potentially confounding data. Although
the toxicant may cause cellular perturbation, an effect cannot be realized. This creates a
large disadvantage for the majority of the currently available transgenic models for use in
classic toxicological studies. The cost and time to produce a transgenic strain of mice are

122
considerable. In addition, the insertion of the transgene within the genome needs to be
well-characterized to be certain that induction of the reporter protein will occur in all
tissues of interest.
The transgenic mouse strains used in these studies are enzyme-based reporter
proteins, only requiring that the tissue slice be homogenized to determine the relative
amount of induction. This provides a much quicker method of analysis and toxicant
identification. Enzyme-based reporter systems offer the advantage of being able to
maximize reaction with the substrate, whereas fluorescent-based reporters require a
minimum amount of protein to be transcribed and translated for proper analysis.
Experiments with tissue slices from transgenic mice with fluorescent reporters did
not prove to be an adequate system for rapid toxicant assessment in these studies. There
are a number of potential explanations for these observations, such as; silencing of the
transgene due to genomic insertion; induction of the transgene did not occur resulting in
loss of reporter protein production; or that tissue homogenate autofluorescence is too
great that signal interference led to inadequate sensitivity. This latter possibility negates
the effectiveness of this system as a high-throughput screen, as minimal interference is a
requirement for this assay to be acceptable.
In a tissue chip model, fluorescent probes were used to study various toxicant
exposures, effectively melding the use of smaller tissue samples, with the use of
fluorescent markers for increased sensitivity. Since toxicants can elicit a number of
events within a cell, it became necessary to study a wide variety of cellular responses to

123
determine which ones could be effectively studied. Major areas of focus were membrane
integrity, mitochondrial function, calcium ion content, as well as sulfhydryl status.
Various fluorescent molecular probes could be coupled with naïve tissue chips for
consideration as a high-throughput screening system. The importance of this fact is that
the readily available inbred mouse strains can be used, many of which have already been
well-characterized (Crabbe et al., 1994; Chu et al., 1997; Joe et al., 1999). Additionally,
the cost of the fluorescent indicators is relatively cheap as compared to the costs of
typical enzyme-based kits. The application of these probes directly to the incubation
media is possible, with subsequent analysis of the lysate in a relatively rapid manner.
Compared to the standard indicator of tissue slice perturbation, intracellular potassium
ion content, the amount of sample preparation time saved per experiment is
conservatively approximated at 12 hours. Additionally, with the increased sensitivity of
fluorescent markers, the potential to use an even smaller biomass is possible. In the
studies presented, a significant savings in the number of animals used per experiment has
been achieved, increasing the total number of samples by at least 3-fold.
The prospect of using some of the smaller organs of the mouse is now possible.
Applications with many of the other smaller organs, such as the spleen, ovary and the
adrenal glands, have not yet been demonstrated with tissue slices from mice. The
fluorescent indicators described in these analyses could easily be applied to these other
tissues. The possibility of studying toxicant insult in these organs may require a matrix,
such as agar, for actual tissue slicing; but toxicological endpoints should be achievable.

124
The capability to thus maximize use of a single animal is possible to examine toxic
potential in a large variety of organs.
In conclusion, a method is now in place to further the use of tissue slice
technology as a high-throughput method for toxicant evaluation. These studies provide
the necessary groundwork to create a system which can accurately reflect target organ
toxicity, but be used to quickly screen large numbers of compounds from the same organ
of a single mouse. The decreased biomass requires the use of a detection system with an
increased sensitivity. The multiple fluorescent probes which are available allow for rapid
detection, while providing multiple processes to be explored. Additionally, this
decreased biomass allows many samples to be generated from one organ, with the
potential of using the smaller organs of the mouse.
Section 5.2: Future Studies
Future studies with the use of tissue chips should involve the use of multi-well
plates, assuming optimal viability parameters can be obtained. This would quickly
enable tissue chips to be used as a rapid technique for toxicant evaluation. One potential
way to solve this problem was made through qualitative observations. When placed into
the media, the tissue chips typically become submerged. However, by laying the tissue
chips onto the media, thus letting the surface tension of the media to float the tissue chip,
appearance of the tissue chips was more suggestive of viable tissue. Instead of a
blanched appearance, indicative of heme protein loss, tissue chips incubated in this

125
manner retained typical color, possibly due to increased oxygenation of the tissue chip.
This may also prevent the tissue chips from becoming disrupted due to friction created by
the chip rubbing against the bottom of the well.
The use of smaller multi-well plates may permit the use of tissue chips without
any necessary support structure which is typically required to optimize the air:media
interface. Matching the diameter of the tissue chip to the diameter of the multi-well plate
may provide the best combination of oxygenation, nutrient replenishment and waste
removal. Further studies with this method could allow direct visualization of the probe
within the media; possibly through lysis of the tissue chip within the well directly. This
would greatly decrease the amount of time involved, creating a much quicker method for
toxicant screening. There remain a large number of fluorescent probes that may prove
more useful in this model system. Given the quick pace of molecular research, the
prospects of new potential probes which readily transport into the tissue could be realized
in the near future.
Tissue chips with decreased thickness (100 µm; approximately 5 cell layers)
could not only maximize the total number of samples generated from one organ, but may
also allow for more direct visualization of a fluorescent marker. This subsequent
decrease in tissue autofluorescence, due to the reduction in the cell layers of a typical
tissue chip, may permit the penetration of light excitation/emission into and out of the
middle cell layers of the tissue chip; yielding a more rapid manner of analysis. The
possibility to run multiple concentrations of a compound, with multiple fluorescent
endpoints, while retaining enough samples for confirmatory genomic, proteomic and/or
126
metabonomic screens, could be attained. The future use of continually specific probes
may allow the determination of specific signal transduction cascades. This could provide
further insight into which organ or which cell type within an organ is affected.
While the tissue chips utilized in this investigation were of a 4 mm size, the
potential to use smaller tissue chips is quite possible. The use of smaller biomass in these
studies was briefly explored; however, this should be reexamined to determine the
minimal amount of tissue which could be used to further these studies. This would not
only allow the possible use of larger multi-well plate formats, but could also further
decrease the number of animals used per study. Theoretically it could be possible to
incubate smaller tissue chips in 48 well plates, with the potential for incubation plates
with as many as 96 wells. This would greatly facilitate the speed at which these studies
could be performed, maximizing the use of the organ of interest.
An appealing system for rapid toxicant identification would be the combination of
multiple probes within a single sample. Previous work has shown that multiple
fluorescent markers can be used, which would provide simultaneous detection of cellular
insult (Hussain, 2001; Traverso et al., 2003; Okita et al., 2004). This method could also
involve the use of robotic systems to help speed the identification of potential toxicants.
The true power of tissue chips and multiple probes could provide insight into the direct
mechanisms of toxicant-induced cellular injury. Coupled with the use of human tissues,
this system could be a strong candidate for early high-throughput screens of potential
xenobiotics.
127
The use of cryopreservation, once perfected, could allow multiple tissue chips to
be produced from human tissue so as to use a large battery of tissue chips from various
organ donors. This would also afford the ability to save tissue chips for subsequent
studies with other chemicals. In essence, a tissue chip library with the possibility to
determine the exact mechanisms of toxicant perturbation, while offering the required use
of multiple genetic differences to be examined as a cause or effect of toxicant disposition.
This could decrease the number of ‘after-market’ incidences, where a drug may be found
to be toxic when given to a larger population size. The ultimate use of this system would
be tissue chips from multiple organs in co-culture so as to specifically look at
bioactivated toxicants and the effects on a variety of tissues; a model system that could
only be bested by in vivo human studies.

128
APPENDIX A: OTHER MODELS OF TRANSGENIC MICE
Section A.1: UbC:GFP Transgenic Mice
In order to increase the speed and efficiency with which these studies could be
carried out, a strain of mice with a fluorescent reporter system was employed. Since the
previous studies had been demonstrated in tissue slice homogenates with concurrent
incubation of detection reagents, foregoing lengthy incubation and homogenization times
was the next goal. In this manner, these studies were chosen to demonstrate that a
fluorescent reporter transgenic tissue slice system could be used to directly monitor the
induction of the reporter gene.
This strain of transgenic mice was a gift of Dr. Douglas Gray from the University
of Ottowa. This group (Tsirigotis et al., 2001) created a transgenic mouse that coupled
the ubiquitin c promoter to a hexahistidine tagged human ubiquitin gene. In addition, the
gene encoding for green fluorescent protein (GFP) was added to the end of the human
ubiquitin gene. Ubiquitin is a well-characterized protein induced by cellular stress and
toxic insult, thus this strain of mice seemed perfectly suited to test whether a fluorescent
protein product could be induced and detected in precision-cut tissue slices. When the
ubiquitin is produced in this model, the hexahistidine tagged ubiquitin protein is created,
allowing for easy purification of the protein product. Additionally, the GFP is cleaved
off the end of the ubiquitin protein, liberating the GFP portion of the transcript (Figure
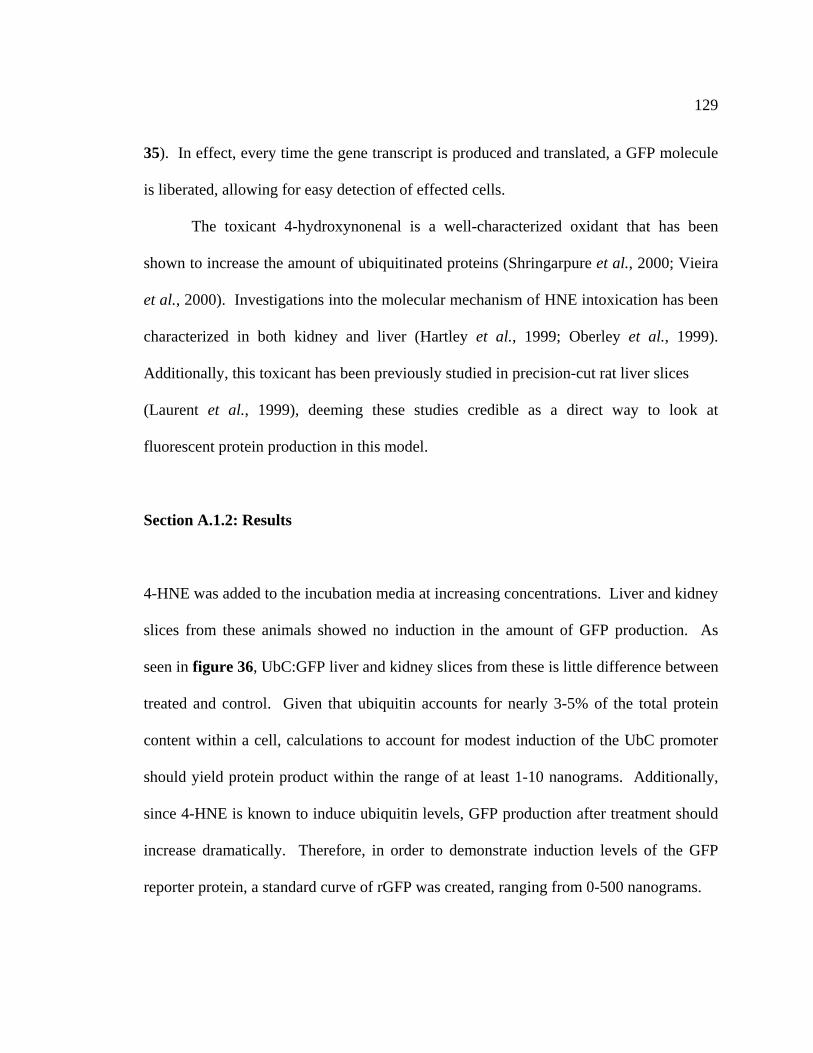
129
35). In effect, every time the gene transcript is produced and translated, a GFP molecule
is liberated, allowing for easy detection of effected cells.
The toxicant 4-hydroxynonenal is a well-characterized oxidant that has been
shown to increase the amount of ubiquitinated proteins (Shringarpure et al., 2000; Vieira
et al., 2000). Investigations into the molecular mechanism of HNE intoxication has been
characterized in both kidney and liver (Hartley et al., 1999; Oberley et al., 1999).
Additionally, this toxicant has been previously studied in precision-cut rat liver slices
(Laurent et al., 1999), deeming these studies credible as a direct way to look at
fluorescent protein production in this model.
Section A.1.2: Results
4-HNE was added to the incubation media at increasing concentrations. Liver and kidney
slices from these animals showed no induction in the amount of GFP production. As
seen in figure 36, UbC:GFP liver and kidney slices from these is little difference between
treated and control. Given that ubiquitin accounts for nearly 3-5% of the total protein
content within a cell, calculations to account for modest induction of the UbC promoter
should yield protein product within the range of at least 1-10 nanograms. Additionally,
since 4-HNE is known to induce ubiquitin levels, GFP production after treatment should
increase dramatically. Therefore, in order to demonstrate induction levels of the GFP
reporter protein, a standard curve of rGFP was created, ranging from 0-500 nanograms.
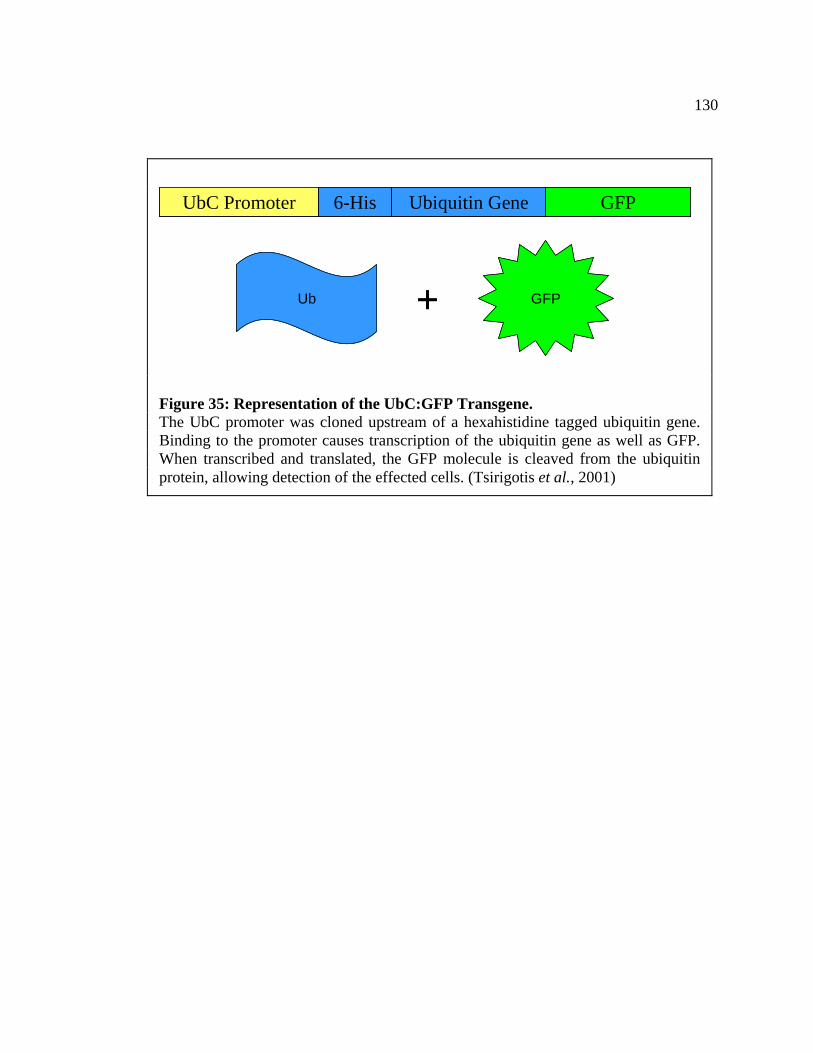
130
UbC Promoter GFPUbiquitin Gene6-HisUbC Promoter GFPUbiquitin Gene6-His
GFPUb + GFPUb +
Figure 35: Representation of the UbC:GFP Transgene. The UbC promoter was cloned upstream of a hexahistidine tagged ubiquitin gene. Binding to the promoter causes transcription of the ubiquitin gene as well as GFP. When transcribed and translated, the GFP molecule is cleaved from the ubiquitin protein, allowing detection of the effected cells. (Tsirigotis et al., 2001)

131
0
50
100
150
200
250
300
350
Control 5 50
4-HNE Conc. (µM)
Fluo
resc
ent U
nits
Figure 36: UbC:GFP Transgenic Mouse Liver Slices. Induction of GFP after treatment with either 5 µM or 50 µM 4-HNE was not observed. 4-HNE is known to quickly induce the amount of free ubiqtuin, due to protein oxidation, and subsequently cause induction in ubiquitin. n=3.

132
Section A.1.3: Summary
Tissue slices from UbC:GFP transgenic mice did not exhibit an increase in GFP
production when treated with 4-HNE. It was later determined that these mice also may
express more of the gene product only in certain regions of the body. These mice were
designed to determine the affects of tin compounds on the brain, and as such, may have
been selected for this exact reason. Further studies (not shown) determined that the
highest levels of GFP production occurred in the brain and only very modest, at best,
induction in other tissues. Although the transgene is present in all tissues (at a genomic
DNA level), induction was not demonstrated in other tissues.
Section A.2: Estrogen Responsive Transgenic Mice Studies
Another strain tested coupled three estrogen response elements to the β-gal gene
product (Figure 37). The mice in these studies were a kind gift from Dr. Susan Nagel
(Nagel et al., 2001). These mice are based on the C57Bl/6 background, and were created
to be a model for estrogenic and selective estrogen receptor modulators. In the original
studies for these mice, various tissues, including the liver and kidney, were treated with
diethylstilbestrol to determine if this model was a viable approach for future studies.
Kidney induction was seen at approximately a 5-fold induction over control, and liver
induction was about a 2-fold induction (Nagel et al., 2001). Levels of estrogen were
added to the incubation media at 100 nM concentrations to look at induction of the β-gal

133
3X ERE β−galactosidase3X ERE β−galactosidase
β-gal Substrate+ Productβ-gal Substrate+ Product
Figure 37: Schematic of the ERE:β-Galactosidase Transgene. Three ERE repeats were cloned into the β-gal vector. When activated estrogen receptor binds the ERE, transcription of the β-gal gene then occurs. β-gal in the lysate is then incubated with substrate and production of a spectrophotometric product can be analyzed for induction. (Nagel et al., 2001)

134
reporter. This level of estradiol is higher than typical biologically relevant
concentrations, but was chosen to be certain that an effect could be seen, if elicited.
When challenged with estrogen treatment, both the liver and kidney tissue slices
exhibited no increase in the expression of β-gal (Figure 38). Although a puzzling result,
it was later determined that this promoter may not be inducible in all tissues and that
results may vary widely between the tissues. These observations may be due in part to
the expression level of the estrogen receptor or the number of cells expressing the
estrogen receptor within the tissue slice. This result was further strengthened by advice
given by Dr. Nagel.

135
Induction of Beta-galactosidase Following Estrogen Treatment
0
2
4
6
8
10
12
14
16
18
20
24
Time (hr)
Bet
a-ga
lact
osid
ase
Act
ivity
Control
E2 Challenge
Figure 38: Beta-galactosidase Induction in 3X ERE:β-gal Tissue Slices. Liver slices from this strain of transgenic mice were exposed to 100 nM of estradiol. When compared to control mice, estrogen treatment does not cause an increase in the expression of the β-gal reporter protein. n=3

136
APPENDIX B: TISSUE CHIP PRODUCTION AND INCUBATION
Section B.1: Methods of Mass Tissue Chip Production
Throughout the course of these studies, various tools or manipulations were
performed in order to maximize the total number of tissue chips which could be
generated. One tool made had multiple razor blades in parallel to first cut the tissue in
one direction, and then cut in the other direction at a 90 degree angle, yielding square
cores of a 4 mm size (Figure 39). This at first proved difficult as liver tissue is
compressible. By placing the liver in agar first, the tissue was held in a rigid matrix and
could be cut more readily. Since the square cores were enveloped in agar, the possibility
of using the 4 mm core size was again attempted. However, as previously determined,
the small size cores were shredded very easily by the blade.
Since small diameter cores had proved difficult, another potential method was to
use one very large core, using most of the liver in the process, thus allowing for large
tissue slices from which many tissue chips could be produced. A large coring tool of
approximately 25 mm in diameter was employed (Figure 40). To take advantage of the
larger cores, a new arm, with a core insert hole, was custom made for the tissue slicer
(Figure 41). Additionally, an arm was made which could hold multiple cores to greatly
increase the number of tissue slices that could be generated at one time (Figure 42).
These modifications required the production of a new baseplate coupled with the use of a

137
Figure 39: Multiple Blade Tool for Mass Production of Tissue Cores from Mouse Liver. TOP: This tool was created to quickly make a large number of tissue cores. BOTTOM: These cores were created by first cutting in one direction with the multiple blade tool, with a subsequent cut performed perpendicular to the first.

138
Figure 40: Tools and Modifications used for the Generation of Many Tissue Chips. From the top left, clockwise, extra large coring tool; tissue slicer arm with multiple tissue core inserts; tissue slicer arm with large diameter insert; weight for large diameter insert; and insert for large diameter tissue cores.
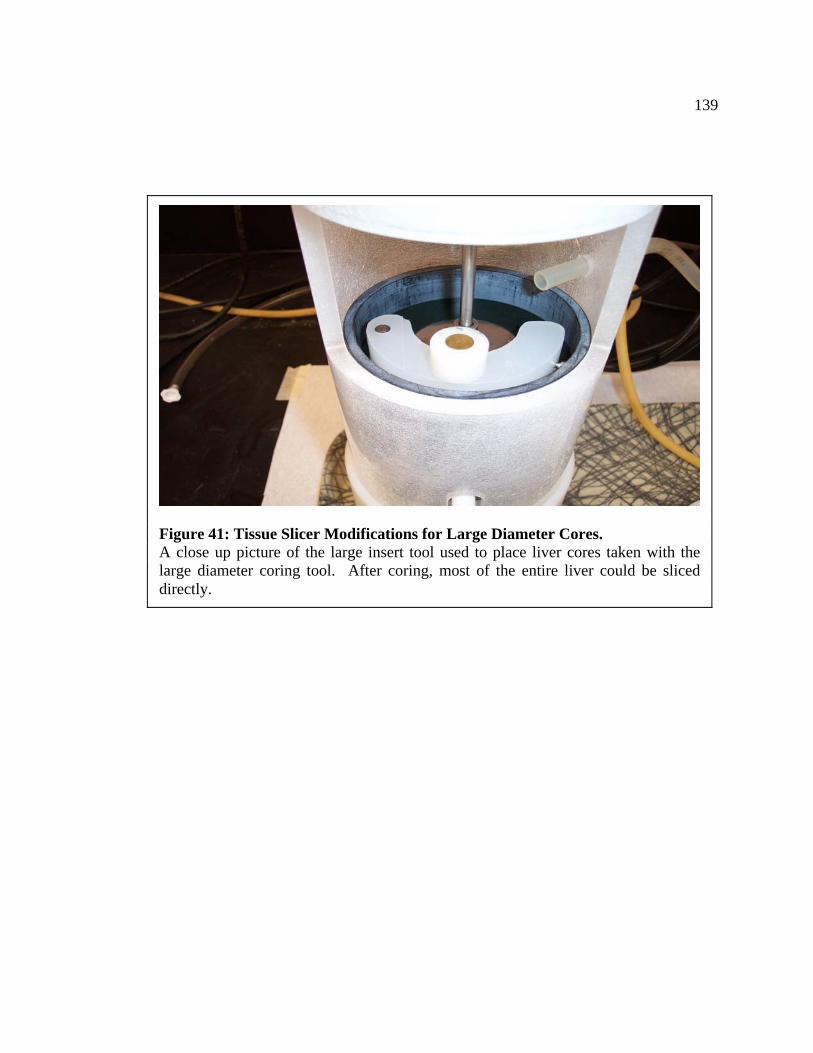
139
Figure 41: Tissue Slicer Modifications for Large Diameter Cores. A close up picture of the large insert tool used to place liver cores taken with the large diameter coring tool. After coring, most of the entire liver could be sliced directly.

140
Figure 42: Multi-core Tissue Slicer Arm. A semicircular arm was created to allow a quicker method to produce tissue chips from the organ of interest. The arm could hold six 8 mm size tissue cores.

141
larger blade size (Figure 43). Difficulties encountered with these approaches were due to
the connective tissue between the different lobes of the liver making slicing the large
cores difficult and inconsistent, as well as large variances in tissue slice thickness
generated with the multiple core insert. As the core was moved across the blade with the
arm, the tissue was shredded, resulting in incomplete tissue slices.
Section B.2: Tissue Chip Incubation Systems
In order to make the tissue chip process a higher throughput model system, older
incubation techniques need to be revisited with newer adaptations. The standard dynamic
roller culture incubation was performed at the same time as the following studies to
ensure that the newly adapted methods were standardized to a well-characterized system.
The following studies were all based upon either flask incubation, a 6 or 24 well plate
(Figure 44) format and compared to roller culture incubations.
Previous studies have shown that shaker platform incubators (based upon a 6 or
12 well format) can yield viability controls comparable to roller culture incubators
(Olinga et al., 1997). Primary studies were directed with the use of a bacterial shaker
incubator kept at 37o C and allowed to equilibrate to atmospheric oxygen levels. These
types of incubators contain a shaking platform, which is covered by a plexiglass hinged
top (Figure 45). The temperature is altered with the use of a blower/heater element at the
rear of the incubator to recirculate the air. The speed of the platform can be changed
from 0 to 500 rpm.

142
Figure 43: Photograph of the Inside of the Modified Tissue Slicer. A close up of the inside of the modified Vitron, Inc., tissue slicer. Note the base plate and the larger size cutting blade.

143
Figure 44: Photograph of Tissue Chips in a 24 Well Plate. After tissue chip production, tissue chips were placed into 24 well plates for incubation. The lid was replaced and tissue chip plates were incubated in either a bacterial culture incubator or a humidified cell culture incubator.
144
Figure 45: Photograph of Bacterial Shaker Incubator with Oxygenation Tubing. This incubation system was used to determine a large number of incubation techniques. 6- and 24-well plates were used, as well as the flask incubation system. This system in this photograph contains four 24-well plates.

145
In the well plate format, tissue chip agitation for correct oxygenation and waste
removal from the tissue chip is an important consideration. Qualitative observations of
the chips within wells demonstrated that rotation speed above 250 rpm caused the chips
to move too much and rub against the side of the well wall, which could result in tissue
trauma. For the following studies, rotational speed was kept below 250 rpm.
These studies began with the hypothesis that quicker rotational speeds would need
to be realized in order to efficiently oxygenate the tissue chips. The first experiments
compared the dynamic roller incubation system to 24 well plates rotated at either 180 or
220 rpm. While the roller culture still had the highest viability, 180 rpm proved better
than the 220 rpm speed. This most likely is again due to tissue trauma, from the tissue
rubbing against the sides or the bottoms of the wells. Qualitative observations noted that
the media in the 220 rpm samples appeared more opaque as compared to the 180 rpm
samples.
Qualitative observations made at the time include a dramatic loss of media
volume, which were approximated at greater than 30% media loss over a 6 hour time
course. Bacterial incubators typically are not humidified, as the vials for bacterial growth
are capped. The warm, dry air within the incubator, in addition to the rapid shaking of

146
the 24 well plates, caused water to be driven from the media and into the chamber. In
order to moderate the loss of (presumably) water from the media, Erlenmeyer flasks filled
with water were placed in the outer corners of the platform. The increased humidity in
the chamber led to an increased viability as compared to studies without the use of the
flasks.
Given the observation regarding the opacity of the media and that water loss from
the media was occurring, increases in the total media per well were experimented with to
determine if the addition of media would prevent the chip from damage due to abrasions
from the bottom of the well. Additionally, protein loss from the tissue chip could act as a
‘wicking’ surface, holding media against the well walls, and increasing water loss.
Media increments of 1 ml, from 2 to 4 ml, were tested to determine if total media amount
within the individual well exhibited an effect on tissue chip viability. No significant
differences were observed by increasing the total media amount, leading to question
whether 180 rpm was still too rough for the tissue chips.
Rotational speeds as low as 75 rpm were attempted, as this appeared to be the
minimum speed at which the chip would still freely rotate in the media. Experiments
with gyratory revolutions around 100-110 rpm appeared to yield the best viability for the
well plate format (Figure 46). At this speed, incubations with the 24 well plate format
were attempted with the addition of more media. Plates were aliquotted with either 1 or 2
ml of media per well. Wells with 1 ml of media displayed increased viability compared
to wells with 2 ml of media, most likely due to the increased oxygen diffusion in the

147
Liver Viability vs. Shaker Speed
0
20
40
60
80
100
75 100 110 125 150 175
Shaker Speed
K+/
DN
A (n
mol
es/u
g)
Figure 46: Effect of Shaker Speed on Tissue Chip Viability. Increases in the rotational speed of the shaker caused a decrease in the viability of precision cut liver chips. Also, there appears to be a minima that is necessary to cause proper oxygenation and/or nutrient replenishment, as below 100 rpm, viability again decreases.

148
smaller media amount, leading to studies focused on decreasing the space between the
air:media interface and increasing the oxygen tension in the chamber.
Since it was now apparent that the increased media air interface played a
significant role in tissue chip viability, the use of screens to support the tissue chip was
explored. The screen was supported within the well by steel washers, with a tissue chip
placed directly on top of the metal screen approximately 2 mm from the air:media
interface (Figure 47). Additionally, to be certain that the media was properly agitated, a
ball bearing was placed below the screen to provide a constant stirring for fresh nutrients
to the tissue chip. Tissue chips incubated in this manner were found to be torn apart on
the bottom of the chip, as the chip was rotated and constantly rubbed against the top of
the metal screen. Slower incubation speeds increased viability, but roller culture
incubation still remained the standard.
Another manner in which tissue slices had been previously incubated was through
the use of Erlenmeyer flasks (Figure 45, as a representative photo). In these studies, 6-
12 chips were placed directly into the media during incubation in the orbital shaker
platform apparatus, and experiments were performed at the same time as corresponding
24 well plate experiments to rule out tissue chip variability. Oxygenation of the media
was performed in two manners. The first included continuous flow of 95% O2 5% CO2
into the incubator. The second method was to directly oxygenate the flask. Both
methods employed using flasks showed increases as compared to the 24 well plate
format, but dynamic roller culture incubation remained significantly and consistently
more viable.

149
Figure 47: Screen Support System for Tissue Chips in 24 Well Plates. A 24 well plate with the screen support system. Three washers are stacked to allow room for the media, with a ball bearing placed in the center to allow for adequate mixing. A titanium screen is then placed on top of the washers, followed by a tissue chip being laid on the screen.

150
Although humidifying the chamber played a role in viability, another important
aspect was to better oxygenate the incubator itself. Initial studies were aimed at using
atmospheric oxygen concentrations. However, viability of tissue chips incubated in this
manner were consistently lower as compared to when the chamber was continuously
flushed with 95% O2:5% CO2. While this proved to maintain better viability, the
question of whether the tissue chips were receiving enough O2 had not been fully
addressed. Studies on tissue chip oxygenation were performed in both flasks and in 24
well plates.
Studies using the 24 well plate format while changing the oxygenation rate from
between 2 – 3 l/minute were performed, essentially replacing the air within the chamber
every 3 – 5 minutes. Twenty-four well plates were incubated at 100 rpm with an oxygen
flow rate of about 2.5 l/min gave the highest viability, although roller culture incubation
viability remained significantly higher. The differences between the all tested
oxygenation rates were not as large as expected, raising the possibility that the plates
need to be directly oxygenated.
To answer this possibility, the 24 well plate format was modified. Plates were
drilled with holes in various locations to make certain that the airflow across the plate
was sufficient to oxygenate the chips (Figure 48). Patterns with a single oxygen inlet
hole were tested with combinations of exit holes. In addition, tubing with a small gauge
needle was placed directly inside a hole on the middle top of the plate to allow proper air
exchange to occur. The pattern of inlets/outlets and location of tubing are shown to play
an important role in the viability of the tissue chips.
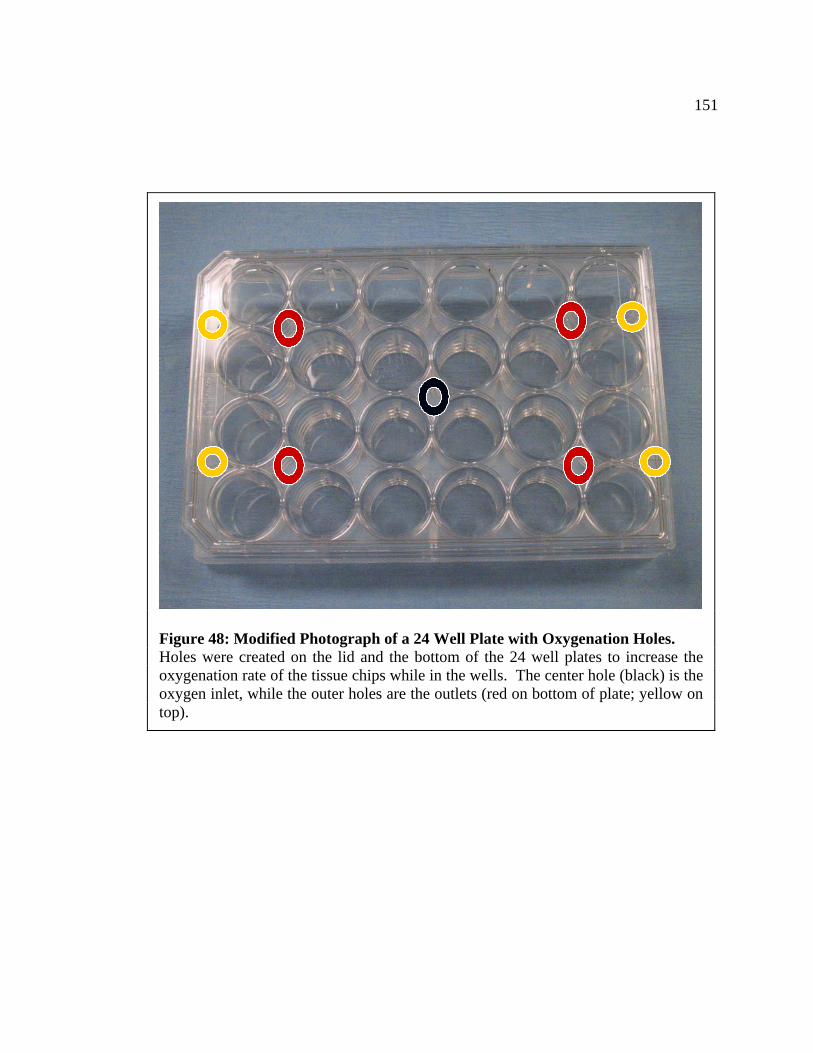
151
Figure 48: Modified Photograph of a 24 Well Plate with Oxygenation Holes. Holes were created on the lid and the bottom of the 24 well plates to increase the oxygenation rate of the tissue chips while in the wells. The center hole (black) is the oxygen inlet, while the outer holes are the outlets (red on bottom of plate; yellow on top).

152
To address the issues of both oxygenation and consistent humidifying conditions,
a new incubation system based upon a cell culture incubator, with fully programmable
control parameters, was created to further ease the process of chip incubation. The
incubator was fully modified to read total CO2 content from the tank and also contained a
shaker platform inside (Figure 49). Although 95% O2:5% CO2 was used, and CO2
settings on the incubator were set to 5% CO2, the chamber never attained a reading higher
than 3.9% CO2. However, during this testing of the incubator, the inlet valve was
constantly open, allowing 95% O2:5% CO2 to freely enter, creating an oxygen-rich
environment for the tissue chips. Company representatives later explained obtaining a
higher level was unlikely, due to the relative humidity of the chamber. The shaker
platform was rotated at a constant 100 rpm as this was the minimum rotation speed to
continuously move the chips while in the incubation media.
During the comparisons of these studies, the dynamic roller incubator remained
the gold standard throughout. Figure 50 shows the comparison of these various methods.
Tissue chips were incubated in 6 well plates with either 2, 3, or 4 ml of media, as well as
placed on a transmembrane filter to decrease the distance of the tissue chip from the
air:media interface. Additionally, 24 well plates and flask incubation systems were
compared to the dynamic roller incubator. The viability of tissue chips in roller culture
consistently remained greater than 50% better than other compared methods of tissue
chip incubations.
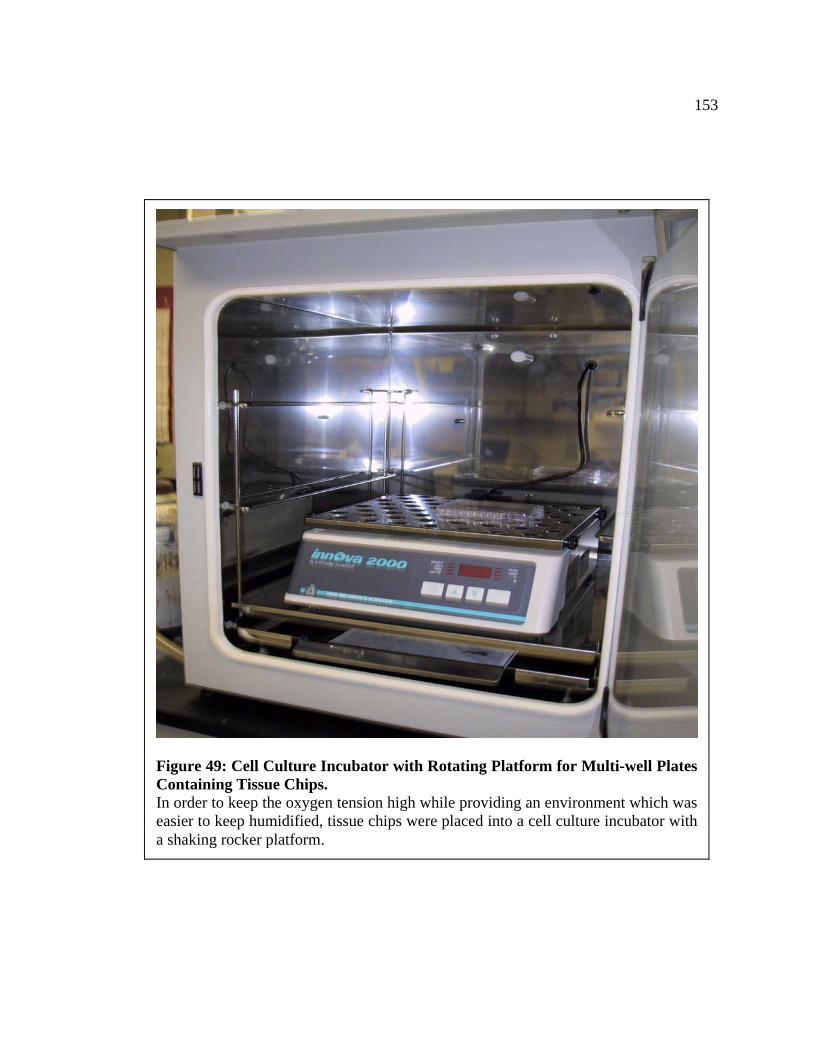
153
Figure 49: Cell Culture Incubator with Rotating Platform for Multi-well Plates Containing Tissue Chips. In order to keep the oxygen tension high while providing an environment which was easier to keep humidified, tissue chips were placed into a cell culture incubator with a shaking rocker platform.

154
Liver Chip Viablity (75 RPM)
0
10
20
30
40
50
60
70
1 2 3 4
Time (hr)
K+/
DN
A (n
mol
es/u
g)
6 well - 2ml6 well - 3 ml6 well - 4 ml6 well - transmembrane24 well - Falcon24 well - Costarflaskroller
Figure 50: Comparison of Incubation Methods on Tissue Chip Viability. Liver tissue chips were incubated in 6 well plates, 24 well plates, flasks, or dynamic roller culture for the indicate time. Viability was assessed by intracellular ion content standardized to DNA. Roller culture incubation demonstrates superior viability parameters compared to the other methods. n=4.

155
Section B.3: Media Formulation
Many different media formulations have been used for the incubation of tissue
slices. These formulations range from high-glucose to lower glucose concentrations, pH
buffered salt solutions, media with the inclusion of cellular growth factors, as well as
media supplemented with fetal bovine serum. Media typically chosen for tissue slices
does not contain the pH indicator phenol red, as this was found to inhibit the induction of
certain CYP enzymes. Throughout the studies in previous experiments, Dulbecco’s
Modified Eagle media (DMEM) supplemented with F-12 was the mainstay. However,
with the decreased biomass of the tissue chips various media formulations needed to be
tested. In the following experiments, all comparisons of media formulations were made
to DMEM without supplements.
Given liver tissue is able to quickly absorb and metabolize glucose, the first
formulation tested was with the addition of glucose. Numerous studies have used
Waymouth’s media for tissue slices, which contains 5000 mg/l of glucose, as compared
to 3150 mg/l of glucose in DMEM. To test potential differences in the chip viability,
DMEM was supplemented with glucose to a final concentration of 5000 mg/l.
Comparing the normal DMEM to the high glucose DMEM demonstrated no significant
differences (Figure 51).
With an increase in media glucose concentration not exhibiting a difference in
viability, the next question was whether the tissue chips could actively uptake glucose in
the media. For this portion of the study, the effects of the hormone insulin were

156
investigated. Insulin is secreted by groups of cells within the pancreas called islet cells,
with secretions occurring in response increases in blood sugar. Insulin receptors, found
on the outer membrane of most cell types, binds the insulin in circulation, thereby
activating receptors that absorb glucose from the blood stream into the inside of the cell.
In this set of experiments, insulin was supplemented into the media at concentrations of 5
µg/ml of media. No significant increases in chip viability were demonstrated with the
addition of the glucose or insulin (Figure 51).
By combining hypotheses from the glucose and insulin studies, experiments were
undertaken to determine if both an increase glucose concentration (5000 mg/l), as well as
insulin supplementation (5 µg/ml) would lead to increased viability. The higher glucose
concentration with the addition of the insulin in the media should be sufficient to induce
transport of glucose into the chips, if the glucose concentration is a limiting factor for
viable tissue chips. Again, no significant differences were observed between normal
DMEM and DMEM supplemented with glucose and insulin (Figure 51).
Various incubation media has been used in liver tissue slice studies. This section
set forth to examine the influence of various factors on tissue chip viability. Since the
use of the smaller biomass (tissue chips) has not been previously studied in 24 well plate
culture, optimal media conditions needed to be tested to determine if the smaller size
required different constituents for viable tissue. By comparing various media
formulations, which included the addition of more glucose, insulin, and fetal bovine
serum, normal DMEM was found to be sufficient for tissue chip incubations (Figure 51).
The use of DMEM without further supplementation not only reduces the overall cost of

157
0
20
40
60
80
100
0 1 2 3 4 5 24
Time (hr)
K+/
DN
A (n
mol
es/u
g) DMEM
DMEM+Gl
DMEM+In
DMEM+Gl+In
Roller
Roller DMEM+Gl
Roller DMEM+In
Roller DMEM+Gl+In
Figure 51: Effects of Different Media Formulations on Tissue Chip Viability. Liver tissue chips were incubated in various media formulations in both 24 well plates and in the roller culture incubation system. Gl = increased glucose; In =insulin; and Gl + In = increased glucose with insulin. n=4.

158
this system, but also allows a simplified incubation system. This is of particular
importance to future studies as changes in media protein levels or sulfhydryl status could
alter how toxicants affect tissue chip viability.

159
APPENDIX C: OTHER TOXICANTS
Section C.1: Metabolically Activated Toxicants
Section C.1.1: Bromobenzene as a Classical Toxicant
Halogenated compounds have been a well characterized group of molecules with
hepatotoxicity. Bromobenzene is a prototypical halogenated hepatotoxicant and has been
studied within the tissue slice model (Smith et al., 1985; Smith et al., 1987; Fraga et al.,
1989; Fisher et al., 1993; Gandolfi et al., 1995). CYP enzymes present in the liver
oxidize bromobenzene to bromobenzene-3,4-oxide. This oxide then causes redox cycling
in the centrilobular region of the hepatic triad, a region rich in CYP content, resulting in
liver necrosis, through binding to macromolecules (Figure 52). To further study the use
of liver tissue chips, bromobenzene was tested in 24 well plates as this was the current
method used for tissue chip incubation. Concentrations from 1 to 25 mM were used in
conjunction with neutral red as an indicator of toxicity (Figure 53).
After addition of bromobenzene to the 24 well plates, observations were made
which noted that the compound was highly water insoluble. To increase its solubility,
DMSO was mixed with the bromobenzene before addition to the media. Once added to
the media, the bromobenzene again separated and generated a viscous coat on the bottom

160
Br
Br
Br
Br
OHHH
SG
Br
SGHH
OH
Br
OH
Br
OHHOH
H
Br OHBr
H
HOH
OH
Br
H
OHH
SG
Br
H
SGH
OH
P450
EH
EH
GST
GST
BrBr
BrBr
BrBr
Br
OHHH
SG
Br
OHHH
SG
Br
SGHH
OH
Br
SGHH
OH
Br
OH
BrBr
OH
Br
OHHOH
H
Br
OHHOH
H
Br OHBrBr OHBr
H
HOH
OH
Br
H
HOH
OH
Br
H
OHH
SG
Br
H
OHH
SG
Br
H
SGH
OH
Br
H
SGH
OH
P450
EH
EH
GST
GST
Figure 52: Metabolic Scheme of Bromobenzene. Bromobenzene is bioactivated by CYP enzymes to form the oxides. These oxides then typically undergo 3 primary routes of further metabolism. Epoxide hydrolase metabolism leads to the bromophenols and the dihydrodiols. The oxide can also be conjugated to GSH via GST. (Lau and Monks, 1988)

161
0.00000.00200.00400.00600.0080
Control 0.25 0.5 1
Bromobenzene Conc. (mmol)
Neu
tral
Red
Upt
ake
Figure 53: Effect of Bromobenzene on Neutral Red Uptake. Liver tissue chips were challenged with increasing concentrations of bromobenzene and analyzed for the uptake of neutral red. This study was performed in a 24 well plate format. After incubation with bromobenzene, neutral red was added to fresh incubation media. n=3.
162
of the plate. It was then noted that the bottom of the wells within the plate were slowly
dissolved by the bromobenzene, confounding experimental data derived from this system.
Previous studies with liver tissue slices used roller culture incubation, within glass
scintillation vials by creating a closed system through the use of caps to prevent vapor
escape. The ‘open’ system of the bacterial incubator allowed some of the vapors to be
released. Citing the dissolution of the plastic plates as a major problem to 24 well plate
models with the tissue chips, the use of solvent like compounds was halted.
Section C.1.2: Thioacetamide
Since the use of small halogenated compounds, such as carbon tetrachloride, and
aromatic halogens, such as bromobenzene, could create potential incubation problems,
toxicants with higher water solubility were chosen. Thioacetamide is another well-
characterized liver toxicant. The metabolism of thioacetamide by CYP enzymes in the
mitochondria creates a bioactivated sulfone which can covalently bind to nucleophilic
molecules, such as proteins, and result in cell death (Visen et al., 1998; Wang et al.,
2000; Moronvalle-Halley et al., 2005) (Figure 54). Thioacetamide in these studies was
used in conjunction with preliminary studies using neutral red as an indicator for cellular
toxicity, using concentration up to 1 mM.

163
CH3CNH3
S
CH3C
S O
NH2
CH3C
S O
NH2
O
CH3CNH2
O
H2S
CH3CN
S
H
SO3ST
CH3CNH3
S
CH3CNH3
S
CH3C
S O
NH2CH3C
S O
NH2
CH3C
S O
NH2
O
CH3C
S O
NH2
O
CH3CNH2
O
CH3CNH2
O
H2S
CH3CN
S
H
SO3CH3CN
S
CH3CN
S
H
SO3ST
P450
P450
P450
P450
Figure 54: Metabolic Scheme of Thioacetamide. Thioacetamide is bioactivated by the CYP enzymes. The first oxidation leads to thoiacetamide sulfoxide, which is then converted to the highly reactive thioacetamide sulfone (shown in brackets). The sulfone product can lead to covalent binding of macromolecules and cell death (Mangipudy et al., 1995).
164
Experiments testing the toxicity of thioacetamide were performed with the neutral
red assay. In these experiments, the variability of neutral red uptake into the tissue chips
was quite high in experiments with 12 hr time points, which were chosen to allow
adequate bioactivation of thioacetamide. Low concentrations of thioacetamide cause
apoptosis to occur while higher concentrations lead to cellular necrosis. The scope of
these studies covered a large range of concentrations, but significant differences in
neutral red uptake were not observed (Figure 55). Since this compound needs to be
bioactivated to form a toxic metabolite, the possibility of decreased and varying CYP
content in the tissue chips was a potential issue. To circumvent this potential problem,
model toxicants that did not require bioactivation steps were used in future studies to
better ascertain the use of probes coupled with tissue chips as a high throughput method
for toxicity screening.
Section C.2: Direct Acting Toxicants
Section C.2.1: Mercuric Chloride
Heavy metal intoxication is known to induce a variety of toxicant related injuries.
Most notably, reactive oxygen species are generated from the oxidation and reduction of
these metals. Additionally, typical binding sites for these metals are large nucleophiles
such as proteins. Mercuric chloride is known to induce apoptosis in liver cells, as well as

165
0.0
1.0
2.0
3.0
4.0
5.0
Control 30 200 1000
Thioacetamide Conc. (µM)
Neu
tral
Red
Upt
ake
Figure 55: Effect of Thioacetamide on Neutral Red Uptake. Liver tissue chips were challenged with increasing concentrations of thioacetamide and analyzed for the uptake of neutral red. Thioacetamide was incubated with tissue liver slices and incubated for 12 hr. Media was removed and replaced with fresh media with neutral red. n=3.

166
cause general necrosis of the liver (Yang et al., 1992; Lachapelle et al., 1993; Reus et al.,
2003). Mercuric chloride causes disruption of various cellular membranes, including the
outer membrane, as well as mitochondrial and lysosomal membranes. Apoptotic
pathways are most likely activated through the release of key enzymes from the
mitochondria into the cytosol. Liver tissue chips were incubated with 1000 µM HgCl2
and analyzed for intracellular ion content to be certain that a known toxicant could induce
cellular insult (Figure 56).

167
0
10
20
30
40
50
60
fresh chip Control Hg 1000 uM
Treatment
K+/
DN
A (n
mol
es/u
g)
Figure 56: Effect of Mercuric Chloride on Intracellular Potassium Ion Content. Mercuric chloride was tested to be certain that high concentrations would disrupt tissue chip viability as determined by intracellular potassium ion content. Mercuric chloride was allowed to incubate with liver tissue chips for 12 hr. n=3.

168
APPENDIX D: OTHER PROBES
Neutral Red
Neutral Red, a weakly cationic dye, is typically used in cell culture viability
assays, and is based on the ability of viable cells to incorporate and bind neutral red. The
dye enters via diffusion and is sequestered in the lysosome, which contains anionic
binding sites. In order to remain, cells must still be viable, otherwise the neutral red
slowly leaks out of the cell. Cell membrane changes or changes in lysosomal membrane
can be caused by xenobiotics and can result in decreased uptake of neutral red.
Utilization of neutral red has not been previously demonstrated in any publication in
tissue slices, however previous studies have indicated the usefulness of this dye in cell
culture studies with multiple cell layers (Zhang et al., 1990; Fautz et al., 1993).
In these studies, 15 µl of neutral red solution (Sigma) was added to the incubation
media directly after toxicant treatment. Tissue chips were then washed with PBS, placed
in acidified ethanol (50% EtOH, 49% H2O, 1% Glacial acetic acid), and lysed via
sonication to extract the neutral red. The lysate was then centrifuged at 6,000 rpm to
remove insoluble protein. Samples were read in a VersaMax absorbance plate reader at
550 nm and standardized to total cellular protein as determined by the BCA method.
Liver tissue chips were challenged with various concentrations of IAM for 6 hr to
determine if neutral red could be used a viability indicator (Figure 57).

169
05
101520253035
Control 100 500 1000Iodoacetamide Conc. (uM)
Neu
tral
Red
Upt
ake
Figure 57: Neutral Red as a Viability Indicator Following Iodoacetamide Exposure. Liver tissue chips were incubated with the indicated concentration of IAM for 6 hr and analyzed for neutral red uptake. After 6 hr, media was removed and replaced with fresh media and neutral red. Neutral red was allowed to incubate for 45 min before analysis. n=3.

170
MitoTracker Far Red
A second mitochondrial specific probe that was chosen was MitoTracker Far Red.
The advantage of this fluorescent probe lies in excitation/emission spectra of this
compound (682/701 nm). The higher excitation wavelength, shifted more to the red
region of the visible spectrum, allows less interference from the cellular milieu and can
thus aid in decreasing quenching of the probe. Figure 58 shows results obtained with
this probe following IAM treatment. However, probe concentrations greater than 100 µM
did not exhibit and increase in fluorescence over background. This probe required very
large concentrations which would lead to very modest increases of fluorescence.

171
0
2
4
6
8
10
12
14
16
18
20
Control 100 500 1000
IAM Conc. (µM)
Fluo
resc
ent U
nits
/Sol
uble
Pro
tein
(RFU
/mg)
Figure 58: Effect of Iodoacetamide on Mito Fluor Far Red Fluorescence. Liver tissue chips were incubated with the indicated concentration of IAM for 6 hr and analyzed for MitoTracker Far Red. Total fluorescence was standardized to total soluble protein. n=5.

172
APPENDIX E: STRUCTURE OF MOLECULAR PROBES
Figure 59: Structure of Neutral Red.

173
Figure 60: Structure of 5-Carboxyfluorescein.

174
Figure 61: Structures of the FURA-2 Dyes. RIGHT: FURA-2 AM. LEFT: FURA-2 Hexapotassium Salt.

175
Figure 62: Structure of Tetramethyl Rhodamine Ester.

176
Figure 63: Structure of Mito Fluor Far Red.

177
Figure 64: Structure of Monobromobimane.

178
Figure 65: Structure of NBD-TMA.

179
REFERENCES
Angel, P., Imagawa, M., Chiu, R., Stein, B., Imbra, R. J., Rahmsdorf, H. J., Jonat, C.,
Herrlich, P., and Karin, M. (1987). Phorbol ester-inducible genes contain a common cis element recognized by a TPA-modulated trans-acting factor. Cell 49, 729-739.
Ansede, J. H., and Thakker, D. R. (2004). High-throughput screening for stability and inhibitory activity of compounds toward cytochrome P450-mediated metabolism. J Pharm Sci 93, 239-255.
Azri, S., Mata, H. P., Gandolfi, A. J., and Brendel, K. (1991). CCl4-induced cytochrome P-450 loss and lipid peroxidation in rat liver slices. Adv Exp Med Biol 283, 669-674.
Balla, A., Toth, B., Timar, G., Bak, J., and Krajcsi, P. (2001). Molecular targets for pharmacological cytoprotection. Biochem Pharmacol 61, 769-777.
Bednarczyk, D., Mash, E. A., Aavula, B. R., and Wright, S. H. (2000). NBD-TMA: a novel fluorescent substrate of the peritubular organic cation transporter of renal proximal tubules. Pflugers Arch 440, 184-192.
Behrsing, H. P., Vickers, A. E., and Tyson, C. A. (2003). Extended rat liver slice survival and stability monitored using clinical biomarkers. Biochem Biophys Res Commun 312, 209-213.
Beske, O. E., and Goldbard, S. (2002). High-throughput cell analysis using multiplexed array technologies. Drug Discov Today 7, S131-135.
Boess, F., Kamber, M., Romer, S., Gasser, R., Muller, D., Albertini, S., and Suter, L. (2003). Gene expression in two hepatic cell lines, cultured primary hepatocytes, and liver slices compared to the in vivo liver gene expression in rats: possible implications for toxicogenomics use of in vitro systems. Toxicol Sci 73, 386-402.
Brandon, E. F., Raap, C. D., Meijerman, I., Beijnen, J. H., and Schellens, J. H. (2003). An update on in vitro test methods in human hepatic drug biotransformation research: pros and cons. Toxicol Appl Pharmacol 189, 233-246.
Brendel, K., McKee, R. L., Hruby, V. J., Johnson, D. G., Gandolfi, A. J., and Krumdieck, C. L. (1987). Precision cut tissue slices in culture: a new tool in pharmacology. Proc West Pharmacol Soc 30, 291-293.
Bronson, S. K., Plaehn, E. G., Kluckman, K. D., Hagaman, J. R., Maeda, N., and Smithies, O. (1996). Single-copy transgenic mice with chosen-site integration. Proc Natl Acad Sci U S A 93, 9067-9072.
Brown, A. P., Hastings, K. L., Gandolfi, A. J., Liebler, D. C., and Brendel, K. (1992). Formation and identification of protein adducts to cytosolic proteins in guinea pig liver slices exposed to halothane. Toxicology 73, 281-295.
Brown, S. L., Brett, S. M., Gough, M., Rodricks, J. V., Tardiff, R. G., and Turnbull, D. (1988). Review of interspecies risk comparisons. Regul Toxicol Pharmacol 8, 191-206.

180
Campbell, S. J., Carlotti, F., Hall, P. A., Clark, A. J., and Wolf, C. R. (1996). Regulation of the CYP1A1 promoter in transgenic mice: an exquisitely sensitive on-off system for cell specific gene regulation. J Cell Sci 109 ( Pt 11), 2619-2625.
Caruso, J. A., Laird, D. W., and Batist, G. (1999). Role of HSP90 in mediating cross-talk between the estrogen receptor and the Ah receptor signal transduction pathways. Biochem Pharmacol 58, 1395-1403.
Catania, J. M., Parrish, A. R., and Gandolfi, A. J. (2001). Toxicity of a sevoflurane degradation product incubated with rat liver and renal cortical slices. Drug Chem Toxicol 24, 347-357.
Catania, J. M., Parrish, A. R., Kirkpatrick, D. S., Chitkara, M., Bowden, G. T., Henderson, C. J., Wolf, C. R., Clark, A. J., Brendel, K., Fisher, R. L., and Gandolfi, A. J. (2003). Precision-cut tissue slices from transgenic mice as an in vitro toxicology system. Toxicol In Vitro 17, 201-205.
Chang, T. C., Nardulli, A. M., Lew, D., and Shapiro, D. J. (1992). The role of estrogen response elements in expression of the Xenopus laevis vitellogenin B1 gene. Mol Endocrinol 6, 346-354.
Chu, F. F., Esworthy, R. S., Ho, Y. S., Bermeister, M., Swiderek, K., and Elliott, R. W. (1997). Expression and chromosomal mapping of mouse Gpx2 gene encoding the gastrointestinal form of glutathione peroxidase, GPX-GI. Biomed Environ Sci 10, 156-162.
Ciana, P., Di Luccio, G., Belcredito, S., Pollio, G., Vegeto, E., Tatangelo, L., Tiveron, C., and Maggi, A. (2001). Engineering of a mouse for the in vivo profiling of estrogen receptor activity. Mol Endocrinol 15, 1104-1113.
Crabbe, J. C., Belknap, J. K., Buck, K. J., and Metten, P. (1994). Use of recombinant inbred strains for studying genetic determinants of responses to alcohol. Alcohol Alcohol Suppl 2, 67-71.
De Kanter, R., De Jager, M. H., Draaisma, A. L., Jurva, J. U., Olinga, P., Meijer, D. K., and Groothuis, G. M. (2002). Drug-metabolizing activity of human and rat liver, lung, kidney and intestine slices. Xenobiotica 32, 349-362.
Dickson, M., and Gagnon, J. P. (2004). Key factors in the rising cost of new drug discovery and development. Nat Rev Drug Discov 3, 417-429.
Dobbeling, U., Ross, K., Klein-Hitpass, L., Morley, C., Wagner, U., and Ryffel, G. U. (1988). A cell-specific activator in the Xenopus A2 vitellogenin gene: promoter elements functioning with rat liver nuclear extracts. Embo J 7, 2495-2501.
Driscoll, M. D., Sathya, G., Muyan, M., Klinge, C. M., Hilf, R., and Bambara, R. A. (1998). Sequence requirements for estrogen receptor binding to estrogen response elements. J Biol Chem 273, 29321-29330.
Drobner, C., Glockner, R., and Muller, D. (2000). Optimal oxygen tension conditions for viability and functioning of precision-cut liver slices. Exp Toxicol Pathol 52, 335-338.
Edwards, R. J., Price, R. J., Watts, P. S., Renwick, A. B., Tredger, J. M., Boobis, A. R., and Lake, B. G. (2003). Induction of cytochrome P450 enzymes in cultured precision-cut human liver slices. Drug Metab Dispos 31, 282-288.

181
Evans, H. L. (1990). Nonhuman primates in behavioral toxicology: issues of validity, ethics and public health. Neurotoxicol Teratol 12, 531-536.
Fautz, R., Husein, B., Efstathiou, E., and Hechenberger-Freudl, C. (1993). Assessment of the relation between the initial viability and the attachment of freshly isolated rat hepatocytes used for the in vivo/in vitro DNA repair assay (UDS). Mutat Res 291, 21-27.
Fisher, R., Brendel, K., and Hanzlik, R. P. (1993). Correlation of metabolism, covalent binding and toxicity for a series of bromobenzene derivatives using rat liver slices in vitro. Chem Biol Interact 88, 191-198.
Fisher, R., Nau, H., Gandolfi, A. J., Putnam, C. W., and Brendel, K. (1991). Valproic acid hepatotoxicity in human liver slices. Drug Chem Toxicol 14, 375-394.
Fraga, C. G., Zamora, R., and Tappel, A. L. (1989). Damage to protein synthesis concurrent with lipid peroxidation in rat liver slices: effect of halogenated compounds, peroxides, and vitamin E1. Arch Biochem Biophys 270, 84-91.
Friedman, A., and Perrimon, N. (2004). Genome-wide high-throughput screens in functional genomics. Curr Opin Genet Dev 14, 470-476.
Furth, P. A., St Onge, L., Boger, H., Gruss, P., Gossen, M., Kistner, A., Bujard, H., and Hennighausen, L. (1994). Temporal control of gene expression in transgenic mice by a tetracycline-responsive promoter. Proc Natl Acad Sci U S A 91, 9302-9306.
Gandolfi, A. J., Brendel, K., Fisher, R. L., and Michaud, J. P. (1995). Use of tissue slices in chemical mixture toxicology and interspecies investigations. Toxicology 105, 285-290.
Gandolfi, A. J., Wijeweera, J., and Brendel, K. (1996). Use of precision-cut liver slices as an in vitro tool for evaluating liver function. Toxicol Pathol 24, 58-61.
Gillessen, T., Grasshoff, C., and Szinicz, L. (2002). Mitochondrial permeability transition can be directly monitored in living neurons. Biomed Pharmacother 56, 186-193.
Gomez-Lechon, M. J., Donato, M. T., Castell, J. V., and Jover, R. (2003). Human hepatocytes as a tool for studying toxicity and drug metabolism. Curr Drug Metab 4, 292-312.
Gonzalez, F. J. (2003). Role of gene knockout and transgenic mice in the study of xenobiotic metabolism. Drug Metab Rev 35, 319-335.
Gonzalez, F. J., and Kimura, S. (1999). Role of gene knockout mice in understanding the mechanisms of chemical toxicity and carcinogenesis. Cancer Lett 143, 199-204.
Gonzalez, F. J., and Kimura, S. (2001). Understanding the role of xenobiotic-metabolism in chemical carcinogenesis using gene knockout mice. Mutat Res 477, 79-87.
Gordon, J. W., and Ruddle, F. H. (1982). Germ line transmission in transgenic mice. Prog Clin Biol Res 85 Pt B, 111-124.
Gossen, M., and Bujard, H. (1992). Tight control of gene expression in mammalian cells by tetracycline-responsive promoters. Proc Natl Acad Sci U S A 89, 5547-5551.
Green, S., Goldberg, A. M., and Zurlo, J. (2001). The TestSmart-HPV Program--development of an integrated approach for testing high production volume chemicals. Regul Toxicol Pharmacol 33, 105-109.
Green, T. (1990). Species differences in carcinogenicity: the role of metabolism in human risk evaluation. Teratog Carcinog Mutagen 10, 103-113.

182
Grimm, S., and Kachel, V. (2002). Robotic high-throughput assay for isolating apoptosis-inducing genes. Biotechniques 32, 670-672, 674-677.
Groneberg, D. A., Grosse-Siestrup, C., and Fischer, A. (2002). In vitro models to study hepatotoxicity. Toxicol Pathol 30, 394-399.
Gu, H., Marth, J. D., Orban, P. C., Mossmann, H., and Rajewsky, K. (1994). Deletion of a DNA polymerase beta gene segment in T cells using cell type-specific gene targeting. Science 265, 103-106.
Guillette, L. J., Jr. (2000). Contaminant-induced endocrine disruption in wildlife. Growth Horm IGF Res 10 Suppl B, S45-50.
Gururaja, T., Li, W., Noble, W. S., Payan, D. G., and Anderson, D. C. (2003). Multiple functional categories of proteins identified in an in vitro cellular ubiquitin affinity extract using shotgun peptide sequencing. J Proteome Res 2, 394-404.
Handler, J. A., Kossor, D. C., and Goldstein, R. S. (1994). Assessment of hepatobiliary function in vivo and ex vivo in the rat. J Pharmacol Toxicol Methods 31, 11-19.
Harrison, P. T., Holmes, P., and Humfrey, C. D. (1997). Reproductive health in humans and wildlife: are adverse trends associated with environmental chemical exposure? Sci Total Environ 205, 97-106.
Hartley, D. P., Kolaja, K. L., Reichard, J., and Petersen, D. R. (1999). 4-Hydroxynonenal and malondialdehyde hepatic protein adducts in rats treated with carbon tetrachloride: immunochemical detection and lobular localization. Toxicol Appl Pharmacol 161, 23-33.
Hartman, N. R., Cysyk, R. L., Bruneau-Wack, C., Thenot, J. P., Parker, R. J., and Strong, J. M. (2002). Production of intracellular 35S-glutathione by rat and human hepatocytes for the quantification of xenobiotic reactive intermediates. Chem Biol Interact 142, 43-55.
Haseman, J. K., and Huff, J. E. (1987). Species correlation in long-term carcinogenicity studies. Cancer Lett 37, 125-132.
Haugaard, N., Lee, N. H., Kostrzewa, R., and Haugaard, E. S. (1969). Effects of a disulfide (Ellman's reagent) and thiols on oxidative phosphorylation and ion transport by rat liver mitochondria. Biochem Pharmacol 18, 2385-2391.
Hays, A. M., Lantz, R. C., and Witten, M. L. (2003). Correlation between in vivo and in vitro pulmonary responses to jet propulsion fuel-8 using precision-cut lung slices and a dynamic organ culture system. Toxicol Pathol 31, 200-207.
Hayward, M. A., Brock, M. L., and Shapiro, D. J. (1982a). Activation of vitellogenin gene transcription is a direct response to estrogen in Xenopus laevis liver. Nucleic Acids Res 10, 8273-8284.
Hayward, M. A., Brock, M. L., and Shapiro, D. J. (1982b). The role of estrogen receptor in Xenopus laevis vitellogenin gene expression. Am J Physiol 243, C1-6.
Hellmold, H., Nilsson, C. B., Schuppe-Koistinen, I., Kenne, K., and Warngard, L. (2002). Identification of end points relevant to detection of potentially adverse drug reactions. Toxicol Lett 127, 239-243.
Henikoff, S. (1998). Conspiracy of silence among repeated transgenes. Bioessays 20, 532-535.

183
Hill, K. A., Buettner, V. L., Glickman, B. W., and Sommer, S. S. (1999). Spontaneous mutations in the Big Blue transgenic system are primarily mouse derived. Mutat Res 436, 11-19.
Hoivik, D. J., Fisher, R. L., Brendel, K., Gandolfi, A. J., Khairallah, E. A., and Cohen, S. D. (1996). Protein arylation precedes acetaminophen toxicity in a dynamic organ slice culture of mouse kidney. Fundam Appl Toxicol 34, 99-104.
Hussain, N. (2001). Fluorometric method for the simultaneous quantitation of differently-sized nanoparticles in rodent tissue. Int J Pharm 214, 55-61.
Jacobson-Kram, D., Sistare, F. D., and Jacobs, A. C. (2004). Use of Transgenic Mice in Carcinogenicity Hazard Assessment. Toxicol Pathol 32, 49-52.
Jessen, B. A., Mullins, J. S., De Peyster, A., and Stevens, G. J. (2003). Assessment of hepatocytes and liver slices as in vitro test systems to predict in vivo gene expression. Toxicol Sci 75, 208-222.
Joe, B., Griffiths, M. M., Remmers, E. F., and Wilder, R. L. (1999). Animal models of rheumatoid arthritis and related inflammation. Curr Rheumatol Rep 1, 139-148.
Kaewmokul, S., Chatsudthipong, V., Evans, K. K., Dantzler, W. H., and Wright, S. H. (2003). Functional mapping of rbOCT1 and rbOCT2 activity in the S2 segment of rabbit proximal tubule. Am J Physiol Renal Physiol 285, F1149-1159.
Kaplowitz, N. (2000). Mechanisms of liver cell injury. J Hepatol 32, 39-47. Kim, J. S., and Southard, J. H. (1998). Alteration in cellular calcium and mitochondrial
functions in the rat liver during cold preservation. Transplantation 65, 369-375. Kimmel, S. E., Berlin, J. A., Reilly, M., Jaskowiak, J., Kishel, L., Chittams, J., and
Strom, B. L. (2005). Patients exposed to rofecoxib and celecoxib have different odds of nonfatal myocardial infarction. Ann Intern Med 142, 157-164.
Klein-Hitpass, L., Ryffel, G. U., Heitlinger, E., and Cato, A. C. (1988). A 13 bp palindrome is a functional estrogen responsive element and interacts specifically with estrogen receptor. Nucleic Acids Res 16, 647-663.
Klein-Hitpass, L., Schorpp, M., Wagner, U., and Ryffel, G. U. (1986). An estrogen-responsive element derived from the 5' flanking region of the Xenopus vitellogenin A2 gene functions in transfected human cells. Cell 46, 1053-1061.
Klein-Hitpass, L., Tsai, S. Y., Greene, G. L., Clark, J. H., Tsai, M. J., and O'Malley, B. W. (1989). Specific binding of estrogen receptor to the estrogen response element. Mol Cell Biol 9, 43-49.
Klinge, C. M. (1999). Estrogen receptor binding to estrogen response elements slows ligand dissociation and synergistically activates reporter gene expression. Mol Cell Endocrinol 150, 99-111.
Koop, R. (2005). Combinatorial biomarkers: From early toxicology assays to patient population profiling. Drug Discov Today 10, 781-788.
Kosower, N. S., Kosower, E. M., Newton, G. L., and Ranney, H. M. (1979). Bimane fluorescent labels: labeling of normal human red cells under physiological conditions. Proc Natl Acad Sci U S A 76, 3382-3386.
Kosower, N. S., Newton, G. L., Kosower, E. M., and Ranney, H. M. (1980). Bimane fluorescent labels. Characterization of the bimane labeling of human hemoglobin. Biochim Biophys Acta 622, 201-209.

184
Krumdieck, C. L., dos Santos, J. E., and Ho, K. J. (1980). A new instrument for the rapid preparation of tissue slices. Anal Biochem 104, 118-123.
Kuhlmann, J. (1999). Alternative strategies in drug development: clinical pharmacological aspects. Int J Clin Pharmacol Ther 37, 575-583.
Kuhn, U. D., Splinter, F. K., Rost, M., and Muller, D. (1998). Induction of cytochrome P450 1A1 in rat liver slices by 7-ethoxycoumarin and 4-methyl-7-ethoxycoumarin. Exp Toxicol Pathol 50, 491-496.
Kuiper, G. G., Carlsson, B., Grandien, K., Enmark, E., Haggblad, J., Nilsson, S., and Gustafsson, J. A. (1997). Comparison of the ligand binding specificity and transcript tissue distribution of estrogen receptors alpha and beta. Endocrinology 138, 863-870.
Kumar, V., and Chambon, P. (1988). The estrogen receptor binds tightly to its responsive element as a ligand-induced homodimer. Cell 55, 145-156.
Lachapelle, M., Guertin, F., Marion, M., Fournier, M., and Denizeau, F. (1993). Mercuric chloride affects protein secretion in rat primary hepatocyte cultures: a biochemical ultrastructural, and gold immunocytochemical study. J Toxicol Environ Health 38, 343-354.
Lake, B. G., Ball, S. E., Renwick, A. B., Tredger, J. M., Kao, J., Beamand, J. A., and Price, R. J. (1997). Induction of CYP3A isoforms in cultured precision-cut human liver slices. Xenobiotica 27, 1165-1173.
Lake, B. G., Charzat, C., Tredger, J. M., Renwick, A. B., Beamand, J. A., and Price, R. J. (1996). Induction of cytochrome P450 isoenzymes in cultured precision-cut rat and human liver slices. Xenobiotica 26, 297-306.
Lakso, M., Sauer, B., Mosinger, B., Jr., Lee, E. J., Manning, R. W., Yu, S. H., Mulder, K. L., and Westphal, H. (1992). Targeted oncogene activation by site-specific recombination in transgenic mice. Proc Natl Acad Sci U S A 89, 6232-6236.
Lau, S. S., and Monks, T. J. (1988). The contribution of bromobenzene to our current understanding of chemically-induced toxicities. Life Sci 42, 1259-1269.
Laurent, A., Alary, J., Debrauwer, L., and Cravedi, J. P. (1999). Analysis in the rat of 4-hydroxynonenal metabolites excreted in bile: evidence of enterohepatic circulation of these byproducts of lipid peroxidation. Chem Res Toxicol 12, 887-894.
Loven, M. A., Wood, J. R., and Nardulli, A. M. (2001). Interaction of estrogen receptors alpha and beta with estrogen response elements. Mol Cell Endocrinol 181, 151-163.
Lupp, A., Danz, M., and Muller, D. (2005). Histomorphological changes and cytochrome P450 isoforms expression and activities in precision-cut liver slices from neonatal rats. Toxicology 206, 427-438.
Ma, Q. (2001). Induction of CYP1A1. The AhR/DRE paradigm: transcription, receptor regulation, and expanding biological roles. Curr Drug Metab 2, 149-164.
Mangipudy, R. S., Chanda, S., and Mehendale, H. M. (1995). Hepatocellular regeneration: key to thioacetamide autoprotection. Pharmacol Toxicol 77, 182-188.

185
Marc, N., Galisteo, M., Lagadic-Gossmann, D., Fautrel, A., Joannard, F., Guillouzo, A., and Corcos, L. (2000). Regulation of phenobarbital induction of the cytochrome P450 2b9/10 genes in primary mouse hepatocyte culture. Involvement of calcium- and cAMP-dependent pathways. Eur J Biochem 267, 963-970.
Marques, C., Pereira, P., Taylor, A., Liang, J. N., Reddy, V. N., Szweda, L. I., and Shang, F. (2004). Ubiquitin-dependent lysosomal degradation of the HNE-modified proteins in lens epithelial cells. Faseb J 18, 1424-1426.
Martignoni, M., de Kanter, R., Grossi, P., Saturno, G., Barbaria, E., and Monshouwer, M. (2005). An in vivo and in vitro comparison of CYP gene induction in mice using liver slices and quantitative RT-PCR. Toxicol In Vitro.
Martin, H., Bournique, B., Sarsat, J. P., Albaladejo, V., and Lerche-Langrand, C. (2000). Cryopreserved rat liver slices: a critical evaluation of cell viability, histological integrity, and drug-metabolizing enzymes. Cryobiology 41, 135-144.
Martin, H., Sarsat, J. P., Lerche-Langrand, C., Housset, C., Balladur, P., Toutain, H., and Albaladejo, V. (2002). Morphological and biochemical integrity of human liver slices in long-term culture: effects of oxygen tension. Cell Biol Toxicol 18, 73-85.
Matsuda, T., Imaoka, S., Funae, Y., Otori, K., and Fukushima, S. (1995). Induction of CYP isoenzymes in various organs of rats by 3-methylcholanthrene or beta-naphthoflavone. Cancer Lett 97, 137-143.
Meinhardt, U., and Mullis, P. E. (2002). The aromatase cytochrome P-450 and its clinical impact. Horm Res 57, 145-152.
Meredith, C., Scott, M. P., Renwick, A. B., Price, R. J., and Lake, B. G. (2003). Studies on the induction of rat hepatic CYP1A, CYP2B, CYP3A and CYP4A subfamily form mRNAs in vivo and in vitro using precision-cut rat liver slices. Xenobiotica 33, 511-527.
Moronvalle-Halley, V., Sacre-Salem, B., Sallez, V., Labbe, G., and Gautier, J. C. (2005). Evaluation of cultured, precision-cut rat liver slices as a model to study drug-induced liver apoptosis. Toxicology 207, 203-214.
Muller, D., Glockner, R., and Rost, M. (1996). Monooxygenation, cytochrome P4501A1 and P4501A1-mRNA in rat liver slices exposed to beta-naphthoflavone and dexamethasone in vitro. Exp Toxicol Pathol 48, 433-438.
Nagel, S. C., Hagelbarger, J. L., and McDonnell, D. P. (2001). Development of an ER action indicator mouse for the study of estrogens, selective ER modulators (SERMs), and Xenobiotics. Endocrinology 142, 4721-4728.
Naor, Z., Harris, D., and Shacham, S. (1998). Mechanism of GnRH receptor signaling: combinatorial cross-talk of Ca2+ and protein kinase C. Front Neuroendocrinol 19, 1-19.
Nebert, D. W., Puga, A., and Vasiliou, V. (1993). Role of the Ah receptor and the dioxin-inducible [Ah] gene battery in toxicity, cancer, and signal transduction. Ann N Y Acad Sci 685, 624-640.
Oberley, T. D., Toyokuni, S., and Szweda, L. I. (1999). Localization of hydroxynonenal protein adducts in normal human kidney and selected human kidney cancers. Free Radic Biol Med 27, 695-703.

186
Okita, C., Sato, M., and Schroeder, T. (2004). Generation of optimized yellow and red fluorescent proteins with distinct subcellular localization. Biotechniques 36, 418-422, 424.
Olinga, P., Groen, K., Hof, I. H., De Kanter, R., Koster, H. J., Leeman, W. R., Rutten, A. A., Van Twillert, K., and Groothuis, G. M. (1997). Comparison of five incubation systems for rat liver slices using functional and viability parameters. J Pharmacol Toxicol Methods 38, 59-69.
Olinga, P., Hof, I. H., Merema, M. T., Smit, M., de Jager, M. H., Swart, P. J., Slooff, M. J., Meijer, D. K., and Groothuis, G. M. (2001). The applicability of rat and human liver slices to the study of mechanisms of hepatic drug uptake. J Pharmacol Toxicol Methods 45, 55-63.
Orban, P. C., Chui, D., and Marth, J. D. (1992). Tissue- and site-specific DNA recombination in transgenic mice. Proc Natl Acad Sci U S A 89, 6861-6865.
Paech, K., Webb, P., Kuiper, G. G., Nilsson, S., Gustafsson, J., Kushner, P. J., and Scanlan, T. S. (1997). Differential ligand activation of estrogen receptors ERalpha and ERbeta at AP1 sites. Science 277, 1508-1510.
Parrish, A. R., Zheng, X. H., Turney, K. D., Younis, H. S., and Gandolfi, A. J. (1999). Enhanced transcription factor DNA binding and gene expression induced by arsenite or arsenate in renal slices. Toxicol Sci 50, 98-105.
Perlman, A. J., Wolffe, A. P., Champion, J., and Tata, J. R. (1984). Regulation by estrogen receptor of vitellogenin gene transcription in Xenopus hepatocyte cultures. Mol Cell Endocrinol 38, 151-161.
Petersen, D. R., and Doorn, J. A. (2004). Reactions of 4-hydroxynonenal with proteins and cellular targets. Free Radic Biol Med 37, 937-945.
Pineau, T., Costet, P., Puel, O., Pfohl-Leszkowicz, A., Lesca, P., Alvinerie, M., and Galtier, P. (1998). Knockout animals in toxicology: assessment of toxin bioactivation pathways using mice deficient in xenobiotic metabolizing enzymes. Toxicol Lett 102-103, 459-464.
Portoles, M. T., Ainaga, M. J., Municio, A. M., and Pagani, R. (1991). Intracellular calcium and pH alterations induced by Escherichia coli endotoxin in rat hepatocytes. Biochim Biophys Acta 1092, 1-6.
Price, R. J., Ball, S. E., Renwick, A. B., Barton, P. T., Beamand, J. A., and Lake, B. G. (1998). Use of precision-cut rat liver slices for studies of xenobiotic metabolism and toxicity: comparison of the Krumdieck and Brendel tissue slicers. Xenobiotica 28, 361-371.
Pritchard, J. F., Jurima-Romet, M., Reimer, M. L., Mortimer, E., Rolfe, B., and Cayen, M. N. (2003). Making better drugs: Decision gates in non-clinical drug development. Nat Rev Drug Discov 2, 542-553.
Renwick, A. B., Watts, P. S., Edwards, R. J., Barton, P. T., Guyonnet, I., Price, R. J., Tredger, J. M., Pelkonen, O., Boobis, A. R., and Lake, B. G. (2000). Differential maintenance of cytochrome P450 enzymes in cultured precision-cut human liver slices. Drug Metab Dispos 28, 1202-1209.
187
Reus, I. S., Bando, I., Andres, D., and Cascales, M. (2003). Relationship between expression of HSP70 and metallothionein and oxidative stress during mercury chloride induced acute liver injury in rats. J Biochem Mol Toxicol 17, 161-168.
Rincon, M., and Flavell, R. A. (1994). AP-1 transcriptional activity requires both T-cell receptor-mediated and co-stimulatory signals in primary T lymphocytes. Embo J 13, 4370-4381.
Ristevski, S. (2005). Making better transgenic models: conditional, temporal, and spatial approaches. Mol Biotechnol 29, 153-163.
Robb-Gaspers, L. D., Rutter, G. A., Burnett, P., Hajnoczky, G., Denton, R. M., and Thomas, A. P. (1998). Coupling between cytosolic and mitochondrial calcium oscillations: role in the regulation of hepatic metabolism. Biochim Biophys Acta 1366, 17-32.
Romualdi, A., Niessen, H., Dombrowski, F., Willecke, K., and Ott, T. (2002). Quantitative analysis of gap-junctional intercellular communication in precision-cut mouse liver slices. Cell Tissue Res 307, 315-320.
Rootwelt, K. (1967). Quantitative determination of thiols and disulphides in urine by means of Ellman's reagent and thiolated Sephadex and its application in cystinuria. Scand J Clin Lab Invest 19, 325-330.
Rubin, D. B., Reznik, G., Weiss, E. A., and Young, P. R. (2000). Non-protein thiols flux to S-nitrosothiols in endothelial cells: an LPS redox signal. Shock 14, 200-207.
Safe, S. (2004). Endocrine disruptors and human health: is there a problem. Toxicology 205, 3-10.
Safe, S. H. (2000). Endocrine disruptors and human health--is there a problem? An update. Environ Health Perspect 108, 487-493.
Sambrook, J., and Gething, M. J. (1989). Protein structure. Chaperones, paperones. Nature 342, 224-225.
Sathya, G., Li, W., Klinge, C. M., Anolik, J. H., Hilf, R., and Bambara, R. A. (1997). Effects of multiple estrogen responsive elements, their spacing, and location on estrogen response of reporter genes. Mol Endocrinol 11, 1994-2003.
Sawyer, J. S., Daller, J. A., Brendel, K., Yohem, K., and Putnam, C. W. (1994). The hepatotoxicities of endotoxin and ethanol comparisons in vitro using the precision-cut rat liver slice model. Life Sci 55, 1407-1417.
Scaduto, R. C., Jr., and Grotyohann, L. W. (1999). Measurement of mitochondrial membrane potential using fluorescent rhodamine derivatives. Biophys J 76, 469-477.
Scott, R. E., Wu-Peng, X. S., Yen, P. M., Chin, W. W., and Pfaff, D. W. (1997). Interactions of estrogen- and thyroid hormone receptors on a progesterone receptor estrogen response element (ERE) sequence: a comparison with the vitellogenin A2 consensus ERE. Mol Endocrinol 11, 1581-1592.
Sebastia, J., Cristofol, R., Martin, M., Rodriguez-Farre, E., and Sanfeliu, C. (2003). Evaluation of fluorescent dyes for measuring intracellular glutathione content in primary cultures of human neurons and neuroblastoma SH-SY5Y. Cytometry A 51, 16-25.

188
Sedlak, J., and Lindsay, R. H. (1968). Estimation of total, protein-bound, and nonprotein sulfhydryl groups in tissue with Ellman's reagent. Anal Biochem 25, 192-205.
Shringarpure, R., Grune, T., Sitte, N., and Davies, K. J. (2000). 4-Hydroxynonenal-modified amyloid-beta peptide inhibits the proteasome: possible importance in Alzheimer's disease. Cell Mol Life Sci 57, 1802-1809.
Simon, A. M., and McWhorter, A. R. (2003). Decreased intercellular dye-transfer and downregulation of non-ablated connexins in aortic endothelium deficient in connexin37 or connexin40. J Cell Sci 116, 2223-2236.
Simoncini, T., Fornari, L., Mannella, P., Varone, G., Caruso, A., Liao, J. K., and Genazzani, A. R. (2002). Novel non-transcriptional mechanisms for estrogen receptor signaling in the cardiovascular system. Interaction of estrogen receptor alpha with phosphatidylinositol 3-OH kinase. Steroids 67, 935-939.
Smith, P. F., Fisher, R., Shubat, P. J., Gandolfi, A. J., Krumdieck, C. L., and Brendel, K. (1987). In vitro cytotoxicity of allyl alcohol and bromobenzene in a novel organ culture system. Toxicol Appl Pharmacol 87, 509-522.
Smith, P. F., Gandolfi, A. J., Krumdieck, C. L., Putnam, C. W., Zukoski, C. F., 3rd, Davis, W. M., and Brendel, K. (1985). Dynamic organ culture of precision liver slices for in vitro toxicology. Life Sci 36, 1367-1375.
Smith, P. F., Krack, G., McKee, R. L., Johnson, D. G., Gandolfi, A. J., Hruby, V. J., Krumdieck, C. L., and Brendel, K. (1986). Maintenance of adult rat liver slices in dynamic organ culture. In Vitro Cell Dev Biol 22, 706-712.
Thomas, P. J., Gaspers, L. D., Pharr, C., and Thomas, J. A. (1991). Continuous measurement of mitochondrial pH gradients in isolated hepatocytes by difference ratio spectroscopy. Arch Biochem Biophys 288, 250-260.
Toda, K., Okada, Y., Zubair, M., Morohashi, K., Saibara, T., and Okada, T. (2004). Aromatase-knockout mouse carrying an estrogen-inducible enhanced green fluorescent protein gene facilitates detection of estrogen actions in vivo. Endocrinology 145, 1880-1888.
Toutain, H. J., Moronvalle-Halley, V., Sarsat, J. P., Chelin, C., Hoet, D., and Leroy, D. (1998). Morphological and functional integrity of precision-cut rat liver slices in rotating organ culture and multiwell plate culture: effects of oxygen tension. Cell Biol Toxicol 14, 175-190.
Toutain, H. J., Sarsat, J. P., Bouant, A., Hoet, D., Leroy, D., and Moronvalle-Halley, V. (1996). Precision-cut dog renal cortical slices in dynamic organ culture for the study of cisplatin nephrotoxicity. Cell Biol Toxicol 12, 289-298.
Tran, N. N., Leroy, P., Bellucci, L., Robert, A., Nicolas, A., Atkinson, J., and Capdeville-Atkinson, C. (1995). Intracellular concentrations of fura-2 and fura-2/am in vascular smooth muscle cells following perfusion loading of fura-2/am in arterial segments. Cell Calcium 18, 420-428.
Traverso, G., Diehl, F., Hurst, R., Shuber, A., Whitney, D., Johnson, C., Levin, B., Kinzler, K. W., and Vogelstein, B. (2003). Multicolor in vitro translation. Nat Biotechnol 21, 1093-1097.

189
Tsirigotis, M., Thurig, S., Dube, M., Vanderhyden, B. C., Zhang, M., and Gray, D. A. (2001). Analysis of ubiquitination in vivo using a transgenic mouse model. Biotechniques 31, 120-126, 128, 130.
Turney, K. D., Parrish, A. R., Orozco, J., and Gandolfi, A. J. (1999). Selective activation in the MAPK pathway by Hg(II) in precision-cut rabbit renal cortical slices. Toxicol Appl Pharmacol 160, 262-270.
Tyler, C. R., Jobling, S., and Sumpter, J. P. (1998). Endocrine disruption in wildlife: a critical review of the evidence. Crit Rev Toxicol 28, 319-361.
Ueda, T., Takeyama, Y., Hori, Y., Takase, K., Goshima, M., and Kuroda, Y. (2000). Pancreatitis-associated ascitic fluid increases intracellular Ca(2+) concentration on hepatocytes. J Surg Res 93, 171-176.
van de Bovenkamp, M., Groothuis, G. M., Draaisma, A. L., Merema, M. T., Bezuijen, J. I., van Gils, M. J., Meijer, D. K., Friedman, S. L., and Olinga, P. (2005). Precision-cut liver slices as a new model to study toxicity-induced hepatic stellate cell activation in a physiologic milieu. Toxicol Sci 85, 632-638.
van De Water, B., Wang, Y., Asmellash, S., Liu, H., Zhan, Y., Miller, E., and Stevens, J. L. (1999). Distinct endoplasmic reticulum signaling pathways regulate apoptotic and necrotic cell death following iodoacetamide treatment. Chem Res Toxicol 12, 943-951.
Vickers, A. E., and Fisher, R. L. (2004). Organ slices for the evaluation of human drug toxicity. Chem Biol Interact 150, 87-96.
Vieira, O., Escargueil-Blanc, I., Jurgens, G., Borner, C., Almeida, L., Salvayre, R., and Negre-Salvayre, A. (2000). Oxidized LDLs alter the activity of the ubiquitin-proteasome pathway: potential role in oxidized LDL-induced apoptosis. Faseb J 14, 532-542.
Visen, P. K., Saraswat, B., and Dhawan, B. N. (1998). Curative effect of picroliv on primary cultured rat hepatocytes against different hepatotoxins: an in vitro study. J Pharmacol Toxicol Methods 40, 173-179.
Wang, T., Shankar, K., Ronis, M. J., and Mehendale, H. M. (2000). Potentiation of thioacetamide liver injury in diabetic rats is due to induced CYP2E1. J Pharmacol Exp Ther 294, 473-479.
Witorsch, R. J. (2002). Endocrine disruptors: can biological effects and environmental risks be predicted? Regul Toxicol Pharmacol 36, 118-130.
Wolf, C. R., and Henderson, C. J. (1998). Use of transgenic animals in understanding molecular mechanisms of toxicity. J Pharm Pharmacol 50, 567-574.
Wong, J. H., Balmer, Y., Cai, N., Tanaka, C. K., Vensel, W. H., Hurkman, W. J., and Buchanan, B. B. (2003). Unraveling thioredoxin-linked metabolic processes of cereal starchy endosperm using proteomics. FEBS Lett 547, 151-156.
Wood, J. R., Greene, G. L., and Nardulli, A. M. (1998). Estrogen response elements function as allosteric modulators of estrogen receptor conformation. Mol Cell Biol 18, 1927-1934.
Wueweera, J. B., Gandolfi, A. J., Badger, D. A., Sipes, I. G., and Brendel, K. (1996). Vitamin A potentiation of vinylidene chloride hepatotoxicity in rats and precision-cut rat liver slices. Fundam Appl Toxicol 34, 73-83.

190
Yang, M., Luo, Y., and Liu, Y. (1992). Potential use of luminol-dependent chemiluminescence for estimation of free radicals produced in hepatic microsomes and reconstituted cytochrome P-450 systems. Biomed Environ Sci 5, 336-348.
Zhang, Q. Y., He, W., Dunbar, D., and Kaminsky, L. (1997). Induction of CYP1A1 by beta-naphthoflavone in IEC-18 rat intestinal epithelial cells and potentiation of induction by dibutyryl cAMP. Biochem Biophys Res Commun 233, 623-626.
Zhang, S. Z., Lipsky, M. M., Trump, B. F., and Hsu, I. C. (1990). Neutral red (NR) assay for cell viability and xenobiotic-induced cytotoxicity in primary cultures of human and rat hepatocytes. Cell Biol Toxicol 6, 219-234.
Zhong, S., Quealy, J. A., Bode, A. M., Nomura, M., Kaji, A., Ma, W. Y., and Dong, Z. (2001a). Organ-specific activation of activator protein-1 in transgenic mice by 12-o-tetradecanoylphorbol-13-acetate with different administration methods. Cancer Res 61, 4084-4091.
Zhong, S. P., Ma, W. Y., Quealy, J. A., Zhang, Y., and Dong, Z. (2001b). Organ-specific distribution of AP-1 in AP-1 luciferase transgenic mice during the maturation process. Am J Physiol Regul Integr Comp Physiol 280, R376-381.