DERIVATION OF WALK-IN COOLER AND FREEZER PERFORMANCE ...
516
DERIVATION OF WALK-IN COOLER AND FREEZER PERFORMANCE STANDARD EQUATIONS AS THEY PERTAIN TO THE ANSI/AHRI STANDARD 1250 AND 1251 A THESIS IN Mechanical Engineering Presented to the Faculty of the University of Missouri-Kansas City in partial fulfillment of the requirements for the degree MASTER OF SCIENCE by BRYAN CURTIS SARTIN B.S., University of Missouri – Rolla, 2008 Kansas City, Missouri 2012
Transcript of DERIVATION OF WALK-IN COOLER AND FREEZER PERFORMANCE ...
DERIVATION OF WALK-IN COOLER AND FREEZER PERFORMANCE
STANDARD EQUATIONS AS THEY PERTAIN TO THE
ANSI/AHRI STANDARD 1250 AND 1251
A THESIS IN
Mechanical Engineering
Presented to the Faculty of the University
of Missouri-Kansas City in partial fulfillment of
the requirements for the degree
MASTER OF SCIENCE
by
BRYAN CURTIS SARTIN
B.S., University of Missouri – Rolla, 2008
Kansas City, Missouri
2012

© 2012
BRYAN CURTIS SARTIN
ALL RIGHTS RESERVED

iii
DERIVATION OF WALK-IN COOLER AND FREEZER PERFORMANCE
STANDARD EQUATIONS AS THEY PERTAIN TO THE
ANSI/AHRI STANDARD 1250 AND 1251
Bryan Curtis Sartin, Candidate for the Master of Science Degree
University of Missouri-Kansas City, 2012
ABSTRACT
The ANSI/AHRI1 Standard 1250/1251 Performance Rating of Walk-In Coolers and
Freezers strives to standardize refrigeration equipment performance rating. According to
the Standard, refrigeration equipment is tested in a laboratory setting using a defined test
method. An existing algorithm is used to calculate the Annual Walk-in Energy Factor
(AWEF) which serves as a comparison of energy efficiency between equipment. In this
work the algorithm was modified in an attempt to more closely approximate actual
refrigeration system operation.
To calculate the AWEF, a walk-in box load profile and a ratio of the equipment
capacity to the refrigeration load are assumed by the Standard. An extensive literature
1 American National Standard Institute (ANSI)/ Air-Conditioning, Heating, and
Refrigeration Institute (AHRI).

iv
review of ninety-eight articles was performed to address these assumptions. Information
was categorized and analyzed for each load component, including lighting, occupancy,
product, infiltration, conduction, and miscellaneous loads. Additional information was
collected on refrigeration system design and operation. A model load profile was
developed from which a revised AWEF algorithm was obtained.
Simulations were performed on four walk-in refrigeration units to validate the
revised calculation method. Raw results show improved correlation of compressor runtime,
because a specific compressor runtime was targeted, reducing variation between hourly
simulations and the 1250 calculation from -29.9% with the AHRI 1250 calculation (Becker
et al. 2011) to 1.1% with the Proposed 1250 calculation. AWEF correlation between hourly
simulations and the 1250 calculation degraded from -7.4% with the AHRI 1250 calculation
(Becker et al. 2011) to 15.9% with the Proposed 1250 calculation. Plotting the results for
the AWEF and compressor runtime correlation versus variation in the box load, between
the hourly simulation and Proposed 1250 calculation results, revealed an issue with the
compressor runtime calculation. At a box load variation of zero, the Proposed 1250 AWEF
correlation is improved to -2.4%, and the Proposed 1250 compressor runtime correlation is
degraded to -14.6%. If a specific compressor runtime had not been targeted, the AWEF
correlation for each simulation set would have been improved. To summarize, the Proposed
1250 equations yield an improved AWEF calculation but do not accurately calculate the
corresponding compressor runtime.

v
APPROVAL PAGE
The faculty listed below, appointed by the Dean of the School of Computing and
Engineering have examined a thesis titled “Derivation of Walk-in Cooler and Freezer
Performance Standard Equations as they Pertain to the ANSI/AHRI Standard 1250 and
1251”, presented by Bryan C. Sartin, candidate for the Master of Science degree, and
certify that in their opinion it is worthy of acceptance.
Supervisory Committee
Bryan Becker, Ph.D., P.E., F.ASME
Department of Civil and Mechanical Engineering
Ganesh Thiagarajan, Ph.D, P.E.
Department of Civil and Mechanical Engineering
Gregory King, Ph.D.
Department of Civil and Mechanical Engineering

vi
CONTENTS
ABSTRACT.......................................................................................................................... iii
LIST OF ILLUSTRATIONS ...............................................................................................xiv
LIST OF TABLES ...............................................................................................................xvi
LIST OF ABBREVIATIONS ............................................................................................xxvi
ACKNOWLEDGEMENTS .............................................................................................. xxxv
Chapter
1. INTRODUCTION ...................................................................................................... 1
Walk-in Refrigeration ........................................................................................... 1
ANSI/AHRI 1250/1251 Standard ......................................................................... 3
2. REVIEW OF CURRENT WORK .............................................................................. 6
3. LITERATURE REVIEW AND INDUSTRY INVESTIGATION .......................... 12
Review of General Refrigeration ........................................................................ 13
Refrigeration System Design ........................................................................ 13
(Huan 2008) ............................................................................................ 13
(Bansal and Jain 2007) ............................................................................ 14
(SCE 2009) ............................................................................................. 14
General Load Details .................................................................................... 16
(Sherif et al. 2002) .................................................................................. 16
(PG&E 2007) .......................................................................................... 18
Product Load ................................................................................................. 24
(Gortner et al. 1948)................................................................................ 24
(Hustrulid and Winters 1943) ................................................................. 25
vii
(Woodroof and Shelor 1947) .................................................................. 25
(Becker and Fricke 1996a) ...................................................................... 26
(Love and Cleland 2007) ........................................................................ 26
Evaporator Application and Defrost ............................................................. 27
(Nelson) .................................................................................................. 27
(O'Hagan et al. 1993) .............................................................................. 28
(Cleland and O'Hagan 2003) .................................................................. 30
(Mago and Sherif 2005) .......................................................................... 32
Infiltration Load ............................................................................................ 34
(Takahashi and Inoh 1963) ..................................................................... 34
(Gosney and Olama 1975) ...................................................................... 34
(Longdill and Wyborn 1978) .................................................................. 37
(Jones et al. 1983) ................................................................................... 40
(Pham and Oliver 1983) .......................................................................... 41
(Hendrix et al. 1989) ............................................................................... 45
(Foster et al. 2003) .................................................................................. 48
(Elsayed 1998) ........................................................................................ 49
(Chen et al. 2002; Cleland et al. 2004) ................................................... 52
Review of Industrial Refrigeration ..................................................................... 58
Refrigeration System Design ........................................................................ 58
(Cooper 1973) ......................................................................................... 58
(Krack 1977) ........................................................................................... 60
(Stoecker 1998) ....................................................................................... 67
viii
(Zhang and Groll 2005) .......................................................................... 78
(Stegmann 2000) ..................................................................................... 81
(USDA 2010) .......................................................................................... 82
General Load Details .................................................................................... 83
(Kun et al. 2007) ..................................................................................... 83
(Ashby et al. 1979).................................................................................. 83
(Cleland 1983) ........................................................................................ 84
(Navy 1986) ............................................................................................ 85
(Adre and Hellickson 1989) .................................................................... 89
(Altwies 1998; Altwies and Reindl 1999) .............................................. 90
(Manske 1999) ........................................................................................ 96
(Stoeckle 2000) ..................................................................................... 103
(Stoeckle et al. 2002) ............................................................................ 106
(Magoo 2003) ....................................................................................... 107
(Roy 2010) ............................................................................................ 112
Lighting Load ............................................................................................. 113
(Rea 2000)............................................................................................. 113
Product Load ............................................................................................... 113
(Aparicio-Cuesta and Garcia-Moreno 1988) ........................................ 113
(Wade 1984) ......................................................................................... 113
(Devres and Bishop 1995) .................................................................... 114
(CIGR 1999) ......................................................................................... 116
(Chourasia and Goswami 2007) ........................................................... 121

ix
Infiltration Load .......................................................................................... 123
(Hayes and Stoecker 1969) ................................................................... 123
(Cole 1987) ........................................................................................... 124
(Chen et al. 1999).................................................................................. 128
(Reindl and Jekel 2008) ........................................................................ 131
Review of Commercial Refrigeration ............................................................... 131
Refrigeration System Design ...................................................................... 132
(Knudsen and Pachai 2004) .................................................................. 132
(Walker 1992) ....................................................................................... 132
(Patel et al. 1993) .................................................................................. 135
(Sezgen and Koomey 1995) .................................................................. 138
(Westphalen et al. 1996) ....................................................................... 139
(Sami and Tulej 1996) .......................................................................... 143
(Sand et al. 1997) .................................................................................. 144
(Kimber 1998)....................................................................................... 146
(Walker 2001) ....................................................................................... 147
(Nagaraju et al. 2001) ........................................................................... 157
(Marchese 2002) ................................................................................... 158
(Walker and Baxter 2002)..................................................................... 158
(Christensen and Bertilsen 2004) .......................................................... 161
(Sekhar et al. 2004) ............................................................................... 162
(Sekhar and Lal 2005)........................................................................... 162
(Arias 2005; Arias and Lundqvist 2006) .............................................. 163
x
(Zhang 2006)......................................................................................... 166
(Hwang et al. 2007) .............................................................................. 171
(Sugiartha et al. 2009) ........................................................................... 171
(Royal 2010) ......................................................................................... 172
(Morris 2012) ........................................................................................ 175
General Load Details .................................................................................. 176
(Walker et al. 1990) .............................................................................. 176
(Anonymous 2004) ............................................................................... 182
(PG&E 2004) ........................................................................................ 182
(Heatcraft 2008) .................................................................................... 183
(SCE 2008) ........................................................................................... 191
(Goetzler et al. 2009) ............................................................................ 192
(DOE 2010b)......................................................................................... 195
(DOE 2010c) ......................................................................................... 199
(Becker et al. 2011) ............................................................................... 200
(Blackmore 2012) ................................................................................. 203
Ground Temperature ................................................................................... 204
(DOE 2010a) ......................................................................................... 204
(Newell 2011) ....................................................................................... 204
(Somrani et al. 2008) ............................................................................ 205
(Chuangchid and Krarti 2001) .............................................................. 205
Evaporator Application and Defrost ........................................................... 206
(Smith 1989a) ....................................................................................... 206
xi
(Faramarzi 1999)................................................................................... 206
(Sujau et al. 2006) ................................................................................. 208
Lighting Load ............................................................................................. 208
(Kassa et al. 2004) ................................................................................ 208
Infiltration Load .......................................................................................... 209
(Fricke and Becker 2011) ..................................................................... 209
Ambient and Box Conditions ..................................................................... 211
(Mitchell et al. 1992) ............................................................................ 211
(Thompson and Spinoglio 1996) .......................................................... 211
(Henderson and Khattar 1999) .............................................................. 212
(Wichman and Braun 2009) .................................................................. 216
(Edwards 2010) ..................................................................................... 216
4. DEVELOPMENT OF PROPOSED MODEL LOAD PROFILE ........................... 218
Walk-in Boxes .................................................................................................. 218
Site Conditions ............................................................................................ 218
Infiltration Protection .................................................................................. 230
Door Details ................................................................................................ 234
Walk-in Coolers ................................................................................................ 245
Box Interior Conditions .............................................................................. 245
Box Conduction .......................................................................................... 258
Infiltration ................................................................................................... 270
Product ........................................................................................................ 280
Lighting and Occupancy ............................................................................. 295
xii
Miscellaneous Loads................................................................................... 303
Defrost ........................................................................................................ 307
Loading Summary....................................................................................... 314
Walk-In Freezers............................................................................................... 315
Box Interior Conditions .............................................................................. 315
Box Conduction .......................................................................................... 327
Infiltration ................................................................................................... 341
Product ........................................................................................................ 350
Lighting and Occupancy ............................................................................. 360
Miscellaneous Loads................................................................................... 366
Defrost ........................................................................................................ 370
Loading Summary....................................................................................... 376
Summary ........................................................................................................... 378
5. DEVELOPMENT OF PROPOSED AHRI STANDARD 1250/1251
EQUATIONS.................................................................................................... 379
Modifications to Calculation Method ............................................................... 379
Proposed Model Load Calculation Inputs ........................................................ 383
Proposed Model Load Hourly Calculations...................................................... 388
AHRI Standard 1250/1251 Box Load Calculation ........................................... 408
Determination of the BLL/BLH ....................................................................... 410
Comparison of Proposed Box Load Equations to AHRI Standard
1250/1251 Equations .................................................................................. 419
Analysis of the Proposed Model Load .............................................................. 420
6. EQUEST SIMULATIONS ..................................................................................... 425
xiii
Small Cooler Equipment Sizing ....................................................................... 428
Small Freezer Equipment Sizing ...................................................................... 430
Large Cooler Equipment Sizing ....................................................................... 432
Large Freezer Equipment Sizing ...................................................................... 434
eQuest Hourly Simulation Setup and Procedure .............................................. 436
eQuest AHRI 1250 Test Simulation Setup and Procedure ............................... 437
eQuest Simulation Results ................................................................................ 438
7. PROPOSED 1250 CALCULATION METHOD DISCUSSION ........................... 463
8. CONCLUSIONS .................................................................................................... 467
REFERENCES .................................................................................................................. 469
VITA .................................................................................................................................. 479

xiv
LIST OF ILLUSTRATIONS
Figure Page
1. Defrost Classifications .............................................................................................. 29
2. Air Velocity Profile for Test Door at 54°F Temperature Difference ....................... 43
3. Air Change versus Door Opening Duration ............................................................. 44
4. Effect of Door Opening Duration on the Ratio of Measured and
Predicted Air Flow with a Rapid-Roll Door without Strip
Curtain .......................................................................................................... 56
5. Air Infiltration Rate in CFM vs. Room Volume ..................................................... 124
6. Steady State vs. Transient Heat Gain Through an Open Door
Assuming 10 ft High by 6.6 ft Wide ........................................................... 126
7. Cyclical Door Operation Correction Factor vs. Frequency of
Operation for a Freezer with a 8.2 ft High Door Held at -
10°F ............................................................................................................. 127
8. Compressor Runtime vs. Load to Capacity Ratio Analysis.................................... 417
9. AHRI or Proposed 1250 Calculated AWEF vs. Hourly Simulation
AWEF Comparison for (Becker et al. 2011) and the
Current Work, Condenser Indoors .............................................................. 457
10. AHRI or Proposed 1250 Calculated AWEF vs. Hourly Simulation
AWEF Comparison for (Becker et al. 2011) and the
Current Work, Condenser Outdoors ........................................................... 458
11. Percent Difference in AWEF vs. Percent Difference in Runtime for
Proposed 1250 and AHRI 1250 (Becker et al. 2011) vs.
Hourly Simulations, Box Out Condenser Out ............................................ 459
12. Percent Difference in AWEF vs. Percent Difference in Runtime for
Proposed 1250 and AHRI 1250 (Becker et al. 2011) vs.
Hourly Simulations, Box In Condenser In.................................................. 460
13. AWEF vs. Runtime for eQuest Hourly Simulations of Current
Work and (Becker et al. 2011) .................................................................... 461

xv
14. AWEF vs. Runtime Percentage for Proposed 1250 Calculation and
Hourly Simulations ..................................................................................... 462
15. Percentage Variation of AWEF and Runtime vs. Box Load
Variation Between Hourly Simulations and Proposed 1250
Calculations ................................................................................................ 466
xvi
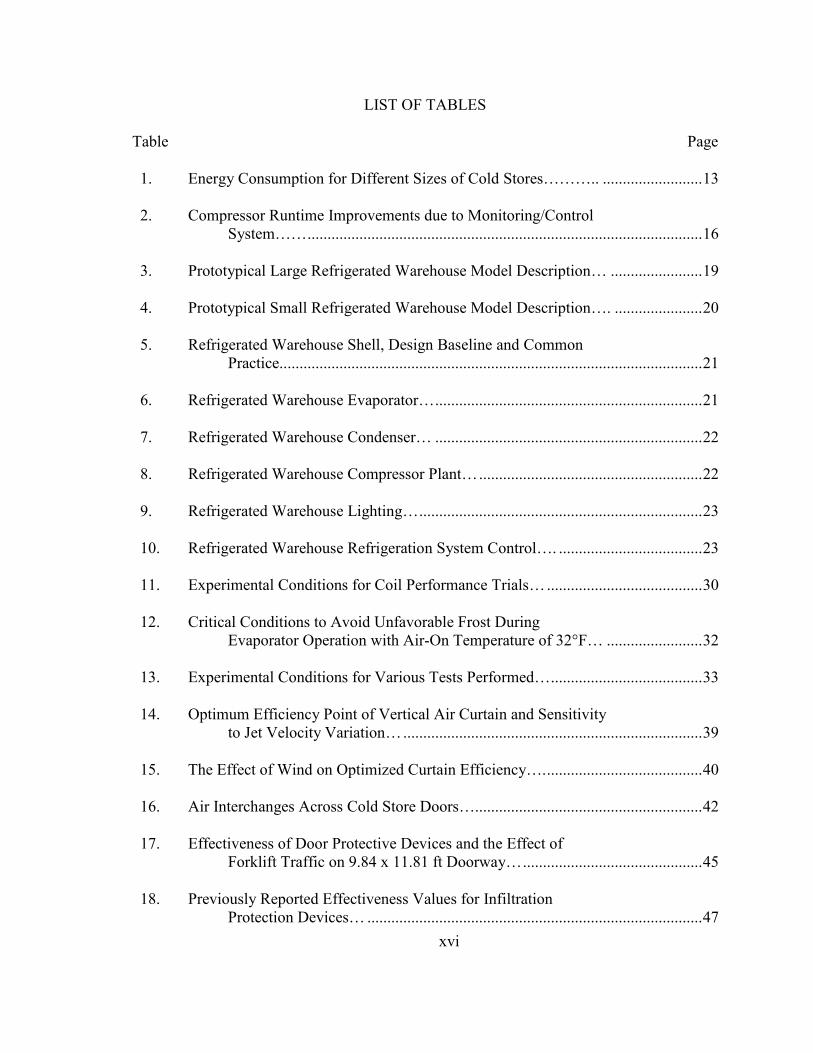
LIST OF TABLES
Table Page
1. Energy Consumption for Different Sizes of Cold Stores……….. ......................... 13
2. Compressor Runtime Improvements due to Monitoring/Control
System…… ................................................................................................... 16
3. Prototypical Large Refrigerated Warehouse Model Description… ....................... 19
4. Prototypical Small Refrigerated Warehouse Model Description…. ...................... 20
5. Refrigerated Warehouse Shell, Design Baseline and Common
Practice.......................................................................................................... 21
6. Refrigerated Warehouse Evaporator… ................................................................... 21
7. Refrigerated Warehouse Condenser… ................................................................... 22
8. Refrigerated Warehouse Compressor Plant… ........................................................ 22
9. Refrigerated Warehouse Lighting… ....................................................................... 23
10. Refrigerated Warehouse Refrigeration System Control…. .................................... 23
11. Experimental Conditions for Coil Performance Trials… ....................................... 30
12. Critical Conditions to Avoid Unfavorable Frost During
Evaporator Operation with Air-On Temperature of 32°F… ........................ 32
13. Experimental Conditions for Various Tests Performed… ...................................... 33
14. Optimum Efficiency Point of Vertical Air Curtain and Sensitivity
to Jet Velocity Variation… ........................................................................... 39
15. The Effect of Wind on Optimized Curtain Efficiency…. ....................................... 40
16. Air Interchanges Across Cold Store Doors…......................................................... 42
17. Effectiveness of Door Protective Devices and the Effect of
Forklift Traffic on 9.84 x 11.81 ft Doorway… ............................................. 45
18. Previously Reported Effectiveness Values for Infiltration
Protection Devices… .................................................................................... 47

xvii
19. Description of Refrigerated Warehouses and Doors Tested… ............................... 52
20. Measured Airtightness, Door Flow Factor, Strip-Curtain
Effectiveness and Air Infiltration Due to Forklift Traffic…. ....................... 55
21. Solar Radiation Allowance… ................................................................................. 61
22. Average Air Changes per 24 Hrs for Medium Temperature
(Above 32°F) and Low Temperature (Below 32°F) Rooms
Due to Infiltration and Door Openings.... ..................................................... 62
23. Occupancy Heat.... .................................................................................................. 64
24. Insulating K-Factors... ............................................................................................ 67
25. Recommended Storage Temperatures for Several Unfrozen Food
Products… .................................................................................................... 69
26. Heat of Respiration of Several Unfrozen Fruits and Vegetables… ........................ 70
27. Specific Heats and Latent Heats of Several Food Products… ............................... .71
28. Thermal Properties of Some Insulating Materials…. ............................................. 72
29. Conductance and Resistance of Some Materials… ................................................ 72
30. Convection Coefficients for Various Surface… ..................................................... 73
31. Thermal Resistances and Recommended Applications of
Prefabricated Wall and Ceiling Panels… ..................................................... 73
32. Heat Equivalence of Occupants… .......................................................................... 75
33. Typical Temperatures of the Heat Sources in a Two-Stage
Refrigeration Plant… .................................................................................... 77
34. Waste Heat Applications and Temperature Levels…............................................. 78
35. Refrigeration Load for Several Applications… ...................................................... 78
36. Physical Sizes of 62 Public Refrigerated Warehouses….. ..................................... 79
37. Refrigerants Used in Public Refrigerated Warehouses… ....................................... 79
38. Compression Stages in 62 Public Refrigerated Warehouses…. ............................. 80

xviii
39. Types of Intercoolers in 49 Public Refrigerated Warehouses…. ........................... 80
40. Minimum Low Temperatures for Two-stage Single Refrigerant
Systems… ..................................................................................................... 82
41. Typical Storage Conditions for Various Applications… ........................................ 86
42. Typical “U” Factors for Walls and Roofs… ........................................................... 87
43. Recommended R-Values for Various Applications…............................................ 87
44. Comparative Refrigerant Performance…. .............................................................. 89
45. Summary of Previous Frozen Food Quality Research…........................................ 92
46. Summary of Vegetables Stored in the Low Temperature
Facility…. ..................................................................................................... 93
47. Property Data for Vegetables, Air, and Water Applied to the
Model for the Low Temperature Facility… ................................................. 94
48. Warehouse Construction Details… ........................................................................ 95
49. Conditioned Space Summary….............................................................................. 97
50. Internal Space Loads…. ........................................................................................ 100
51. Recommended Performance Monitoring Measurements…. ................................ 101
52. Energy Savings Comparisons between Optimization
Techniques…. ............................................................................................. 102
53. Yearly Cooling Load Comparison for Light and Massive
Construction Types…. ................................................................................ 105
54. Suggested Resistance Values for Refrigerated Storage Facilities.. ...................... 109
55. Storage Temperature for Various Crops… ........................................................... 117
56. Coefficients for Carbon Dioxide Production by Commodities… ........................ 119
57. Effect of Temperature and Oxygen Concentration on the
Respiratory Rate of Various Commodities… ............................................. 120
58. Cooling and Rates Analyzed................................................................................. 122

xix
59. Effectiveness of Different Infiltration Reduction Techniques on
Rapid Roll Doors… .................................................................................... 131
60. Refrigerated Walk-in Boxes in the Test Store… .................................................. 134
61. Analysis of Low Temperature Walk-in Box Test Results… ................................ 135
62. Unitary and Centralized System Inventory, Performance, and
Energy Usage Data… ................................................................................. 138
63. Identified Energy Savings Potential… ................................................................. 140
64. Characteristics of the Baseline Cooler and Freezer… .......................................... 143
65. TEWI for Low and Medium Temperature Direct Expansion
Refrigerant System in North America… .................................................... 146
66. Parameters Used For Refrigeration System Analysis… ....................................... 150
67. Heat Rejection System Specifications for Refrigeration
Modeling…. ................................................................................................ 152
68. Design Ambient Conditions for Supermarket Analysis…. .................................. 154
69. Description of Modeled Cases and Coolers… ...................................................... 155
70. Low-Charge System Energy Savings for Supermarket Analysis in
Washington, DC…...................................................................................... 156
71. Total Equivalent Warming Impact for Analyzed Systems in
Washington, DC…...................................................................................... 156
72. Estimated Annual Combined Operating Cost of Supermarket
Refrigeration and HVAC Systems in Washington, DC… .......................... 157
73. Energy Consumption Comparison Between Multiplex and
Distributed Refrigeration Systems… .......................................................... 160
74. TEWI Analysis for the Field Test Results… ........................................................ 160
75. Walk-in and Display Cabinet Details for Denmark
Supermarket… ............................................................................................ 162
76. Field Test Supermarket Details............................................................................. 165
xx
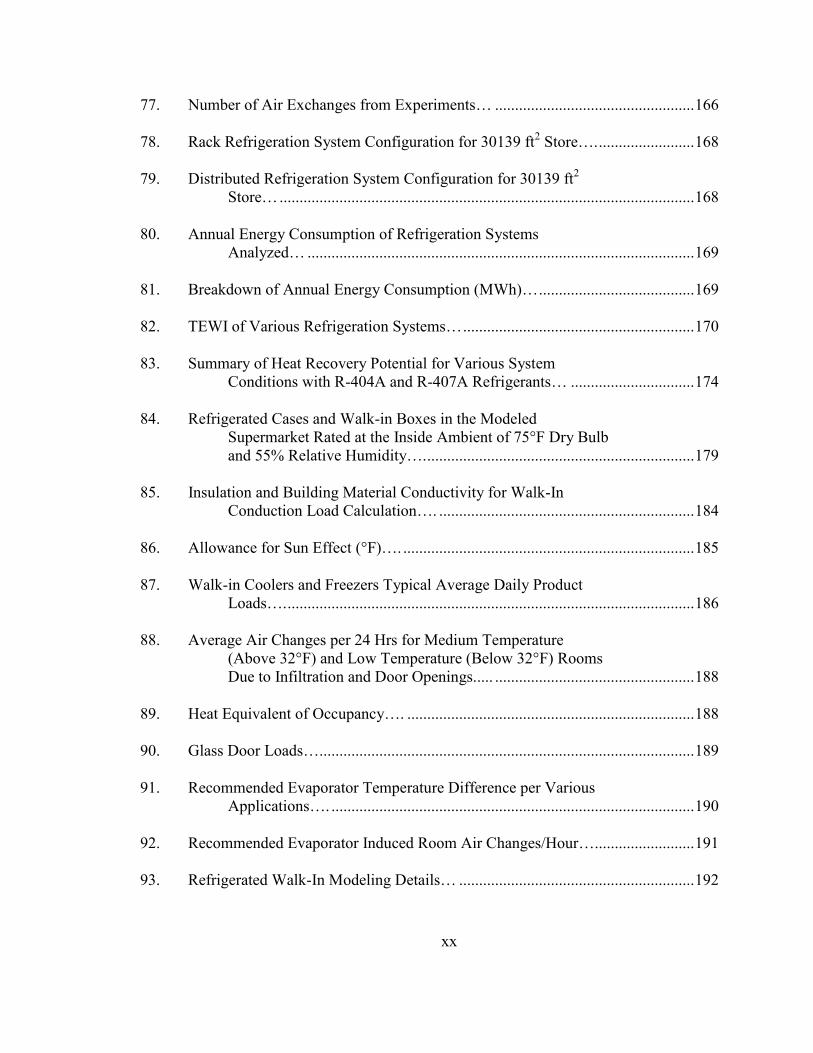
77. Number of Air Exchanges from Experiments… .................................................. 166
78. Rack Refrigeration System Configuration for 30139 ft2 Store…. ........................ 168
79. Distributed Refrigeration System Configuration for 30139 ft2
Store… ........................................................................................................ 168
80. Annual Energy Consumption of Refrigeration Systems
Analyzed… ................................................................................................. 169
81. Breakdown of Annual Energy Consumption (MWh)… ....................................... 169
82. TEWI of Various Refrigeration Systems… .......................................................... 170
83. Summary of Heat Recovery Potential for Various System
Conditions with R-404A and R-407A Refrigerants… ............................... 174
84. Refrigerated Cases and Walk-in Boxes in the Modeled
Supermarket Rated at the Inside Ambient of 75°F Dry Bulb
and 55% Relative Humidity…. ................................................................... 179
85. Insulation and Building Material Conductivity for Walk-In
Conduction Load Calculation…. ................................................................ 184
86. Allowance for Sun Effect (°F)…. ......................................................................... 185
87. Walk-in Coolers and Freezers Typical Average Daily Product
Loads…. ...................................................................................................... 186
88. Average Air Changes per 24 Hrs for Medium Temperature
(Above 32°F) and Low Temperature (Below 32°F) Rooms
Due to Infiltration and Door Openings..... .................................................. 188
89. Heat Equivalent of Occupancy…. ........................................................................ 188
90. Glass Door Loads….............................................................................................. 189
91. Recommended Evaporator Temperature Difference per Various
Applications…. ........................................................................................... 190
92. Recommended Evaporator Induced Room Air Changes/Hour…......................... 191
93. Refrigerated Walk-In Modeling Details… ........................................................... 192
xxi
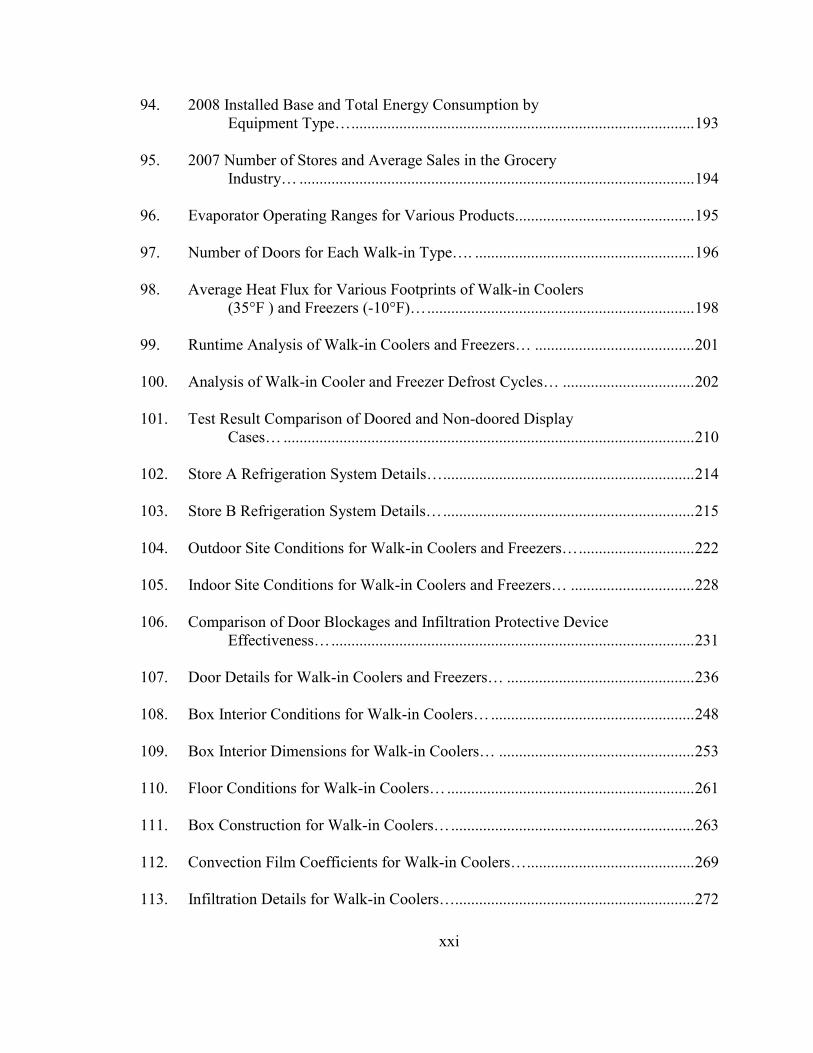
94. 2008 Installed Base and Total Energy Consumption by
Equipment Type… ...................................................................................... 193
95. 2007 Number of Stores and Average Sales in the Grocery
Industry… ................................................................................................... 194
96. Evaporator Operating Ranges for Various Products............................................. 195
97. Number of Doors for Each Walk-in Type…. ....................................................... 196
98. Average Heat Flux for Various Footprints of Walk-in Coolers
(35°F ) and Freezers (-10°F)… ................................................................... 198
99. Runtime Analysis of Walk-in Coolers and Freezers… ........................................ 201
100. Analysis of Walk-in Cooler and Freezer Defrost Cycles… ................................. 202
101. Test Result Comparison of Doored and Non-doored Display
Cases… ....................................................................................................... 210
102. Store A Refrigeration System Details… ............................................................... 214
103. Store B Refrigeration System Details… ............................................................... 215
104. Outdoor Site Conditions for Walk-in Coolers and Freezers… ............................. 222
105. Indoor Site Conditions for Walk-in Coolers and Freezers… ............................... 228
106. Comparison of Door Blockages and Infiltration Protective Device
Effectiveness… ........................................................................................... 231
107. Door Details for Walk-in Coolers and Freezers… ............................................... 236
108. Box Interior Conditions for Walk-in Coolers… ................................................... 248
109. Box Interior Dimensions for Walk-in Coolers… ................................................. 253
110. Floor Conditions for Walk-in Coolers… .............................................................. 261
111. Box Construction for Walk-in Coolers… ............................................................. 263
112. Convection Film Coefficients for Walk-in Coolers… .......................................... 269
113. Infiltration Details for Walk-in Coolers…............................................................ 272

xxii
114. Product Loading for Walk-in Coolers… .............................................................. 283
115. Product Sensible and Latent Thermal Properties for Walk-in
Coolers.. ...................................................................................................... 291
116. Lighting and Occupancy Load Details for Walk-in Coolers… ............................ 297
117. Miscellaneous Load Details for Walk-in Coolers…............................................. 304
118. Defrost Details for Walk-in Coolers… ................................................................. 308
119. Box Interior Conditions for Walk-in Freezers… .................................................. 319
120. Box Interior Dimensions for Walk-in Freezers… ................................................ 323
121. Floor Conditions for Walk-in Freezers… ............................................................. 330
122. Box Construction for Walk-in Freezers… ............................................................ 333
123. Convection Film Coefficients for Walk-in Freezers…......................................... 340
124. Infiltration Details for Walk-in Freezers… .......................................................... 343
125. Product Loading for Walk-in Freezers… ............................................................. 351
126. Product Sensible and Latent Thermal Properties for Walk-in
Freezers… ................................................................................................... 358
127. Lighting and Occupancy Load Details for Walk-in Freezers… ........................... 362
128. Miscellaneous Load Details for Walk-in Freezers… ........................................... 367
129. Defrost Details for Walk-in Freezers… ................................................................ 371
130. Proposed Walk-in Cooler and Freezer Model Load Inputs… .............................. 383
131. Proposed Walk-in Cooler Model Load Inputs… .................................................. 384
132. Proposed Walk-in Freezer Model Load Inputs… ................................................. 386
133. Proposed Small Walk-in Cooler Hourly Model Load
Calculation… .............................................................................................. 389
134. Proposed Large Walk-in Cooler Hourly Model Load
Calculation… .............................................................................................. 392
xxiii
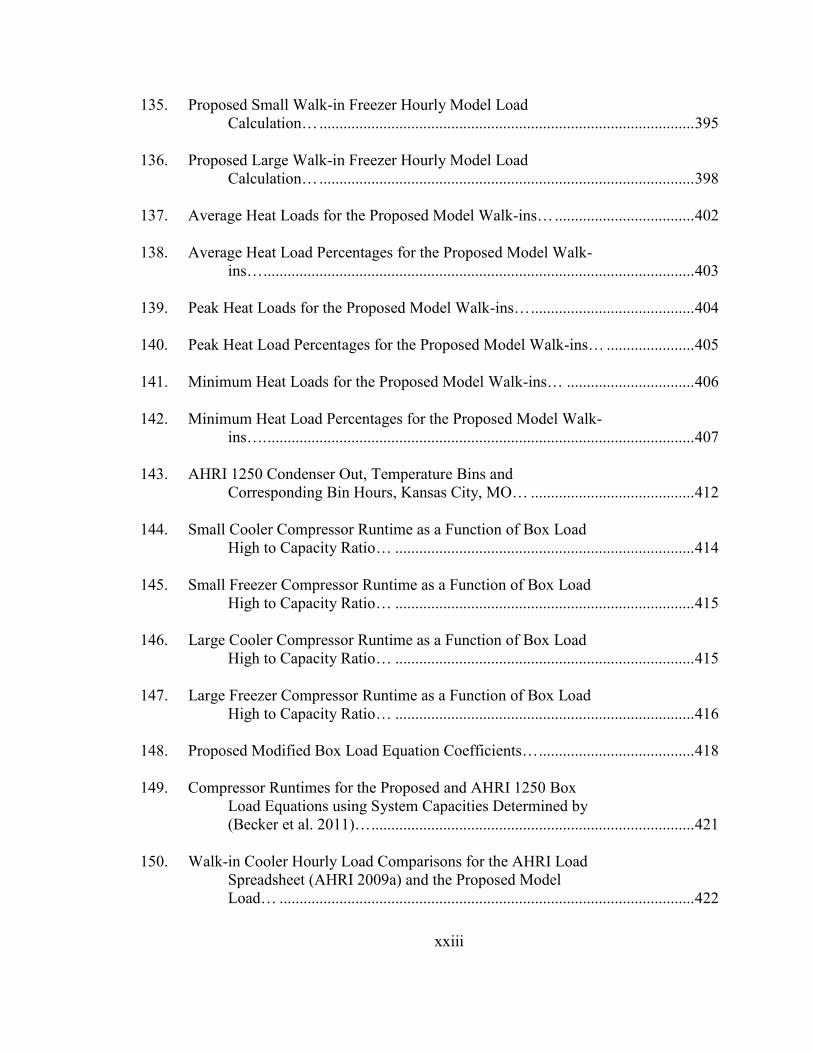
135. Proposed Small Walk-in Freezer Hourly Model Load
Calculation… .............................................................................................. 395
136. Proposed Large Walk-in Freezer Hourly Model Load
Calculation… .............................................................................................. 398
137. Average Heat Loads for the Proposed Model Walk-ins… ................................... 402
138. Average Heat Load Percentages for the Proposed Model Walk-
ins… ............................................................................................................ 403
139. Peak Heat Loads for the Proposed Model Walk-ins… ......................................... 404
140. Peak Heat Load Percentages for the Proposed Model Walk-ins… ...................... 405
141. Minimum Heat Loads for the Proposed Model Walk-ins… ................................ 406
142. Minimum Heat Load Percentages for the Proposed Model Walk-
ins…. ........................................................................................................... 407
143. AHRI 1250 Condenser Out, Temperature Bins and
Corresponding Bin Hours, Kansas City, MO… ......................................... 412
144. Small Cooler Compressor Runtime as a Function of Box Load
High to Capacity Ratio… ........................................................................... 414
145. Small Freezer Compressor Runtime as a Function of Box Load
High to Capacity Ratio… ........................................................................... 415
146. Large Cooler Compressor Runtime as a Function of Box Load
High to Capacity Ratio… ........................................................................... 415
147. Large Freezer Compressor Runtime as a Function of Box Load
High to Capacity Ratio… ........................................................................... 416
148. Proposed Modified Box Load Equation Coefficients… ....................................... 418
149. Compressor Runtimes for the Proposed and AHRI 1250 Box
Load Equations using System Capacities Determined by
(Becker et al. 2011)… ................................................................................. 421
150. Walk-in Cooler Hourly Load Comparisons for the AHRI Load
Spreadsheet (AHRI 2009a) and the Proposed Model
Load… ........................................................................................................ 422

xxiv
151. Walk-in Freezer Hourly Load Comparisons for the AHRI Load
Spreadsheet (AHRI 2009a) and the Proposed Model
Load… ........................................................................................................ 423
152. Percentage Variations of AWEF and Compressor Runtimes,
AHRI 1250 to Average Climate Zone Simulations… ................................ 424
153. Small Cooler Heatcraft Load Calculation (Heatcraft 2008).. ............................... 429
154. Small Freezer Heatcraft Load Calculation (Heatcraft 2008)… ............................ 431
155. Large Cooler Heatcraft Load Calculation (Heatcraft 2008)… ............................. 433
156. Large Freezer Heatcraft Load Calculation (Heatcraft 2008)… ............................ 435
157. Small Cooler eQuest Field Simulation Results… ................................................ 438
158. Small Cooler eQuest Indoor Condenser Method of Test
Simulation Results… .................................................................................. 439
159. Small Cooler eQuest Outdoor Condenser Method of Test
Simulation Results… .................................................................................. 440
160. Small Cooler Proposed Walk-In Compressor Runtimes… .................................. 441
161. Small Freezer eQuest Field Simulation Results… ............................................... 442
162. Small Freezer eQuest Indoor Condenser Method of Test
Simulation Results… .................................................................................. 443
163. Small Freezer eQuest Outdoor Condenser Method of Test
Simulation Results… .................................................................................. 444
164. Small Freezer Proposed Walk-In Compressor Runtimes… ................................. 445
165. Large Cooler eQuest Field Simulation Results…................................................. 446
166. Large Cooler eQuest Indoor Condenser Method of Test
Simulation Results… .................................................................................. 447
167. Large Cooler eQuest Outdoor Condenser Method of Test
Simulation Results… .................................................................................. 448
168. Large Cooler Proposed Walk-In Compressor Runtimes… .................................. 449

xxv
169. Large Freezer eQuest Field Simulation Results… ............................................... 450
170. Large Freezer eQuest Indoor Condenser Method of Test
Simulation Results… .................................................................................. 451
171. Large Freezer eQuest Outdoor Condenser Method of Test
Simulation Results… .................................................................................. 452
172. Large Freezer Proposed Walk-In Compressor Runtimes… ................................. 453
173. eQuest Simulation AWEF Calculations… ........................................................... 455
174. eQuest Simulation Compressor Runtimes… ........................................................ 455
175. Proposed 1250 vs. Hourly Weather Simulations (% Increase)… ......................... 456
176. Comparison of AHRI (Becker et al. 2011) to Proposed Percentage
Variations of AWEF and Compressor Runtimes, 1250 to
Average Climate Zone Simulations… ........................................................ 456
177. Comparison of the Box Load and Electrical Usage via Hourly
Simulations and Standard 1250 Calculations… ......................................... 464
178. Percentage Variation of the Box Load and Electrical Usage via
Hourly Simulations and Proposed 1250 Calculations
Compared to Variations in the AWEF and Runtime… .............................. 465

xxvi
LIST OF ABBREVIATIONS
: Time related door cycling factor
H : Mass fraction of water vapor in the outdoor air (%)
C : Mass fraction of water vapor in the indoor air (%)
: Dimensionless time ρH: Outside (warm) air density (lb/ft3) ρC: Inside (cold) air density (lb/ft3) ρp: Bulk product density (lb/ft3)
' : Ratio of cold air density to hot air density _
: Average density of the cold interior and warm exterior bodies of air
(lb/ft3)
def : Defrost efficiency (%)
θ: Dimensionless temperature θamb: Ambient dimensionless temperature θjet: Air curtain jet orientation, degrees β: Volumetric thermal expansion coefficient (°F-1) μ: Dynamic viscosity (lb/ft-s) Δω: Difference between the specific humidities of air streams (lb vapor/lb
dry air) ωC: Humidity ratio of the cold air inside the refrigerated space (lb vapor/lb
dry air) ωH: Humidity ratio of the air outside the refrigerated space (lb vapor/lb dry
air) ωon: Air-on humidity ratio (lb vapor/lb dry air) ωws: Coil surface humidity ratio (lb vapor/lb dry air) α1: 13.5, Velocity constant α2: 7.67, Velocity constant ap: Product specific surface area (ft2/ft3) Afloor: Floor area of refrigerated space (ft2) Ainf: Cross-sectional area of the opening (door) to the refrig. space (ft2) ATDB: The approach of the dry fluid cooler to the dry-bulb temperature (°F) ATWB: The approach of the evaporative fluid cooler to the wet-bulb
temperature (°F) Aw: Liquid water activity coefficient ACH: Air changes per hour (1/hr) AWEF: Annual Walk-in Energy Factor, Btu/W-hr
bo: Jet width at
_
x = 0 (ft) b: Thickness of air curtain jet (ft) BF: Coil bypass factor BL(Tj): Heat removed from walk-in box at Tj, not including heat generated by
operation of the refrigeration system, W-h

xxvii
jTBLH
: Non equipment related walk-in box load high at Tj (Btu/h)
jTBLL
: Non-equipment related walk-in box load low at Tj (Btu/h)
_
B : Dimensionless width B: Width (distance from door to back wall) of cold room ca: Condenser specific heat capacity (Btu/h-lb-°F) C1: 14.4 Btu-min/lb-°F-hr, constant C2: Infiltration coefficient dependent of Troom (ft1/2/s-hr) C3: Constant, 1.427 x 10⁸ min/ft3-hr C4: Temperature dependent, high load coefficient C5: Non-temperature dependent, high load coefficient C6: Temperature dependent, low load coefficient C7: Non-temperature dependent, low load coefficient C8: Percentage of time the refrigeration system operates in high load
conditions (%) Cac: Optimum horizontal air curtain constant Ccap: Compressor capacity correction Cd: Infiltration correction factor Cfan: Fan factor to account for operation below the minimum condensing
temperature (°F) Cir: Rate of fresh air change per minute (ft3/min) Cp: Specific heat of air at constant pressure (Btu/lb-°F) Cresp: 0.658 Btu/grains, Respiration load constant Cs: Infiltration scaling factor, equal to unity for rectangular openings Ct: Infiltration traffic coefficient, 1.0919 (ft3/movement-°F1.76) CapBal: Balanced capacity of condensing units and evaporator units that
compose the system, Btu Capcomp: Actual compressor capacity (Btu/hr) Capcomp,r: Rated compressor capacity at the rated conditions (Btu/hr) Capcond1: Condenser capacity at point 1 Capcond2: Condenser capacity at point 2 Capcond,SST: Condensing unit capacity at the design saturated suction
temperature (Btu/hr) Capecond: Actual evaporative condenser capacity (Btu/hr) Capecond,n: Nominal evaporative condenser capacity (Btu/hr) Capevap: Actual evaporator capacity (Btu/hr) Capevap,1TD: Evaporator capacity at 1°F T.D. (Btu/hr) Capevap,r: Rated evaporator capacity at design point (Btu/hr) CPR: Critical price ratio (%) CEC: Compressor energy consumption (kW-h) CFA: Required coil face area (ft2) CR: Compressor runtime percentage (%) D: Diffusivity of the component vapor or gas in the mixture (ft2/s) Ddoor: Doorway depth (ft)

xxviii
Df: Doorway flow factor Dt: Doorway open-time factor
DF : Defrost system power consumption (W) E: Thermal barrier or infiltration protective device effectiveness (%) Eref(Tj): Total energy input of refrigeration systems at Tj (W-h) EER: Energy efficiency ratio (Btu/W-h)
coEF
: Evaporator fan power consumption during compressor off period (W)
jss TE
: Steady state power consumption at Tj, including power usage of
compressor(s), condenser fans, and evaporator fans (W) ƒ: Respiration coefficient (grains CO2/lb air-hr-°Fg) ƒd: Frequency of the door cycling (1/s) Fd: Blockage factor of door Fload: Load factor to compensate for changes in interior store conditions Fm: Density correction factor Fmin: Minimum fraction of design load (0.66 for medium temp, 0.80 for low
temp) Fo: Occupancy percentage (hr/hr) Fp: Protective device correction factor Fpp: Percentage of product that is vapor-barrier packaged
F : Fractional open time correction factor
Ft: Traffic infiltration correction factor FTamm: 0.77, Tamm’s equation correction factor applied by Chen (Chen et al.
1999) Fv: Density correction factor #2 FHR: Fan heat added per ton of net room load (tons/ton) FHF: Heat of fan power (Btu-h/ft2)
FP: Fan power (Bhp/ft2)
Gr: Grashop number gresp: Respiration exponent g: Gravity, 32.21 ft/s2 gc: Gravitational constant, 32.174 lbm-ft/lbf-s2 Gr: Grashop number GRL: Gross room load (tons) Δh41: Actual enthalpy difference between compressor suction and
evaporator inlet (superheated suction – subcooled liquid, Btu/lb) Δh41,r: Rated enthalpy difference between compressor suction and
evaporator inlet (superheated suction – subcooled liquid, Btu/lb) Δhsub: Latent heat of sublimation (Btu/lb) h: Enthalpy (Btu/lb) h1e: Operating enthalpy of the refrigerant exiting the evaporator (Btu/lb) h1e,r: Rated enthalpy of the refrigerant exiting the evaporator (Btu/lb) h1s: Enthalpy of the refrigerant suction vapor (Btu/lb) h3: Enthalpy of the refrigerant liquid (Btu/lb)
xxix
h4e: Operating enthalpy of the refrigerant entering the evaporator (Btu/lb) h4e,r: Rated enthalpy of the refrigerant entering the evaporator (Btu/lb) hC: Enthalpy of the air inside (cold) of the cold room (Btu/lb) hC,mix: Enthalpy of the air-vapor mixture inside (cold) of the cold room
(Btu/lb mixture) hcor: Enthalpy of the air in the corridor (Btu/lb) hfg: Latent heat of evaporation for water at the product temperature
(Btu/lb water) hg: Enthalpy of water vapor (Btu/lb vapor) hH: Enthalpy of the air outside (warm) of the cold room (Btu/lb) hH,mix: Enthalpy of the air-vapor mixture of the warm outside of the
refrigerated space (Btu/lb mixture) hmix: Enthalpy of the air-vapor mixture (Btu/lb mixture) H: Height of the opening (door) to the refrigerated space (ft) H1: Height of the cold room (ft) HEP: Heat equivalent of fan power, assumed to be 3000 Btu-h/Bhp HRF: Heat rejection factor as a function of the outside wet bulb and the
refrigerant saturated condensing temperature J: Lag factor j: Bin number k: Thermal conductivity of air (Btu-ft/h-ft2-°F) km: Overall mass transfer coefficient (s/ft) Ldoor: Door seal length (ft) LSHR: Load Sensible Heat Ratio mcs: Slope of condenser capacity vs. sat. suction temperature, Btu/hr-°F mpj: Amount of product that enters the cold store during the jth day (lb) mp: Total stored product weight (lb) mpal: Amount of product that enters the cold store on one pallet (lb) mtot: Summation of refrigerant mass flow over the test period (lb)
2COm
: Mass flow of carbon dioxide (grains CO2/lb air-hr)
dam
: Dry air mass flow rate of moisture (lb/hr)
inf
m : Mass flow of the infiltrating air (lb/hr)
Mm
: Modified flow rate of infiltration air to a cold room (lb/min)
om
: Critical mass flow rate of moisture (lb/hr)
rm
: Reverse mass flow rate of moisture (lb/hr)
ssm
: Steady state mass flow of the infiltrating air for a permanently open doorway (lb/hr)
wm
: Rate of moisture loss (lb water/s-lb product)
wvm
: Rate of mass transfer of a gas or vapor (lb/hr)

xxx
ssM
: Steady dimensionless modified rate of infiltration
MM
: Dimensionless modified rate of infiltration
nj: Bin hours, hrs npj: Amount of product that exits the cold store during the jth day (lb) N: Capacity fan speed correlation exponent Nd: Box load high to design refrigeration capacity ratio Ndo: Number of door openings in ttot Nevap: Number of evaporator units Nf: Frequency non-dimensional parameter No: Physical non-dimensional parameter Nt: Forklift traffic frequency (movements/hr) NRL: Net room load (tons) OR: Opening ratio psat: Saturated pressure (psi) Pavg,day: The average daytime cost of electricity ($/kWh) Pavg,shift: The average off-peak cost of electricity during which load shifting
would be performed ($/kWh) Pr: Prandtl number q’: Specific load (tons per ft door width)
floorq" : Heat flux through the floor (Btu/hr-ft2)-
etq
: Heat loss due to evaporation process (Btu/hr-lb product)
pq
: Occupancy load per person (Btu/hr-person)
respq
: Specific load due to respiration (Btu/hr-lb product)
Q10: Ratio of the respiration rate at one temperature to a rate at a 18°F higher temperature
QInf: Infiltration load (Btu) QInf/24: Infiltration load over 24 hr period (Btu/24 hr) Qtot: Total load (Btu)
DFQ
: Defrost power consumption contributed to the box load (Btu/hr)
indefQ,
: The actual energy required to melt the frost off the coil (Btu/hr)
InfQ
: Infiltration load into the refrigerated space (Btu/h)
DInfQ
: Infiltration load through doors (Btu/h)
WInfQ
: Infiltration load through walls (Btu/h)
LQ
: Latent Heat Flow (Btu/hr)

xxxi
meltQ
: Theoretical energy required to melt the frost (Btu/hr)
respQ
: Product respiration heat load (Btu/hr)
sQ
: Sensible Heat Flow (Btu/hr)
TQss
: Steady state refrigeration capacity as a function of temperature to
which the condenser is rejecting heat (Btu/hr)
totQ
: Average refrigeration load over a period ttot (Btu/hr)
RT1: Respiration rate at a temperature T1 (Btu/hr-ton) RT1+10°C: Respiration rate at a temperature 18°F higher than T1 (Btu/hr-ton) RER: Heat transferred from the air to the refrigerant, Btu-h/ft2
RH: Relative humidity (%) RTBal: Balanced compressor runtime (%) RPMa: Actual fan speed (rpm) RPMr: Rated fan speed (rpm) s: Ratio of warm air density to cold air density S: Seven-eighths cooling time (hr) Sh: Sherwood number Sc: Schmidt number SHR: Sensible heat ratio SST1: Saturated suction temperature at point 1 (°F) SST2: Saturated suction temperature at point 2 (°F) t: Time (s) t1: Time (days) t1/2: Half cooling time of the product in the given conditions (days) ta: Time to open door (s) tb: Time the door was fully opened (s) tc: Time for the door to close (s) td: Period of the cycle between door openings (s) toc: Opening time of the door for one pallet passage (s) topen: Time that the door is open, compensated for opening and closing
periods (s) tdt: The total time during which defrost was occurring (s) ttot: Total time period (s) ΔT: Temperature difference between the interior box and exterior
temperatures (°F) ΔTref: Reference temperature difference between the interior box and
exterior temperatures (°F) T1: Ambient temperature, condition 1 (°F) T2: Ambient temperature, condition 2 (°F) Tain: Coil entering air temperature (°F) Tamb: Ambient outside dry-bulb temperature (°F) Taout: Coil leaving air temperature (°F)
xxxii
TC: Temperature of the cold air inside the refrigerated space (°F) Tcon: The minimum condensing temperature (°F) Tcond: Condensing temperature (°F) Tcor: Corridor (entry way to refrigerated space) temperature (°F) Tcs: Coil surface temperature (°F) Tcsc: Coil surface critical surface temperature (°F) Td: Refrigeration system design ambient temperature (°F) Tevap: Evaporator temperature (°F) TH: Temperature of the warm air outside the refrigerated space (°F) Tj: Ambient temperature for bin j (°F) Ton: Air-on condition temperature (°F) Toff: Air-off condition temperature (°F) Tpc: Temperature at center of cooling object (°F) Tpini: Initial temperature of the product (°F)
_
p
T : Mass average product temperature (°F)
Tref: Reference temperature (°F) Tsll: Suction line loss temperature (°F) TDDB: Temperature difference between the condensing temperature and
the ambient dry-bulb temperature (°F) TDEapprox.: Approximation of the difference between the interior box and
saturated suction temperatures (°F) TDEbal: Balanced or actual operating temperature difference between the
interior box and saturated suction temperatures (°F) TDEdes: Temperature difference between the interior box and saturated
suction temperatures at evaporator design point (°F) TDW: Temperature difference between the condensing temperature and
the water temperature (°F) TDWB: Temperature difference between the condensing temperature and
the wet-bulb temperature (°F)
u: Mean velocity in
_
x direction (ft/s) uC: Velocity profile for cold air leaving the refrigerated space (ft/s) uFV: Coil face velocity (ft/s) uH: Velocity profile for warm air entering the refrigerated space (ft/s) umf: Maximum velocity of the velocity profile during infiltration through a
doorway (ft/s) uo: Mean velocity at nozzle outlet (ft/s) uop: Optimum horizontal air curtain jet exit velocity (ft/s) uref: Elsayed reference velocity in x direction (ft/min) U: Dimensionless velocity component in x direction UA: Sensible Capacity Rating (Btu/hr-°F)
ATV
: Air infiltration rate when the doors are closed, air tightness, crack infiltration (ft3/min)
xxxiii
LV AT /
: Air infiltration rate when the doors are closed per length of crack, air tightness (ft3/min-ft)
inf
V : The general infiltration rate compensating for door and crack infiltration (ft3/min)
ntV
: The average infiltration rate without traffic passing through the doorway (ft3/min)
pV
: The infiltration rate with the protection device operating on the
doorway (ft3/min)
trV
: The infiltration rate with traffic passing through at a defined frequency
(ft3/min)
uV
: The infiltration rate with the unprotected doorway (ft3/min) Vt: Infiltration per forklift movement, including entry and exit
(ft3/movement) V: Volume of the refrigerated space (ft3)
ain : Design specific volume of air at coil entrance air temperature (ft3/lb)
ainr : Operational specific volume of air at coil entrance air temp. (ft3/lb)
aout : Specific volume of air at coil exit air temperature (ft3/lb)
H : Specific volume of warm air outside of the refrigerated space (ft3/lb)
C : Specific volume of cold air inside of the refrigerated space (ft3/lb)
comp : Specific volume of inlet gas based on the actual conditions (ft3/lb)
compr : Specific volume of inlet gas based on manufacturer’s rated
conditions (ft3/lb)
Cr : 10.95, Coil rated specific volume of air inside refrigerated space
Er : Specific volume of refrigerant in the evaporator at rated conditions
(ft3/lb)
E : Specific volume of refrigerant in the evaporator (ft3/lb)
g : Specific volume of water vapor (ft3/lb water vapor)
v : Kinematic viscosity (ft/s2)
W: Width of the door (ft) wgap: Gap width (in) _
x : Coordinate position along airflow path, parallel to air flow (ft) xC: Height above floor of velocity UC (ft) xH: Height above floor of velocity UH (ft) X: Dimensionless distance along the x direction Y: Dimensionless distance along the y direction

xxxiv
_
y : Coordinate position along airflow path, perpendicular to air flow (ft)
z: Door height to density ratio relationship (ft)
xxxv
ACKNOWLEDGEMENTS
First, I will like thank Dr. Bryan Becker for his guidance and support over the past
three years. From directing me to my topic of research to assistance with analysis of
results, Dr. Becker has been key to this work. In addition, I would like to express my
gratitude to the other members of my thesis committee, including Dr. Ganesh Thiagarajan
and Dr. Gregory King. The time that these professors took to assist with the development
of this work is a testament of the dedication of the Civil and Mechanical Engineering
Department at the University of Missouri – Kansas City to the development of their
students. Finally, I would to thank my father, John Sartin, for spending the time to proof
this work.

DEDICATION
I would like to dedicate this work to my family. Mandy, thank you for your
intermittent patience. Your willingness to provide me time to work on my research and
abrupt reversals to frustration with the amount of time that it was taking showed both your
faith in my development and longing for our time together. Matthew, you have grown up
throughout my Master‟s research from six months to now three and a half years old. You
are turning into quite the little man, and I am looking forward to rough-housing with you a
lot more in the coming years. Avery, your cheerful personality is what keeps me going. Just
like your grandmother Jean and your mother, you project positive energy to all those
around you, please never change.

1
CHAPTER 1
INTRODUCTION
Walk-in Refrigeration
Walk-in coolers and freezers are defined as refrigerated spaces operating above
freezing or below freezing, respectively, and ranging in size from 50 to 3000 ft2, with
ceiling heights ranging from 8 to 30 ft (CEC 2007; CEC 2008; Congress 2007). Walk-ins
are used in numerous settings, including offices, retail, grocery stores, schools, hotels,
hospitals, and warehouses (Patel et al. 1993), with the majority of applications classified as
commercial use.
The commercial sector uses 5.6 Quads (1 Quad = 1015
Btu/yr) of energy in the
United States, accounting for 15.8% of the total useful energy utilized by the nation (DOE
2004; Goetzler et al. 2009; Westphalen et al. 1996). Commercial refrigeration uses 4.1 to
7% of the commercial sector‟s energy, equaling 0.23 to 0.35 Quads of energy consumption
(Goetzler et al. 2009; Westphalen et al. 1996).
Commercial refrigeration usage may be broken down further to analyze what
contribution walk-ins have on energy consumption. Supermarket refrigeration, which
contributes to 47 to 56% of a supermarket‟s total energy use (Arias 2005; Arias and
Lundqvist 2006; Christensen and Bertilsen 2004; Fricke and Becker 2011; Goetzler et al.
2009; Huan 2008; Sugiartha et al. 2009; Walker 2001), accounts for the greatest portion of
commercial refrigeration at 32.9%. The ratio of supermarket walk-in energy use to total
supermarket refrigeration energy use is cited by researchers as ranging from 12.3 to 30.2%,
with an average value of 24.3% (Goetzler et al. 2009; Henderson and Khattar 1999; Walker
2001; Walker et al. 1990). Walk-ins used in applications other than supermarkets account

2
for 18.2% of commercial refrigeration energy use (Westphalen et al. 1996). Considering
the above information, walk-in coolers and freezers consume 26.2% of commercial
refrigeration energy use, 1.5% of commercial building energy use, and 0.2% of the nation‟s
energy use. This is equivalent to 76 trillion Btu/yr of energy use or 242 trillion Btu/yr of
primary energy use. Primary energy use is calculated based on a heat rate of 10,867
Btu/kWh to take into account losses in generation and transmission of electricity (Patel et
al. 1993).
The refrigeration industry is focused on reducing energy use from both an
environmental impact and operating cost perspective. Opportunities for reduction in energy
use have been identified by numerous researchers, ranging from 10 to 49.4% of the current
consumption. Methods of reducing energy use by refrigerated spaces, discussed in the
previously noted research, include application of current energy efficient equipment and
construction, technologies used by other industries but not yet applied to walk-in
refrigeration, and potential future research developments (Goetzler et al. 2009; Huan 2008;
Patel et al. 1993; SCE 2008; Walker 2001; Westphalen et al. 1996).
The government in California began imposing construction standards for walk-ins
to drive energy efficient designs in 2004 with the California Code of Regulations Title 20.
Federal regulations followed, including the Energy Independence and Security Act (EISA)
of 2007 (Congress 2007). The most recent federal regulatory information can be found in
the Final Rule of the Energy Conservation Program‟s Test Procedures for Walk-In Coolers
and Freezers (DOE 2011). To ensure that governmental regulations were attainable, the
Air-Conditioning, Heating, and Refrigeration Institute (AHRI) developed standards for
performance rating of walk-in refrigeration equipment (AHRI 2009b; AHRI 2009c).

3
ANSI/AHRI 1250/1251 Standard
The AHRI Standard for Performance Rating of Walk-In Coolers and Freezers
(AHRI Standard 1250/1251) was published in 2009 (AHRI 2009b; AHRI 2009c). As
implied by their titles, this pair of documents was put in place to standardize the rating of
the mechanical refrigeration equipment used in walk-in coolers and freezers.
Manufacturers are to test their equipment (walk-in systems, condensing units, and unit
coolers) in a specific manner as defined by the Standard and then use an algorithm to
calculate the Annual Walk-in Energy Factor (AWEF).
To determine the AWEF value for a given piece of equipment, the unit should first
be tested according to the method of test defined by the AHRI Standard (AHRI 2009b;
AHRI 2009c). Indoor condensing units are to be tested at a rating temperature of 90ºF and
outdoor condensers are to be tested at temperatures of 95, 59, and 35ºF. AHRI defines the
AWEF as the ratio of the annual refrigeration load less the heat added to the space by the
refrigeration equipment, divided by the annual refrigeration system energy usage (Equation
1). With the components of Equation 1 listed in Equations 2 and 3.
n
j jref
n
j j
TE
TBLAWEF
1
1 ( 1 )
j
co
cojss
DFcojcojss
cojss
DFcojcojss
jref n
DFEF
EFTQ
QEFTBLLEFTE
EFTQ
QEFTBLHEFTE
TE
412.3
412.3
67.0
412.3
412.333.0
( 2 )

4
jjjj nTBLLTBLHTBL
67.033.0 ( 3 )
The Standard assumes that the refrigeration load profile for walk-ins may be
approximated by a period of elevated refrigeration load (high load period) and a period of
reduced refrigeration load (low load period). The low load period comprises 16 hours of
the day whereas the high load period comprises the remaining 8 hours. The box load levels
are designated by AHRI as a function of the refrigeration system capacity at the design
conditions. The generalized equations for the box load variables are presented in Equations
4, 5, 6, and 7. The box loads do not include heat added to the space by the refrigeration
equipment, including defrost and evaporator fan operation.
Walk-in Cooler Box Loads
60
3505.065.0
jdss
dssj
TTQTQTBLH ( 4 )
60
3507.003.0
jdss
dssj
TTQTQTBLL ( 5 )
Walk-in Freezer Box Loads
105
1025.055.0
jdss
dssj
TTQTQTBLH ( 6 )
105
1025.015.0
jdss
dssj
TTQTQTBLL ( 7 )
The box load equations break the load into two components, a load driven by the
ambient temperature and a consistent load. AHRI developed a model load profile using the
5
AHRI Load Spreadsheet (AHRI 2009a) to derive the coefficients associated with the box
load equations.
An initial investigation by Becker et al. (Becker et al. 2011) of the AHRI Standard
1250/1251 revealed potential issues with the model load that AHRI used to develop the box
load equations and variations between the AHRI Standard 1250/1251 performance
calculations and those developed through hourly simulations.
This work proposes some modifications to the equations that define the AHRI
Standard 1250/1251 (AHRI 2009b; AHRI 2009c). This investigation included the
following tasks:
Review of Current Work
Literature Review and Industry Investigation
Development of Proposed Model Load Profile
Development of Proposed AHRI Standard 1250/1251 Equations
eQuest Simulations
Proposed 1250 Calculation Method Discussion
Conclusions
6
CHAPTER 2
REVIEW OF CURRENT WORK
To begin, the current status of information directly related to the AHRI Standard
1250/1251 (AHRI 2009b; AHRI 2009c) was reviewed. This review of information
included the Standard itself, AHRI Load Spreadsheet (AHRI 2009a), and the ARTI Project
9002 Final Report (Becker et al. 2011).
The AHRI Standards 1250/1251 define a performance rating method to be utilized
by manufacturers, designers, installers, contractors and end-users. The standard defines
method of tests for fixed capacity matched systems, dual capacity matched systems, and
variable capacity matched systems with condensers located indoors or outdoors, and is
applicable to coolers and freezers. Component methods of tests are defined for fixed
capacity condensing units (indoor and outdoor condensers) and evaporators, applicable to
coolers and freezers. Information collected from these performance tests is applied to a set
of equations to determine the Annual Walk-in Energy Factor (AWEF) for a given set of
refrigeration equipment.
The AHRI Load Spreadsheet (AHRI 2009a) uses an array of equations to determine
the box refrigeration load. The box conduction load is calculated using a traditional,
simplified method which analyzes only the conduction heat transfer, and ignores the effects
of transferring that heat to the space via convection. By using a square walk-in footprint,
only three different surfaces are considered, including the ceiling, floor, and walls. Similar
to the AHRI 1250/1251, this spreadsheet only analyzes walk-in boxes situated inside a
temperature controlled building.

7
The infiltration calculation was done by the AHRI Load Spreadsheet using some
simplified equations to define the sensible and latent portions of the load (Equations 8 and
9) with the Gosney Olama equation determining the flow rate through the unprotected door
(Equation 12).
CHs TTVQ
inf1.1 ( 8 )
CHL VQ
inf5500 ( 9 )
ATdud VFVFEV
11inf ( 10 )
ft
inA
LwVV
doorgapAT
12inf
inf
( 11 )
min
601221.0 2
12
1
inf
sFgHAV m
C
Hu
( 12 )
Product loading into the refrigerated space is done at one point in time for all walk-
ins as defined by the AHRI Load Spreadsheet. The refrigeration load associated with this
product introduction to the space is assumed to affect the space in a linear fashion, pulled
down over an eight hour period. The calculation assumes the load is solely sensible for
coolers and freezers. Therefore the product must be packaged so that water vapor may not
pass through the barrier.
Miscellaneous loads include lighting, occupancy, and vehicle operation. Lighting
load is calculated based on Wattage per space footprint and a lighting schedule. The
lighting load is reduced by a certain percentage to apply only the light power converted to
8
heat as a load on the space. Occupancy load is defined by Equation 13 and vehicle load is
calculated based on the vehicle power usage and operating schedule.
12955.11
CopTFq ( 13 )
From the model load profiles of large and small walk-in coolers and freezers, the
AHRI Standard 1250/1251 box load equations are developed. The small and large cooler
box load equations are averaged, as are the equations for the walk-in freezers, to develop a
typical walk-in cooler and freezer box load equation set. These equations were applied to
the development of the AHRI Standard 1250/1251.
The AHRI Load Spreadsheet contains calculations using both SI and IP units. The
only difference in these calculations is the box interior temperature. As defined in the
standard, walk-in freezers operate at -23ºC (AHRI 2009c) or -10ºF (AHRI 2009b), and
walk-in coolers operate at 2ºC (AHRI 2009c) or 35ºF (AHRI 2009b). These values do not
directly equate from Celsius to Fahrenheit, resulting in solution variations of up to 17.7%.
The standard box load equations were developed using the SI unit calculation method for
both the AHRI Standard 1250 and 1251.
The ARTI Project 9002 Final Report performed a model load investigation similar
to that done in this report, analysis of monitored field sites, simulations of walk-in cooler
and freezer performance, and analysis of the AHRI Standard 1250/1251 load equations.
The model load investigation revealed a few differences between the AHRI model load
profile and the literature, including the large walk-in box door size and number, omission
of crack infiltration, product loading for the small walk-in box, walk-in freezer relative
humidity, and walk-in freezer R-value. Total door area was analyzed as a function of the

9
space floor area, with AHRI large walk-in door areas 1.5% of the refrigerated space floor
area. According to Becker et al. (Becker et al. 2011) the literature review revealed an
average relationship between the floor area and door area of 9.3%. Infiltration was
analyzed by the AHRI Load Spreadsheet (AHRI 2009a) only as a function of door
openings. In reality there is constant infiltration to the space through cracks around doors
and through any cracks left in between insulated panels during the installation of the walk-
in. Product loading for the small cooler was overstated at approximately 3 times the value
noted by the Department of Energy (DOE 2010b) for a similar walk-in cooler size. Walk-in
cooler relative humidity was specified at 90% by AHRI, but the literature revealed a
slightly lower value of 73.6%. The AHRI Load Spreadsheet freezer uses 32 h-ft2-˚F/Btu
construction. When Becker et al. compared this to insulation details reported by other
researchers, an average value of 26 h-ft2-˚F/Btu was found.
The AHRI 1250/1251 Standard specifies an indoor condensing unit ambient
temperature of 90ºF. Becker et al. (Becker et al. 2011) recommends a value of 80ºF to more
closely approximate the conditions that indoor condensing units operate under.
Comparison of monitored field data to parameters defined in the AHRI Standard
1250/1251 shows that „low loads‟ correlate. The „high load‟ defined by AHRI 1250/1251
appears to be overstated by 32.5 to 84.7% when compared to the field data. The time spent
at „high load‟ and „low load‟ operation does not agree either. AHRI 1250/1251 assumes
2/3rds of time at „low load‟ and 1/3rd
of the time at „high load‟ for both walk-in coolers and
freezers, but field data suggests that the load profile is more evenly split between high and
low load conditions. AHRI 1250/1251 assumes 33.2% more time in low load than
10
monitored data for coolers and 23.6% more time in low load than monitored data for
freezers.
Additional comparisons were made to the refrigeration load per square foot of
monitored field walk-in coolers and freezers. The AHRI 1250/1251 small cooler area-
specific refrigeration load correlated well with field data at 27.6% larger. The AHRI
1250/1251 large cooler refrigeration load is less than half that depicted by measured data,
however. AHRI 1250/1251 freezer loads were 19.9 and 10.7% of the measured data for the
small and large freezers, respectively.
Following eQuest simulation of typical walk-in coolers and freezers the Annual
Walk-in Energy Factor (AWEF) was calculated for seven climate zones with the condenser
indoors and outdoors. In addition, AWEFs were calculated according to the test method
specified in AHRI 1250/1251. The freezer runtimes seem appropriate, with the test method
closely matching the values obtained through simulation of the refrigeration system‟s
operation in an actual climate zone. The AHRI 1250/1251 small freezer compressor
runtime, as compared to the climate zone simulations, was 3.3% lower, 15.7% lower, and
6.4% lower for condenser indoor; box in, condenser outdoor; and box out, condenser
outdoor conditions, respectively. Large freezer runtime comparisons were similar, at 5.0%
lower, 30.3% lower, and 26.3% lower, for the condenser indoor; box in, condenser
outdoor; and box out, condenser outdoor conditions, respectively. Walk-in cooler runtime
comparisons were more drastic. The AHRI 1250/1251 small cooler runtime, as compared
to the climate zone simulations, was 45.8% lower, 52.1% lower, and 44.2% lower for the
condenser indoor; box in, condenser outdoor; and box out, condenser outdoor conditions,
respectively. The large cooler runtime was determined to be 42.1% lower, 51.0% lower,

11
and 47.7% lower for the condenser indoor; box in, condenser outdoor; and box out,
condenser outdoor conditions, respectively.
12
CHAPTER 3
LITERATURE REVIEW AND INDUSTRY INVESTIGATION
An extensive literature review was performed to analyze walk-in cooler and freezer
load information available. Information was gathered from numerous sources, including
published literature, presentations, and discussions with industry professionals. While this
investigation was focused on defining a model load profile for walk-in coolers and freezers
in commercial refrigeration applications, the study was not confined to that type
equipment. A walk-in load profile is composed of numerous items, including infiltration,
conduction, product load, occupancy load, lighting load, and miscellaneous loads. Studies
done on these subjects in other applications of refrigeration can be carefully applied to
walk-in coolers and freezers.
The primary assumption of this investigation is that the occurrence of specific
model load characteristics in literature correlate to the occurrence of these same model load
characteristics in industry. Therefore, an analysis of information presented in the literature
will appropriately represent the actual application of walk-in refrigeration systems in the
field.
Literature is categorized by industry and load type. Industries include industrial,
commercial, and general refrigeration. Industrial refrigeration, as defined by this work,
includes refrigeration systems supporting the production and/or storage of bulk products.
These facilities would typically include warehouses, truck loading docks, pull-down rooms,
and ripening rooms. Commercial refrigeration refers to refrigeration of spaces in
supermarkets, restaurants, convenience stores, and other miscellaneous small-scale
applications. Typically, units in a commercial application have a much higher turnover of
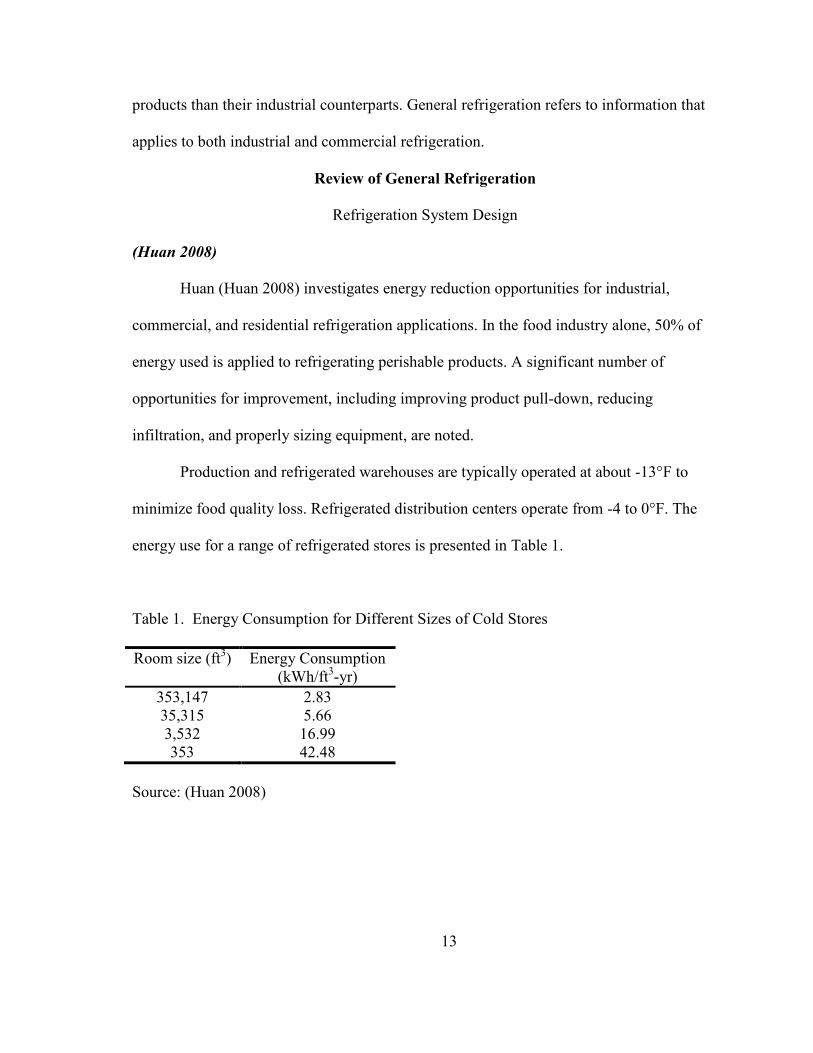
13
products than their industrial counterparts. General refrigeration refers to information that
applies to both industrial and commercial refrigeration.
Review of General Refrigeration
Refrigeration System Design
(Huan 2008)
Huan (Huan 2008) investigates energy reduction opportunities for industrial,
commercial, and residential refrigeration applications. In the food industry alone, 50% of
energy used is applied to refrigerating perishable products. A significant number of
opportunities for improvement, including improving product pull-down, reducing
infiltration, and properly sizing equipment, are noted.
Production and refrigerated warehouses are typically operated at about -13°F to
minimize food quality loss. Refrigerated distribution centers operate from -4 to 0°F. The
energy use for a range of refrigerated stores is presented in Table 1.
Table 1. Energy Consumption for Different Sizes of Cold Stores
Room size (ft3) Energy Consumption
(kWh/ft3-yr)
353,147 2.83
35,315 5.66
3,532 16.99
353 42.48
Source: (Huan 2008)

14
(Bansal and Jain 2007)
Cascade systems are used for numerous low-temperature refrigeration applications,
including blast freezing, cold storages, and liquefaction of gases at temperatures ranging
from -148 to -22°F. A temperature difference ranging from 4.5 to 9°F is commonly used in
the cascade condenser to balance condenser first cost and system energy consumption. The
high temperature circuit uses a high boiling point refrigerant such as R-22, R-124a, R-507,
ammonia, propane, propylene, or hydrocarbons whereas the low temperature side uses
CO2, HFC-23, or R-508B.
While the use of these systems is wide spread, their application requires careful
consideration, as available tools to optimize the system are limited. In the comparison of
low temperature refrigerants, CO2 is a clear winner for suction temperatures above -58°F
due to its low cost and thermal properties. Bansal and Jain (Bansal and Jain 2007) found
ammonia to be the most effective refrigerant for the high pressure side of the cascade
system. The system attained a COP of 1.52 when configured with a low mass flow ratio of
0.31, condenser temperature of 86°F, low-side evaporator temperature of -49°F, and
cascade heat exchanger approach of 9°F.
(SCE 2009)
It is difficult to operate a refrigeration system efficiently when there are only
mechanical controls in place. Configuring sensors and controls to analyze how the system
is operating gives the opportunity to optimize the system. This article analyzes the benefits
of an internet based monitoring system (SCE 2009). A Southern California Edison (SCE)
customer site was chosen to test this monitoring and control system. The facility was a
large dry goods distribution warehouse (21,000 ft2) with numerous zones cooled to a
15
medium temperature. Attached to the facility are small independent walk-in coolers and
freezer.
One cooler inside the warehouse is 5,820 ft2 and contains cheese and other dairy
products. It is composed of four separate rooms, 9 compressors, and 17 evaporators
interconnected by doors for forklift travel. A second cooler (36°F ) is used to pre-sort items
prior to loading trucks at the shipping dock. This space also serves as temporary storage
after unloading a truck.
The independent walk-ins include one freezer and two coolers. The walk-in freezer,
with a setpoint temperature of 0°F (204 ft2), is located between two walk-in coolers (96 and
300 ft2). All of these units utilize glass merchandising doors. The walk-in freezer utilizes
electric defrost. Prior to monitoring/control defrost occurred four times per day.
Some efficiency measures implemented as a result of this analysis include a
significant reduction in defrost, installation of destratification fans in the large cooler, ECM
evaporator fan motors, and anti-sweat heater controls. In the end, compressor runtimes
were reduced by 26.7% (Table 2) and evaporator fan runtime was reduced by 57.4%.
Simultaneous with these energy savings, temperature control improved with the average
space temperature lowered 0.9°F.
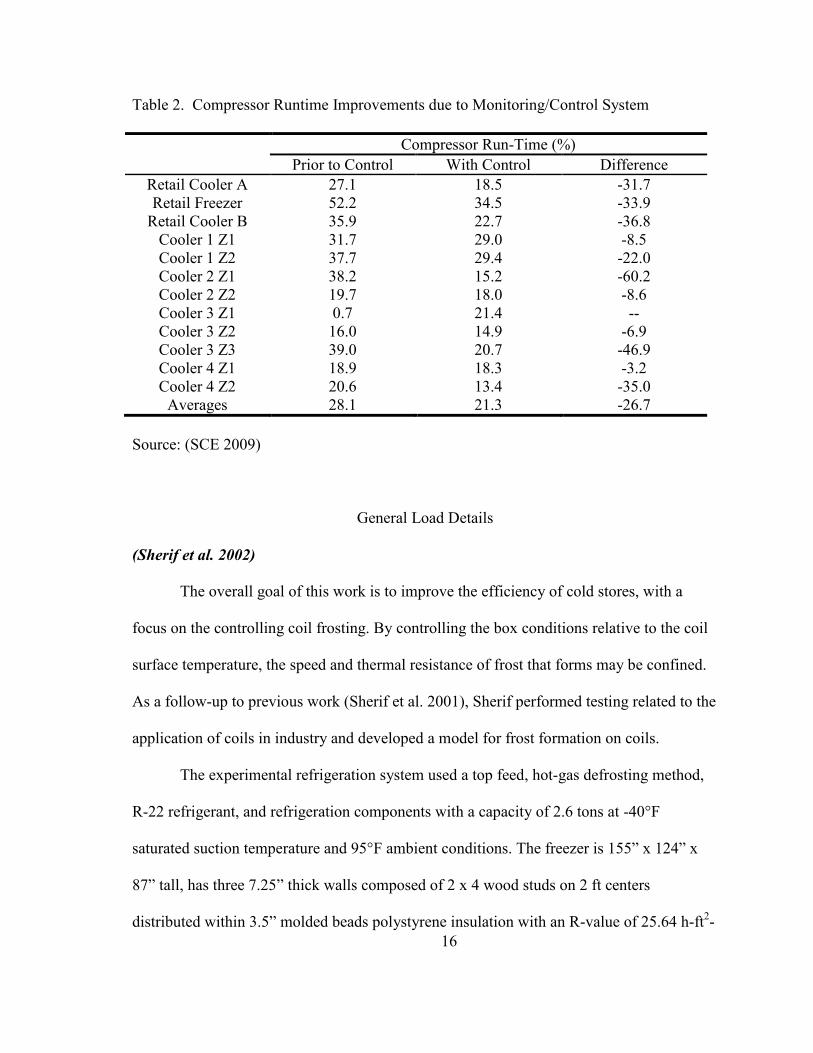
16
Table 2. Compressor Runtime Improvements due to Monitoring/Control System
Compressor Run-Time (%)
Prior to Control With Control Difference
Retail Cooler A 27.1 18.5 -31.7
Retail Freezer 52.2 34.5 -33.9
Retail Cooler B 35.9 22.7 -36.8
Cooler 1 Z1 31.7 29.0 -8.5
Cooler 1 Z2 37.7 29.4 -22.0
Cooler 2 Z1 38.2 15.2 -60.2
Cooler 2 Z2 19.7 18.0 -8.6
Cooler 3 Z1 0.7 21.4 --
Cooler 3 Z2 16.0 14.9 -6.9
Cooler 3 Z3 39.0 20.7 -46.9
Cooler 4 Z1 18.9 18.3 -3.2
Cooler 4 Z2 20.6 13.4 -35.0
Averages 28.1 21.3 -26.7
Source: (SCE 2009)
General Load Details
(Sherif et al. 2002)
The overall goal of this work is to improve the efficiency of cold stores, with a
focus on the controlling coil frosting. By controlling the box conditions relative to the coil
surface temperature, the speed and thermal resistance of frost that forms may be confined.
As a follow-up to previous work (Sherif et al. 2001), Sherif performed testing related to the
application of coils in industry and developed a model for frost formation on coils.
The experimental refrigeration system used a top feed, hot-gas defrosting method,
R-22 refrigerant, and refrigeration components with a capacity of 2.6 tons at -40°F
saturated suction temperature and 95°F ambient conditions. The freezer is 155” x 124” x
87” tall, has three 7.25” thick walls composed of 2 x 4 wood studs on 2 ft centers
distributed within 3.5” molded beads polystyrene insulation with an R-value of 25.64 h-ft2-

17
°F/Btu, a front wall composed of one layer of insulation for an R-value of 13.33 h-ft2-
°F/Btu, and an R-value of 35.71 h-ft2-°F/Btu for the ceiling. The freezer has two 30 7/8” x
66.5” tall doors with good rubber seals, constructed in a similar manner to the front wall
but with an additional ¾” layer of plywood beneath the outside aluminum cladding for an
R-value of 14.29 h-ft2-°F/Btu. Each door has one 13” x 13” insulated, double glazed, ½”
air space window with an R-value of 1.96 h-ft2-°F/Btu. The floor is 16 gage galvanized
sheet metal on a 6 millimeter layer of visquene with 4” of molded bead polystyrene
beneath, and ½” of extruded polystyrene below that. The entire box is on an insulated
basement floor 1 ft below grade.
Each door uses 16 ft of heating cable at 3 Watts per foot at 40°F. Two light fixtures
are in the space, each using two 60 Watt fluorescent bulbs.
Heat pipes installed upstream and downstream of a dehumidification coil reduce the
sensible cooling load on the dehumidification coil and then reheat the exiting air using no
external energy. During defrost, damper door positioning was tested to determine the
effects on defrost efficiency. Partial dampering was coincident with an 18% improvement
in defrost efficiency whereas full dampering increased defrost efficiency by 43%.
Coil operation under supersaturated box conditions produced very dense, snow-like
frost which grew quickly but was slow to remove during the defrost cycle. As may be
expected, sub-saturated operation had very little frost formation. Frost formed at higher
face velocities (greater than 700 fpm) is more likely to be transferred to the drain pan
during defrost, resulting in a higher defrost efficiency.
18
(PG&E 2007)
California Title 24 dictates building energy efficiency standards, including
standards for refrigerated warehouses (250,000 ft2 or more). Pacific Gas and Electric
Company (PG&E) discusses changes to Title 24 refrigerated warehouse standards such as
insulation requirements, fan and compressor controls, and interior lighting levels (PG&E
2007). Benefits from following Title 24 are promised at 0.3 kWh/ft2 for insulation
improvements, 6.2 kWh/ft2 for evaporator fan controls, 1.4 kWh/ft
2 with use of evaporative
condensers, and 4.1 kWh/ft2 for compressor controls. These cost savings were determined
through simulation of two prototypical warehouses, defined in Table 3 and Table 4. Walk-
in refrigerated spaces (3,000 ft2 or less) are defined by Title 20, and some of those details
are also discussed in this report.
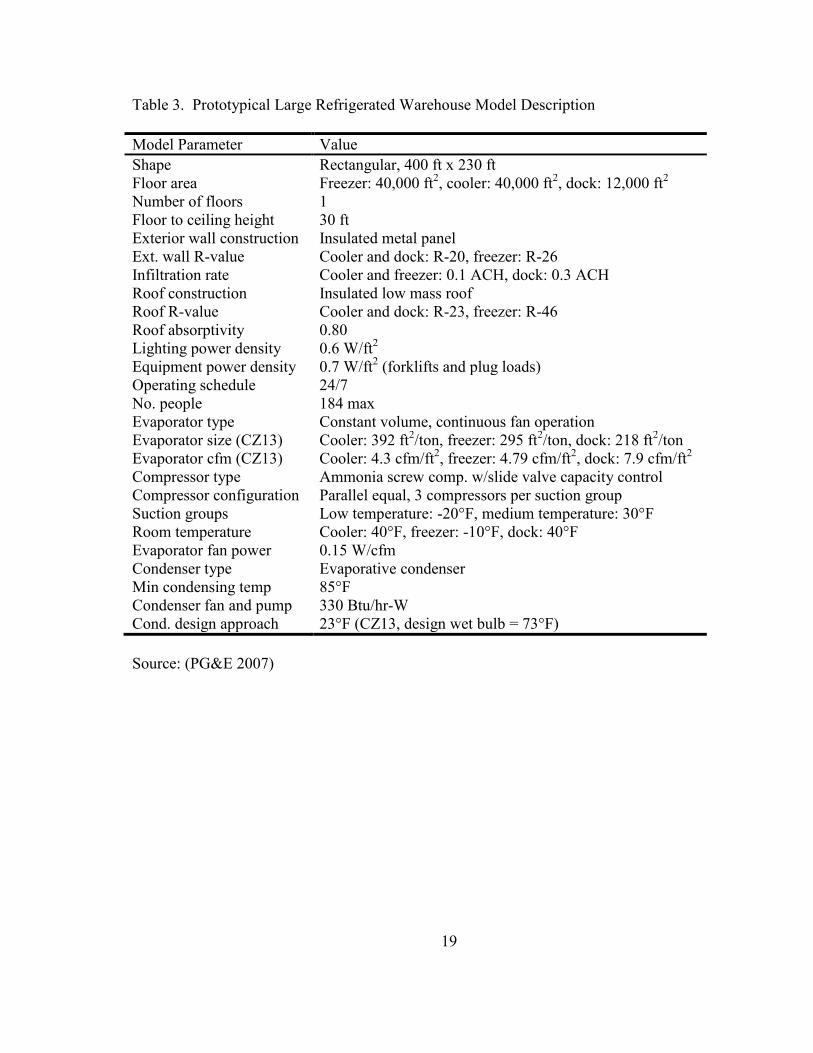
19
Table 3. Prototypical Large Refrigerated Warehouse Model Description
Model Parameter Value
Shape Rectangular, 400 ft x 230 ft
Floor area Freezer: 40,000 ft2, cooler: 40,000 ft
2, dock: 12,000 ft
2
Number of floors 1
Floor to ceiling height 30 ft
Exterior wall construction Insulated metal panel
Ext. wall R-value Cooler and dock: R-20, freezer: R-26
Infiltration rate Cooler and freezer: 0.1 ACH, dock: 0.3 ACH
Roof construction Insulated low mass roof
Roof R-value Cooler and dock: R-23, freezer: R-46
Roof absorptivity 0.80
Lighting power density 0.6 W/ft2
Equipment power density 0.7 W/ft2 (forklifts and plug loads)
Operating schedule 24/7
No. people 184 max
Evaporator type Constant volume, continuous fan operation
Evaporator size (CZ13) Cooler: 392 ft2/ton, freezer: 295 ft
2/ton, dock: 218 ft
2/ton
Evaporator cfm (CZ13) Cooler: 4.3 cfm/ft2, freezer: 4.79 cfm/ft
2, dock: 7.9 cfm/ft
2
Compressor type Ammonia screw comp. w/slide valve capacity control
Compressor configuration Parallel equal, 3 compressors per suction group
Suction groups Low temperature: -20°F, medium temperature: 30°F
Room temperature Cooler: 40°F, freezer: -10°F, dock: 40°F
Evaporator fan power 0.15 W/cfm
Condenser type Evaporative condenser
Min condensing temp 85°F
Condenser fan and pump 330 Btu/hr-W
Cond. design approach 23°F (CZ13, design wet bulb = 73°F)
Source: (PG&E 2007)

20
Table 4. Prototypical Small Refrigerated Warehouse Model Description
Model Parameter Value
Shape Rectangular, 200 ft x 130 ft
Floor area Freezer: 10,000 ft2, cooler: 10,000 ft
2, dock: 6,000 ft
2
Number of floors 1
Floor to ceiling height 30 ft
Exterior wall construction Insulated metal panel
Ext. wall R-value Cooler and dock: R-20, freezer: R-26
Infiltration rate Cooler and freezer: 0.1 ACH, dock: 0.3 ACH
Roof construction Insulated low mass roof
Roof R-value Cooler and dock: R-23, freezer: R-46
Roof absorptivity 0.80
Lighting power density 0.6 W/ft2
Equipment power density 0.7 W/ft2 (forklifts and plug loads)
Operating schedule 24/7
No. people 52 max
Evaporator type Constant volume, continuous fan operation
Evaporator size (CZ13) Cooler: 550 ft2/ton, freezer: 380 ft
2/ton, dock: 360 ft
2/ton
Evaporator cfm (CZ13) Cooler: 3 cfm/ft2, freezer: 3.5 cfm/ft
2, dock: 4.7 cfm/ft
2
Compressor type HFC reciprocating compressor with unloader
Compressor configuration Parallel equal, 2 compressors per suction group
Suction groups Low temperature: -20°F, medium temperature: 30°F
Room temperature Cooler: 40°F, freezer: -10°F, dock: 40°F
Evaporator fan power 0.15 W/cfm
Condenser type Air-cooled condenser
Min condensing temp 85°F
Condenser fan and pump 53 Btu/hr-W
Cond. design approach 15°F cooler and dock, 10°F freezer
Source: (PG&E 2007)
To appropriately define each parameter, this study investigated current best
practice. Both the current best practice and the “Savings by Design Baseline” values are
listed for insulation levels (Table 5), evaporator control (Table 6), condenser control (Table
7), compressor control (Table 8), lighting requirements (Table 9), and general system
control (Table 10).

21
Table 5. Refrigerated Warehouse Shell, Design Baseline and Common Practice
Savings
by Design
Common
Practice
ASHRAE
Recommendation
Freezer Ceiling R-46 R-31 to 50 R-45 to 50
Freezer Exterior Wall R-26 R-32 to 56 R-35 to 40
Freezer Floor R-30 R-18 to 30 R-27 to 32
Cooler Ceiling R-23 R-24 to 40 R-30 to 35
Cooler Walls R-20 R-23 to 40 R-25
Dock Ceiling R-23 Same as facility R-30 to 35
Dock to Outdoor Wall R-20 Same as facility R-25
Underfloor Heating No electric Heat recovery-glycol None
Source: (PG&E 2007)
Table 6. Refrigerated Warehouse Evaporator, Design Baseline and Common Practice
Savings
by Design
Common
Practice
Evaporator fan speed
control
Constant volume,
constant operation
Constant volume,
constant operation
Evaporator design
approach temperature
10°F Variable based on
humidity required
Evaporator fan power
(W/cfm)
Not addressed No opinion
Source: (PG&E 2007)

22
Table 7. Refrigerated Warehouse Condenser, Design Baseline and Common Practice
Savings
by Design
Common
Practice
Condenser type
Not addressed Evaporative
condensers in
ammonia facilities
Air-Cooled condenser
fan speed control
Cycling one-speed
fans
Cycling one-speed
fans
Air-Cooled cond.
design approach
temperature
10 to 15°F
depending on
suction temp.
10 to 15°F
depending on
suction temp.
Air-Cooled condenser
fan power
53 Btu/W-hr at
10°F approach
temperature
No comment
Evaporative condenser
fan speed control
Two speed fan Two speed fan
Evaporative cond.
design approach
temperature
18 to 25°F based
on design wet
bulb temperature
18 to 20°F
Evaporative condenser
fan and pump power
330 Btu/W-hr at
100°F SCT and
70°F wet bulb
No comment
Source: (PG&E 2007)
Table 8. Refrigerated Warehouse Compressor Plant, Design Baseline and Common
Practice
Savings
by Design
Common
Practice
Compressor capacity
modulation
Not addressed Slide valves on screw compressors,
multiple compressor racks on
reciprocating plants
Compressor oil cooling Not addressed Unclear
Source: (PG&E 2007)
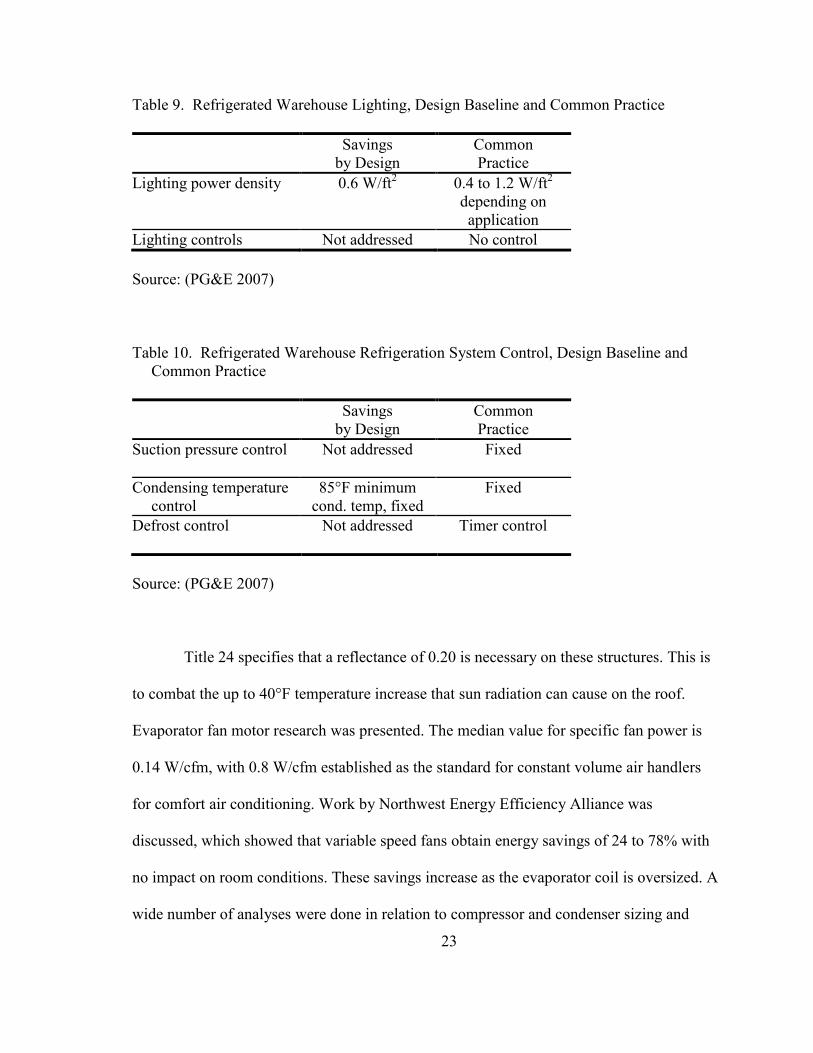
23
Table 9. Refrigerated Warehouse Lighting, Design Baseline and Common Practice
Savings
by Design
Common
Practice
Lighting power density 0.6 W/ft2 0.4 to 1.2 W/ft
2
depending on
application
Lighting controls Not addressed No control
Source: (PG&E 2007)
Table 10. Refrigerated Warehouse Refrigeration System Control, Design Baseline and
Common Practice
Savings
by Design
Common
Practice
Suction pressure control
Not addressed Fixed
Condensing temperature
control
85°F minimum
cond. temp, fixed
Fixed
Defrost control
Not addressed Timer control
Source: (PG&E 2007)
Title 24 specifies that a reflectance of 0.20 is necessary on these structures. This is
to combat the up to 40°F temperature increase that sun radiation can cause on the roof.
Evaporator fan motor research was presented. The median value for specific fan power is
0.14 W/cfm, with 0.8 W/cfm established as the standard for constant volume air handlers
for comfort air conditioning. Work by Northwest Energy Efficiency Alliance was
discussed, which showed that variable speed fans obtain energy savings of 24 to 78% with
no impact on room conditions. These savings increase as the evaporator coil is oversized. A
wide number of analyses were done in relation to compressor and condenser sizing and

24
control. The highest savings were seen with floating head pressure down to 70°F, operating
at a 5°F dry bulb offset (air cooled) or 9°F wet bulb offset (evaporative), and utilizing
variable speed condenser fans.
In regard to Title 20 and walk-in coolers and freezers, the following
recommendations are made:
Wall and ceiling: R-36 freezer, R-28 cooler
Floor: R-36 freezer
Electric underfloor heating is not typically utilized in warehouse applications but
may be used in smaller walk-in applications. This should be thermostatically controlled to
limit energy use. Recommendations are made for control methods, as well as a lighting
reduction to 0.6 W/ft2.
Product Load
(Gortner et al. 1948)
Variations in the air temperature in a refrigerated freezer occur during its operation.
Large temperature variations may occur if refrigeration equipment breaks down, control
logic response lags, during excessive loads while freezing new product, and lack of
partitioning of spaces. This work is focused on defining the sensitivity of the relationship
between product quality and storage temperature variation.
Products used to analyze the effects of temperature fluctuation include strawberries,
beans, peas, and pork. Typical storage temperatures for pork are specified as -5 to -15°F.
Test temperatures ranged from 0 to 20°F.
The result of this analysis was that product quality was not significantly different
for product cycled between 0 and 20°F and product maintained at 10°F. One thing
25
specifically noted was the need to keep storage temperatures below 0°F to obtain the
optimum product longevity.
(Hustrulid and Winters 1943)
Hustrulid and Winters performed testing to analyze the effect of fluctuating storage
temperatures on the quality of frozen fruits and vegetables. Snap beans, corn, peas,
strawberries, cantaloupe, and raspberries were put in either a constant temperature locker
(30 ft3) or a locker controlled with oscillating air temperature for six to nine months.
Hustrulid states that no difference is apparent between food subjected to oscillating
or constant temperatures. Food exposed to oscillating temperature was varied from -20 to
0°F. However, Hustrulid failed to note the temperature of the constant temperature freezer.
(Woodroof and Shelor 1947)
Woodroof presented information related to freezing foods for storage and the
effects of storage temperature fluctuation on food quality. He first presented work done by
others, then differentiated his work, and finally discussed his results and conclusions.
Zero degrees Fahrenheit is generally accepted as the most desirable temperature for
holding frozen fruits. Tressler and Evers echoed this, stating that 0°F should be maintained
at all times and that certain fruits such as peaches should be held at -5°F (Tressler and
Evers 1947), as storage life can be increased with lower temperature storage. Bauernfeind
and Siemers make a similar recommendation of storing peaches between -10 and 0°F
(Bauernfeind and Siemers 1945). Wiegand states that 0°F is necessary for locker plants
whereas commercial plants require lower temperatures ranging from -10 to 0°F (Wiegand
1931). However, Lutz recommended storing frozen dewberries with temperatures as high
as 10 to 15°F (Lutz et al. 1934). Plagge also suggested slightly higher storage temperatures
26
of 0 to 10°F (Plagge 1938). Diehl and Berry stated that 15°F is the practical upper limit for
frozen storage of most plant products (Diehl and Berry 1933). Winters conducted
experiments which showed that higher storage temperatures lower the quality of the food
(Winters 1942).
Hustrulid and Winters (Hustrulid and Winters 1943) reported that no difference in
food quality is apparent for reasonable fluctuations in temperature. Opposing this stance,
Woodroof, Birdseye (Birdseye 1946), Tressler, and Plagge all explicitly state that storage
temperature fluctuation will decrease the quality of food.
(Becker and Fricke 1996a)
Transpiration and respiration are two processes occurring in products over time.
Transpiration is loss of moisture through the product skin via convective mass transfer to
the surroundings. Respiration is defined as the chemical process by which fruits and
vegetables convert stored sugars into carbon dioxide, water, and heat. Respiration adds a
continuous heat load to the refrigerated space and affects the transpiration rate.
Transpiration effects the relative humidity maintained by the space and the defrost
requirements.
Becker presents details on respiration and transpiration for various fruits and
vegetables.
(Love and Cleland 2007)
Chiller cabinets are stand-alone refrigeration units used by convenience stores or
supermarket chains to keep small displays of products cool. Typical products for such units
are packaged beverages, such as soda or bottled water. In addition to keeping products
cool, items delivered to such a unit for display are usually at room temperature initially.

27
The focus of this article is to model the pull down of a chiller cabinet, predicting the
interior temperature distribution over time.
A model was developed and then a prototype unit was tested to validate the model.
The display cabinet was 21 ft3 and contained 600 drink cans. It operated at a set point air
temperature of 36.5°F using 1300 ft3/min and a 9 cc compressor utilizing R-134a. Over a
26 hour period it was designed to pull product from 95°F down to the storage temperature.
Simulations of the prototypical unit were done to analyze the effects of modifying
certain components that directly impact the refrigeration capacity of the unit. Results
included product pull-down periods ranging from 18.8 to 24.9 hours.
Evaporator Application and Defrost
(Nelson)
Nelson gives a general discussion about defrost methods, including water, electric,
and hot gas defrost, highlighting the positive aspects of hot gas defrost. Defrost efficiency
is defined by Equation 14.
indef
meltdef
Q
Q
,
( 14 )
(Cole 1989) noted that typical defrost systems only operate at a 15 to 20%
efficiency, with 60% of the heat lost to the room via convection and radiation, 20% used to
heat the metal in the evaporator, and 5% lost due to hot gas bypass at the end of defrost.
A defrost comparison for a 32°F and -10°F room is made. In a colder room there is
a greater convective component resulting in a 63% loss to the room compared to a 46%
loss to a 32°F room. The defrost duration is 30 minutes. One item noted by Nelson that is
not immediately apparent is the fact that increasing the hot gas temperature is not

28
necessarily the best method, as this increases the percentage of heat lost to the refrigerated
space.
The minimum time to melt frost was established at 8 and 10 minutes by Cole (Cole
1989), but industrial facilities have hot gas defrost durations in excess of 30 minutes.
Reducing the defrost period to its optimum duration reduces the amount of heat lost to the
space. Allowing the frost to build longer on the coil before defrost also reduces heat lost to
the refrigerated space during the defrost cycle, however this is a balance between the
evaporator performance throughout operation and the benefit from increasing the defrost
efficiency.
In a cost savings analysis performed by Nelson room temperatures analyzed include
32, 0, -10, and -30°F. Typical defrost efficiencies are noted as 32, 18, 17, and 14%. Nelson
predicts that through optimization, these efficiencies may be improved by 91 to 186%.
(O'Hagan et al. 1993)
O‟Hagan gathered finned coil performance data under frosting conditions. In an
attempt to obtain applicable results, air flow rate was reduced during frosting conditions
due to the increased pressure drop over the coil, and a wide range of sensible heat ratios
(SHRs) were tested, as coils are often located in areas where they can experience
particularly low local SHR. At variations of the parameters noted above, the performance
of the coil was measured for comparison.
The concept of unfavorable frost formulation noted by Smith (Smith 1989a) was
adopted by O‟Hagan. When the line representing the temperature and humidity of the air
passing through the coil, crosses the saturation line of the psychrometric chart, unfavorable
amounts of frost will form from airborne ice-crystal precipitation. This frost is of a

29
particularly low density, insulating the coil and reducing air flow rate by a significant
amount.
Figure 1. Defrost Classifications
Source: (O'Hagan et al. 1993)
The test facility used was 7.87 ft tall, 8.86 ft wide, and 13.78 ft long and
constructed of 5.9 inch thick polystyrene sandwich panel. Major system components
included, a HCFC-22 test coil, dry heat addition system, and a wet heat addition system.
The coil performance is defined in Equation 15. This was developed to allow for a
direct comparison of trials with different SHRs, as presented in Table 11.
offon
evapoffevapon
s
Ebal
s
TT
TTTTQ
TD
QUA
/ln ( 15 )
Unfavorable
Transitional
Favorable
TCS TC

30
Table 11. Experimental Conditions for Coil Performance Trials
Trial Ton (°F) RHon (%) SHR ɸs (Btu/hr)
1 31.6 68 0.84 27640
2 31.3 68 0.83 26960
3 29.1 72 0.78 29000
4 30.6 83 0.71 22860
5 29.1 82 0.71 22180
6 31.5 82 0.71 22180
7 32.0 76 0.70 33440
8 32.4 77 0.70 33780
9 30.9 78 0.70 31390
10 31.3 81 0.70 33440
11 29.5 87 0.70 29340
12 30.7 89 0.63 26960
13 28.8 87 0.62 25930
14 31.8 87 0.58 28320
15 32.2 93 0.54 31730
16 32.4 93 0.54 31730
Source: (O'Hagan et al. 1993)
Test result analysis showed variability of frost formation at low SHR levels.
Previous work on coil performance with frosting has indicated slight initial performance
enhancement prior to degradation due to the insulating effect of the frost. No enhancement
was seen by O‟Hagan et al. Air flow restriction for the same amount of frost deposited was
greater at lower SHR values. After operating at low SHR values, transitioning to higher
SHR conditions offers some recovery to coil performance.
(Cleland and O'Hagan 2003)
The heat transfer performed by an evaporator diminishes as water condenses on the
coil and turns into frost. This frost continues to build and reduce performance until a

31
defrost cycle removes it. In sizing an evaporator to maintain certain interior conditions,
careful attention should be paid to the psychrometrics of the air passing through the coil.
Sherif (Sherif et al. 2001) reported experimental results on coils operating at typical
low-temperature refrigerant conditions of -40°F evaporator temperature and 17°F air-on
temperature. Cleland reports results from testing of frosting on coils in rooms with air-on
temperatures of approximately 32°F (28.8 to 32.9°F) at moderate temperature differences,
a wide range of the sensible heat ratios (0.63 to 0.78), and an evaporator temperature
ranging from 9 to 12.6°F.
As defined by Smith (Smith 1992; Smith 1989b) air conditions should pass below
the saturation curve on the psychrometric chart (Figure 1). To avoid undesirable frost
formation, coils should be sized so that the coil surface temperature is greater than the
critical coil surface temperature as defined by Equations 16 and 17.
7
7
10106705.3511.271
67.6071exp
109283.1
cs
ws
T
( 16 )
sub
a
wsonon
h
c
SHR
TT
11
csc
( 17 )
For a discrete number of conditions, the critical surface temperature was calculated
(Table 12). Due to the relationship of these parameters, any one parameter may be
determined given the other two.

32
Table 12. Critical Conditions to Avoid Unfavorable Frost During Evaporator Operation
with Air-On Temperature of 32°F
Ron (%) Tsc (°F) SHRc
60.0 2.5 0.81
64.4 5.0 0.79
70.0 8.2 0.77
80.0 13.8 0.72
80.2 14.0 0.71
86.1 17.6 0.68
90.0 20.1 0.65
91.4 21.2 0.64
95.0 24.1 0.62
95.8 24.8 0.61
Source: (Cleland and O'Hagan 2003)
(Mago and Sherif 2005)
Frosting of coils during operation reduces performance of evaporators. This study
analyzes this effect on coils operating near saturated or under supersaturated conditions.
Operation near saturated conditions is a common practice. Items discussed include the two
types of frost formations, issues with using hot-gas defrost, and some methods to improve
the energy efficiency of the process.
Defrost efficiency is the ratio of the energy required to melt the ice to the energy
put into the defrost cycle (Equation 14).
indef
meltdef
Q
Q
,
( 14 )
The experimental facility is a small walk-in freezer with an industrial sized freezer
coil (4 fins per inch) installed in it. The space is isolated from infiltration through use of
good seals on the doors and the filling of all cracks. To determine the heat transfer

33
properties of the space, the enclosure was tested in a clean, dry, and empty state. Some test
conditions that were utilized are listed in Table 13.
Table 13. Experimental Conditions for Various Tests Performed
Experiment
Entering Air Exit Air Space Coil Face
Velocity
(fpm) Dry Bulb
(°F)
RH
(%)
Dry Bulb
(°F)
Degree of
Sat. (%)
Temp
(°F)
RH
(%)
Demarcation Scenario 1 17.1 64 2.8 92
Demarcation Scenario 2 17.1 84 2.8 102
Demarcation Scenario 3 17.1 92 3.0 105
Demarcation Scenario 4 17.1 99 3.0 109
Hot Gas Test Initial 3.0 75.6 768
Hot Gas Case A 6.8 to 10.4
Hot Gas Case B 5
Heat Pipe Test 37.4 50 17 88 755
High Face Vel. Initial 6 75 315, 728, 1280
Source: (Mago and Sherif 2005)
Demarcation testing showed definite differences between frost forming during sub-
saturated conditions and super-saturated conditions, with super-saturated frost being snow-
like. Two mechanisms drive frost formation. The first is the relationship between the free
stream humidity and the coil surface temperature. The second driving force is due to water
condensing out of the air and being convected into the coil. During super-saturated
conditions water vapor transitions directly to ice crystals, which are easily deposited once
they are convected into the evaporator coil.
Hot gas defrosting was tested during super and sub-saturated conditions. Sub-
saturated testing (Case B) had little frosting of the coil, even with a coil surface
temperature of -7.6°F. The super-saturated test (Case A) resulted in an evaporator coil

34
completely blocked by ice after four hours of operation. When defrosted, ice fell off in
chunks onto the floor as opposed to draining into the pan, with a defrost efficiency of only
22%.
Energy reduction techniques investigated include application of heat pipes,
dampers, and high face velocities. When heat pipes are applied to cooling dehumidifying
processes they reduce energy usage by approximately 25%. Dampering a coil during the
defrost cycle reduces the amount of defrost heat that is added to the space. Defrost
efficiencies have been shown to increase by 43% (Mago and Sherif 2002) through the use
of dampering. Higher face velocities during operation result in higher defrost efficiencies
during the defrost cycle. Defrost efficiency increased from 18 to 70.4% with a change in
face velocity from 315 to 1280 fpm. A typical well-designed hot gas system is noted to
require defrost for only about 30 minutes every day.
Infiltration Load
(Takahashi and Inoh 1963)
Takahashi discusses the different types of air curtains utilized by cold rooms,
including outside down-blow type, inside down-blow-circulation type, and inside lateral-
blow-circulation type. Each type of air curtain was tested to analyze what method achieved
the highest decrease in infiltration. In conclusion, most air curtains reduced heat loss
through doorways to about 20-40% (the air curtains were 80-60% efficient), respectively,
almost independent of the type of air curtain applied.
(Gosney and Olama 1975)
Gosney and Olama developed their well-known definition of infiltration rate
(Equation 18) in this article. Gosney discusses the current available information on
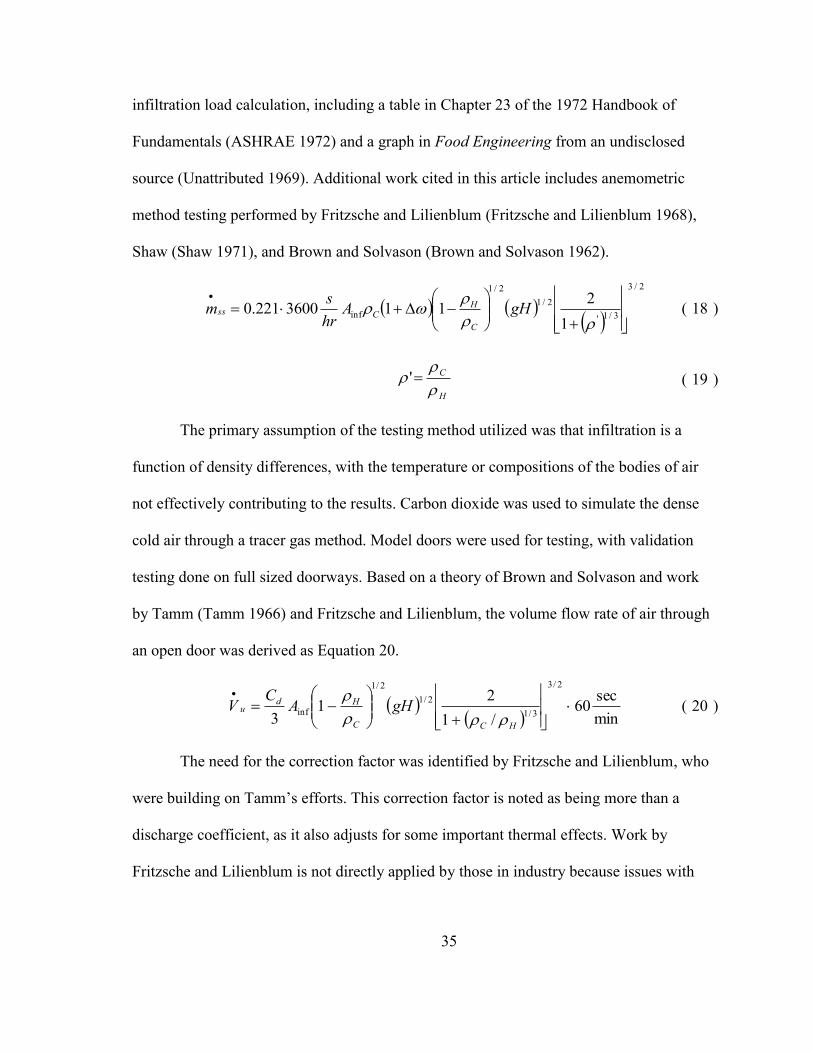
35
infiltration load calculation, including a table in Chapter 23 of the 1972 Handbook of
Fundamentals (ASHRAE 1972) and a graph in Food Engineering from an undisclosed
source (Unattributed 1969). Additional work cited in this article includes anemometric
method testing performed by Fritzsche and Lilienblum (Fritzsche and Lilienblum 1968),
Shaw (Shaw 1971), and Brown and Solvason (Brown and Solvason 1962).
2/3
3/1'
2/1
2/1
inf
1
2113600221.0
gHA
hr
sm
C
HCss ( 18 )
H
C
' ( 19 )
The primary assumption of the testing method utilized was that infiltration is a
function of density differences, with the temperature or compositions of the bodies of air
not effectively contributing to the results. Carbon dioxide was used to simulate the dense
cold air through a tracer gas method. Model doors were used for testing, with validation
testing done on full sized doorways. Based on a theory of Brown and Solvason and work
by Tamm (Tamm 1966) and Fritzsche and Lilienblum, the volume flow rate of air through
an open door was derived as Equation 20.
min
sec60
/1
21
3
2/3
3/1
2/1
2/1
inf
HCC
Hdu gHA
CV
( 20 )
The need for the correction factor was identified by Fritzsche and Lilienblum, who
were building on Tamm‟s efforts. This correction factor is noted as being more than a
discharge coefficient, as it also adjusts for some important thermal effects. Work by
Fritzsche and Lilienblum is not directly applied by those in industry because issues with
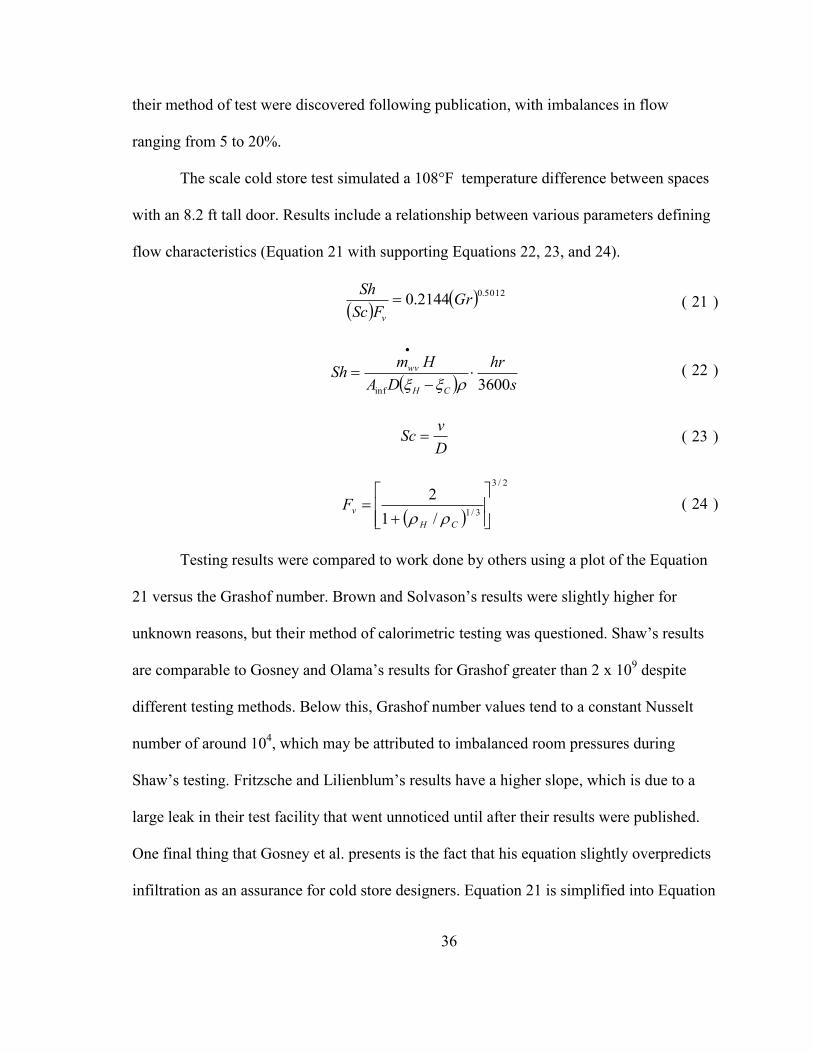
36
their method of test were discovered following publication, with imbalances in flow
ranging from 5 to 20%.
The scale cold store test simulated a 108°F temperature difference between spaces
with an 8.2 ft tall door. Results include a relationship between various parameters defining
flow characteristics (Equation 21 with supporting Equations 22, 23, and 24).
5012.0
2144.0 GrFSc
Sh
v
( 21 )
s
hr
DA
HmSh
CH
wv
3600inf
( 22 )
D
vSc ( 23 )
2/3
3/1/1
2
CH
vF
( 24 )
Testing results were compared to work done by others using a plot of the Equation
21 versus the Grashof number. Brown and Solvason‟s results were slightly higher for
unknown reasons, but their method of calorimetric testing was questioned. Shaw‟s results
are comparable to Gosney and Olama‟s results for Grashof greater than 2 x 10⁹ despite
different testing methods. Below this, Grashof number values tend to a constant Nusselt
number of around 104, which may be attributed to imbalanced room pressures during
Shaw‟s testing. Fritzsche and Lilienblum‟s results have a higher slope, which is due to a
large leak in their test facility that went unnoticed until after their results were published.
One final thing that Gosney et al. presents is the fact that his equation slightly overpredicts
infiltration as an assurance for cold store designers. Equation 21 is simplified into Equation

37
25 to give a more usable form. From this, equations defining water and heat transfer are
developed (Equations 26 and 27), where Equation 27 defines a factor to compensate for
cycling of the doorway, combining Equations 28, 29, and 30.
hr
gHAmHCC
HCCHwv
sec3600
/1
21221.0
2/3
3/1
2/1
2/1
inf
( 25 )
hr
gHhhAQHCC
HCCHD
sec3600
/1
21221.0
2/3
3/1
2/1
2/1
infinf
( 26 )
1.0
3565.0
2
0112.01 dopen
open
ft
H
vt
( 27 )
1.0
3565.0
0112.01 f
o
NN
( 28 )
d
open
dopenft
tftN ( 29 )
2H
vtN
open
o
( 30 )
(Longdill and Wyborn 1978)
Infiltration is a large load on refrigerated spaces at 1.54 x 10⁶ Btu/h for enclosed
loading docks and as high as 4.09 x 10⁶ Btu/h when there is no enclosed loading space
attached to a refrigerated storage facility. Air curtains are often utilized to reduce this
infiltration load. Longdill and Wyborn‟s study was focused on developing a basic method
to optimize air curtain performance to allow for easier application by cold store designers.

38
The infiltration flow pattern for a typical doorway has fast air movement at the
bottom of the door leaving the refrigerated space, high air flow at the top of the door
entering the refrigerated space, and a transition region in between. The maximum velocity
for such a door may be represented by Equation 31. Again, this is the maximum velocity
found at the top and bottom of the door, with the average velocity being much lower.
Profiles for the entering and exiting air flows are given by Equations 32, 33, and 34 (Tamm
1969).
2/1
31
12
s
sgHumf ( 31 )
2/112 sxzgu CC ( 32 )
2/1
11
2
szxgu HH ( 33 )
31 s
Hz
( 34 )
Longdill performed tracer-gas method tests, with and without air curtains in
operation, to analyze the effectiveness of the unit on a 6250 ft3 freezer with a 69.8°F
outdoor temperature. A vertical air curtain was tested on a 1.74 x 5.41 ft doorway.
Variations in jet velocity and jet thickness were studied at store temperatures of -4 to 32°F.
The optimum jet velocity is a function of the curtain-jet thickness and the refrigerated
space temperature. This optimum point is somewhat sensitive to variations in flow rate,
approximated in Table 14. Air curtains operating with 80% efficiency would represent a
682,400 Btu/hr savings for this storage freezer.
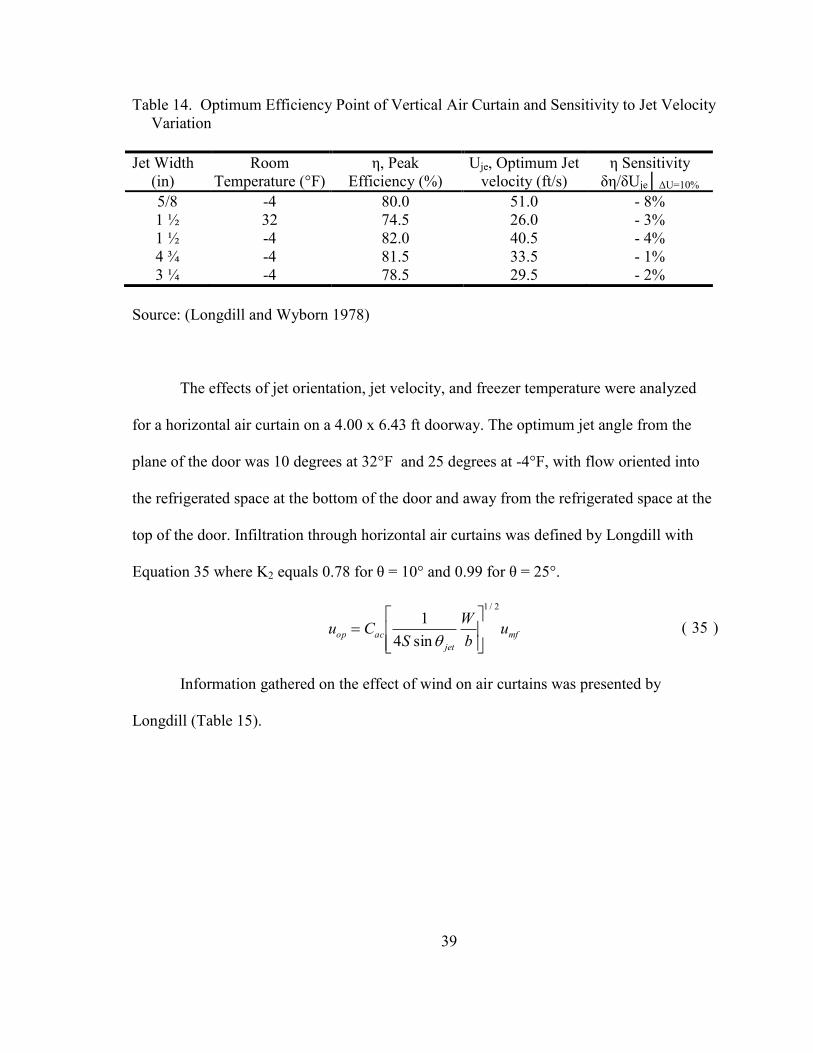
39
Table 14. Optimum Efficiency Point of Vertical Air Curtain and Sensitivity to Jet Velocity
Variation
Jet Width
(in)
Room
Temperature (°F)
η, Peak
Efficiency (%)
Uje, Optimum Jet
velocity (ft/s)
η Sensitivity
δη/δUje│ΔU=10%
5/8 -4 80.0 51.0 - 8%
1 ½ 32 74.5 26.0 - 3%
1 ½ -4 82.0 40.5 - 4%
4 ¾ -4 81.5 33.5 - 1%
3 ¼ -4 78.5 29.5 - 2%
Source: (Longdill and Wyborn 1978)
The effects of jet orientation, jet velocity, and freezer temperature were analyzed
for a horizontal air curtain on a 4.00 x 6.43 ft doorway. The optimum jet angle from the
plane of the door was 10 degrees at 32°F and 25 degrees at -4°F, with flow oriented into
the refrigerated space at the bottom of the door and away from the refrigerated space at the
top of the door. Infiltration through horizontal air curtains was defined by Longdill with
Equation 35 where K2 equals 0.78 for θ = 10° and 0.99 for θ = 25°.
mf
jet
acop ub
W
SCu
2/1
sin4
1
( 35 )
Information gathered on the effect of wind on air curtains was presented by
Longdill (Table 15).

40
Table 15. The Effect of Wind on Optimized Curtain Efficiency
Curtain Efficiency %
Curtain
Type
Curtain
Number
No Wind 0.5 ft/s
Draught
Wind
Load (ft/s)
Side Wind Direct
Wind
Vertical 1 77 35 22.0 2 6
Vertical 2 82 33 22.0 3 16
Vertical 3 83 31 22.0 -9 16
Vertical 4 79 - 22.0 -7 27
Vertical 5 68 15 22.0 1 19
Horizontal 6 82 30 17.1 13 0
Horizontal 6 82 30 8.5 37 1
Source: (Longdill and Wyborn 1978)
(Jones et al. 1983)
ASHRAE handbook data often underestimates moisture infiltration, which may
enter through ducts passing through unconditioned spaces, by natural convection at
openings, and/or by upstream diffusion through outflowing air. This paper presents a
method to estimate infiltration in a more complete manner and offers solutions to reduce
these modes of infiltration.
To perform the testing for this work a 12 x 6 x 6 ft test chamber was constructed of
plywood, supported by a wood frame. The chamber was lined with sheet metal to ensure a
vapor barrier between the exterior conditions and the chamber construction materials. The
exterior of the chamber was encased in 2 inch foam insulation. Jones et al. (Jones et al.
1983) applied the results of this testing to define moisture infiltrating into a refrigerated
space.

41
Moisture added to a cold room is more than would be expected due to reverse flows
(Equation 36 or Equation37). Equation 36 is accurate within 20% assuming the following
conditions are met:
The temperature difference between spaces is greater than 5°F
There are no sources of turbulence directed at either side of the opening
The length of the opening is short compared to its height and width
The opening is on a vertical surface
Equation 37 is applicable for aspect ratios (length to height) greater than 0.5.
dao
s
r mmC
m 33.026.0
( 36 )
daor mmm 26.010.0 ( 37 )
(Pham and Oliver 1983)
Pham and Oliver performed research detailed in this report (Pham and Oliver
1983), that is referenced throughout the field of refrigeration. In this work, Pham analyzes
the effectiveness of a correlation derived by Tamm ((Tamm 1965), Equation 38) using
velocity traversing and a tracer gas method test. In addition, the effect of forklift traffic and
air curtains are analyzed.
min60
1
12
3
233/1
s
s
sgHWHVu
( 38 )
Too validate Tamm‟s equation, multiple test freezers were employed, ranging from
a 6250 ft3 facility with a 12.47 inside height, 3.94 x 5.25 ft test doorway, and a test
temperature difference of 35.1°F, to a 1,306,643 ft3 facility with an inside height of 69.6 ft,

42
test doorway dimensions of 9.84 x 11.81 ft, and a temperature difference of 61.2°F across
the doorway. Forklift traffic passed through the large doorway at one pass per minute. Test
conditions and results summarized in Table 16.
Table 16. Air Interchanges Across Cold Store Doors
Store height
(ft)
Door width
(ft)
Door height
(ft)
Inside temp
(°F)
Outside
temp (°F)
Measured
interchange
(cfm)
Interchange
from
Equation 38
27.6 10.0 9.0 2.3 56.3 6,822.8 10,403.7
27.6 10.0 9.0 2.3 56.3 6,865.2 10,403.7
16.7 8.9 9.5 -0.4 59.0 7,225.4 10,297.8
21.3 9.8 11.8 1.4 44.6 9,195.9 13,560.8
69.6 5.8 7.0 -4.0 57.2 2,585.0 4,322.5
12.5 3.5 6.5 23.9 59.0 1,334.9 1,758.7
Source: (Pham and Oliver 1983)
With the above data, Pham suggests applying an empirical factor to Tamm‟s
equation of 0.68. Pham‟s testing also included profile testing on a 9.84 ft tall door, with a
2.3°F inside temperature and a 56.3°F outside temperature (Figure 2). Tamm overpredicts
the flow rate at the bottom of the doorway, with the measured data profile from the
midpoint of the doorway down being a mostly constant profile.

43
Figure 2. Air Velocity Profile for Test Door at 54°F Temperature Difference
Source: (Pham and Oliver 1983)
Tracer gas testing was performed on four conventional, palletized refrigerated
storage facilities, with gross volumes of 141,259 ft3, 197,762 ft
3, 388,461 ft
3, and 1,341,957
ft3. Doors were enclosed by a loading area or exposed to the outdoors. Infiltration
protection devices included no protection, horizontal or vertical air curtains, plastic strip
curtains, and a combination of air curtain and strip curtain protections. One interesting
finding was that infiltration decays with time (Figure 3). The cause of this was attributed to
internal partitioning of air flow as opposed to a rise in the internal box temperature. Product
stacked around the doorways and throughout the cold store, limit or restrict air flow to the
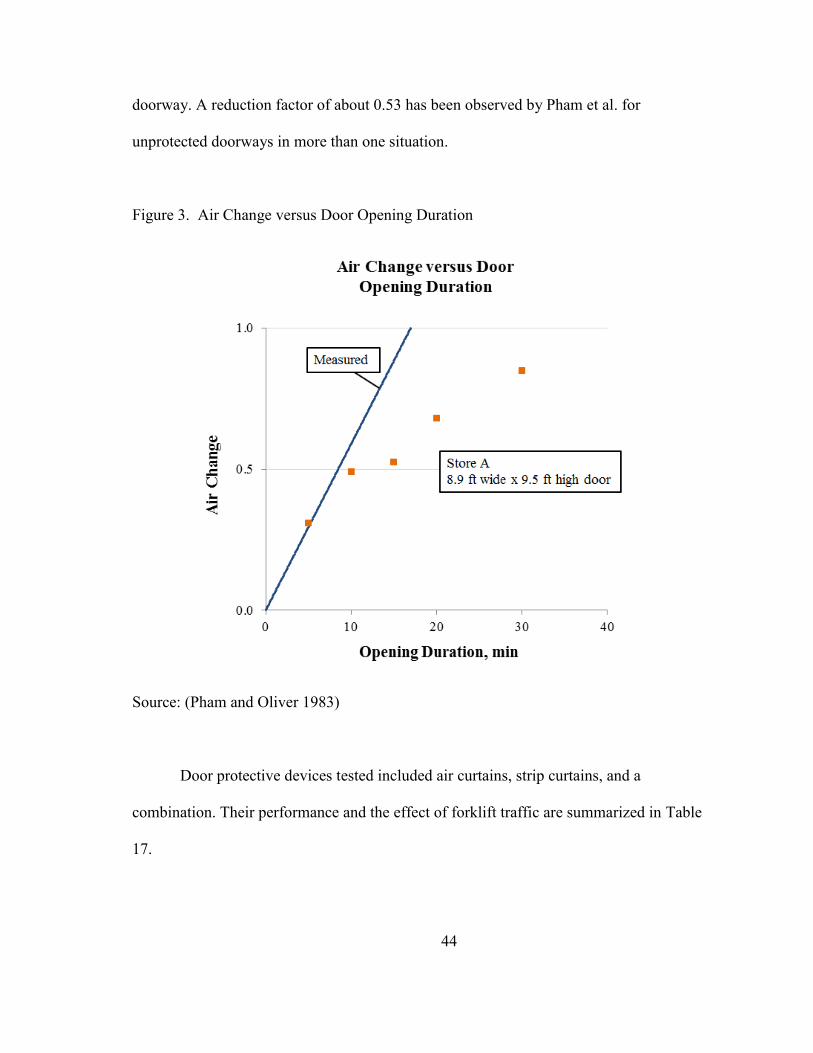
44
doorway. A reduction factor of about 0.53 has been observed by Pham et al. for
unprotected doorways in more than one situation.
Figure 3. Air Change versus Door Opening Duration
Source: (Pham and Oliver 1983)
Door protective devices tested included air curtains, strip curtains, and a
combination. Their performance and the effect of forklift traffic are summarized in Table
17.

45
Table 17. Effectiveness of Door Protective Devices and the Effect of Forklift Traffic on
9.84 x 11.81 ft Doorway
Efficiency
(%)
Increase in
Infil. (%)
Vertical non-recirculating air curtain, 4.5 inch slot, 1969 fpm jet 79 ± 3
Horizontal recirculating air curtain, 2.4 inch slot, 1339 fpm jet 76 ± 3
Plastic strip curtain 93 ± 1
Horizontal air curtain (as noted above) and plastic strip curtain 91 ± 1
Forklift with pallet, one pass per minute, unprotected doorway 21 ± 10 - 21 ± 10
Forklift with pallet, one pass per minute, air and/or plastic curtains 43 ± 62
Internal circulation fans off for forklift passage - 9 ± 6
Source: (Pham and Oliver 1983)
(Hendrix et al. 1989)
Hendrix et al. analyzed the available correlations for infiltration into cold rooms
using measured data from four test rooms at two refrigerated warehouses (Hendrix et al.
1989). Rooms 1 and 2 are 25,000 ft2 (250 x 100 ft) and 30 ft tall for a volume of 750,000
ft3. Construction is of pre-fabricated, insulated panels, with three central floor-to-ceiling
storage racks and additional racks around the perimeter. The space is cooled by two
centrally mounted unit coolers rated at 52,000 Btu/h each (7-8°F approach and 63,885
cfm) which maintain -15°F for one room and 0°F for the other. Two 7 x 10 ft
pneumatically actuated horizontal sliding insulated doors are positioned on one end of each
room, protected with vestibules and strip curtains. On the other end of each room there is a
similar door equipped with strip curtains but no vestibule.
The second facility has a freezer space, ice cream freezer space, and refrigerated
dock space. The freezer is 150 x 180 ft (27,000 ft2) with a 30 ft ceiling (810,000 ft
3).
operating at -10°F. Construction and rack spacing is similar to the other facility. One end of
46
the freezer connects to a smaller ice cream freezer (40 x 180 ft, 7200 ft2, 180,000 ft
3),
operating at -15°F. There are two 8 x 12 ft tall openings to the loading dock protected by
air curtains, a conditioned vestibule, and bi-fold strip curtains. Refrigeration is provided by
three unit coolers positioned at the end of the freezer, with an additional refrigeration unit
in the ice cream freezer. The loading dock operates at 40°F using ceiling mounted unit
coolers and is 4500 ft2 with a 17 ft ceiling (76,500 ft
3). It has six truck bays and an
additional 8 x 12.67 ft high doorway protected by an air curtain leading to a dry storage
area.
Ambient conditions during testing ranged from dry bulb of 37 to 85°F and relative
humidity of 20 to 89%. These conditions corresponded to temperature differences from 13
to 90°F. General findings of the study include strip curtain effectiveness greater than 90%
and vestibule effectiveness of nearly 75%. Effectiveness values previously determined by
others were presented in Table 18.
An additional finding was the fact that transient behavior is not important during
door opening events. Hendrix et al. states that Df for an unobstructed doorway should
always be equal to 1 whereas data collected by Gosney and Olama (Gosney and Olama
1975) suggest a value of 0.5 to 0.6 for the first 20 to 30 seconds that the door is open.
Hendrix extends the insignificance of transient effects to long door open periods. In this
study, no transient effects were observed for door open periods up to 45 minutes.
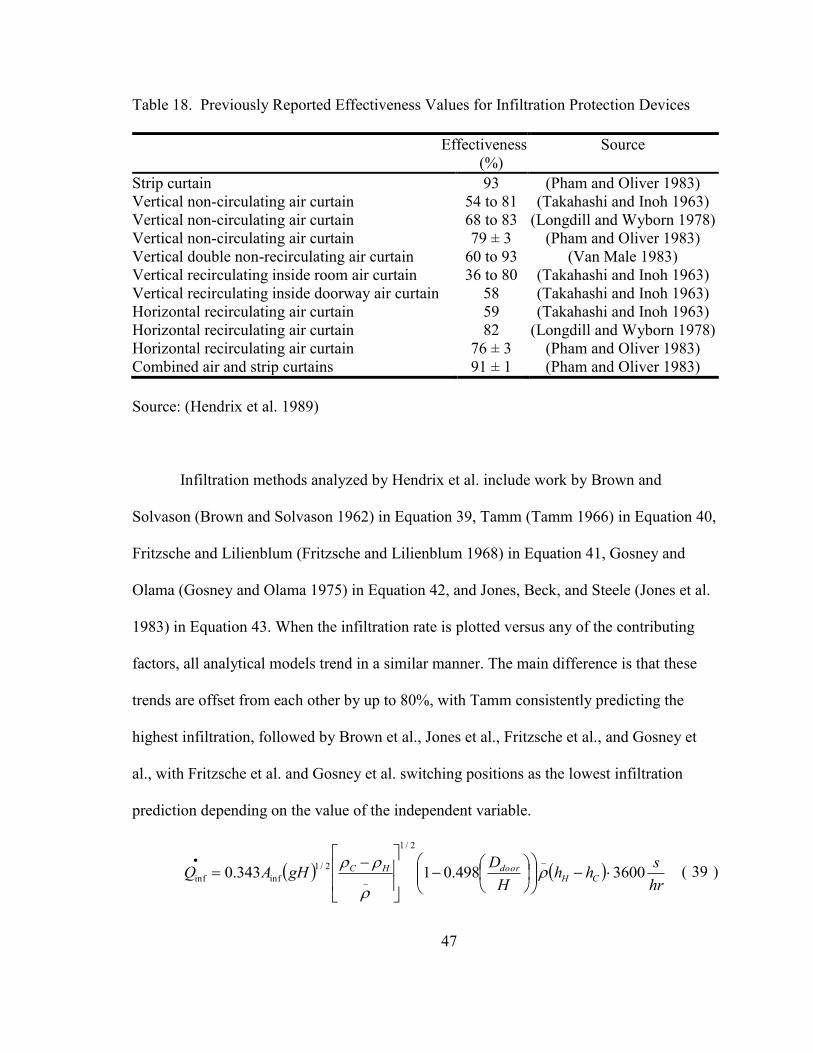
47
Table 18. Previously Reported Effectiveness Values for Infiltration Protection Devices
Effectiveness
(%)
Source
Strip curtain 93 (Pham and Oliver 1983)
Vertical non-circulating air curtain 54 to 81 (Takahashi and Inoh 1963)
Vertical non-circulating air curtain 68 to 83 (Longdill and Wyborn 1978)
Vertical non-circulating air curtain 79 ± 3 (Pham and Oliver 1983)
Vertical double non-recirculating air curtain 60 to 93 (Van Male 1983)
Vertical recirculating inside room air curtain 36 to 80 (Takahashi and Inoh 1963)
Vertical recirculating inside doorway air curtain 58 (Takahashi and Inoh 1963)
Horizontal recirculating air curtain 59 (Takahashi and Inoh 1963)
Horizontal recirculating air curtain 82 (Longdill and Wyborn 1978)
Horizontal recirculating air curtain 76 ± 3 (Pham and Oliver 1983)
Combined air and strip curtains 91 ± 1 (Pham and Oliver 1983)
Source: (Hendrix et al. 1989)
Infiltration methods analyzed by Hendrix et al. include work by Brown and
Solvason (Brown and Solvason 1962) in Equation 39, Tamm (Tamm 1966) in Equation 40,
Fritzsche and Lilienblum (Fritzsche and Lilienblum 1968) in Equation 41, Gosney and
Olama (Gosney and Olama 1975) in Equation 42, and Jones, Beck, and Steele (Jones et al.
1983) in Equation 43. When the infiltration rate is plotted versus any of the contributing
factors, all analytical models trend in a similar manner. The main difference is that these
trends are offset from each other by up to 80%, with Tamm consistently predicting the
highest infiltration, followed by Brown et al., Jones et al., Fritzsche et al., and Gosney et
al., with Fritzsche et al. and Gosney et al. switching positions as the lowest infiltration
prediction depending on the value of the independent variable.
hr
shh
H
DgHAQ CH
doorHC 3600498.01343.0_
2/1
_
2/1
infinf
( 39 )

48
hr
shhgHAQ CHC
CHC
HC 3600/1
2333.0
2/3
3/1
2/1
2/1
infinf
( 40 )
...004.048.0333.0
2/1
_
2/1
infinf
HCCH gHATTQ
hr
shh CHC
CH
3600/1
2...
2/3
3/1
( 41 )
hr
shhgHAQ CHC
HCC
HC 3600/1
2221.0
2/3
3/1
2/1
2/1
infinf
( 42 )
hr
shh
T
T
T
TgHAQ CHC
H
C
C
H 36001
11733.0
2/1
2/1
infinf
( 43 )
(Foster et al. 2003)
Numerous analytical models are compared, along with CFD modeling, to determine
the best method for predicting airflow through doorways.
Empirical models discussed include Brown and Solvason ((Brown and Solvason
1962), Equation 39), Tamm ((Tamm 1966), Equation 40), Fritzsche and Lilienblum
((Fritzsche and Lilienblum 1968), Equation 41), Gosney and Olama ((Gosney and Olama
1975), Equation 42), and Pham and Oliver ((Pham and Oliver 1983), Equation 44).
hr
shhgHAQ CHC
CHC
HC 3600/1
2226.0
2/3
3/1
2/1
2/1
infinf
( 44 )
Testing was completed using a cooler with internal dimensions of 15.75 x 19.0 x
12.47 ft high, operating a 33.8°F. Air flow was measured through 4.46 x 10.50 ft, 3.28 x

49
10.50 ft, and 1.42 x 2.26 ft openings with an average outdoor temperature of 68°F. A
leakage rate of 0.33 cfm was detected on the closed door.
Brown and Tamm models were found to overpredict infiltration by 52.1 to 122.7%.
Fritzsche and Gosney models give the closest predictions for the 3.28 ft wide door, but the
Gosney and Olama equation (Equation 18) was found to be the closest comparison to
experimental results overall. CFD only has an advantage to this empirical method for the
case in which infiltration is changing with time.
(Elsayed 1998)
Elsayed discussed the various excepted models of infiltration, checked their
accuracy, studied the effect of Grashof number, studied the effect of the room height
relative to the door height, and predicted a doorway flow factor.
Infiltration load is heat added to the refrigerated space by mass flow of warm air
into the space and cold air out of the space (Equation 45). The infiltration for a given door
may be approximated by applying factors for the open period, flow factor, and door flow
protective devices in Equation 46 (ASHRAE 1994).
CH hhmQ
infinf ( 45 )
EDDmm ftss
1inf ( 46 )
Correlations analyzed by this study include relationships developed by Gosney and
Olama (Gosney and Olama 1975), Jones et al. (Jones et al. 1983), and Cole (Cole 1984).
These relationships are given in Equations 47, 48, and 49, respectively.
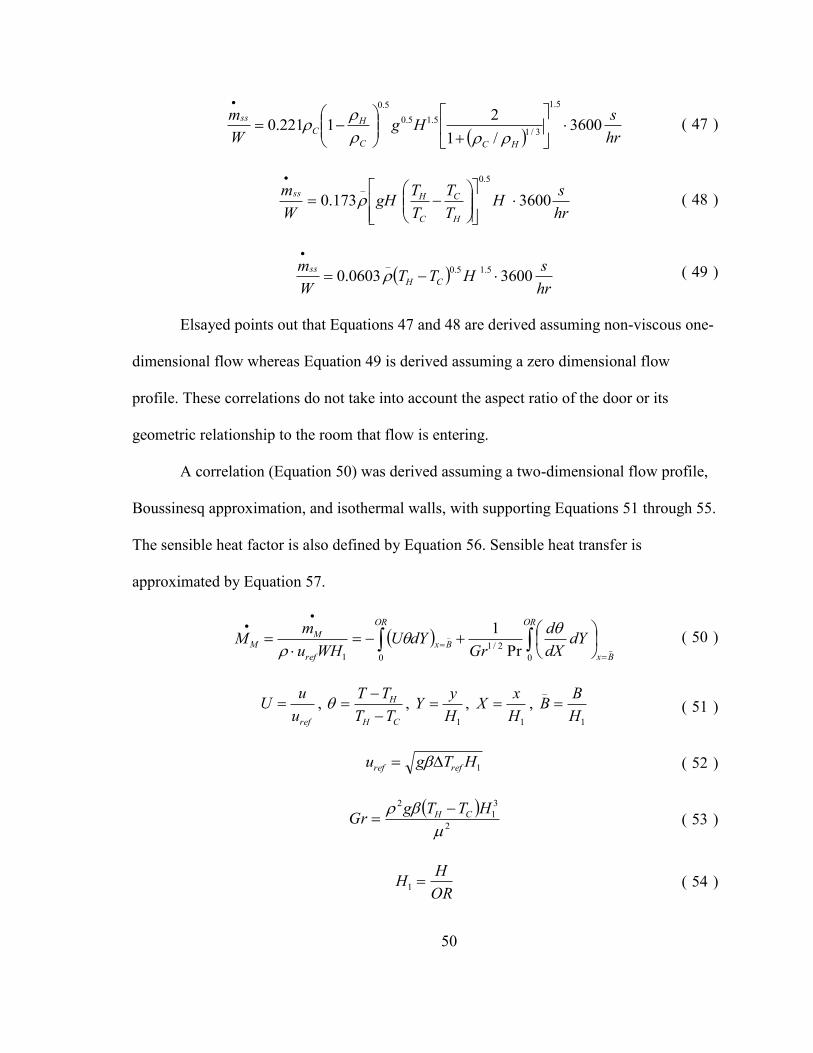
50
hr
sHg
W
m
HCC
HC
ss3600
/1
21221.0
5.1
3/1
5.15.0
5.0
( 47 )
hr
sH
T
T
T
TgH
W
m
H
C
C
Hss3600173.0
5.0_
( 48 )
hr
sHTT
W
mCH
ss36000603.0
5.15.0_
( 49 )
Elsayed points out that Equations 47 and 48 are derived assuming non-viscous one-
dimensional flow whereas Equation 49 is derived assuming a zero dimensional flow
profile. These correlations do not take into account the aspect ratio of the door or its
geometric relationship to the room that flow is entering.
A correlation (Equation 50) was derived assuming a two-dimensional flow profile,
Boussinesq approximation, and isothermal walls, with supporting Equations 51 through 55.
The sensible heat factor is also defined by Equation 56. Sensible heat transfer is
approximated by Equation 57.
OR
Bx
OR
Bx
ref
MM dY
dX
d
GrdYU
WHu
mM
00
2/1
1_
_
Pr
1
( 50 )
refu
uU ,
CH
H
TT
TT
,
1H
yY ,
1H
xX ,
1
_
H
BB ( 51 )
1HTgu refref ( 52 )
2
3
1
2
HTTgGr CH
( 53 )
OR
HH 1 ( 54 )
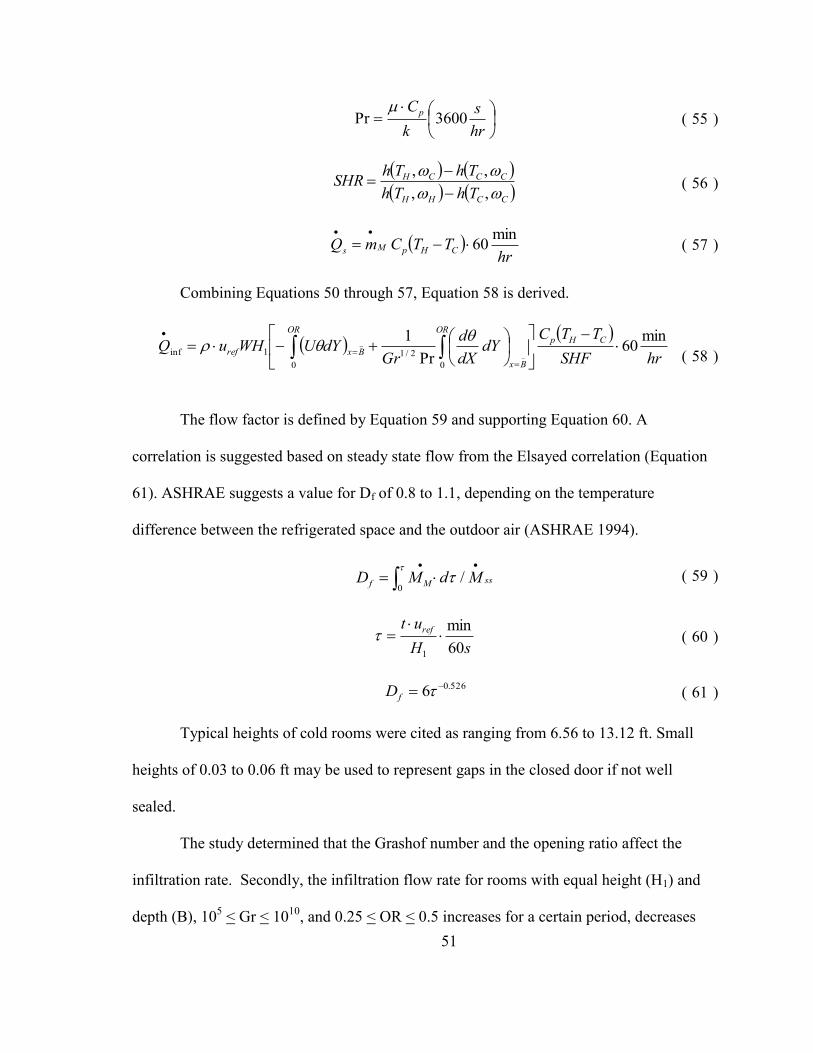
51
hr
s
k
Cp3600Pr
( 55 )
CCHH
CCCH
ThTh
ThThSHR
,,
,,
( 56 )
hr
TTCmQ CHpMs
min60
( 57 )
Combining Equations 50 through 57, Equation 58 is derived.
hrSHF
TTCdY
dX
d
GrdYUWHuQ
CHpOR
Bx
OR
Bxref
min60
Pr
1
00
2/11inf _
_
( 58 )
The flow factor is defined by Equation 59 and supporting Equation 60. A
correlation is suggested based on steady state flow from the Elsayed correlation (Equation
61). ASHRAE suggests a value for Df of 0.8 to 1.1, depending on the temperature
difference between the refrigerated space and the outdoor air (ASHRAE 1994).
0
/ ssMf MdMD ( 59 )
sH
ut ref
60
min
1
( 60 )
526.06 fD ( 61 )
Typical heights of cold rooms were cited as ranging from 6.56 to 13.12 ft. Small
heights of 0.03 to 0.06 ft may be used to represent gaps in the closed door if not well
sealed.
The study determined that the Grashof number and the opening ratio affect the
infiltration rate. Secondly, the infiltration flow rate for rooms with equal height (H1) and
depth (B), 105 < Gr < 10
10, and 0.25 < OR < 0.5 increases for a certain period, decreases
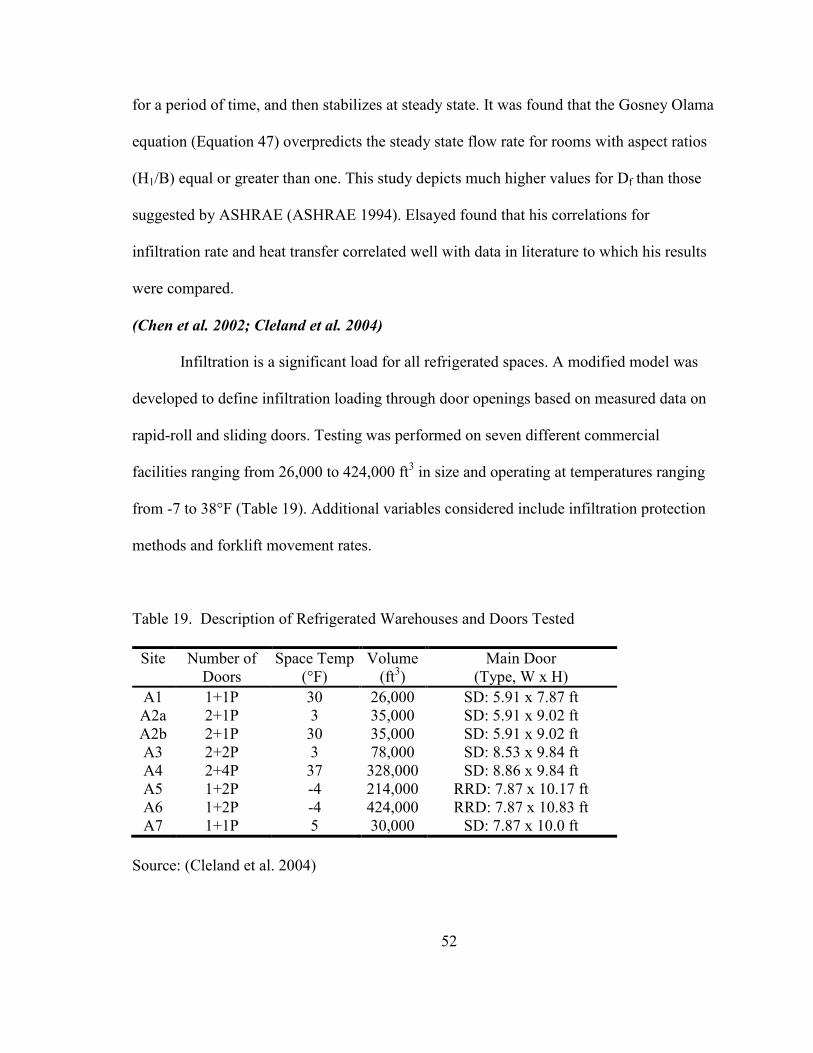
52
for a period of time, and then stabilizes at steady state. It was found that the Gosney Olama
equation (Equation 47) overpredicts the steady state flow rate for rooms with aspect ratios
(H1/B) equal or greater than one. This study depicts much higher values for Df than those
suggested by ASHRAE (ASHRAE 1994). Elsayed found that his correlations for
infiltration rate and heat transfer correlated well with data in literature to which his results
were compared.
(Chen et al. 2002; Cleland et al. 2004)
Infiltration is a significant load for all refrigerated spaces. A modified model was
developed to define infiltration loading through door openings based on measured data on
rapid-roll and sliding doors. Testing was performed on seven different commercial
facilities ranging from 26,000 to 424,000 ft3 in size and operating at temperatures ranging
from -7 to 38°F (Table 19). Additional variables considered include infiltration protection
methods and forklift movement rates.
Table 19. Description of Refrigerated Warehouses and Doors Tested
Site Number of
Doors
Space Temp
(°F)
Volume
(ft3)
Main Door
(Type, W x H)
A1 1+1P 30 26,000 SD: 5.91 x 7.87 ft
A2a 2+1P 3 35,000 SD: 5.91 x 9.02 ft
A2b 2+1P 30 35,000 SD: 5.91 x 9.02 ft
A3 2+2P 3 78,000 SD: 8.53 x 9.84 ft
A4 2+4P 37 328,000 SD: 8.86 x 9.84 ft
A5 1+2P -4 214,000 RRD: 7.87 x 10.17 ft
A6 1+2P -4 424,000 RRD: 7.87 x 10.83 ft
A7 1+1P 5 30,000 SD: 7.87 x 10.0 ft
Source: (Cleland et al. 2004)

53
A literature review by Cleland presents research performed by others and
recommendations by ASHRAE. Tamm (Tamm 1965) developed a theoretical equation
(Equation 40) for infiltration which was modified by Gosney and Olama (Gosney and
Olama 1975). Gosney‟s equation (Equation 18) is what ASHRAE recommends for the
infiltration calculation (ASHRAE 2002). Longdill tested a 3.9 ft wide by 5.2 ft high
doorway in a 6250 ft3 cold room to validate Tamm‟s equation. Longdill, Pham and Oliver
(Pham and Oliver 1983), and Downing and Meffert (Downing and Meffert 1993) defined
air curtains to be 49 to 83% effective. Strip curtain effectiveness ranges from 86 to 96%
with no traffic (Downing and Meffert 1993; Hendrix et al. 1989; Pham and Oliver 1983)
and 82 to 92% with one forklift passage per minute (Downing and Meffert 1993). For non-
protected doorways infiltration is decreased by traffic by 21 ± 10% (Downing and Meffert
1993). Downing et al. found that doors with strip curtain protection had an increase in
infiltration of 32 ± 45% with forklift traffic.
The benefits of the rapid-roll doors are the focus of this study. Rapid-roll doors
shorten the interval that the door is open for each opening event through the use of
magnetic sensor automation to detect forklift movements. In order to achieve this quick
action, doors are constructed of light materials, and do not have a good thermal resistance
value. Like any doorway, they are susceptible to leakage through cracks around the
doorway. Downing and Meffert found these doors to be 93% effective when closed and 79
to 85% effective with one traffic entry and exit per minute. The doors analyzed in Downing
and Meffert‟s study were fully open for 8 to 20 seconds, taking 1 to 2 seconds to
open/close. The doors analyzed in Cleland‟s study have similar operating characteristics.
A5 takes 1.7 seconds to open, is open for 15.7 to 17.0 seconds, and then closes in 3.1
54
seconds. Door A6 takes 2.9 seconds to open, is open for 8.8 to 15.4 seconds, and then
closes in 4.9 seconds. There is a transient period of air flow as the door is opened, but the
effect of this lag period is assumed insignificant because the door is open longer than 10
seconds.
Slow-acting sliding doors, utilizing plastic strip curtains, were also studied. The
time to open or close this type door is between 4 and 10 seconds, with a fully open time of
60 seconds on average. These doors, like rapid-roll doors, are susceptible to poor sealing.
Due to installation methods, the sliding doors in this test had a ½” gap that was constantly
allowing warm air to enter the space. Forklift movements studied ranged from 1 to 70
movements per hour.
The effectiveness of different protective devices is summarized below and in Table
20. These results correlate well with previous work by others:
Strip curtain: 92% effectiveness
Strip curtain with one strip missing: 80%
Strip curtain with small gaps between strips: 87%

55
Table 20. Measured Airtightness, Door Flow Factor, Strip-Curtain Effectiveness and Air
Infiltration Due to Forklift Traffic
Site TC (°F) ΔT
(°F) LV AT /
(cfm/ft)
Df E Vt
(ft3/mov)
Std
Dev Qf
Conditions
A1 31.3 32.6 0.3 0.97 No traffic without strip curtain
A2a 5.7 59.0 0.5 1260 410 Open door with strip curtain
A2b 30.2 40.0 0.4 620 150 Open door with strip curtain
A3 2.8 55.6 0.3 0.88 0.87 1530 180 Open door, small gaps in strip
curtain, enclosed door
A4 37.9 27.7 0.3 550 180 Open door with strip curtain
A5 -1.1 66.2 1.8 1.27 0.92 1500 170 With strip curtain
-1910 630 Without strip curtain
A6 -7.2 76.1 2.6 1.31 0.80 2390 180
0.6 in gap in door seal, one strip
missing in strip curtain
1.9 Seal gap covered w/strip curtain
A7 7.0 58.1 1.0
1300 220 0.8 in door seal gap, strip curt
1460 240 0.8 in door seal gap, open door,
with strip curtain
0.8 Seal gap covered w/strip curtain
Source: (Cleland et al. 2004)
In the development of a modified model for infiltration, door flow factor, fractional
door open time, and traffic effects were discussed. Door flow factors are quite variable
depending on the type of door. A value between 0.8 and 1.1, in agreement with ASHRAE
(ASHRAE 2002), is suggested. A fractional door open time factor (Equation 62) was
applied to the infiltration calculation for doors that are repeatedly opened and closed.
Results analyzing the measured and predicted air flow rates are shown in Figure 4. This
data suggests that for doors open 10 seconds or more, the air flow is fully developed.
Hendrix et al. (Hendrix et al. 1989) and Azzouz and Duminil (Azzouz and Duminil 1993)
both suggest lag times of less than 3 seconds.

56
totbcadot ttttND /2/ ( 62 )
Figure 4. Effect of Door Opening Duration on the Ratio of Measured and Predicted Air
Flow with a Rapid-Roll Door without Strip Curtain
Source: (Cleland et al. 2004)
The effect of forklift traffic is not something that has been quantified in equation
form other than a door protection modification. Plotting the relationship between
infiltration and the temperature difference across the door, Cleland et al. developed an
equation to define this relationship (Equation 63). This equation applies to doors similar to
the size tested with forklift traffic in this study (7.87 ft wide x 10.0 to 10.83 ft high) with
57
fixed strip curtains. One forklift movement is equivalent to an entry and exit, not just a
single passage and each forklift movement is with a pallet measuring 3.6 x 3.3 wide x 6.6 ft
tall. Forklift size and speed were not documented. Equation 63 was developed based on
data from a sliding door, but no significant difference was noted between doors kept
permanently open between forklift movements and those controlled by pull-cord, so
potentially this could be applied to other door types.
76.1TCV tt ( 63 )
trtfutAT VEDDVDVV
11inf ( 64 )
hr
NVV tt
trmin
60
( 65 )
min
601
21221.0
2/3
3/1
2/12/1 s
ssgHWHV u
( 66 )
The modified infiltration model (Equation 64) was used to compare energy savings
for different door types and infiltration protection devices, where the doors open to a
loading dock at 41°F and 80% relative humidity. Conclusions include the tradeoffs
between infiltration, forklift productivity, and door selection. To maintain forklift
productivity (above 40 movements per hour) a fast-acting door with protection would be
the best combination. However, at low traffic frequency this type door is hard to justify, as
it allows more conduction and crack infiltration than a comparable sliding door. Strip
curtains enable significant energy reductions, lowering energy costs by $0.40/hr for 20
forklift movements/hour, even when a fast-acting door is being used.

58
Review of Industrial Refrigeration
Twenty-eight articles were reviewed that presented information related directly to
the field of industrial refrigeration. Industrial refrigeration in this work refers to
refrigeration applied on a large scale, like a refrigerated warehouse or as part of a product‟s
preparation for resale, such as a harvest temperature pull-down facility, blast freezer, or
cooling of manufacturing equipment or a data center.
Specific topics include refrigeration system design, general load details, and load
information related to lighting, product, and infiltration. While each piece of literature
reviewed in this section focuses solely on industrial refrigeration, the majority of the
content applies to both industrial and commercial refrigeration, and therefore to walk-in
coolers and freezers.
Refrigeration System Design
(Cooper 1973)
Cooper presents information related to general design of cold storages, including
selection of compressors, refrigerants (Ammonia, R12, R22, and R502), and handling
equipment. Examples are given of cold store applications, including the storage of single
farm-crops for four to six months. Application examples include storing seed potatoes,
bulbs, grain or rice drying and storage, and fruit ripening of bananas, canned pears, plums,
and peaches. Air storage temperature varies for each product type. Pears require 29°F air
temperature whereas temperatures up to 50°F can be used for peaches, figs, grapes,
avocadoes, and apricots. Some additional storage temperatures include 39 to 41°F for
oranges, 46 to 48°F for mangoes, and 55°F for green bananas. Relative humidities should
generally be 90% but somewhat higher for leafy vegetables, such as lettuce, cabbage, and
59
celery. A cold store may receive up to 10% of its product storage capacity at one time. As a
crop storage facility the refrigeration system must remove a large amount of heat from the
product (example: 80°F to 32°F in 3 days).
Typical construction types at the time of this publication included brick and
concrete, with typical roof construction of corrugated asbestos on steel-framed trusses.
Modern cold stores are single-story. Pallets/bins of product may be stacked 23 to 26 ft
high. Room is required above the product to allow airflow. For example, in a room that is
16 ft tall bins should only be stacked up to 13 ft high. An analysis of one example store
showed that 64% of the available floor area could be utilized for storage. A typical stacking
density is 13.73 lb/ft3.
Three example stores are discussed, presenting information on construction,
operation, and loading of refrigerated stores. First, the article discusses an R-12 refrigerant
cold room in a semi-tropical region at an altitude of 2300 to 2600 ft, with a design dry bulb
of 95°F. The cold room is to operate at interior temperatures of 29.3 and 46.4°F
alternatively for gas ripening of fruit crops such as mangoes or bananas.
An example load calculation was performed for another cold store. The design load
was 84 Btu/h-ft2, including conduction, infiltration, product load (respiratory activity of
product), and miscellaneous loads from electric motors and lights. Respiration is typically
assumed to be 1/3 latent and 2/3 sensible heat. The equipment was selected based on an 18
hr run period.
Finally, a specification of a refrigeration plant was supplied. It was to use a direct
expansion refrigeration system utilizing R-12. The space is composed of two rooms with
internal dimensions of 29.5 x 30.5 x 15 ft to hold 220 tons of fruits and vegetables. Defrost

60
is not specified for this system, as interior temperature will be above a 35°F. The exterior
conditions are shaded, with a 90°F dry bulb and 70% relative humidity. Ten percent of
warm product is added to each room per day. The product is lowered to storage
temperature in three days with a 1% weight loss. Air infiltration is assumed to be 12 air
changes per day. Internal circulation is greater than 30 air changes each hour. The design
load is 67900 Btu/h (75.5 Btu/h-ft2), maintaining 28.9°F and 90% relative humidity.
Equipment temperatures are as follows: 16.7°F evaporator temperature, 131°F condensing
temperature. The lighting load is 200 W per room, or 0.22 W/ft2.
(Krack 1977)
Krack Corporation is at the center of industrial refrigeration. They have a selection
guide similar to that provided by Heatcraft for commercial refrigeration called RLE-278
(Krack 1977).
Conduction is analyzed in great detail by this manual. The absolute value used as a
heat transfer coefficient is dependent upon the material reflectivity, degree of roughness,
attitude (vertical or horizontal), length and the air velocity over the surface. Combining
these components, one can obtain the surface film conductance. Surface film conductance
for indoor walls may be estimated at 1.60 and 6.0 for outdoor walls not exposed to winds in
excess of 15 mph. In practice, the surface film coefficient is often ignored due to its small
effect on the outcome of sizing the equipment.
Floor conditions are difficult to approximate for a large industrial facility. While
ground temperatures are readily available for numerous locations, their application with a
refrigerated space is a complicated matter. Freezers typically have heated floors. This

61
actually simplifies the sizing method. It is usual practice to assume a factor of 1 Btu/ft2-°F -
24 hrs for freezer floors with conventional insulation.
Commercial coolers and freezers are shielded from solar effects if they are
constructed inside of the commercial space. Industrial facilities typically do not have this
luxury and the roof of refrigerated volume is exposed to direct sunlight. Krack estimates
the load by adding degrees to the temperature differential between the interior box and
exterior conditions as defined in Table 21. When the facility is in close proximity to a
highly reflective surface, such as sand or water the values noted in Table 21 should be
increased by 50%.
Table 21. Solar Radiation Allowance
°F to be Added to Normal TD
Luminance Surface Type East Wall South Wall West Wall Flat Roof
Dark Slate Roofing
Tar Roofing
Black Paints
8 5 8 20
Medium Unpainted Wood
Brick, Red Tile
Dark Cement
Red, Grey, or Green
Paint
6 4 6 15
Light White Stone
Light Colored Cement
White Paint
4 2 4 9
Source: (Krack 1977)
Depending on the application, door openings can vary widely according to Krack.
When specific data is not available the manual suggests using a 24 hr period air change
value corresponding to the size of the refrigerated space (Table 22). For refrigerated spaces

62
with heavy usage, the air change estimate should be doubled. On the other hand, if the
space is used for long term storage and there are infrequent door openings, these values
should be reduced by up to 40%.
Table 22. Average Air Changes per 24 Hrs for Medium Temperature (Above 32°F) and
Low Temperature (Below 32°F) Rooms Due to Infiltration and Door Openings.
Medium
Temp
Low
Temp
Medium
Temp
Low
Temp
Volume (ft3) Air Changes/24 hr Volume (ft
3) Air Changes/24 hr
200 44.0 5000 7.2 5.6
250 29.0 6000 6.5 5.0
300 34.5 26.2 8000 5.5 4.3
400 29.5 22.5 10000 4.9 3.8
500 26.0 20.0 15000 3.9 3.0
600 23.0 18.0 20000 3.5 2.6
800 20.0 15.3 25000 3.0 2.3
1000 17.5 13.5 30000 2.7 2.1
1500 14.0 11.0 40000 2.3 1.8
2000 12.0 9.3 50000 2.0 1.6
2500 8.1 75000 1.6 1.3
3000 9.5 7.4 100000 1.4 1.1
4000 8.2 6.3 200000 0.9
Source: (Krack 1977)
Krack also specifies an alternative, more precise method for determining the load
due to infiltration. If the frequency and duration of door opening is known the infiltration
load can be determined using the following equation (Equation 67). The constant 527 is
derived as displayed, where 24 hr refers to the period for which the equation applies, 0.075
lb/ft3 is the air density assumed, and 60 min/hr is a conversion. The values 100 ft/min, 7 ft,
and 60°F are used in the velocity calculation. According to Krack, the average air velocity
in either half of a door 7 feet high at a 60°F temperature differential is 100 ft/min.

63
2
527 inf24/
AFhhTTHQ CHCHInf ( 67 )
Fft
ft
hrft
lbhr
Fft
lb
607
min100
min60075.024527
32/12/5 ( 68 )
To adjust infiltration calculations for altitude of the site where the refrigerated space
will be located, Krack assumes that relative humidity is constant, enthalpy and humidity
ratio increase 2% and 5% respectively for every 1000 ft increase in altitude. The specific
volume for a given dry bulb and humidity ratio is inversely proportional to atmospheric
pressure.
Product pull down may occur over a 2 to 24 hour period according to Krack,
depending on the application and conditions. Products do not uniformly give up their heat
after being introduced to a refrigerated space. Heat is given off to space at a higher rate
initially. As the temperature of the product drops, so does heat transfer rate to the
surrounding refrigerated space (15 to 25% reduction). Load factors are applied when the
product loading is a significant component of the load profile to ensure accurate unit sizing.
Typically refrigerated long term storage facilities will be preceded by a blast freezer
or cooler to reduce product temperature prior to its introduction to the space. Facilities that
do not have this luxury must respond to product pull-down while also operating at a steady
long term temperature. Krack recommends flooded and recirculated refrigerant systems to
allow for wide control variance of the evaporator TD.
Products in medium temperature environments respire throughout the period when
they are stored. Krack provides an extensive list of perishable product storage data. Any
moisture lost by the product reduces its quality. To reduce respiration and prolong the

64
storage life of products, storage rooms should be controlled within 1°F. Meat and fish have
no continuing life process and therefore generate no heat in storage.
Supplemental loads may include motors, heaters, lights, people, forklifts, and other
miscellaneous heat sources. Occupancy load is a function of the number of people in space,
the work being performed, and the room temperature. As a good estimate, Krack suggests
the values in Table 23 to estimate the load added to the space by each person in the space.
For short duration occupancy the heat load should be increased by 20%.
Table 23. Occupancy Heat.
Room Temperature (°F) Heat per Person
Btu/24 hr
50 17300
40 20200
30 22800
20 25200
10 28800
0 31200
-10 33600
Source: (Krack 1977)
Typically, lighting is 1 to 1.5 W/ft2 for storage areas. If the space is used for active
working the lighting load is larger, at 2.5 to 3 W/ft2. Forklifts may be estimated at 4 to 5hp.
Most industrial facilities need defrost to remove frozen condensate from the
evaporator coils. Krack assumes 25% of the heat used during the defrost cycle is added to
the space whereas the remainder of the heat is taken away in the coil condensate. Defrost
cycles vary based on the application. A defrost cycle explicitly stated by Krack occurs 4
times a day at 15 to 20 minute duration (beef carcass chilling).

65
Safety factor correction of 5 to 10% to the calculated hourly load is suggested.
Numerous examples are presented for calculating refrigeration loads, including blast
freezers, fruit chilling and storage, beef carcass chilling, beer cooler and storage, nut
storage, distribution centers, milk cooler, and ice cream hardening freezer. A number of
these examples are applicable to an analysis of the model load profile for walk-in coolers
and freezers, as they are smaller than 3000 ft2 in plan area. Information presented includes
the temperatures and conditions surrounding and inside the refrigerated space; the box
construction; refrigeration loads, including product load, occupancy load, equipment load,
lighting load, and infiltration load; and equipment operation details, such as defrost cycling
and load contribution, and evaporator fan motor load. Details on footprint, box height, and
door size for spaces larger than what would qualify as a walk-in refrigerated space were
excluded from the model load profile analysis.
Evaporator operation is selected around the desired operating conditions of the box.
Walk-ins with meats should have low air flows and moderate evaporator TDs ranging from
10-12°F. If the product must be pulled down from a relatively high initial temperature (50
to 70°F pull-down) the coil TD will approach 18-20°F initially and drop with the
temperature of the product. Storage rooms for nuts need a lower relative humidity (65%)
than does a meat storage facility (85%). As a result, a higher evaporator TD should be
utilized at around 12°F.
When sizing equipment, the frequency and duration of defrost required will affect
how closely the equipment size can align with the refrigeration load. Spaces with coil
temperatures above 32°F will have no frost accumulation and can be sized for a compressor
runtime of 24 hrs at peak load. Medium temperature refrigerated spaces with positive

66
defrost systems can have a compressor runtime of 20 to 22 hours, as defrost will be
necessary for 2 to 4 hours of the day. Low temperature refrigerated spaces can typically be
sized for 18 hr operation. Off cycle defrost is utilized for space temperature of 35°F or
higher (assuming that the coil temperature is below 32°F). This type system can be sized
for 16 hr operation, as 8 hours will be required in off cycle to defrost the coil.
Typical refrigeration loads were specified as a function of room size. Small beef
carcass chilling rooms (appropriate size to be considered a walk-in cooler) usually operate
at 300 Btu/hr-ft2 (range of 288 to 465 Btu/hr-ft
2) whereas large industrial facilities operate
from 171 to 184 Btu/hr-ft2. From reviewing the information in the Krack manual it is
apparent that this is the trend, the larger the facility is the lower the refrigeration ton/ft2
requirement. Pork chilling rooms have similar load requirements, but, from analysis of the
information presented by Krack, they should be upsized (relative to beef carcass rooms of
the same size) by 10-20%.
Krack presents typical room load less product loading at 95°F ambient
corresponding to given footprints in their manual. They also give typical product loads for
walk-in coolers and freezers. These were combined to analyze typical loads for walk-ins.
The loads for coolers range from 30.4 (1600 ft2 with 8 ft ceiling at 36°F interior box
temperature) to 145.3 Btu/hr-ft2 (36 ft
2 with 10 ft ceiling at 28°F interior box temperature).
The average walk-in cooler load was 62.6 Btu/hr-ft2. Walk-in freezer loads ranged from
30.6 (1600 ft2 with 8 ft ceiling at -20°F interior box temperature) to 169.6 Btu/hr-ft
2 (36 ft
2
with 10 ft ceiling at -10°F interior box temperature), with an average load of 69.3 Btu/hr-
ft2.
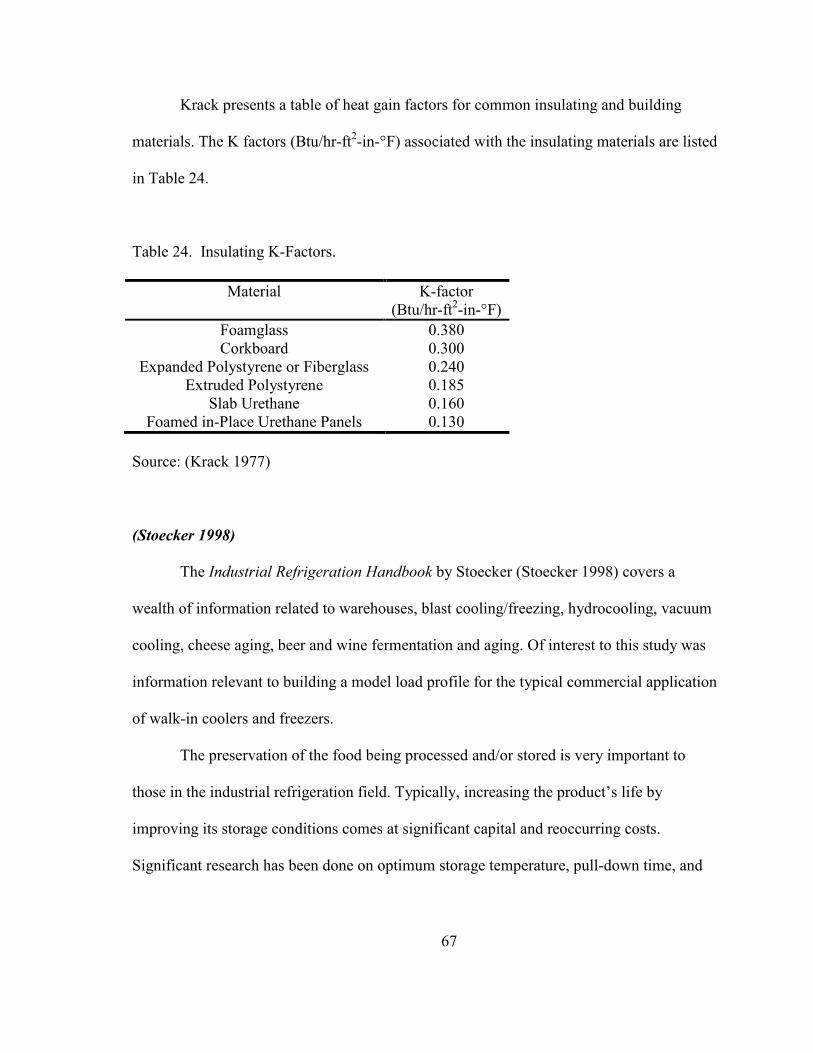
67
Krack presents a table of heat gain factors for common insulating and building
materials. The K factors (Btu/hr-ft2-in-°F) associated with the insulating materials are listed
in Table 24.
Table 24. Insulating K-Factors.
Material K-factor
(Btu/hr-ft2-in-°F)
Foamglass 0.380
Corkboard 0.300
Expanded Polystyrene or Fiberglass 0.240
Extruded Polystyrene 0.185
Slab Urethane 0.160
Foamed in-Place Urethane Panels 0.130
Source: (Krack 1977)
(Stoecker 1998)
The Industrial Refrigeration Handbook by Stoecker (Stoecker 1998) covers a
wealth of information related to warehouses, blast cooling/freezing, hydrocooling, vacuum
cooling, cheese aging, beer and wine fermentation and aging. Of interest to this study was
information relevant to building a model load profile for the typical commercial application
of walk-in coolers and freezers.
The preservation of the food being processed and/or stored is very important to
those in the industrial refrigeration field. Typically, increasing the product‟s life by
improving its storage conditions comes at significant capital and reoccurring costs.
Significant research has been done on optimum storage temperature, pull-down time, and
68
storage temperature range to attempt to reduce any money wasted on preserving the
product.
The proper storage temperature for different foods has been developed by those in
the industry over a number of years. Taking advantage of some products‟ thermal
properties allows for improved storage life. Some fruits for example, may be stored slightly
below 32°F without freezing due to the fruits‟ sugar content. Some meats and poultry
products are best stored at temperatures around 30°F to take advantage of similar
properties. Some recommended unfrozen storage temperatures are provided in Table 25.
Additional interior condition examples include docks at 39 to 46°F and meat processing
rooms at 50 to 57°F. When low relative humidities are required, as is the case with seed
storage, cooling and dehumidification is performed with a moderate refrigerant temperature
and then the air is reheated to the load-ratio line of 50% relative humidity. Reheat coils
may also be needed in locations were the outdoor temperature drops, resulting in infrequent
evaporator operation. To keep the relative humidity from rising, the coils cool the space to
condense water out of the air, followed by a defrost cycle.

69
Table 25. Recommended Storage Temperatures for Several Unfrozen Food Products
Product Storage
Temperature (°F)
Relative
Humidity (%)
Storage Life
Apples (most varieties) 30 to 37 90 to 95 3 to 8 mnths
Avocados 38 to 40
Bananas 54 to 58 90 to 95
Beans, Green 40 to 45 90 to 95 7 to 10 days
Broccoli 32 95 to 100 10 to 14 days
Cabbage 32
Cheese 32 to 50
Dough, storage 37 to 41
Dough, proofing 80
Honeydew melon 41 to 50 90 to 95 2 to 3 wks
Lettuce 32 to 34 95 to 100 2 to 3 wks
Milk 33 to 40
Peaches 29 to 31 90 to 95 2 to 4 wks
Pears 29 to 31 90 to 95 2 to 7 mnths
Peas, Green 32 95 to 98 1 to 3 wks
Potatoes, early 37 to 39 90 to 95 4 to 5 mnths
Poultry 30 to 35
Seeds 32 to 50 50 to 65 10 to 12 mnths
Strawberries 31 to 32 90 to 95 5 to 7 days
Tomatoes 38 to 50 90 to 95 4 to 7 days
Source: (Stoecker 1998)
Foods can be frozen in several minutes or several hours with today‟s methods. This
reduces ice crystals on the interior of the product, improving what the end customer
receives. Methods include air blast freezing, contact freezing, immersion freezing, belt
freezers, spiral freezers, and cryogenic freezing using liquid carbon dioxide or nitrogen.
Frozen storage temperatures are typically between -10 and -5°F with -10°F cited as the
most frequent. The lower the temperature the better, from a product quality point of view.
This comes at an operating and capital cost, however, so warehouses do not want to cool

70
excessively. Bakery goods are stored at 5 to 14°F due to their low moisture content and ice
cream and fish are stored at or below -20°F.
Chilling facilities used to pull-down and store beef and pork carcasses remove 58 to
65°F in one night. Birds 4 pounds or less are cooled by 40°F in 4 hours or less. Birds less
than 6 lbs in weight must be cooled within 6 hrs whereas any larger birds must be cooled
within 8 hrs. Products lose water during processing and storage due to respiration.
Carcasses lose about 1% of their weight during processing.
A cooler‟s product load is composed of the required reduction in temperature and
the removal of the heat of respiration. Refer to Table 26 for information for product heat of
respiration cited at various interior box temperature conditions. Freezers have three
components to their product load, including reducing the temperature of the product to the
freezing point, removing the latent heat of fusion, and reducing the product temperature to
the storage temperature.
Table 26. Heat of Respiration of Several Unfrozen Fruits and Vegetables
Heat of Respiration (Btu/lb-day)
Product 32°F 41°F 59°F 68°F
Apples 0.253 to 0.451 0.559 to 0.792 1.5 to 3.4 1.86 to 3.85
Beans 1.95 to 3.85 3.21 to 6.72 23.3 to 29.8
Celery 0.793 1.21 4.11 7.11
Lettuce 1.00 to 1.86 1.46 to 2.2 4.25 to 4.5 6.61
Peaches 0.451 to 0.703 0.702 to 1.01 3.66 to 4.67 6.52 to 11.3
Pears 5.21 to 8.32 8.72 to 10.7 38.4
Strawberries 1.35 to 1.95 1.8 to 3.66 7.82 to 10.2 11.3 to 21.6
Source: (Stoecker 1998)

71
Table 27. Specific Heats and Latent Heats of Several Food Products
Product Water
Content
(% mass)
High
Freezing
Point (°F)
Specific Heat
Above
Freezing
(Btu/lb)
Specific Heat
Below
Freezing
(Btu/lb)
Latent Heat
of Freezing
(Btu/lb)
Apples 84 30 0.902 0.453 121
Chicken 74 27 0.843 0.423 107
Peas 74 31 0.792 0.423 107
Ham 56 29 0.735 0.368 81
Salmon 64 28 0.783 0.392 92
Sirloin beef 56 0.735 0.368 81
Strawberries 90 31 0.938 0.471 130
Source: (Stoecker 1998)
Product loading varies considerably for each site. A warehouse storing seasonal
products has a moderate turnover of 8 to 12 per year whereas grocery distribution sees a
turnover of 30 per year. In an effort to reduce inventories and increase the shelf life at the
supermarket, distribution centers continue to increase the turnover rate up to 100. Typically
in storage facilities, the product load is small, as it is either delivered at the storage
temperature or precooled in an adjacent facility.
Conduction is a significant component of the load for any refrigerated space.
Building materials (Table 28, Table 29) and the insulation thickness are an economics and
application exercise, to determine what makes the most sense for the life of the facility.
The most popular method for insulating is the use of prefabricated insulating materials
which connect together with tongue and groove, spanning up to 30 ft (Table 31).
Convection coefficients applicable for various surface orientations, wind direction, and
heat flow directions are listed in Table 30.
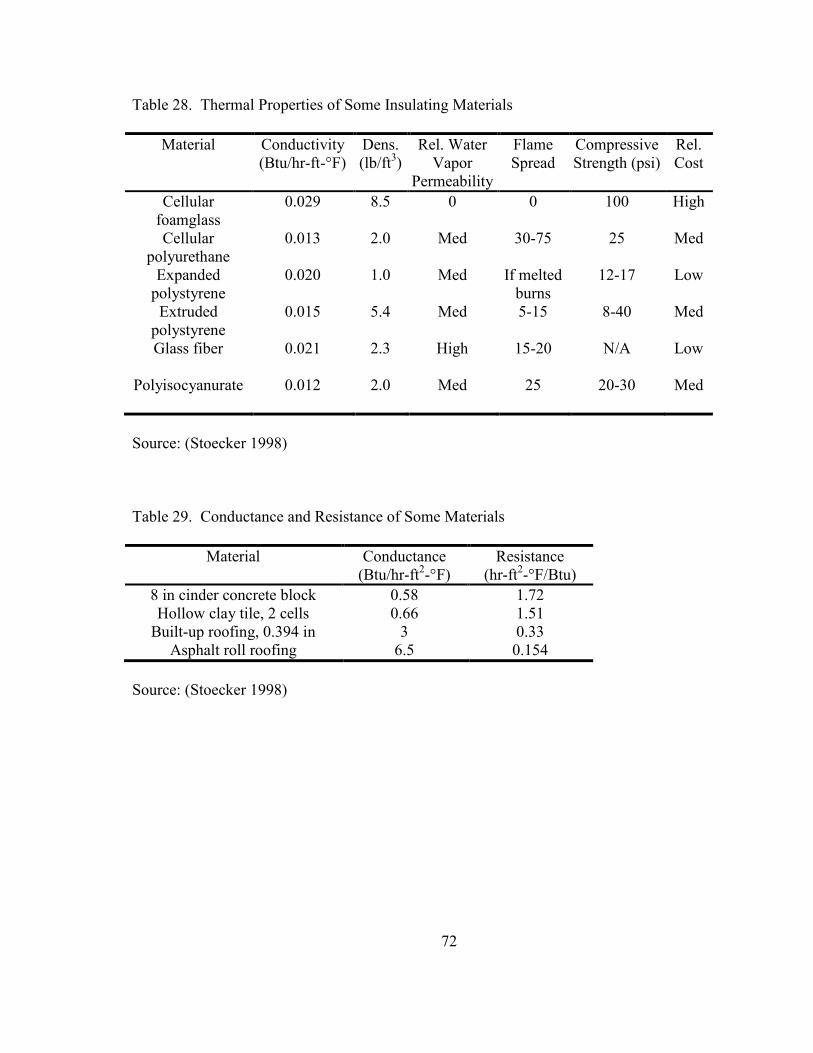
72
Table 28. Thermal Properties of Some Insulating Materials
Material Conductivity
(Btu/hr-ft-°F)
Dens.
(lb/ft3)
Rel. Water
Vapor
Permeability
Flame
Spread
Compressive
Strength (psi)
Rel.
Cost
Cellular
foamglass
0.029 8.5 0 0 100 High
Cellular
polyurethane
0.013 2.0 Med 30-75 25 Med
Expanded
polystyrene
0.020 1.0 Med If melted
burns
12-17 Low
Extruded
polystyrene
0.015 5.4 Med 5-15 8-40 Med
Glass fiber
0.021 2.3 High 15-20 N/A Low
Polyisocyanurate
0.012 2.0 Med 25 20-30 Med
Source: (Stoecker 1998)
Table 29. Conductance and Resistance of Some Materials
Material Conductance
(Btu/hr-ft2-°F)
Resistance
(hr-ft2-°F/Btu)
8 in cinder concrete block 0.58 1.72
Hollow clay tile, 2 cells 0.66 1.51
Built-up roofing, 0.394 in 3 0.33
Asphalt roll roofing 6.5 0.154
Source: (Stoecker 1998)

73
Table 30. Convection Coefficients for Various Surface Orientations and Air Flow
Conditions
Orientation and Condition Convection Coefficient
(Btu/h- ft2-°F)
15 mph, winter, any orientation 6
7.5 mph, summer, any orientation 4
Still air:
Vertical surface, heat flow horizontal 1.46
Horizontal surface, heat flow upward 1.63
Horizontal surface, heat flow downward 1.08
Source: (Stoecker 1998)
Table 31. Thermal Resistances and Recommended Applications of Prefabricated Wall and
Ceiling Panels
Thickness (in) Thermal Resistance
(h- ft2-°F/Btu)
Recommended Temperature
Application
2 16.6 Ambient
3 20.8 Down to 32°F
4 33.3 Down to -20°F
5 41.6 Down to -50°F
6 50.0 Down to -70°F
Source: (Stoecker 1998)
In determining what the appropriate model load profile is, it is important to
understand which ambient conditions are the most representative of the design point.
Stoecker specifies the following locations as typical design points:
Atlanta: 94°F summer 1% dry bulb (DB), 74°F coincident wet bulb (WB),
78°F summer 1% WB
Chicago: 94°F summer 1% DB, 75°F coincident WB, 78°F summer 1% WB
Dallas: 102°F summer 1% DB, 75°F coincident WB, 78°F summer 1% WB

74
Los Angeles: 94°F summer 1% DB, 70°F coincident WB, 72°F summer 1%
WB
New York: 92°F summer 1% DB, 74°F coincident WB, 76°F summer 1%
WB
Ground temperature is a very important component in determining an appropriate
model load. Stoecker states that the sub-floor temperature is typically between 41 and 50°F
for refrigerated facilities. Heating is required to maintain 50°F so that the facility does not
freeze and heave up. A glycol recirculating loop is the most prevalent system used in
industry. The supply temperature needs to be no higher than 50 to 60°F. It is typically
assumed that the sub-floor temperature is 50°F or that the floor heating load is about 2
Btu/h-ft2.
During the day, sun is radiating on the surfaces that form the exterior of the
refrigerated storage facility. Depending on the exterior material properties, the temperature
of a roof may rise to 120 to 130°F during the day.
Infiltration is a well analyzed component of the refrigeration load. Gosney Olama is
the most widely used air infiltration approximation method utilized by industrial
refrigeration professionals (Equation 18). One method of determining the infiltration to a
space is to take the expected turnover rate and apply an expected door open duration for
each product movement. A typical door open time may be assumed at 10 to 15 seconds.
Reductions to the infiltration to a space may be achieved by applying air curtains or plastic
strip curtains to the opening. Air curtains can remove 65 to 80% of infiltration load
compared to an open door (Hayes and Stoecker 1969). Plastic strip curtains are 90%
effective when there is no traffic and 85% effective with traffic.

75
Internal loads include lighting, occupancy, and equipment loads. Lighting levels
vary about as much as product loads, depending on the application. Meat processing rooms
require high lighting levels to ensure employee safety at 1.5 W/ft2. Warehouses have much
lower light intensity at 0.48 W/ft2. Additional internal loads for meat processing rooms are
also high, as there is a heavy concentration of workers (Table 32) and electrical equipment
operating. Warehouses have a lower concentration of employees, but they do have forklift
loads.
Table 32. Heat Equivalence of Occupants
Space temp
(°F)
Heat rate
(Btu/hr-person)
50 720
32 920
14 1,130
-4 1,330
Source: (Stoecker 1998)
Defrost is needed on any coil which operates at a temperature at or below 32°F.
Defrost adds refrigeration load to the space (4% of the total load in the example presented
in the text), but it is required to effectively cool the space. Defrost efficiency is defined as
the ratio of the heat to melt the frost off the coil to the heat provided to the system.
Methods of defrost discussed by Stoecker include air, electric, water, and hot gas.
In medium temperature applications, where the coil is still below 32°F, air defrost may be
utilized. The refrigeration system shuts off for a period of time to allow the space to heat
and defrost the coil. Typically defrosting the coil in this manner requires a significant

76
amount of time, unless the fan continues to operate. Another method used is to insulate the
coil and then bring in a supply of warm air from another source to quickly melt the frost on
the coil.
Electric defrost is common in small commercial applications due to its low first cost
and simplicity. The operational cost for this method is the highest compared to the other
alternatives, so large applications typically do not utilize it.
Water defrost is the second most popular industrial defrosting method. To defrost
the evaporator coil, hot water is sprayed on the coils. This method is utilized when the
refrigeration system does not have enough evaporators to utilize hot gas. The ideal
application of water defrost is in a spiral freezer chamber, operating in a production mode.
Hot gas is the most efficient (typically 20%) and most widely used defrost method.
The defrost cycles are very quick using this method, allowing for a higher daily compressor
runtime and, therefore, smaller equipment selections. During a hot gas defrost cycle the
evaporator valves are switched, so that flow to the evaporator coil from the liquid header is
shut off, and compressor discharge is brought in through the evaporator discharge line to
heat the coil.
R22 and R502 are the most widely used refrigerants but are being phased out.
Ammonia is also widely used but highly toxic. Packaged refrigeration units which contain
the evaporator, compressor, and condenser typically use halocarbon refrigerant and have
air-cooled condensers. Packaged units are popular in refrigerated spaces of less than about
10,000 ft2 in area and in central plants with areas greater than 20,000 ft
2. Selecting a
compressor capable of delivering full capacity is the lowest first cost choice. Using
multiple compressors to split the load offers lower energy usage, as compressors can drop

77
off as the load diminishes, and improved flexibility. If one compressor goes down in a
system with ten compressors, the system can still maintain 90% of its cooling capacity until
the damaged compressor can be replaced or repaired.
Evaporator and condenser fans are heavy energy users in refrigerated systems. They
use 30% of total energy use over a year (10-15% of full load power). The mechanical
components in a refrigeration system offer waste heat that can sometimes be utilized for
other purposes within the overall system. Examples of heat sources in a two stage
refrigeration plant are listed in Table 33, with potential uses listed in Table 34.
Table 33. Typical Temperatures of the Heat Sources in a Two-Stage Refrigeration Plant
Source Type of Compressor Temperature (°F)
Water from Head Cooling Reciprocating 85 to 95
Oil to be Cooled, 1st stage Screw 140 to 150
Oil to be Cooled, 2nd
stage Screw 150 to 170
Desuperheating, 1st stage Reciprocating 175 to 195
Desuperheating, 2nd
stage Reciprocating 200 to 240
Desuperheating, 1st stage Screw 120 to 130
Desuperheating, 2nd
stage Screw 150 to 170
Condensing refrigerant -- 60 to 100
Source: (Stoecker 1998)

78
Table 34. Waste Heat Applications and Temperature Levels
Potential Use Min Refrigerant
Temperature (°F)
Underfloor heating 50 to 60
Water defrost 72 to 80
Space heating in winter 80 to 110
Humidity control reheat coils 90 to 100
Process use preheat water 110 to 120
Source: (Stoecker 1998)
Refrigeration loads relative to their application are compared in Table 35. It should
be noted that these values seem low compared to those presented by others. That may be
due to the fact that industrial facilities are much larger in size than the walk-in facilities that
are the focus of this thesis.
Table 35. Refrigeration Load for Several Applications
Type of Space Refrigeration Load (Btu/ft3-hr)
Frozen food storage 0.72 to 1.44
High-rise freezer storage 0.24 to 0.72
Produce storage 0.96 to 1.32
Shipping dock 1.32 to 2.40
Process area 1.92 to 6.00
Source: (Stoecker 1998)
(Zhang and Groll 2005)
Zhang conducted a survey related to refrigerated warehouses. He reached out to
industry with questions related to the size of their facility (Table 36), number of
compressor stages (Table 38), refrigerant (Table 37), intercooler (Table 39) or economizer

79
type/use, control scheme and equipment, number of staff and their duty time in machine
rooms, compressor type, compressor speed control, and evaporator type.
Table 36. Physical Sizes of 62 Public Refrigerated Warehouses
Volume (x 106 ft
3) Plant Number
0.36 to 0.99 11
1.00 to 1.99 7
2.00 to 3.99 21
4.00 to 5.99 8
6.00 to 7.99 8
8.00 to 9.99 2
10.0 to 14.4 5
Source: (Zhang and Groll 2005)
Table 37. Refrigerants Used in Public Refrigerated Warehouses
Refrigerants Responses to
Questionnaire
1998
Directory of
IARW
R-717 58 306
R-12 1 44
R-22 5 0
R-134a 1 0
R-404a 1 1
R-502 0 1
R-507 1 0
Total 67 352
Sources: (IARW 1999; Zhang and Groll 2005)

80
Table 38. Compression Stages in 62 Public Refrigerated Warehouses
Number of
Plants
Percentage
(%)
Plants using single stage only 12 19.7
Plants using two stage only 36 59.0
Plants using both two stage and single stage 13 21.3
Plants that did not answer to compression stage 1
Source: (Zhang and Groll 2005)
Table 39. Types of Intercoolers in 49 Public Refrigerated Warehouses
Number of
Plants
Percentage
(%)
Plants with shell-and-coil intercoolers only 24 61.5
Plants with flash-type intercoolers only 15 38.5
Plants with both kinds of intercoolers 6
Plants with other intercoolers 6
Source: (Zhang and Groll 2005)
Control types utilized by the 62 plants include computer integral control (40 plants),
partial auto-control using no computer (25 plants), and unknown (2 plants). Automatic
control methods are known to reduce plant energy usage by up to 40% (Zhang et al. 1999).
Seventeen plants had one staff in the machine room, 12 had two individuals, and 26 plants
has three staff working in the machine room. The duty time associated with the machine
room personnel varied from daytime during the week only (37 plants) to 24 hours a day for
(16 plants).
Compressor types varied between piston and screw type. Twelve plants used only
piston type, 23 used screw compressors only, and 27 plants utilized both piston and screw

81
compressors in their operation. A total of 226 piston compressors were reported along with
213 screw compressors. Of the piston compressors, 25 of them were semi-hermetic, 30
were integral 2-stage, 3 operated with a VFD, and 7 used a microprocessor for speed
control. Of the screw compressors reported, 8 screw compressor were semi-hermetic, 69
were single screw, 73 operated with an economizer, 142 used variable volume control, 16
operated with a VFD, and 185 utilized a microprocessor.
(Stegmann 2000)
Low temperature refrigeration means different things to different industries. In
commercial refrigeration, low temperature refers to operating conditions below 32°F
whereas in air conditioning, chilled water or glycol temperatures around 32°F are
considered low temperature. When Stegmann states low temperature in this article it refers
to temperatures lower than those seen in industrial refrigeration and above cryogenic
temperatures, falling in the range of -58 to -148°F. Applications include food,
pharmaceutical, chemical processing, laboratory environmental chambers, and thermal
storage equipment.
Compression schemes for these systems include stock hermetic compressors in an
autocascade cycle, single-stage economized screw, two-stage single refrigerant systems
utilizing either screw or reciprocating compressors, and two or three-circuit cascade
systems. Auto cascade systems are self-contained systems with multiple stages of cooling
occurring simultaneously using a specific refrigerant mixture. Single-stage economized
screw compressor systems are the simplest low temperature system, operating down to
about -60°F. Two-stage single refrigerant system limitations depend on the refrigerants
chosen (Table 40). Two-circuit cascade systems are the most common and suitable all the
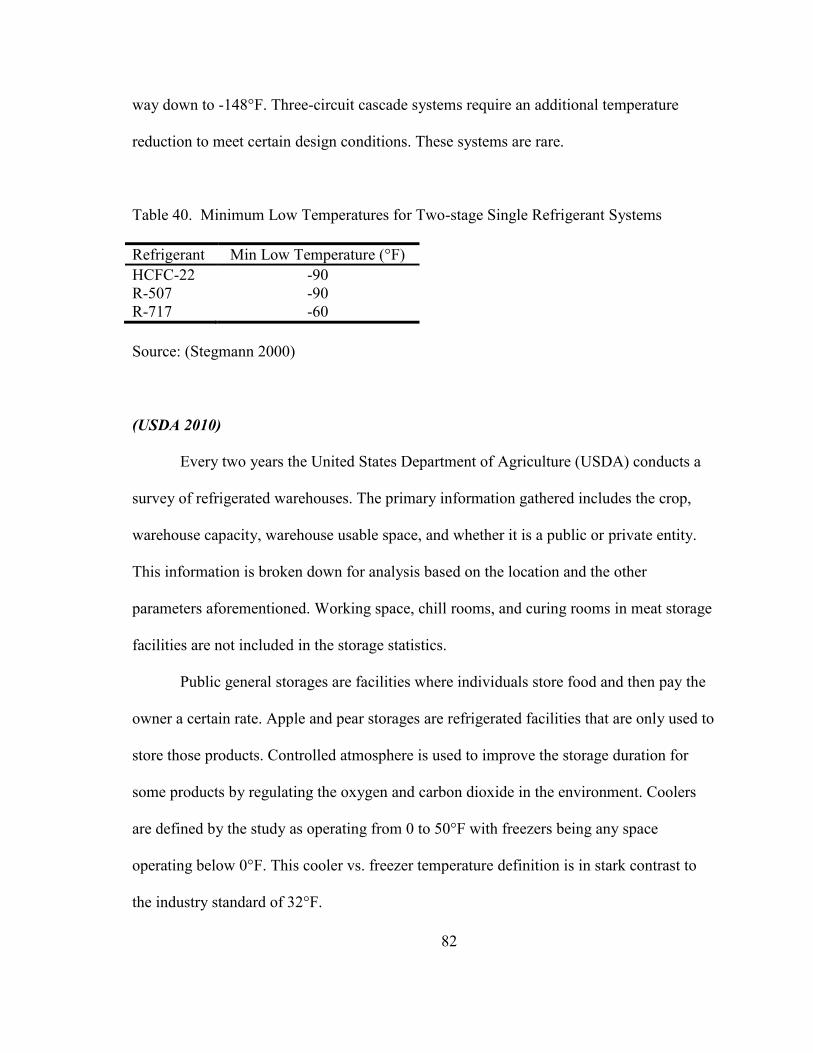
82
way down to -148°F. Three-circuit cascade systems require an additional temperature
reduction to meet certain design conditions. These systems are rare.
Table 40. Minimum Low Temperatures for Two-stage Single Refrigerant Systems
Refrigerant Min Low Temperature (°F)
HCFC-22 -90
R-507 -90
R-717 -60
Source: (Stegmann 2000)
(USDA 2010)
Every two years the United States Department of Agriculture (USDA) conducts a
survey of refrigerated warehouses. The primary information gathered includes the crop,
warehouse capacity, warehouse usable space, and whether it is a public or private entity.
This information is broken down for analysis based on the location and the other
parameters aforementioned. Working space, chill rooms, and curing rooms in meat storage
facilities are not included in the storage statistics.
Public general storages are facilities where individuals store food and then pay the
owner a certain rate. Apple and pear storages are refrigerated facilities that are only used to
store those products. Controlled atmosphere is used to improve the storage duration for
some products by regulating the oxygen and carbon dioxide in the environment. Coolers
are defined by the study as operating from 0 to 50°F with freezers being any space
operating below 0°F. This cooler vs. freezer temperature definition is in stark contrast to
the industry standard of 32°F.

83
Refrigerated storage is rising at a tremendous rate, primarily due to new
construction, growing 14% from 2007 to 2009. The five states with the largest refrigerated
warehouse capacities (x 106 ft
3) include California with 495, Florida at 274, Pennsylvania
at 227, Georgia with 218, and Texas with 198. Refrigerated warehouse average usable
space is about 82% of the gross space, with freezers comprising about 77% of the total
usable space reported for coolers and freezers.
General Load Details
(Kun et al. 2007)
This report analyzes heat reclaim on a Chinese refrigerated warehouse. The ambient
temperature specified is 122°F with storage conditions, including 5, 64.4, and 71.6°F.
(Ashby et al. 1979)
Energy can be purchased at a lower cost during off peak hours. Because industrial
refrigerated spaces use a significant amount of electricity it is advantageous for these
facilities to utilize energy predominantly during off-peak hours. This article discusses the
opportunity to save money by operating at two temperatures over the course of the day.
During off peak hours the refrigeration system would work extra to pull the storage room
temperature down below the typical set point. This way during higher energy rate portions
of the day, the refrigeration system is not required to remove as much heat from the space.
Drawbacks to operating in this manner include increases in conduction and
infiltration loading due to a larger temperature differential between the box temperature
and the exterior temperature, increased equipment capacity and control requirements, and
potential damage to the stored product.

84
Ashby et al. analyzed box temperature variation for a storage freezer containing
packaged okra, peas, and strawberries. A control and three different temperature variations
were compared. Comparisons were made in regard to energy consumption and product
quality.
Details pertinent to developing a model load profile include information presented
on typical freezer storage conditions and box construction. The typical freezer storage
condition used as the control for this study was -9.4°F. The walk-in boxes utilized in this
study had walls constructed of an 0.7” air gap formed from 24 gage aluminum foil fastened
to horizontal wood strips, ceiling air spaces of 1.6”, and a floor insulated by foam plastic.
Thermal conductance values for the box are listed below:
Walls: 0.041 Btu/h-ft2-°F
Ceiling: 0.032 Btu/h-ft2-°F
Floor: 0.042 Btu/h-ft2-°F
(Cleland 1983)
Cleland develops a simulation model for design of a meat processing plant with
several independent loads (Cleland 1983). He cites work by Marshall and James who
simulated a two-stage compression ammonia plant (Marshall and James 1975) and his
previous development of a model for freezing fish on a fishing boat (Cleland et al. 1982).
To reduce the complexity of the model, Cleland assumed that equipment with rapid
response could be modeled with steady state equations. Differential equations were only
used for equipment with long time constants.
The meat processing plant that is the focus of this article has five types of
refrigeration applications, including cutting rooms (air temperatures from 46 to 50°F ), beef
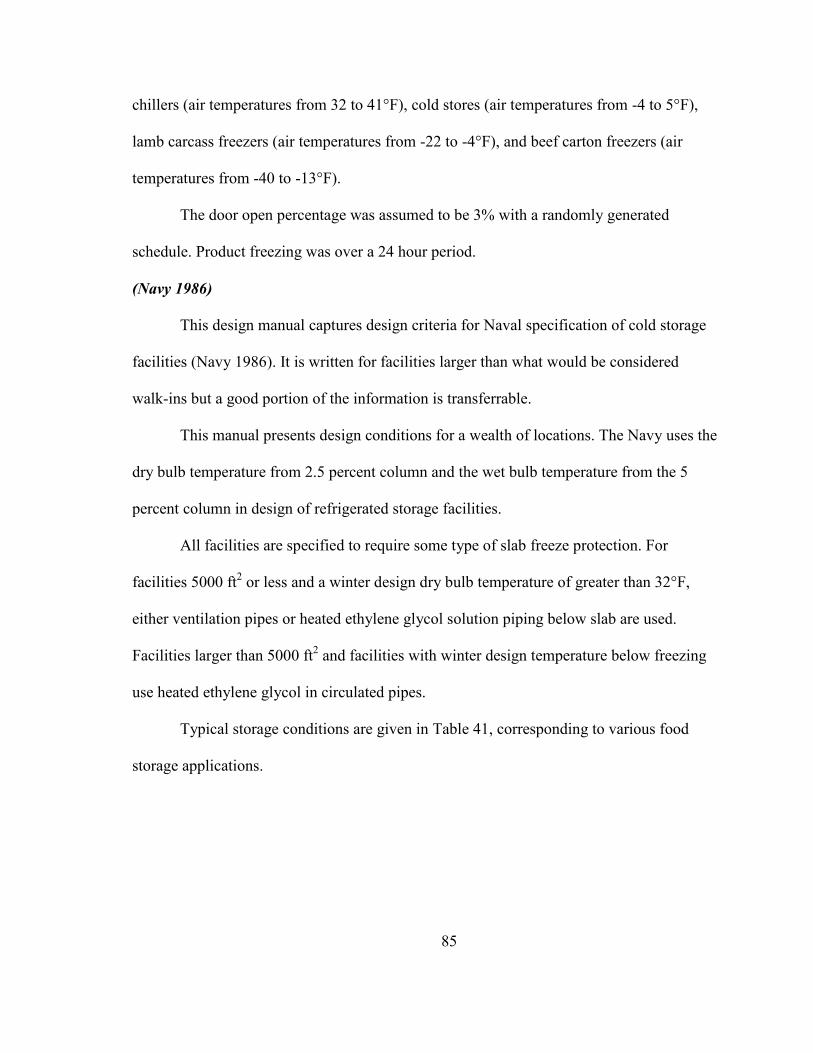
85
chillers (air temperatures from 32 to 41°F), cold stores (air temperatures from -4 to 5°F),
lamb carcass freezers (air temperatures from -22 to -4°F), and beef carton freezers (air
temperatures from -40 to -13°F).
The door open percentage was assumed to be 3% with a randomly generated
schedule. Product freezing was over a 24 hour period.
(Navy 1986)
This design manual captures design criteria for Naval specification of cold storage
facilities (Navy 1986). It is written for facilities larger than what would be considered
walk-ins but a good portion of the information is transferrable.
This manual presents design conditions for a wealth of locations. The Navy uses the
dry bulb temperature from 2.5 percent column and the wet bulb temperature from the 5
percent column in design of refrigerated storage facilities.
All facilities are specified to require some type of slab freeze protection. For
facilities 5000 ft2 or less and a winter design dry bulb temperature of greater than 32°F,
either ventilation pipes or heated ethylene glycol solution piping below slab are used.
Facilities larger than 5000 ft2 and facilities with winter design temperature below freezing
use heated ethylene glycol in circulated pipes.
Typical storage conditions are given in Table 41, corresponding to various food
storage applications.
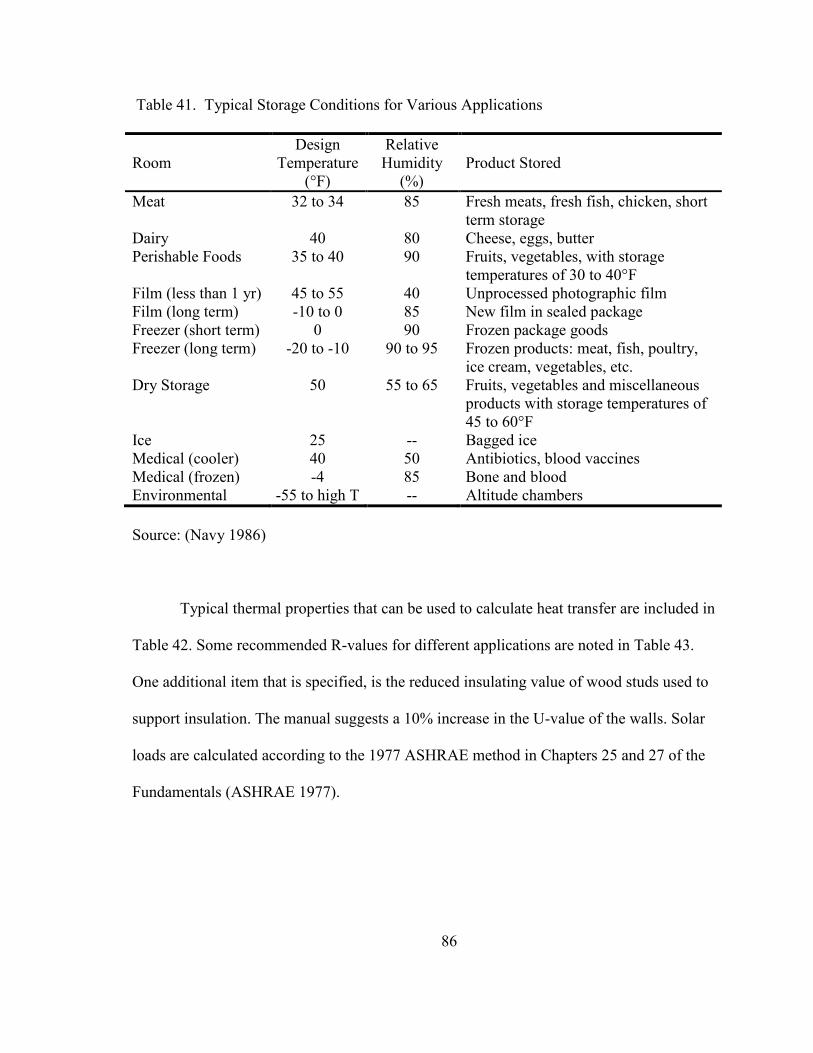
86
Table 41. Typical Storage Conditions for Various Applications
Room
Design
Temperature
(°F)
Relative
Humidity
(%)
Product Stored
Meat 32 to 34 85 Fresh meats, fresh fish, chicken, short
term storage
Dairy 40 80 Cheese, eggs, butter
Perishable Foods 35 to 40 90 Fruits, vegetables, with storage
temperatures of 30 to 40°F
Film (less than 1 yr) 45 to 55 40 Unprocessed photographic film
Film (long term) -10 to 0 85 New film in sealed package
Freezer (short term) 0 90 Frozen package goods
Freezer (long term) -20 to -10 90 to 95 Frozen products: meat, fish, poultry,
ice cream, vegetables, etc.
Dry Storage 50 55 to 65 Fruits, vegetables and miscellaneous
products with storage temperatures of
45 to 60°F
Ice 25 -- Bagged ice
Medical (cooler) 40 50 Antibiotics, blood vaccines
Medical (frozen) -4 85 Bone and blood
Environmental -55 to high T -- Altitude chambers
Source: (Navy 1986)
Typical thermal properties that can be used to calculate heat transfer are included in
Table 42. Some recommended R-values for different applications are noted in Table 43.
One additional item that is specified, is the reduced insulating value of wood studs used to
support insulation. The manual suggests a 10% increase in the U-value of the walls. Solar
loads are calculated according to the 1977 ASHRAE method in Chapters 25 and 27 of the
Fundamentals (ASHRAE 1977).

87
Table 42. Typical “U” Factors for Walls and Roofs
Insulation
Thickness
(in)
U-Value (Btu/hf-ft2-°F)
Polyurethane
k = 0.14
Polystyrene Fiber Glass
k = 0.23
Cellular Glass
k = 0.16 k = 0.20 k = 0.25
2 0.069 0.083 0.100 0.093 0.132
3 0.048 0.059 0.071 0.066 0.097
4 0.037 0.045 0.056 0.052 0.076
5 0.030 0.037 0.045 0.042 0.063
6 0.025 0.031 0.038 0.036 0.054
Source: (Navy 1986)
Table 43. Recommended R-Values for Various Applications
Type of Facility Temperature
Range (°F)
R-Values (hr-ft2-°F/Btu)
Floors
Walls/
Suspended
Ceilings
Roofs
Cooler 40 to 50 Perimeter
insulation only
17 to 30 25 to 35
Chill Cooler 28 to 35 15 to 20 25 to 35 30 to 40
Holding Freezer -10 to 20 30 to 35 35 to 40 40 to 50
Blast Freezer -40 35 to 40 50 to 60 50 to 60
Source: (Navy 1986)
Product loading is a function of the weight of the product and the difference
between the initial temperature of the product being loaded and the temperature of the
space. An example of a product load given, was for an automatic ice-making plant at 10
tons/day at 13 ft2 storage space/ton. After being frozen it is subcooled to 25°F. The Navy
notes typically cooling time as 18 to 24 hrs.
Infiltration is sometimes a significant portion of the load on a refrigerated cooler or
freezer. To reduce these effects air curtains are suggested, which theoretically provide a 70

88
to 80% reduction in air flow. A reduction of 30 to 40% is suggested as being more realistic
for design calculations. This takes into account the effects of traffic and draughts on the air
curtain efficiency.
In refrigerated rooms there is a risk of freezing the ground below the floor. If this
occurs the concrete with heave upward. The Navy specifies that this is only a concern if the
space is at a temperature below 15°F and the room width is over 10 to 15 ft.
To optimize system efficiency, different temperature boxes are served by different
compressor groups. The closer the suction group matches the optimum evaporator saturated
suction temperature, the higher efficiency the system will have. Generally temperature
difference between the room and evaporator saturated suction temperature is 5 to 10°F for
freezers and cooler storage of meat and produce, 10 to 15°F for medium temperature
storage of items such as milk, and 15 to 20°F for coolers used for meat and produce
preparation.
Sizing refrigeration equipment should be done on a 16 hour basis if air defrost is
being utilized. Electric, hot gas, and water defrost systems allow for equipment selection at
20 hr operation.
Various refrigerants are used in these systems. The application of these refrigerants
is suggested to correspond to Table 44.

89
Table 44. Comparative Refrigerant Performance
Refrigerant Bhp/ton Compression
Ratio
Refrig. Circ.
(lb/min-ton)
Typical SST
(°F)
R-717 0.989 4.94 0.422 -10 to 40
R-12 1.002 4.08 4.00 30 to 50
R-22 1.011 4.03 2.86 30 to 50
R-502 1.079 3.75 4.38 -40 to 0
Source: (Navy 1986)
(Adre and Hellickson 1989)
Adre performed simulations of cold rooms to analyze energy usage throughout the
year, with a focus on opportunities to reduce operating costs. The study identified that the
continuous operation of evaporator fans was a significant unnecessary cost. On the cases
analyzed, approximately 37 to 52% of the zone refrigeration energy use is due to
evaporator fan operation.
For the analysis, a cold store built in 1984 and operated by the Duckwall-Pooley
Fruit Company in Hood River, Oregon was used. It is composed of one large common
storage area (57.1 x 97.1 x 32.8 ft) with a 4365 bin capacity and three controlled
atmosphere rooms (63.0 x 43.5 x 32.8 ft) with a 1245 bin capacity. Each bin measures 4 x 4
x 2 ft in outer dimensions and hold 790 lbs of fruit.
Assumptions and details related to setting up the analysis are as follows:
One wall of the cold storage is next to the engine room which operates at 50
to 82°F.
Horizontal heat transfer through the perimeter wall is assumed negligible.
Ground temperature was assumed to be at a 2 ft depth.

90
Indoor relative humidity of 95%.
There is one door to move bins in/out.
Average daily temperature and monthly humidity ratio were used to
calculate infiltration heat gain.
Defrost occurred 1 to 8 times a day in 10 minute durations. This was the
only period of time that the evaporator fans did not operate.
Lighting load varied depending on the number of bins loaded, from 0.86 to
2.15 kW for 11 hours per day.
Equipment and occupancy loads are not explicitly defined but their duration
is specified at 50% of an 8 hour day.
Product loading is not explicitly defined.
16 hour compressor runtime, allowing time for the defrost cycle necessary
for a 35°F room.
Adre uses “Sol-air” temperatures as he called them, for outdoor conditions defined
as the temperature of the outdoor air, including the effect of solar radiation. The sol-air
temperatures were calculated using an emissivity of 0.15 for light colored surfaces,
resulting in approximate increase in roof temperature of 36°F (88.6 Btu/ft3 of radiation
from the sun).
(Altwies 1998; Altwies and Reindl 1999)
Altwies‟ work is focused on the potential benefits to a refrigerated warehouse
operator from demand shifting the refrigeration load (Altwies 1998; Altwies and Reindl
1999). The main cost of operating a refrigerated warehouse is the energy usage. Energy
demand is higher when the ambient temperature is higher, and therefore the load peaks

91
during the daytime and diminishes at night. The cost of electricity follows this same trend
as more end-users are calling for electricity in the daytime. By running the refrigeration
equipment during the night time to drive down the storage temperature, Altwies suggests a
refrigerated storage facility can operate at a lower cost even though more energy will be
expended. Two options were analyzed, including full demand shifting and load leveling.
Full demand shifting pulls the space temperature down throughout the night, so that no
refrigeration equipment operation is necessary during the day to maintain the desired peak
storage temperature. Load leveling involves operating the refrigeration equipment at a
consistent rate throughout the day, over cooling at night and under cooling during the
daytime. A computer model of a refrigerated facility was developed and then correlated
with test data from the site.
The effect of temperature fluctuation on food quality has been a debate in the field
of industrial refrigeration for some time. This is a concern for this storage methodology and
its feasibility is defended by Altwies by summarizing previous research in Table 45. If
fruits and vegetables are frozen at the given temperatures, the associated percentage loss of
vitamin C may be expected over one year (IIR 1986):
10 to 14°F storage temperature – 80 to 90% Vitamin C loss
-4 to -14°F storage temperature – 10% Vitamin C loss
-22°F storage – practically no Vitamin C loss
Altwies suggests storage at or below 0°F, as this is a good balance between food
preservation and operating costs. From the analysis of previous work she also concludes
that temperature swings below 0°F have little effect on the quality of the food.

92
Table 45. Summary of Previous Frozen Food Quality Research
Product Investigator Conditions Summary
Cauliflower (Aparicio-
Cuesta and
Garcia-
Moreno 1988)
-5°F (10 hrs) to
39°F (14 hrs) for 10
days, sealed in
polyethylene bags
Freeze/thaw. Vitamin C losses
of 35% over control, no
color change, loss of flavor,
softer
Strawberries,
Blackberries,
Raspberries,
Peaches
(Woodroof
and Shelor
1947)
-20 to 0°F and 0 to
10°F for up to 12
months, raspberries
in sealed 3-lb metal
cans, peaches in 1-
lb waxed cartons,
strawberries and
blackberries in 10-
lb moisture-proof
bags inside
corrugated boxes
Color, flavor, and aroma of
low-temp cycled
strawberries only slightly
less pleasing than those at
constant -10°F, differences
in blackberries were less
than with strawberries,
peaches more sensitive to
fluctuations, high-temp
fluctuations worse than
constant 10°F in most cases
Snap beans,
Corn, Peas,
Strawberries,
Raspberries,
Cantaloupe
(Hustrulid and
Winters 1943)
-20 to 0°F (12 to 24
hrs) for minimum
of 6 months,
unknown packaging
No influence on appearance or
palatability compared with
control group at constant
temperature
4 Varieties of
Peas
(Boggs et al.
1960)
-5 to 5°F, -10 to
10°F, and 0 to 20°F
(24 hr sinusoidal
cycling), retail
packaging
Fluctuation of temperature per
se had little or no effect on
deterioration
Pork roasts,
Strawberries,
Snap beans,
Peas
(Gortner et al.
1948)
0°F (6 days) to
20°F (6 days) for 1
year, wrapped in
cellophane (pork)
or commercial
packaging
Quality changes were
equivalent to control foods
held at constant 10°F
Okra, Peas,
Strawberries
(Ashby et al.
1979)
-11°F (12 hrs) to
0°F (12 hrs) for 1
year, plastic
pouches or
paperboard cartons
placed inside
corrugated boxes
No significant changes
Source: (Altwies 1998)
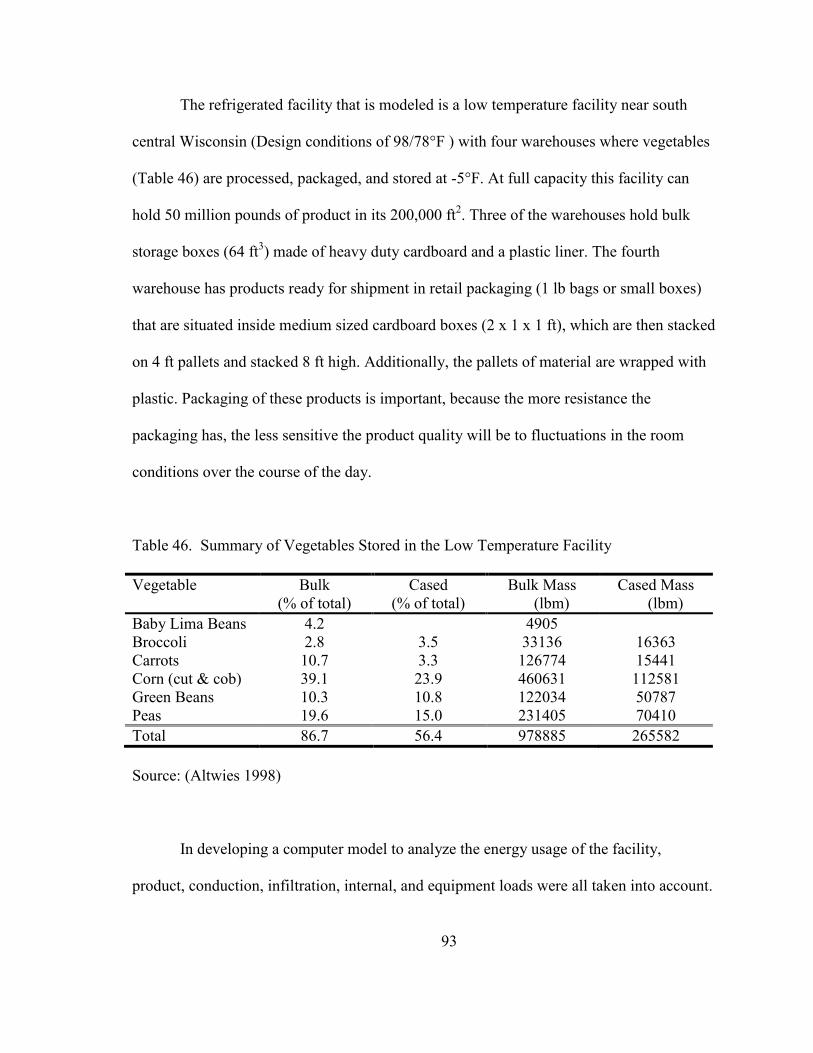
93
The refrigerated facility that is modeled is a low temperature facility near south
central Wisconsin (Design conditions of 98/78°F ) with four warehouses where vegetables
(Table 46) are processed, packaged, and stored at -5°F. At full capacity this facility can
hold 50 million pounds of product in its 200,000 ft2. Three of the warehouses hold bulk
storage boxes (64 ft3) made of heavy duty cardboard and a plastic liner. The fourth
warehouse has products ready for shipment in retail packaging (1 lb bags or small boxes)
that are situated inside medium sized cardboard boxes (2 x 1 x 1 ft), which are then stacked
on 4 ft pallets and stacked 8 ft high. Additionally, the pallets of material are wrapped with
plastic. Packaging of these products is important, because the more resistance the
packaging has, the less sensitive the product quality will be to fluctuations in the room
conditions over the course of the day.
Table 46. Summary of Vegetables Stored in the Low Temperature Facility
Vegetable Bulk
(% of total)
Cased
(% of total)
Bulk Mass
(lbm)
Cased Mass
(lbm)
Baby Lima Beans 4.2 4905
Broccoli 2.8 3.5 33136 16363
Carrots 10.7 3.3 126774 15441
Corn (cut & cob) 39.1 23.9 460631 112581
Green Beans 10.3 10.8 122034 50787
Peas 19.6 15.0 231405 70410
Total 86.7 56.4 978885 265582
Source: (Altwies 1998)
In developing a computer model to analyze the energy usage of the facility,
product, conduction, infiltration, internal, and equipment loads were all taken into account.
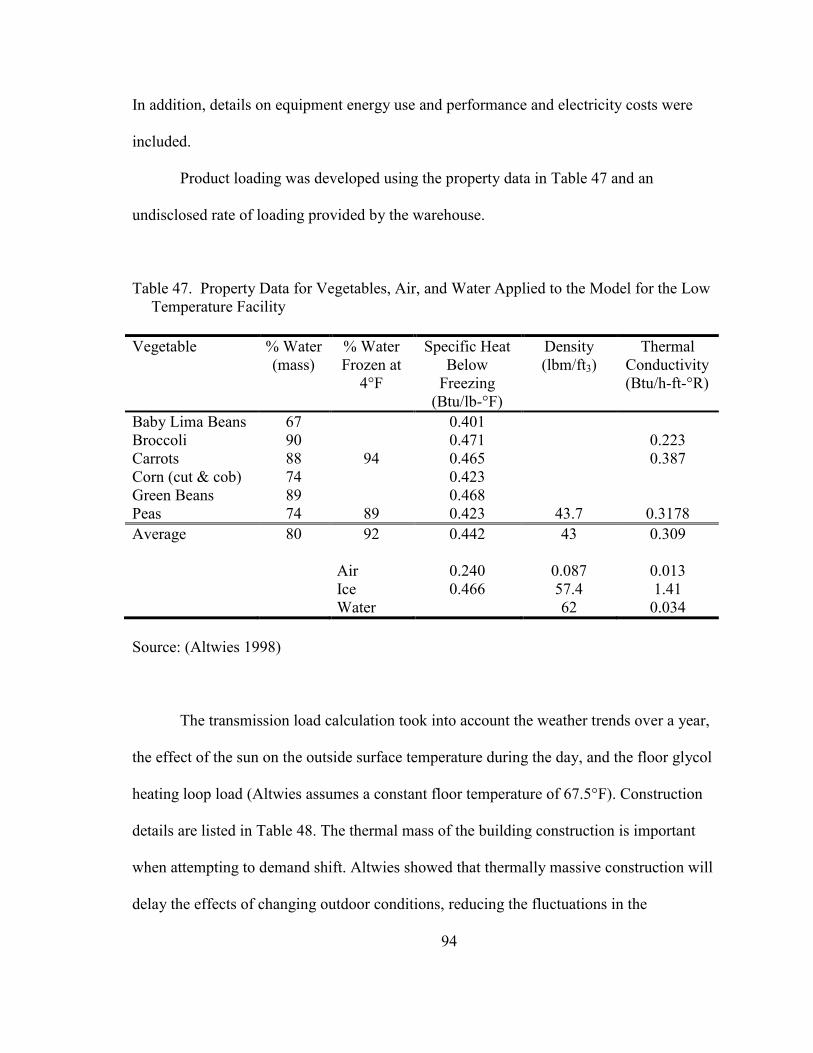
94
In addition, details on equipment energy use and performance and electricity costs were
included.
Product loading was developed using the property data in Table 47 and an
undisclosed rate of loading provided by the warehouse.
Table 47. Property Data for Vegetables, Air, and Water Applied to the Model for the Low
Temperature Facility
Vegetable % Water
(mass)
% Water
Frozen at
4°F
Specific Heat
Below
Freezing
(Btu/lb-°F)
Density
(lbm/ft3)
Thermal
Conductivity
(Btu/h-ft-°R)
Baby Lima Beans 67 0.401
Broccoli 90 0.471 0.223
Carrots 88 94 0.465 0.387
Corn (cut & cob) 74 0.423
Green Beans 89 0.468
Peas 74 89 0.423 43.7 0.3178
Average 80 92 0.442 43 0.309
Air 0.240 0.087 0.013
Ice 0.466 57.4 1.41
Water 62 0.034
Source: (Altwies 1998)
The transmission load calculation took into account the weather trends over a year,
the effect of the sun on the outside surface temperature during the day, and the floor glycol
heating loop load (Altwies assumes a constant floor temperature of 67.5°F). Construction
details are listed in Table 48. The thermal mass of the building construction is important
when attempting to demand shift. Altwies showed that thermally massive construction will
delay the effects of changing outdoor conditions, reducing the fluctuations in the
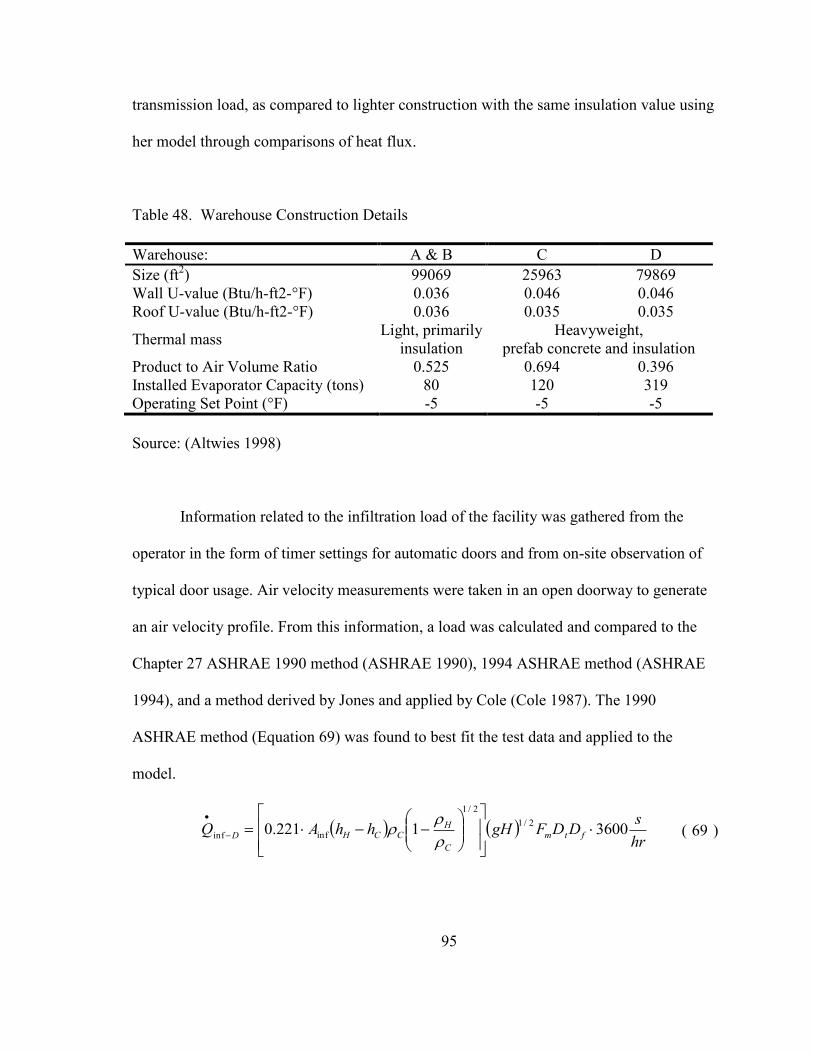
95
transmission load, as compared to lighter construction with the same insulation value using
her model through comparisons of heat flux.
Table 48. Warehouse Construction Details
Warehouse: A & B C D
Size (ft2) 99069 25963 79869
Wall U-value (Btu/h-ft2-°F) 0.036 0.046 0.046
Roof U-value (Btu/h-ft2-°F) 0.036 0.035 0.035
Thermal mass Light, primarily
insulation
Heavyweight,
prefab concrete and insulation
Product to Air Volume Ratio 0.525 0.694 0.396
Installed Evaporator Capacity (tons) 80 120 319
Operating Set Point (°F) -5 -5 -5
Source: (Altwies 1998)
Information related to the infiltration load of the facility was gathered from the
operator in the form of timer settings for automatic doors and from on-site observation of
typical door usage. Air velocity measurements were taken in an open doorway to generate
an air velocity profile. From this information, a load was calculated and compared to the
Chapter 27 ASHRAE 1990 method (ASHRAE 1990), 1994 ASHRAE method (ASHRAE
1994), and a method derived by Jones and applied by Cole (Cole 1987). The 1990
ASHRAE method (Equation 69) was found to best fit the test data and applied to the
model.
hr
sDDFgHhhAQ ftm
C
HCCHD 36001221.0
2/1
2/1
infinf
( 69 )
96
Facility personnel supplied information on internal and equipment loads to Altwies.
Internal loads include occupancy, lighting, forklift, and other miscellaneous loads.
Equipment loads include evaporator fan motors and defrost cycle contribution to the space.
For her research, Altwies altered the current -5°F setpoint to a temperature swing
from -12.5 to -2.5°F over the course of the day, with the air temperature at -12.5°F at night
and -2.5°F during the daytime by demand load shifting. Full demand load shifting requires
idling refrigeration equipment for the entire on-peak period (10-14 hrs in length).
Altwies concluded with three options, including full demand load shifting, full load
shifting and load leveling, and load leveling. Given a $155,000 annual cost for electricity
the load strategies will save $82,000 (53%), $58,000 (37%), and $1000 (<1%),
respectively.
(Manske 1999)
A pumped liquid overfeed ammonia cold storage warehouse near Milwaukee, WI
was optimized through modeling the facility with Engineering Equation Solver (Klein and
Alvarado 1999) and analyzing the typical operation scheme. Methods for reducing energy
usage included, refrigerant temperature control, refrigerant flow control, condenser fan
control, evaporator fan control, compressor configuration, refrigerant system configuration,
condenser size, defrost control, and infiltration reduction.
Set point temps of 23°F and -12°F are maintained in the intermediate and low
pressure receiver vessels respectively. These refrigerant temperatures provide for the
freezer with a space temperature of 0°F and the cooler with a space temperature of 34°F.
The banana and tomato ripening rooms are cooled using liquid following the high pressure
receiver to maintain conditions of 45 to 65°F. Four degrees Fahrenheit of superheat is

97
added by the evaporators and 15°F of subcooling is performed by an evaporative
condenser.
Condenser fan control schemes include on/off motor cycling, two speed motor
cycling, and variable speed control of the motors. Five schemes of part load evaporator
operation include cycling the refrigerant flow to the evaporator while the fan motors stay
on, on/off fan motor cycling, two speed motor cycling, variable frequency drive control of
evaporator motors, and controlling refrigerant temperature supplied to the evaporator. As
an alternative to the current single stage compression system, a two-stage and a
thermosiphon system were analyzed.
Building construction is considered lightweight for all spaces and specified in Table
49. Outside of the freezer there is a warming room for workers to spend their breaks in.
Table 49. Conditioned Space Summary
Space Area
(ft2)
Temp
(°F)
Relative
Humidity
R-Value
Roof
R-Value
Wall
R-Value
Perimeter
Freezer 54000 0 80 33.09 32.85 n/a
Cooler 32000 34 87 25.09 24.85 1
Cooler Dock 5700 45 65 25.09 24.85 1
Banana Rooms 4000 56 to 64 80 Unavailable
Tomato Rooms 4000 45 to 55 80 Unavailable
Source: (Manske 1999)
This facility uses a single screw and a reciprocating compressor operating in
parallel to a common discharge line. Compressor capacity adjustment was done in
accordance with Equation 70 to account for variations in superheat, subcooling, mass flow,
and suction or discharge temperatures.
98
rcomp
compr
rcompcomph
hCapCap
,41
41
,
( 70 )
Screw compressors may be unloaded down to 10% by proper slide positioning.
Reciprocating compressors are unloaded by reducing the number of cylinders acting on the
refrigerant. Both of these relationships, between load and power usage, were modeled
using a linear regression for application in the modeling software.
Flow lifted by the compressors was cooled with an evaporative condenser, which is
rated according to Equation 71, where heat rejection factor (HRF) is a function of the wet
bulb temperature and the saturated condensing temperature. The coefficient N varies
between 0.5 for laminar flow and 0.8 for turbulent flow (Mitchell and Braun 1998). The
manufacturer of the evaporative condenser, used for this analysis, suggested a value of
0.76. Capacity is reduced to 35% by operating the condenser in dry cooling mode, which is
required at outside temperatures below 31°F.
N
r
anecond
econdRPM
RPM
HRF
CapCap
, ( 71 )
Typically evaporator fans are operated all the time. With a focus on reducing
energy usage of the modeled facility, Manske applied part load control of the evaporator
fans. This is modeled using Equation 72, which is very similar to Equation 71. The
manufacturer suggested a value between 0.5 and 0.6 for the exponent N whereas Manske
applied an experimental value of 0.65 that was obtained through a personal
communication.
N
r
arevapevap
RPM
RPMCapCap
, ( 72 )
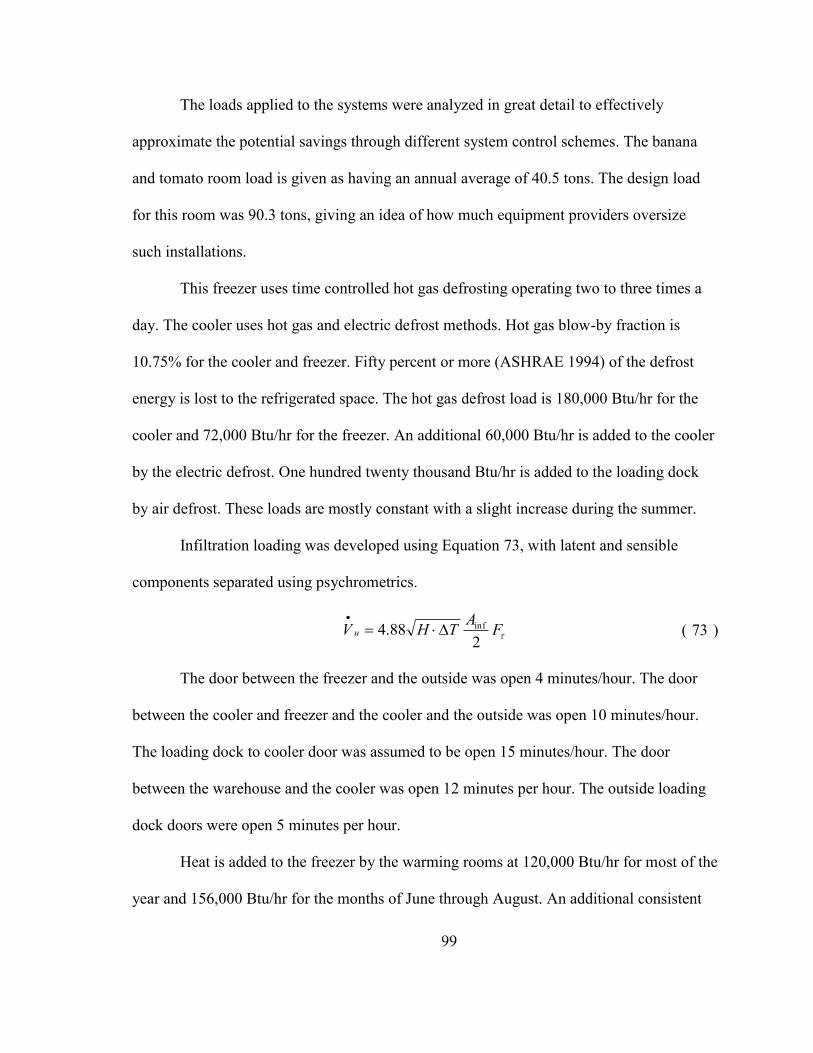
99
The loads applied to the systems were analyzed in great detail to effectively
approximate the potential savings through different system control schemes. The banana
and tomato room load is given as having an annual average of 40.5 tons. The design load
for this room was 90.3 tons, giving an idea of how much equipment providers oversize
such installations.
This freezer uses time controlled hot gas defrosting operating two to three times a
day. The cooler uses hot gas and electric defrost methods. Hot gas blow-by fraction is
10.75% for the cooler and freezer. Fifty percent or more (ASHRAE 1994) of the defrost
energy is lost to the refrigerated space. The hot gas defrost load is 180,000 Btu/hr for the
cooler and 72,000 Btu/hr for the freezer. An additional 60,000 Btu/hr is added to the cooler
by the electric defrost. One hundred twenty thousand Btu/hr is added to the loading dock
by air defrost. These loads are mostly constant with a slight increase during the summer.
Infiltration loading was developed using Equation 73, with latent and sensible
components separated using psychrometrics.
FA
THV u
288.4 inf
( 73 )
The door between the freezer and the outside was open 4 minutes/hour. The door
between the cooler and freezer and the cooler and the outside was open 10 minutes/hour.
The loading dock to cooler door was assumed to be open 15 minutes/hour. The door
between the warehouse and the cooler was open 12 minutes per hour. The outside loading
dock doors were open 5 minutes per hour.
Heat is added to the freezer by the warming rooms at 120,000 Btu/hr for most of the
year and 156,000 Btu/hr for the months of June through August. An additional consistent

100
heat load is added by the heated freezer floors at 2.5 Btu/h-ft2. All interior loads, except for
lights and warming room loads, are at design levels for second shift (3 pm to 12 am) and at
half levels during all other times. Additional miscellaneous loads are summarized in Table
50.
Table 50. Internal Space Loads
Space Source Sensible
(Btu/hr)
Latent
(Btu/hr)
Loading Multiplier for
First Shift Operation
Freezer People 4830 9730 0.5
Product 0 0 1
Forklift 118000 0 0.5
Lights 83060 0 1
Sub-Floor Heating 135000 0 1
Cooler People 3450 6950 0.5
Product 0 1201 1
Forklift 118000 0 0.5
Lights 73700 0 1
Dock People 3450 6950 0.5
Product 0 0 1
Forklift 55500 0 0.5
Lights 27528 0 1
Source: (Manske 1999)
To achieve energy improvements, Manske recommends extensive instrumentation.
Electric power monitoring of compressors, evaporator fans, and condenser fans along with
miscellaneous other equipment will allow analysis of the control schemes utilized. The
instantaneous refrigeration load should be calculated and logged from evaporator enthalpy
change and refrigerant mass flow. Necessary instrumentation is summarized in Table 51.

101
Table 51. Recommended Performance Monitoring Measurements
Location Minimum
Measurement
Preferred Measurement Usefulness
Condenser Pressure Condenser Fan Control
Mechanical
Room Power
Fan and Pump Power Electricity Consumption
Compressor(s)
Suction
Dry Suction Line
Pressure
Individual Machine
Suction Flange Pressure
Capacity, Horsepower,
and Mass Flow
Calculations
Compressor(s)
Discharge
Discharge Line
Pressure
Individual Machine
Discharge Flange
Pressure
Capacity, Horsepower,
and Mass Flow
Calculations
Compressor(s) Part Load
Operation
Capacity, Horsepower,
and Mass Flow
Calculations
Compressor(s) Mechanical
Room Power
Individual Machine
Power Draws
Electricity Consumption
Evaporator Coil Refrigerant
Temperature/Pre
ssure, Inlet Air
Temperature
Supply and Coil
Refrigerant
Temperature/Pressure,
Inlet and Outlet Air
Temperature
Coil Capacity
Calculations
Evaporator Static Pressure Drop or
Time Clock Measuring
Liquid Solenoid Feed
Time
Defrost Demand
Determination
Evaporator Evaporator Fan
Power
Electricity Consumption
Receiver
Vessels
High Pressure Liquid
Supply Line Mass Flow
Load Calculations
Cold Space Temperature Control
Outdoor Air Dry Bulb, Wet
Bulb
Condenser Fan Control
Entire System Electric Bill Monthly Analysis
Source: (Manske 1999)
Manske compared thirteen different system configurations to analyze the cost
reduction opportunities (Table 52). In relation to the capital cost to implement some of

102
these changes, improvements for the most part were small. The best improvement predicted
(28.8% savings) is through the use of a split system with an elaborate monitoring system to
optimize system performance. This would be tied in with variable speed control of
condenser fans, two-speed control of evaporator fans, and optimized defrost cycling. The
split system puts the banana and tomato ripening room on its own circuit to reduce the
inefficiency of cooling the space with a 23°F suction temperature. The ratio between the
peak energy usage and off-peak energy usage for each system configuration was very
similar with on-peak energy usage, ranging from 36.5 to 37.0% of the total energy usage.
Table 52. Energy Savings Comparisons between Optimization Techniques
System Design/Optimization Option Electric
Cost ($/yr)
Electric
Savings
($/yr)
Electrical
Savings
(%)
Current System 89667
Smaller Condenser 87659 2008 2.2
Two-stage Compression 90453 -786 -0.9
Split System 82610 7057 7.9
Split System with Thermosiphon 80655 9012 10.1
Bi-Level, Fixed Head Pressure 92242 -2575 -2.9
VFD Condenser Fans, Min Head Pressure 87458 2209 2.5
VFD Condenser Fans, Opt Head Pressure 85811 3856 4.3
On/Off Evaporator Fans, Opt. Receiver Temp 89131 536 0.6
Two-speed Evaporator Fans, Opt. Receiver T 76850 12817 14.3
Hot Gas Defrost Control 85892 3775 4.2
Warehouse Door Infiltration 50% Reduction 81816 7851 8.8
Optimized Split System – VFD Condenser Fans,
Two-speed Evap., Reduced Defrost
63872 25795 28.8
Source: (Manske 1999)

103
(Stoeckle 2000)
Stoeckle investigates using the product in a refrigerated warehouse as thermal
storage to allow reduced compressor runtime during peak electricity cost hours (Stoeckle
2000). A computer model was developed from which different operating schemes were
analyzed. A forecasting method to estimate next day demand shifting benefits was
developed.
The distribution warehouse modeled consisted of two refrigerated spaces. The
freezer was 100,000 ft2 (316.2 x 316.2 ft), 31.5 ft in height (3,121,000 ft
3 volume), and
maintained at 0°F. A 20,000 ft2 (316.2 x 62.96 ft), 12 ft high loading dock (237,773 ft
3
volume) is attached to this main storage building, which maintains a 34°F temperature. The
freezer has 43% of its area covered with product, using a typical static pallet rack
installation. Five doors connect the dock to the freezer (14 ft x 10 ft each). Thirty truck
bays connect the dock to the outdoors, at 9 ft wide x 8 ft height dimensions each. The
infiltration load associated with the opening of these doors is based on Downing and
Meffert‟s method (Equations 74 and 75), assuming freezer doors are open 4 min/hour and
each dock door is open 2 min/hour.
CHm
C
HCD hhEFHA
hr
ftQ
1182.45122/1
2/1
inf
2/1
inf
( 74 )
2
3
3/1
1
2
H
C
mF
( 75 )

104
Two freezer constructions are analyzed, including a thermally massive wall and
roof construction and a lightweight wall. Both walls had a R-value of 21.74. Demand
shifting savings are typically improved with heavier constructions as a result of the load
lagging effect that such constructions have due to their thermal capacity. The dock is
assigned an R-value of 10.53 h-ft2-°F/Btu. The convective coefficient used for the interior
of the facility is 0.75 Btu/hr-ft2-°F.
A consistent load that the space sees is a heating loop used to ensure the sub-floor
does not freeze. A constant temperature of 67.5°F is assumed at the transition from the dirt
to the 12 inch concrete slab and 2 in of insulation. This sub-floor temperature drives a heat
flow of 2.48 Btu/h-ft2, but the value of 3.6 Btu/h-ft
2, suggested by Jekel (Jekel and Reindl
2000), was applied to the model.
Additional loads include lighting for the freezer (0.45 W/ft2) and the dock (2.5
W/ft2), equipment load generated by fork lifts operating in the freezer which adds 18.17
tons, and occupancy loading which adds 2.25 tons of heat to the space. The product arrival
temperature is assumed to be at storage temperature, removing that component from the
load profile.
Some equipment details were noted. The evaporator was sized for a 5.4°F reduction
in air temperature with an 8.1°F temperature difference for the freezer and the dock spaces.
It is never explicitly stated, but it appears that this system utilizes an evaporative
condenser, as the condenser performance is driven by the wet bulb temperature. The
minimum temperature difference between the condenser refrigerant and wet bulb
temperature is 18°F. The type of defrost was not specified but a typical value of 20%
defrost efficiency was noted (Jekel and Reindl 2000).

105
The two warehouses were analyzed for over a year under typical refrigeration
system operation. Results are compared in Table 53, showing very similar energy use. The
freezer with massive wall construction required 258 tons of refrigeration capacity whereas
the lightweight wall construction freezer required 344 tons.
Table 53. Yearly Cooling Load Comparison for Light and Massive Construction Types
Sensible Cooling
Load / kWh
Latent Cooling
Load / kWh
Total Cooling
Load / kWh
Total Electricity
Demand / kWh
Massive Wall Warehouse
Freezer 4060160 155121 4215281 1647379
Dock 550649 213893 764542 575260
Total 4610809 369014 4979823 2222640
Lightweight Wall Warehouse
Freezer 4061038 156438 4217476 1609134
Dock 540927 212045 752972 573138
Total 4601965 368483 4970448 2182273
Source: (Jekel and Reindl 2000)
Demand shifting strategies first discussed by Altwies (Altwies 1998) include full
demand shifting, load leveling, and a combination of the two strategies. Full demand
shifting cools the refrigerated space enough that refrigeration equipment does not operate
during the on-peak period. Load leveling strives to operate the refrigeration equipment at a
consistent rate in order to overcool the space during off-peak hours and maintain a
temperature below the maximum space temperature during on-peak hours. The third option
attempts to take advantage of the off-peak energy costs while still allowing on-peak
operation. This method allows for reduced energy costs without the need for as much
refrigeration capacity. A fourth strategy discussed precools the space for a few hours prior

106
to throttling back refrigeration equipment operation to maintain a desired temperature
throughout high price periods.
During the load shifting simulations, temperature was allowed to rise above the
typical freezer temperature of 0°F and brought down to -22°F during off-peak hours. To
achieve savings with full load demand shifting, additional compressor capacity was
required to drive the storage temperature down during off-peak hours. The massive wall
freezer obtained savings of $7000 to $15000 using these methods, for a yearly operational
savings of 4 to 10%. Precooling did not show reduction in energy costs because the heavy
compressor operation, prior to the floating period, essentially negated any on-peak savings.
(Stoeckle et al. 2002)
Demand load shifting has potential to reduce operating cost by utilizing the
products stored in the refrigerated space as a thermal battery and taking advantage of lower
energy costs during off-peak periods. This paper presents a simple method for determining
if demand load shifting will offer a reduction in operational costs for a specific warehouse
on a daily basis (Stoeckle et al. 2002). The method includes predicting the maximum
allowable floating duration based on the outside air temperatures for the next day and
establishing the floating period that yields the greatest operating cost savings. A simple
price ratio criterion was found to be a good indicator of energy cost savings by demand
shifting.
Real-time pricing rate structures were obtained from Pacific Gas and Electric,
Alabama Power, Southern Company, and Niagara Mohawk Power. Not only does
electricity cost vary throughout the day, but it also varies from month to month, with peak
electricity costs in the summer months.

107
Whether demand shifting will offer reduced energy costs depends primarily on the
real-time price, with the equipment performance being a less significant factor. To
determine whether a given day will be better served by conventional operation or by load
demand shifting, Equation 76 should be analyzed. Stoeckle et al. found that the critical
price ratio is 2.2 in numerous cases. When performing this analysis, if the critical price
ratio is above 2.2, the refrigeration system will operate at a lower cost if the load is shifting
to the off-peak hours.
shifavg
dayavg
P
PCPR
,
, ( 76 )
Using this method the model showed that annual savings of $12,581 were realized
with a maximum product temperature of -0.4°F. Annual savings with a maximum product
temperature of 3.2°F were $17,976.
Operating costs savings through demand shifting are relatively small compared to
the annual refrigeration system cost. Installation of additional refrigeration capacity results
in projected savings in the range of 7% to 11%.
(Magoo 2003)
Refrigerated storage requires significant amounts of energy. During off peak hours,
energy is available at a lower cost. Magoo investigates the opportunity for shifting
refrigeration system operation into the low cost electricity periods of the day by utilizing
the thermal mass of the products being stored in high temperature warehouses. Coolers are
limited on the amount of load shifting that they can perform. If the temperature is pulled
down too low during off-peak periods, some products could begin to freeze, which would
damage them.
108
A distributed warehouse is modeled and analyzed using TRNSYS. Three
approaches are used for modeling the thermal effects of the product. The first approach
assumes that the product is a consistent temperature throughout at any given time. The
second approach analyzes the product using a three-dimensional finite difference approach.
A third approach uses a two-dimensional finite difference model.
Magoo categorizes cold storage into five classifications, including controlled
atmosphere storage, coolers, high-temperature freezers, low-temperature storage, and low-
temperature storage with extra capacity for pulling down product temperature upon arrival.
Controlled atmosphere coolers are used for long term storage of fruits and vegetables. By
maintaining certain conditions, the longevity of the stored product may be prolonged.
Coolers operate at temperatures above 32°F, high temperature freezers operate from 26.6 to
28.4°F, and low-temperature storage rooms operate from -20.2 to -9.4°F. Product received
by some low temperature storage facilities is above freezing and must be pulled down
through the latent heat of fusion. This requires significant additional capacity to quickly
transition these products to a frozen state. Freezers store agricultural products, meat, fish,
poultry, fruit juices, processed and canned foods, and ice cream. Coolers store milk, dairy
products like cheese and butter, eggs and egg products at temperatures close to freezing.
The closer these products are to freezing the longer their quality will be maintained
(ASHRAE 1998). These units have a much higher product turnover than freezers, as
products can only be stored for a short period of time at temperatures above freezing before
the product quality begins to degrade. Additional spaces include refrigerated docks which
are used to reduce infiltration into the associated cooler or freezer to which it is adjoined
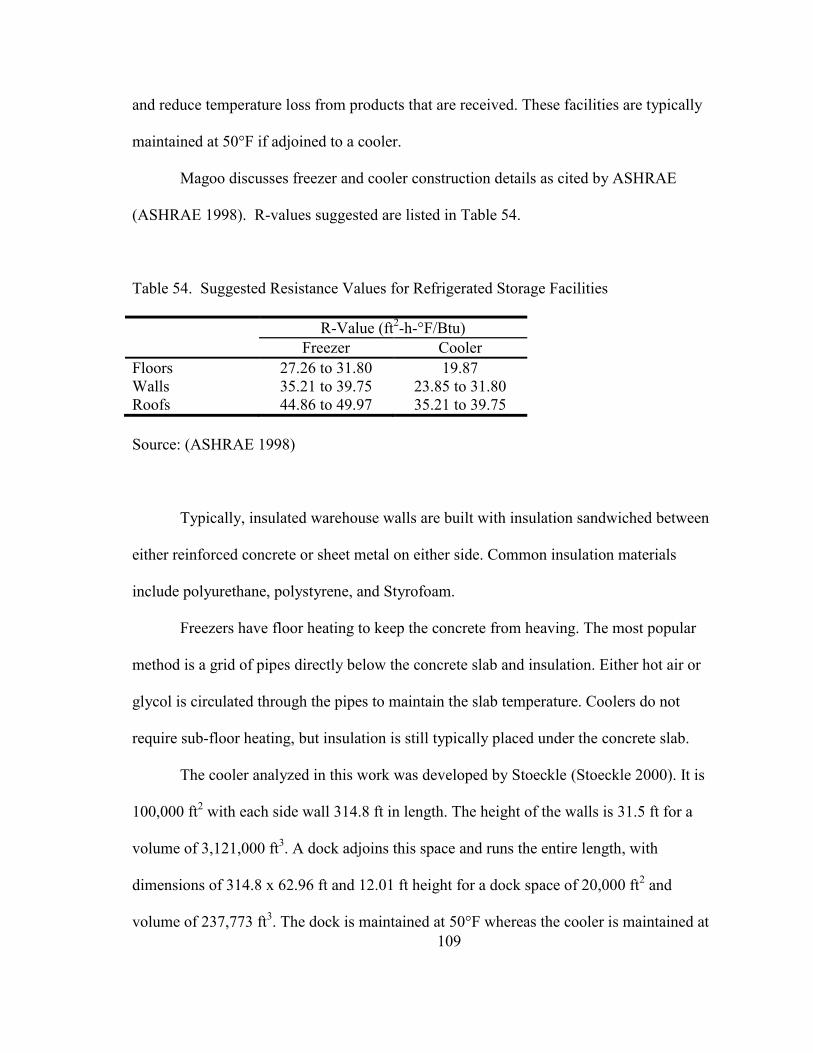
109
and reduce temperature loss from products that are received. These facilities are typically
maintained at 50°F if adjoined to a cooler.
Magoo discusses freezer and cooler construction details as cited by ASHRAE
(ASHRAE 1998). R-values suggested are listed in Table 54.
Table 54. Suggested Resistance Values for Refrigerated Storage Facilities
R-Value (ft
2-h-°F/Btu)
Freezer Cooler
Floors 27.26 to 31.80 19.87
Walls 35.21 to 39.75 23.85 to 31.80
Roofs 44.86 to 49.97 35.21 to 39.75
Source: (ASHRAE 1998)
Typically, insulated warehouse walls are built with insulation sandwiched between
either reinforced concrete or sheet metal on either side. Common insulation materials
include polyurethane, polystyrene, and Styrofoam.
Freezers have floor heating to keep the concrete from heaving. The most popular
method is a grid of pipes directly below the concrete slab and insulation. Either hot air or
glycol is circulated through the pipes to maintain the slab temperature. Coolers do not
require sub-floor heating, but insulation is still typically placed under the concrete slab.
The cooler analyzed in this work was developed by Stoeckle (Stoeckle 2000). It is
100,000 ft2 with each side wall 314.8 ft in length. The height of the walls is 31.5 ft for a
volume of 3,121,000 ft3. A dock adjoins this space and runs the entire length, with
dimensions of 314.8 x 62.96 ft and 12.01 ft height for a dock space of 20,000 ft2 and
volume of 237,773 ft3. The dock is maintained at 50°F whereas the cooler is maintained at

110
34°F. The space is maintained using a saturated suction temperature of 19°F and discharge
temperature of 95°F. If the space temperature varies by 0.09°F from the setpoint, cooling is
initiated.
Wall and roof construction is heavyweight for the cooler, composed of insulation
between two layers of two inch thick concrete. Three different insulation thickness‟ were
analyzed by this work, including 5.71 inches at 27.93 ft2-h-°F/Btu, 4.29 inches at 21.19 ft
2-
h-°F/Btu, and 5.08 inches at 24.88 ft2-h-°F/Btu. The dock included in the simulations is
composed of the following items from the outside to inside: two inches of concrete, 1.85
inches of insulation, and 5.98 inches of concrete, with an R-value of 10.25 ft2-h-°F/Btu.
The dock and cooler have a common floor composed of 11.8 inches of concrete covered
with 1.38 inches of insulation for an R-value of 8.28 ft2-h-°F/Btu. No floor heating is
utilized, with the slab resting directly against soil, which is assumed to be at a constant
temperature of 50 °F.
Five 10 x 14 ft doors connect the cooler to the dock. The dock has 30 doors which
open to the outdoor air. Each door is 9 x 8 ft. Product is assumed to arrive at storage
temperature so there is effectively no product load. The product is assumed to cover 60%
of the floor space on average. This is important, because the amount of product in the
cooler will affect the capability of the system to load shift.
Infiltration loading is calculated using the Gosney Olama equation (Equation 18).
Door openings were assumed to be one per hour for each dock door with a 60 second total
door open period. The doorway flow factor is set at 0.8 per ASHRAE (ASHRAE 1998).
According to common practice, cooler to dock doors were left open continuously with a
door flow factor of 0.8.
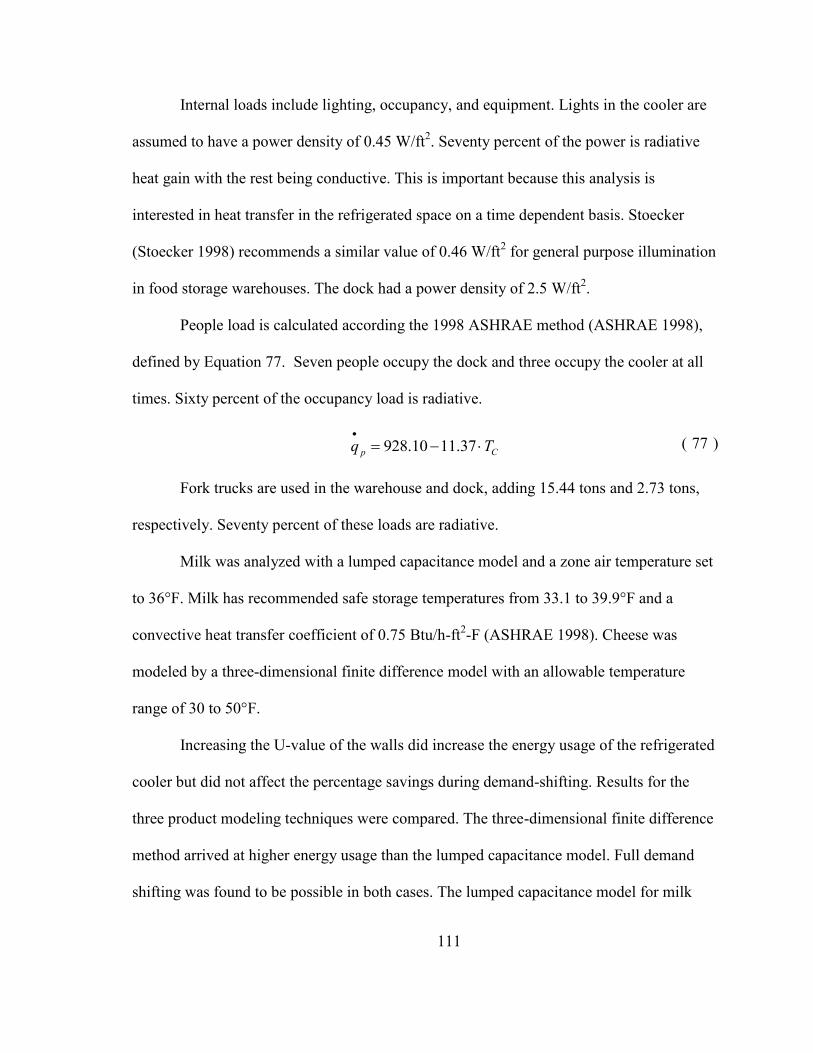
111
Internal loads include lighting, occupancy, and equipment. Lights in the cooler are
assumed to have a power density of 0.45 W/ft2. Seventy percent of the power is radiative
heat gain with the rest being conductive. This is important because this analysis is
interested in heat transfer in the refrigerated space on a time dependent basis. Stoecker
(Stoecker 1998) recommends a similar value of 0.46 W/ft2 for general purpose illumination
in food storage warehouses. The dock had a power density of 2.5 W/ft2.
People load is calculated according the 1998 ASHRAE method (ASHRAE 1998),
defined by Equation 77. Seven people occupy the dock and three occupy the cooler at all
times. Sixty percent of the occupancy load is radiative.
Cp Tq
37.1110.928 ( 77 )
Fork trucks are used in the warehouse and dock, adding 15.44 tons and 2.73 tons,
respectively. Seventy percent of these loads are radiative.
Milk was analyzed with a lumped capacitance model and a zone air temperature set
to 36°F. Milk has recommended safe storage temperatures from 33.1 to 39.9°F and a
convective heat transfer coefficient of 0.75 Btu/h-ft2-F (ASHRAE 1998). Cheese was
modeled by a three-dimensional finite difference model with an allowable temperature
range of 30 to 50°F.
Increasing the U-value of the walls did increase the energy usage of the refrigerated
cooler but did not affect the percentage savings during demand-shifting. Results for the
three product modeling techniques were compared. The three-dimensional finite difference
method arrived at higher energy usage than the lumped capacitance model. Full demand
shifting was found to be possible in both cases. The lumped capacitance model for milk

112
requires a pre-cooling setpoint of 37°F to achieve this, and the finite difference model for
cheddar cheese showed that a precooled setpoint of 41°F is required.
(Roy 2010)
Industrial refrigerated warehouses‟ primary operating cost is the cost of electricity
to maintain the desired conditions for products. This article discusses Sobeys warehouse of
Trois-Rivières. To reduce energy use, this warehouse utilizes an ammonia central chiller
and glycol secondary loop, improved insulation, natural lighting, monitored fresh air
supply, and miscellaneous other energy trimming efforts.
The refrigerated portion of the warehouse is 120,000 ft2, maintained at 39°F.
Heating is provided by a radiant floor to both avoid freezing of the sub-floor and improve
employee comfort. Building insulation is R-30 for the walls and R-40 for the ceiling. The
roof is reflective (white) to reduce the solar load. T5 high output fluorescent lights are used
throughout the warehouse to achieve optimum energy efficient lighting. This is
supplemented by natural lighting brought in through R-7.5 windows on the south side of
the building. Fresh air was reduced by 75% through the use of CO2 sensors that monitor the
space conditions. When outdoor temperatures are below 10°F (844 hours during the year
for this location), the refrigeration system operates without compressors using a
thermosiphon cycle. During the sizing of equipment, the thermal mass of the product being
stored (44,092 lb of milk products) was taken into account, reducing the refrigeration
equipment size (transient effects were not considered).
This system offers energy savings of $144,896 annually with a simple seven year
payback.

113
Lighting Load
(Rea 2000)
The Iesna Lighting Handbook Reference and Application presents details on
lighting as it applies to numerous industries and applications (Rea 2000). This edition of
the handbook has a heightened focus on light quality, discussing design criteria such as
eye-source-task geometry, flicker, color, and glare. The handbook gives very little
information in regard to refrigeration. It cites that refrigeration storage areas reach as low
as -20°F and that warehouse type buildings use fluorescent lighting along the aisles.
Product Load
(Aparicio-Cuesta and Garcia-Moreno 1988)
Long term storage conditions and their effect on food quality are very important to
those working in industrial refrigeration. Aparicio-Cuesta et al. presented a report on frozen
cauliflower in which the conditions were varied for different samples over a 30 month
storage period. The product was kept at a temperature of -7.6°F. Storage in a display
freezer was also analyzed for 60 days at -0.4°F.
(Wade 1984)
Wade discusses details of refrigeration design related to the cooling of harvested
products from field temperature, including system capacity, air flow management, and
pertinent equations. Just because a refrigeration system has sufficient capacity does not
mean it will be able to cool the product appreciably faster. If flow is not passing through
the product it will not be reduced from its initial temperature to the storage temperature in a
24 hour period no matter what the refrigeration system capacity is. Industrial refrigeration
applications typically use pressure-cooling, to ensure a steady flow rate over the product to
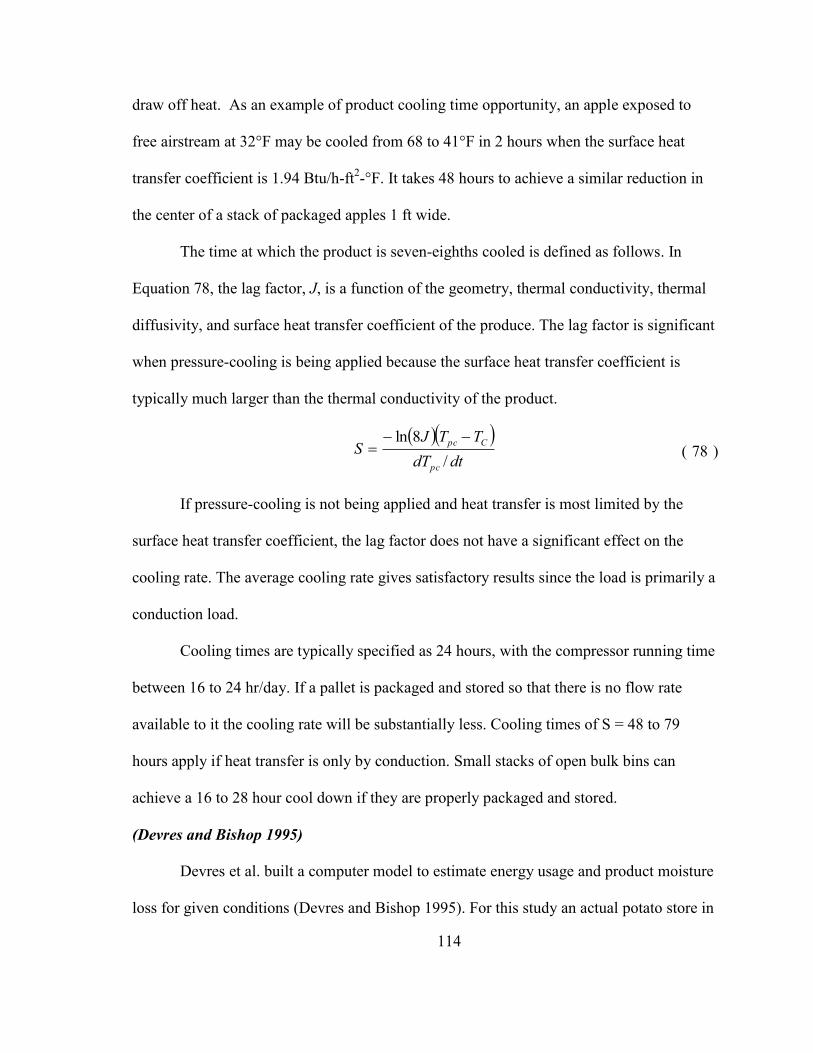
114
draw off heat. As an example of product cooling time opportunity, an apple exposed to
free airstream at 32°F may be cooled from 68 to 41°F in 2 hours when the surface heat
transfer coefficient is 1.94 Btu/h-ft2-°F. It takes 48 hours to achieve a similar reduction in
the center of a stack of packaged apples 1 ft wide.
The time at which the product is seven-eighths cooled is defined as follows. In
Equation 78, the lag factor, J, is a function of the geometry, thermal conductivity, thermal
diffusivity, and surface heat transfer coefficient of the produce. The lag factor is significant
when pressure-cooling is being applied because the surface heat transfer coefficient is
typically much larger than the thermal conductivity of the product.
dtdT
TTJS
pc
Cpc
/
8ln ( 78 )
If pressure-cooling is not being applied and heat transfer is most limited by the
surface heat transfer coefficient, the lag factor does not have a significant effect on the
cooling rate. The average cooling rate gives satisfactory results since the load is primarily a
conduction load.
Cooling times are typically specified as 24 hours, with the compressor running time
between 16 to 24 hr/day. If a pallet is packaged and stored so that there is no flow rate
available to it the cooling rate will be substantially less. Cooling times of S = 48 to 79
hours apply if heat transfer is only by conduction. Small stacks of open bulk bins can
achieve a 16 to 28 hour cool down if they are properly packaged and stored.
(Devres and Bishop 1995)
Devres et al. built a computer model to estimate energy usage and product moisture
loss for given conditions (Devres and Bishop 1995). For this study an actual potato store in

115
the Cambridge region of the United Kingdom was analyzed. Model predictions were
compared to actual store measurements to analyze the model effectiveness. This
information is important to industrial refrigeration because they are typically conflicting
parameters which must be balanced to maintain a successful refrigerated storage operation.
Devres et al. used the following temperature relationship assumptions for the model
when measured data was not available:
Corridor temperature = Ambient temperature - 18°F
Ground temperature = 41°F
Ceiling temperature = Ambient temperature + 18°F
For sun load hours an additional temperature difference was added to the walls to
account for solar radiation. The structure has a light colored exterior to which 3.6, 5.4, and
5.4°F are added for the south, west, and east walls, respectively.
The interior temperature of 39.2°F (90% relative humidity) is maintained by an
evaporator operating at 28.4°F, with a T.D. of approximately 10°F. According to Devres,
product storage should be kept within 2 to 5°F of the product freezing point to achieve the
best product storage life. With these operating conditions, a defrost system will be needed,
as 25% of the condensed water will turn to frost on the coil. Devres uses a defrost
efficiency of 50%.
The facility being analyzed has a product load that represents over 50% of total
daily load with a half cooling time of 10 days. Product is added to the store over 20 to 30
days and is later unloaded over four to five months. The product‟s temperature at any given
time may be estimated by Equation 79.
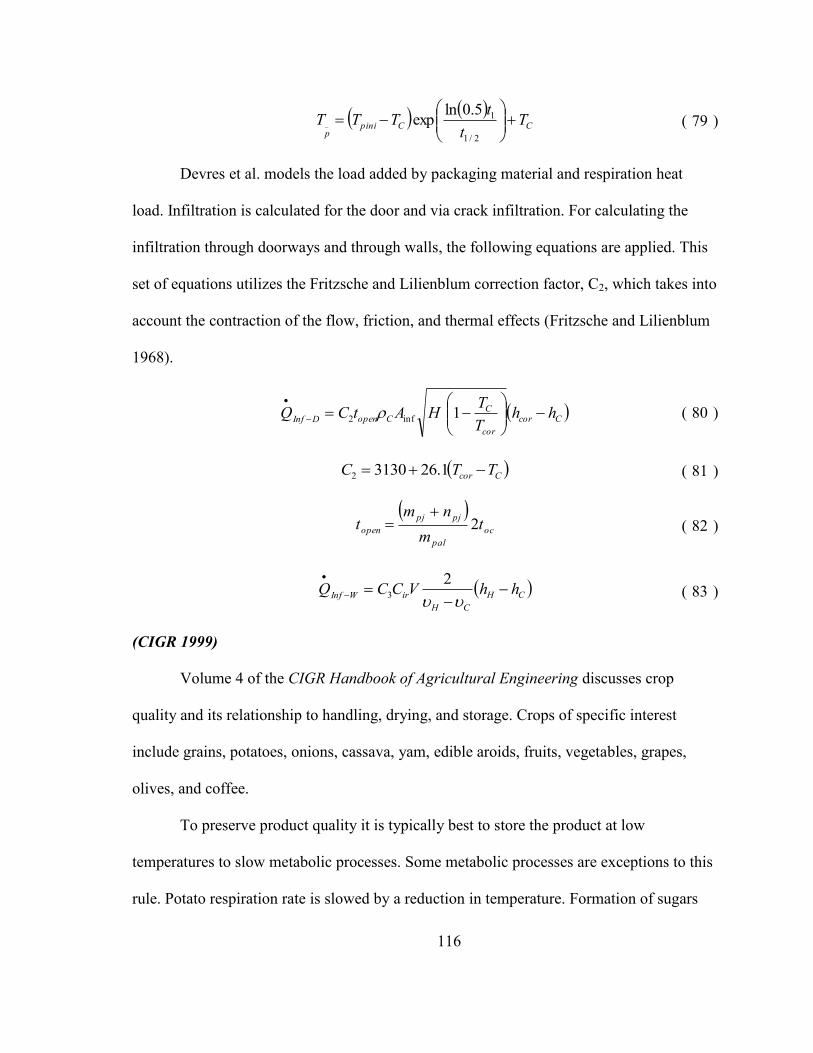
116
CCpini
p
Tt
tTTT
2/1
15.0lnexp_ ( 79 )
Devres et al. models the load added by packaging material and respiration heat
load. Infiltration is calculated for the door and via crack infiltration. For calculating the
infiltration through doorways and through walls, the following equations are applied. This
set of equations utilizes the Fritzsche and Lilienblum correction factor, C2, which takes into
account the contraction of the flow, friction, and thermal effects (Fritzsche and Lilienblum
1968).
Ccor
cor
CCopenDInf
hhT
THAtCQ
1inf2 ( 80 )
Ccor TTC 1.2631302 ( 81 )
oc
pal
pjpj
open tm
nmt 2
( 82 )
CH
CH
irWInfhhVCCQ
23 ( 83 )
(CIGR 1999)
Volume 4 of the CIGR Handbook of Agricultural Engineering discusses crop
quality and its relationship to handling, drying, and storage. Crops of specific interest
include grains, potatoes, onions, cassava, yam, edible aroids, fruits, vegetables, grapes,
olives, and coffee.
To preserve product quality it is typically best to store the product at low
temperatures to slow metabolic processes. Some metabolic processes are exceptions to this
rule. Potato respiration rate is slowed by a reduction in temperature. Formation of sugars
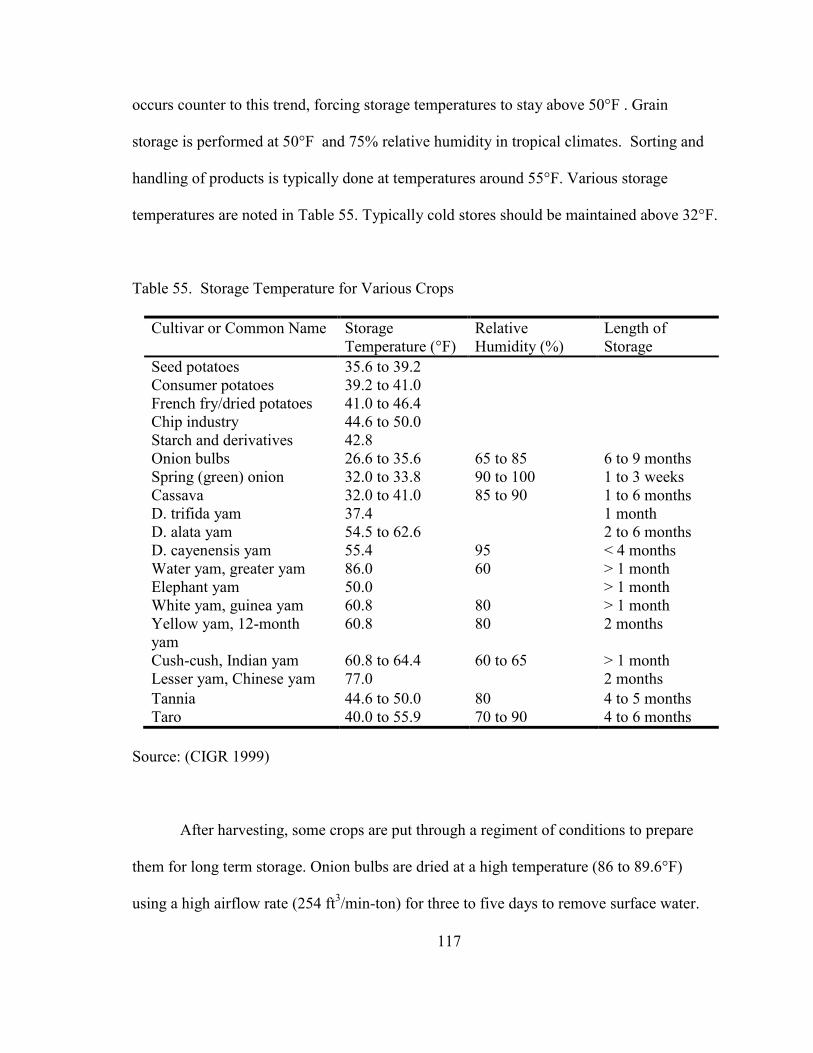
117
occurs counter to this trend, forcing storage temperatures to stay above 50°F . Grain
storage is performed at 50°F and 75% relative humidity in tropical climates. Sorting and
handling of products is typically done at temperatures around 55°F. Various storage
temperatures are noted in Table 55. Typically cold stores should be maintained above 32°F.
Table 55. Storage Temperature for Various Crops
Cultivar or Common Name Storage
Temperature (°F)
Relative
Humidity (%)
Length of
Storage
Seed potatoes 35.6 to 39.2
Consumer potatoes 39.2 to 41.0
French fry/dried potatoes 41.0 to 46.4
Chip industry 44.6 to 50.0
Starch and derivatives 42.8
Onion bulbs 26.6 to 35.6 65 to 85 6 to 9 months
Spring (green) onion 32.0 to 33.8 90 to 100 1 to 3 weeks
Cassava 32.0 to 41.0 85 to 90 1 to 6 months
D. trifida yam 37.4 1 month
D. alata yam 54.5 to 62.6 2 to 6 months
D. cayenensis yam 55.4 95 < 4 months
Water yam, greater yam 86.0 60 > 1 month
Elephant yam 50.0 > 1 month
White yam, guinea yam 60.8 80 > 1 month
Yellow yam, 12-month
yam
60.8 80 2 months
Cush-cush, Indian yam 60.8 to 64.4 60 to 65 > 1 month
Lesser yam, Chinese yam 77.0 2 months
Tannia 44.6 to 50.0 80 4 to 5 months
Taro 40.0 to 55.9 70 to 90 4 to 6 months
Source: (CIGR 1999)
After harvesting, some crops are put through a regiment of conditions to prepare
them for long term storage. Onion bulbs are dried at a high temperature (86 to 89.6°F)
using a high airflow rate (254 ft3/min-ton) for three to five days to remove surface water.
118
Airflow and temperature are reduced (101.7 ft3/min-ton and 78.8 down to 59.0°F at 65 to
75% relative humidity) for about 20 days to remove surface moisture and dry, cure, and
seal the skin. Bulbs may be stored for up to 10 months if properly cured and stored at 32 to
41°F and 65 to 75% relative humidity. Bulbs are warmed above the dew point of the air for
seven days prior to removal to avoid condensation of moisture during grading. After the
cooling or pull-down period during which the field heat is removed from the crop, product
is often moved to another facility for storage. This allows each refrigeration system to be
designed for the specific function of pull-down or storage, reducing overall energy usage
and improving equipment effectiveness.
Reading this resource puts into perspective the difficulty of delivering a product to
a customer. For example, typical storage losses for Cassava root under ideal conditions is 6
to 7% per week. Not only must storage temperature be low enough to reduce respiration
effect, but the temperature must typically be above a threshold to avoid other issues, such
as bruising of tubers at temperatures below 50°F.
The temperature dependency of the respiration rate is expressed by Equation 84.
Typically Q10 is between 2.0 and 2.5 for a temperature range from 35 to 77°F.
1
10110
T
CT
R
RQ ( 84 )
The carbon dioxide production and the associated heat load of products is described
by Equations 85 and 86, respectively (Becker and Fricke 1996b; Hardenburg et al. 1986) in
correspondence to Table 56.
respg
p
CO Tfm
_2 ( 85 )

119
2COrespresp mCq
( 86 )
Table 56. Coefficients for Carbon Dioxide Production by Commodities
Skin Mass Transfer Coefficient,
ks (grains/ft2-s-ksi)
Respiration Coefficients
VPL ƒ
(Btu/grain-°Fg)
gresp
Low Mean High
Carrots 314.3 1542.1 3568.5 0.99 3.074 x 10⁻³
1.793
Onions -- 8.778 -- 0.98 2.254 x 10⁻⁵
2.538
Potatoes -- 6.277 -- 0.98 1.050 x 10⁻³
1.769
Sugar beets 89.86 332.1 863.0 0.96 5.280 x 10⁻⁴
1.888
Source: (Becker and Fricke 1996b)
Respiration of product also depends on the atmosphere in which it is stored. Most
root products have significantly lower respiratory activity if the external oxygen
concentration drops below 10%. Examples of the effect of temperature and oxygen on the
respiratory rate are given in Table 57. In addition to removing moisture from the product,
respiration in a properly designed storage facility can be expected to remove dry matter at
1.5% of the products‟ weight.

120
Table 57. Effect of Temperature and Oxygen Concentration on the Respiratory Rate of
Various Commodities
Carbon Dioxide Production (grains/lb-hr)
In Air In 3% O2
32°F 50°F 68°F 32°F 50°F 68°F
Beetroot
Storing .028 .077 .133 .042 .049 .070
Bunching with leaves .077 .154 .280 .049 .098 .224
Carrots
Storing .091 .133 .231 .049 .077 .175
Bunching with leaves .245 .518 .847 .196 .378 .595
Onion .021 .049 .056 .014 .028 .028
Potato
Main crop .042 .028 .042 .035 .021 .028
Immature .070 .140 .280 .070 .126 .210
Source: (Kays 1991)
The handbook offers some rules of thumb for the design of refrigerated storage
systems ranging from ammonia to halocarbon systems. Generally storage systems are
designed with R-30 to 60 for the ceiling, R-20 to 40 for the walls, and R-10 for the floors.
Typical loads are from 0.96 to 1.32 Btu/h-ft3 for refrigerated storage and 1.32 to 2.42
Btu/h-ft3 for shipping docks. A conduction detail specifically outlined by this work is
related to the sun‟s effect on the conduction load. A dark, flat roof may be 76°F warmer
than the outside air temperature whereas a light colored surface would be only 56°F
warmer. Designers add 10 to 20% to the calculated peak load to ensure equipment
performance at worst case conditions.
Refrigerated storage requires adequate ventilation to reduce temperature
stratification or isolation. Most storage facilities are designed to have airflow of 100

121
ft3/min-ton. After the product has reached its storage temperature the airflow is reduced to
20 to 40 ft3/min-ton with relative humidities typically maintained above 90%.
If evaporators for cold storage are oversized they can operate at a higher
temperature. This reduces the amount of moisture removed from the air. It is good practice
to size the coil large enough to operate at 4 to 8°F colder than the return air temperature.
(Chourasia and Goswami 2007)
Harvested products require various steps to properly store them depending on the
product type. Potatoes require their storage facility to quickly pull-down their temperature
from field to storage temperature in order to reduce the respiration losses that occur at
elevated temperatures. During the transient cooling period, product cooling contributes
about two-thirds of the refrigeration load. In this study, various combinations of cooling
rates and loading patterns were investigated to analyze which gave the optimum product
quality and minimum refrigeration load. The best configuration was a half cooling time of
6.72 day (30 days to storage temperature) in combination with a linearly decreasing
product loading rate over 30 days.
Typically, product load calculations are done assuming a constant load over the
entire transient period. This is an appropriate assumption when products are added to the
space in a periodic manner. In the application of cooling products from harvest, this is not
the case, as the actual load profile varies with time (Cleland 1983).
Potatoes are harvested, cured for 1 day, and then cooled to a final temperature of
71.6 to 77°F. A commercial potato cold store has a capacity of 4000 tons of which 3 to 4%
is typically added every day during the harvest season. Once at storage temperature, they
are stored anywhere from 1 to 8 months.

122
Research performed by Devres and Bishop (Devres and Bishop 1995) used the half
cooling to represent the product-pull down rate. Chourasia et al. used Equation 79 to define
the product temperature at any given time. Moisture loss, which is detrimental to the
product, is defined by Equation 87 and heat loss due to this moisture loss is defined by
Equation 88.
CCpini
p
Tt
tTTT
2/1
15.0lnexp_ ( 79 )
hr
s
ft
ing
aRHApkm c
p
p
wsatmw
3600144100 2
2
( 87 )
fgw
et hmq
( 88 )
Cooling rates analyzed are listed in Table 58. Loading rates were either linearly
decreasing over a range of 10 to 30 days, constant over 30 days, or a replication of an
actual product load from a cold store. The actual loading pattern was primarily a linearly
decreasing profile to the 20th
day (415 to 20 tons per day) after which it was mostly
constant at 15 tons per day.
Table 58. Cooling and Rates Analyzed
Cooling Rate
Test or Simulation Pull-Down
Period (days)
t1/2 (days)
C-1 10 2.24
C-2 20 4.48
C-3 30 6.72
Devres and Bishop (Devres and Bishop 1995) 10
Chourasia, product near surface (Chourasia et al. 2003) 5
Source: (ASHRAE 1998)
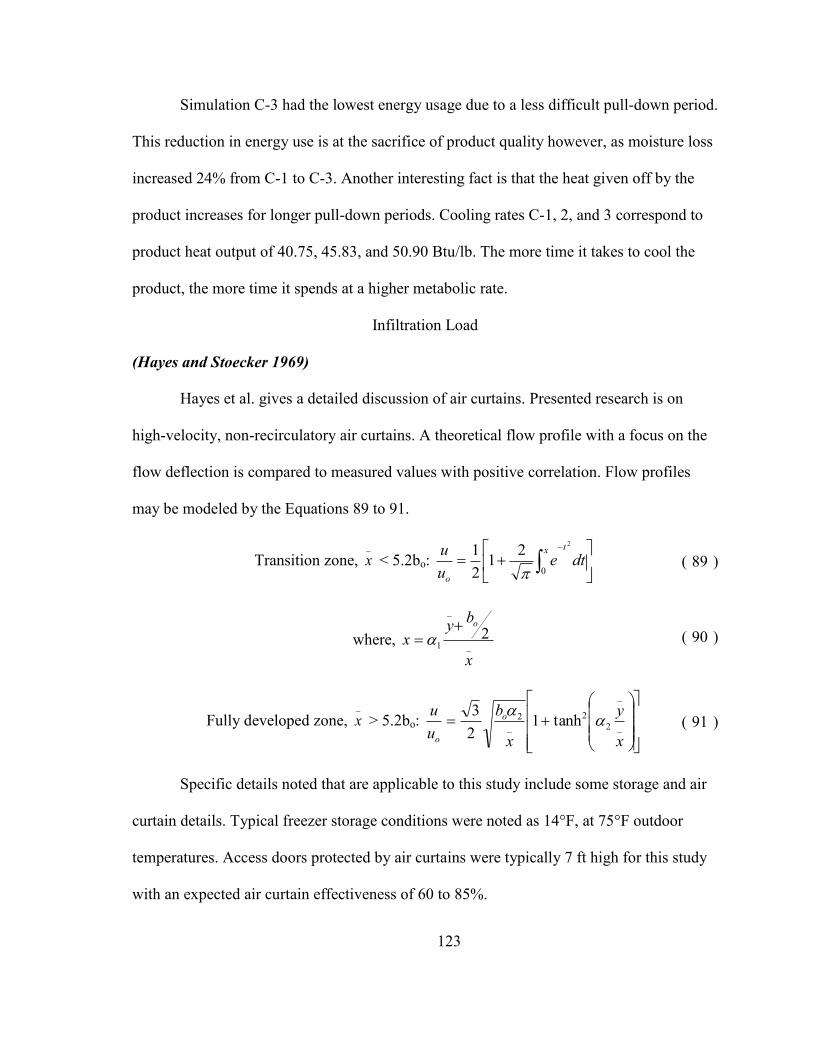
123
Simulation C-3 had the lowest energy usage due to a less difficult pull-down period.
This reduction in energy use is at the sacrifice of product quality however, as moisture loss
increased 24% from C-1 to C-3. Another interesting fact is that the heat given off by the
product increases for longer pull-down periods. Cooling rates C-1, 2, and 3 correspond to
product heat output of 40.75, 45.83, and 50.90 Btu/lb. The more time it takes to cool the
product, the more time it spends at a higher metabolic rate.
Infiltration Load
(Hayes and Stoecker 1969)
Hayes et al. gives a detailed discussion of air curtains. Presented research is on
high-velocity, non-recirculatory air curtains. A theoretical flow profile with a focus on the
flow deflection is compared to measured values with positive correlation. Flow profiles
may be modeled by the Equations 89 to 91.
Transition zone, _
x < 5.2bo:
dteu
u tx
o
2
0
21
2
1
( 89 )
where, _
_
12
x
by
x
o ( 90 )
Fully developed zone, _
x > 5.2bo:
_
_
2
2
_
2 tanh12
3
x
y
x
b
u
u o
o
( 91 )
Specific details noted that are applicable to this study include some storage and air
curtain details. Typical freezer storage conditions were noted as 14°F, at 75°F outdoor
temperatures. Access doors protected by air curtains were typically 7 ft high for this study
with an expected air curtain effectiveness of 60 to 85%.
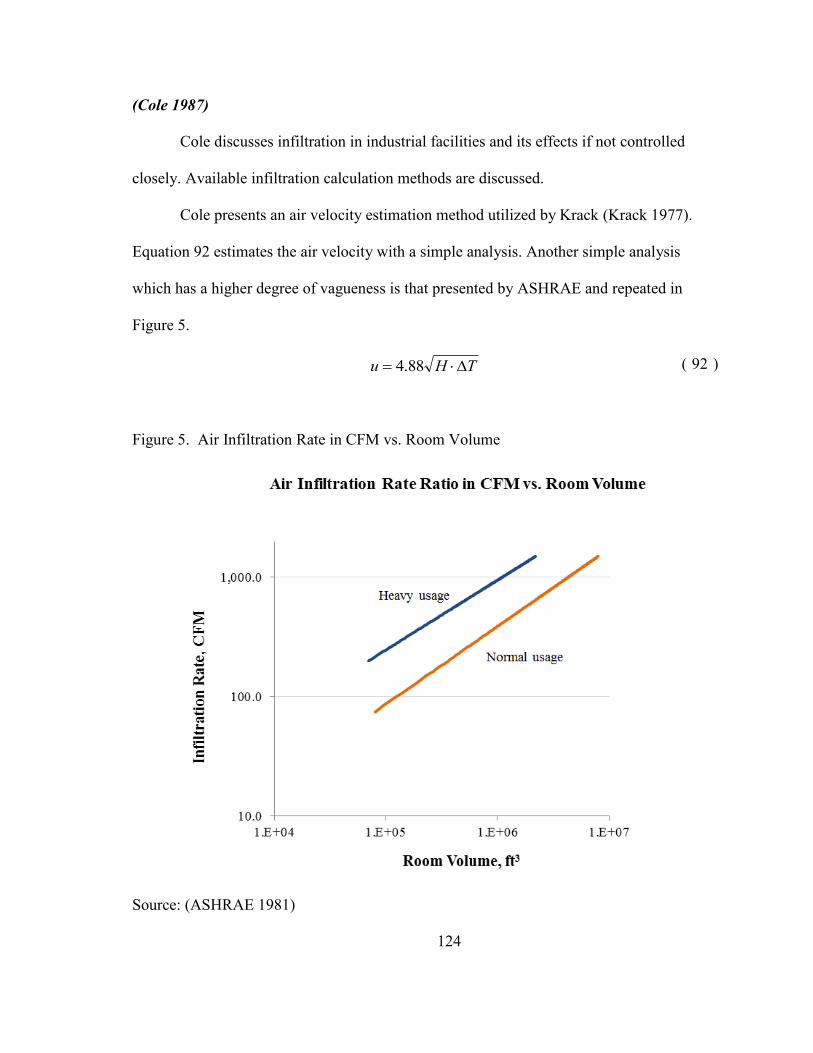
124
(Cole 1987)
Cole discusses infiltration in industrial facilities and its effects if not controlled
closely. Available infiltration calculation methods are discussed.
Cole presents an air velocity estimation method utilized by Krack (Krack 1977).
Equation 92 estimates the air velocity with a simple analysis. Another simple analysis
which has a higher degree of vagueness is that presented by ASHRAE and repeated in
Figure 5.
THu 88.4 ( 92 )
Figure 5. Air Infiltration Rate in CFM vs. Room Volume
Source: (ASHRAE 1981)

125
Gosney and Olama (Gosney and Olama 1975) developed a mathematical expression
(Equations 18 and 19) for infiltration using data gathered with table top testing. The scale
models utilized carbon dioxide and air to represent the differing densities whose exchange
was monitored through the scaled opening.
2/3
3/1'
2/1
2/1
inf
1
2113600221.0
gHA
hr
sm
C
HCss ( 18 )
H
C
' ( 19 )
Jones et al. (Jones et al. 1983) studied the same phenomenon but with a focus on the
latent load. Through the use of full scale laboratory tests and applying assumptions of a
rectangular opening and equivalent mass flows, the mass flow of water vapor was defined
according to Equation 93.
2/3
2/1
36001733.0 WHT
T
T
Tg
hr
sm
H
C
C
H
Cwv
( 93 )
Cole combined the work of Gosney, Olama, and Jones to determine the total flow
of air and moisture (Equation 94) and the associated load (Equation 95).
hr
sWH
T
T
T
Tgm
H
C
C
H
c
ss 36001
11733.0 2/3
2/1
( 94 )
CH
H
C
C
H
c
hhHT
T
T
Tq
2/3
2/1
1295.0'
( 95 )
In a discussion of the equations defining infiltration, it is noted that the height of the
opening is the most significant geometric parameter. The width is only a scaling parameter
whereas the height has an exponential relationship with the load. This fact should be

126
considered in the design and installation details on doorways to be used for refrigerated
storage. Application of the above equations to the actual site is discussed. The duration of
the door being open and the amount of disruption incurred by the air movement affects the
percentage of air exchange that actually occurs. Cole presents a figure (Figure 6) from an
undisclosed source that presents the transient effects of air flow.
Figure 6. Steady State vs. Transient Heat Gain Through an Open Door Assuming 10 ft
High by 6.6 ft Wide
Source: (Cole 1987)
Gosney and Olama (Gosney and Olama 1975) derived a time related factor, ф,
which varies based on the duration and frequency of door openings and physical
127
parameters such as door height and room temperature. This parameter is displayed
graphically in Figure 7 and its definition is repeated below in Equations 28, 29, and 30.
1.0
3565.0
0112.01 f
o
NN
( 28 )
d
open
dopenft
tftN ( 29 )
2H
vtN
open
o
( 30 )
Figure 7. Cyclical Door Operation Correction Factor vs. Frequency of Operation for a
Freezer with a 8.2 ft High Door Held at -10°F
Source: (Cole 1987)

128
Additional factors effecting infiltration include internal partitioning (Pham and
Oliver 1983) and doorway traffic, which is analyzed by many researchers. Internal
partitioning is a function of room geometry and product stacking around the door.
Effectively, air flow from the refrigerated space is restricted resulting in the infiltration
load dropping off after several minutes of a door being open. Traffic through a doorway
reduces infiltration by disrupting the air flow. One traffic passage per minute reduces
infiltration by 15%. The lag time that it takes the flow to re-establish is a function of many
variables and ranges from 15 seconds to 1 minute. Practitioners have observed these
theories in action for continuously open (20 minutes or more) unprotected doorways. The
realized load is less than the calculated value due to doorway traffic and partitioning.
Cole summarizes research on door infiltration reduction, including information on
air and strip curtains presented by Pham and Oliver (Pham and Oliver 1983). Non-
recirculating vertical air curtains have been shown to be 79% efficient whereas strip
curtains are 91% efficient. Traffic passing through a strip curtain will reduce efficiency by
up to 50%, but this is still an improvement on an open door‟s infiltration.
(Chen et al. 1999)
Chen performed testing on the infiltration through freight doors used on industrial
refrigeration facilities. Door testing included rapid-roll doors, strip curtains, crack
infiltration, and the effect of forklift traffic on infiltration (Chen et al. 1999).
Chen modifies an equation presented by Tamm to define infiltration (Tamm 1965)
and utilizes an equation by Downing to approximate the effect of door protective device
effectiveness (Downing and Meffert 1993) (Equations 96 through 100).

129
FVFFFF
s
s
sgHHWV ATtPTamm
1min
601
1267.0
33/1inf ( 96 )
nt
tr
t
V
VF
( 97 )
tot
bcado
t
tttNF
5.0 ( 98 )
100/100 EFP ( 99 )
1001
u
p
V
VE ( 100 )
Tamm‟s equation was validated by Longdill by testing it on a 3.94 x 5.25 ft high
doorway in a 6250 ft3 cold room (Longdill et al. 1974). Pham and Oliver utilized a slightly
modified version of Tamm‟s equation with infiltration testing performed on 6250 to
1306640 ft3 rooms with room heights from 12.5 to 69.6 ft (Pham and Oliver 1982; Pham
and Oliver 1983). Door sizes tested ranged from 3.54 x 6.50 ft to 9.84 x 11.81 ft.
Single-plastic strip curtain effectiveness reported by numerous authors is noted as
follows:
86-96% (Downing and Meffert 1993)
93% (Pham and Oliver 1983)
92 to 96% (Hendrix et al. 1989)
93% with rapid roll doors (Downing and Meffert 1993)
32 ±45% increase in infiltration due to one forklift entry and exit per minute
(Downing and Meffert 1993)
130
79 to 85% with rapid roll doors and one forklift entry/exit per minute. The
door was fully open for 6 to 10 seconds and took 1 to 2 seconds to open or
close for each traffic pass. (Downing and Meffert 1993)
Pham and Oliver also investigated the effect of forklift traffic on an unprotected
doorway. With one forklift entry and exit per minute, infiltration was decreased by 21%
compared to an open door with no traffic.
Chen‟s testing was performed on a single-story refrigerated storage facility with
dimensions of 78.7 x 118.1 x 23.0 ft. It operates between -4 and 3.2°F and is constructed of
7.87 inches of polystyrene insulated sandwich panels attached to a steel portal frame. The
tested rapid-roll door was 7.87 x 10.83 ft in size, cycling open in 1.7 seconds and closing
over a period of 3.1 seconds. The typical open period during passage of a forklift is 16.4
seconds when the door actuation is controlled by sensors. Tests were performed with door
open times of 10, 20, 30, 40, and 50 seconds, with forklift traffic at 8 to 150 passes/hr.
Research on the lag time for flow through an open door to reach steady state
includes work done by Azzouz and Duminil, who found that only 1.5 seconds are needed
to reach steady state flow for a 9.19 x 9.84 ft doorway (Azzouz and Duminil 1993). This
result was verified by Chen‟s testing, as it was determined that the lag time is less than 2
seconds.
Effectiveness values developed based on the research are presented in Table 59.

131
Table 59. Effectiveness of Different Infiltration Reduction Techniques on Rapid Roll
Doors
% Effectiveness
No protection 0%
No protection with traffic at 1 entry/exit per minute 44%
Strip curtain protection (good condition) 92%
Strip curtain protection (one strip missing) 75%
Strip curtain protection with traffic at 1 entry/exit per minute 62%
Door closed (air-tightness) 99%
Source: (Chen et al. 1999)
(Reindl and Jekel 2008)
Reindl discusses the use of CO2 tracer gas for measuring infiltration in refrigerated
spaces and its application to blast freezers. Blast freezers operate at very low temperatures
ranging from -45 to -20°F. The opportunity of reducing freezer energy use by better
understanding the infiltration rate has great potential (Reindl and Jekel 2008).
Previously noted infiltration rates for blast freezing systems range from 0.7 to 2.5
air changes per hour. For the facility tested in this article, the rate was calculated at an
average of 1.58 air changes per hour, which is considered above an acceptable level.
Review of Commercial Refrigeration
Information gathered from 46 sources is presented in this section, all referring
primarily to commercial applications of refrigeration. In this work, commercial
refrigeration is defined as refrigeration systems serving an end user in a retail setting.
Examples of this type system include a walk-in freezer at a grocery store, a display case at
a gas station, or a refrigerated coffin case at a movie theatre.
132
Literature is organized based on its content and is categorized into seven groups,
including refrigeration system design, general load details, ground temperature, evaporator
application and defrost, lighting loads, infiltration loads, and ambient and box operating
conditions.
Refrigeration System Design
(Knudsen and Pachai 2004)
The Technical University of Denmark did an energy comparison between CO2
cascade systems and R404a systems (Knudsen and Pachai 2004). Four supermarkets were
instrumented for data collection, including two conventional plants and two cascade plants.
Data collected includes outside conditions, power consumption, compressor and condenser
capacity utilization, suction and discharge temperature, expansion valve operation,
superheat at the evaporator, and air temperature in the refrigerated space. The study
concluded that cascade systems have power usage similar to a state of the art conventional
system.
Information presented in the report that pertains to this investigation included walk-
in box sizes. Medium temperature room volumes in the test stores were given as 1230, 844,
1117, and 1337 ft3. Low temperature room volumes in the test stores were given as 343,
189, 421, and 309 ft3.
(Walker 1992)
The field of commercial refrigeration is always trying to improve the efficiency of
its refrigeration systems. Walker field tested a Safeway store in Menlo Park, CA and then
applied different strategies of reducing energy usage (Walker 1992). Items utilized to
reduce energy usage include high efficiency display case fan motors, anti-sweat heater

133
controls, and vinyl strip curtains on doors (6 in wide vinyl strips connected above the door
and hanging down to the bottom of the door). Both conventional and multiplex systems
were tested. Test conditions are listed below:
Conventional Test Conditions:
Outside Dry Bulb: 60.6°F average, 52.8°F minimum, 68.3°F maximum
Outside Dew Point: 45.1°F average, 34.4°F minimum, 51.9°F maximum
Outside Wet Bulb: 52.3°F average, 45.8°F minimum, 58.4°F maximum
Inside Dry Bulb: 73.6°F average, 71.7°F minimum, 74.4°F maximum
Inside Dew Point: 44.9°F average, 38.5°F minimum, 49.2°F maximum
Multiplex Test Conditions:
Outside Dry Bulb: 62.4°F average, 54.7°F minimum, 68.4°F maximum
Outside Dew Point: 48.2°F average, 44.7°F minimum, 54.7°F maximum
Outside Wet Bulb: 54.7°F average, 50.3°F minimum, 57.8°F maximum
Inside Dry Bulb: 72.7°F average, 71.3°F minimum, 74.9°F maximum
Inside Dew Point: 45.7°F average, 43.1°F minimum, 47.5°F maximum
Conventional (stand-alone) refrigeration systems utilize a single semi-hermetic
compressor for each display case circuit or walk-in box. The stand-alone system includes
all the necessary refrigerant piping, control valves, receiver, electrical components, and air-
cooled condenser mounted on the same base or skid. Head pressure is monitored by a
liquid line thermostat set to a 90°F minimum condensing temperature and controlled by
cycling the fan used by the condenser.

134
For medium and high temperature fixtures, off-cycle defrost is commonly used
whereas for very low and low temperature applications, electric defrost is employed.
A wealth of information is presented on the test store walk-in boxes (Table 60), as
is information on the compressor selected for the store.
Table 60. Refrigerated Walk-in Boxes in the Test Store
Description Floor Area (ft2) Design Load
(Btu/h)
Evaporator
Temperature
(°F)
Discharge Air
Temperature
(°F)
Meat cooler 480 26300 20 30
Produce cooler 437 21750 31 40
Dairy cooler 540 21750 27 36
Meat prep 800 48000 29 50
Fish cooler 96 7800 20 30
Meat holding 120 9200 21 30
Deli box 70 6275 26 37
Bakery retard 80 6400 27 36
Freezer 500 29900 -22 -12
Bakery freezer 81 7100 -22 -12
Source: (Walker 1992)
In addition to an analysis of refrigeration loads for low and very low temperature
display cases, Walker presents an analysis of refrigeration loads for low temperature walk-
in boxes. Results are presented in Table 61.
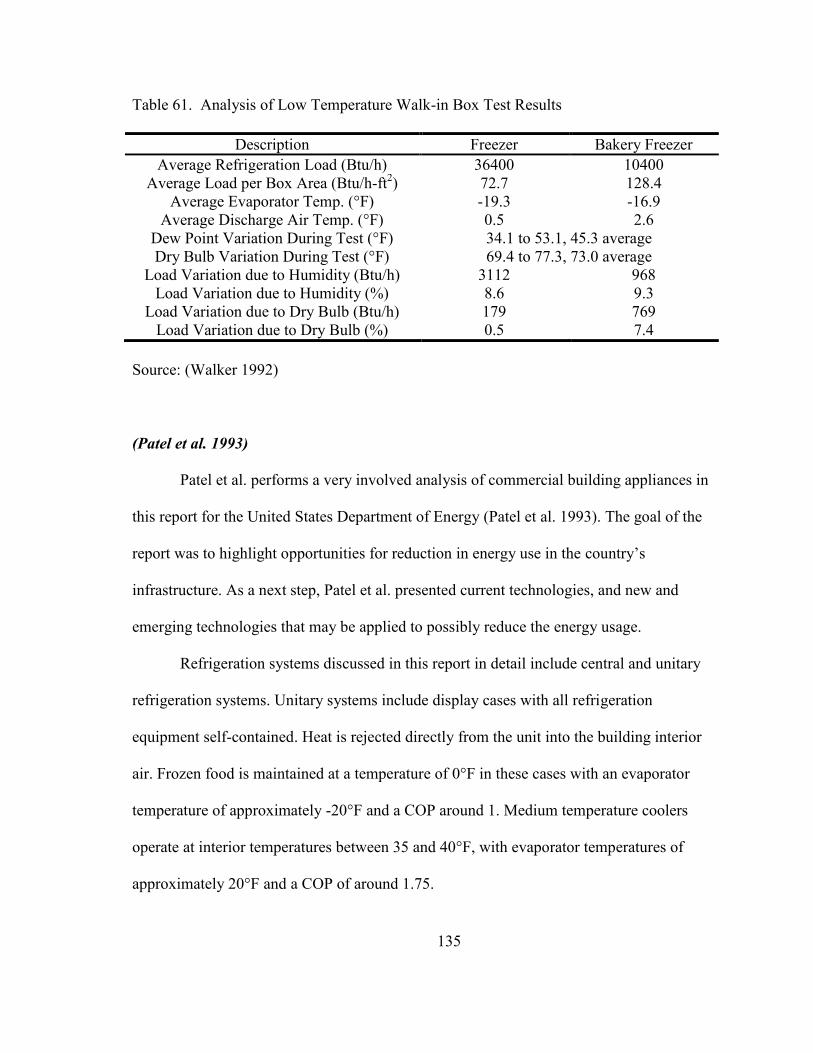
135
Table 61. Analysis of Low Temperature Walk-in Box Test Results
Description Freezer Bakery Freezer
Average Refrigeration Load (Btu/h) 36400 10400
Average Load per Box Area (Btu/h-ft2) 72.7 128.4
Average Evaporator Temp. (°F) -19.3 -16.9
Average Discharge Air Temp. (°F) 0.5 2.6
Dew Point Variation During Test (°F) 34.1 to 53.1, 45.3 average
Dry Bulb Variation During Test (°F) 69.4 to 77.3, 73.0 average
Load Variation due to Humidity (Btu/h) 3112 968
Load Variation due to Humidity (%) 8.6 9.3
Load Variation due to Dry Bulb (Btu/h) 179 769
Load Variation due to Dry Bulb (%) 0.5 7.4
Source: (Walker 1992)
(Patel et al. 1993)
Patel et al. performs a very involved analysis of commercial building appliances in
this report for the United States Department of Energy (Patel et al. 1993). The goal of the
report was to highlight opportunities for reduction in energy use in the country‟s
infrastructure. As a next step, Patel et al. presented current technologies, and new and
emerging technologies that may be applied to possibly reduce the energy usage.
Refrigeration systems discussed in this report in detail include central and unitary
refrigeration systems. Unitary systems include display cases with all refrigeration
equipment self-contained. Heat is rejected directly from the unit into the building interior
air. Frozen food is maintained at a temperature of 0°F in these cases with an evaporator
temperature of approximately -20°F and a COP around 1. Medium temperature coolers
operate at interior temperatures between 35 and 40°F, with evaporator temperatures of
approximately 20°F and a COP of around 1.75.

136
Unitary systems operate at an interior ambient dry bulb temperature of 90°F, as the
condenser is located inside, coincident with the ANSI/AHRI Standard 1250/1251 (AHRI
2009b; AHRI 2009c) rating method. Typically, central refrigeration systems serve
numerous applications at the same time, maintaining low, medium, and high temperature
spaces. Major components of the system include the case or walk-in being cooled with
evaporator; the compressor; and the air, water, or evaporative-cooled condenser.
Mechanical components are typically located some distance from the case or walk-in being
cooled, connected by refrigerant piping. Frozen food interior temperatures range from -5 to
0°F, with evaporator temperatures of ranging from -30 to -20°F. Medium temperature
applications use 32 to 45°F air maintained by an evaporator coil operating at 10 to 20°F
SST. Patel specifies that product loading in these units is typically low, as product is
transferred to the case or walk-in at near storage temperature. Standard rating conditions
for outdoor condensers used for central refrigeration systems are at 95°F dry bulb and 75°F
wet bulb. In addition, it is typical for HFCF-22 to be used in both frozen food and
refrigerated food and beverage unitary systems.
Of the total 2.9 Quads (Quad = 1015
Btu) of energy used in commercial buildings,
refrigeration uses 26% (755 x 1012
Btu/yr). Refrigeration energy usage is second only to
water heating, which consumes 33% of the total energy. Drilling down into refrigeration
itself, Patel identified that central refrigeration systems used in supermarkets and for large
walk-in refrigerators and freezers use 490 x 1012
Btu/yr (66% of refrigeration baseline) ,
display cases and other unitary refrigeration equipment use 149 x 1012
Btu/yr (20%), and
ice makers use 105 x 1012
Btu/yr (14%). There is substantial opportunity to reduce the
energy usage in commercial refrigeration. Current technologies are available, according to
137
Patel, that could reduce the energy used by 12% (91 x 1012
Btu/yr). Technologies are
available in other industries which could be modified so that they could be applied to the
refrigeration industry with a potential to reduce energy use by 24% (179 x 1012
Btu/yr). In
the distant future, the researchers predict new technologies could cut energy use by 49%
(373 x 1012
Btu/yr).
Central refrigeration systems are currently being installed with variable capacity
control, floating head pressure control, water cooled condensers, and mechanical
subcooling. There is untapped opportunity to reduce domestic energy usage by 76 x 1012
Btu/yr through application of these technologies across the board.
Technologies that could be quickly adapted to central refrigeration systems to
improve efficiency include fully floating head pressure control and two-stage R22 with
intercooling and subcooling. Application of these technologies has an energy reduction
potential of 72 x 1012
Btu/yr. Unitary system energy use could be reduced by 79 x 1012
Btu/yr if high efficiency compressors, higher insulation levels, increased evaporator and
condenser face area, and water cooled condensers were applied.
Potential advanced technologies for central refrigeration systems and unitary
systems include advanced vapor cycle with multi-stage mechanical cooling and high-
efficiency refrigerants (110 x 1012
Btu/yr potential for central refrigeration systems and 35
x 1012
Btu/yr for unitary systems), reverse Stirling cycle (141 and 25 x 1012
Btu/yr),
advanced absorption cycle (246 and 75 x 1012
Btu/yr).
Refrigeration systems are expected to be operational all year. Due to variations in
load however, the equipment is not always operating. Average runtimes are presented in
Table 62 along with inventory, performance, and energy usage data. The column noted as

138
“U.S. Annual Energy Use” takes into account the conversion to primary energy input at the
power plant using a conversion factor of 11,200 Btu per kWh.
Table 62. Unitary and Centralized System Inventory, Performance, and Energy Usage
Data
System
Type
Building
Type
1990 Est.
Unit
Inventory
Unit
Runtime
(%)
Typ.
Rated
Cap (kW)
Typ.
COP
1990 ADL
Energy
(108 kWh/yr)
U.S. Annual
Energy Use
(1012
Btu/yr)
Unitary Office 275267 50 1.4 1.5 16.9 18.9
Unitary Retail 576985 50 1.4 1.5 35.4 39.6
Unitary Restaurant 540672 50 1.4 1.5 33.2 37.1
Unitary Grocery 274371 70 1.4 1.5 23.6 26.4
Unitary Schools 216089 40 1.4 1.5 10.6 11.9
Unitary Hotel 122839 50 1.4 1.5 7.53 8.44
Unitary Hospitals 93250 50 1.4 1.5 5.72 6.40
Central Restaurant 125280 50 3 1.6 16.5 18.4
Central Supermarket 187000 70 25 1.5 286 320
Central Convenience 90000 70 5 1.8 55.0 61.6
Central Hotel 256170 50 2.5 1.8 28.1 31.4
Central Hospital 129643 50 3 1.6 17.0 19.1
Central Warehouse 225841 50 3.5 1.3 34.6 38.8
Source: (Patel et al. 1993)
(Sezgen and Koomey 1995)
Commercial End-Use Planning System (COMMEND 4.0) is used by Sezgen and
Koomey (Sezgen and Koomey 1995) to forecast refrigeration end uses. In addition to
describing the model, the authors present commercial refrigeration information such as
types of applications, types of refrigeration systems and their performance, and market data
such as equipment market saturation.
Some information included in this report is directly applicable to the current study.
Typical walk-in coolers operate at 35°F box temperature, 20°F evaporating temperature,

139
and 70 Btu/h-ft2 base refrigeration load for storage of meat, dairy, deli meats and cheese,
and produce. Walk-in freezers typically operate at 0°F box temperature with a base
refrigeration load of 90 Btu/h-ft2. Ice cream freezers operate at a case temperature of -12°F
with a -33°F evaporating temperature. Walk-in freezer application in groceries, restaurants,
and warehouses is on the order of 14, 3, and 3 ft2/1000 ft
2 of building, respectively. Walk-
in cooler use is slightly higher at 45, 11, and 3 ft2/1000 ft
2 of building in these same
applications, respectively. Typical walk-in sizes are noted as 50 x 30 x 20 ft tall, 20 x 10 x
8 ft tall, and 250 x 200 x 40 ft tall for grocery, restaurant, and warehouse applications,
respectively.
(Westphalen et al. 1996)
Primary energy use for commercial refrigeration is estimated at 990 trillion Btu
annually, with supermarket refrigeration accounting for 33% of the energy use. Another
18% of commercial refrigeration energy use is from the operation of non-supermarket
walk-ins. This report identifies opportunities for energy efficiency improvements and
estimates savings for successful implementation of the options proposed (Table 63).

140
Table 63. Identified Energy Savings Potential
Savings Potential
(x 1012
Btu) Payback Range (yrs)
Evaporator Fan ECM Motor 85 0.5 to 3
ECM/Variable Speed Compressor 48 2 to 5
High-Efficiency Compressor 39 0.5 to 2
High-Efficiency Fan Blades 30 0.1 to 1
Condenser Fan ECM Motor 25 0.5 to 8
Floating Head Pressure 25 0.3 to 3
Electronic Ballasts 24 1 to 2.5
Non-Electric Anti-sweat 20 1 to 1.5
Thicker Insulation 20 1 to 1.5
Ambient Sub-cooling 12 2 to 11
Hot Gas Defrost 10 1.5 to 3
Liquid-Suction Heat Exchangers 10 4 to 14
Evaporative Condensers 10 --
Anti-sweat Heater Controls 10 2 to 6
Ice Machine Process Improvements 9 1 to 6
Evaporator Fan Shutdown 7 1 to 2
External Heat Rejection 6 7
Economizer Cooling 6 20
Heat Reclaim 3 2 to 5
Defrost Control 3 3
Mechanical Subcooling 2 5
Source: (Westphalen et al. 1996)
Supermarkets utilize numerous types of equipment to keep products at the proper
storage temperature. Display cases and walk-ins operate via a centralized refrigeration
system. Self-contained refrigeration systems are distributed throughout the store to supply
cooling to merchandisers, certain display cases, and refrigerators/freezers similar to those
used in a residence.
Some details presented about walk-ins include the use of 3 or more inches of
insulation (R-27 typical) contained by steel or fiberglass panels. Freezer floors generally
use insulation. Typically these units do not require anti-sweat heaters. Lighting (1 W/ft2) in

141
walk-ins is turned off when they are not being occupied, which can be half of the time.
Evaporator fans typically have shaded-pole motors and operate 100% of the time.
Refrigerants were historically CFC-12 and R-502, but this is transitioning to HFC blends,
such as R404A. Merchandising doors are sometimes placed along one wall to allow
customers to access product in the space. Some walk-ins utilize electric defrost. This
defrost power usage may range from 19.5 to 29 W/ft2. Typical loads for walk-ins include
60 Btu/h-ft2 for coolers and 80 Btu/h-ft
2 for freezers.
In addition to being used in supermarkets, walk-ins are used in restaurants,
convenience stores, cafeterias, food wholesalers, produce and fruit farms, small meat
packagers, small ice cream companies, florists, research laboratories, and warehouses. The
majority of these applications are stand-alone units with a unitary condensing unit
(packaged system). Another option is a split system where the compressor and condenser
are piped together in the field. Ten to sixty percent of these installations reject heat to the
interior of the building as opposed to placing the condenser on the roof.
As part of this study, an analysis was made of a prototypical supermarket with two
medium temperature racks (15°F SST/115°F SDT) and two low temperature racks
(-25°F/110°F SDT). The refrigerant system condensers reject heat to an ambient
temperature of 100°F. The prototypical freezer is 80 ft2 and maintains a space temperature
of -9°F, and the cooler is 24 x 10 ft, maintaining a 35°F space temperature. The cooler has
an oversized compressor to assist in pulling down the temperature of product brought into
the space. A detailed presentation of information on the prototypical freezer and cooler
(Table 64) reveals that they are the same units used in the analysis (Westphalen et al.
1996).
142
Common storage temperatures for products include:
High temperature: 35°F and above for produce and flowers.
Medium temperature: 10 to 15°F for meats and seafood; 15 to 25°F for
dairy, produce, beverage, and meat walk-ins; 25 to 35°F for dairy and
produce walk-ins and prep rooms.
Low temperature: -25 to -15°F for frozen foods.
Very low temperature: -35 to -25°F for ice cream and frozen bakery.
Numerous opportunities to better utilize energy were identified for supermarkets.
Current technologies that can be applied include evaporative condensers, floating or very
low head pressure, ambient or mechanical subcooling, heat reclaim, hot gas defrost,
variable speed motors for fans, liquid-suction heat exchanger, and anti-sweat heater
controls. New technologies include electronic ballasts lighting, high efficiency fan motors,
high efficiency fan blades, increased insulation, coil improvements, and defrost control.
Advanced technologies include alternative refrigerants, engine-driven compressors,
absorption refrigeration, and chemisorption refrigeration.
Opportunities for walk-in cooler and freezer energy reduction are visited separately
from supermarket refrigeration. Current technologies that may be applied include hot gas
defrost and thicker insulation. New technologies include floating head pressure, ambient
subcooling, external heat rejection, economizer cooling, high efficiency fan blades and
motors, electronic ballasts, anti-sweat heater control, and evaporator fan cycling. Advanced
technologies that may be applied include non-electric anti-sweat and demand defrost
control.
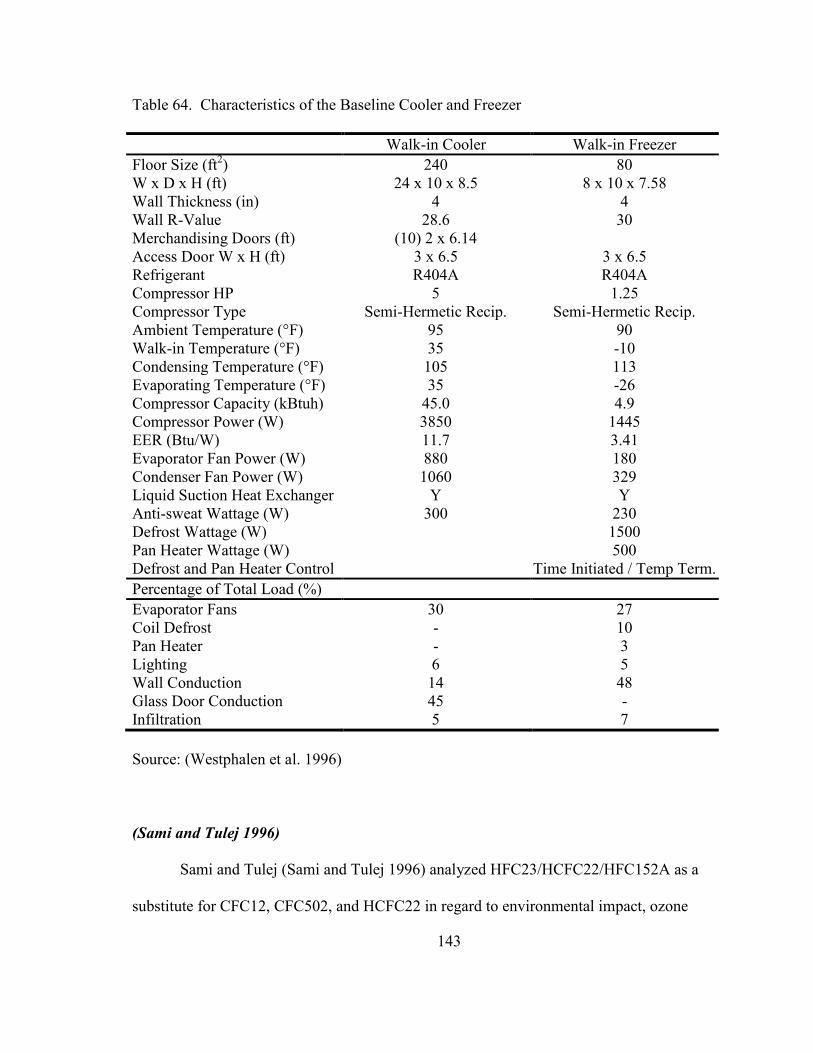
143
Table 64. Characteristics of the Baseline Cooler and Freezer
Walk-in Cooler Walk-in Freezer
Floor Size (ft2) 240 80
W x D x H (ft) 24 x 10 x 8.5 8 x 10 x 7.58
Wall Thickness (in) 4 4
Wall R-Value 28.6 30
Merchandising Doors (ft) (10) 2 x 6.14
Access Door W x H (ft) 3 x 6.5 3 x 6.5
Refrigerant R404A R404A
Compressor HP 5 1.25
Compressor Type Semi-Hermetic Recip. Semi-Hermetic Recip.
Ambient Temperature (°F) 95 90
Walk-in Temperature (°F) 35 -10
Condensing Temperature (°F) 105 113
Evaporating Temperature (°F) 35 -26
Compressor Capacity (kBtuh) 45.0 4.9
Compressor Power (W) 3850 1445
EER (Btu/W) 11.7 3.41
Evaporator Fan Power (W) 880 180
Condenser Fan Power (W) 1060 329
Liquid Suction Heat Exchanger Y Y
Anti-sweat Wattage (W) 300 230
Defrost Wattage (W) 1500
Pan Heater Wattage (W) 500
Defrost and Pan Heater Control Time Initiated / Temp Term.
Percentage of Total Load (%)
Evaporator Fans 30 27
Coil Defrost - 10
Pan Heater - 3
Lighting 6 5
Wall Conduction 14 48
Glass Door Conduction 45 -
Infiltration 5 7
Source: (Westphalen et al. 1996)
(Sami and Tulej 1996)
Sami and Tulej (Sami and Tulej 1996) analyzed HFC23/HCFC22/HFC152A as a
substitute for CFC12, CFC502, and HCFC22 in regard to environmental impact, ozone

144
depletion potential, global warming potential, flammability, toxicity, and performance
through testing of six walk-in facilities located at Springhill and Dorchester, Canada..
Energy performance and system coefficient of performance are compared, specifically.
Springhill walk-ins included a garbage cooler, meat cooler, bakery freezer, and
bakery cooler. The garbage cooler operated with a 9,405 Btu/h capacity evaporator at 30°F
evaporating temperature and 15°F temperature difference, utilizing off-cycle defrost. The
meat cooler operates with a 16,900 Btu/h electric defrost evaporator at 20°F evaporator
temperature. The bakery freezer and cooler each operate with an 8,400 Btu/h electric
defrost evaporator at 20°F evaporator temperature. The Dorchester site walk-ins have no
information given regarding the system type or operation.
(Sand et al. 1997)
This report compared current and alternative refrigeration, air conditioning, and
appliance technologies with regard to the total equivalent warming impact (TEWI), safety,
health concerns, initial and operating costs, regional energy considerations, and ease of
maintenance.
Current supermarket refrigeration systems require a significant amount of
refrigerant, corresponding to high leakage rates. Supermarket alternatives to CFCs and
HCFCs include mixtures of HFCs. Direct expansion is the traditional design, with
alternatives available such as secondary loop and distributed systems. Secondary loop
systems pump cold brine to display cases. This system reduces refrigerant charge (down to
10% of a conventional system in some cases), reduces refrigerant leakage rate, and isolates
refrigerant from the sales floor. Distributed systems break the system into smaller units that
serve cases in close proximity.
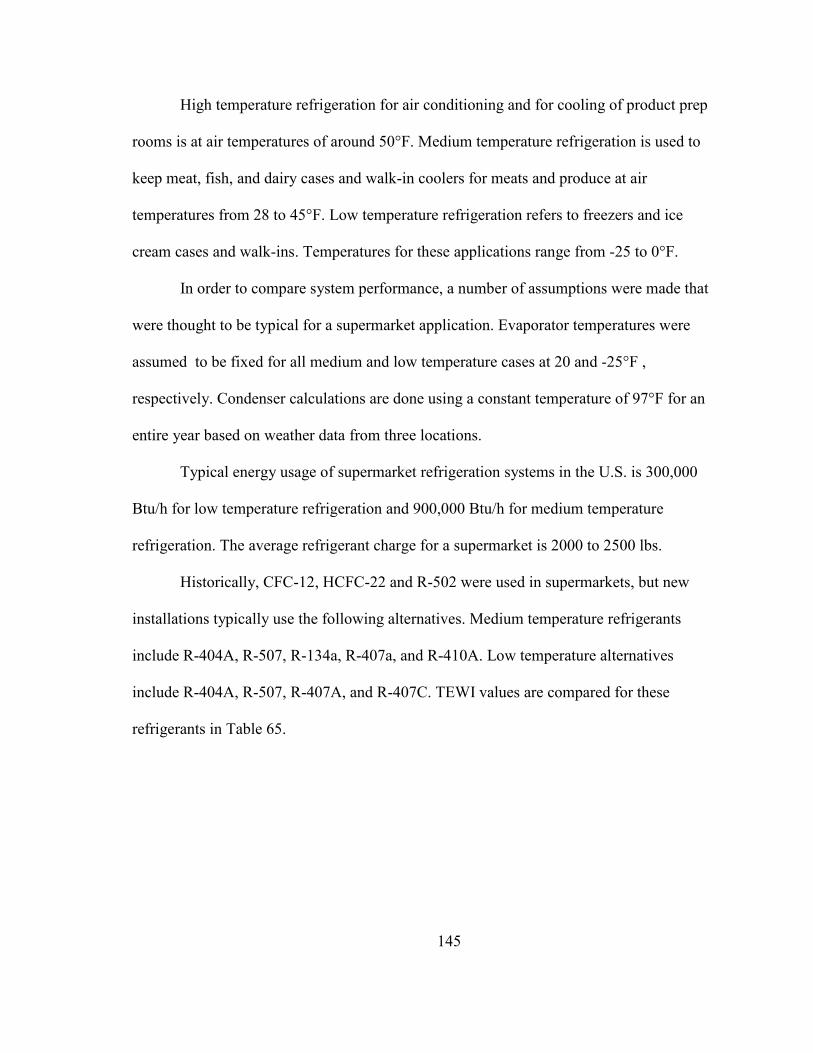
145
High temperature refrigeration for air conditioning and for cooling of product prep
rooms is at air temperatures of around 50°F. Medium temperature refrigeration is used to
keep meat, fish, and dairy cases and walk-in coolers for meats and produce at air
temperatures from 28 to 45°F. Low temperature refrigeration refers to freezers and ice
cream cases and walk-ins. Temperatures for these applications range from -25 to 0°F.
In order to compare system performance, a number of assumptions were made that
were thought to be typical for a supermarket application. Evaporator temperatures were
assumed to be fixed for all medium and low temperature cases at 20 and -25°F ,
respectively. Condenser calculations are done using a constant temperature of 97°F for an
entire year based on weather data from three locations.
Typical energy usage of supermarket refrigeration systems in the U.S. is 300,000
Btu/h for low temperature refrigeration and 900,000 Btu/h for medium temperature
refrigeration. The average refrigerant charge for a supermarket is 2000 to 2500 lbs.
Historically, CFC-12, HCFC-22 and R-502 were used in supermarkets, but new
installations typically use the following alternatives. Medium temperature refrigerants
include R-404A, R-507, R-134a, R-407a, and R-410A. Low temperature alternatives
include R-404A, R-507, R-407A, and R-407C. TEWI values are compared for these
refrigerants in Table 65.
146
Table 65. TEWI for Low and Medium Temperature Direct Expansion Refrigerant System
in North America
TEWI
Direct Expansion Distributed Secondary Loop
Low Temperature
R-404A 3,923,600 2,130,200 2,207,200
R-507 3,922,711 2,130,200 2,207,200
R-407A 3,112,100 2,107,900 2,241,300
R-407C 2,980,000 2,152,000 2,301,500
R-717 -- -- 2,096,252
Medium Temperature
R-404A 5,497,300 3,430,300 3,422,400
R-507 5,427,500 3,356,100 3,345,500
R-134a 4,161,400 3,392,700 3,473,800
R-410A 4,125,900 3,196,700 3,260,100
R-717 -- -- 3,253,100
Source: (Sand et al. 1997)
(Kimber 1998)
Nevada Energy Control Systems, Inc. has configured a product to control
evaporator operation, reducing energy costs while maintaining system cooling
performance. Kimber (Kimber 1998) conducted field testing of installations (listed below)
of these controllers to determine the energy usage improvement due to their
implementation.
• Safeway Store #309, Fremont, CA
• Trader Joe‟s Store #70, Sacramento, CA
• McDonald‟s Restaurant, Stockton, CA
• Walnut Creek School District, Walnut Creek, CA
• Cameron Park Liquors, Cameron Park, CA
147
Provided information included average daily energy consumption of the evaporator
fans and the compressor, the number and duration of personnel door openings, the ambient
temperature and humidity inside and outside of the walk-in box, and the compressor duty
cycle data.
(Walker 2001)
Walker discusses the currently accepted refrigeration system design, and its
drawbacks. He discusses advanced systems and their benefits and drawbacks. A low charge
refrigeration system which is integrated with the HVAC system is analyzed and compared
to currently available systems. Comparisons are made on a basis of energy consumption
and total equivalent warming impact (TEWI). The combined energy usage of the store
refrigeration and HVAC systems are also compared, framing the full picture of the
efficiency of a refrigeration system.
Supermarkets are the largest commercial electricity end-user, with a typical store
(35,000 ft2) accounting for 2 million kWh annually. Of this 2 million kWh, a significant
portion is due to refrigeration, comfort cooling, and heating (10-20 % of the store energy
usage is HVAC). Typically, multiplex systems are utilized to gain the optimum efficiency,
flexibility, and reliability. With a heightened focus on the total environmental impact of
refrigerated systems, some supermarkets have moved toward advanced systems, which use
less refrigerant but often sacrifice energy efficiency, including low-charge multiplex,
secondary loop, distributed, and self-contained.
There is significant opportunity to improve current advanced system designs to
improve energy efficiency. Shorter suction lines on secondary loop, distributed, and
advanced self-contained systems can translate into lower compressor power usage. Low
148
head pressure operation to reduce energy usage (Walker 2001) may be achieved with
distributed and self-contained systems utilizing scroll compressors, and self-contained
systems with capacity control.
HVAC system operation and energy usage is directly related to the type of
refrigeration system that is being utilized. During space cooling, the refrigeration system is
removing heat from the supermarket with exception of the heat convected from the
equipment in the machine room. Space heating is the dominant HVAC load because the
refrigeration equipment in the store continues to operate, combatting the space heating.
Reclaiming waste heat (14-20%) from the refrigeration system may be done by
desuperheating discharge gas. This is typically used for water or space heating. Additional
reduction in space heating load may be achieved by utilizing a water source heat pump to
claim the full potential of the refrigeration system heat rejection and apply it to space
heating.
Walk-ins in supermarkets are constructed of pre-fabricated panels that are field
assembled. Doors are wide enough to allow pallet jack passage, which is typically
accompanied by the door being left open for the loading or unloading period. Infiltration is
the largest load for these units, combated in some cases through the use of vinyl strips hung
in the doorways. In a supermarket, walk-ins are typically used to hold a specific product
type. Meat and produce coolers are also used to prepare food for display.
Multiplex refrigeration uses centralized racks of compressors to serve various cases
and walk-ins. Low temperature racks typically operate at -20°F SST, medium temperature
racks typically operate at 20°F, and satellite compressors are used to serve off-temperature
refrigeration. Each rack is composed of three to four compressors, allowing for capacity

149
control, for reduced energy use and more stable operating conditions. Reciprocating
compressors allow operation at a saturated discharge temperature of 70°F. Utilizing scroll
compressors would allow operation at discharge temperatures of 40 and 60°F for low and
medium temperature refrigeration, respectively, for a potential compressor energy savings
of 10% (Walker and Deming 1989) when coupled with condenser bypass controls which
also reduce the required refrigerant charge (up to 1/3 reduction in charge).
Compressors are typically reciprocating, semi-hermetic due to relative reliability
and energy efficiency. Scroll compressors are typically only used for distributed systems
where noise levels are a concern. Condensers are air cooled in most cases, 8 to 10 fpi with
a 500 fpm face-velocity, and use multiple fans for capacity control. Evaporative-cooled
condensers offer reduction in energy use but come with disadvantages of water treatment
and consumption.
Distributed systems are composed of compressor cabinets with racks of scroll
compressors which are configured to allow capacity control. This system‟s benefits include
better saturated suction temperature matching, reduced pressure losses through close
coupled equipment (SST at 1 to 2°F lower than the saturated temperature at the evaporator,
compared to 2 to 4°F for a multiplex system; and return gas rise of 5 to 15°F, compared to
40 to 65°F for a multiplex system) , reduced refrigerant charge (810 to 900 lb per store),
and lower minimum condensing temperature of 55 to 60°F. A store-encompassing
glycol/water (25 to 33% glycol) loop (300 to 350 gpm) removes heat from each distributed
cabinet. Evaporative fluid coolers are often used with this type system to help overcome
the additional temperature differential added to the water loop by heat exchange from the
distributed refrigeration cycles.
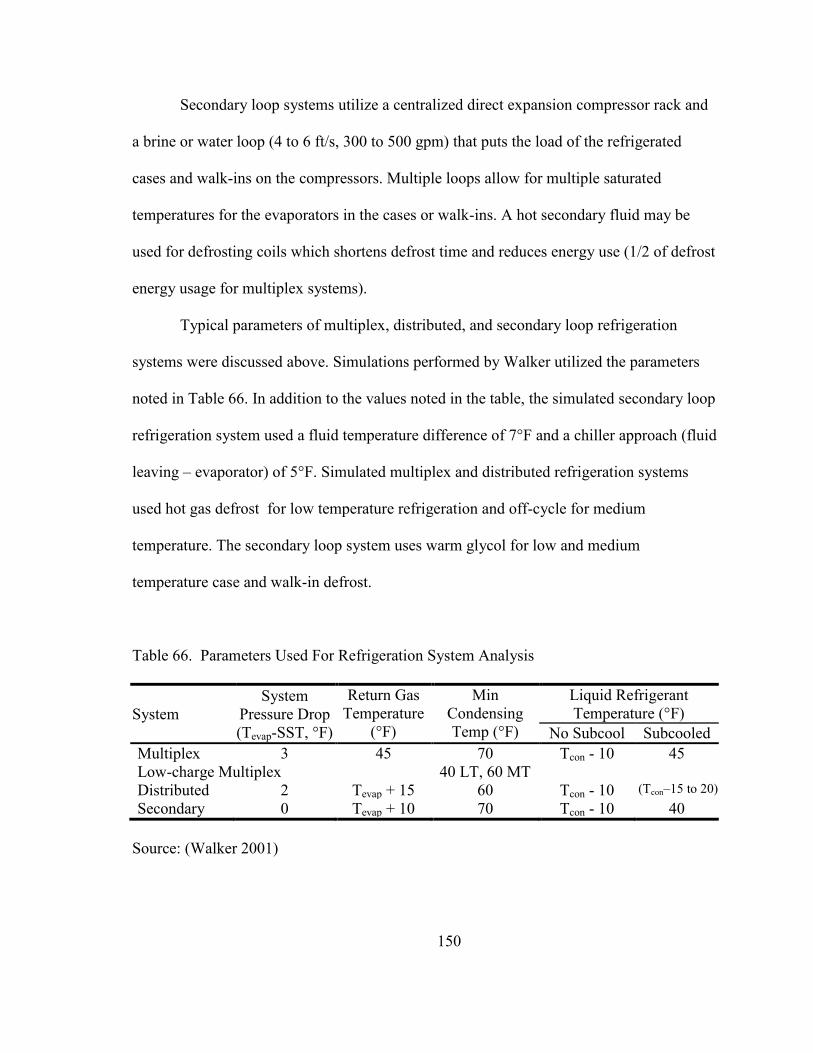
150
Secondary loop systems utilize a centralized direct expansion compressor rack and
a brine or water loop (4 to 6 ft/s, 300 to 500 gpm) that puts the load of the refrigerated
cases and walk-ins on the compressors. Multiple loops allow for multiple saturated
temperatures for the evaporators in the cases or walk-ins. A hot secondary fluid may be
used for defrosting coils which shortens defrost time and reduces energy use (1/2 of defrost
energy usage for multiplex systems).
Typical parameters of multiplex, distributed, and secondary loop refrigeration
systems were discussed above. Simulations performed by Walker utilized the parameters
noted in Table 66. In addition to the values noted in the table, the simulated secondary loop
refrigeration system used a fluid temperature difference of 7°F and a chiller approach (fluid
leaving – evaporator) of 5°F. Simulated multiplex and distributed refrigeration systems
used hot gas defrost for low temperature refrigeration and off-cycle for medium
temperature. The secondary loop system uses warm glycol for low and medium
temperature case and walk-in defrost.
Table 66. Parameters Used For Refrigeration System Analysis
System
System
Pressure Drop
(Tevap-SST, °F)
Return Gas
Temperature
(°F)
Min
Condensing
Temp (°F)
Liquid Refrigerant
Temperature (°F)
No Subcool Subcooled
Multiplex 3 45 70 Tcon - 10 45
Low-charge Multiplex 40 LT, 60 MT
Distributed 2 Tevap + 15 60 Tcon - 10 (Tcon–15 to 20)
Secondary 0 Tevap + 10 70 Tcon - 10 40
Source: (Walker 2001)
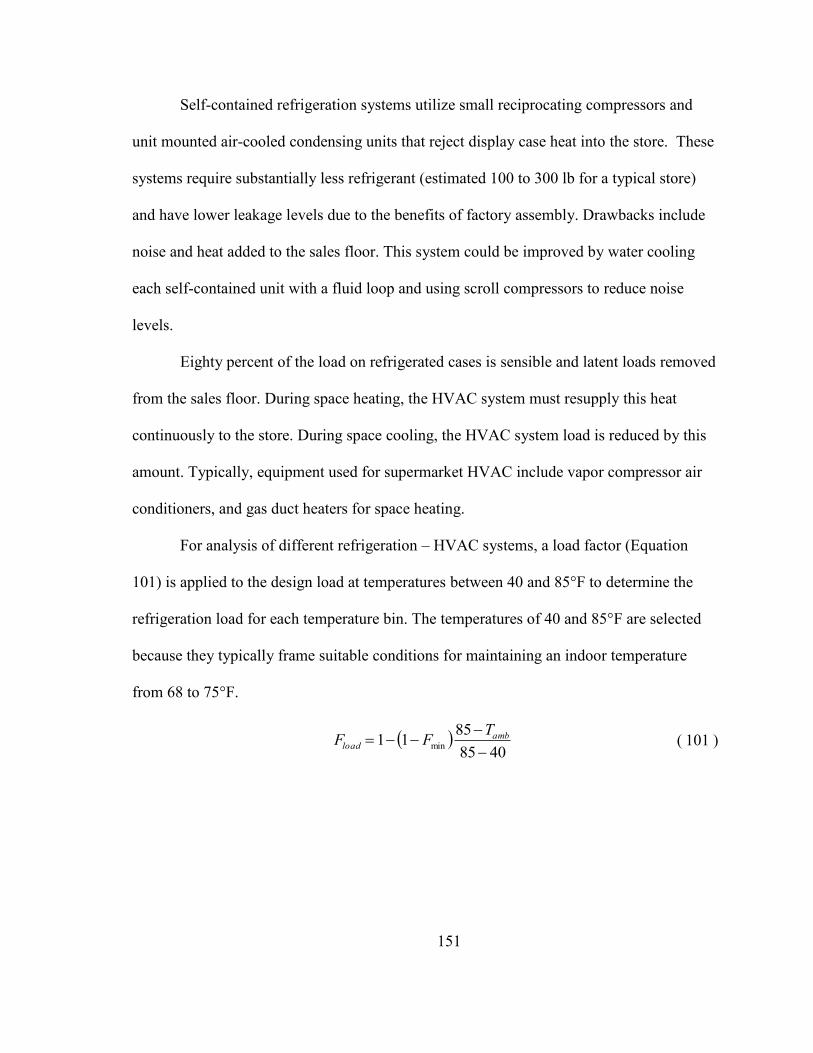
151
Self-contained refrigeration systems utilize small reciprocating compressors and
unit mounted air-cooled condensing units that reject display case heat into the store. These
systems require substantially less refrigerant (estimated 100 to 300 lb for a typical store)
and have lower leakage levels due to the benefits of factory assembly. Drawbacks include
noise and heat added to the sales floor. This system could be improved by water cooling
each self-contained unit with a fluid loop and using scroll compressors to reduce noise
levels.
Eighty percent of the load on refrigerated cases is sensible and latent loads removed
from the sales floor. During space heating, the HVAC system must resupply this heat
continuously to the store. During space cooling, the HVAC system load is reduced by this
amount. Typically, equipment used for supermarket HVAC include vapor compressor air
conditioners, and gas duct heaters for space heating.
For analysis of different refrigeration – HVAC systems, a load factor (Equation
101) is applied to the design load at temperatures between 40 and 85°F to determine the
refrigeration load for each temperature bin. The temperatures of 40 and 85°F are selected
because they typically frame suitable conditions for maintaining an indoor temperature
from 68 to 75°F.
4085
8511 min
amb
load
TFF ( 101 )
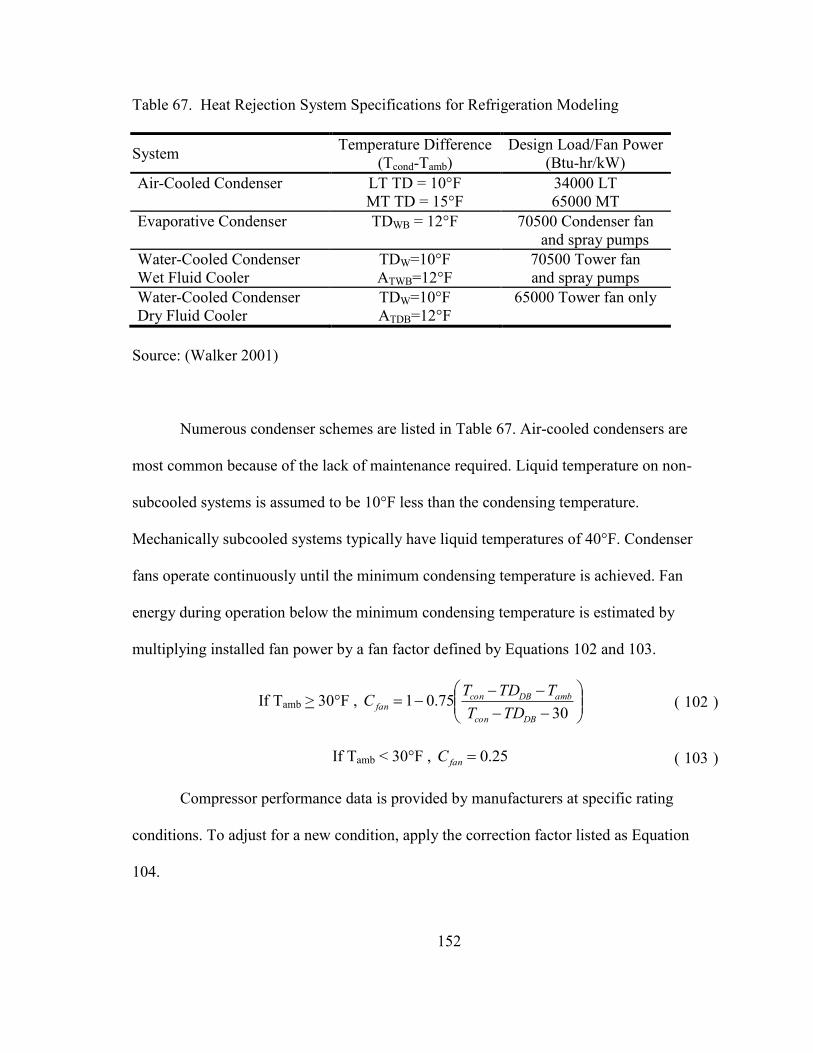
152
Table 67. Heat Rejection System Specifications for Refrigeration Modeling
System Temperature Difference
(Tcond-Tamb)
Design Load/Fan Power
(Btu-hr/kW)
Air-Cooled Condenser LT TD = 10°F 34000 LT
MT TD = 15°F 65000 MT
Evaporative Condenser TDWB = 12°F
70500 Condenser fan
and spray pumps
Water-Cooled Condenser TDW=10°F 70500 Tower fan
Wet Fluid Cooler ATWB=12°F and spray pumps
Water-Cooled Condenser TDW=10°F 65000 Tower fan only
Dry Fluid Cooler ATDB=12°F
Source: (Walker 2001)
Numerous condenser schemes are listed in Table 67. Air-cooled condensers are
most common because of the lack of maintenance required. Liquid temperature on non-
subcooled systems is assumed to be 10°F less than the condensing temperature.
Mechanically subcooled systems typically have liquid temperatures of 40°F. Condenser
fans operate continuously until the minimum condensing temperature is achieved. Fan
energy during operation below the minimum condensing temperature is estimated by
multiplying installed fan power by a fan factor defined by Equations 102 and 103.
If Tamb > 30°F ,
3075.01
DBcon
ambDBconfan
TDT
TTDTC ( 102 )
If Tamb < 30°F , 25.0fanC ( 103 )
Compressor performance data is provided by manufacturers at specific rating
conditions. To adjust for a new condition, apply the correction factor listed as Equation
104.

153
rere
ee
C
Cr
caphh
hhC
,4,1
41
( 104 )
The refrigeration system modeled for the analysis included the cases and walk-ins
listed in Table 69. R404a was used for the low temperature racks in the multiplex system
and all of the systems in the distributed refrigeration system. R22 was used for the medium
temperature racks in the multiplex system. The distributed refrigeration system utilizes 10
different mechanical cabinets, resulting in closer matching of the design saturated suction
temperature. The secondary loop refrigeration system used four loops at -20, 10, 20, and
30°F loop temperatures, each with their own chiller system. Low temperature loops use
Pekasol 50 whereas medium temperature loops use a propylene glycol/water mixture. The
refrigerant used in the centralized mechanical room is R507.
Locations chosen for the refrigeration analysis include Worchester, MA;
Washington, DC; Memphis, TN; and Los Angeles, CA (Table 68). Indoor design
conditions are 75°F and 55% relative humidity. Load considerations applicable to display
cases and walk-ins include conduction, solar roof loading, fan heating, ventilation,
infiltration, occupancy, lighting, and miscellaneous loads. Loads are analyzed in the report
for the macro-store level, with walk-in and case loads developed independently (Table 69).
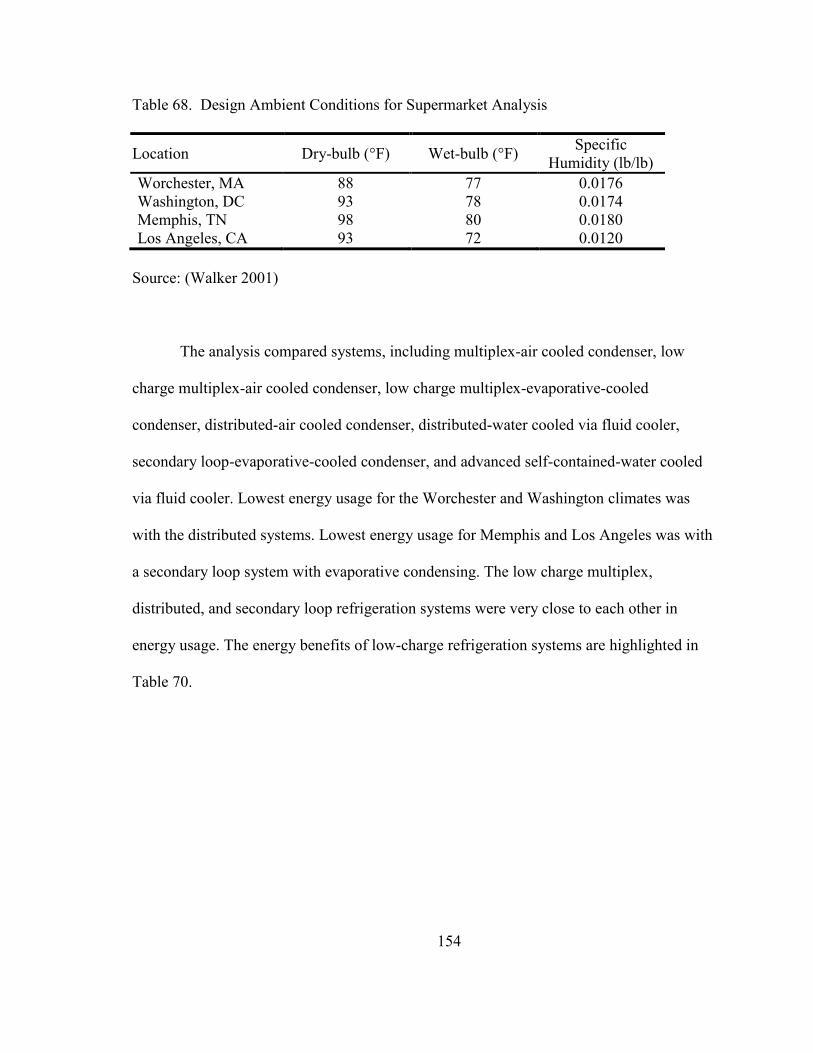
154
Table 68. Design Ambient Conditions for Supermarket Analysis
Location Dry-bulb (°F) Wet-bulb (°F) Specific
Humidity (lb/lb)
Worchester, MA 88 77 0.0176
Washington, DC 93 78 0.0174
Memphis, TN 98 80 0.0180
Los Angeles, CA 93 72 0.0120
Source: (Walker 2001)
The analysis compared systems, including multiplex-air cooled condenser, low
charge multiplex-air cooled condenser, low charge multiplex-evaporative-cooled
condenser, distributed-air cooled condenser, distributed-water cooled via fluid cooler,
secondary loop-evaporative-cooled condenser, and advanced self-contained-water cooled
via fluid cooler. Lowest energy usage for the Worchester and Washington climates was
with the distributed systems. Lowest energy usage for Memphis and Los Angeles was with
a secondary loop system with evaporative condensing. The low charge multiplex,
distributed, and secondary loop refrigeration systems were very close to each other in
energy usage. The energy benefits of low-charge refrigeration systems are highlighted in
Table 70.
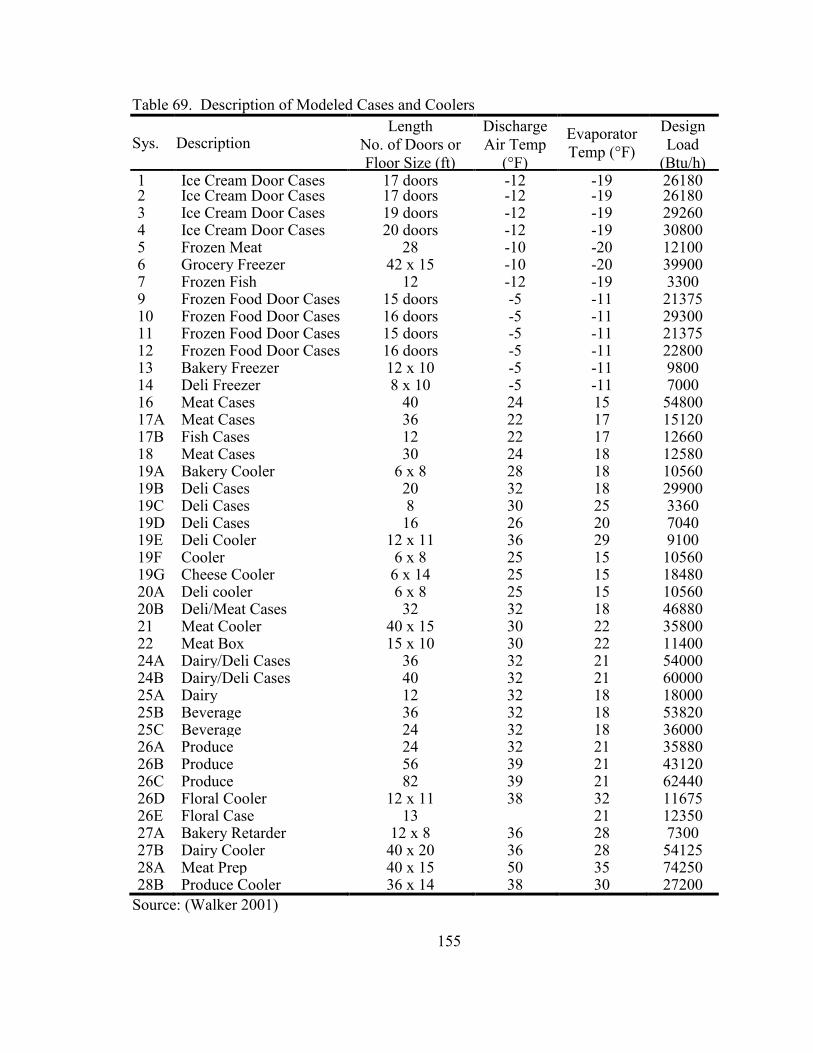
155
Table 69. Description of Modeled Cases and Coolers
Sys. Description Length
No. of Doors or
Floor Size (ft)
Discharge
Air Temp
(°F)
Evaporator
Temp (°F)
Design
Load
(Btu/h) 1 Ice Cream Door Cases 17 doors -12 -19 26180 2 Ice Cream Door Cases 17 doors -12 -19 26180 3 Ice Cream Door Cases 19 doors -12 -19 29260 4 Ice Cream Door Cases 20 doors -12 -19 30800 5 Frozen Meat 28 -10 -20 12100 6 Grocery Freezer 42 x 15 -10 -20 39900 7 Frozen Fish 12 -12 -19 3300 9 Frozen Food Door Cases 15 doors -5 -11 21375 10 Frozen Food Door Cases 16 doors -5 -11 29300 11 Frozen Food Door Cases 15 doors -5 -11 21375 12 Frozen Food Door Cases 16 doors -5 -11 22800 13 Bakery Freezer 12 x 10 -5 -11 9800 14 Deli Freezer 8 x 10 -5 -11 7000 16 Meat Cases 40 24 15 54800 17A Meat Cases 36 22 17 15120 17B Fish Cases 12 22 17 12660 18 Meat Cases 30 24 18 12580 19A Bakery Cooler 6 x 8 28 18 10560 19B Deli Cases 20 32 18 29900 19C Deli Cases 8 30 25 3360 19D Deli Cases 16 26 20 7040 19E Deli Cooler 12 x 11 36 29 9100 19F Cooler 6 x 8 25 15 10560 19G Cheese Cooler 6 x 14 25 15 18480 20A Deli cooler 6 x 8 25 15 10560 20B Deli/Meat Cases 32 32 18 46880 21 Meat Cooler 40 x 15 30 22 35800 22 Meat Box 15 x 10 30 22 11400 24A Dairy/Deli Cases 36 32 21 54000 24B Dairy/Deli Cases 40 32 21 60000 25A Dairy 12 32 18 18000 25B Beverage 36 32 18 53820 25C Beverage 24 32 18 36000 26A Produce 24 32 21 35880 26B Produce 56 39 21 43120 26C Produce 82 39 21 62440 26D Floral Cooler 12 x 11 38 32 11675 26E Floral Case 13 21 12350 27A Bakery Retarder 12 x 8 36 28 7300 27B Dairy Cooler 40 x 20 36 28 54125 28A Meat Prep 40 x 15 50 35 74250 28B Produce Cooler 36 x 14 38 30 27200
Source: (Walker 2001)
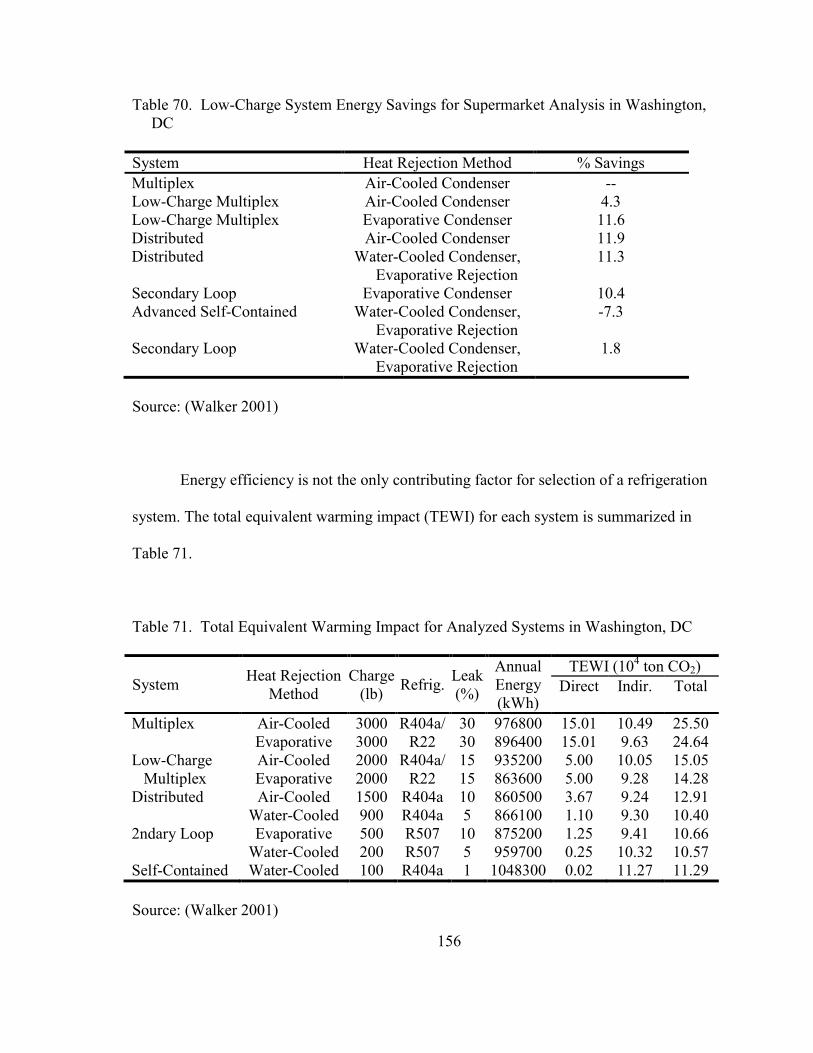
156
Table 70. Low-Charge System Energy Savings for Supermarket Analysis in Washington,
DC
System Heat Rejection Method % Savings
Multiplex Air-Cooled Condenser --
Low-Charge Multiplex Air-Cooled Condenser 4.3
Low-Charge Multiplex Evaporative Condenser 11.6
Distributed Air-Cooled Condenser 11.9
Distributed Water-Cooled Condenser,
Evaporative Rejection
11.3
Secondary Loop Evaporative Condenser 10.4
Advanced Self-Contained Water-Cooled Condenser,
Evaporative Rejection
-7.3
Secondary Loop Water-Cooled Condenser,
Evaporative Rejection
1.8
Source: (Walker 2001)
Energy efficiency is not the only contributing factor for selection of a refrigeration
system. The total equivalent warming impact (TEWI) for each system is summarized in
Table 71.
Table 71. Total Equivalent Warming Impact for Analyzed Systems in Washington, DC
System Heat Rejection
Method
Charge
(lb) Refrig.
Leak
(%)
Annual
Energy
(kWh)
TEWI (104 ton CO2)
Direct Indir. Total
Multiplex Air-Cooled 3000 R404a/ 30 976800 15.01 10.49 25.50
Evaporative 3000 R22 30 896400 15.01 9.63 24.64
Low-Charge
Multiplex
Air-Cooled
Evaporative
2000
2000
R404a/
R22
15
15
935200
863600
5.00
5.00
10.05
9.28
15.05
14.28
Distributed Air-Cooled 1500 R404a 10 860500 3.67 9.24 12.91
Water-Cooled 900 R404a 5 866100 1.10 9.30 10.40
2ndary Loop Evaporative
Water-Cooled
500
200
R507
R507
10
5
875200
959700
1.25
0.25
9.41
10.32
10.66
10.57
Self-Contained Water-Cooled 100 R404a 1 1048300 0.02 11.27 11.29
Source: (Walker 2001)

157
By combining the energy usage of the refrigeration system and the supermarket
HVAC system and by taking into account their relationship, Walker developed a
comparison of the combined operating cost of multiplex, multiplex with heat reclaim, and
distributed with water source heat pump systems (Table 72). It is not surprising that the
distributed system integrated into a WSHP has much lower energy usage compared to a
multiplex system integrated with an HVAC system, as the distributed system showed an
11.3% savings compared to the multiplex system in the previous analysis (Table 70).
Table 72. Estimated Annual Combined Operating Cost of Supermarket Refrigeration and
HVAC Systems in Washington, DC
Annual Operating Cost ($)
Energy: Physical Use:
System Refrig. HVAC Refrig. Water Total
Multiplex 69353 33869 3375 0 106597
Multiplex and Heat Reclaim 72193 27297 3375 0 102865
Distributed and Water Source Heat Pump 61493 22669 349 1616 86127
Source: (Walker 2001)
(Nagaraju et al. 2001)
A unique photo-voltaic cold store, utilizing R-12 refrigerant, was tested by
Nagaraju et al. (Nagaraju et al. 2001) to analyze its performance. The 750.9 ft3 (15.1 x 7.1
x 7.1 ft tall) facility maintains an interior temperature of 5°F to preserve 10 tons of fish. It
is located inside another building, which maintains a temperature less than 86°F although
the temperature does vary. Calculated loads include infiltration at 842.8 Btu/h (0.5 ACH)
and a product load of 22,046 lb at 0.9°F temperature drop per hour, equivalent to 8,632.7

158
Btu/h (0.435 Btu/lb-°F). Nagaraju et al. concludes by stating that the system performed
according to its intended design, meeting the cold store demands.
(Marchese 2002)
Marchese gives a general discussion about sizing walk-in coolers and freezers, as it
pertains to commercial refrigeration. Included in this discussion are the typical loads that
compose the total refrigeration demand to maintain the desired operating conditions of a
refrigerated space. Loads include heat transmission, air infiltration, product load, and
supplemental loads added by occupants and equipment operating in the space.
(Walker and Baxter 2002)
Multiplex refrigeration systems‟ display cases and walk-ins are served with
refrigerant from a central plant, with multiple racks operating at various saturation
temperatures. These compressor racks are cooled by a centralized condenser(s) mounted
above the machine room, where the racks are housed. Multiplex systems are currently the
most sought after type of refrigeration system due to their efficiency and performance
advantages over a conventional refrigeration system. The main drawback, that
supermarkets have been willing to except up to this point, is the amount of refrigerant
charge required for these systems. Distributed refrigeration systems reduce the required
refrigerant charge by locating direct expansion systems to serve display cases and walk-ins
in local proximity. Heat rejection is done via water cooled condensers which are plumbed
to air cooled condensers on the roof. A few drawbacks to this system type include higher
compressor power, as a less efficient scroll compressor must be used to achieve lower
noise levels and increased operating condensing temperatures due to the need for a fluid
loop, which adds an additional temperature rise.

159
Two Price Chopper supermarkets in Marlborough, MA were tested to compare the
actual performance of multiplex and distributed supermarket refrigeration systems. Both
stores consisted of 52,000 ft2 of floor space and were newly constructed, opening in 1997.
The multiplex store that was tested as part of this work had air-cooled condensers, R404a
for the low temperature rack, and R22 for the two medium temperature racks. As is
typically done, the low temperature air cooled condenser was sized for a 10°F temperature
difference and the medium temperature condenser was sized for a 15°F temperature
difference, both with a minimum condensing temperature of 70°F . The design loads were
422,825 and 899,953 Btu/hr for the low and medium temperature racks, respectively, with
one of the medium temperature racks pulling a subcool load off the low temperature rack
of 361,670 Btu/hr.
The distributed refrigeration store uses three water-source heat pumps for store
HVAC that reclaim waste heat from the refrigeration system. The refrigeration system
rejects heat to the water loop for store heating when needed and the heat pumps reject heat
back to the fluid loop during store space cooling. The minimum condensing temperature
was set at 60°F to maintain the 50°F fluid loop temperature required to meet store heating
demands. The refrigeration system is composed of 10 compressor cabinets located out in
the store with loads of 404,845 and 1,010,936 Btu/hr for low and medium temperature
refrigeration, respectively.
Energy (Table 73) and TEWI (Table 74) comparisons were made of the two
systems. Because the distributed system is tied into the store spacing cooling/heating
system, a more complete analysis would have taken into account the overall energy
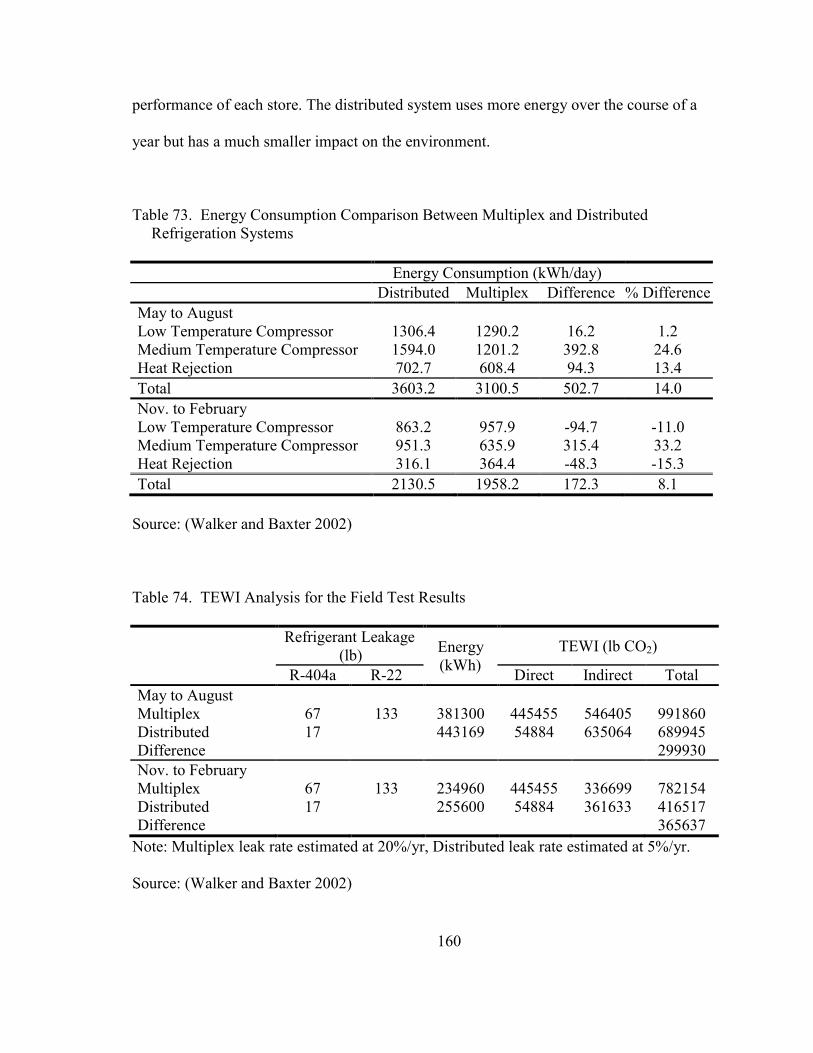
160
performance of each store. The distributed system uses more energy over the course of a
year but has a much smaller impact on the environment.
Table 73. Energy Consumption Comparison Between Multiplex and Distributed
Refrigeration Systems
Energy Consumption (kWh/day)
Distributed Multiplex Difference % Difference
May to August
Low Temperature Compressor 1306.4 1290.2 16.2 1.2
Medium Temperature Compressor 1594.0 1201.2 392.8 24.6
Heat Rejection 702.7 608.4 94.3 13.4
Total 3603.2 3100.5 502.7 14.0
Nov. to February
Low Temperature Compressor 863.2 957.9 -94.7 -11.0
Medium Temperature Compressor 951.3 635.9 315.4 33.2
Heat Rejection 316.1 364.4 -48.3 -15.3
Total 2130.5 1958.2 172.3 8.1
Source: (Walker and Baxter 2002)
Table 74. TEWI Analysis for the Field Test Results
Refrigerant Leakage
(lb) Energy
(kWh)
TEWI (lb CO2)
R-404a R-22 Direct Indirect Total
May to August
Multiplex 67 133 381300 445455 546405 991860
Distributed 17 443169 54884 635064 689945
Difference 299930
Nov. to February
Multiplex 67 133 234960 445455 336699 782154
Distributed 17 255600 54884 361633 416517
Difference 365637
Note: Multiplex leak rate estimated at 20%/yr, Distributed leak rate estimated at 5%/yr.
Source: (Walker and Baxter 2002)
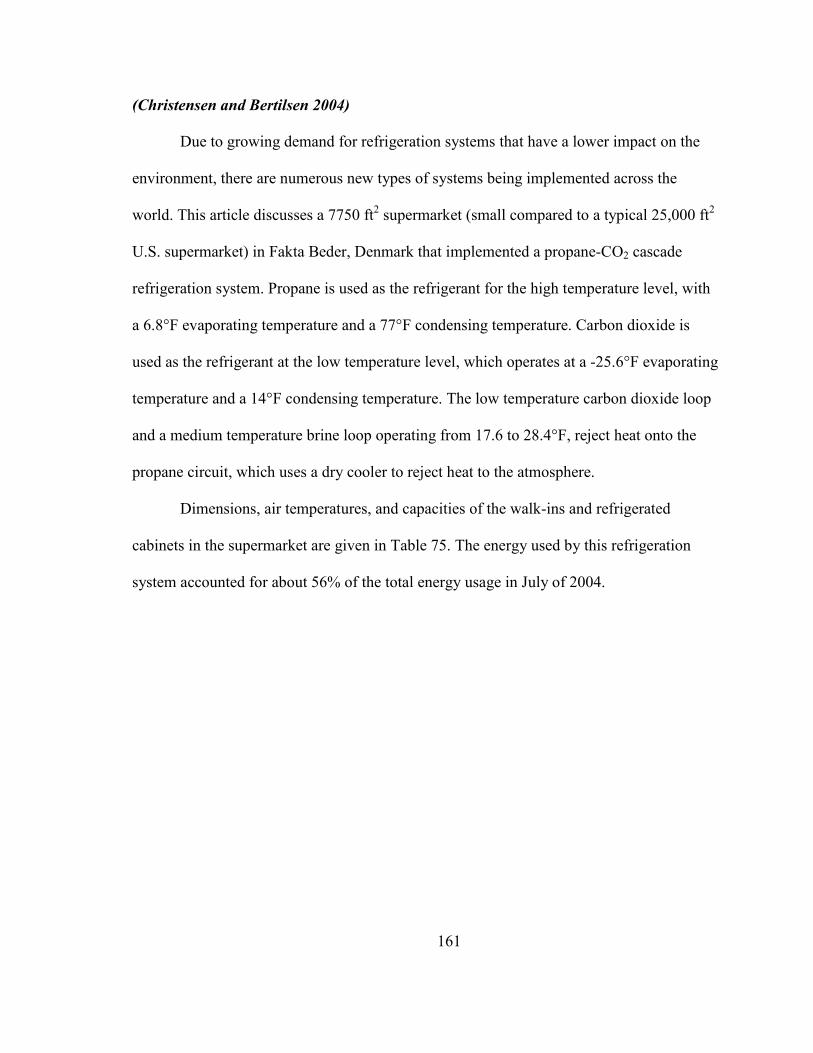
161
(Christensen and Bertilsen 2004)
Due to growing demand for refrigeration systems that have a lower impact on the
environment, there are numerous new types of systems being implemented across the
world. This article discusses a 7750 ft2 supermarket (small compared to a typical 25,000 ft
2
U.S. supermarket) in Fakta Beder, Denmark that implemented a propane-CO2 cascade
refrigeration system. Propane is used as the refrigerant for the high temperature level, with
a 6.8°F evaporating temperature and a 77°F condensing temperature. Carbon dioxide is
used as the refrigerant at the low temperature level, which operates at a -25.6°F evaporating
temperature and a 14°F condensing temperature. The low temperature carbon dioxide loop
and a medium temperature brine loop operating from 17.6 to 28.4°F, reject heat onto the
propane circuit, which uses a dry cooler to reject heat to the atmosphere.
Dimensions, air temperatures, and capacities of the walk-ins and refrigerated
cabinets in the supermarket are given in Table 75. The energy used by this refrigeration
system accounted for about 56% of the total energy usage in July of 2004.
162
Table 75. Walk-in and Display Cabinet Details for Denmark Supermarket
Air-On
Temperature
(°F)
Capacity (Btu/h) Dimensions,
LxWxH (ft)
Glass door walk-in cooler 28.4 15,355 16.7 x 10.8 x 8.5
Glass door walk-in freezer -14.8 14,331 11.8 x 10.8 x 8.0
Glass door walk-in ice cream freezer -18.4 9,554 6.9 x 10.8 x 8.0
Open cooler display case 28.4 49,135 32.8 in length
Doored freezer display case -16.6 7,507 12.3 x 3.3 x 3.1
Doored freezer display case -16.6 2,730 6.4 x 3.3 x 3.1
Doored cooler display case 28.4 4,777 12.3 x 3.3 x 3.1
Doored cooler display case 28.4 2,388 6.4 x 3.3 x 3.1
Total 105,777
Source: (Christensen and Bertilsen 2004)
Christensen concluded that this system performed at an efficiency level equivalent
to a conventional R404a system. The system‟s capital costs were, however, 12 to 20%
greater than a conventional system installation. Larger systems, which are more typical,
would likely be only 10% more expensive than a conventional system.
(Sekhar et al. 2004)
Sekhar et al. (Sekhar et al. 2004) analyzed the performance of an ozone friendly
mixture of HFC134a, HC600a, and HC290 in a walk-in cooler. Results were compared to
R-12, with the mixture using 28.6% less energy (6-10% improved COP). Testing was done
on a 7.55 x 7.55 x 9.19 ft tall walk-in with an average interior temperature of 38.8°F. The
unit was insulated with 5.91 inches of mineral wool.
(Sekhar and Lal 2005)
In a continuation of previous work (Sekhar et al. 2004), Sekhar and Lal analyzed
the performance of a blend of HFC134a, HC600a, and HC290 and a conventional CFC
163
refrigerant (R-12) (Sekhar and Lal 2005). The refrigerants that compose this blend have
their own drawbacks when utilized in a system independently. When combined per this
investigation, the refrigerant mixture in medium and low temperature applications used 10
to 30% and 5 to 15% less energy than R-12, respectively.
Testing was performed on domestic refrigerators, deep freezers, vending machines,
and walk-in coolers. The walk-in cooler used was the same unit used in his previous work
and operated at the same setpoint temperature (Sekhar et al. 2004).
(Arias 2005; Arias and Lundqvist 2006)
Supermarkets use a significant amount of energy, through necessity, to keep
products cold during storage. In Sweden, supermarkets use about 3% of the nation‟s
energy. Forty seven percent of this energy is used for refrigeration. The industry is always
looking for methods to improve the operation of equipment in such a way as to reduce
energy consumption while maintaining the performance and flexibility of today‟s
supermarket multiplex systems. Two new methods for achieving this include the use of
heat recovery and floating condensing temperatures.
Drawbacks to heat recovery systems include requiring a minimum liquid
temperature to be maintained (100 to 106°F) and calling for the greatest load during the
winter, when the refrigeration system is operating at a reduced load. Operating the
refrigeration system to meet these needs reduces the efficiency of the system but when
coupled with the building heating, the store overall energy usage is reduced.
Floating condensing systems allow the condensing temperature to follow the
ambient conditions. At lower outdoor temperatures, the system operates at decreased
energy consumption due to the lower system pressures. This type system requires

164
sophisticated controls and different components, such as special valving, to work
effectively. Arias developed a computer model to analyze energy efficiency, environmental
impact, and economy of refrigeration systems. The model was validated with field testing.
Field testing was conducted at supermarkets in the cities of Sala, Hjo, Farsta
Centrum, Hedemora, Västerås, Taby Centrum, and Kista Centrum. Provided supermarket
test site information is included in Table 76. Typical store conditions are noted as 71.6°F
and 65% relative humidity.

165
Table 76. Field Test Supermarket Details
#1 #2 #3 #4 #5 #6 #7
City
Sala Hjo Farsta
Centrum
Hedemora Västerås Täby
Centrum
Kista
Centrum
Area (ft2)
29,063 7,750 19,375 21,528 23,681 29,063 29,063
Refrigerant
System
Type
Cascade,
secondary
Cascade,
secondary
and
distributed
Distributed
w/chiller
Parallel,
secondary
Cascade
DX and
secondary
loop
Cascade
secondary
distributed
and self-
contained
Cascade
secondary
distributed
and self-
contained
Low Temp.
(tons)
9.95 3.70 56.87
combined
8.25 9.10 9.10 5.97
Med.Temp.
(tons)
36.96 17.06 21.33 36.96 54.03 39.81
Cooler
Disp.
Cases
10 10 29 6 14 11 15
Freezer
Disp.
Cases
3 4 8 3 5 5 6
Walk-ins
7 7 11 11 5 8 10
Med.Temp
Refrigera
nt
R404A R404A R404A R404A R404A R404A R404A
Low Temp
Refrigera
nt
R404A R404A R404A R404A R404A R404A R404A
Brine 1 Pekasol
50/60
Ethyl
alcohol
Ethyl
alcohol
Propylene
Glycol
Propylene
Glycol
Propylene
Glycol
Ethyl
alcohol
Brine 2 Pekasol
50/90
Ethyl
alcohol
Pekasol
50/90
CO2
Coolant
Fluid
Pekasol
50/60
Propylene
Glycol
Propylene
Glycol
Propylene
Glycol
Propylene
Glycol
Heat
Recovery
Y Y N Y Y Y N
Source: (Arias 2005)
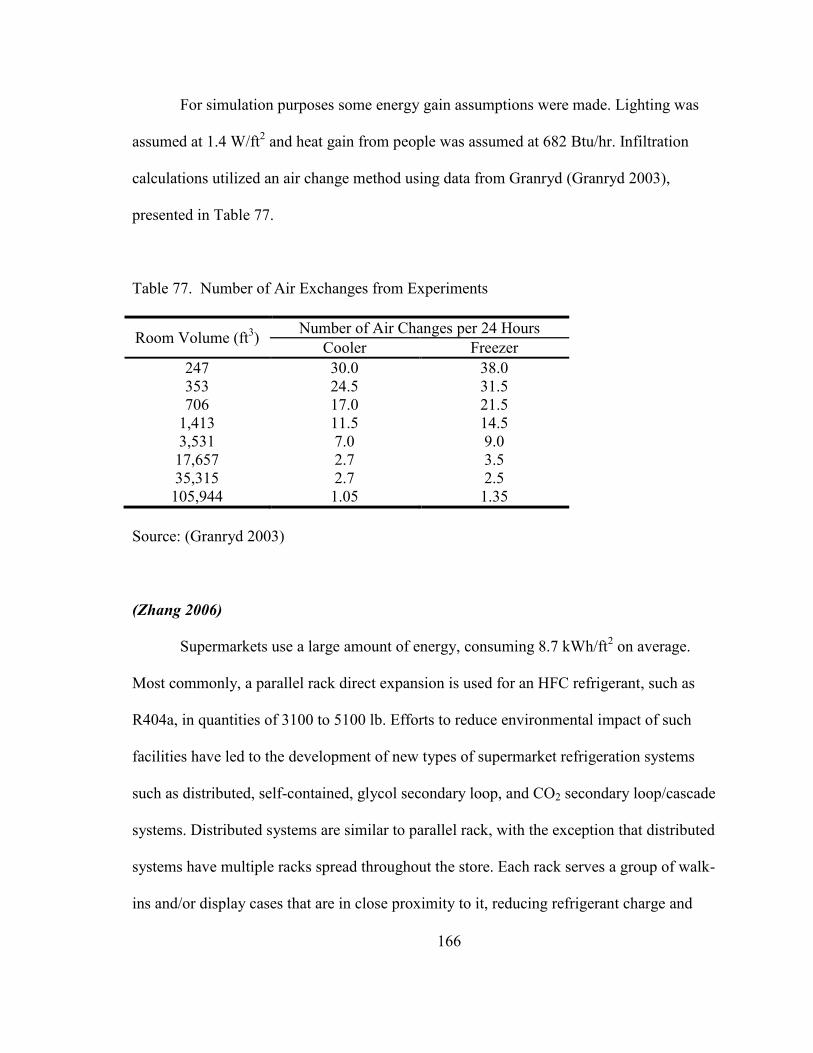
166
For simulation purposes some energy gain assumptions were made. Lighting was
assumed at 1.4 W/ft2 and heat gain from people was assumed at 682 Btu/hr. Infiltration
calculations utilized an air change method using data from Granryd (Granryd 2003),
presented in Table 77.
Table 77. Number of Air Exchanges from Experiments
Room Volume (ft3)
Number of Air Changes per 24 Hours
Cooler Freezer
247 30.0 38.0
353 24.5 31.5
706 17.0 21.5
1,413 11.5 14.5
3,531 7.0 9.0
17,657 2.7 3.5
35,315 2.7 2.5
105,944 1.05 1.35
Source: (Granryd 2003)
(Zhang 2006)
Supermarkets use a large amount of energy, consuming 8.7 kWh/ft2 on average.
Most commonly, a parallel rack direct expansion is used for an HFC refrigerant, such as
R404a, in quantities of 3100 to 5100 lb. Efforts to reduce environmental impact of such
facilities have led to the development of new types of supermarket refrigeration systems
such as distributed, self-contained, glycol secondary loop, and CO2 secondary loop/cascade
systems. Distributed systems are similar to parallel rack, with the exception that distributed
systems have multiple racks spread throughout the store. Each rack serves a group of walk-
ins and/or display cases that are in close proximity to it, reducing refrigerant charge and
167
piping lengths of the system. Self-contained systems are display cases or walk-ins that have
their own compressor and condenser, cooled by water that loops the store and then
exchanges the heat with the atmosphere through a rooftop unit. This system reduces
refrigerant charge but sacrifices efficiency of operation. Secondary glycol systems have a
centrally located direct expansion system that cools a glycol circuit. The glycol circuit
loops the store to cool the refrigerated spaces. Because of the additional steps of heat
exchange, this system also results in an increased energy cost. Secondary systems using
CO2 in place of glycol have much higher efficiency and therefore lower energy cost, by
taking advantage of a phase change. The primary drawback to this system is its capital cost.
Zhang developed models to analyze each of these system types. Outputs compared
include annual energy consumption, Total Equivalent Warming Impact (TEWI), and life
cycle cost. Comparative studies include work done by Walker and Baxter (Walker and
Baxter 2003) and Arias and Lundqvist (Arias and Lundqvist 2005).
Two typical supermarkets (30139 and 54896 ft2) were specified for modeling the
different systems. Both supermarkets had display cases and walk-ins with an indoor
condition of 75.2°F (55% relative humidity). The refrigeration load is varied based on the
outdoor temperature‟s effect on interior conditions utilizing Equation 101.
4085
8511 min
amb
load
TFF ( 101 )
Models were developed for six different system configurations at three site
locations utilizing the loads and operating characteristics noted in Table 78 and Table 79.
Air cooled condensers were sized with a 10°F difference between the condensing
temperature and the ambient dry-bulb (TD) for low temperature systems and 15°F for
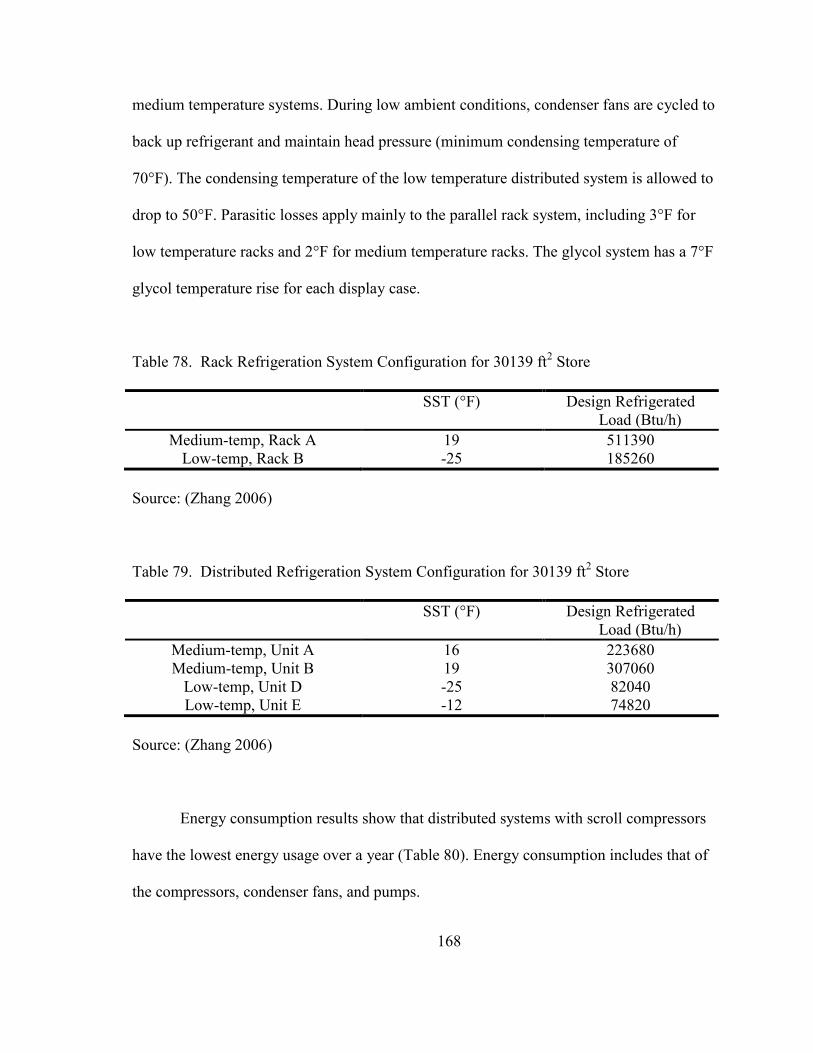
168
medium temperature systems. During low ambient conditions, condenser fans are cycled to
back up refrigerant and maintain head pressure (minimum condensing temperature of
70°F). The condensing temperature of the low temperature distributed system is allowed to
drop to 50°F. Parasitic losses apply mainly to the parallel rack system, including 3°F for
low temperature racks and 2°F for medium temperature racks. The glycol system has a 7°F
glycol temperature rise for each display case.
Table 78. Rack Refrigeration System Configuration for 30139 ft2 Store
SST (°F) Design Refrigerated
Load (Btu/h)
Medium-temp, Rack A 19 511390
Low-temp, Rack B -25 185260
Source: (Zhang 2006)
Table 79. Distributed Refrigeration System Configuration for 30139 ft2 Store
SST (°F) Design Refrigerated
Load (Btu/h)
Medium-temp, Unit A 16 223680
Medium-temp, Unit B 19 307060
Low-temp, Unit D -25 82040
Low-temp, Unit E -12 74820
Source: (Zhang 2006)
Energy consumption results show that distributed systems with scroll compressors
have the lowest energy usage over a year (Table 80). Energy consumption includes that of
the compressors, condenser fans, and pumps.

169
Table 80. Annual Energy Consumption of Refrigeration Systems Analyzed
Rack Distributed Self-
contained
Glycol
Secondary
Loop
CO2
Secondary
Loop
CO2
Cascade
St. Louis 506 462 561 584 514 511
Boston 465 420 516 540 476 474
Dallas 582 543 646 665 587 582
Source: (Zhang 2006)
Analyzing the breakdown of energy usage (Table 81), it would appear that
compressors use the most energy. This is misleading, as evaporator motor energy usage is
not included in the energy analysis. In actuality, compressors are the second largest
contributor to the energy usage of a refrigeration system.
Table 81. Breakdown of Annual Energy Consumption (MWh)
Systems Compressors Secondary
Loop Pumps
Condenser/
Fluid Cooler
Fans
Total
Rack 448 N/A 58 506
Distributed 408 N/A 54 462
Self-contained 503 N/A 58 561
Glycol Secondary Loop 489 36.4 58 584
CO2 Secondary Loop 453 3.5 58 514
CO2 Cascade 448 1.5 58 507
Source: (Zhang 2006)
The annual operating cost analysis took into account the energy used and the
refrigerant used, assuming a leakage rate. This comparison to a standard parallel rack
system shows cost savings for two of the five systems. Distributed, CO2 secondary loop,
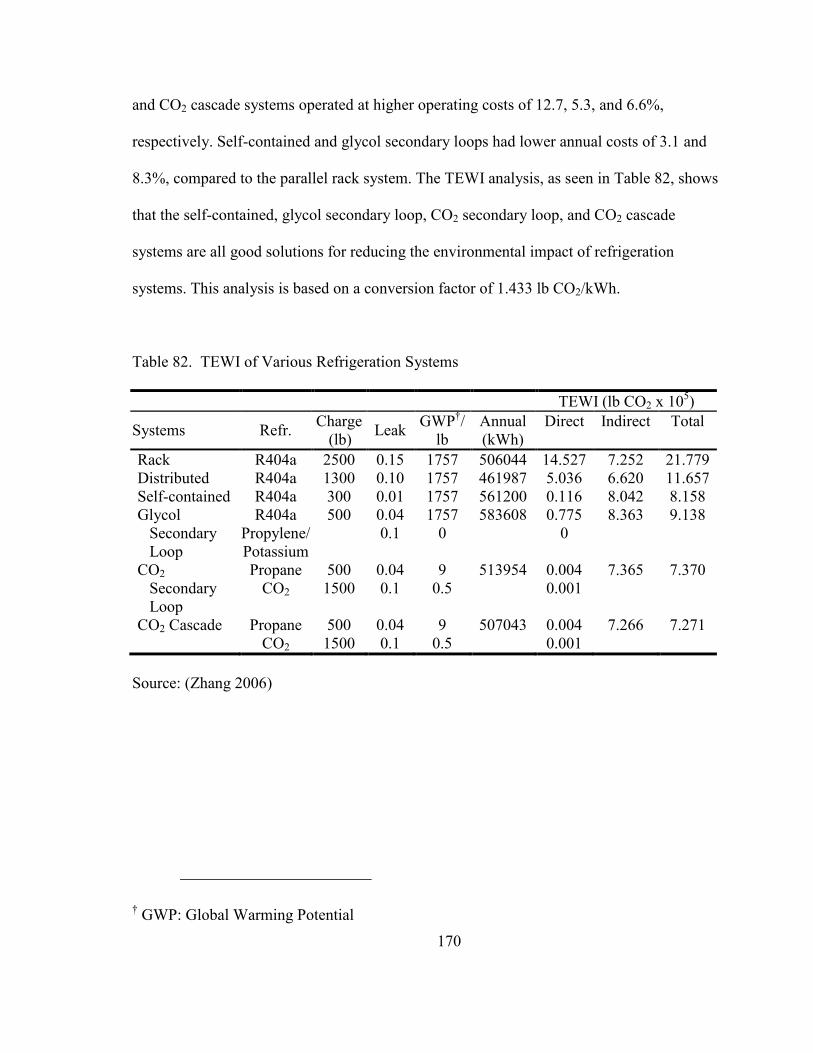
170
and CO2 cascade systems operated at higher operating costs of 12.7, 5.3, and 6.6%,
respectively. Self-contained and glycol secondary loops had lower annual costs of 3.1 and
8.3%, compared to the parallel rack system. The TEWI analysis, as seen in Table 82, shows
that the self-contained, glycol secondary loop, CO2 secondary loop, and CO2 cascade
systems are all good solutions for reducing the environmental impact of refrigeration
systems. This analysis is based on a conversion factor of 1.433 lb CO2/kWh.
Table 82. TEWI of Various Refrigeration Systems
TEWI (lb CO2 x 105)
Systems Refr. Charge
(lb) Leak
GWP†/
lb
Annual
(kWh)
Direct Indirect Total
Rack R404a 2500 0.15 1757 506044 14.527 7.252 21.779
Distributed R404a 1300 0.10 1757 461987 5.036 6.620 11.657
Self-contained R404a 300 0.01 1757 561200 0.116 8.042 8.158
Glycol
Secondary
Loop
R404a
Propylene/
Potassium
500 0.04
0.1
1757
0
583608 0.775
0
8.363 9.138
CO2
Secondary
Loop
Propane
CO2
500
1500
0.04
0.1
9
0.5
513954 0.004
0.001
7.365
7.370
CO2 Cascade Propane
CO2
500
1500
0.04
0.1
9
0.5
507043 0.004
0.001
7.266 7.271
Source: (Zhang 2006)
† GWP: Global Warming Potential
171
(Hwang et al. 2007)
(Hwang et al. 2007) compared the performance of R-404a and R-410a to R-290
(propane) for walk-in refrigeration systems. Hydrocarbons, such as propane have low
global warming potential but are highly flammable.
A theoretical analysis showed that R-290 was superior at higher condensing
temperatures (19% and 6% better than R-404a and R-410a, respectively at 122°F SCT) and
at lower temperatures it was outperformed by the HFCs to which it was compared by
around 4%.
Experimental testing was performed in a psychrometric test facility on a low
temperature and medium temperature refrigeration system. The low temperature
refrigeration system had a capacity of 13,650 Btu/hr and utilized a -20.2°F saturated
evaporating temperature and the medium temperature refrigeration system had a capacity
of 37,535 Btu/hr and operated with saturated evaporating temperatures from -4 to 32°F.
In conclusion, based on equivalent capacity, R-290 performed at an 11 to 12% and
4 to 9% improved COP compared to R-404a and R-410a, respectively. At part load
conditions it performed with an improved COP of 5 to 10% as compared to both HFC
refrigerants.
(Sugiartha et al. 2009)
In the United Kingdom it is typical for direct expansion to be used to maintain
space temperatures in the refrigerated spaces. The energy required to perform this cooling
accounts for an average of 40% of supermarket energy use. This study analyzes a gas-
turbine trigeneration system used for a 30,139 ft2 supermarket in the south of England,
relative to a conventional system.

172
The average electrical demand of the store is 395 kW (59 kW for low temperature
refrigeration and 99 kW for medium temperature refrigeration). The average heat demand
of the store is 55 kW.
The study concluded that gas turbine heat diversion to absorption chillers of 85% or
less, a trigeneration plant performs at a lower system energy usage than a conventional
system.
(Royal 2010)
Grocery store refrigeration systems run all day long and account for one-third to
half of the store‟s electricity usage. As a waste product, the refrigeration system generates a
constant supply of low quality heat.
A typical direct expansion system operates low temperature coils at -20°F with a 4
to 6°F superheat and 30°F return gas temperature. Medium temperature evaporator coils
operate using a saturated suction temperature of 20°F, superheat of 5 to 8°F, and a return
gas temperature of around 50°F. The heat recovery potential for this type system is
summarized in Table 83.
Water heating is a common form of heat recovery. With the waste heat available,
electric heat is seldom required to obtain the desired potable hot water temperature. Some
systems utilize a holdback valve on the refrigeration system to maintain a condensing
temperature sufficient to provide the desired waste heat temperature. This should be
avoided, as the energy required to maintain the refrigeration system at these conditions is
more than what would be require to heat the potable water with electric heat.
Another method of heat recovery is pre-heating the outdoor air supplied to the store.
Based on the minimum condensing temperatures listed in Table 83, no space heating is
173
required from a HVAC using this form of heat recovery at outdoor temperatures above
47.5°F.
A third method of heat recovery is using the refrigeration system waste heat in a
heat pump configuration with the HVAC system. These systems are difficult to implement,
as the peak HVAC heating requirement corresponds with the lowest condensing
temperature and therefore, the lowest heating potential.

174
Table 83. Summary of Heat Recovery Potential for Various System Conditions with R-
404A and R-407A Refrigerants
R-404A, 378,000 Btu/h Full Load, -20°FSST – Low Temperature – Desuperheating Condensing
Temp. (°F)
Compressor
Disch. (°F)
Mass Flow
(lbm/hr)
Percent of Design
Load
Heat Recovery
Potential (Btu/hr) 65 157.0 5,791 85% 135,182 75 167.0 6,412 88% 154,400
85 179.0 7,140 91% 181,509
95 192.0 8,008 94% 217,454
105 205.0 9,061 97% 263,331
115 218.0 10,397 100% 324,283
R-404A, 378,000 Btu/h Full Load, -20°FSST – Low Temperature – Full Condensing
Condensing
Temp. (°F)
Compressor
Disch. (°F)
Mass Flow
(lbm/hr)
Percent of Design
Load
Heat Recovery
Potential (Btu/hr) 65 157.0 5,791 85% 504,503 75 167.0 6,412 88% 545,929
85 179.0 7,140 91% 596,603
95 192.0 8,008 94% 657,603
105 205.0 9,061 97% 730,107
115 218.0 10,397 100% 819,514
R-404A, 889,000 Btu/h Full Load, +20°FSST – Medium Temperature – Full Condensing
Condensing
Temp. (°F)
Compressor
Disch. (°F)
Mass Flow
(lbm/hr)
Percent of Design
Load
Heat Recovery
Potential (Btu/hr) 65 115.0 10,204 70% 888,992 75 128.0 11,774 76% 1,002,507
85 141.0 13,580 82% 1,134,656
95 153.0 15,685 88% 1,287,939
105 166.0 18,176 94% 1,464,490
115 178.0 21,231 100% 1,673,508
R-407A, 378,000 Btu/h Full Load, -20°FSST – Low Temperature – Full Condensing
Condensing
Temp. (°F)
Compressor
Disch. (°F)
Mass Flow
(lbm/hr)
Percent of Design
Load
Heat Recovery
Potential (Btu/hr) 65 190.0 4,602 85% 494,032 75 204.0 5,016 88% 534,032
85 219.0 5,494 91% 580,323
95 235.0 6,032 94% 633,730
105 250.0 6,666 97% 693,743
115 267.0 7,412 100% 767,212
R-407A, 889,000 Btu/h Full Load, +20°FSST – Medium Temperature – Full Condensing
Condensing
Temp. (°F)
Compressor
Disch. (°F)
Mass Flow
(lbm/hr)
Percent of Design
Load
Heat Recovery
Potential (Btu/hr) 65 128.0 8,305 70% 770,192 75 143.0 9,459 76% 868,218
85 159.0 10,763 82% 978,387
95 174.0 12,219 88% 1,097,125
105 188.0 13,899 94% 1,226,168
115 203.0 15,841 100% 1,375,440
Source: (Royal 2010)

175
(Morris 2012)
Kevin Morris‟ presentation on supermarket refrigeration equipment selections gives
details on walk-in coolers and freezers, and methods used to properly size equipment for
these units (Morris 2012).
Walk-in cooler and freezer details include information on interior conditions, the
relationship between interior conditions and evaporator selection, and example box sizes
and corresponding loads. Walk-ins that contain items such as meat require high humidity
(90% typical) to ensure minimum weight loss. To achieve this, evaporators are oversized
and utilize a low air flow rate, resulting in a tight air side change in temperature of 7-9°F.
On the other end of the spectrum, in rooms where people are constantly working to prepare
foods or where candy or film are stored, low relative humidities in the range of 50-65% are
maintained. To achieve this, high air flow rates are utilized with smaller evaporator units
operating at 17-22°F air side temperature drops. A typical guideline for supermarkets is an
evaporator delta T of 10-12°F for low temperature and 15°F for medium temperature
applications.
Example walk-ins ranged in size from 30x30x8‟ to 20x12x8‟, with freezer box
temperatures of 0 or -10°F and cooler temperatures of 35°F . A product load of 1000 lb of
meat at 40°F was given as an example for a 40x20x8‟ freezer.
A system balancing routine is utilized to determine the actual balanced operating
point of a given set of equipment. Condenser capacity at multiple saturated suction
temperatures (SST) and the same design ambient temperature, evaporator quantity,
evaporator capacity, and delta T are analyzed with the equations below to obtain the
balanced capacity, evaporator delta T, and SST, and the runtime hours.

176
21
21
SSTSST
CapCapm condcond
cs
( 105 )
cs
Edes
evap
Evap
cscondsllCcsEbal
mTD
CapN
SSTmCapTTmTD
11
( 106 )
Edes
evapEvapEbal
BalTD
CapNTDCap
( 107 )
Bal
totBal
Cap
QRT ( 108 )
General Load Details
(Walker et al. 1990)
Supermarket refrigeration accounted for 59% of the total store energy consumption
in 1990 (Walker et al. 1990). With a great potential for reduction in energy usage,
supermarket refrigeration systems are a constant target for optimization. Walker compared
conventional and multiplex refrigeration systems used for supermarket refrigeration. The
conventional refrigeration system used air cooled condensers, fixed head pressure control,
and electric defrost. Multiplex configurations included air-cooled and evaporative
condensers, floating and fixed head pressure control, ambient and mechanical sub-cooling,
and electric and hot gas defrost. To allow for application by industry, the report focuses on
the operating and capital costs of each system type for various operating requirements.
A display case line-up or circuit consists of several display cases that have parallel
liquid and suction refrigerant piping. Conventional refrigeration systems use a single
compressor for each display case lineup or walk-in box. Each circuit in the store is isolated
from all of the others with dedicated refrigerant piping, control valves, receiver, electrical
177
components, condenser, and compressor. Multiplex refrigeration systems use semi-
hermetic compressors typically, mounted on a rack. Display case lineups and walk-ins that
are operating at similar conditions share a liquid line and discharge line.
An equal parallel compressor rack is a type of multiplex refrigeration system in
which all compressors are of the same size, in terms of refrigeration capacity. Unequal
parallel compressor racks allow the system to closely match the required refrigeration load
during off-design periods, achieve the highest possible suction pressure, and higher system
efficiency.
Multiplex systems use floating head pressure to reduce compressor power.
Variation in the head pressure must be limited however, as it typically has a negative effect
on the ability of the expansion valve to properly feed refrigerant into the evaporator coil
and could potentially cause flashing of the refrigerant in the liquid lines. A minimum
condensing temperature of 70°F is typically recommended. In conventional systems with a
single compressor, floating head pressure can cause system instability issues. As the head
pressure drops, the capacity of the compressor increases, causing long off-cycle periods. To
avoid this the minimum condensing temperature for conventional systems must be set
much higher, usually between 90 and 95°F. This is referred to as fixed head pressure
control.
Six sites were used as part of the simulations, including Atlanta, GA; Boston, MA;
Los Angeles, CA; Milwaukee, WI; Phoenix, AZ; and St. Louis, MO. A Safeway Stores,
Inc. field test site in Menlo Park, CA (Store #990) was used as a baseline to build the
simulation from. The system has three racks, operating at five suction temperatures (SST),
including a low (3 compressors at -23°F SST) and very low (1 compressor at -33°F SST)

178
temperature rack (Rack A), a medium temperature rack at 16°F SST (Rack B), and a high
temperature rack at 26°F SST (Rack C). A satellite compressor operates at 9°F SST on
Rack C to refrigerate the meat display cases. As is typically done, this refrigeration system
utilizes hot gas defrost.
This investigation was limited to single-stage vapor compression, using semi-
hermetic reciprocating compressors. R12 was utilized for medium and high temperature
refrigeration and R502 was used for low temperature circuits (both being phased out under
the Montreal protocol).
Evaporative condensers were sized for a condensing temperature of 100°F. Air
cooled condensers are applied with a design temperature differential (Condenser
temperature minus design ambient dry bulb) of 10°F for low temperature racks and 15°F
for medium and high temperature racks. As mentioned before, minimum condensing
temperature for the multiplex refrigeration systems is set at 70°F during floating head
pressure operation. Head pressure is also controlled so that it raises prior to initiation of
each defrost cycle. Using oversized condensers reduces the condensing temperature.
However, the savings of operating at a lower head pressure are typically offset by increased
fan energy consumption of the oversized condensers.
First the conventional system was modeled. It utilized 23 single compressors with
individual air-cooled condensers with fixed head pressure control set at 90°F. The 23
compressors are categorized as 1 very low, 5 low, 12 medium, and 5 high temperature. The
conventional system has small air cooled condensers mounted to the compressor base in
the machine room. Suction pressure is held between set points by cycling of the

179
compressors. Head pressure is controlled above a minimum condensing temperature of
90°F by a liquid line thermostat, which cycles the condenser fans.
Conventional systems typically use either off-cycle or electric defrost. Off-cycle is
used for medium or high temperature refrigeration circuits whereas electric defrost is
utilized for low temperature cases or boxes.
Table 84. Refrigerated Cases and Walk-in Boxes in the Modeled Supermarket Rated at the
Inside Ambient of 75°F Dry Bulb and 55% Relative Humidity
Description Case Type Total
Case Length (ft)
Floor
Area
(ft2)
Design
Load
(Btu/h)
Eva Temp
(°F)
Discharge
Air Temp
(°F)
Ice cream Wide aisle tub 76 -- 32300 -33 -20
Frozen food 26 door reach-in 68 -- 39520 -23 -5
Frozen food 26 door reach-in 68 -- 39520 -23 -5
Frozen food Wide aisle tub 64 -- 21600 -23 -10
Freezer Walk-in box -- 500 29900 -22 -12
Bakery freezer Walk-in box -- 81 7100 -22 -12
Cheese case Single deck 39 -- 13074 18 37
Produce Multi-deck 24 -- 17400 19 37
Dairy Multi-deck 48 -- 61200 19 32
Dairy Multi-deck 40 -- 51000 19 32
Deli Multi-deck 36 -- 58680 16 32
Beverage Multi-deck 48 -- 61200 19 32
Cheese Single deck 22 -- 6400 18 37
Produce Single deck 52 -- 22100 19 37
Meat cooler Walk-in box -- 480 26300 20 30
Fish cooler Walk-in box -- 96 7800 20 30
Meat holding Walk-in box -- 120 9200 21 30
Meat case Multi-deck 36 -- 58500 9 22
Meat Multi-deck 24 -- 39000 9 22
Fish Service 16 -- 6246 21 27
Produce cooler Walk-in box -- 437 21750 31 40
Dairy cooler Walk-in box -- 540 27825 27 36
Meat prep Walk-in box -- 800 48000 29 50
Deli box Walk-in box -- 70 6275 26 36
Bakery retard Walk-in box -- 80 6400 27 --
(Walker et al. 1990)

180
The building was modeled according to the following specification:
Hours of operation: 24 h/day
Conditioned air volume: 358,000 ft3
Total floor space: 43,139 ft2
Sales floor space: 25,600 ft2
Building construction quality: tight
Building walls U-value (ASHRAE 8-in concrete block, filled insulation):
0.103 Btu/h-ft2-°F
Building roof U-value (ASHRAE No. 17, steel sheet with 2-in insulation):
0.093 Btu/h-ft2-°F
Storefront window U-value: 0.917 Btu/hr-ft2-°F
Storefront window area (30% of north wall area): 450 ft2
Ventilation flow rate: 21,000 cfm (return air), 2,200 cfm (fresh air)
Internal sensible gain due to lighting and equipment: 3.24 W/ft2
Internal moisture generation: 10 lbm/h
Building thermal capacitance (ASHRAE heavy construction classification):
666,000 Btu/°F
Air volume used for moisture capacitance: 358,000 ft3
Walls: Inside convection coefficient: 1.4 Btu/h-ft2-°F
Window: U-value (not including inside/outside convection): 14.2 Btu/h-ft2-
°F
Inside convection coeff: 1.4 Btu/h-ft2-°F

181
Window dimensions: 5 ft high, 90 ft long
People heat gain: Sensible: 315 Btu/h-person
Latent: 325 Btu/h-person
Floor U-Value (ASHRAE 12in concrete slab with 12-in insulation): 0.0238
Btu/h-ft2-°F
661 ft of refrigerated cases, 2512 ft2 of walk-in boxes
HVAC: central air handler capable of 21,000 ft3/min
Air cooled condensers were set at 10°F temperature difference (condenser
temperature - design ambient dry bulb) for very low and low temperature
circuits whereas 15°F was used for medium and high temperature circuits.
The evaporative condenser utilized a design condensing temp of 100°F.
The multiplex system parallels the field site with 13 parallel compressors with 1
very low, 3 low, 6 medium, and 3 high temperature compressors. Floating head pressure is
utilized by this system along with ambient sub coolers and mechanical sub coolers for very
low and low temperature racks. Hot gas defrost is utilized for very low and low
temperature racks. The entire system is cooled by a remotely located evaporative condenser
The conventional and multiplex defrost schedules were provided in great detail. The
number of defrosts per day ranges from 1 to 4 with an average of 1.63 times per day for
walk-in freezers and 0 to 4 with an average of 2.58 times per day for walk-in coolers.
Defrost duration over the course of the day ranged from 0.5 to 3.33 hrs, with an average
duration of 1.17 hrs for walk-in freezers and 0 to 3.47 hrs, with an average duration of 1.98
hrs for walk-in coolers.
182
The lighting load assumed was 3.24 W/ft2. Occupancy load was set as 50 people
from 3 am to 6 am and 200 people from 3 pm to 6 pm, with the number of people ramping
linearly between these two points. For refrigerated cases and walk-in box details see Table
84. Suction temperatures are the same as those outlined in the details about the field site.
(Anonymous 2004)
This article gives a general discussion of walk-in coolers and freezers. Walk-ins
may be pre-engineered or built on site. They may be located indoors or outdoors and may
reject heat using a packaged refrigeration system connected to the box or using a remote
condenser. Footprints range from 5 x 6 ft to an entire warehouse with some being multiple
stories. These units store 28 lb of product/ft3 of available storage volume on average.
A common walk-in box temperature is 35°F whereas a freezer is typically
maintained at -10°F. Construction materials are typically urethane insulated panels encased
in sheet metal with resistance values of around R-30 for 4” of insulation. Five to six inches
of insulation are available. Insulated panels are mass produced in sizes of 1, 2, and 4 ft
wide by 7.5, 8.5, and 9.5 ft tall, confining the possible walk-in box sizes. Doors are 24 to
34 inches wide
When combination units are designed, the freezer door opens to the cooler to reduce
heat loss. Air curtains or vinyl door strips are used by some walk-ins to reduce infiltration
to the space.
(PG&E 2004)
Pacific Gas and Electric Company (PG&E) analyzes the current state of walk-ins in
California in this report. The report characterizes typical walk-ins and proposes some
standards to improve the efficiency of refrigeration equipment in the jurisdiction.
183
Walk-ins range from less than 50 ft2 to 2,000 ft
2, with ceiling heights ranging from
8 to 30 ft. Walk-ins may be placed inside the building that it is serving or just outside the
building. Small walk-ins typically only have one access door but often have several glass
display doors for customer access to products. Construction is typically prefabricated
panels of polyurethane, polystyrene, or fiberglass with an insulation thickness of 3.5 to 5.5
inches. Wood or high density polyethylene are sometimes used for structural integrity of
the panels.
Recommended standards include automatic door closers, reach-in doors with anti-
sweat heater control, evaporator fan control, and high efficiency lighting.
(Heatcraft 2008)
The Heatcraft Engineering Manual (Heatcraft 2008) is a well-trusted source of
information on sizing a walk-in for numerous applications in the commercial refrigeration
industry. There is a wealth of specific information that can be applied as well as general
approximations for when the details related to a project are somewhat unknown.
Walk-ins are composed of various materials. To assist in determining the
conduction load, Heatcraft provides a table of heat loads based on these variables.
Insulation and building material details are included in Table 85.
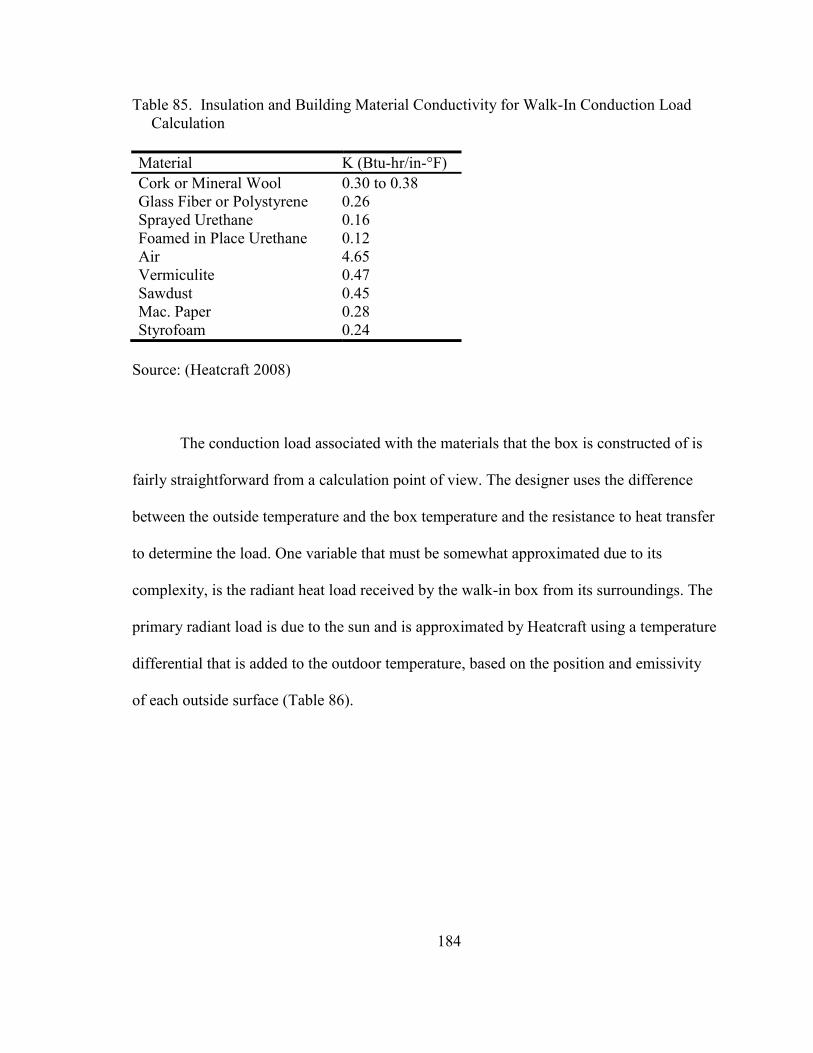
184
Table 85. Insulation and Building Material Conductivity for Walk-In Conduction Load
Calculation
Material K (Btu-hr/in-°F)
Cork or Mineral Wool 0.30 to 0.38
Glass Fiber or Polystyrene 0.26
Sprayed Urethane 0.16
Foamed in Place Urethane 0.12
Air 4.65
Vermiculite 0.47
Sawdust 0.45
Mac. Paper 0.28
Styrofoam 0.24
Source: (Heatcraft 2008)
The conduction load associated with the materials that the box is constructed of is
fairly straightforward from a calculation point of view. The designer uses the difference
between the outside temperature and the box temperature and the resistance to heat transfer
to determine the load. One variable that must be somewhat approximated due to its
complexity, is the radiant heat load received by the walk-in box from its surroundings. The
primary radiant load is due to the sun and is approximated by Heatcraft using a temperature
differential that is added to the outdoor temperature, based on the position and emissivity
of each outside surface (Table 86).

185
Table 86. Allowance for Sun Effect (°F)
Allowance for Sun Effect (+ °F)
Surface Type East Wall South Wall West Wall Flat Roof
Dark Colored Surfaces:
Slate roofing, tar roofing,
or black paints
8 5 8 20
Light Colored Surfaces:
White stone, light colored
cement, or white paint
4 2 4 9
Medium Colored Surfaces:
Unpainted wood, brick,
red tile, dark cement, or
red, gray, or green paint
6 4 6 15
Source: (Heatcraft 2008)
Another conduction component is the heat load from the ground. Cooler heat gain is
based on the temperature differential between the local ground temperature and the storage
room temperature. Freezer floors, however, are commonly heated to prevent the ground
below the freezer from freezing and heaving up. A minimum slab temperature is 40°F but
because the effects of a sub-floor freezing would be so costly, most walk-ins use a slab
temperature of 55°F. An extensive list of ground and design temperatures is provided in the
Heatcraft Manual.
Product load can be calculated easily by hand if the details on the quantity of
product that will be received daily is known, along with the temperature at which it will be
received. If no such information is available Heatcraft presents a typical average daily
product load based on the cooler or freezer‟s size (Table 87). Storage requirements and
miscellaneous product properties are presented by Heatcraft in great detail.
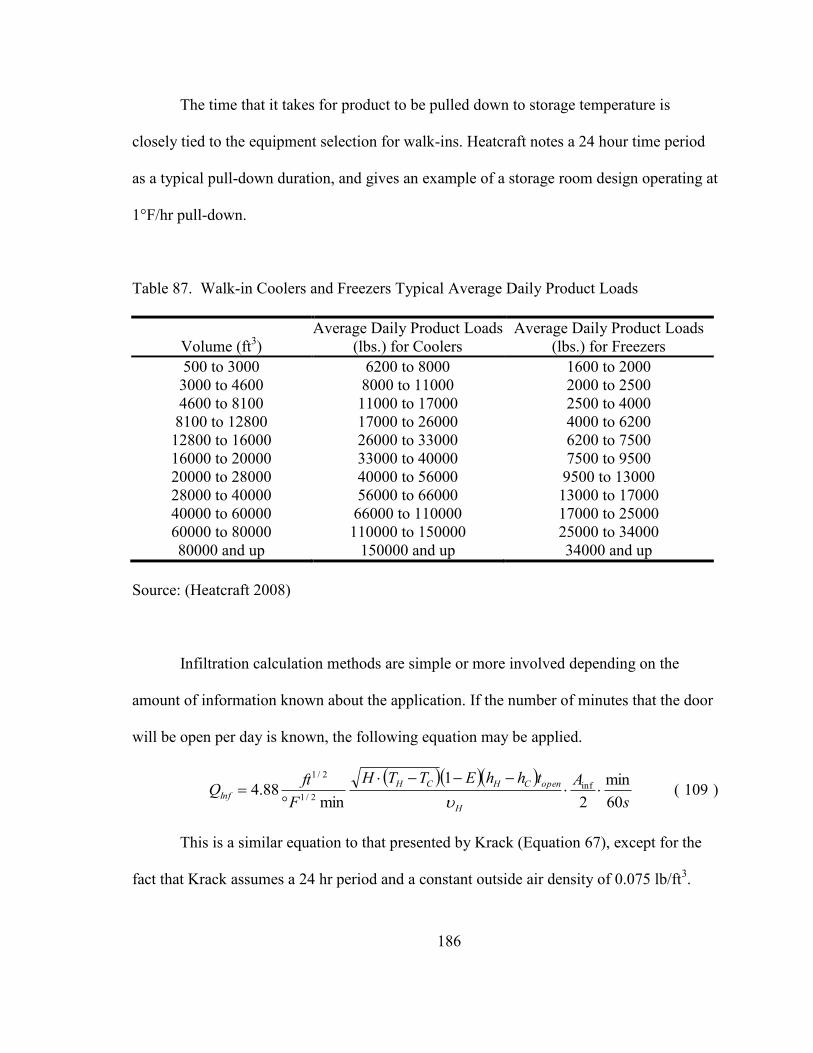
186
The time that it takes for product to be pulled down to storage temperature is
closely tied to the equipment selection for walk-ins. Heatcraft notes a 24 hour time period
as a typical pull-down duration, and gives an example of a storage room design operating at
1°F/hr pull-down.
Table 87. Walk-in Coolers and Freezers Typical Average Daily Product Loads
Volume (ft3)
Average Daily Product Loads
(lbs.) for Coolers
Average Daily Product Loads
(lbs.) for Freezers
500 to 3000 6200 to 8000 1600 to 2000
3000 to 4600 8000 to 11000 2000 to 2500
4600 to 8100 11000 to 17000 2500 to 4000
8100 to 12800 17000 to 26000 4000 to 6200
12800 to 16000 26000 to 33000 6200 to 7500
16000 to 20000 33000 to 40000 7500 to 9500
20000 to 28000 40000 to 56000 9500 to 13000
28000 to 40000 56000 to 66000 13000 to 17000
40000 to 60000 66000 to 110000 17000 to 25000
60000 to 80000 110000 to 150000 25000 to 34000
80000 and up 150000 and up 34000 and up
Source: (Heatcraft 2008)
Infiltration calculation methods are simple or more involved depending on the
amount of information known about the application. If the number of minutes that the door
will be open per day is known, the following equation may be applied.
s
AthhETTH
F
ftQ
H
openCHCH
Inf60
min
2
1
min88.4 inf
2/1
2/1
( 109 )
This is a similar equation to that presented by Krack (Equation 67), except for the
fact that Krack assumes a 24 hr period and a constant outside air density of 0.075 lb/ft3.
187
If details required to calculate infiltration using Equation 109 are not available,
designers use a typical value for the average air changes in a 24 hour period. Heatcraft
provides these values as a function of the volume of the space (Table 88). The values in
Table 88 are the same as those in Table 22 (Krack 1977) with the following exceptions.
Heatcraft interpolates to some intermediate values and extrapolates to some larger space
sizes that are omitted by Krack. Heatcraft also omits some intermediate values that Krack
includes. The only values that do not agree are air changes for the 200,000 ft3 cooler, for
which Krack specifies 0.9 air changes per 24 hours whereas Heatcraft specifies 1.1. To
allow for easy calculation of the heat load Heatcraft also provides a table of data to convert
air changes to heat loss based on the inside and outdoor conditions.
Lighting for storage spaces are typically 1 to 1.5 W/ft2. Cutting or processing rooms
may have 2 to 3 W/ft2. Equipment loads include lift trucks, evaporator fans, heaters, etc.
Lift trucks are typically battery powered for refrigerated spaces due to the desire to keep
the required air changes to a minimum. A conservative estimate for the load added to the
space by lift trucks in larger refrigerated spaces is 0.16 Btu/hr-ft3 for coolers and 0.20
Btu/hr-ft3 for freezers. Occupancy loads vary depending on the facility type and the
temperature at which it operates (Table 89).

188
Table 88. Average Air Changes per 24 Hrs for Medium Temperature (Above 32°F) and
Low Temperature (Below 32°F) Rooms Due to Infiltration and Door Openings.
Medium
Temp
Low
Temp
Medium
Temp
Low
Temp
Volume (ft3) Air Changes/24 hr Volume (ft
3) Air Changes/24 hr
200 44.0 33.5 8000 5.5 4.3
250 38.0 29.0 10000 4.9 3.8
300 34.5 26.2 15000 3.9 3.0
400 29.5 22.5 20000 3.5 2.6
500 26.0 20.0 25000 3.0 2.3
600 23.0 18.0 30000 2.7 2.1
800 20.0 15.3 40000 2.3 1.8
1000 17.5 13.5 50000 2.0 1.6
1500 14.0 11.0 75000 1.6 1.3
2000 12.0 9.3 100000 1.4 1.1
3000 9.5 7.4 150000 1.2 1.0
4000 8.2 6.3 200000 1.1 0.9
5000 7.2 5.6 300000 1.0 0.85
6000 6.5 5.0
Source: (Heatcraft 2008)
Table 89. Heat Equivalent of Occupancy
Box Temperature (°F) Btu/24 hr-person
50 17280
40 20160
30 22800
20 25200
10 28800
0 31200
-10 33600
Source: (Heatcraft 2008)
Glass doors used for customer access to products stored in display walk-in coolers
and freezers increase conduction to the walk-in box and introduce additional paths for
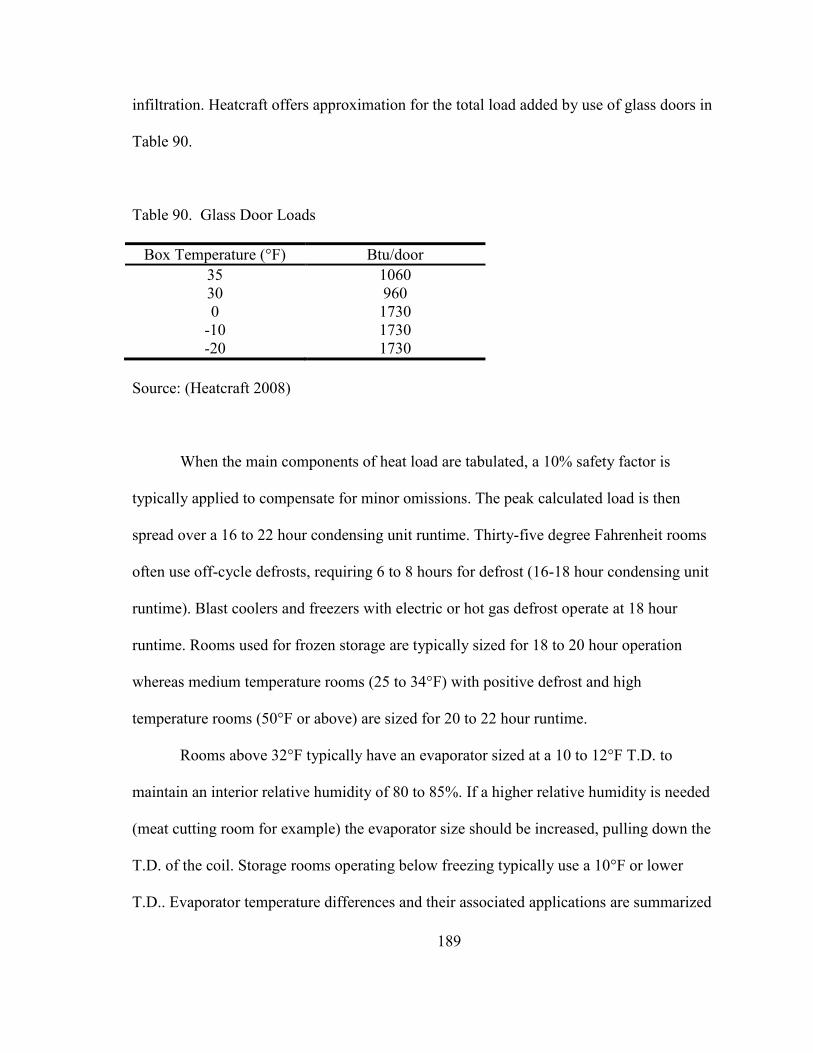
189
infiltration. Heatcraft offers approximation for the total load added by use of glass doors in
Table 90.
Table 90. Glass Door Loads
Box Temperature (°F) Btu/door
35 1060
30 960
0 1730
-10 1730
-20 1730
Source: (Heatcraft 2008)
When the main components of heat load are tabulated, a 10% safety factor is
typically applied to compensate for minor omissions. The peak calculated load is then
spread over a 16 to 22 hour condensing unit runtime. Thirty-five degree Fahrenheit rooms
often use off-cycle defrosts, requiring 6 to 8 hours for defrost (16-18 hour condensing unit
runtime). Blast coolers and freezers with electric or hot gas defrost operate at 18 hour
runtime. Rooms used for frozen storage are typically sized for 18 to 20 hour operation
whereas medium temperature rooms (25 to 34°F) with positive defrost and high
temperature rooms (50°F or above) are sized for 20 to 22 hour runtime.
Rooms above 32°F typically have an evaporator sized at a 10 to 12°F T.D. to
maintain an interior relative humidity of 80 to 85%. If a higher relative humidity is needed
(meat cutting room for example) the evaporator size should be increased, pulling down the
T.D. of the coil. Storage rooms operating below freezing typically use a 10°F or lower
T.D.. Evaporator temperature differences and their associated applications are summarized

190
below (Table 91). Evaporator temperature differences may be approximated by Equation
110.
TDevap
SSTcond
EapproxCap
CapTD
1,
, ( 110 )
Table 91. Recommended Evaporator Temperature Difference per Various Applications
T.D. (°F) Approximate RH (%) Application
7 to 9 90 Low product moisture loss. Vegetable, produce,
flower, unpackaged ice and chill rooms.
10 to 12 80 to 85 General storage and convenience store coolers,
packaged meats and vegetables, and fruits.
12 to 16 65 to 80 Moderate relative humidity requirements. Beer,
wine, pharmaceuticals, potatoes, onions, tough
skin fruit, and short term packaged products.
17 to 22 50 to 65 Humidity must remain low to avoid damage to
product. Prep/cutting rooms, beer warehouses,
candy or film storage and loading docks.
Source: (Heatcraft 2008)
Another component of evaporator unit design is the air flow rate that they operate
at. Air change needs for various applications are summarized in Table 92. The desired air
changes may be converted to air flow using Equation 111.
min60inf
hrVACHV
( 111 )

191
Table 92. Recommended Evaporator Induced Room Air Changes/Hour
Type of Application Recommended Air
Change/Hour Range
Holding Freezer 40 to 80
Packaged Holding Center 40 to 80
Cutting Rooms 20 to 30
Meat Chill Room 80 to 120
Boxed Banana Ripening 120 to 200
Vegetables and Fruit Storage 30 to 60
Blast Freezer 150 to 300
Work Areas 20 to 30
Unpackaged Meat Storage 30 to 60
Source: (Heatcraft 2008)
(SCE 2008)
eQuest, an energy modeling tool, was used by Southern California Edison (SCE
2008) to model walk-in coolers and freezers for development of Title 20 standards for
walk-in boxes. Energy efficiency focused improvements suggested by this report for
application to the Title 20 standard include strip curtain or spring hinged door infiltration
reduction, high efficiency lighting or controls, freezer floor insulation (R-28 or greater),
floating head pressure control, low head pressure capable compressors, variable speed
evaporator fans, temperature termination defrost control, and anti-sweat heater wattage
limits with humidity monitoring controls.
Four different walk-in types (250 ft2, 500 ft2, 1000 ft2, and 2,500 ft
2) were
simulated as coolers and freezers in a baseline configuration and with the improvements
noted above to determine the cost savings potential assuming a year round ground
temperature of 50°F. Details pertaining to the calculation of the walk-in load are listed in
Table 93.

192
Table 93. Refrigerated Walk-In Modeling Details
Cooler temperature (°F) 35
Freezer temperature (°F) 5
Product Load (%) 70
Lighting Load (W/ft2) 1.0
250 ft2 cooler infiltration rate (ACH) 1.00
500 ft2 cooler infiltration rate (ACH) 0.68
1000 ft2 cooler infiltration rate (ACH) 0.46
2500 ft2 cooler infiltration rate (ACH) 0.25
250 ft2 freezer infiltration rate (ACH) 0.78
500 ft2 freezer infiltration rate (ACH) 0.53
1000 ft2 freezer infiltration rate (ACH) 0.36
2500 ft2 freezer infiltration rate (ACH) 0.21
Source: (SCE 2008)
Strip curtain protected doors are assumed to have a 75% reduction in infiltration by
this study. Freezer floor insulation of R-28 is compared to the standard 6” concrete slab (R-
1.2). A film coefficient of 0.61 hr-ft2-°F/Btu (ASHRAE 2005) is applied.
(Goetzler et al. 2009)
Navigant discusses current equipment used for different applications in commercial
refrigeration. Commercial refrigeration energy usage accounts for 4.1 to 6.3% of primary
energy used by commercial buildings (DOE 2006; DOE 2008). Annual refrigeration energy
usage was broke down into various types of refrigeration equipment. Supermarket
refrigeration accounts for 56% of the total commercial refrigeration energy usage, with
non-supermarket walk-ins accounting for an additional 12%. Opportunities to reduce
energy usage are presented and compared to the current state.
The quantity of various units in the domestic U.S. is presented for calculation of
energy savings (Table 94). The quantities of retailers that utilize this equipment are listed
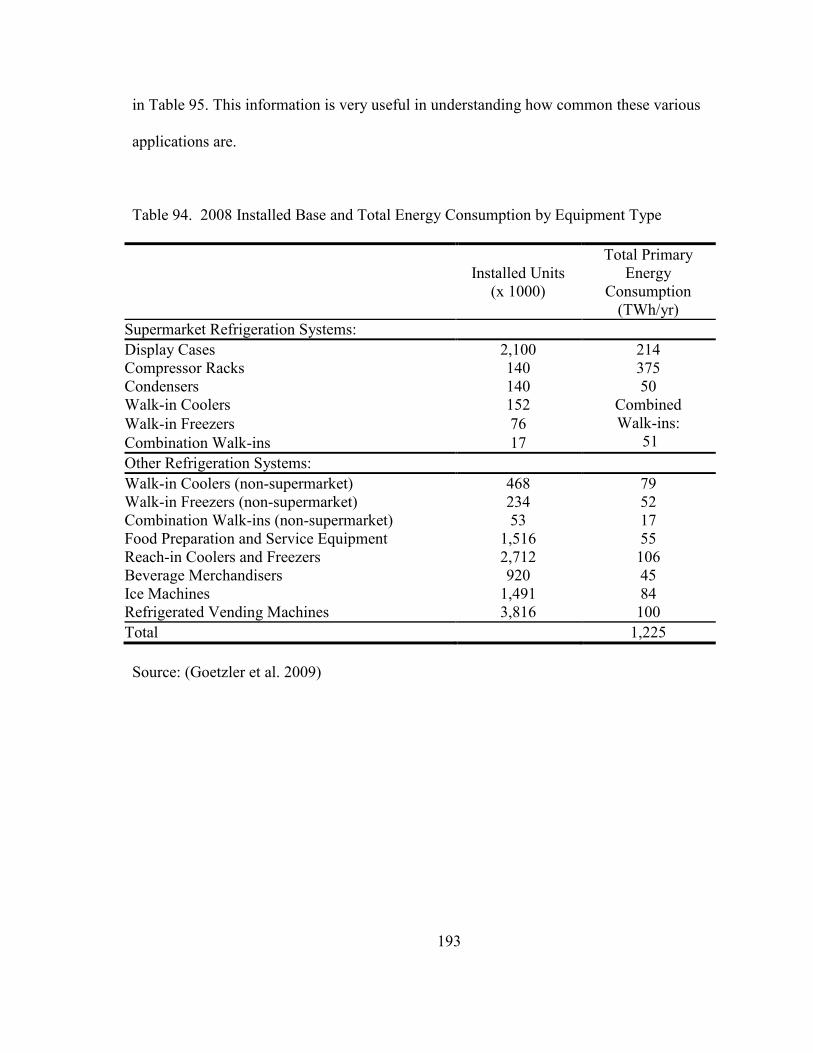
193
in Table 95. This information is very useful in understanding how common these various
applications are.
Table 94. 2008 Installed Base and Total Energy Consumption by Equipment Type
Installed Units
(x 1000)
Total Primary
Energy
Consumption
(TWh/yr)
Supermarket Refrigeration Systems:
Display Cases 2,100 214
Compressor Racks 140 375
Condensers 140 50
Walk-in Coolers 152 Combined
Walk-ins:
51 Walk-in Freezers 76
Combination Walk-ins 17
Other Refrigeration Systems:
Walk-in Coolers (non-supermarket) 468 79
Walk-in Freezers (non-supermarket) 234 52
Combination Walk-ins (non-supermarket) 53 17
Food Preparation and Service Equipment 1,516 55
Reach-in Coolers and Freezers 2,712 106
Beverage Merchandisers 920 45
Ice Machines 1,491 84
Refrigerated Vending Machines 3,816 100
Total 1,225
Source: (Goetzler et al. 2009)
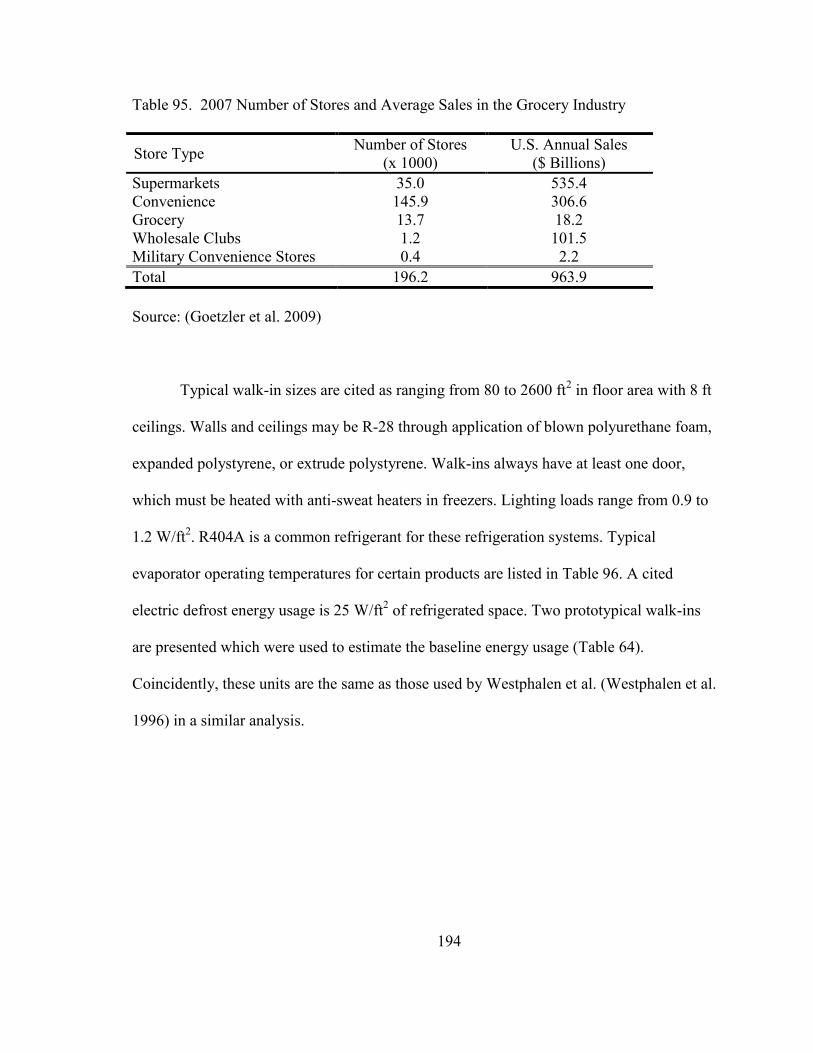
194
Table 95. 2007 Number of Stores and Average Sales in the Grocery Industry
Store Type Number of Stores
(x 1000)
U.S. Annual Sales
($ Billions)
Supermarkets 35.0 535.4
Convenience 145.9 306.6
Grocery 13.7 18.2
Wholesale Clubs 1.2 101.5
Military Convenience Stores 0.4 2.2
Total 196.2 963.9
Source: (Goetzler et al. 2009)
Typical walk-in sizes are cited as ranging from 80 to 2600 ft2 in floor area with 8 ft
ceilings. Walls and ceilings may be R-28 through application of blown polyurethane foam,
expanded polystyrene, or extrude polystyrene. Walk-ins always have at least one door,
which must be heated with anti-sweat heaters in freezers. Lighting loads range from 0.9 to
1.2 W/ft2. R404A is a common refrigerant for these refrigeration systems. Typical
evaporator operating temperatures for certain products are listed in Table 96. A cited
electric defrost energy usage is 25 W/ft2 of refrigerated space. Two prototypical walk-ins
are presented which were used to estimate the baseline energy usage (Table 64).
Coincidently, these units are the same as those used by Westphalen et al. (Westphalen et al.
1996) in a similar analysis.

195
Table 96. Evaporator Operating Ranges for Various Products
Temperature
Range (°F) Applications
High Temperature 35 and above Produce, Flowers
Medium Temperature 10 to 15 Meats, Seafood
Medium Temperature 15 to 25 Dairy, Produce, Beverages, Meat Walk-ins
Medium Temperature 25 to 35 Dairy and Produce Walk-ins, Prep Rooms
Low Temperature -25 to -15 Frozen Foods
Very Low Temperature -35 to -25 Ice Cream, Frozen Bakery
Source: (Goetzler et al. 2009)
(DOE 2010b)
The DOE Preliminary Technical Support Document (TSD) (DOE 2010b) presents a
preliminary analysis of the current market of walk-in coolers and freezers. In order to
understand the full picture, the technologies‟ energy use, initial cost, and cost to
manufacture were all taken into account. In consideration of improving the energy
efficiency of walk-in coolers and freezers, the effect on consumers and manufacturer‟s was
analyzed. Four types of walk-ins were analyzed, including non-display and display walk-in
coolers and freezers. Three different footprints were considered, including small (10 x 8 x
7.6 ft tall), medium (12 x 20 x 9.5 ft tall), and large (25 x 30 x 12 ft tall), but an industry
discussion revealed that the grouping may have not been appropriate. Small walk-ins
typically range from 200 to 400 ft2. The height of the space significantly changes the
design, with heights ranging from 8 to 30 ft, where 30 ft is more applicable to a warehouse
construction. Six equipment classes were analyzed, including dedicated refrigeration
system with condenser indoors, dedicated refrigeration system with condenser outdoors,
and multiplex refrigeration systems for low or medium temperature applications.

196
An overview of walk-in coolers and freezers revealed that coolers operate above
32°F and freezers operate below. These boxes typically use automatic door closers for a
tight closure, some method of infiltration protection, and insulation better than R-25 for
coolers and R-32 for freezers, with freezers using R-28 or better for floor insulation.
Insulated walls used for these sizes of walk-ins are typically prefabricated panels with a
foam core and a metal skin on either side.
In the analysis of walk-in performance, a baseline system was developed, and
multiple variations to system design were simulated to analyze the effect of each
component on the overall energy efficiency and first cost of the system. The baseline
envelopes used 4” of wall and ceiling insulation, composed of extruded polystyrene or
polyurethane. Freezer floors are insulated to R-28, as noted as typical above, and coolers
have no floor insulation. Display walk-ins have glass display doors with an R-value of 2.3
hr-ft-°F/Btu. Walk-ins were assigned a certain number of doors based on their size and
type. Passage doors had a glass area of 0.9 ft2 and door dimensions of 3 x 7 ft. Freight
doors were 7 x 9 ft tall for small and medium walk-ins and 7 x 12 ft tall for large walk-ins.
Display doors are 2.5 x 6.3 ft tall in this study.
Table 97. Number of Doors for Each Walk-in Type
Display Doors Passage Doors Freight Doors
Non-display small 0 1 0
Non-display medium 0 1 1
Non-display large 0 2 1
Display small 3 1 0
Display medium 8 1 0
Display large 50 2 0
Source: (DOE 2010b)

197
No infiltration reduction devices, door systems, or anti-sweat heater control are
utilized. Lighting is done with 5 ft T8 fluorescents. Design option alternatives that were
analyzed in this study are noted below. The refrigeration equipment and control methods
used to serve the walk-ins were also varied to analyze the effect on the overall efficiency
and first cost.
Wall/ceiling insulation thickness: 4”, 4.4”, 5”, 6”, and 7”.
Floor insulation: none, 4”, 5”, and 6”.
Insulation materials: extruded polystyrene/polyurethane (5.90 hr-ft-°F/Btu-in),
vacuum insulation panels (29.15 hr-ft-°F/Btu-in), and hybrid panels (75% vacuum
insulated, 25% standard foam insulation).
Display Door R-values: 2.3, 3.7, 8.1, and 12.5 hr-ft-°F/Btu.
Sealants for pre-fabricated panel joints: gasket, gasket and caulking, and advanced
tongue and groove.
Infiltration protection devices: none, strip curtain, and air curtain
Door systems: none and vestibules (98% effectiveness).
Anti-sweat heater: no control or control
Lighting: T8 fluorescent, compact fluorescent, or LED
Other controls: no control, lighting sensors, and door opening control
Using finite element analysis and specific walk-in operating temperatures, DOE
determined floor heat flux for various levels of floor insulation. Results varied based on the
floor area and are presented in Table 98.

198
Table 98. Average Heat Flux for Various Footprints of Walk-in Coolers (35°F ) and
Freezers (-10°F)
Floor Area (ft2) Average Heat Flux (Btu/h-ft
2)
Cooler Floor R-Value: 0 22.42 28.03
36 8.61 1.48 1.21
71.4 7.31 1.43 1.18
80 6.90 1.41 1.17
240 4.40 1.31 1.10
750 2.97 1.13 0.97
1200 3.04 1.18 1.01
Freezer Floor R-Value: 22.42 28.03 33.64
36 3.15 2.59 2.20
48 3.11 2.56 2.18
71.4 3.04 2.51 2.14
180 2.88 2.40 2.06
500 2.54 2.16 1.88
1200 2.51 2.14 1.86
Source: (DOE 2010b)
Parameters used by DOE for their calculations, which are pertinent to this study,
include information related to the loads of the walk-in. Freezers were operated at -10°F and
60% relative humidity and coolers were operated at 35°F and 60% relative humidity with
an ambient exterior temperature of 75°F and 40% relative humidity. The concrete floor
temperature was assumed to be 60°F for coolers and 65°F for freezers. Associated with the
transmission load as well, DOE specified an external film coefficient of 0.68 hr-ft2-°F/Btu,
internal film coefficient of 0.25 hr-ft2-°F/Btu, and floor film coefficient of 0.87 hr-ft
2-
°F/Btu. Infiltration details specified include the door flow factor of 0.8, display door
opening schedule of 72 per day at 8 seconds per opening, passage door opening schedule of
60 per day at 12 seconds per opening with an additional 15 minutes per day that the door
stands open, and a freight door opening schedule of 60 openings per day at 12 seconds per

199
opening with an additional 15 minutes per day that the door stands open. The anti-sweat
heater provided 1 W of heat per foot of display door perimeter, with 70% of that heat
transferred into the refrigerated space. Defrosts are 15 minutes in duration at 4 defrosts per
day.
(DOE 2010c)
This presentation (DOE 2010c) is a summary of the Technical Support Document
(TSD) for energy conservation in walk-in coolers and freezers (DOE 2010b) and
correspondence with industry experts following the TSD being presented (DOE 2010a).
Walk-ins are noted as any refrigerated space less than 3,000 ft2. Walk-in coolers
operate above 32°F and freezers operate at or below 32°F. Typical outdoor conditions are
noted as 90°F for indoor condensing units and 35, 59, and 95°F for outdoor condensing
units. Foam is specified as the most common insulating material. Four inch thick foam
panels can vary significantly in R-value depending on what foam material is used, ranging
from 16 to 32 hr-ft2-°F/Btu. Steel which is used as the casing has an R-value of 0.16 hr-ft
2-
°F/Btu. Vacuum insulated panels have R-values ranging from 120 to 200 hr-ft2-°F/Btu. The
initial R-value deteriorates over time as gases diffuse from the foam and it takes on water
from the air.
DOE computer simulations of heat transfer through uninsulated cooler floors
developed the following two equations for heat flux (Equations 112 and 113) as a function
of floor area, assuming a sub-floor temperature of 65°F. A floor R-value of 28 hr-ft2-°F/Btu
is required for freezers and a ground temperature of 60°F is assumed.
Afloor < 750 ft2:
364.0153.33" floorfloor Aq ( 112 )
200
Afloor > 750 ft2: 84.2002.0" floorfloor Aq ( 113 )
Some assumed schedules are presented for lighting and anti-sweat heaters. Lights
are on 75% of the time when no timers or other shut-off systems are in place. A unit that
does have lights that automatically shut off may only use lights half of the time. Anti-sweat
heaters are on all the time in a typical walk-in, but through the use of heater controls this
may be reduced to half the time for freezers and 25% of the time for walk-in coolers.
(Becker et al. 2011)
The Final Report, prepared by Becker for the Air-Conditioning and Refrigeration
Technology Institute (ARTI) in 2011, consolidated information from a number of sources
(Becker et al. 2011). Information presented includes information of walk-in size,
construction, infiltration, and infiltration reduction
Data from monitored field sites is analyzed in this report (Table 99). Field sites are
in Massachusetts and Rhode Island and include one freezer and three coolers. One cooler is
for a convenience store whereas the other walk-ins are all utilized by a restaurant. In
addition to data on unit performance, the box operating conditions, box construction, walk-
in size and configuration, door size and type, anti-sweat heater loads, defrost loads and
cycles, lighting, product load, occupancy load, infiltration, and equipment loads are all
compared. Due to a current focus on energy efficiency, a number of articles discussed by
Becker et al. were related to new standards being put in place for future construction or
testing of new concepts to reduce energy usage of supermarket refrigeration.
Unfortunately, using this information to define a model load for a rating standard would
not be appropriate. The majority of equipment that is in service or will be brought into
service in the near future will not be the new energy efficient equipment. Typically, such

201
items are more expensive than standard equipment and require significant advantage or a
government mandate to incentivize selecting them.
Table 99. Runtime Analysis of Walk-in Coolers and Freezers
Walk-in Coolers Walk-in Freezers
Statistic Tedeschi
11 Door
Chili‟s
Beer
Chili‟s
Food
Field
Average
AHRI
1250/1251
Chili‟s
Food
AHRI
1250/1251
Min Hourly
Runtime %
9.5 1.8 8.4 6.6 24.0
Max Hourly
Runtime %
39.4 32.0 82.6 51.3 84.2
Ave. Hourly
Runtime %
24.8 13.1 44.0 27.3 45.7
Ave Low
Load RT%
16.4 7.7 25.8 16.6 10 33.3 40
Operation at
Low Load %
45.8 55.2 50.0 50.3 67 54.2 67
Ave High
Load RT%
32.3 19.6 61.9 37.9 70 60.4 80
Operation at
High Load %
54.2 44.8 50.0 49.7 33 45.8 33
Source: (Becker et al. 2011)
Door opening and closing events were recorded for three field sites, as was the
defrost cycle detail (Table 100). The Tedeschi 11-door cooler had an average of 9.3
openings per day of 4.8 minute average duration. Chili‟s food cooler had an average of
22.0 openings per day of 1.0 minute average duration. Chili‟s food freezer had an average
of 85.0 openings per day of 1.2 minute average duration. The AHRI Load Spreadsheet
(AHRI 2009a) was compared to the field door data with 55.5 openings per day of 0.41
minute average duration.

202
Table 100. Analysis of Walk-in Cooler and Freezer Defrost Cycles
Statistic Tedeschi
11 Door
Cooler
Chili‟s
Beer
Cooler
Chili‟s
Food
Cooler
Cooler
Average
Chili‟s
Food
Freezer
Average number of defrosts per day 1.75 1.25 4.25 2.42 3.00
Average duration of cycles (min) 41.6 24.3 34.6 33.5 37.8
Source: (Becker et al. 2011)
Becker et al. validated eQuest by comparing simulation results to field data
obtained from a PG&E instrumented freezer at the Food Service Technology Center
(FSTC). Three trials were analyzed with an average difference between eQuest results and
the physical test data of 3.0%, with eQuest overestimating the refrigeration system‟s energy
usage.
Seven locations were used for climate zone simulations in eQuest. This exercise
allowed comparison of the field site performance of walk-ins across the United States.
Climate zone locations include Miami, FL; San Antonio, TX; San Francisco, CA; Kansas
City, MO; Omaha, NE; Billings, MT; and International Falls, MN. Outside of a few initial
simulations, which included the validation simulation, four additional simulation setups
were utilized, including a small cooler, small freezer, large cooler, and large freezer.
Freezers that were simulated utilized a heated sub-floor maintaining a temperature of 50°F.
Becker analyzed the model load profile to determine if the Air-Conditioning,
Heating, and Refrigeration Institute (AHRI) was using appropriate assumptions on how a
typical walk-in cooler and freezer would be constructed and how it would be loaded. This
information is also included in the model load analysis of this thesis.
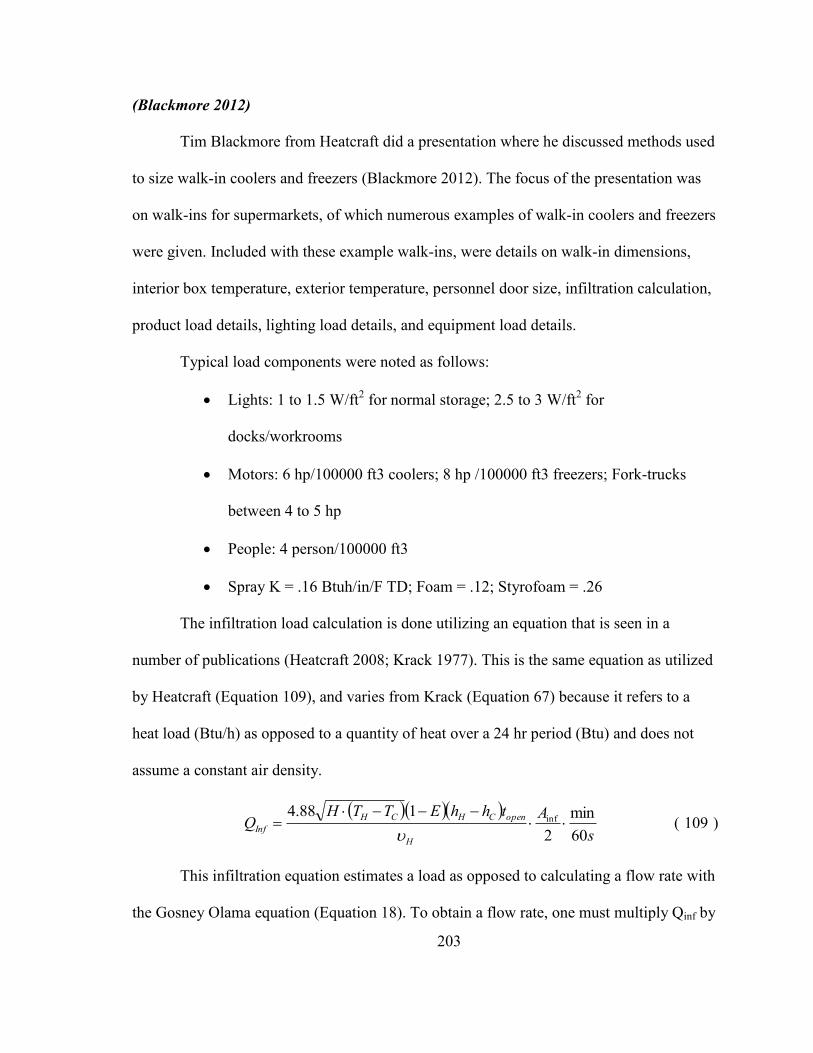
203
(Blackmore 2012)
Tim Blackmore from Heatcraft did a presentation where he discussed methods used
to size walk-in coolers and freezers (Blackmore 2012). The focus of the presentation was
on walk-ins for supermarkets, of which numerous examples of walk-in coolers and freezers
were given. Included with these example walk-ins, were details on walk-in dimensions,
interior box temperature, exterior temperature, personnel door size, infiltration calculation,
product load details, lighting load details, and equipment load details.
Typical load components were noted as follows:
Lights: 1 to 1.5 W/ft2 for normal storage; 2.5 to 3 W/ft
2 for
docks/workrooms
Motors: 6 hp/100000 ft3 coolers; 8 hp /100000 ft3 freezers; Fork-trucks
between 4 to 5 hp
People: 4 person/100000 ft3
Spray K = .16 Btuh/in/F TD; Foam = .12; Styrofoam = .26
The infiltration load calculation is done utilizing an equation that is seen in a
number of publications (Heatcraft 2008; Krack 1977). This is the same equation as utilized
by Heatcraft (Equation 109), and varies from Krack (Equation 67) because it refers to a
heat load (Btu/h) as opposed to a quantity of heat over a 24 hr period (Btu) and does not
assume a constant air density.
s
AthhETTHQ
H
openCHCH
Inf60
min
2
188.4inf
( 109 )
This infiltration equation estimates a load as opposed to calculating a flow rate with
the Gosney Olama equation (Equation 18). To obtain a flow rate, one must multiply Qinf by

204
the specific volume of the incoming air and the specific enthalpy difference between the
interior box air and the ambient air and divide by the quantity of the time that the door is
open.
Ground Temperature
The ground temperature has a significant effect on the box heat load, especially for
walk-in coolers. Walk-in freezers typically use some method to heat the walk-in floor to
keep the ground from freezing and heaving upward. A higher ground temperature simply
reduces the amount of heat that must be added below the walk-in to maintain the desired
soil temperature.
(DOE 2010a)
A DOE Transcript (DOE 2010a) was put together to document a discussion with
the public on the proposed rules to define test procedures for walk-in coolers and freezers.
A wealth of information is contained in this document, as industry professionals were the
primary attendants. Of particular interest to this work, is the information presented in
relation to ground temperature for walk-ins. Typically, industry professionals assume a
ground temperature of 55°F for walk-in design sizing. A ground temperature of 60°F may
be assumed if a more conservative sizing is desired.
(Newell 2011)
Ground heat transfer is an important factor in building design. A three-dimensional,
transient model was used to determine what level of insulation was necessary for the topic
project. In the model a region of Earth extending 98.4 ft horizontally from the building
perimeter and 16.4 ft deep was defined with a ground temperature of 50°F.

205
Soil is a dynamic substance with varying moisture content throughout the year.
Varying soil properties and freezing of the soil were not incorporated into the model except
for analysis of a range of soil thermal diffusivities (3.3 to 8.6 x 10⁻⁶
ft2/s).
(Somrani et al. 2008)
Somrani et al analyzed two methods for determining ground heat transfer gains for
ice rinks, with a goal of improving the design of these facilities in the future. These
methods include an analytical method using an inter-zone temperature estimation technique
and an implicit finite difference model analyzing heat transfer on a time-varying basis.
Loads on ice rink cooling systems include conductive loads from the floor, piping,
pumps, and ice resurfacing; convective loads from the air to ice surface; and radiant loads
between the ice surface and the ceiling (including light fixtures).
Soil temperatures and property assumptions for the model development were stated.
The water table temperature (16.4 ft below the surface) is assumed to be 50°F throughout
the year. The soil temperature near the surface fluctuates around 57.2°F (±19.2°F). Soil
thermal diffusivity was assumed to be 6.94 x 10⁻⁶
ft2/s.
(Chuangchid and Krarti 2001)
This paper analyzes floor heat load as it applies to residential and commercial
radiant floor heating applications. Similar to Somrani et al. (Somrani et al. 2008), slab and
soil temperatures are determined using the inter-zone temperature profile estimation
technique. An identical water table temperature assumption is made.

206
Evaporator Application and Defrost
(Smith 1989a)
Smith analyzed the psychrometrics of evaporator coil selection for a freezer
operating with exit temperatures of -15 to -5°F. His calculations built toward solving for
the required coil face area (CFA) (Equations 114 to 119).
RER
GRL
ton
hBtuCFA
000,12 ( 114 )
FHRNRLGRL 1 ( 115 )
LSHR
TTBFuCRER
aout
csainFV
11 ( 116 )
csain
csaout
TT
TTBF
( 117 )
FHFRER
FHFFHR
( 118 )
ain
ainrHEPFPFHF
( 119 )
(Faramarzi 1999)
Faramarzi discusses the components of the refrigeration load seen by a display case.
Each load component is analyzed on a theoretical basis and opportunities are noted for
improving the efficiency of display cases.
Display case cooling load components include transmission heat gain, radiation
heat gain, infiltration sensible and latent heat load, lighting and motor heat gain, anti-sweat
heater and defrost heat gain, product pull down load, and product latent heat of respiration.
207
Defrost types vary depending on the case temperature. Medium temperature cases
with evaporator temperatures around 30°F use off-cycle defrost, which essentially means
that refrigerant flow is shut off to the case. This allows the coil temperature to rise above
32°F to melt the frost. Reverse air defrost is used to speed up this process. This method
pulls air from the store to melt frost. Neither of these methods require an auxiliary heat
source in the classical sense.
Low temperature applications require an auxiliary heat source for defrost. Electric
defrost works by using elements located near the evaporator. During defrost the fans and
refrigerant flow are shut off and the elements are turned on. Hot gas defrost back-flows
compressor discharge gas into the evaporator to defrost the coil from the inside. This
method adds up to 85% more heat than required to melt the ice. The defrost period is
controlled by either a timer or a temperature sensor.
Anti-sweat heaters typically operate continuously in low temperature or glass door
cases, keeping ice from forming on some surfaces in the display case.
An 8 ft open vertical meat case was tested at ambient room conditions of 75°F dry
bulb and 55% relative humidity. The resulting load distribution was 3% evaporator fans,
4% conduction loading, 12% radiant load, 8% lighting load, and 73% infiltration load. The
infiltration load is the most significant portion of an open display case heat load even when
an air curtain is utilized. To ensure the most energy efficient operation of an open case,
proper air curtain flow is essential. Product should not block the flow path, and air curtains
should be in good condition and orientation.

208
(Sujau et al. 2006)
A great deal of research has gone into optimizing the defrost cycle, as it is a
significant load on the system. Factors influencing the formation of frost on a coil include
the coil design, box operating conditions, and the efficiency of the defrost system. An
additional variable is the frequency and duration of each defrost cycle.
Sujau et al. performed testing on a 10.8 x 14.4 x 9.8 ft tall walk-in box with electric
defrost (4.6 kW) to determine the effect of defrost cycle period and frequency on the
overall system efficiency. Defrost intervals of 6 to 30 hrs were tested. The walk-in was
entered through a 3.9 x 7.9 ft door fitted with a strip curtain.
Lighting Load
(Kassa et al. 2004)
With a focus on consumer safety, a study of 57 food service establishments was
performed to analyze the efficacy of qualitative light levels. Locations tested within each
establishment included walk-ins and food preparation counters. Results are compared to the
Federal Food Code (FDA 2001) specified as 10 foot-candles at 30 inches above the floor
and 50 foot-candles on food preparation surfaces.
Of the 55 walk-in coolers tested, 12 used fluorescent lighting and 43 used
incandescent. Measurements were taken in the center of the walk-ins. The geometric mean
of the results from the fluorescent lit walk-ins was 15.3 foot candles, ranging from 6.4 to
85.5 ft-c. Seventy five percent of the coolers met the standard. The geometric mean of the
results from the incandescent lit walk-ins was 3.4 ft-c, ranging from 1 to 16.7 ft-c. Only 7%
of incandescently lit walk-ins met the standard. Analysis of 185 food preparation counters
209
revealed a geometric mean of 38.7 ft-c, ranging from 2.9 to 196.8 ft-c. Only 23% of
establishments met the standard.
Infiltration Load
(Fricke and Becker 2011)
Supermarkets utilize open and glass-doored display cases. Glass-doored display
cases have a significant energy use advantage, but many retailers resist using them because
they believe that these type display cases also reduce purchases, as the customer must open
a door to get to the product. In support of using glass doored display cases, Fricke cites the
fact that 50% of supermarket energy usage is for refrigeration of foods (Westphalen et al.
1996) and that 70% of the load on open display cases is due to infiltration (Faramarzi et al.
2002). Faramarzi found that installation of glass doors on a display case reduced the
refrigeration load by 68%, reduced compressor power by 87%, and simultaneously reduced
product temperature by 6°F. This allows for smaller central refrigeration systems and
higher food quality.
Fricke performed testing on two similar 25,000 ft2 supermarkets to highlight the
differences in performance and sales due to installation of glass-doored display cases. The
first store is in Osawatomie, KS with average sales of $80,000 per week. This location
utilizes new doored cases to store dairy products (48 ft, 20 door) and alcoholic beverages
(12 ft, 6 door). The second store is located in Wamego, KS with weekly sales of $140,000.
This store displays alcoholic beverages in a new 24 ft open multi-deck case.
An analysis was done of the test data (Table 101) where the daily refrigeration load
was defined by Equation 120, and compressor power (Equation 121) is determined via the
energy-efficiency ratio (EER) of the refrigeration system, which is calculated using the

210
adjusted dew-point temperature. The adjusted dew point was determined as the saturated
temperature of the refrigerant at the evaporator pressure less 2°F.
hr
s
tt
hhmQ
dttot
stottot
360031
( 120 )
s
hr
EERkW
W
ttQCEC dttot
tot3600
1000
( 121 )
Table 101. Test Result Comparison of Doored and Non-doored Display Cases
Doored Display Case
(Store #1)
Open Display Case
(Store #2)
Compressor Electric Energy (kWh/day-ft) 0.46 1.76
Lighting Electric Energy (kWh/day-ft) 0.47 0.22
Evap. Fan Electric Energy (kWh/day-ft) 0.18 0.24
Anti-sweat Electric Energy (kWh/day-ft) 0.61 --
Total Electric Energy (kWh/day-ft) 1.71 2.21
Beverage Sales Increase Post Installation 27% 29%
Dairy Sales Increase Post Installation -2.8% -0.5%
Source: (Fricke and Becker 2011)
Open door case energy use varies depending on the store conditions. The system
uses 25% more energy when the store relative humidity is increased from 20 to 45%. No
correlation between door openings on doored cases and energy consumption was
determined. Door openings were recorded for Store #1 at 4792 from April 13, 2009 to June
3, 2009 with a mean duration of 31 seconds, ranging from 1 seconds to 30 minutes, 42
seconds.
211
Ambient and Box Conditions
(Mitchell et al. 1992)
Store air conditioning and air dehumidification techniques are investigated by
Mitchell et al. (Mitchell et al. 1992). Operating performance, operating cost, and
installation costs are calculated and compared for multiple system types and configurations.
Information pertinent to this study included details on the conditions inside
supermarkets. These conditions will affect both the conduction and infiltration load on the
refrigerated space. Supply air inlet temperatures ranged from 60 to 70°F during the cooling
season and were around 72°F during the winter months. Mitchell analyzed supermarket
HVAC systems maintaining 58°F at 55% relative humidity and 71°F at 50% relative
humidity.
(Thompson and Spinoglio 1996)
This report provides insight into the types of refrigerated rooms available for
perishable product storage, suggested operating conditions for different products, and some
crude sizing information (Thompson and Spinoglio 1996).
Walk-in boxes are noted to range from 6 x 8 ft in floor plan to 20 x 20 ft. Thompson
et al. suggests that 12 to 18 inches be left above the product to allow good air flow through
the facility, and that fiberglass insulation, polystyrene, or urethane foam board be used to
obtain an R-value of at least 19 h-ft2-°F/Btu. The discussion on types of refrigerated
storage facilities is not confined to stationary buildings. In addition to the prefabricated and
owner built cold rooms discussed, Thompson et al. discusses refrigerated transportation
options, including rail cars, highway vans, and cargo containers.
212
Suggested storage temperatures for various fruits and vegetables are presented.
These commodities are broken down into three groups, including those that are to be stored
at temperatures of 32 to 36°F and 90 to 98% relative humidity, products stored at 45 to
50°F and 85 to 95% relative humidity, and finally items to be stored at temperatures
ranging from 55 to 65°F and a relative humidity of 85 to 95%. Higher humidity conditions
are obtained by oversizing the evaporator coil to allow a higher saturated suction
temperature and thereby reduce the amount of condensate.
One set of product loading information is provided through an example cold room.
The 16 x 19 ft walk-in operates at 33°F and has 581 boxes of product turnover every 24
hours.
(Henderson and Khattar 1999)
Typically, refrigerated storage conditions correspond to relatively high humidities.
Moisture in the box air is condensed onto the evaporator coil during system operation. Not
only does this increase the heat load on the coil by adding latent heat of vaporization, but it
reduces coil performance by limiting air flow and insulating the heat transfer surfaces.
Field tests were performed on two supermarkets to investigate the relationship
between humidity, defrost, and energy usage. The first store (33,400 ft2) is in Minneapolis,
operates 24 hours a day, and contains 2,849 ft2 of walk-in coolers and freezers (Table 103).
The initial system utilized hot gas, time-terminated defrost and 10 kW of anti-sweat
heaters. The second store (50,000 ft2) is in Indianapolis and operates 24 hours a day. This
supermarket contains 3,685 ft2 of total walk-in footprint (Table 102). The initial system
uses electric, pressure terminated defrost. A 9kW anti-sweat heater is used to keep the door
213
free to move. Daily average space humidity ranges from 30 to 50%, with ambient
temperatures ranging from 59 to 89°F.
Modifications to the systems‟ control methods were performed to analyze the
effects. These modifications included, temperature-terminated defrost and anti-sweat heater
control. Test data was analyzed to understand the relationship between energy use, and
ambient temperature and space humidity.
Energy usage trends linearly with the outside ambient conditions down to about 60
or 70°F. Below these conditions energy usage is still reducing but at a slightly flatter rate.
Energy usage is essentially constant at ambient conditions of 20°F or less. The effect of
space humidity is a little more difficult to determine, but a multi-linear regression was
developed to simplify the analysis. At a 22% relative humidity, every 1% increase in the
space relative humidity increases energy usage by 10 kWh/day (0.4% change in energy
usage / 1% change in relative humidity for Store B).
Analyzing the benefit to the system by using temperature-terminated defrost
presented some additional information about the effect of humidity on the system
performance. At a relative humidity of 36%, the temperature-terminated system operates
with the same efficiency as the time-terminated system. Above this humidity level the
temperature-terminated system actually uses more energy, suggesting that the time-
terminated system may be set at too short of a duration.
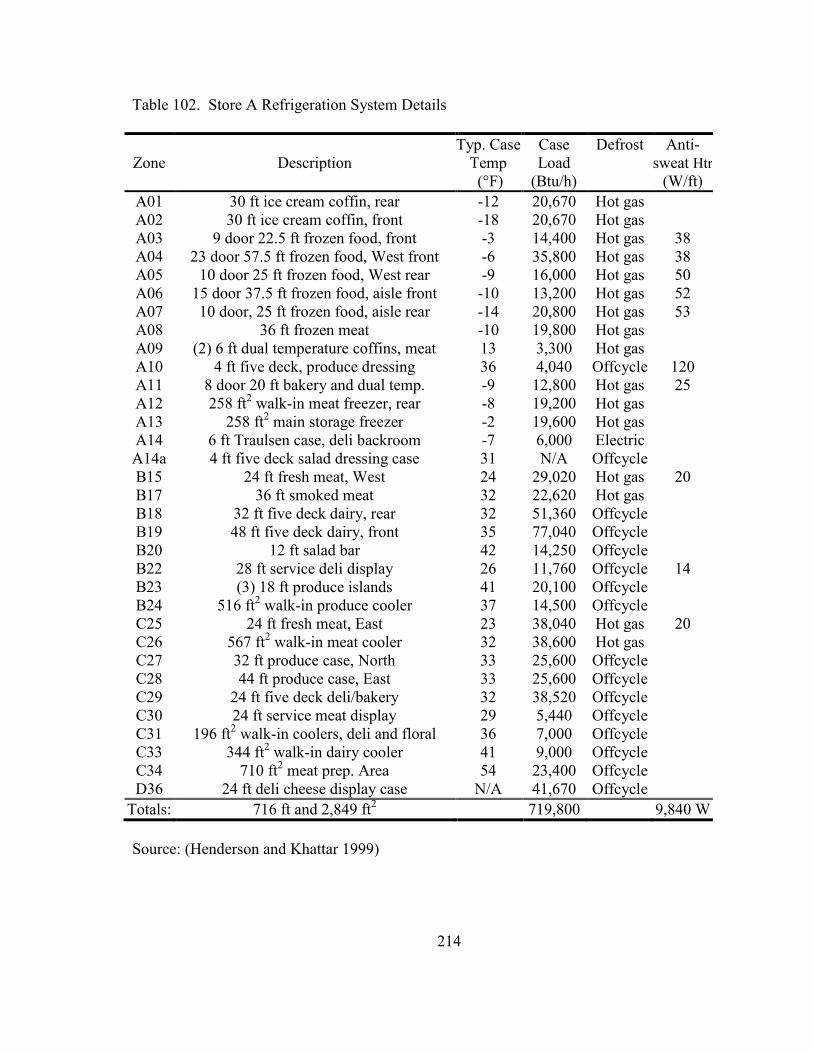
214
Table 102. Store A Refrigeration System Details
Zone Description
Typ. Case
Temp
(°F)
Case
Load
(Btu/h)
Defrost Anti-
sweat Htr
(W/ft)
A01 30 ft ice cream coffin, rear -12 20,670 Hot gas
A02 30 ft ice cream coffin, front -18 20,670 Hot gas
A03 9 door 22.5 ft frozen food, front -3 14,400 Hot gas 38
A04 23 door 57.5 ft frozen food, West front -6 35,800 Hot gas 38
A05 10 door 25 ft frozen food, West rear -9 16,000 Hot gas 50
A06 15 door 37.5 ft frozen food, aisle front -10 13,200 Hot gas 52
A07 10 door, 25 ft frozen food, aisle rear -14 20,800 Hot gas 53
A08 36 ft frozen meat -10 19,800 Hot gas
A09 (2) 6 ft dual temperature coffins, meat 13 3,300 Hot gas
A10 4 ft five deck, produce dressing 36 4,040 Offcycle 120
A11 8 door 20 ft bakery and dual temp. -9 12,800 Hot gas 25
A12 258 ft2 walk-in meat freezer, rear -8 19,200 Hot gas
A13 258 ft2 main storage freezer -2 19,600 Hot gas
A14 6 ft Traulsen case, deli backroom -7 6,000 Electric
A14a 4 ft five deck salad dressing case 31 N/A Offcycle
B15 24 ft fresh meat, West 24 29,020 Hot gas 20
B17 36 ft smoked meat 32 22,620 Hot gas
B18 32 ft five deck dairy, rear 32 51,360 Offcycle
B19 48 ft five deck dairy, front 35 77,040 Offcycle
B20 12 ft salad bar 42 14,250 Offcycle
B22 28 ft service deli display 26 11,760 Offcycle 14
B23 (3) 18 ft produce islands 41 20,100 Offcycle
B24 516 ft2 walk-in produce cooler 37 14,500 Offcycle
C25 24 ft fresh meat, East 23 38,040 Hot gas 20
C26 567 ft2 walk-in meat cooler 32 38,600 Hot gas
C27 32 ft produce case, North 33 25,600 Offcycle
C28 44 ft produce case, East 33 25,600 Offcycle
C29 24 ft five deck deli/bakery 32 38,520 Offcycle
C30 24 ft service meat display 29 5,440 Offcycle
C31 196 ft2 walk-in coolers, deli and floral 36 7,000 Offcycle
C33 344 ft2 walk-in dairy cooler 41 9,000 Offcycle
C34 710 ft2 meat prep. Area 54 23,400 Offcycle
D36 24 ft deli cheese display case N/A 41,670 Offcycle
Totals: 716 ft and 2,849 ft2 719,800 9,840 W
Source: (Henderson and Khattar 1999)
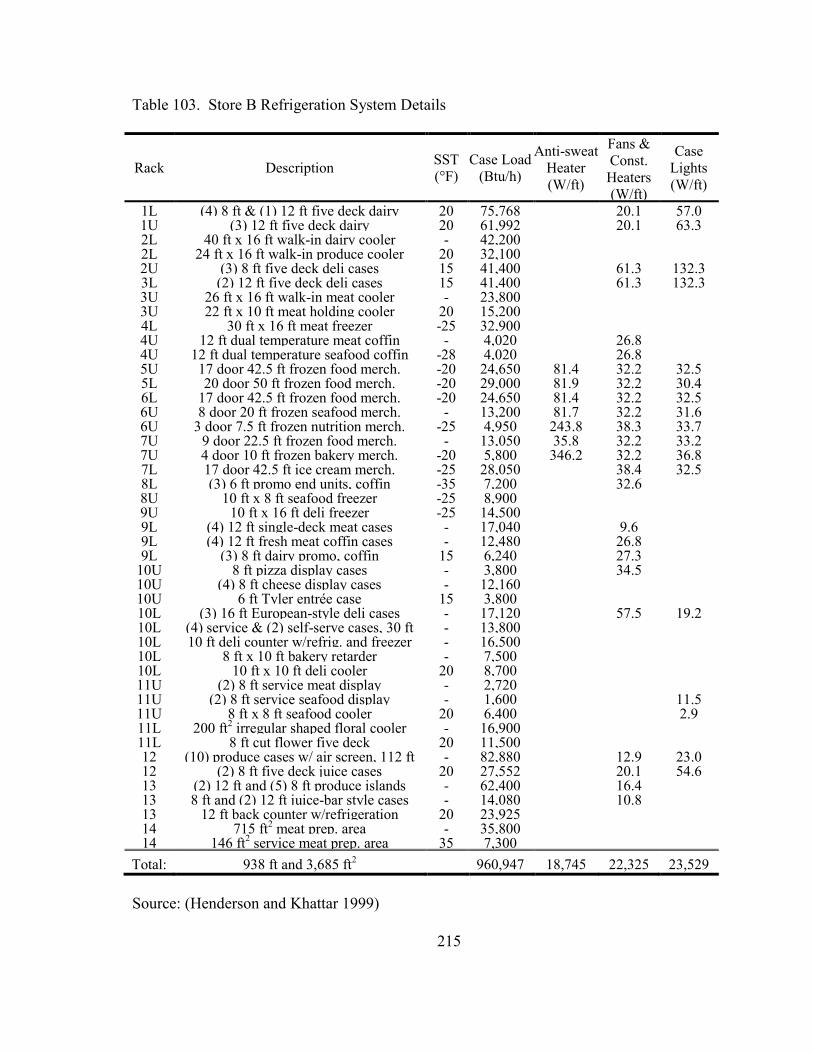
215
Table 103. Store B Refrigeration System Details
Rack Description SST
(°F)
Case Load
(Btu/h)
Anti-sweat
Heater
(W/ft)
Fans &
Const.
Heaters
(W/ft)
Case
Lights
(W/ft)
1L (4) 8 ft & (1) 12 ft five deck dairy 20 75,768 20.1 57.0 1U (3) 12 ft five deck dairy 20 61,992 20.1 63.3 2L 40 ft x 16 ft walk-in dairy cooler - 42,200 2L 24 ft x 16 ft walk-in produce cooler 20 32,100 2U (3) 8 ft five deck deli cases 15 41,400 61.3 132.3 3L (2) 12 ft five deck deli cases 15 41,400 61.3 132.3 3U 26 ft x 16 ft walk-in meat cooler - 23,800 3U 22 ft x 10 ft meat holding cooler 20 15,200 4L 30 ft x 16 ft meat freezer -25 32,900 4U 12 ft dual temperature meat coffin - 4,020 26.8 4U 12 ft dual temperature seafood coffin -28 4,020 26.8 5U 17 door 42.5 ft frozen food merch. -20 24,650 81.4 32.2 32.5 5L 20 door 50 ft frozen food merch. -20 29,000 81.9 32.2 30.4 6L 17 door 42.5 ft frozen food merch. -20 24,650 81.4 32.2 32.5 6U 8 door 20 ft frozen seafood merch. - 13,200 81.7 32.2 31.6 6U 3 door 7.5 ft frozen nutrition merch. -25 4,950 243.8 38.3 33.7 7U 9 door 22.5 ft frozen food merch. - 13,050 35.8 32.2 33.2 7U 4 door 10 ft frozen bakery merch. -20 5,800 346.2 32.2 36.8 7L 17 door 42.5 ft ice cream merch. -25 28,050 38.4 32.5 8L (3) 6 ft promo end units, coffin -35 7,200 32.6 8U 10 ft x 8 ft seafood freezer -25 8,900 9U 10 ft x 16 ft deli freezer -25 14,500 9L (4) 12 ft single-deck meat cases - 17,040 9.6 9L (4) 12 ft fresh meat coffin cases - 12,480 26.8 9L (3) 8 ft dairy promo, coffin 15 6,240 27.3
10U 8 ft pizza display cases - 3,800 34.5 10U (4) 8 ft cheese display cases - 12,160 10U 6 ft Tyler entrée case 15 3,800 10L (3) 16 ft European-style deli cases - 17,120 57.5 19.2 10L (4) service & (2) self-serve cases, 30 ft - 13,800 10L 10 ft deli counter w/refrig. and freezer - 16,500 10L 8 ft x 10 ft bakery retarder - 7,500 10L 10 ft x 10 ft deli cooler 20 8,700 11U (2) 8 ft service meat display - 2,720 11U (2) 8 ft service seafood display - 1,600 11.5 11U 8 ft x 8 ft seafood cooler 20 6,400 2.9 11L 200 ft
2 irregular shaped floral cooler - 16,900
11L 8 ft cut flower five deck 20 11,500 12 (10) produce cases w/ air screen, 112 ft - 82,880 12.9 23.0 12 (2) 8 ft five deck juice cases 20 27,552 20.1 54.6 13 (2) 12 ft and (5) 8 ft produce islands - 62,400 16.4 13 8 ft and (2) 12 ft juice-bar style cases - 14,080 10.8 13 12 ft back counter w/refrigeration 20 23,925 14 715 ft
2 meat prep. area - 35,800
14 146 ft2 service meat prep. area 35 7,300
Total: 938 ft and 3,685 ft2 960,947 18,745 22,325 23,529
Source: (Henderson and Khattar 1999)

216
At 55% relative humidity the anti-sweat heater operates at full capacity to keep
surfaces above dew point. Through a simple heat transfer and psychrometric analysis, the
rate at which the heater drops off with reduced humidity levels was increased from 3.5
kWh/day-RH% to 7.8 kWh/day-RH% for Store A and from 4.6 kWh/day-RH% to 9.1
kWh/day-RH% for Store B.
(Wichman and Braun 2009)
Wichman and Braun (Wichman and Braun 2009) experimented with the
effectiveness of applying fault detection and diagnostics to a refrigeration system. The
diagnostic method determines fault conditions through a logical approach to common
issues and resulting effects that may be strongly linked to those issues. Through an
understanding of what issues will likely happen in the system and by adding some logic to
the system for calculation of system conditions based on only system temperatures, the
number of sensors required was reduced to the minimum of 13.
A walk-in cooler and freezer were used to analyze the detection methodology by
simulating system issues, including compressor valve leakage, liquid-line restriction,
condenser fouling, evaporator fouling, ice accumulation, low refrigerant charge, and high
refrigerant charge. The walk-in cooler operates with R-22 to maintain an interior
temperature of 37.4°F and the freezer uses R-404a. The ambient temperatures simulated
include 55, 75, and 95°F.
(Edwards 2010)
Comments made by Southern California Edison, San Diego Gas and Electric, and
Sacramento Municipal Utility District to the “DOE Notice of Proposed Rulemaking Test

217
Procedures for Walk-In Coolers and Walk-In Freezers” are summarized in this report
(Edwards 2010).
Proposed test conditions include:
Cooler box temperature of 55°F
Freezer box temperature of 20°F
Infiltration temperature difference of 70°F
Ambient dry bulbs of 35, 59, and 95°F
Saturated suction temperatures of -40, -22, 18 and 35°F
Condensing temperatures of 110°F with a 65°F superheat
Comments included information primarily related to system temperatures. Return
gas temperature is around 41°F for walk-in coolers and 5°F for freezers. A cooler operates
between 32 and 55°F, with a total chilled area of less than 3000 ft2. Walk-in freezers are
also defined as being smaller than 3000 ft2 and operating at temperatures below freezing.
The capacity of the system may best be approximated by the enthalpy difference
between the liquid line and 10°F superheated gas leaving the evaporator coil. The
superheated gas temperature is typically 35°F for coolers and -10°F for freezers.

218
CHAPTER 4
DEVELOPMENT OF PROPOSED MODEL LOAD PROFILE
Following review of the current work and a thorough analysis of the available
literature, information pertinent to developing an appropriate model load profile was
compiled. Due to the volume of information and sources, the comparisons were reduced
into different facets of the model load, including site conditions, box conditions, box
conduction, infiltration, infiltration protection, product, lighting and occupancy, and
miscellaneous loads. This analysis was performed for walk-in coolers and freezers with the
exception of site conditions, infiltration protection, and door details, as they apply in a
similar manner to both walk-in coolers and freezers.
The primary assumption of this work is that the occurrence of particular situations
in real applications in industry is in a similar proportion to the number occurrences of that
same situation in published works. Results were therefore windowed and averaged to
determine what the most typical occurrence was. Using this as a guide, values for each
component of the model load are proposed.
Walk-in Boxes
As mentioned previously, there are some parameters which are applicable to both
walk-in coolers and freezers. In the present work, site conditions, infiltration protective
devices, and door details are applied to the calculation of a model load in the same manner
for walk-in coolers and freezers.
Site Conditions
Site conditions include the outdoor temperature and relative humidity, solar loading
on the exterior of the walk-in box, ground temperature, and the indoor conditions of the
219
facility that the walk-in is serving. Ground conditions will be discussed individually for
walk-in coolers and freezers, as they vary for each application. Fifty-two articles presented
information related to the site conditions that affect walk-in coolers and freezers, including
(Adre and Hellickson 1989), (Altwies 1998), (Altwies and Reindl 1999), (Anonymous
2004), (Arias 2005), (Arias and Lundqvist 2006), (Becker et al. 2011), (Blackmore 2012),
(Christensen and Bertilsen 2004), (CIGR 1999), (Cleland 1983), (Cooper 1973), (Devres
and Bishop 1995), (DOE 2010b), (DOE 2010c), (Faramarzi 1999), (Foster et al. 2003),
(Goetzler et al. 2009), (Gosney and Olama 1975), (Hayes and Stoecker 1969), (Heatcraft
2008), (Henderson and Khattar 1999), (Hendrix et al. 1989), (Huan 2008), (Kimber 1998),
(Krack 1977), (Kun et al. 2007), (Longdill and Wyborn 1978), (Love and Cleland 2007),
(Manske 1999), (Mitchell et al. 1992), (Nagaraju et al. 2001), (Navy 1986), (Patel et al.
1993), (PG&E 2007), (Pham and Oliver 1983), (Roy 2010), (SCE 2008), (SCE 2009),
(Sekhar et al. 2004), (Sekhar and Lal 2005), (Stoecker 1998), (Stoeckle 2000), (Stoeckle et
al. 2002), (Sujau et al. 2006), (Walker et al. 1990), (Walker 1992), (Walker 2001), (Walker
and Baxter 2002), (Westphalen et al. 1996), (Wichman and Braun 2009), and (Zhang
2006).
All of the information discerned from the literature related to site conditions,
whether reported from the field of industrial or commercial refrigeration, is applicable to
this study. The raw data was analyzed, averaged for each source, and then averaged overall
(Table 104 and Table 105). Through comparison of the results with the values included in
the initial model load for the AHRI 1250/1251 Standard Load Spreadsheet (AHRI 2009a),
new values are proposed for developing a model load for the AHRI 1250/1251 Standard
(AHRI 2009b; AHRI 2009c).

220
Outdoor ambient temperatures, as noted in Table 104, refer to the air temperature
that the outdoor condenser rejects heat to. For the case where the walk-in box is located
outside, outdoor ambient conditions are coincident with the conduction load experienced
by three of the four walls that surround the refrigerated space. When the box is located
inside, conduction load is associated with the indoor site conditions (Table 105). The
outdoor dry bulb noted by the literature ranged from 35 to 122°F, with an average value of
81.8°F. The ambient outdoor conditions at which the AHRI Load Spreadsheet was initially
analyzed seem appropriate and will remain unchanged. The effect of sun loading on the
space was altered from 12 hours at a 15°F increase in the roof temperature to 8 hours at a
20°F increase in roof temperature. The proposed roof temperature increase more closely
approaches the average roof temperature increase determined from literature, of 33.2°F.
The average temperature was not matched however due to the common application of
highly reflective roof surfaces and the fact that the value in literature is coincident with the
peak sun load.
The AHRI Load Spreadsheet (AHRI 2009a) assumed typical indoor (store) design
conditions of 75°F dry bulb and 50% relative humidity (Table 105). The literature notes
dry bulb temperatures ranging from 50 to 90°F for various applications, with an average
temperature of 73.5°F, correlating well with the AHRI Load Spreadsheet value of 75°F.
The relative humidities noted in literature also correlate well with the AHRI Load
Spreadsheet value of 50%, ranging from 30 to 65%, with an average value of 49.6%.
Values supplied by Becker et al. (Becker et al. 2011) from the FSTC test site for indoor
ambient temperature and relative humidity were excluded from the range and average at

221
the top of Table 105 because they refer to conditions at which the indoor condenser
operates.

222
Table 104. Outdoor Site Conditions for Walk-in Coolers and Freezers
Outdoor Site Conditions for Walk-in Coolers and Freezers (1 of 6)
Outdoor Ambient Temp
(°F)
Coincident
Wet Bulb (°F)
Outdoor
Ambient
RH (%)
Sunlight directly
on roof? Roof Temp (°F)
Range 35 to 122 49.0 to 83.0 20 to 89 Ambient + 2 to 76°F
Average 81.8 69.2 54.4 Ambient + 33.2°F
Proposed 80, 95, 110
N – 5pm to
10am, Y – 10am
to 5pm
Ambient + 20°F
(AHRI 2009a) 80, 95, 110 N – 8pm to 8am,
Y – 8am to 8pm
Roof T = Ambient T +
15°F if there is direct
sunlight
(Adre and
Hellickson
1989)
100.4 69.8 20.8 Yes; Sol-air
temp
36°F increase with
3300 kJ/m3 of global
radiation; 0.15 for
light-colored surfaces.
South facing exterior
wall: 27°F with 3300
kJ/m3 of global
radiation.
(Altwies 1998) South central Wisconsin;
Design 998/78°F
(Altwies and
Reindl 1999)
North central U.S.; Design
98/78°F 78 40.6
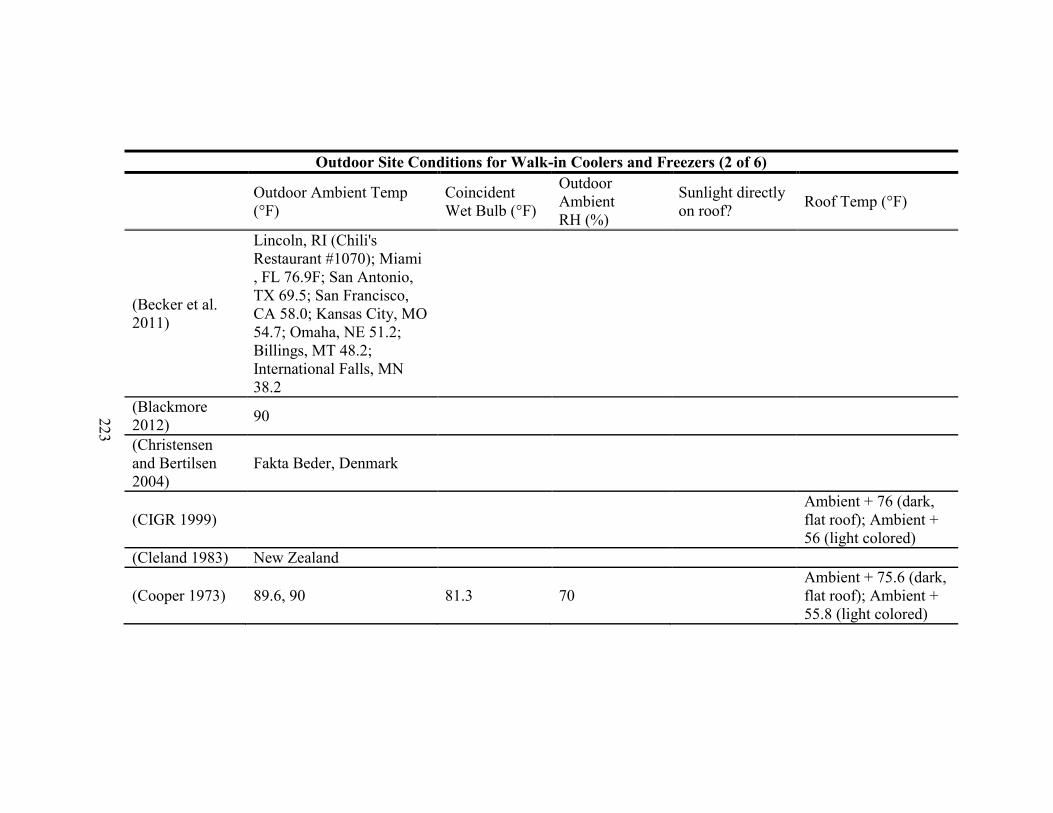
223
Outdoor Site Conditions for Walk-in Coolers and Freezers (2 of 6)
Outdoor Ambient Temp
(°F)
Coincident
Wet Bulb (°F)
Outdoor
Ambient
RH (%)
Sunlight directly
on roof? Roof Temp (°F)
(Becker et al.
2011)
Lincoln, RI (Chili's
Restaurant #1070); Miami
, FL 76.9F; San Antonio,
TX 69.5; San Francisco,
CA 58.0; Kansas City, MO
54.7; Omaha, NE 51.2;
Billings, MT 48.2;
International Falls, MN
38.2
(Blackmore
2012) 90
(Christensen
and Bertilsen
2004)
Fakta Beder, Denmark
(CIGR 1999)
Ambient + 76 (dark,
flat roof); Ambient +
56 (light colored)
(Cleland 1983) New Zealand
(Cooper 1973) 89.6, 90 81.3 70
Ambient + 75.6 (dark,
flat roof); Ambient +
55.8 (light colored)

224
Outdoor Site Conditions for Walk-in Coolers and Freezers (3 of 6)
Outdoor Ambient Temp
(°F)
Coincident
Wet Bulb (°F)
Outdoor
Ambient
RH (%)
Sunlight directly
on roof? Roof Temp (°F)
(Devres and
Bishop 1995) 79.7
Ambient + 18 (roof);
Ambient + 3.6, 5.4,
and 5.4 (south, west,
and east walls)
(DOE 2010c) 35, 59, 95
(Goetzler et al.
2009) 90 (freezer), 95 (cooler)
(Gosney and
Olama 1975) 77 67.2 60
(Hayes and
Stoecker 1969) 75
(Heatcraft 2008) 95
Ambient + 2 to 20
(7.58 average, Table
86)
(Henderson and
Khattar 1999)
Minneapolis, MN (Store
A), Indianapolis, IN (Store
B); 59 to 89
(Hendrix et al.
1989) 37 to 85 20 to 89
(Huan 2008) 68 63.9 80
(Kimber 1998) 59.0 (Safeway)
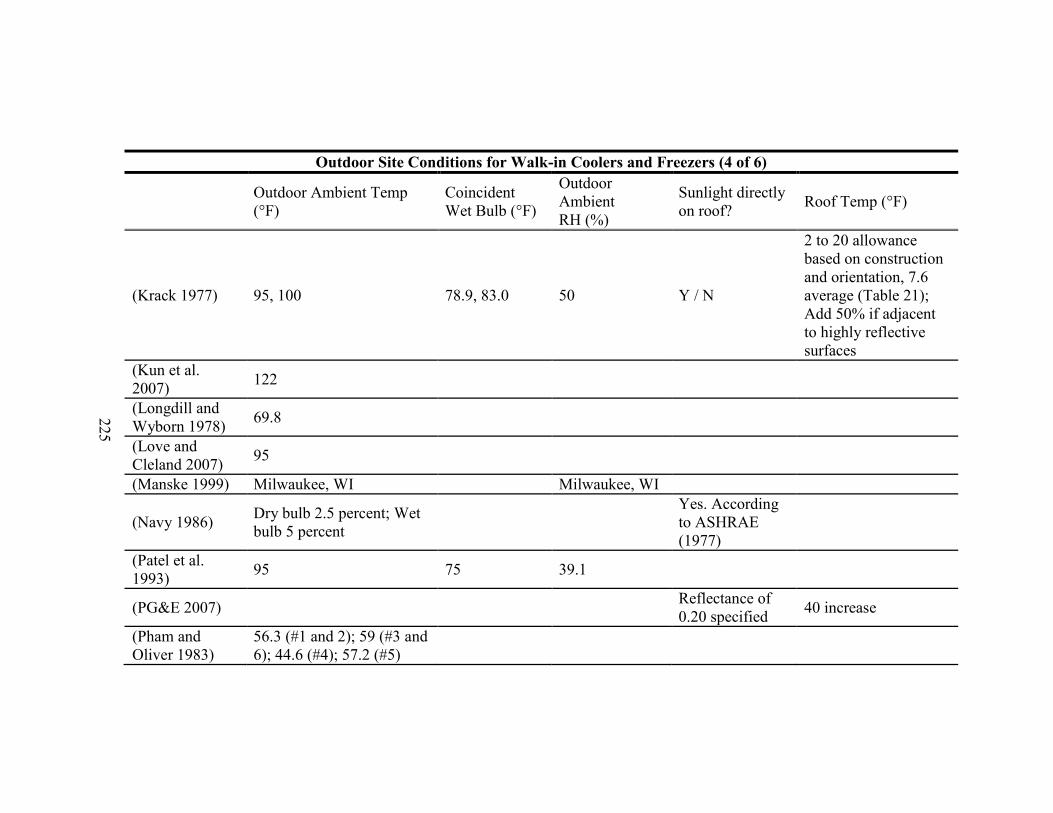
225
Outdoor Site Conditions for Walk-in Coolers and Freezers (4 of 6)
Outdoor Ambient Temp
(°F)
Coincident
Wet Bulb (°F)
Outdoor
Ambient
RH (%)
Sunlight directly
on roof? Roof Temp (°F)
(Krack 1977) 95, 100 78.9, 83.0 50 Y / N
2 to 20 allowance
based on construction
and orientation, 7.6
average (Table 21);
Add 50% if adjacent
to highly reflective
surfaces
(Kun et al.
2007) 122
(Longdill and
Wyborn 1978) 69.8
(Love and
Cleland 2007) 95
(Manske 1999) Milwaukee, WI Milwaukee, WI
(Navy 1986) Dry bulb 2.5 percent; Wet
bulb 5 percent
Yes. According
to ASHRAE
(1977)
(Patel et al.
1993) 95 75 39.1
(PG&E 2007) Reflectance of
0.20 specified 40 increase
(Pham and
Oliver 1983)
56.3 (#1 and 2); 59 (#3 and
6); 44.6 (#4); 57.2 (#5)

226
Outdoor Site Conditions for Walk-in Coolers and Freezers (5 of 6)
Outdoor Ambient Temp
(°F)
Coincident
Wet Bulb (°F)
Outdoor
Ambient
RH (%)
Sunlight directly
on roof? Roof Temp (°F)
(Roy 2010) Trois-Rivieres, Quebec Yes. Reflective
white roof.
(SCE 2008)
Hourly weather for
Baltimore, MD (54.7
average)
49.0
Hourly weather
for Baltimore,
MD (67.1
average)
140°F on 100°F
ambient days
(Stoecker 1998)
1% Summer Design: 94
(Atlanta), 94 (Chicago),
102 (Dallas), 94 (Los
Angeles), 92 (New York)
74 (Atlanta),
75 (Chicago),
75 (Dallas), 70
(Los Angeles),
74 (New York)
39.3 (Atlanta),
41.7 (Chicago),
28.6 (Dallas),
29.9 (Los
Angeles), 43.2
(New York)
Yes 120 to 130 during the
day
(Stoeckle et al.
2002) Madison, WI
(Walker et al.
1990)
Atlanta, GA; Boston, MA;
Los Angeles, CA;
Milwaukee, WI; Phoenix,
AZ; St. Louis, MO
(Walker 1992) 61.5 average 53.5 average 53.8 average
(Walker 2001)
Worcester, MA (88);
Washington, DC (93);
Memphis, TN (98); Los
Angeles, CA (93)
MA (77); DC
(78); TN (80);
CA (72)

227
Outdoor Site Conditions for Walk-in Coolers and Freezers (6 of 6)
Outdoor Ambient Temp
(°F)
Coincident
Wet Bulb (°F)
Outdoor
Ambient
RH (%)
Sunlight directly
on roof? Roof Temp (°F)
(Walker and
Baxter 2002)
Marlborough and Webster,
MA
Marlborough
and Webster,
MA
(Westphalen et
al. 1996)
100 (typical), 90
(prototypical freezer), 95
(prototypical cooler)
(Wichman and
Braun 2009) 55, 75, 95
(Zhang 2006) St. Louis, MO; Boston,
MA; Dallas, TX
St. Louis, MO;
Boston, MA;
Dallas, TX

228
Table 105. Indoor Site Conditions for Walk-in Coolers and Freezers
Indoor Site Conditions for Walk-in Coolers and Freezers (1 of 2)
Indoor (Store) Amb. Temp (°F) Indoor (Store) Ambient RH (%)
Range 50 to 90 30 to 65
Average 73.5 49.6
Proposed 75 50
(AHRI 2009a) 75 50
(Adre and Hellickson
1989) Wall 1: 50 to 82.4°F machine room
(Altwies and Reindl
1999) Warehouses adjacent to each other
(Anonymous 2004) Freezer door opens to cooler (typical)
(Arias 2005; Arias and
Lundqvist 2006) 71.6 (typical) 65 (typical)
(Becker et al. 2011) Indoor walk-in box and condensing unit at 80F, 70, 75 (FSTC) `41, 34, 55 (FSTC)
(DOE 2010b) 75 40 (weighted national average)
(DOE 2010c) 90
(Faramarzi 1999) 75 55
(Foster et al. 2003) 68
(Henderson and
Khattar 1999) 59 to 89 30 to 50%
(Kimber 1998) 69.9 (Safeway), 57.7 (McDonald‟s), 61.3 (Walnut Creek), 61.7
(Cameron Park Liquor)
(Manske 1999)
Adjacent to worker warming room; Cooler shares one wall with
freezer, one wall with the dock, and one wall with a heated space,
else outdoors

229
Indoor Site Conditions for Walk-in Coolers and Freezers (2 of 2)
Indoor (Store) Amb. Temp (°F) Indoor (Store) Ambient RH (%)
(Mitchell et al. 1992) 71, 58 50, 55
(Nagaraju et al. 2001) 86
(SCE 2009) Wall 1 and 3 are connected to walk-in coolers
(Sekhar et al. 2004),
(Sekhar and Lal 2005) 89.6
(Stoeckle 2000) Freezer (0°F) shares wall with 34°F loading dock; Else Outdoors;
Values excluded from range and average.
(Stoeckle et al. 2002) Freezer Wall 1 adjacent to dock (34°F); Dock Wall 1 adjacent to
freezer (0°F); Values excluded from range and average.
(Sujau et al. 2006) 59 55
(Walker 1992) 73.2 average 36.9 average
(Walker 2001) 75 (typical), 68 to 75 55, 45, 40
(Zhang 2006) 75.2 55

230
Infiltration Protection
Operators of refrigerated spaces are always looking for opportunities to reduce the
parasitic load on the space. In a number of applications, infiltration to the space is a
considerable portion of the load. A number of researchers have worked to develop an
understanding of what methods of infiltration protection work the best in different
situations. Effectiveness of different infiltration methods, as found in the literature, are
presented in Table 106.
Authors who have researched the effectiveness of infiltration protection devices
include (Becker et al. 2011), (Chen et al. 1999), (Cleland et al. 2004), (Cole 1987),
(Downing and Meffert 1993), (Hayes and Stoecker 1969), (Hendrix et al. 1989), (Longdill
and Wyborn 1978), (Navy 1986), (Pham and Oliver 1983), (SCE 2008), (Stoecker 1998),
(Takahashi and Inoh 1963), and (Van Male 1983). Their work gives information on
infiltration reduction for open door with fork lift traffic, internal circulation, air curtains,
strip curtains, swing-type plastic hinged doors, and rapid roll doors. The AHRI Load
Spreadsheet (AHRI 2009a) assumes an infiltration protection effectiveness of 85%. This
value is in the range of air curtains or strip curtains and was therefore re-used in the
modified model load.
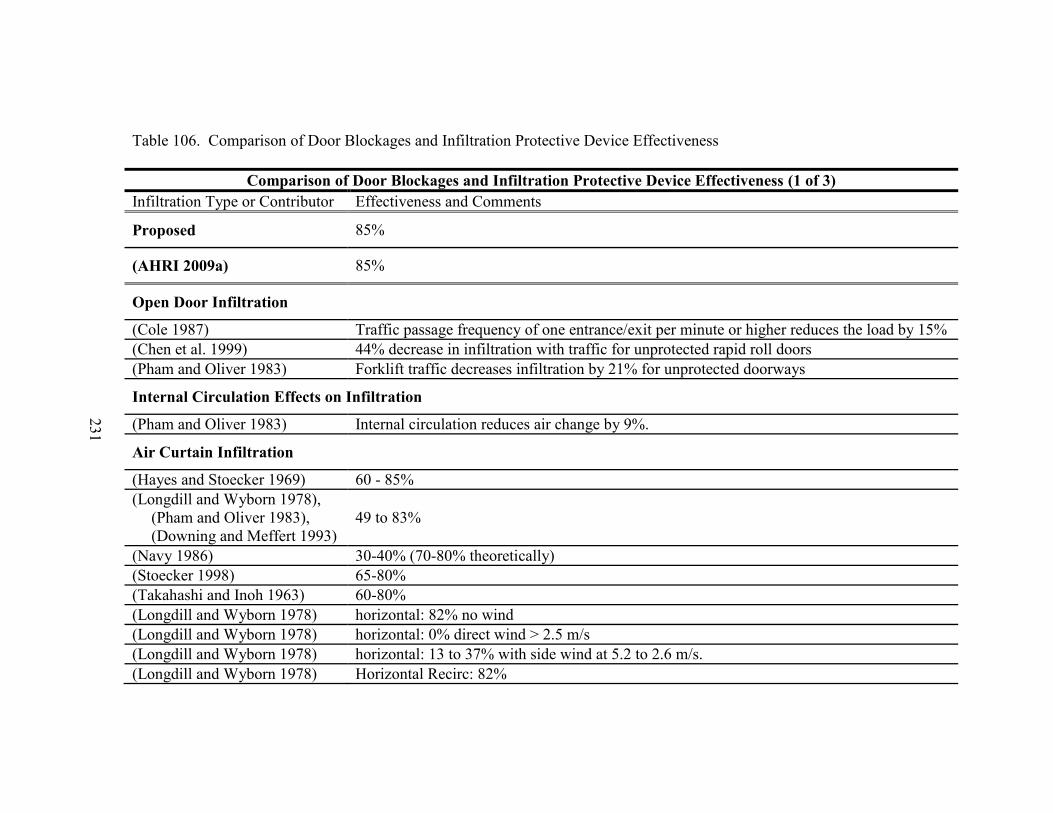
231
Table 106. Comparison of Door Blockages and Infiltration Protective Device Effectiveness
Comparison of Door Blockages and Infiltration Protective Device Effectiveness (1 of 3)
Infiltration Type or Contributor Effectiveness and Comments
Proposed 85%
(AHRI 2009a) 85%
Open Door Infiltration
(Cole 1987) Traffic passage frequency of one entrance/exit per minute or higher reduces the load by 15%
(Chen et al. 1999) 44% decrease in infiltration with traffic for unprotected rapid roll doors
(Pham and Oliver 1983) Forklift traffic decreases infiltration by 21% for unprotected doorways
Internal Circulation Effects on Infiltration
(Pham and Oliver 1983) Internal circulation reduces air change by 9%.
Air Curtain Infiltration
(Hayes and Stoecker 1969) 60 - 85%
(Longdill and Wyborn 1978),
(Pham and Oliver 1983),
(Downing and Meffert 1993)
49 to 83%
(Navy 1986) 30-40% (70-80% theoretically)
(Stoecker 1998) 65-80%
(Takahashi and Inoh 1963) 60-80%
(Longdill and Wyborn 1978) horizontal: 82% no wind
(Longdill and Wyborn 1978) horizontal: 0% direct wind > 2.5 m/s
(Longdill and Wyborn 1978) horizontal: 13 to 37% with side wind at 5.2 to 2.6 m/s.
(Longdill and Wyborn 1978) Horizontal Recirc: 82%
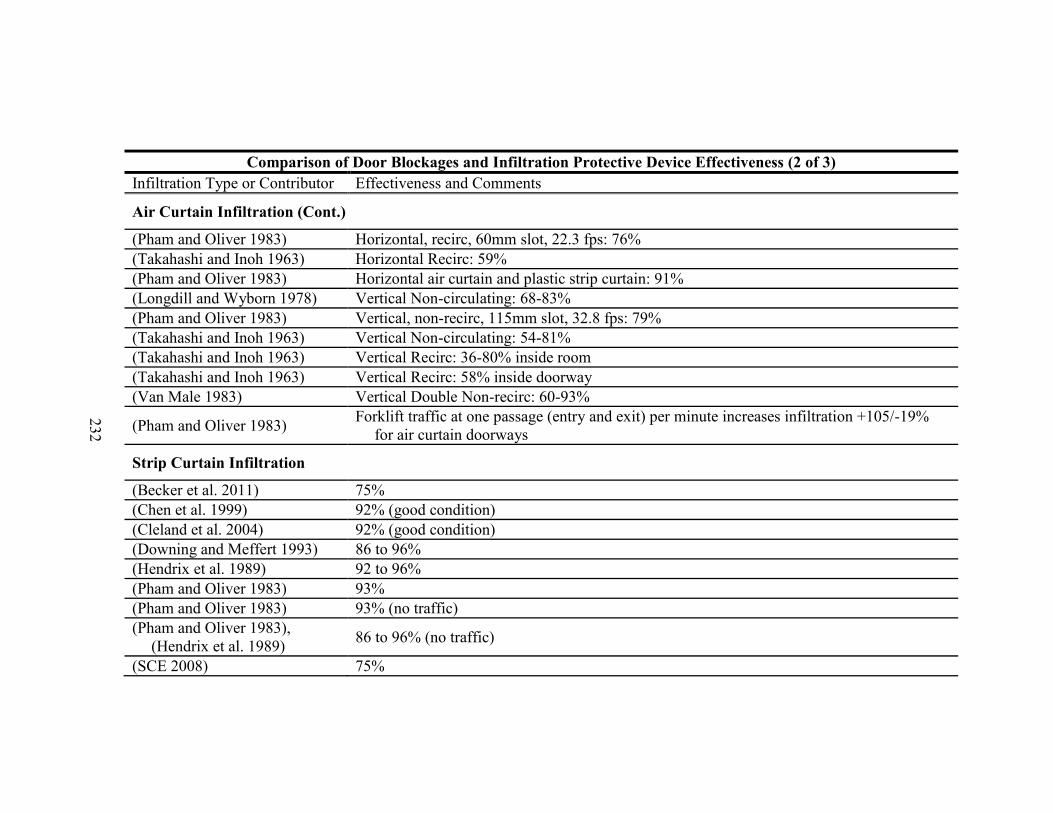
232
Comparison of Door Blockages and Infiltration Protective Device Effectiveness (2 of 3)
Infiltration Type or Contributor Effectiveness and Comments
Air Curtain Infiltration (Cont.)
(Pham and Oliver 1983) Horizontal, recirc, 60mm slot, 22.3 fps: 76%
(Takahashi and Inoh 1963) Horizontal Recirc: 59%
(Pham and Oliver 1983) Horizontal air curtain and plastic strip curtain: 91%
(Longdill and Wyborn 1978) Vertical Non-circulating: 68-83%
(Pham and Oliver 1983) Vertical, non-recirc, 115mm slot, 32.8 fps: 79%
(Takahashi and Inoh 1963) Vertical Non-circulating: 54-81%
(Takahashi and Inoh 1963) Vertical Recirc: 36-80% inside room
(Takahashi and Inoh 1963) Vertical Recirc: 58% inside doorway
(Van Male 1983) Vertical Double Non-recirc: 60-93%
(Pham and Oliver 1983) Forklift traffic at one passage (entry and exit) per minute increases infiltration +105/-19%
for air curtain doorways
Strip Curtain Infiltration
(Becker et al. 2011) 75%
(Chen et al. 1999) 92% (good condition)
(Cleland et al. 2004) 92% (good condition)
(Downing and Meffert 1993) 86 to 96%
(Hendrix et al. 1989) 92 to 96%
(Pham and Oliver 1983) 93%
(Pham and Oliver 1983) 93% (no traffic)
(Pham and Oliver 1983),
(Hendrix et al. 1989) 86 to 96% (no traffic)
(SCE 2008) 75%

233
Comparison of Door Blockages and Infiltration Protective Device Effectiveness (3 of 3)
Infiltration Type or Contributor Effectiveness and Comments
Strip Curtain Infiltration (Cont.)
(Stoecker 1998) 90% (no traffic)
(Chen et al. 1999) 75% (one strip missing)
(Cleland et al. 2004) 80% (one strip missing)
(Cleland et al. 2004) 87% (small gap between strips)
(Chen et al. 1999) Fork lift traffic at one passage (entry and exit) per minute: 62%
(Downing and Meffert 1993) 82 to 92% with one forklift entry/exit per minute
(Pham and Oliver 1983),
(Hendrix et al. 1989) 82 to 92% (one forklift entry/exit per minute)
(Pham and Oliver 1983) Forklift traffic at one passage (entry and exit) per minute increases infiltration +105/-19%
for strip curtain doorways
(Stoecker 1998) 85% (with traffic)
(Pham and Oliver 1983) Horizontal air curtain and plastic strip curtain: 91%
Swing-type Plastic Hinged Doors
(SCE 2008) 95%
Rapid Roll Doors
(Downing and Meffert 1993) 93% without traffic
(Downing and Meffert 1993) 79 to 85% with one entry/exit per minute (fully open 8 to 20 seconds with 1-2 second
open/close)
(Cleland et al. 2004) Defined via modified Gosney and Olama equation (Gosney and Olama 1975)
(Chen et al. 1999) Defined via modified Tamm equation (Tamm 1965)
(Chen et al. 1999) Door closed (air tightness): 99%
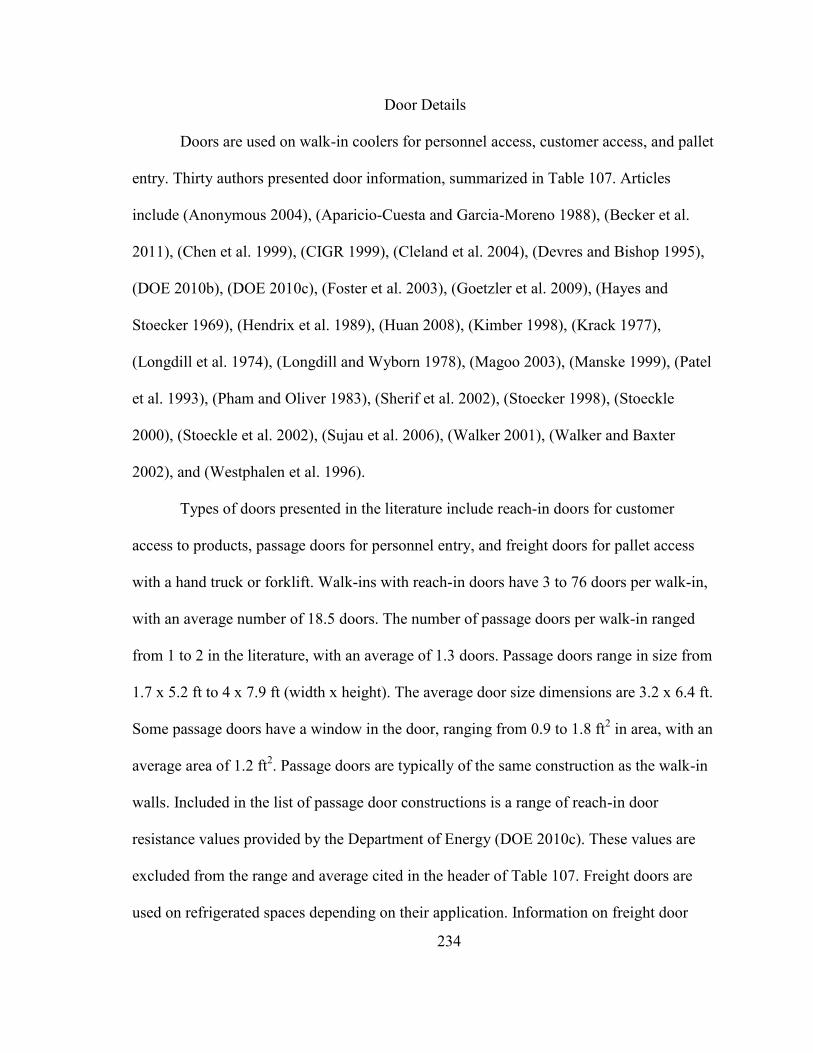
234
Door Details
Doors are used on walk-in coolers for personnel access, customer access, and pallet
entry. Thirty authors presented door information, summarized in Table 107. Articles
include (Anonymous 2004), (Aparicio-Cuesta and Garcia-Moreno 1988), (Becker et al.
2011), (Chen et al. 1999), (CIGR 1999), (Cleland et al. 2004), (Devres and Bishop 1995),
(DOE 2010b), (DOE 2010c), (Foster et al. 2003), (Goetzler et al. 2009), (Hayes and
Stoecker 1969), (Hendrix et al. 1989), (Huan 2008), (Kimber 1998), (Krack 1977),
(Longdill et al. 1974), (Longdill and Wyborn 1978), (Magoo 2003), (Manske 1999), (Patel
et al. 1993), (Pham and Oliver 1983), (Sherif et al. 2002), (Stoecker 1998), (Stoeckle
2000), (Stoeckle et al. 2002), (Sujau et al. 2006), (Walker 2001), (Walker and Baxter
2002), and (Westphalen et al. 1996).
Types of doors presented in the literature include reach-in doors for customer
access to products, passage doors for personnel entry, and freight doors for pallet access
with a hand truck or forklift. Walk-ins with reach-in doors have 3 to 76 doors per walk-in,
with an average number of 18.5 doors. The number of passage doors per walk-in ranged
from 1 to 2 in the literature, with an average of 1.3 doors. Passage doors range in size from
1.7 x 5.2 ft to 4 x 7.9 ft (width x height). The average door size dimensions are 3.2 x 6.4 ft.
Some passage doors have a window in the door, ranging from 0.9 to 1.8 ft2 in area, with an
average area of 1.2 ft2. Passage doors are typically of the same construction as the walk-in
walls. Included in the list of passage door constructions is a range of reach-in door
resistance values provided by the Department of Energy (DOE 2010c). These values are
excluded from the range and average cited in the header of Table 107. Freight doors are
used on refrigerated spaces depending on their application. Information on freight door

235
size, presented in Table 107, was not filtered to remove information specific to larger
refrigerated spaces, such as refrigerated warehouses, and should be interpreted with regard
to applicability. Some of the values for door size presented by Foster et al. (Foster et al.
2003) were excluded from the range and average values for freight door height and width,
as they refer to different partially open positions of a single freight door used during
testing.
The AHRI Load Spreadsheet (AHRI 2009a) used one door for all walk-ins
analyzed. Small walk-ins used a personnel door measuring 4 x 7 ft whereas large walk-ins
used a freight door measuring 6 x 10 ft. Taking into account the findings from the
literature, only the width of the small door was modified. The width of the door was
reduced from 4 ft to 3 ft. As was depicted by the literature review, AHRI assumed the
doors were of the same construction as the walk-in walls. This approach was not altered for
determination of the modified model load.
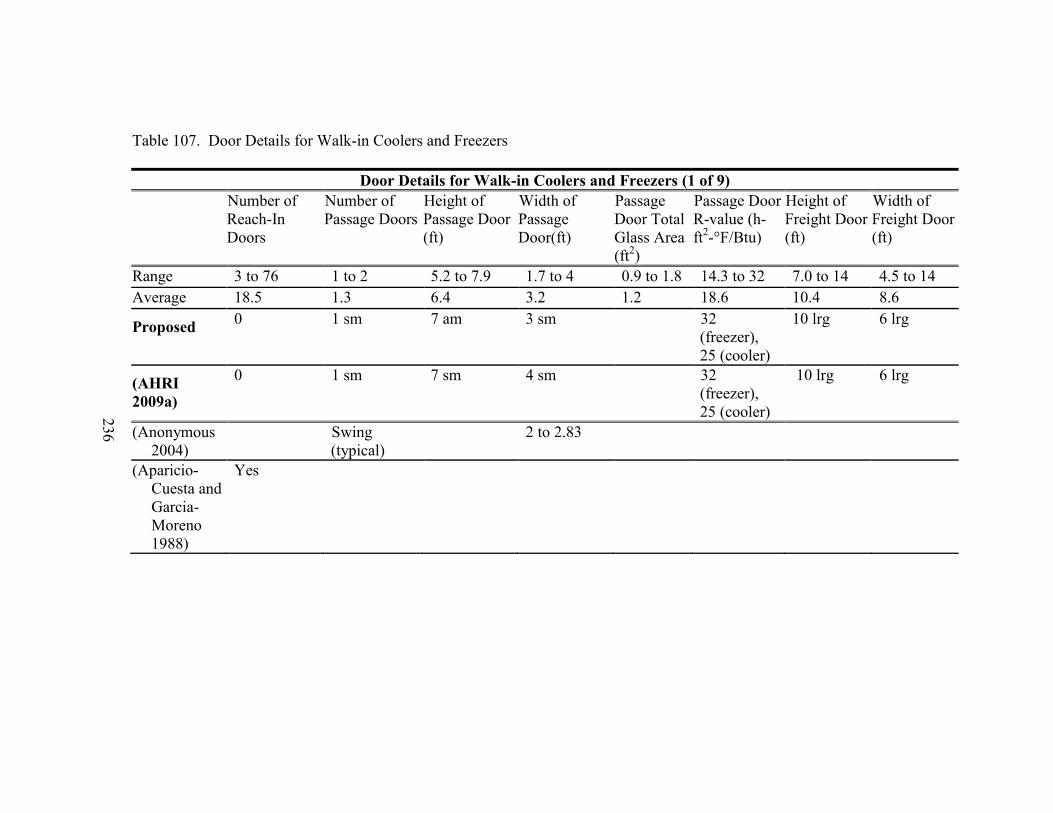
236
Table 107. Door Details for Walk-in Coolers and Freezers
Door Details for Walk-in Coolers and Freezers (1 of 9)
Number of
Reach-In
Doors
Number of
Passage Doors
Height of
Passage Door
(ft)
Width of
Passage
Door(ft)
Passage
Door Total
Glass Area
(ft2)
Passage Door
R-value (h-
ft2-°F/Btu)
Height of
Freight Door
(ft)
Width of
Freight Door
(ft)
Range 3 to 76 1 to 2 5.2 to 7.9 1.7 to 4 0.9 to 1.8 14.3 to 32 7.0 to 14 4.5 to 14
Average 18.5 1.3 6.4 3.2 1.2 18.6 10.4 8.6
Proposed 0 1 sm 7 am 3 sm 32
(freezer),
25 (cooler)
10 lrg 6 lrg
(AHRI
2009a)
0 1 sm 7 sm 4 sm 32
(freezer),
25 (cooler)
10 lrg 6 lrg
(Anonymous
2004)
Swing
(typical)
2 to 2.83
(Aparicio-
Cuesta and
Garcia-
Moreno
1988)
Yes

237
Door Details for Walk-in Coolers and Freezers (2 of 9)
Number of
Reach-In
Doors
Number of
Passage Doors
Height of
Passage Door
(ft)
Width of
Passage
Door(ft)
Passage
Door Total
Glass Area
(ft2)
Passage Door
R-value (h-
ft2-°F/Btu)
Height of
Freight Door
(ft)
Width of
Freight Door
(ft)
(Becker et al.
2011)
11
(Tedeschi
Food Shop
#110)
1 (Chili's
Freezer,
Small and
Large
Freezer,
Tedeschi
Food Shop
#110, Chili's
Beer and
Food
Cooler,
Small and
Large
Cooler)
6.67 (FSTC,
Small
Freezer and
Cooler); 7
(Prototypical)
3.25 (FSTC,
Small
Freezer and
Cooler); 4
(Prototypical)
4" Extruded
polystyrene
sandwich
panel, R-
17.24
(Small
Freezer and
Cooler); R-
32 (Large
Freezer); 25
R-value
(Large
Cooler)
10 (Large
Freezer
and
Cooler)
6 (Large
Freezer
and
Cooler)
(Chen et al.
1999)
6.5 3.54 10.83,
11.81
7.87, 9.84
(CIGR 1999) 2 to 2.5 8 to 10
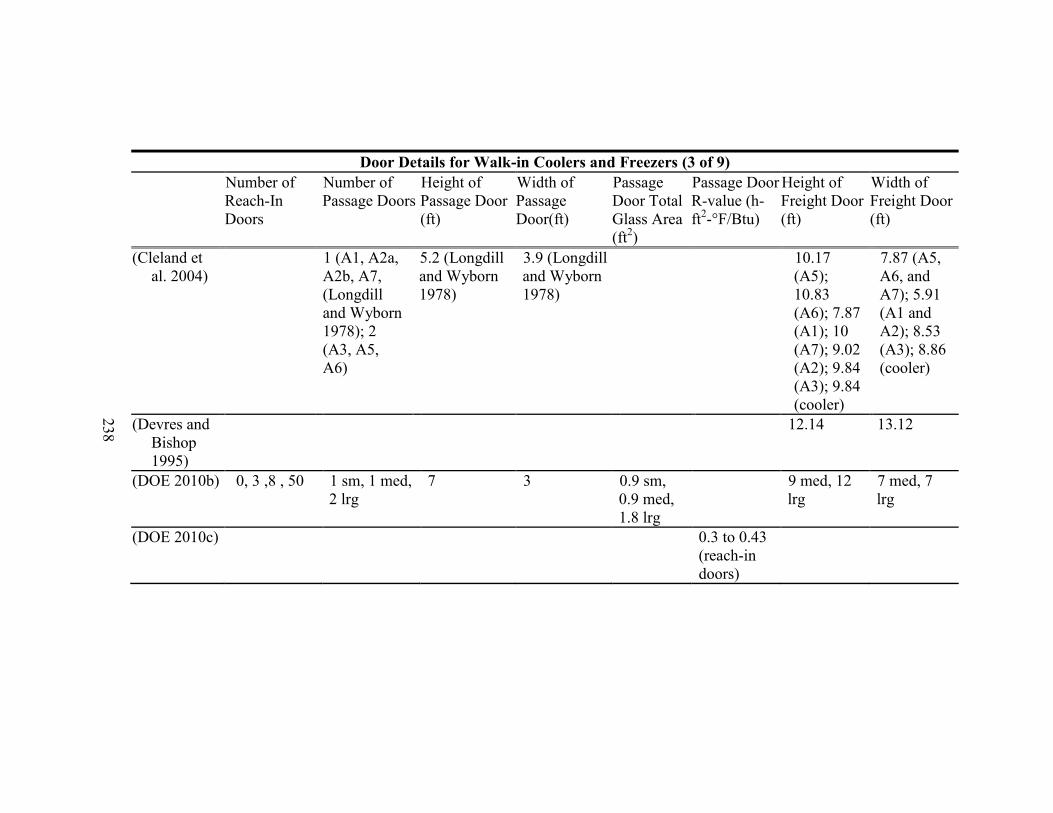
238
Door Details for Walk-in Coolers and Freezers (3 of 9)
Number of
Reach-In
Doors
Number of
Passage Doors
Height of
Passage Door
(ft)
Width of
Passage
Door(ft)
Passage
Door Total
Glass Area
(ft2)
Passage Door
R-value (h-
ft2-°F/Btu)
Height of
Freight Door
(ft)
Width of
Freight Door
(ft)
(Cleland et
al. 2004)
1 (A1, A2a,
A2b, A7,
(Longdill
and Wyborn
1978); 2
(A3, A5,
A6)
5.2 (Longdill
and Wyborn
1978)
3.9 (Longdill
and Wyborn
1978)
10.17
(A5);
10.83
(A6); 7.87
(A1); 10
(A7); 9.02
(A2); 9.84
(A3); 9.84
(cooler)
7.87 (A5,
A6, and
A7); 5.91
(A1 and
A2); 8.53
(A3); 8.86
(cooler)
(Devres and
Bishop
1995)
12.14 13.12
(DOE 2010b) 0, 3 ,8 , 50 1 sm, 1 med,
2 lrg
7 3 0.9 sm,
0.9 med,
1.8 lrg
9 med, 12
lrg
7 med, 7
lrg
(DOE 2010c) 0.3 to 0.43
(reach-in
doors)

239
Door Details for Walk-in Coolers and Freezers (4 of 9)
Number of
Reach-In
Doors
Number of
Passage Doors
Height of
Passage
Door (ft)
Width of
Passage
Door(ft)
Passage
Door Total
Glass Area
(ft2)
Passage
Door R-
value (h-ft2-
°F/Btu)
Height of
Freight Door
(ft)
Width of
Freight Door
(ft)
(Foster et al.
2003)
2.26
(excluded
from
average
and range),
10.5
7.55; 4.46,
3.28, 1.41
(excluded
from
average
and range)
(Goetzler et
al. 2009)
10 1 6.5 3
(Hayes and
Stoecker
1969)
7
(Hendrix et
al. 1989)
Freezer: 10
(#1 and 2),
12 (#3);
Cooler:
12.67 (to
Dry stores)
Freezer: 7
(#1 and 2),
8.5 (#3);
Cooler: 8
(to Dry
stores)
(Huan 2008) 9.84 9.19

240
Door Details for Walk-in Coolers and Freezers (5 of 9)
Number of
Reach-In
Doors
Number of
Passage Doors
Height of
Passage Door
(ft)
Width of
Passage
Door(ft)
Passage
Door Total
Glass Area
(ft2)
Passage Door
R-value (h-
ft2-°F/Btu)
Height of
Freight Door
(ft)
Width of
Freight Door
(ft)
(Kimber
1998)
13
(Safeway),
9 (Trader
Joe‟s), 13
(Cameron
Park
Liquor)
1 (Safeway), 1
(Trader Joe‟s),
1
(McDonald‟s),
2 (Walnut
Creek), 1
(Cameron
Park Liquor)
3
(McDonald‟s)
(Krack 1977) 3"
insulation
11.5, 8 4.5, 6
(Longdill et
al. 1974)
5.25 3.94
(Longdill
and
Wyborn
1978)
2 5.41; 6.43 1.74; 4
(Magoo
2003)
8
(outdoors);
14 (cooler)
9
(outdoors);
10 (cooler)
(Manske
1999)
8 10
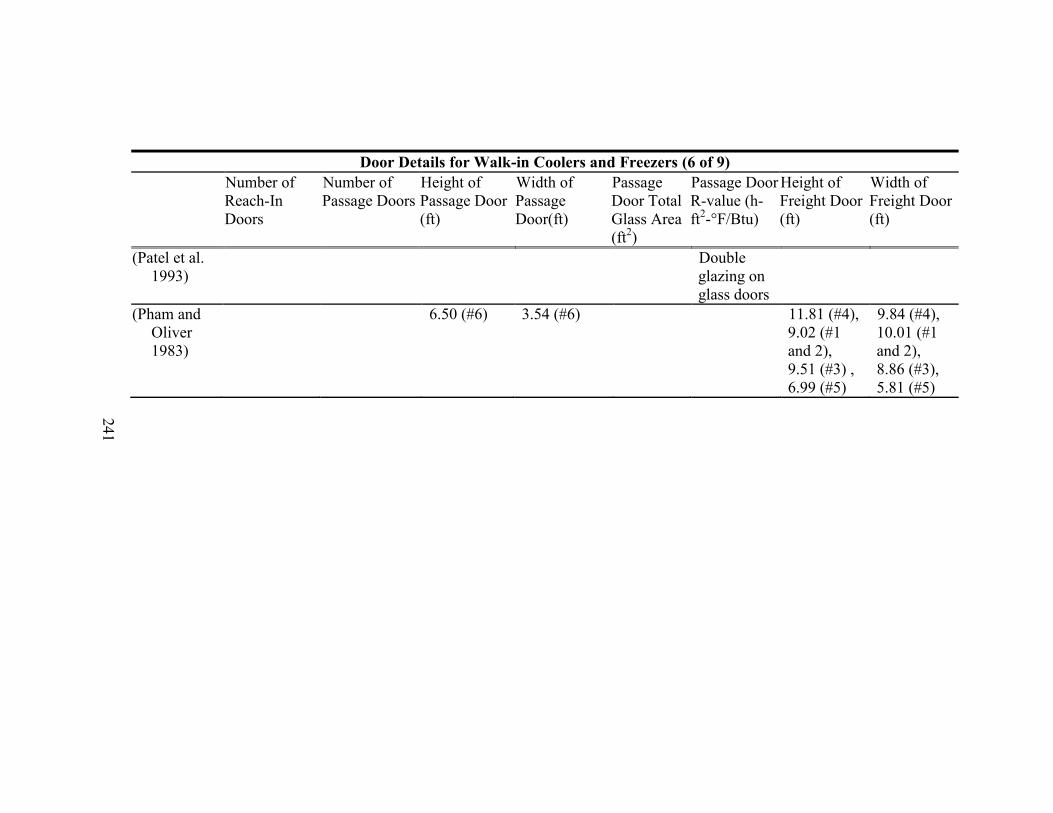
241
Door Details for Walk-in Coolers and Freezers (6 of 9)
Number of
Reach-In
Doors
Number of
Passage Doors
Height of
Passage Door
(ft)
Width of
Passage
Door(ft)
Passage
Door Total
Glass Area
(ft2)
Passage Door
R-value (h-
ft2-°F/Btu)
Height of
Freight Door
(ft)
Width of
Freight Door
(ft)
(Patel et al.
1993)
Double
glazing on
glass doors
(Pham and
Oliver
1983)
6.50 (#6) 3.54 (#6) 11.81 (#4),
9.02 (#1
and 2),
9.51 (#3) ,
6.99 (#5)
9.84 (#4),
10.01 (#1
and 2),
8.86 (#3),
5.81 (#5)

242
Door Details for Walk-in Coolers and Freezers (7 of 9)
Number of
Reach-In
Doors
Number of
Passage Doors
Height of
Passage Door
(ft)
Width of
Passage
Door(ft)
Passage
Door Total
Glass Area
(ft2)
Passage Door
R-value (h-
ft2-°F/Btu)
Height of
Freight Door
(ft)
Width of
Freight Door
(ft)
(Sherif et al.
2002)
2 5.54 2.57 1.17 Outside to
Inside:
Aluminum
sheet (AS),
3/4"
Plywood,
3.5"
Polystyrene
molded beads
with 2x4s on
2 ft centers
(PS), 1/16"
AS with
Window of
insulated
double
glazing with
1/2" air space
for R-value of
14.29
(Stoecker
1998)
7 to 14 5 to 14

243
Door Details for Walk-in Coolers and Freezers (8 of 9)
Number of
Reach-In Doors
Number of
Passage Doors
Height of
Passage Door
(ft)
Width of
Passage
Door(ft)
Passage
Door Total
Glass Area
(ft2)
Passage
Door R-
value (h-ft2-
°F/Btu)
Height of
Freight Door
(ft)
Width of
Freight Door
(ft)
(Stoeckle
2000)
14 (freezer
to dock); 8
(outdoors)
10 (freezer
to dock); 9
(outdoors)
(Stoeckle et
al. 2002)
8
(outdoors);
14 (freezer
to dock)
9
(outdoors);
10 (freezer
to dock)
(Sujau et al.
2006)
1 7.9 3.9
(Walker
2001)
17-20 (ice-
cream
cases); 15-
16 (food
cases)
(Walker and
Baxter
2002)
Freezer: 76
(Reach-in
#1), 23
(Reach-in
#2), 52
(Reach-in
#3); Cooler:
46 (Reach-in
dairy)

244
Door Details for Walk-in Coolers and Freezers (9 of 9)
Number of
Reach-In Doors
Number of
Passage Doors
Height of
Passage Door
(ft)
Width of
Passage
Door(ft)
Passage
Door Total
Glass Area
(ft2)
Passage
Door R-
value (h-ft2-
°F/Btu)
Height of
Freight Door
(ft)
Width of
Freight Door
(ft)
(Westphalen
et al. 1996)
20% of walk-
in freezers
have
merchandising
doors; 30% of
walk-in
coolers have
merchandising
doors, 10
(prototypical
cooler)
At least 1 6.5 3
245
Walk-in Coolers
In order to define a model load profile for walk-in coolers, information gathered
from literature that related to the various components of a model load was analyzed to
determine what is typical in application. Load components in addition to those analyzed
above include box interior conditions, box conduction details, infiltration, product loading,
lighting and occupancy, defrost details, and other miscellaneous loads.
Box Interior Conditions
Box interior conditions for the purposes of this study include the box interior
temperature, box interior relative humidity, and the box dimensions. To ensure results are
applicable to walk-in coolers, only interior dimensions for spaces that would be considered
walk-ins (< 3000 ft2) are included in the analysis.
Forty-six authors presented operating temperatures and relative humidities of walk-
in coolers. These reports include (Adre and Hellickson 1989), (Anonymous 2004),
(Aparicio-Cuesta and Garcia-Moreno 1988), (Becker et al. 2011), (Blackmore 2012),
(Chen et al. 2002), (Christensen and Bertilsen 2004), (CIGR 1999), (Cleland 1983),
(Cleland et al. 2004), (Cooper 1973), (Devres and Bishop 1995), (DOE 2010b), (Edwards
2010), (Goetzler et al. 2009), (Gortner et al. 1948), (Heatcraft 2008), (Henderson and
Khattar 1999), (Hendrix et al. 1989), (Krack 1977), (Kun et al. 2007), (Love and Cleland
2007), (Magoo 2003), (Manske 1999), (McHugh 2010), (Morris 2012), (Navy 1986),
(Nelson 2011), (Kimber 1998), (Patel et al. 1993), (PG&E 2007), (Roy 2010), (Sand et al.
1997), (SCE 2008), (SCE 2009), (Sekhar and Lal 2005), (Sekhar et al. 2004), (Sezgen and
Koomey 1995), (Stoecker 1998), (Stoeckle 2000), (Stoeckle et al. 2002), (Sujau et al.
246
2006), (Thompson and Spinoglio 1996), (USDA 2010), (Westphalen et al. 1996), and
(Wichman and Braun 2009). Information is summarized in Table 108.
Thirty-five articles presented information on box dimensions, including (Adre and
Hellickson 1989), (Anonymous 2004), (Arias 2005), (Becker et al. 2011), (Blackmore
2012), (Christensen and Bertilsen 2004), (Cooper 1973), (DOE 2010a), (DOE 2010b),
(DOE 2010c), (Elsayed 1998), (Foster et al. 2003), (Goetzler et al. 2009), (Heatcraft 2008),
(Henderson and Khattar 1999), (Kimber 1998), (Knudsen and Pachai 2004), (Krack 1977),
(Love and Cleland 2007), (McHugh 2010), (Morris 2012), (Patel et al. 1993), (PG&E
2004), (SCE 2008), (SCE 2009), (Sekhar et al. 2004), (Sekhar and Lal 2005), (Sezgen and
Koomey 1995), (Sujau et al. 2006), (Thompson and Spinoglio 1996), (Walker et al. 1990),
(Walker 1992), (Walker 2001), (Walker and Baxter 2002), and (Westphalen et al. 1996).
Interior box dimensions are listed in Table 109.
The calculation of the AHRI 1250 (AHRI 2009b)/1251 (AHRI 2009c) walk-in
cooler box load equations used interior conditions of 35°F and 90% relative humidity. In
reviewing the literature, cooler box interior temperatures ranged from 0 to 86°F, with
relative humidities ranging from 40 to 100%. Considering the corresponding average
values of 38.6°F dry bulb and 80.0% relative humidity, it was determined that AHRI used
an appropriate value for the dry bulb temperature. As noted by Becker et al. (Becker et al.
2011), the relative humidity is overstated by AHRI and will be reduced to 80% for the
proposed model load.
Two walk-in sizes were used to develop the AHRI 1250 (AHRI 2009b)/1251
(AHRI 2009c) walk-in cooler equations. The small walk-in was 8 x 8 ft with an 8 ft ceiling
and the large walk-in was 50 x 50 ft in floor plan with a 20 ft ceiling. Box sizes seen in the
247
literature ranged from 5 x 6 ft to 50 x 63 ft boxes. Floor areas ranged from 30 to 3000 ft2,
with volumes ranging from 7 to 89,841 ft3. The average values for box width, length,
height, floor area, and volume were 14.9 ft, 24.1 ft, 12 ft, 702.5 ft2, and 8,863.7 ft
3,
respectively. Values used initially by AHRI to develop the model load seem appropriate
and will remain unchanged for this study.
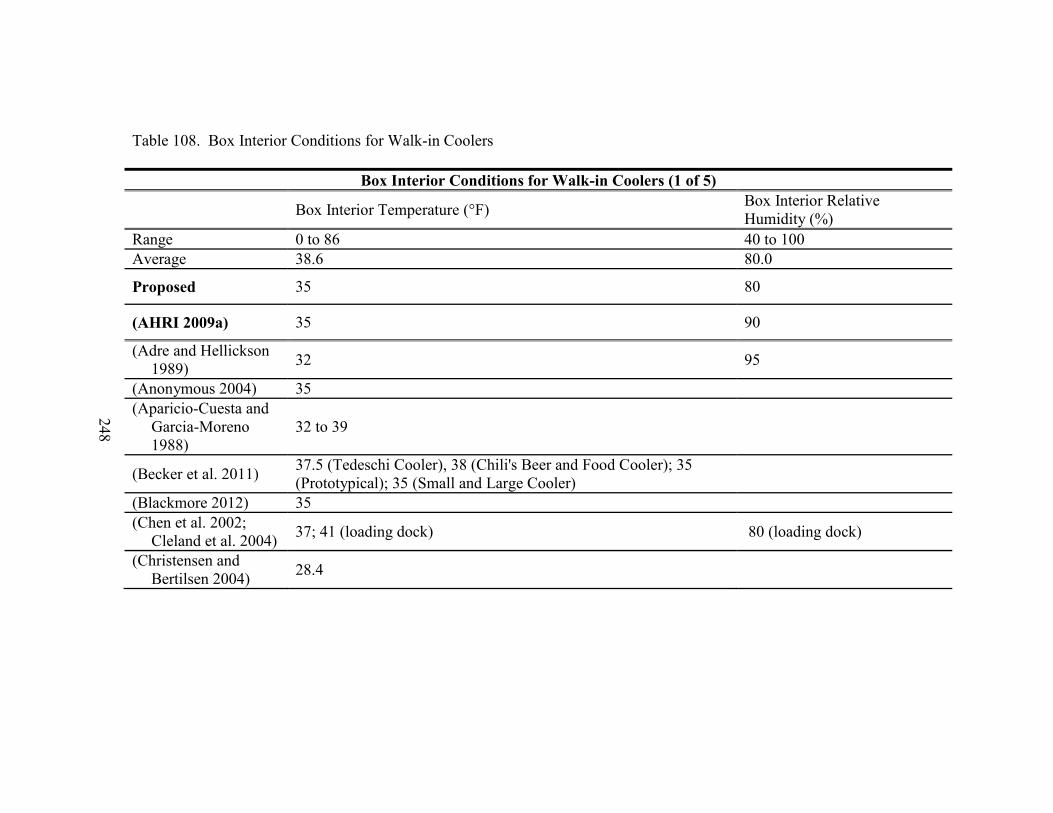
248
Table 108. Box Interior Conditions for Walk-in Coolers
Box Interior Conditions for Walk-in Coolers (1 of 5)
Box Interior Temperature (°F) Box Interior Relative
Humidity (%)
Range 0 to 86 40 to 100
Average 38.6 80.0
Proposed 35 80
(AHRI 2009a) 35 90
(Adre and Hellickson
1989) 32 95
(Anonymous 2004) 35
(Aparicio-Cuesta and
Garcia-Moreno
1988)
32 to 39
(Becker et al. 2011) 37.5 (Tedeschi Cooler), 38 (Chili's Beer and Food Cooler); 35
(Prototypical); 35 (Small and Large Cooler)
(Blackmore 2012) 35
(Chen et al. 2002;
Cleland et al. 2004) 37; 41 (loading dock) 80 (loading dock)
(Christensen and
Bertilsen 2004) 28.4
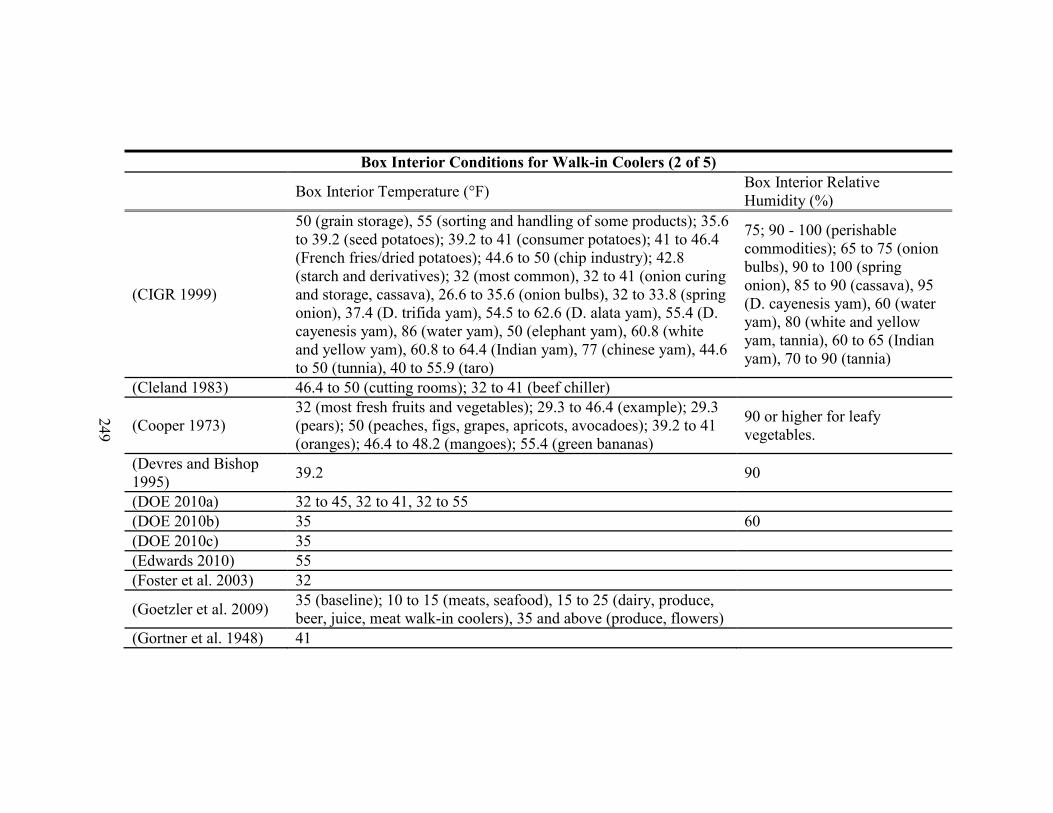
249
Box Interior Conditions for Walk-in Coolers (2 of 5)
Box Interior Temperature (°F) Box Interior Relative
Humidity (%)
(CIGR 1999)
50 (grain storage), 55 (sorting and handling of some products); 35.6
to 39.2 (seed potatoes); 39.2 to 41 (consumer potatoes); 41 to 46.4
(French fries/dried potatoes); 44.6 to 50 (chip industry); 42.8
(starch and derivatives); 32 (most common), 32 to 41 (onion curing
and storage, cassava), 26.6 to 35.6 (onion bulbs), 32 to 33.8 (spring
onion), 37.4 (D. trifida yam), 54.5 to 62.6 (D. alata yam), 55.4 (D.
cayenesis yam), 86 (water yam), 50 (elephant yam), 60.8 (white
and yellow yam), 60.8 to 64.4 (Indian yam), 77 (chinese yam), 44.6
to 50 (tunnia), 40 to 55.9 (taro)
75; 90 - 100 (perishable
commodities); 65 to 75 (onion
bulbs), 90 to 100 (spring
onion), 85 to 90 (cassava), 95
(D. cayenesis yam), 60 (water
yam), 80 (white and yellow
yam, tannia), 60 to 65 (Indian
yam), 70 to 90 (tannia)
(Cleland 1983) 46.4 to 50 (cutting rooms); 32 to 41 (beef chiller)
(Cooper 1973)
32 (most fresh fruits and vegetables); 29.3 to 46.4 (example); 29.3
(pears); 50 (peaches, figs, grapes, apricots, avocadoes); 39.2 to 41
(oranges); 46.4 to 48.2 (mangoes); 55.4 (green bananas)
90 or higher for leafy
vegetables.
(Devres and Bishop
1995) 39.2 90
(DOE 2010a) 32 to 45, 32 to 41, 32 to 55
(DOE 2010b) 35 60
(DOE 2010c) 35
(Edwards 2010) 55
(Foster et al. 2003) 32
(Goetzler et al. 2009) 35 (baseline); 10 to 15 (meats, seafood), 15 to 25 (dairy, produce,
beer, juice, meat walk-in coolers), 35 and above (produce, flowers)
(Gortner et al. 1948) 41
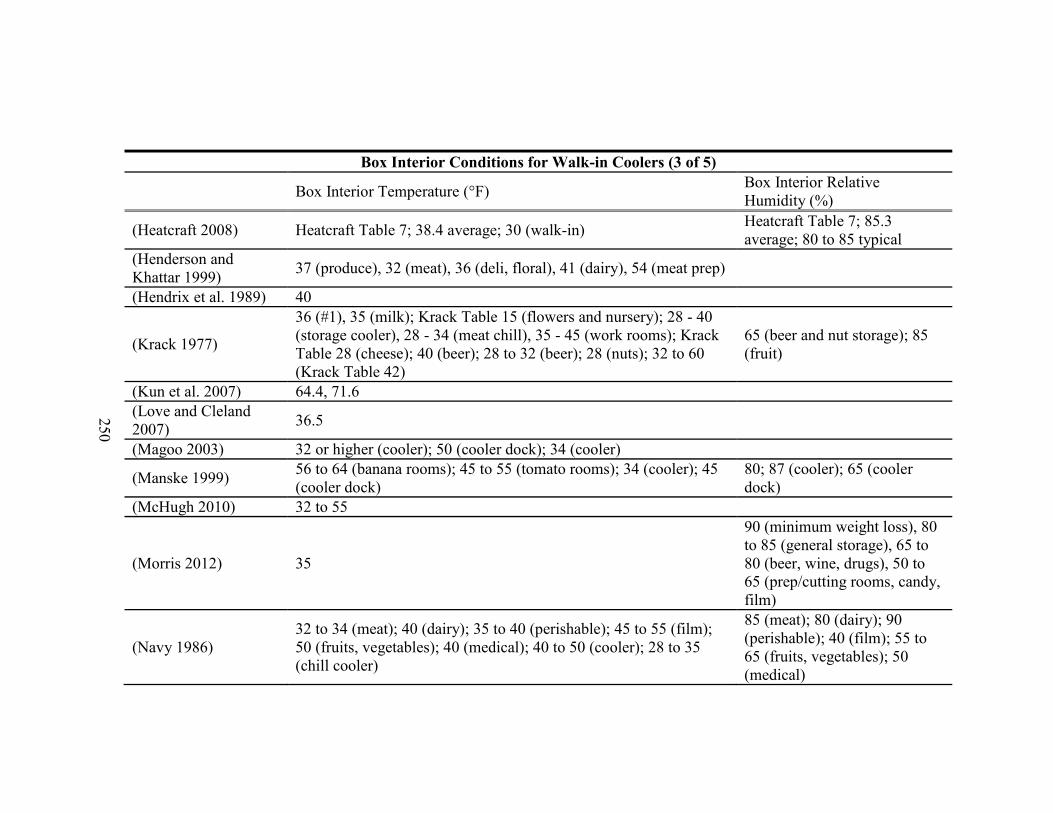
250
Box Interior Conditions for Walk-in Coolers (3 of 5)
Box Interior Temperature (°F) Box Interior Relative
Humidity (%)
(Heatcraft 2008) Heatcraft Table 7; 38.4 average; 30 (walk-in) Heatcraft Table 7; 85.3
average; 80 to 85 typical
(Henderson and
Khattar 1999) 37 (produce), 32 (meat), 36 (deli, floral), 41 (dairy), 54 (meat prep)
(Hendrix et al. 1989) 40
(Krack 1977)
36 (#1), 35 (milk); Krack Table 15 (flowers and nursery); 28 - 40
(storage cooler), 28 - 34 (meat chill), 35 - 45 (work rooms); Krack
Table 28 (cheese); 40 (beer); 28 to 32 (beer); 28 (nuts); 32 to 60
(Krack Table 42)
65 (beer and nut storage); 85
(fruit)
(Kun et al. 2007) 64.4, 71.6
(Love and Cleland
2007) 36.5
(Magoo 2003) 32 or higher (cooler); 50 (cooler dock); 34 (cooler)
(Manske 1999) 56 to 64 (banana rooms); 45 to 55 (tomato rooms); 34 (cooler); 45
(cooler dock)
80; 87 (cooler); 65 (cooler
dock)
(McHugh 2010) 32 to 55
(Morris 2012) 35
90 (minimum weight loss), 80
to 85 (general storage), 65 to
80 (beer, wine, drugs), 50 to
65 (prep/cutting rooms, candy,
film)
(Navy 1986)
32 to 34 (meat); 40 (dairy); 35 to 40 (perishable); 45 to 55 (film);
50 (fruits, vegetables); 40 (medical); 40 to 50 (cooler); 28 to 35
(chill cooler)
85 (meat); 80 (dairy); 90
(perishable); 40 (film); 55 to
65 (fruits, vegetables); 50
(medical)
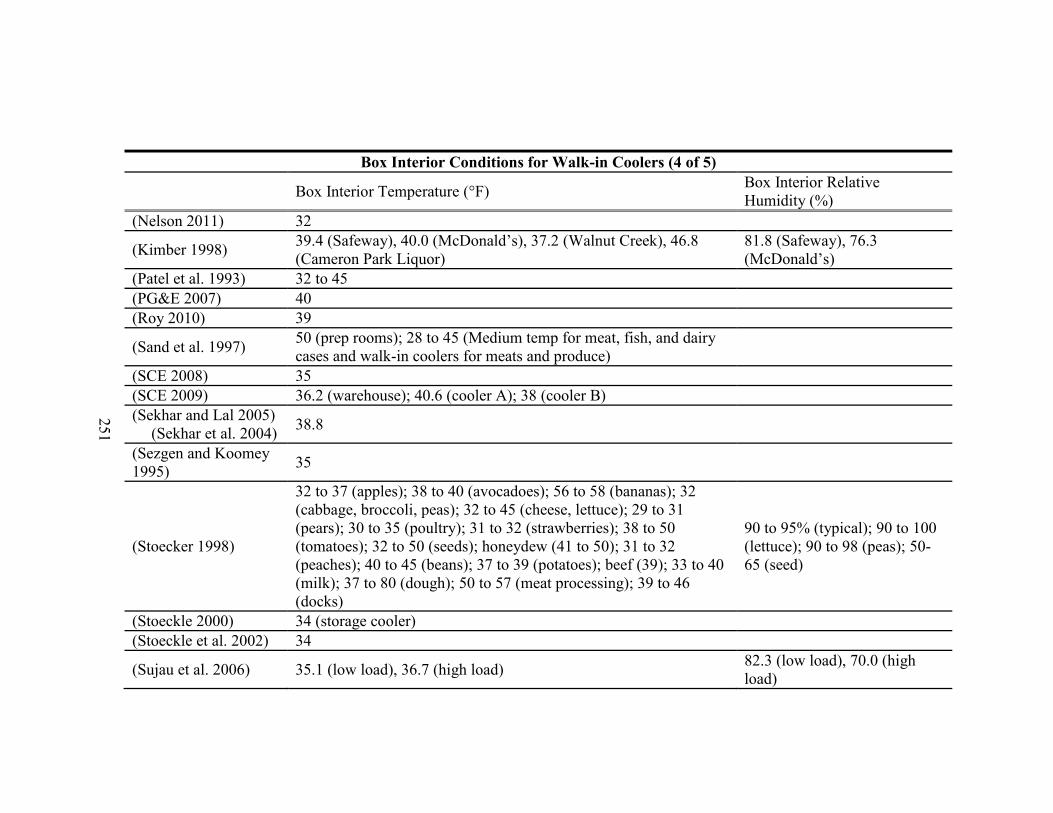
251
Box Interior Conditions for Walk-in Coolers (4 of 5)
Box Interior Temperature (°F) Box Interior Relative
Humidity (%)
(Nelson 2011) 32
(Kimber 1998) 39.4 (Safeway), 40.0 (McDonald‟s), 37.2 (Walnut Creek), 46.8
(Cameron Park Liquor)
81.8 (Safeway), 76.3
(McDonald‟s)
(Patel et al. 1993) 32 to 45
(PG&E 2007) 40
(Roy 2010) 39
(Sand et al. 1997) 50 (prep rooms); 28 to 45 (Medium temp for meat, fish, and dairy
cases and walk-in coolers for meats and produce)
(SCE 2008) 35
(SCE 2009) 36.2 (warehouse); 40.6 (cooler A); 38 (cooler B)
(Sekhar and Lal 2005)
(Sekhar et al. 2004) 38.8
(Sezgen and Koomey
1995) 35
(Stoecker 1998)
32 to 37 (apples); 38 to 40 (avocadoes); 56 to 58 (bananas); 32
(cabbage, broccoli, peas); 32 to 45 (cheese, lettuce); 29 to 31
(pears); 30 to 35 (poultry); 31 to 32 (strawberries); 38 to 50
(tomatoes); 32 to 50 (seeds); honeydew (41 to 50); 31 to 32
(peaches); 40 to 45 (beans); 37 to 39 (potatoes); beef (39); 33 to 40
(milk); 37 to 80 (dough); 50 to 57 (meat processing); 39 to 46
(docks)
90 to 95% (typical); 90 to 100
(lettuce); 90 to 98 (peas); 50-
65 (seed)
(Stoeckle 2000) 34 (storage cooler)
(Stoeckle et al. 2002) 34
(Sujau et al. 2006) 35.1 (low load), 36.7 (high load) 82.3 (low load), 70.0 (high
load)
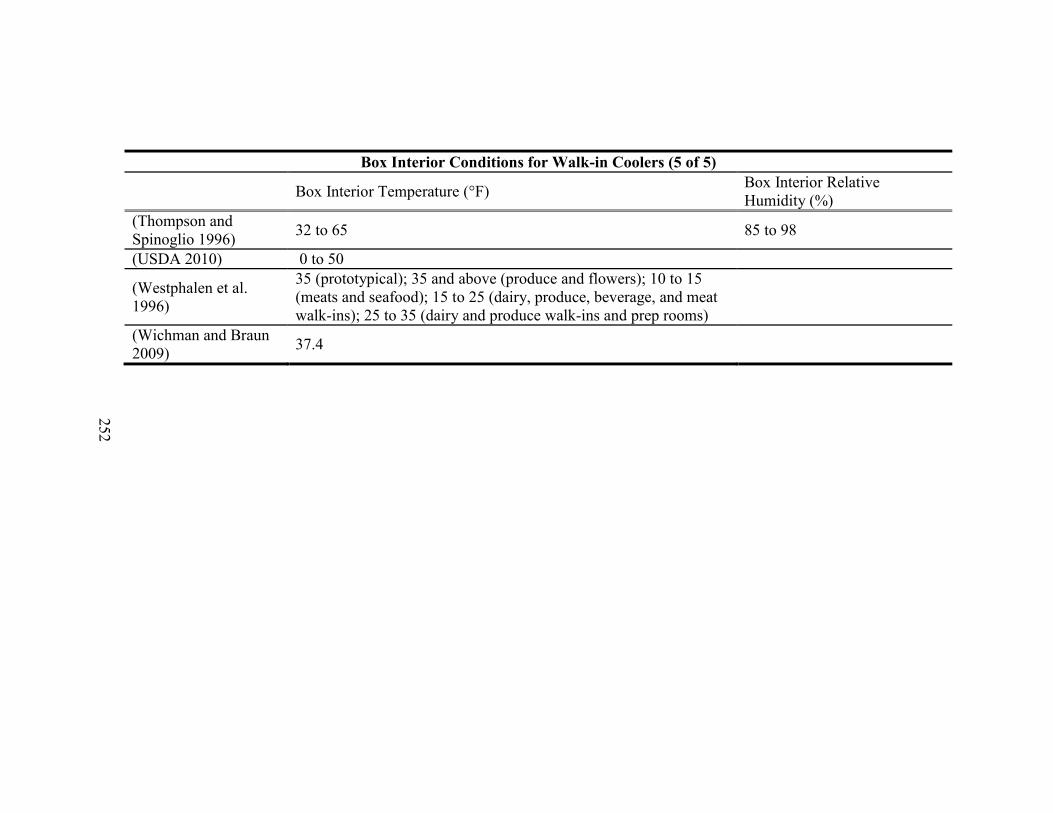
252
Box Interior Conditions for Walk-in Coolers (5 of 5)
Box Interior Temperature (°F) Box Interior Relative
Humidity (%)
(Thompson and
Spinoglio 1996) 32 to 65 85 to 98
(USDA 2010) 0 to 50
(Westphalen et al.
1996)
35 (prototypical); 35 and above (produce and flowers); 10 to 15
(meats and seafood); 15 to 25 (dairy, produce, beverage, and meat
walk-ins); 25 to 35 (dairy and produce walk-ins and prep rooms)
(Wichman and Braun
2009) 37.4
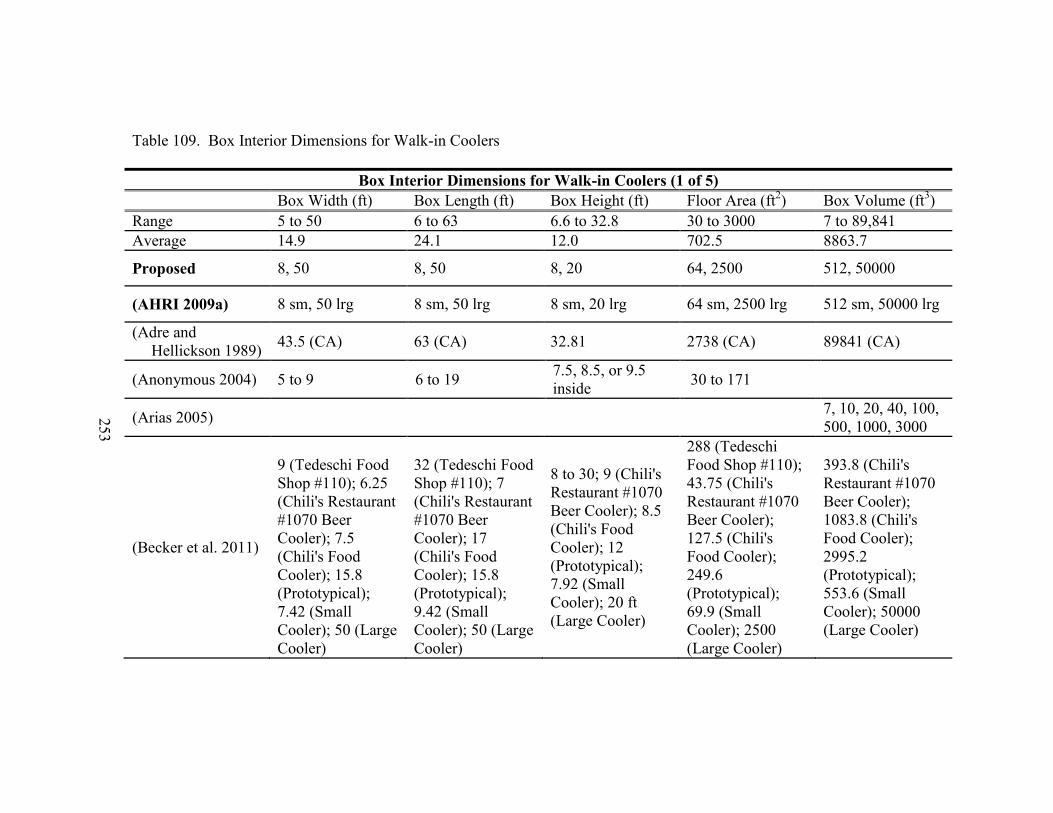
253
Table 109. Box Interior Dimensions for Walk-in Coolers
Box Interior Dimensions for Walk-in Coolers (1 of 5)
Box Width (ft) Box Length (ft) Box Height (ft) Floor Area (ft2) Box Volume (ft
3)
Range 5 to 50 6 to 63 6.6 to 32.8 30 to 3000 7 to 89,841
Average 14.9 24.1 12.0 702.5 8863.7
Proposed 8, 50 8, 50 8, 20 64, 2500 512, 50000
(AHRI 2009a) 8 sm, 50 lrg 8 sm, 50 lrg 8 sm, 20 lrg 64 sm, 2500 lrg 512 sm, 50000 lrg
(Adre and
Hellickson 1989) 43.5 (CA) 63 (CA) 32.81 2738 (CA) 89841 (CA)
(Anonymous 2004) 5 to 9 6 to 19 7.5, 8.5, or 9.5
inside 30 to 171
(Arias 2005) 7, 10, 20, 40, 100,
500, 1000, 3000
(Becker et al. 2011)
9 (Tedeschi Food
Shop #110); 6.25
(Chili's Restaurant
#1070 Beer
Cooler); 7.5
(Chili's Food
Cooler); 15.8
(Prototypical);
7.42 (Small
Cooler); 50 (Large
Cooler)
32 (Tedeschi Food
Shop #110); 7
(Chili's Restaurant
#1070 Beer
Cooler); 17
(Chili's Food
Cooler); 15.8
(Prototypical);
9.42 (Small
Cooler); 50 (Large
Cooler)
8 to 30; 9 (Chili's
Restaurant #1070
Beer Cooler); 8.5
(Chili's Food
Cooler); 12
(Prototypical);
7.92 (Small
Cooler); 20 ft
(Large Cooler)
288 (Tedeschi
Food Shop #110);
43.75 (Chili's
Restaurant #1070
Beer Cooler);
127.5 (Chili's
Food Cooler);
249.6
(Prototypical);
69.9 (Small
Cooler); 2500
(Large Cooler)
393.8 (Chili's
Restaurant #1070
Beer Cooler);
1083.8 (Chili's
Food Cooler);
2995.2
(Prototypical);
553.6 (Small
Cooler); 50000
(Large Cooler)

254
Box Interior Dimensions for Walk-in Coolers (2 of 5)
Box Width (ft) Box Length (ft) Box Height (ft) Floor Area (ft2) Box Volume (ft
3)
(Blackmore 2012)
20, 8
(convenience
store)
30, 28
(convenience
store)
16, 8
(convenience
store)
600, 224 (convenience
store)
9600, 1792
(convenience
store)
(Christensen and
Bertilsen 2004)
10.83 (walk-in
with glass doors)
16.73 (walk-in
with glass doors)
8.53 (walk-in
with glass doors) 181.2 1,545.5
(Cooper 1973) 32.81 32.81 14.76 1,076.5 15,889.1
(DOE 2010a) < 3000
(DOE 2010b) 8.0 sm, 12 med,
25 lrg
10 sm, 20 med,
30 lrg
7.6 sm, 9.5 med,
12 lrg
80 sm, 240 med, 750
lrg
608 sm, 2280
med, 9000 lrg
(DOE 2010c) < 3000
(Elsayed 1998) 6.56 to 13.12
(Foster et al. 2003) 15.74 19.03 12.47 299.67 3736.0
(Goetzler et al.
2009) 10 24 8.5 240; 80 to 250 (typical) 2,040
(Heatcraft 2008)
6, 8
(convenience), 14
(beef)
30, 28
(convenience),
16 (beef)
22, 8
(convenience,
beef)
180, 224 (convenience,
beef)
3960, 1792
(convenience,
beef)
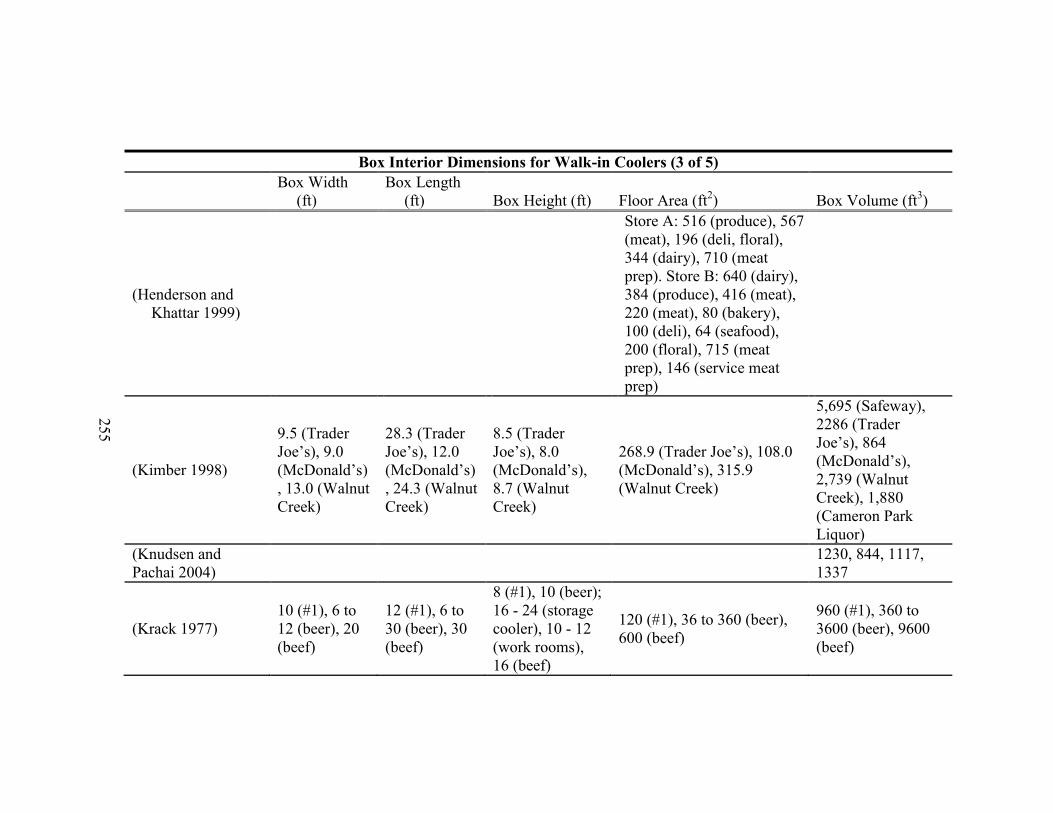
255
Box Interior Dimensions for Walk-in Coolers (3 of 5)
Box Width
(ft)
Box Length
(ft) Box Height (ft) Floor Area (ft2) Box Volume (ft
3)
(Henderson and
Khattar 1999)
Store A: 516 (produce), 567
(meat), 196 (deli, floral),
344 (dairy), 710 (meat
prep). Store B: 640 (dairy),
384 (produce), 416 (meat),
220 (meat), 80 (bakery),
100 (deli), 64 (seafood),
200 (floral), 715 (meat
prep), 146 (service meat
prep)
(Kimber 1998)
9.5 (Trader
Joe‟s), 9.0
(McDonald‟s)
, 13.0 (Walnut
Creek)
28.3 (Trader
Joe‟s), 12.0
(McDonald‟s)
, 24.3 (Walnut
Creek)
8.5 (Trader
Joe‟s), 8.0
(McDonald‟s),
8.7 (Walnut
Creek)
268.9 (Trader Joe‟s), 108.0
(McDonald‟s), 315.9
(Walnut Creek)
5,695 (Safeway),
2286 (Trader
Joe‟s), 864
(McDonald‟s),
2,739 (Walnut
Creek), 1,880
(Cameron Park
Liquor)
(Knudsen and
Pachai 2004)
1230, 844, 1117,
1337
(Krack 1977)
10 (#1), 6 to
12 (beer), 20
(beef)
12 (#1), 6 to
30 (beer), 30
(beef)
8 (#1), 10 (beer);
16 - 24 (storage
cooler), 10 - 12
(work rooms),
16 (beef)
120 (#1), 36 to 360 (beer),
600 (beef)
960 (#1), 360 to
3600 (beer), 9600
(beef)
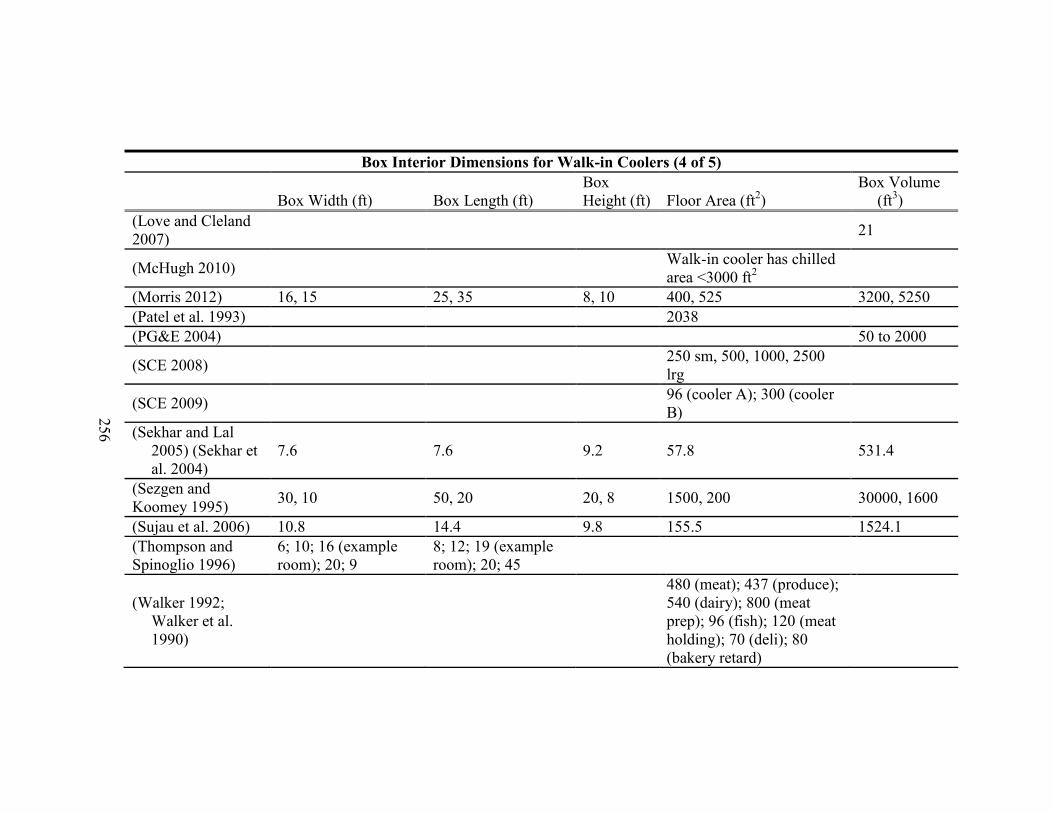
256
Box Interior Dimensions for Walk-in Coolers (4 of 5)
Box Width (ft) Box Length (ft)
Box
Height (ft) Floor Area (ft2)
Box Volume
(ft3)
(Love and Cleland
2007) 21
(McHugh 2010) Walk-in cooler has chilled
area <3000 ft2
(Morris 2012) 16, 15 25, 35 8, 10 400, 525 3200, 5250
(Patel et al. 1993) 2038
(PG&E 2004) 50 to 2000
(SCE 2008) 250 sm, 500, 1000, 2500
lrg
(SCE 2009) 96 (cooler A); 300 (cooler
B)
(Sekhar and Lal
2005) (Sekhar et
al. 2004)
7.6 7.6 9.2 57.8 531.4
(Sezgen and
Koomey 1995) 30, 10 50, 20 20, 8 1500, 200 30000, 1600
(Sujau et al. 2006) 10.8 14.4 9.8 155.5 1524.1
(Thompson and
Spinoglio 1996)
6; 10; 16 (example
room); 20; 9
8; 12; 19 (example
room); 20; 45
(Walker 1992;
Walker et al.
1990)
480 (meat); 437 (produce);
540 (dairy); 800 (meat
prep); 96 (fish); 120 (meat
holding); 70 (deli); 80
(bakery retard)

257
Box Interior Dimensions for Walk-in Coolers (5 of 5)
Box Width (ft) Box Length (ft)
Box
Height (ft) Floor Area (ft2)
Box Volume
(ft3)
(Walker 2001)
6 (bakery, cooler #1,
cheese and deli #2);
12 (deli and floral);
15 (meat #1 and meat
prep); 10 (meat #2);
14 (produce); 20
(dairy)
8 (bakery, cooler #1,
and deli #2); 12 (deli
and floral); 14
(cheese); 36
(produce); 40 (meat
#1, dairy, and meat
prep); 15 (meat #2)
48 (bakery, cooler #1, and
deli #2); 132 (deli and
floral); 84 (cheese); 600
(meat #1 and meat prep);
150 (meat #2); 800 (dairy);
504 (produce)
(Walker and Baxter
2002)
140 (floral walk-in); 2195
(walk-in coolers); 1010
(meat prep); 520 (produce
prep); 857 (dairy); 153
(deli); 48 (raw); 110 (fish);
984 (produce); 1056 (meat);
120 (bakery)
(Westphalen et al.
1996) 10 24 8.5
Meat cooler: 400, Other
coolers: 2600; Prototypical:
240
2040
258
Box Conduction
The box conduction load is defined by the wall, ceiling, and floor construction and
the exterior and interior conditions of the walk-in. Site conditions, with exception of the
ground temperature, are noted in Table 104 and Table 105, and interior box conditions are
listed in Table 108. Box construction details, as found in the literature, are noted in Table
111, with some additional conduction load details analyzed in Table 112.
Information on ground conditions for walk-in coolers was presented by (Adre and
Hellickson 1989), (Chuangchid and Krarti 2001), (Cooper 1973), (Devres and Bishop
1995), (DOE 2010a), (DOE 2010b), (DOE 2010c), (Heatcraft 2008), (Krack 1977),
(Magoo 2003), (Navy 1986), (Roy 2010), (SCE 2008), (Somrani et al. 2008), (Stoecker
1998), (Stoeckle 2000), and (Stoeckle et al. 2002). Information presented by (Chuangchid
and Krarti 2001) and (Somrani et al. 2008) is not included in this discussion, as it does not
directly apply to walk-ins. This information is summarized in Table 110.
Walk-in cooler construction details were presented by (Adre and Hellickson 1989),
(ASHRAE 1998), (Anonymous 2004), (Becker et al. 2011), (Blackmore 2012), (CIGR
1999), (Cooper 1973), (DOE 2010a), (DOE 2010b), (DOE 2010c), (Goetzler et al. 2009),
(Heatcraft 2008), (Krack 1977), (Magoo 2003), (Manske 1999), (Navy 1986), (Patel et al.
1993), (PG&E 2007), (Roy 2010), (SCE 2008), (Sekhar et al. 2004), (Sekhar and Lal
2005), (Stoecker 1998), (Stoeckle 2000), (Stoeckle et al. 2002), (Sujau et al. 2006),
(Thompson and Spinoglio 1996), and (Westphalen et al. 1996). Convective film
coefficients related to calculation of the conduction load for walk-in coolers were presented
by (DOE 2010b), (Krack 1977), (SCE 2008), and (Stoecker 1998).

259
Floor conditions are specified by some authors as a heat load per footprint and by
others as a ground temperature which is applied to calculate the heat load. Floor heat loads
ranged from 0.97 to 8.61 Btu/hr-ft2, with an average value of 3.29 Btu/hr-ft
2. Coolers
typically do not have floor heating installed, as sub-floor freezing is less of a concern. The
local ground temperature is therefore applied for determining the floor heat load. Values in
literature ranged from 40 to 80°F, with an average value of 57.6°F. Additional works that
should be noted but were too involved for application in this work include (Somrani et al.
2008), (Schulak and Horvay 2002), (Chuangchid and Krarti 2001), (ISO 1998), (Krarti et
al. 2004), (Krarti 1999), and (Krarti et al. 1988). The AHRI Load Spreadsheet (AHRI
2009a) uses a value of 50°F, which through comparison to literature values is low.
Increasing the ground temperature associated with the model load profile from 50°F to
55°F should better represent typical ground temperatures seen by walk-in boxes. When
applied to the model load calculation, this ground temperature correlated with a floor heat
load of 1.28 Btu/hr-ft2.
Box construction typically varies slightly for the ceiling, walls, and floor of a walk-
in cooler. Ceiling R-values ranged from 7.9 to 60 h-ft2-°F/Btu for walk-in coolers, with an
average value of 28.4 h-ft2-°F/Btu. This was comparable to the results found for the walls
of a cooler, which ranged from 7.9 to 42.5 h-ft2-°F/Btu, with an average value of 23.9 h-ft
2-
°F/Btu. The floor R-value was the exception, as it appears that about half of the time walk-
in coolers do not have insulated floors. The cited values ranged from on slab to 42.5 h-ft2-
°F/Btu, with an average value of 14.0 h-ft2-°F/Btu. AHRI had assumed R-values of 25 h-
ft2-°F/Btu for the walls, ceiling, and floor. This insulation level was maintained for the
260
walls and ceiling in the modified model load but was reduced to 15 h-ft2-°F/Btu for the
floors, to more closely match the literature findings.
The conduction load is tied to the space via convection on the interior and exterior
surfaces with the exception of the floor. A majority of designers and the AHRI Load
Spreadsheet (AHRI 2009a) ignore the effects of convection, but for this analysis the
convection film coefficients were applied to the conduction load calculation. Values
differed for the ceiling, wall, and floor, ranging from 0.17 to 0.87 h-ft2-°F/Btu. Values of
0.5 h-ft2-°F/Btu will be used for the wall and ceiling calculation, and 0.6 h-ft
2-°F/Btu will
be used for the floor calculation.

261
Table 110. Floor Conditions for Walk-in Coolers
Floor Conditions for Walk-in Coolers (1 of 2)
Floor Heat Load (Btu/hr-ft2) Ground Temperature (°F)
Range 0.97 to 8.61 40 to 80
Average 3.29 57.6
Proposed 1.28
55
(AHRI 2009a) 0.6
50
(Adre and
Hellickson 1989)
Average soil temperature at 51 cm
(Cooper 1973) 79.7
(Devres and
Bishop 1995)
41
(DOE 2010a) 55 or 60
(DOE 2010b) R-22.42, R-28.03, R-33.64: 8.61, 1.48,
1.21 (36 ft2); 7.31, 1.43, 1.18 (71.4 ft2);
6.9, 1.41, 1.17 (80 ft2); 4.4, 1.31, 1.1 (240
ft2); 2.97, 1.13, 0.97 (750 ft2); 3.04, 1.18,
1.01 (1200 ft2); (DOE finite element
analysis)
DOE Test Procedure: 60
(DOE 2010c) for A < 750 ft2: qfloor = 33.153 A^-0.364;
for A > 750 ft2: qfloor = 0.0002 A + 2.84
(floorless coolers)] 65

262
Floor Conditions for Walk-in Coolers (2 of 2)
Floor Heat Load (Btu/hr-ft2) Ground Temperature (°F)
(Heatcraft 2008) Ground temperatures ranging from 40 to 80, 66.3 average
(Krack 1977) 55
(Magoo 2003) No heating 50 under slab
(Navy 1986) Facilities > 5000 ft2 or < 32°F: heated by
glycol; Other facilities may use ventilation
pipes as alternative heating method
(Roy 2010) Yes
(SCE 2008) 50
(Stoecker 1998) Typically 41 to 50°F below slab
(Stoeckle 2000) 3.6 (Jekel and Reindl 2000) 67.5 below slab
(Stoeckle et al.
2002)
3.6 (Jekel and Reindl 2000)
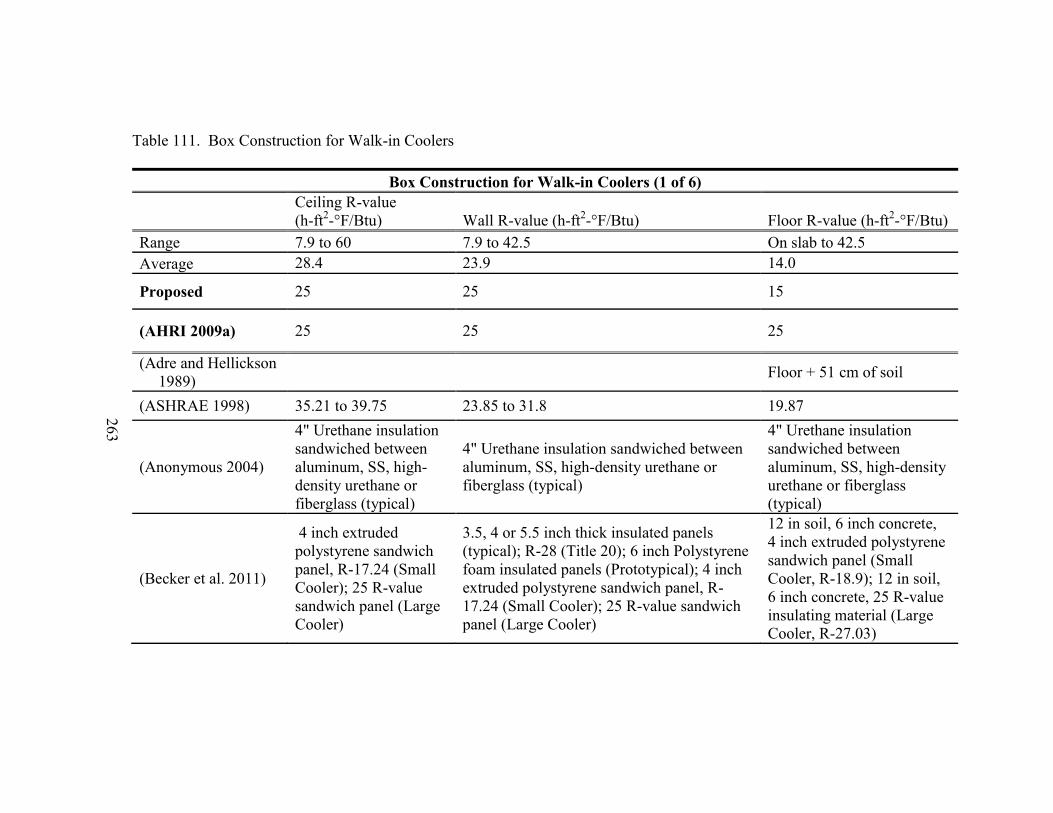
263
Table 111. Box Construction for Walk-in Coolers
Box Construction for Walk-in Coolers (1 of 6)
Ceiling R-value
(h-ft2-°F/Btu) Wall R-value (h-ft
2-°F/Btu) Floor R-value (h-ft
2-°F/Btu)
Range 7.9 to 60 7.9 to 42.5 On slab to 42.5
Average 28.4 23.9 14.0
Proposed 25 25 15
(AHRI 2009a) 25 25 25
(Adre and Hellickson
1989) Floor + 51 cm of soil
(ASHRAE 1998) 35.21 to 39.75 23.85 to 31.8 19.87
(Anonymous 2004)
4" Urethane insulation
sandwiched between
aluminum, SS, high-
density urethane or
fiberglass (typical)
4" Urethane insulation sandwiched between
aluminum, SS, high-density urethane or
fiberglass (typical)
4" Urethane insulation
sandwiched between
aluminum, SS, high-density
urethane or fiberglass
(typical)
(Becker et al. 2011)
4 inch extruded
polystyrene sandwich
panel, R-17.24 (Small
Cooler); 25 R-value
sandwich panel (Large
Cooler)
3.5, 4 or 5.5 inch thick insulated panels
(typical); R-28 (Title 20); 6 inch Polystyrene
foam insulated panels (Prototypical); 4 inch
extruded polystyrene sandwich panel, R-
17.24 (Small Cooler); 25 R-value sandwich
panel (Large Cooler)
12 in soil, 6 inch concrete,
4 inch extruded polystyrene
sandwich panel (Small
Cooler, R-18.9); 12 in soil,
6 inch concrete, 25 R-value
insulating material (Large
Cooler, R-27.03)

264
Box Construction for Walk-in Coolers (2 of 6)
Ceiling R-value
(h-ft2-°F/Btu) Wall R-value (h-ft
2-°F/Btu) Floor R-value (h-ft
2-°F/Btu)
(Blackmore 2012)
Spray K = 0.16 Btu / hr-in-F, Foam = 0.12,
Styrofoam = 0.26; 4 inch Styrene
(Convenience store)
6" concrete slab
(Convenience store)
(CIGR 1999)
Insulated with rigid
board, foam materials,
or loss fill. 60 R-value
common Range of 30
to 60.
0.30 W/m2-K typical; 0.25 W/m
2-K without
mechanical cooling; 0.20 W/m2-K ceilings,
0.25 W/m2-K walls, 0.505 W/m
2-K floors;
Walls insulated with fiberglass batting, rigid
urethane foam boards or sprayed on foam. 20
to 40 R-value
(Cooper 1973) R-42.53, 6" thick
Brick and concrete or light steel frames and
panels of pre-cast polyurethane bonded
between steel or aluminum outer coating and
plywood or other permeable materials as
inner face. 42.53 h-ft2-ºF/Btu; 5 inches thick
42.53 h-ft2-ºF/Btu; 5 inches
thick
(DOE 2010a) No foam insulation degradation seen in
practice
(DOE 2010b)
4” XPS or PU, R-24
(independent testing
lab)
4” XPS or PU, R-24 (independent testing
lab) Uninsulated
(DOE 2010c)
4" Foam: 16 to 32 h-ft2-ºF/Btu; 4" Vacuum
insulated panel: 120 to 200 h-ft2-ºF/Btu
(excluded from average for Table 111).
Insulating value degrades over time due to
diffusion of gases and moisture absorption.

265
Box Construction for Walk-in Coolers (3 of 6)
Ceiling R-value
(h-ft2-°F/Btu) Wall R-value (h-ft
2-°F/Btu) Floor R-value (h-ft
2-°F/Btu)
(Goetzler et al. 2009)
28; minimum of 4 in of
blown polyurethane
foam
28; minimum of 4 in of blown polyurethane
foam; 28.6; 4 in thick (baseline)
28; minimum of 4 in of
blown polyurethane foam
(Heatcraft 2008) Walk-in: 4 in Styrene
(R = 16.7, k = 0.24)
1 to 10 inches of cork/mineral wool, glass
fiber/poly styrene, sprayed urethane, foamed
in place urethane; Heatcraft Table 13 -
General Standard for Insulation Thickness in
Storage Rooms; 2 to 4 inches of styrofoam or
polyurethane. Walk-in: 4 in Styrene (R =
16.7, k = 0.24)
Walk-in: 6" concrete slab
(Krack 1977)
3-4" foamed in place
urethane; 3" foamglass
to 6" foamed in place
urethane (7.9 to 23.1 h-
ft2-°F/Btu, 14.9
average)
3-4" foamed in place urethane; 3" foamglass
to 6" foamed in place urethane (7.9 to 23.1 h-
ft2-°F/Btu, 14.9 average)
6 in concrete on grade, no
insulation or 4 or 6" styrene
(Magoo 2003) same as walls
Insulation: 21.19 to 27.93 with a 2 in layer of
concrete on either side (cooler); Outside to
inside: 2 in concrete, 1.85 in insulation, 5.98
in concrete; 10.25 R-value (dock)
Outside to inside: 11.8 in
concrete, 1.38 in insulation;
8.28 R-value (cooler);
Outside to inside: 11.8 in
concrete, 1.38 in insulation;
8.28 R-value (dock)
(Manske 1999) 25.09 lightweight 24.85 lightweight 1 (perimeter)

266
Box Construction for Walk-in Coolers (4 of 6)
Ceiling R-value
(h-ft2-°F/Btu) Wall R-value (h-ft
2-°F/Btu) Floor R-value (h-ft
2-°F/Btu)
(Navy 1986)
25 to 35 (40 to 50°F
box temp); 30 to 40 (28
to 35°F)
17 to 30 (40 to 50°F box temp); 25 to 35 (28
to 35°F)
Perimeter only (40 to 50°F
box temp); 15 to 20 (28 to
35°F)
(Patel et al. 1993) 2 inches of foam insulation on all walls
(PG&E 2007)
R-24 to R-40 (range) of
wood frame plywood
with 4" of blown
insulation; R-23, 0.8
absorptivity
(prototypical
cooler/dock)
R-23 to R-40 (range) of either 4" to 5"
expanded urethane metal clad panels or
sandwiched concrete panels; R-30 (typical
for cooler or dock); R-20 (prototypical
cooler/dock)
Uninsulated concrete on
grade
(Roy 2010) 40 30 with natural lighting through high
insulated R-7.5 translucent windows
(SCE 2008) > R-28 > R-28
(Sekhar et al. 2004),
(Sekhar and Lal
2005)
5.9 inches of mineral
wool 5.9 inches of mineral wool 5.9 inches of mineral wool
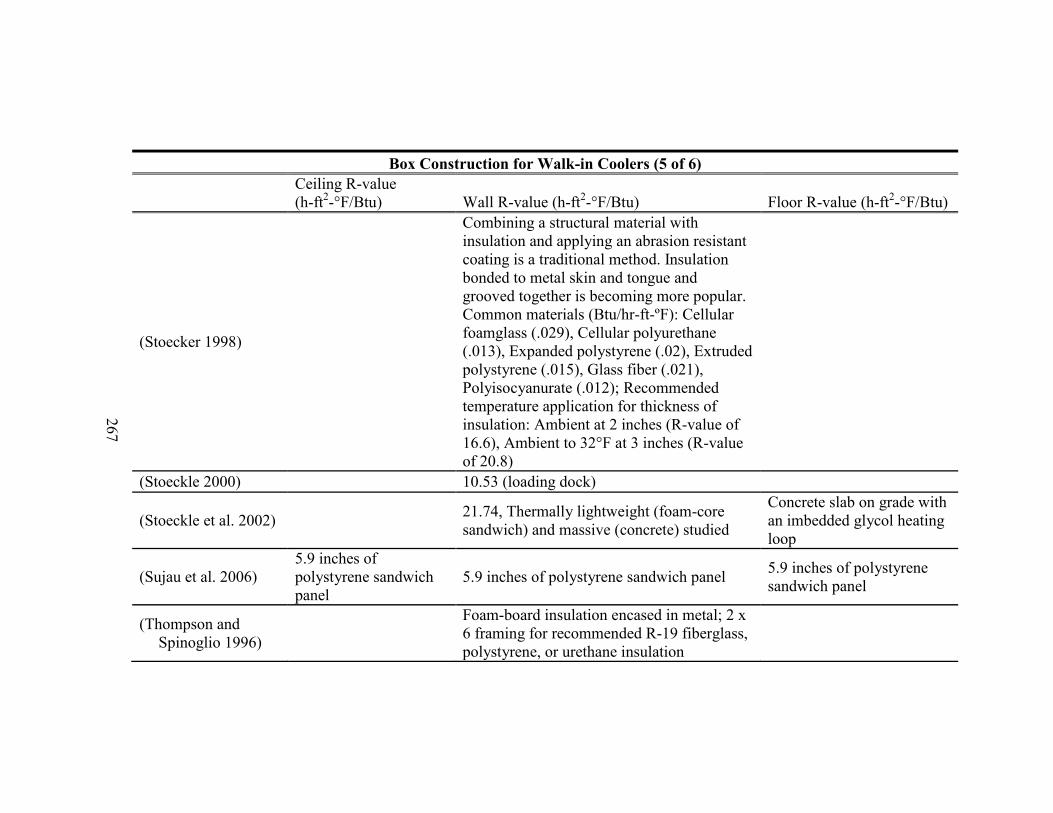
267
Box Construction for Walk-in Coolers (5 of 6)
Ceiling R-value
(h-ft2-°F/Btu) Wall R-value (h-ft
2-°F/Btu) Floor R-value (h-ft
2-°F/Btu)
(Stoecker 1998)
Combining a structural material with
insulation and applying an abrasion resistant
coating is a traditional method. Insulation
bonded to metal skin and tongue and
grooved together is becoming more popular.
Common materials (Btu/hr-ft-ºF): Cellular
foamglass (.029), Cellular polyurethane
(.013), Expanded polystyrene (.02), Extruded
polystyrene (.015), Glass fiber (.021),
Polyisocyanurate (.012); Recommended
temperature application for thickness of
insulation: Ambient at 2 inches (R-value of
16.6), Ambient to 32°F at 3 inches (R-value
of 20.8)
(Stoeckle 2000)
10.53 (loading dock)
(Stoeckle et al. 2002) 21.74, Thermally lightweight (foam-core
sandwich) and massive (concrete) studied
Concrete slab on grade with
an imbedded glycol heating
loop
(Sujau et al. 2006)
5.9 inches of
polystyrene sandwich
panel
5.9 inches of polystyrene sandwich panel 5.9 inches of polystyrene
sandwich panel
(Thompson and
Spinoglio 1996)
Foam-board insulation encased in metal; 2 x
6 framing for recommended R-19 fiberglass,
polystyrene, or urethane insulation
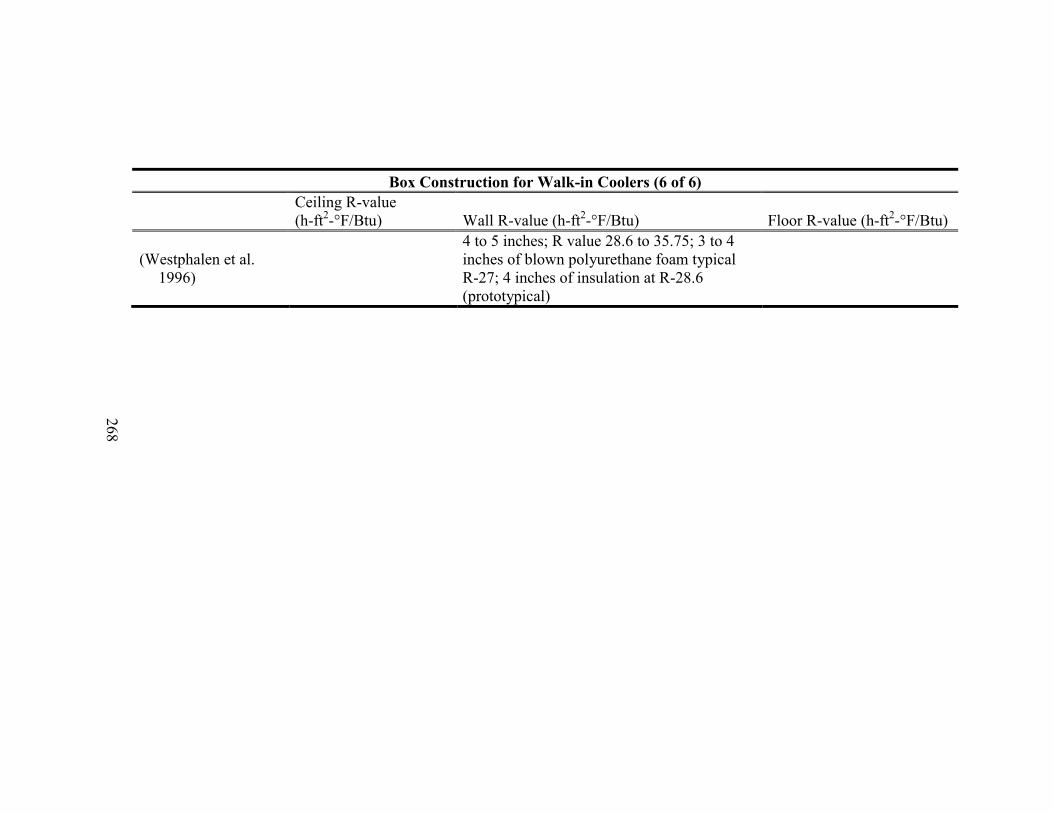
268
Box Construction for Walk-in Coolers (6 of 6)
Ceiling R-value
(h-ft2-°F/Btu) Wall R-value (h-ft
2-°F/Btu) Floor R-value (h-ft
2-°F/Btu)
(Westphalen et al.
1996)
4 to 5 inches; R value 28.6 to 35.75; 3 to 4
inches of blown polyurethane foam typical
R-27; 4 inches of insulation at R-28.6
(prototypical)
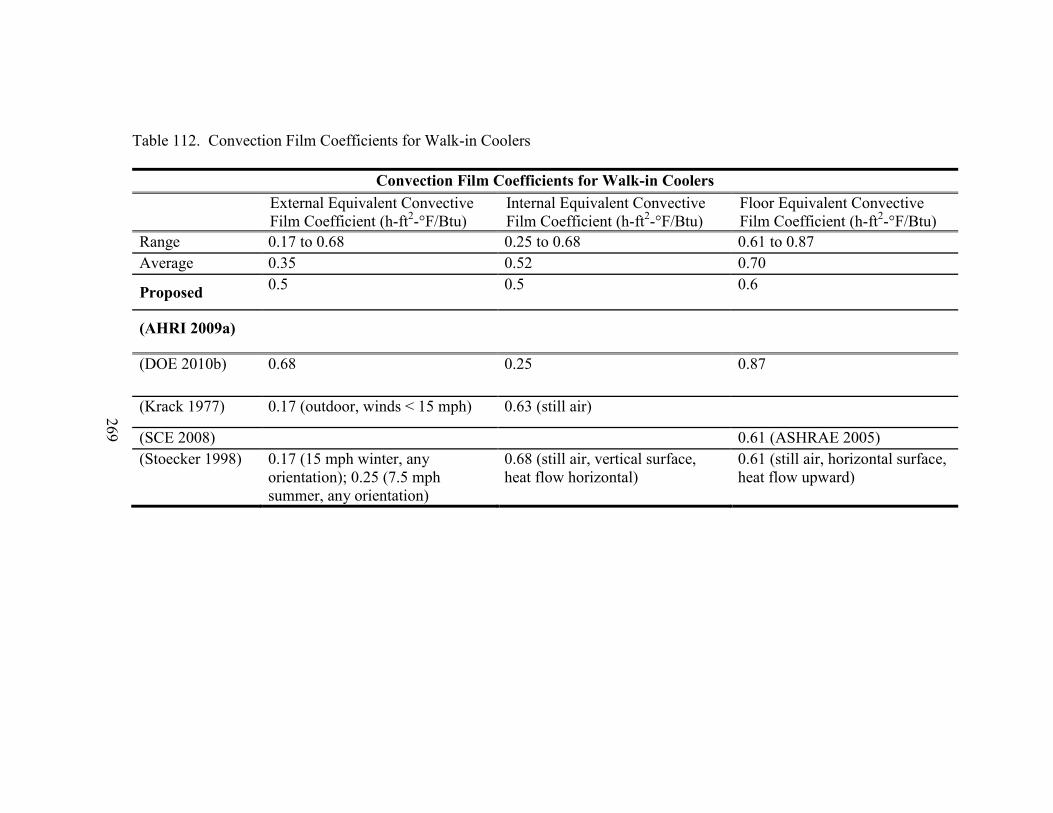
269
Table 112. Convection Film Coefficients for Walk-in Coolers
Convection Film Coefficients for Walk-in Coolers
External Equivalent Convective
Film Coefficient (h-ft2-°F/Btu)
Internal Equivalent Convective
Film Coefficient (h-ft2-°F/Btu)
Floor Equivalent Convective
Film Coefficient (h-ft2-°F/Btu)
Range 0.17 to 0.68 0.25 to 0.68 0.61 to 0.87
Average 0.35 0.52 0.70
Proposed 0.5 0.5 0.6
(AHRI 2009a)
(DOE 2010b) 0.68 0.25 0.87
(Krack 1977) 0.17 (outdoor, winds < 15 mph) 0.63 (still air)
(SCE 2008) 0.61 (ASHRAE 2005)
(Stoecker 1998) 0.17 (15 mph winter, any
orientation); 0.25 (7.5 mph
summer, any orientation)
0.68 (still air, vertical surface,
heat flow horizontal)
0.61 (still air, horizontal surface,
heat flow upward)
270
Infiltration
Components for calculation of the infiltration load include the difference in
temperature of the interior and exterior spaces, the schedule of door openings and their
duration, and the calculation method utilized. Space interior temperatures were analyzed in
Table 108, and exterior and interior site conditions are listed in Table 104 and Table 105,
respectively. Door opening schedules and infiltration calculation methods are compared in
Table 113.
Twenty-eight authors presented information related to infiltration, including (Arias
2005), (Becker et al. 2011), (Blackmore 2012), (Christensen and Bertilsen 2004), (Cleland
1983), (Cleland et al. 2004), (Cole 1987), (Cooper 1973), (Devres and Bishop 1995), (DOE
2010b), (Elsayed 1998), (Foster et al. 2003), (Fricke and Becker 2011), (Heatcraft 2008),
(Hendrix et al. 1989), (Kimber 1998), (Krack 1977), (Magoo 2003), (Manske 1999), (Patel
et al. 1993), (PG&E 2007), (Roy 2010), (SCE 2008), (Stoecker 1998), (Stoeckle 2000),
(Stoeckle et al. 2002), and (Westphalen et al. 1996).
Primary infiltration calculation methods used in the literature include Gosney and
Olama (Equation 25), Downing and Meffert (Equation 74), Heatcraft (Equation 109),
Krack (Equation 67), and Air Change Method (Table 22, Table 77, and Table 88). Gosney
and Olama is the most widely used and most accepted. Coincidently, this is the method
used in the AHRI Load Spreadsheet (AHRI 2009a). Door opening schedules and the
duration of door openings were all captured from literature. The number of door openings
and their duration are difficult to compare due to variations in the test period and
complexity of some schedules. When analyzed as an open door percentage, literature
values for the door being open ranged from 1.3 to 100%. The average door open

271
percentage was 12.7%. The AHRI Load Spreadsheet door opening schedule equates to an
open percentage of 1.18% for the small cooler and 2.78% for the large cooler. The average
open door percentage was skewed by numerous door opening schedules where the door
was open all the time. After analyzing the available literature, a 5.4% open door percentage
was chosen for the proposed model load.

272
Table 113. Infiltration Details for Walk-in Coolers
Infiltration Details for Walk-in Coolers (1 of 8)
Infiltration Calculation Miscellaneous Infiltration
Calculation Information
Number of Door
Openings
Duration of Door
Openings
Range Average Open Door Percentage:
1.3% to 100%
9.3 to 960 8.8 to 316.5 seconds
Average Average Open Door Percentage:
12.7%
174.2 75
9 seconds
Proposed Gosney Olama Average Open Door Percentage:
5.4%
13 per hour - 7 am
to 7 pm
30 seconds
AHRI Load
Spreadsheet
(2009a)
Gosney Olama Equation
(ASHRAE Refrigeration
Handbook); Air Density
Factor: 0.97
Average Open Door Percentage:
1.18% (sm), 2.78% (lrg)
30 openings per
hour – 6am to
7am, 2 openings
per hour – 7am to
7pm (sm);
32 openings per
hour – 6am to
7am, 4 openings
per hour – 7am to
7pm (lrg)
30 seconds per
opening – 6am to
7am, 5 seconds per
opening – 7am to
7pm (sm);
30 seconds per
opening – 6am to
7pm (lrg)
(Arias 2005) 30 Air changes per 24 hrs for
247 ft3 room, 24.5 for 353, 17
for 706, 11.5 for 1413, 7 for
3531, 2.7 for 17657, 2.7 for
35315, 1.05 for 105944
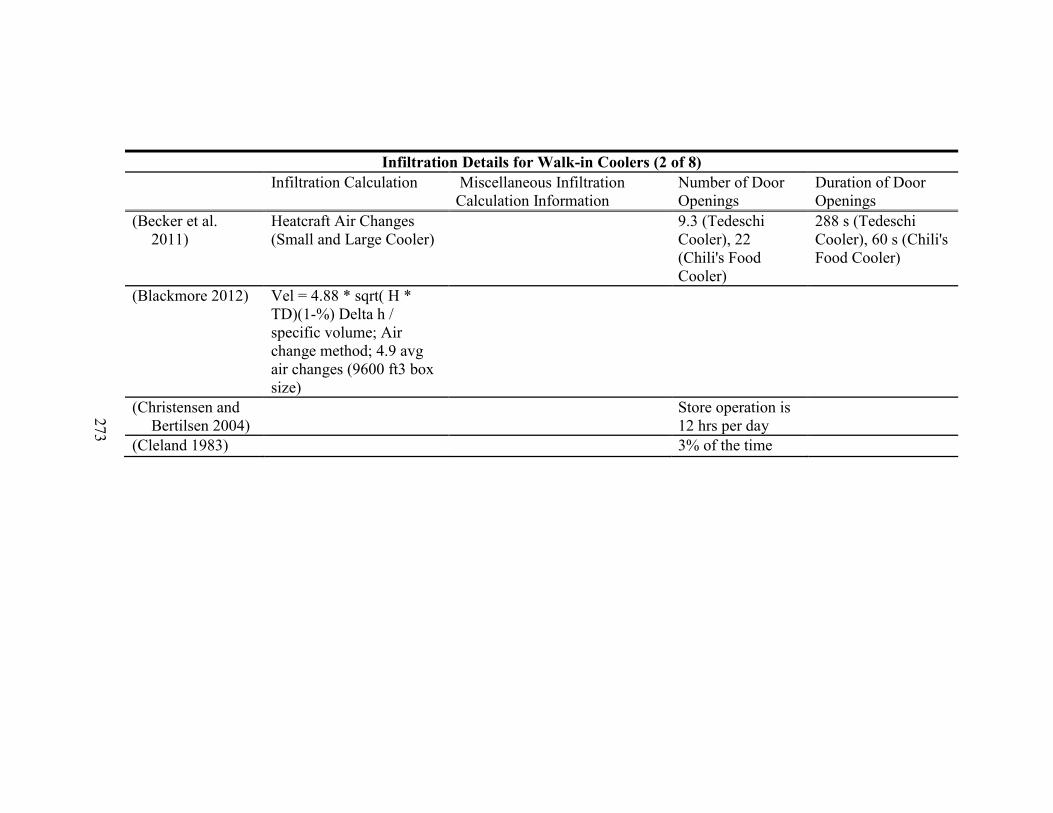
273
Infiltration Details for Walk-in Coolers (2 of 8)
Infiltration Calculation Miscellaneous Infiltration
Calculation Information
Number of Door
Openings
Duration of Door
Openings
(Becker et al.
2011)
Heatcraft Air Changes
(Small and Large Cooler)
9.3 (Tedeschi
Cooler), 22
(Chili's Food
Cooler)
288 s (Tedeschi
Cooler), 60 s (Chili's
Food Cooler)
(Blackmore 2012) Vel = 4.88 * sqrt( H *
TD)(1-%) Delta h /
specific volume; Air
change method; 4.9 avg
air changes (9600 ft3 box
size)
(Christensen and
Bertilsen 2004)
Store operation is
12 hrs per day
(Cleland 1983) 3% of the time
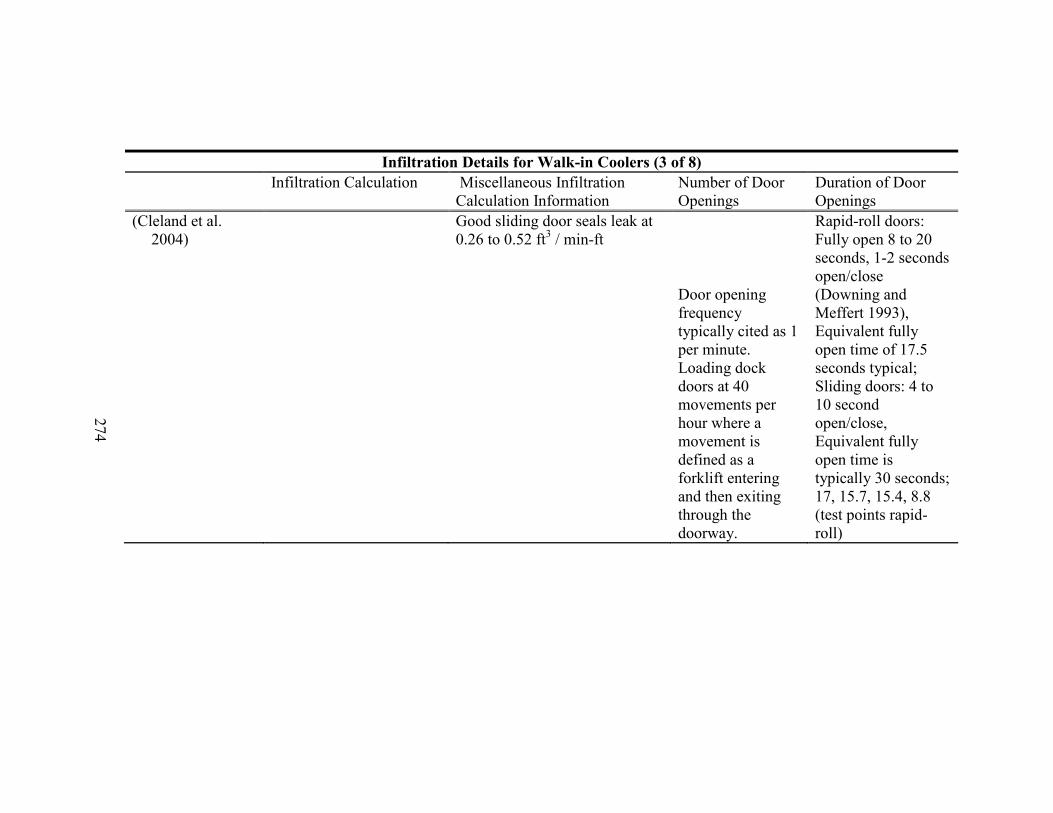
274
Infiltration Details for Walk-in Coolers (3 of 8)
Infiltration Calculation Miscellaneous Infiltration
Calculation Information
Number of Door
Openings
Duration of Door
Openings
(Cleland et al.
2004)
Good sliding door seals leak at
0.26 to 0.52 ft3 / min-ft
Door opening
frequency
typically cited as 1
per minute.
Loading dock
doors at 40
movements per
hour where a
movement is
defined as a
forklift entering
and then exiting
through the
doorway.
Rapid-roll doors:
Fully open 8 to 20
seconds, 1-2 seconds
open/close
(Downing and
Meffert 1993),
Equivalent fully
open time of 17.5
seconds typical;
Sliding doors: 4 to
10 second
open/close,
Equivalent fully
open time is
typically 30 seconds;
17, 15.7, 15.4, 8.8
(test points rapid-
roll)

275
Infiltration Details for Walk-in Coolers (4 of 8)
Infiltration Calculation Miscellaneous Infiltration
Calculation Information
Number of Door
Openings
Duration of Door
Openings
(Cole 1987) Modified Gosney Olama Flow drops off after several
minutes due to partitioning
effect of product stacked around
door; Krack Corporation
calculation method: V = 4.88
(H) (TD)0.5; Figure 17 - Air
infiltration rate in cfm vs. room
volume; 18 - Air infiltration in
air changes vs. room volume; ф
(Time Related Factor), Gosney
Olama: 0.5 typical for high
traffic door operated cyclically;
Lag Time: 15 to 60 seconds
(Cooper 1973) Air change method 12 empty volume air changes
per day assumed
(Devres and
Bishop 1995)
56 openings per
day
20 seconds / opening
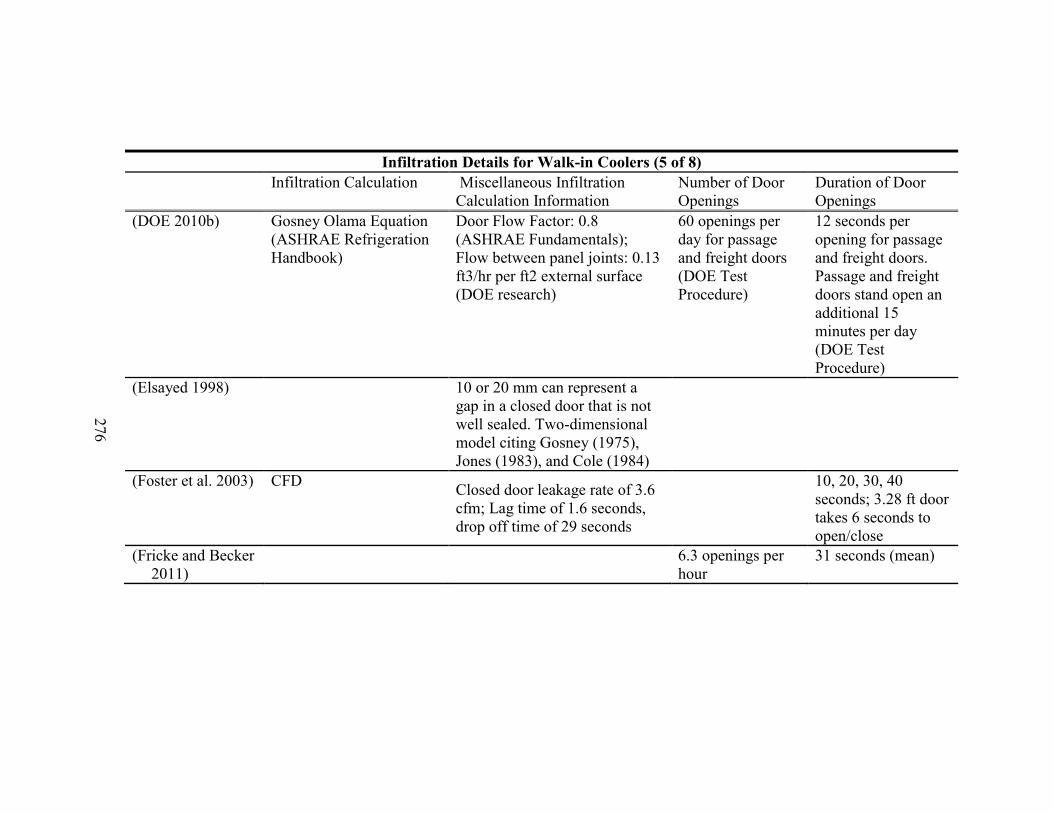
276
Infiltration Details for Walk-in Coolers (5 of 8)
Infiltration Calculation Miscellaneous Infiltration
Calculation Information
Number of Door
Openings
Duration of Door
Openings
(DOE 2010b) Gosney Olama Equation
(ASHRAE Refrigeration
Handbook)
Door Flow Factor: 0.8
(ASHRAE Fundamentals);
Flow between panel joints: 0.13
ft3/hr per ft2 external surface
(DOE research)
60 openings per
day for passage
and freight doors
(DOE Test
Procedure)
12 seconds per
opening for passage
and freight doors.
Passage and freight
doors stand open an
additional 15
minutes per day
(DOE Test
Procedure)
(Elsayed 1998) 10 or 20 mm can represent a
gap in a closed door that is not
well sealed. Two-dimensional
model citing Gosney (1975),
Jones (1983), and Cole (1984)
(Foster et al. 2003) CFD Closed door leakage rate of 3.6
cfm; Lag time of 1.6 seconds,
drop off time of 29 seconds
10, 20, 30, 40
seconds; 3.28 ft door
takes 6 seconds to
open/close
(Fricke and Becker
2011)
6.3 openings per
hour
31 seconds (mean)

277
Infiltration Details for Walk-in Coolers (6 of 8)
Infiltration Calculation Miscellaneous Infiltration
Calculation Information
Number of Door
Openings
Duration of Door
Openings
(Heatcraft 2008) Average air change or
Heatcraft infiltration
calculation:
[(4.88)sqrt(door height)
(area/2) (minutes open)
sqrt(temp diff F)
(enthalpy incoming - box
air)] [(1-X)]/specific
volume of incoming air
Table 88; Table 90- Glass Door
Loads; Table 92
(Hendrix et al.
1989)
Door Flow Factor: 1; lag time
of less than 3 seconds
(Kimber 1998) 72.8 openings per
day (Safeway
passage door)
6.4 hours per day
(Safeway passage
door)
(Krack 1977) Air change method or
infiltration calculation:
[(527)sqrt(door
height*TD)*A/2*(minutes
open) (delta h)]
Air changes (Table 22) 480 min open / 24
hrs; 5 min/hr (beef
carcass)
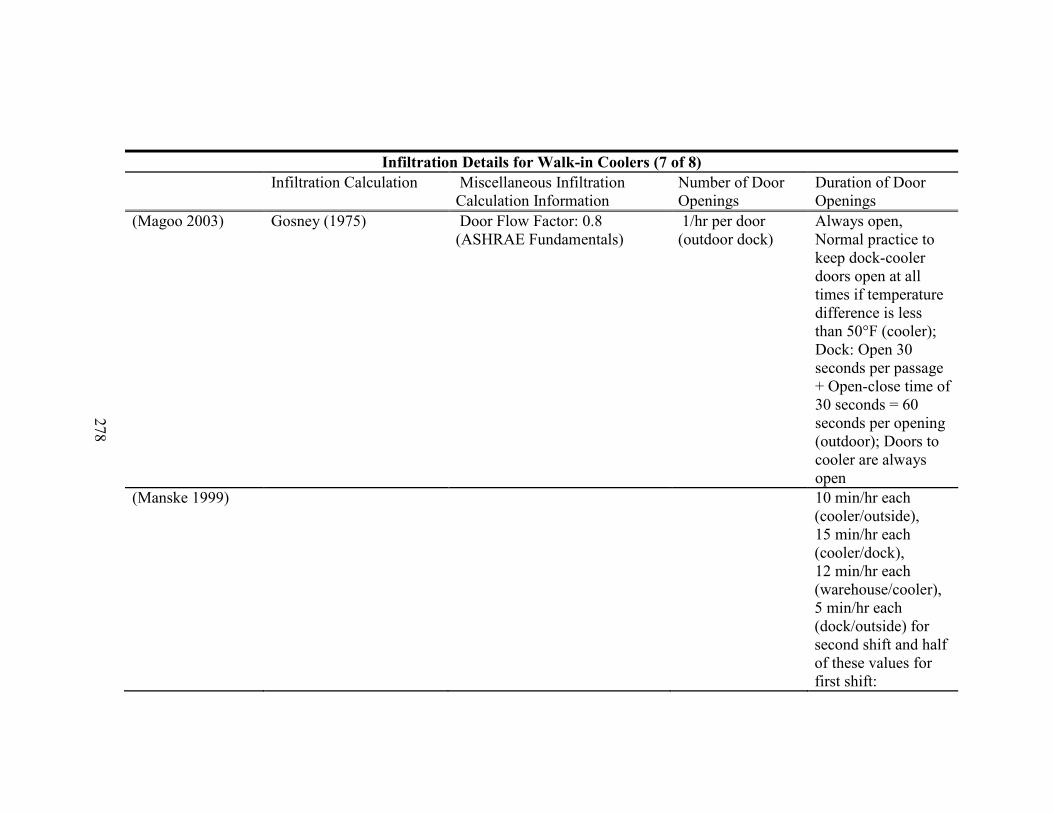
278
Infiltration Details for Walk-in Coolers (7 of 8)
Infiltration Calculation Miscellaneous Infiltration
Calculation Information
Number of Door
Openings
Duration of Door
Openings
(Magoo 2003) Gosney (1975) Door Flow Factor: 0.8
(ASHRAE Fundamentals)
1/hr per door
(outdoor dock)
Always open,
Normal practice to
keep dock-cooler
doors open at all
times if temperature
difference is less
than 50°F (cooler);
Dock: Open 30
seconds per passage
+ Open-close time of
30 seconds = 60
seconds per opening
(outdoor); Doors to
cooler are always
open
(Manske 1999) 10 min/hr each
(cooler/outside),
15 min/hr each
(cooler/dock),
12 min/hr each
(warehouse/cooler),
5 min/hr each
(dock/outside) for
second shift and half
of these values for
first shift:

279
Infiltration Details for Walk-in Coolers (8 of 8)
Infiltration Calculation Miscellaneous Infiltration
Calculation Information
Number of Door
Openings
Duration of Door
Openings
(Patel et al. 1993) Significant portion of load
(PG&E 2007) Air change method 0.1 ACH
(Roy 2010) 1800 cfm; Refrigerated
warehouses typically don't have
ventilation systems
(SCE 2008) 1.00 air changes per hour (sm),
0.68 ACH, 0.46 ACH, 0.25
ACH (lrg) (Heatcraft
Refrigeration)
(Stoecker 1998) Gosney and Olama 10 to 15 seconds
(typical)
(Stoeckle 2000) (Downing and Meffert
1993)
2 min/hr each
(outside); 4 min/hr
each (freezer)
(Stoeckle et al.
2002)
(Downing and Meffert
1993)
4 min/hr ea
(freezer); 2 min/hr
ea (outdoors)
(Westphalen et al.
1996)
Good door sealing systems

280
Product
Another load that varies greatly from walk-in to walk-in is the product load.
Depending on the application, some walk-ins pull-down product temperatures to the
storage temperature whereas others just maintain product temperature. Some coolers must
continuously combat product respiration whereas others store only packaged products or
non-perishable products that do not evaporate-off moisture. The length of storage is fairly
consistent (1 to 20 days) with coolers, as the duration of product storage is limited by its
shelf life.
Through researching the available literature, information on product type (Table
114), pull-down characteristics (Table 114), product loading (Table 114), and product
thermal properties (Table 115), was obtained. Thirty researchers contributed information to
this study, including (Adre and Hellickson 1989), (Anonymous 2004), (Becker and Fricke
1996a), (Becker et al. 2011), (Blackmore 2012), (Chourasia and Goswami 2007), (CIGR
1999), (Cooper 1973), (Devres and Bishop 1995), (DOE 2010b), (Goetzler et al. 2009),
(Heatcraft 2008), (Henderson and Khattar 1999), (Krack 1977), (Love and Cleland 2007),
(Magoo 2003), (Manske 1999), (Navy 1986), (Patel et al. 1993), (PG&E 2007), (Roy
2010), (SCE 2008), (SCE 2009), (Stoeckle et al. 2002), (Stoecker 1998), (Thompson and
Spinoglio 1996), (USDA 2010), (Wade 1984), (Walker and Baxter 2002), and (Westphalen
et al. 1996).
Coolers store many different products, ranging from fruits and vegetables to film
reels. The type of product strongly affects what storage conditions the box will operate at
(Table 108), which is a factor in all heat load calculations. As noted previously, the amount
of the heat that must be removed from the incoming product to reach the storage condition

281
varies greatly for each application. Research showed that product pull-down temperature
differences range from 0 to 68°F, with an average value of 23.8°F. AHRI (AHRI 2009a)
used a value of 10°F for the pull-down temperature difference. This value was not altered
for the modified model load, as a disproportional number of references were for harvest
applications where field heat must be removed from the product. Product loading schedules
also vary widely, but due to the fact that product temperature pull-down is over an
extended period ranging from 8 to 720 hrs (115.7 hr average) for coolers, the load may be
assumed to be constant over the entire day. The average value is skewed by the large
number of applications where crops are pulled down from field temperature to storage
temperature over numerous weeks following harvest. A more typical value would be 24 hrs
or more. Assuming that the load may be applied as a constant value of the entire day to the
model load, the product load was analyzed on a loading ratio basis. Information in the
literature showed a daily loading ratio ranging from 1.23 to 4.06 lbs of product per ft3 of
refrigerated space, with an average value of 1.91. The larger values of product loading
were coincident with smaller coolers. The AHRI Load Spreadsheet used values of 12.11
and 1.60 lbs of product per ft3 for the small and large coolers, respectively. The smaller
cooler product loading seems high considering the data obtained from the literature,
resulting in an adjustment of the product loads to 4.0 and 1.8 lbs of product per ft3 of
refrigerated space for the small and large coolers, respectively.
A wealth of information was obtained from the literature on the thermal properties
of various products. The AHRI Load Spreadsheet (AHRI 2009a) uses a product specific
heat of 0.9 Btu/lb-°F. After analyzing the literature, this value remained unchanged for the
modified model. Additionally, it is apparent that it is common for products be stored so that
282
their respiration heat load is added to the space. For this study, it is assumed that half of the
products stored are unpackaged and therefore add a respiration heat load to the space, with
a respiration coefficient of approximately 0.0292 Btu/lb-hr.
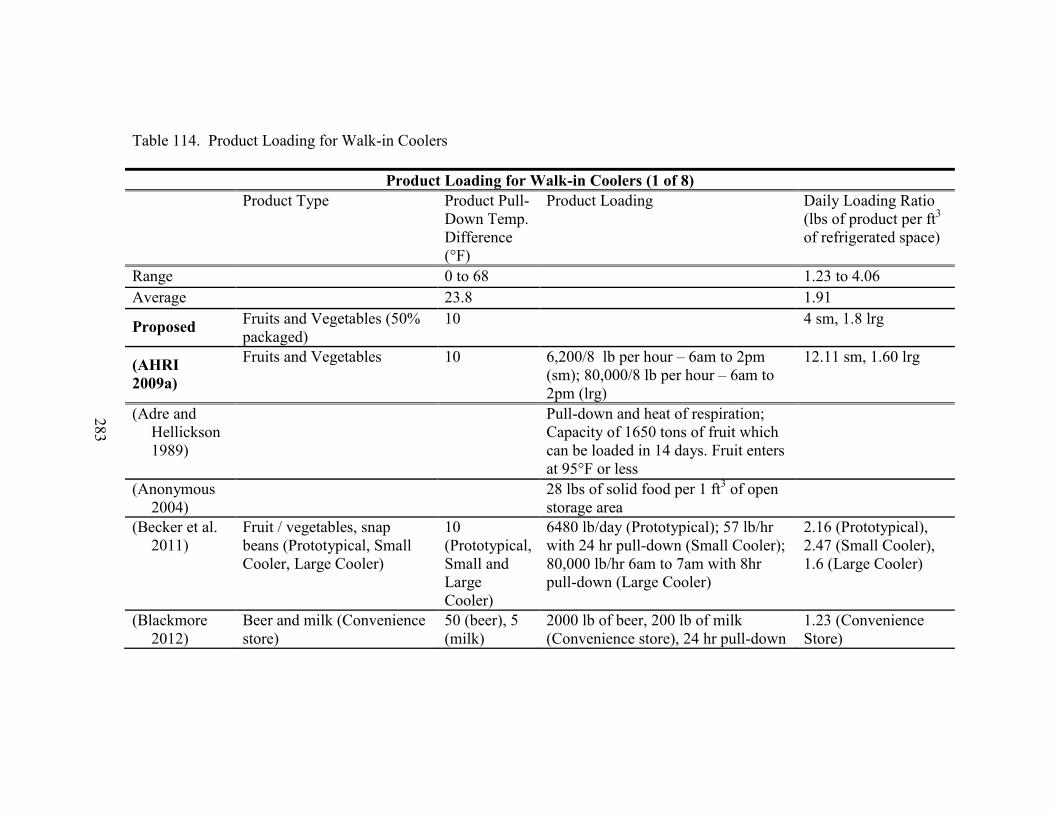
283
Table 114. Product Loading for Walk-in Coolers
Product Loading for Walk-in Coolers (1 of 8)
Product Type Product Pull-
Down Temp.
Difference
(°F)
Product Loading Daily Loading Ratio
(lbs of product per ft3
of refrigerated space)
Range 0 to 68 1.23 to 4.06
Average 23.8 1.91
Proposed Fruits and Vegetables (50%
packaged)
10 4 sm, 1.8 lrg
(AHRI
2009a)
Fruits and Vegetables 10 6,200/8 lb per hour – 6am to 2pm
(sm); 80,000/8 lb per hour – 6am to
2pm (lrg)
12.11 sm, 1.60 lrg
(Adre and
Hellickson
1989)
Pull-down and heat of respiration;
Capacity of 1650 tons of fruit which
can be loaded in 14 days. Fruit enters
at 95°F or less
(Anonymous
2004)
28 lbs of solid food per 1 ft3 of open
storage area
(Becker et al.
2011)
Fruit / vegetables, snap
beans (Prototypical, Small
Cooler, Large Cooler)
10
(Prototypical,
Small and
Large
Cooler)
6480 lb/day (Prototypical); 57 lb/hr
with 24 hr pull-down (Small Cooler);
80,000 lb/hr 6am to 7am with 8hr
pull-down (Large Cooler)
2.16 (Prototypical),
2.47 (Small Cooler),
1.6 (Large Cooler)
(Blackmore
2012)
Beer and milk (Convenience
store)
50 (beer), 5
(milk)
2000 lb of beer, 200 lb of milk
(Convenience store), 24 hr pull-down
1.23 (Convenience
Store)
284
Product Loading for Walk-in Coolers (2 of 8)
Product Type Product Pull-
Down Temp.
Difference
(°F)
Product Loading Daily Loading Ratio
(lbs of product per ft3
of refrigerated space)
(Chourasia
and
Goswami
2007)
Potatoes in gunny bags made
of meshed jute threads
35.1 Contributes to 2/3rds of refrigeration
load during transient cooling periods
of cold storage. 6.72 day half cool
time, 10 to 30 day pull down time.
Storage for 1 to 8 months. 25.97 to
54.89 W/ton average load. 4000 ton
capacity. The daily loading rate
should be 3-4% of the total loading
capacity.
(CIGR 1999) 3.6 3500 J/kg-K (pull-down); 1000-4200
J/kg-K (respiration); Temperatures
and storage lengths given (onions,
spring onions, cassava, tubers, yams,
taro, tannia)
(Cooper 1973) Fresh fruits and vegetables,
seed potatoes, bulbs, grain-
drying, rice drying, fruit
ripening or coloring for
bananas, canned pears,
plums and peaches
48.6 Single farm crops four to six months.
Product stacked 13.1 ft high in a 16.4
ft room. Product covers 65% of floor
area and 46.3% of volume. 220 kg/m3
of product per insulated volume.
Receive 10% of nominal capacity of
warm product on each day during
harvest season, taking three days to
cool from 80.6°F to 32°F.
Respiratory activity of fruit at 250
kcal/ton-day
1.37
285
Product Loading for Walk-in Coolers (3 of 8)
Product Type Product Pull-
Down Temp.
Difference
(°F)
Product Loading Daily Loading Ratio
(lbs of product per ft3
of refrigerated space)
(Devres and
Bishop
1995)
More than 50% of total daily load;
Half cooling time of 10 days;
Capacity of 1,400,000 kg of potatoes;
4 to 5 months to unload product.
(DOE 2010b) 10 4 sm, 2 med, 2 lrg
(Goetzler et al.
2009)
Meat, Seafood, Produce,
Dairy, Deli, Beer/Juice,
Flowers

286
Product Loading for Walk-in Coolers (4 of 8)
Product Type Product Pull-
Down Temp.
Difference
(°F)
Product Loading Daily Loading Ratio
(lbs of product per ft3
of refrigerated space)
(Heatcraft
2008)
Heatcraft Table 7; Banana
ripening room: Bananas
shipped in fiberboard cartons
(10 x 16 x 22") holding 42 lb
net (47 lb gross) with 864
boxes in a carload lot.
6,200 - 8,000 lbs/day (500 - 3,000
ft3); 8,000 - 11,000 lbs/day (3000 -
4,600 ft3); 11,000 to 17,000 lbs/day
(4,600 - 8,100 ft3); 17,000 - 26,000
lbs/day (8,100 - 12,800 ft3); 26,000 -
33,000 lbs/day (12,800 - 16,000 ft3);
33,000 - 40,000 lbs/day (16,000 -
20,000 ft3); 40,000 - 56,000 lbs/day
(20,000 - 28,000 ft3); 56,000 - 66,000
lbs/day (28,000 - 40,000 ft3); 66,000 -
110,000 lbs/day (40,000 - 60,000 ft3);
110,000 - 150,000 lbs/day (60,000 -
80,000 ft3); Heatcraft Table 9 - Heat
Loads of Keg and Bottled Beer;
Heatcraft Table 10 - Carcass Heat
Loads; Product Loading Density from
13 to 57 lb/ft3 (Heatcraft Tab le 7);
Banana ripening room: 1644 lb
turnover per week; 1°F/hr pull down
rate; Pull down in 24 hours, average
load; Heatcraft Table A - Product
Cooling Loads for Walk-In Coolers
4.06 lb/day-ft3 (500 -
3,000 ft3); 2.5 (3000 -
4,600 ft3); 2.20 (4,600
- 8,100 ft3); 2.06
(8,100 - 12,800 ft3);
2.05 (12,800 - 16,000
ft3); 2.02 (16,000 -
20,000 ft3); 2.00
(20,000 - 28,000 ft3);
1.79 (28,000 - 40,000
ft3); 1.76 (40,000 -
60,000 ft3); 1.86
(60,000 - 80,000 ft3);
Heatcraft Table 9 -
Heat Loads of Keg
and Bottled Beer;
Heatcraft Table 10 -
Carcass Heat Loads
(Henderson
and Khattar
1999)
Store A: Deli, floral, dairy, meat
prep; Store B: Dairy, produce, meat,
bakery, deli, seafood
287
Product Loading for Walk-in Coolers (5 of 8)
Product Type Product Pull-
Down Temp.
Difference
(°F)
Product Loading Daily Loading Ratio
(lbs of product per ft3
of refrigerated space)
(Krack 1977) Fruit, beef carcass, beer 10 (milk); 0
to 68 (Krack
Table 42); 20
(beer); 66
(beef
carcass); 44
(beer)
10 to 15 day storage period; 20% of
load (#1), 37.6% of load (300 gallons
of milk / day) with 10 hr pull-down
(milk); 20% daily turn of 900 cases
(27.4% of load); 1ºF / hr typical; 20%
daily inventory turn with 20°F
product temperature drop (beer
cooler); 15ºF, 24 hr pull-down (beef
carcass); 24 hr pull-down (beer
storage)
Average product
loads: 1.2 to 2.7
Btu/hr-ft3 (30,000 to
250 ft3, 1.7 Btu/hr-ft
3
average); Krack Table
42 (specific product
loads)
(Love and
Cleland
2007)
600 - 12 fl oz soda cans 58.5 22.7 to 24.9 hr pull-down time
according to pull-down tests

288
Product Loading for Walk-in Coolers (6 of 8)
Product Type Product Pull-
Down Temp.
Difference
(°F)
Product Loading Daily Loading Ratio
(lbs of product per ft3
of refrigerated space)
(Magoo 2003) Milk or cheese Cooler: 60% of cooler floor space
covered with pallets of stored
products. Distribution type where
products are constantly
shipped/received. Assumed to arrive
at storage temperature. 2600 lb/pallet,
35.25" x 42" pallet dimensions.
Industry: Products stored near
freezing: milk, dairy products like
cheese and butter, eggs and egg
products. Vegetables and fruits are
typically stored at temperatures well
above freezing for short periods of
time. There is a constant turnover of
stored products.
(Manske
1999)
Banana and tomato rooms: 10 - 15%
per day; Cooler: Sensible: 0 Btu/h
(assumes product arrives at storage
temperature), Latent: 1201; Dock:
None
(Navy 1986) Meat, Dairy, Perishable
food, Film, Fruits,
Vegetables, Medical
18 to 24 hrs pull-down time
(Patel et al.
1993)
0 Minimal; Typically fresh and frozen
products are received at storage temp.

289
Product Loading for Walk-in Coolers (7 of 8)
Product Type Product Pull-
Down Temp.
Difference
(°F)
Product Loading Daily Loading Ratio
(lbs of product per ft3
of refrigerated space)
(PG&E 2007) Fresh fruit commodities such
as grapes
(Roy 2010) Milk product 44092 lb. Sizing doesn't account for
transient states or thermal mass.
(SCE 2008) 70% of capacity; 21,840 Btu/hr (sm),
43,680 Btu/hr, 86,520 Btu/hr,
195,720 Btu/hr (lrg)
(SCE 2009) Cheese and other dairy
products (warehouse cooler)
(Stoecker
1998)
Beef and pork carcasses 58, 65, 40 Beef and pork carcass chilling
facilities remove 58 to 65°F in one
night; 4 pound birds are cooled 40°F
in 4 hours or less
(Stoeckle et al.
2002)
0 Loading dock where product is
assumed to arrive at storage
temperature
(Thompson
and
Spinoglio
1996)
Fruits, vegetables, cut
flowers
3 ft aisle with 12" to 18" from top of
product to ceiling; 7 day storage;
50% turnover every day (example
room)
290
Product Loading for Walk-in Coolers (8 of 8)
Product Type Product Pull-
Down Temp.
Difference
(°F)
Product Loading Daily Loading Ratio
(lbs of product per ft3
of refrigerated space)
(USDA 2010) Apples/pear storage are
stored exclusively in 14.37%
of refrigerated warehouse
facilities
Usable Percentages: 57.59 Min State
Ave, 91.85 Max State Ave, 82.29
Median State Ave, 81.70 Average
General, 84.20 Average
Apples/Pears, 82.06 Average Overall;
Apples/Pears: 0.43 Bushels/ft3 Usable
Storage, 0.36 Bushels/ft3 Gross
Storage
(Wade 1984) 27 An apple exposed to free airstream at
32°F is cooled from 68 to 41°F in 2
hrs. 48 hrs to reduce center stack
temperature of 1 ft wide packaged
apples. Cooling times of 48 to 79 hrs
observed in the center of a pallet load
of unpackaged fruit in boxes cooling
by conduction only. Small stacks of
open bulk bins cool in 16 to 28 hrs.
Open stacks of lidded bins with 1 to
8% ventilation cool in 66 to 99 hrs.
(Walker and
Baxter
2002)
Floral; Meat; Produce;
Dairy; Deli; Raw; Fish; Meat
Prep; Produce; Meat; Bakery
(Westphalen
et al. 1996)
Meats, seafood, dairy,
produce, beer/juice, flowers

291
Table 115. Product Sensible and Latent Thermal Properties for Walk-in Coolers
Product Sensible and Latent Thermal Properties for Walk-in Coolers (1 of 4)
Product
Specific
heat Above
Freezing
(Btu/lb-F)
Product
Moisture
Loss during
storage (%)
Product Heat
of Respiration
at 32°F
(Btu/lb/day)
Product Heat
of Respiration
at 41°F
(Btu/lb/day)
Product Heat
of Respiration
at 50°F
(Btu/lb/day)
Product Heat
of Respiration
at 59°F
(Btu/lb/day)
Product Heat
of Respiration
at 68°F
(Btu/lb/day)
Product Heat
of
Transpiration
Range 0.50 to 0.91 1 0.25 to 8.32 0.56 to 10.7 0.86 to 2.34 1.02 to 10.2 1.27 to 38.4
Average 0.80 1 1.26 1.68 1.25 3.22 7.35
Proposed 0.9
(AHRI 2009a) 0.9
(Adre and
Hellickson
1989)
Apples,
average of
many
cultivars:
0.252 - 0.451;
Pears: 0.288-
0.396
Apples,
average of
many
cultivars:
0.558-0.793;
Pears, late
ripening:
0.648-1.531;
Pears, early
ripening:
0.811-1.712
Pears, late
ripening:
0.865-2.2072;
Pears, early
ripening:
1.081-2.342
Apples,
average of
many
cultivars:
1.495-3.405;
Pears, late
ripening:
3.062-4.684;
Pears, early
ripening:
3.783-5.944
Apples,
average of
many
cultivars:
1.856-3.855;
Pears, late
ripening:
3.603-8.106;
Pears, early
ripening:
4.323-9.907
(Becker and
Fricke
1996a)
Coefficients
given
Coefficients
given
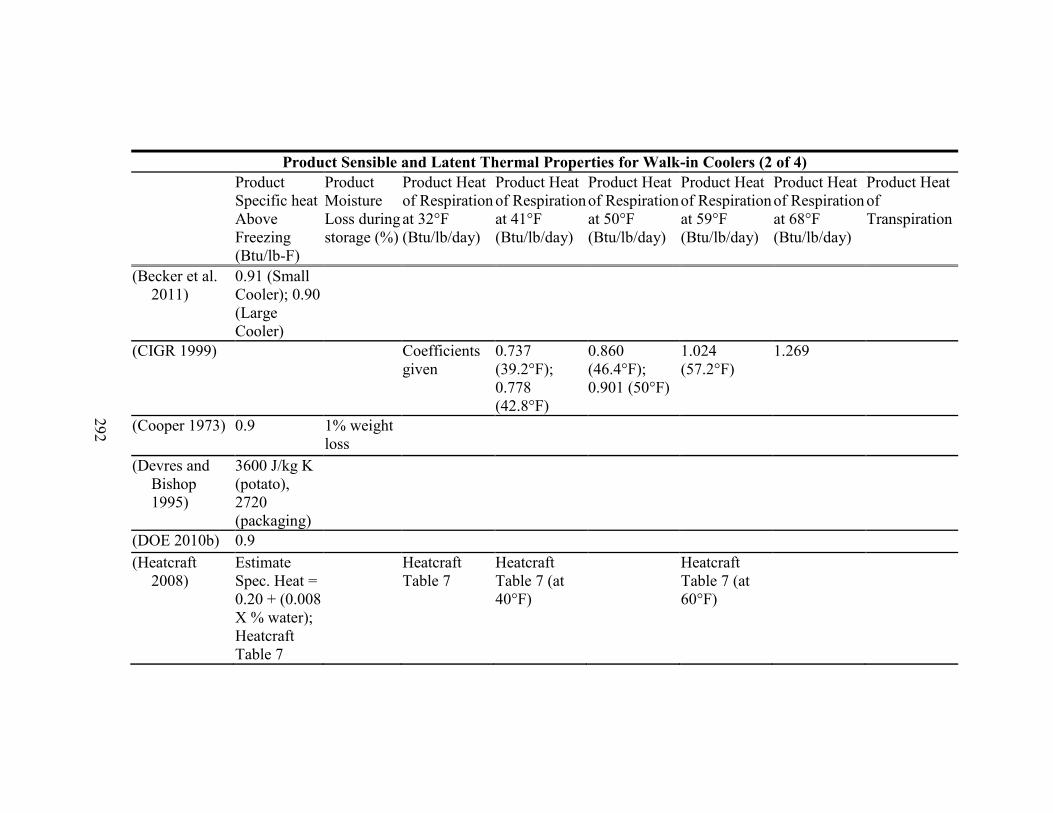
292
Product Sensible and Latent Thermal Properties for Walk-in Coolers (2 of 4)
Product
Specific heat
Above
Freezing
(Btu/lb-F)
Product
Moisture
Loss during
storage (%)
Product Heat
of Respiration
at 32°F
(Btu/lb/day)
Product Heat
of Respiration
at 41°F
(Btu/lb/day)
Product Heat
of Respiration
at 50°F
(Btu/lb/day)
Product Heat
of Respiration
at 59°F
(Btu/lb/day)
Product Heat
of Respiration
at 68°F
(Btu/lb/day)
Product Heat
of
Transpiration
(Becker et al.
2011)
0.91 (Small
Cooler); 0.90
(Large
Cooler)
(CIGR 1999) Coefficients
given
0.737
(39.2°F);
0.778
(42.8°F)
0.860
(46.4°F);
0.901 (50°F)
1.024
(57.2°F)
1.269
(Cooper 1973) 0.9 1% weight
loss
(Devres and
Bishop
1995)
3600 J/kg K
(potato),
2720
(packaging)
(DOE 2010b) 0.9
(Heatcraft
2008)
Estimate
Spec. Heat =
0.20 + (0.008
X % water);
Heatcraft
Table 7
Heatcraft
Table 7
Heatcraft
Table 7 (at
40°F)
Heatcraft
Table 7 (at
60°F)
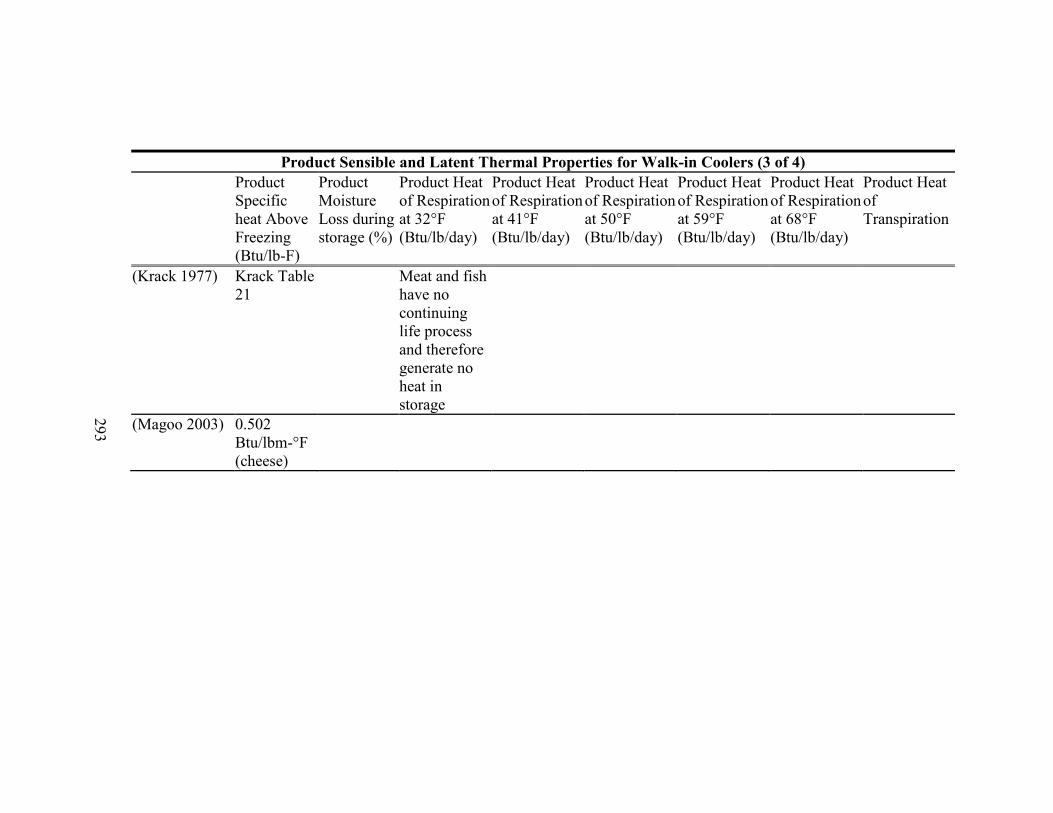
293
Product Sensible and Latent Thermal Properties for Walk-in Coolers (3 of 4)
Product
Specific
heat Above
Freezing
(Btu/lb-F)
Product
Moisture
Loss during
storage (%)
Product Heat
of Respiration
at 32°F
(Btu/lb/day)
Product Heat
of Respiration
at 41°F
(Btu/lb/day)
Product Heat
of Respiration
at 50°F
(Btu/lb/day)
Product Heat
of Respiration
at 59°F
(Btu/lb/day)
Product Heat
of Respiration
at 68°F
(Btu/lb/day)
Product Heat
of
Transpiration
(Krack 1977) Krack Table
21
Meat and fish
have no
continuing
life process
and therefore
generate no
heat in
storage
(Magoo 2003) 0.502
Btu/lbm-°F
(cheese)
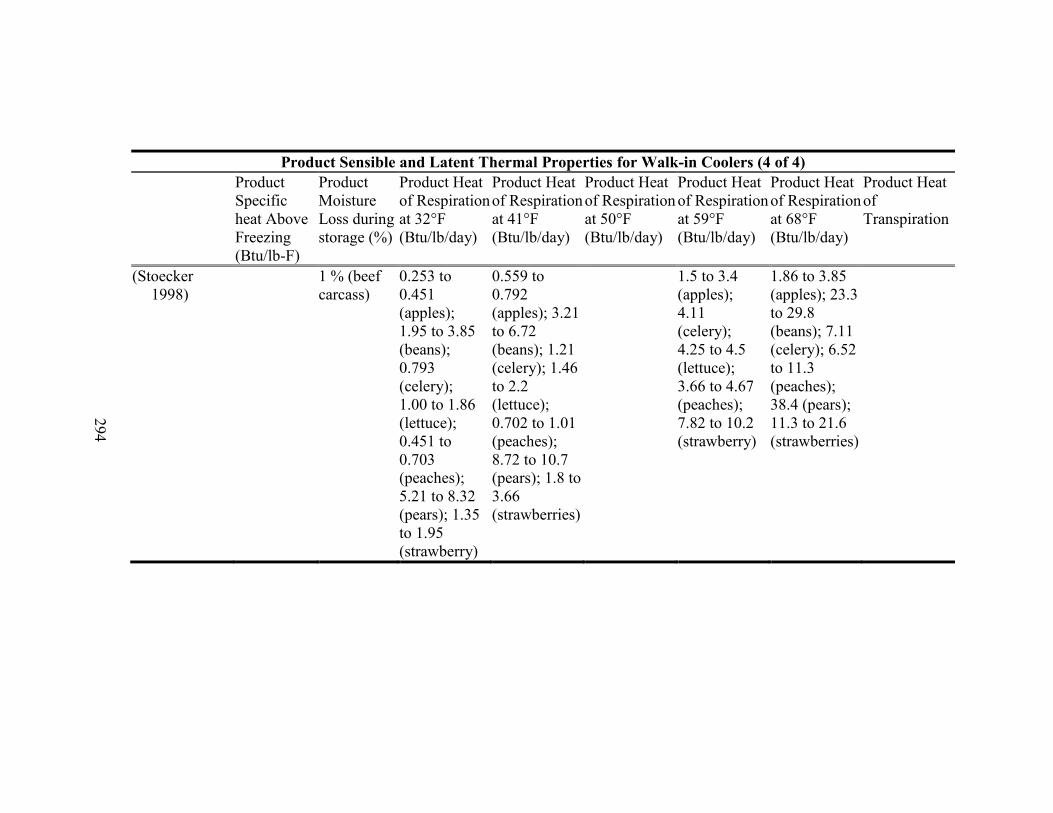
294
Product Sensible and Latent Thermal Properties for Walk-in Coolers (4 of 4)
Product
Specific
heat Above
Freezing
(Btu/lb-F)
Product
Moisture
Loss during
storage (%)
Product Heat
of Respiration
at 32°F
(Btu/lb/day)
Product Heat
of Respiration
at 41°F
(Btu/lb/day)
Product Heat
of Respiration
at 50°F
(Btu/lb/day)
Product Heat
of Respiration
at 59°F
(Btu/lb/day)
Product Heat
of Respiration
at 68°F
(Btu/lb/day)
Product Heat
of
Transpiration
(Stoecker
1998)
1 % (beef
carcass)
0.253 to
0.451
(apples);
1.95 to 3.85
(beans);
0.793
(celery);
1.00 to 1.86
(lettuce);
0.451 to
0.703
(peaches);
5.21 to 8.32
(pears); 1.35
to 1.95
(strawberry)
0.559 to
0.792
(apples); 3.21
to 6.72
(beans); 1.21
(celery); 1.46
to 2.2
(lettuce);
0.702 to 1.01
(peaches);
8.72 to 10.7
(pears); 1.8 to
3.66
(strawberries)
1.5 to 3.4
(apples);
4.11
(celery);
4.25 to 4.5
(lettuce);
3.66 to 4.67
(peaches);
7.82 to 10.2
(strawberry)
1.86 to 3.85
(apples); 23.3
to 29.8
(beans); 7.11
(celery); 6.52
to 11.3
(peaches);
38.4 (pears);
11.3 to 21.6
(strawberries)

295
Lighting and Occupancy
Lighting and occupancy loads are considered in the same section of this report, as
their schedules typically coincide with each other. Through analyzing the literature, load
details related to lighting and occupancy were found in the following works, (Adre and
Hellickson 1989), (Arias 2005), (Becker et al. 2011), (Blackmore 2012), (Cooper 1973),
(Devres and Bishop 1995), (DOE 2010b), (DOE 2010c), (Goetzler et al. 2009), (Heatcraft
2008), (Kassa et al. 2004), (Krack 1977), (Magoo 2003), (Manske 1999), (PG&E 2007),
(Roy 2010), (SCE 2008), (Stoecker 1998), (Stoeckle 2000), (Sujau et al. 2006), and
(Westphalen et al. 1996).
Lighting loads found in the literature ranged from 0.08 to 9.83 W/ft2,with an
average value of 1.50 W/ft2. The AHRI Load Spreadsheet (AHRI 2009a) used a lighting
power usage of 1.56 W/ft2 for the small cooler and 1 W/ft
2 for the large cooler. Ninety
eight percent of the lighting load is assumed to affect the space of the small cooler whereas
only 85% is assumed to affect the space of the large cooler due to the use of fluorescent
lighting. The modified model load uses a lighting load of 1 W/ft2, but unlike AHRI, all of
the lighting energy usage is a load on the space.
The quantity of people in the space that AHRI assumed seems appropriate at 1
person for the small cooler and 2 for the large cooler. The percentage of time that people
occupy the space ranged in the literature from 3 to 100% of the time, with an average value
of 34.7% of the time. Lights were on for a period of 4 to 100% of the time, with an average
value of 54.7%. AHRI (AHRI 2009a) assumed that the lights were on 3.75 and 12.5% of
the time for the small and large cooler, respectively. People are assumed to occupy the
space for 5.83 and 12.5% of the time for the small and large cooler, respectively. The
296
proposed model load will use occupancy and lighting percentages of 20 and 30%,
respectively. A value ranging from 30 to 50% seems more acceptable from the collected
data, but hesitation is made to use this, as unfortunately there was some ambiguity in some
of the literature as to whether the occupancy percentage referred to a percentage of the day
or a percentage of the working day.
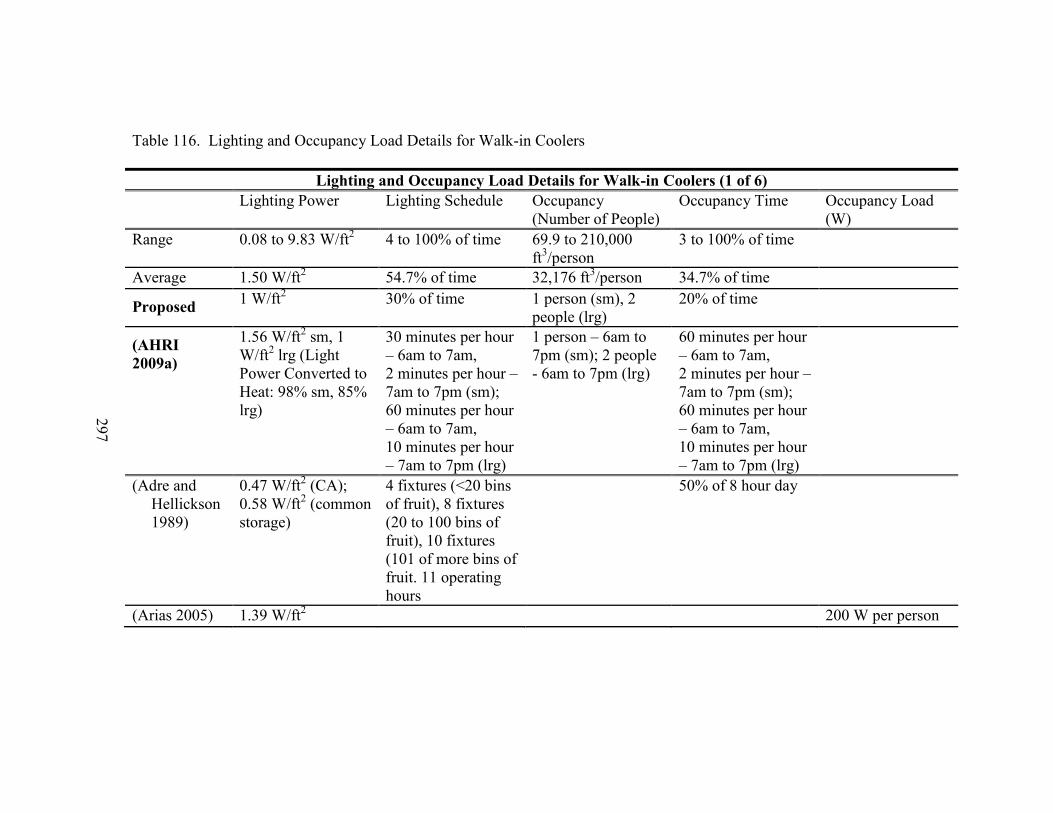
297
Table 116. Lighting and Occupancy Load Details for Walk-in Coolers
Lighting and Occupancy Load Details for Walk-in Coolers (1 of 6)
Lighting Power Lighting Schedule Occupancy
(Number of People)
Occupancy Time Occupancy Load
(W)
Range 0.08 to 9.83 W/ft2 4 to 100% of time 69.9 to 210,000
ft3/person
3 to 100% of time
Average 1.50 W/ft2 54.7% of time 32,176 ft
3/person 34.7% of time
Proposed 1 W/ft
2 30% of time 1 person (sm), 2
people (lrg)
20% of time
(AHRI
2009a)
1.56 W/ft2 sm, 1
W/ft2 lrg (Light
Power Converted to
Heat: 98% sm, 85%
lrg)
30 minutes per hour
– 6am to 7am,
2 minutes per hour –
7am to 7pm (sm);
60 minutes per hour
– 6am to 7am,
10 minutes per hour
– 7am to 7pm (lrg)
1 person – 6am to
7pm (sm); 2 people
- 6am to 7pm (lrg)
60 minutes per hour
– 6am to 7am,
2 minutes per hour –
7am to 7pm (sm);
60 minutes per hour
– 6am to 7am,
10 minutes per hour
– 7am to 7pm (lrg)
(Adre and
Hellickson
1989)
0.47 W/ft2 (CA);
0.58 W/ft2 (common
storage)
4 fixtures (<20 bins
of fruit), 8 fixtures
(20 to 100 bins of
fruit), 10 fixtures
(101 of more bins of
fruit. 11 operating
hours
50% of 8 hour day
(Arias 2005) 1.39 W/ft2 200 W per person

298
Lighting and Occupancy Load Details for Walk-in Coolers (2 of 6)
Lighting Power Lighting Schedule Occupancy
(Number of People)
Occupancy Time Occupancy Load
(W)
(Becker et al.
2011)
1 W/ft2
(Prototypical, Small
and Large Cooler)
6 min/hr 8am to
6pm (Small
Cooler); 60 min/hr
6am to 7am, 10
min/hr 7am to 7pm
(Large Cooler)
1 person
(Prototypical, Small
Cooler); 2 people
(Large Cooler)
4.8 min / hr 8am to
6pm Monday to
Saturday, 2.4 min /
hr 10am to 6pm
Sunday
(Prototypical); 6
min/hr 8am to 6pm
(Small Cooler); 60
min / hr 6am to
7am, 10 min / hr
7am to 7pm (Large
Cooler)
80.6 W/person
latent, 80.6
W/person sensible
(Small Freezer);
410.3 W/person
(Large Freezer)
(Blackmore
2012)
1 to 1.5 W/ft2
(normal storage), 2.5
to 3 W/ft2
(docks/workrooms)
4 person / 100,000
ft3
(Cooper
1973)
0.61 W/ft2, 0.22
W/ft2
(Devres and
Bishop
1995)
150 seconds per
entry, 56 entries per
day
9.7% of the time
(DOE 2010b) 0.31 W/ft2 sm; 0.08
W/ft2 med; 0.09
W/ft2 lrg
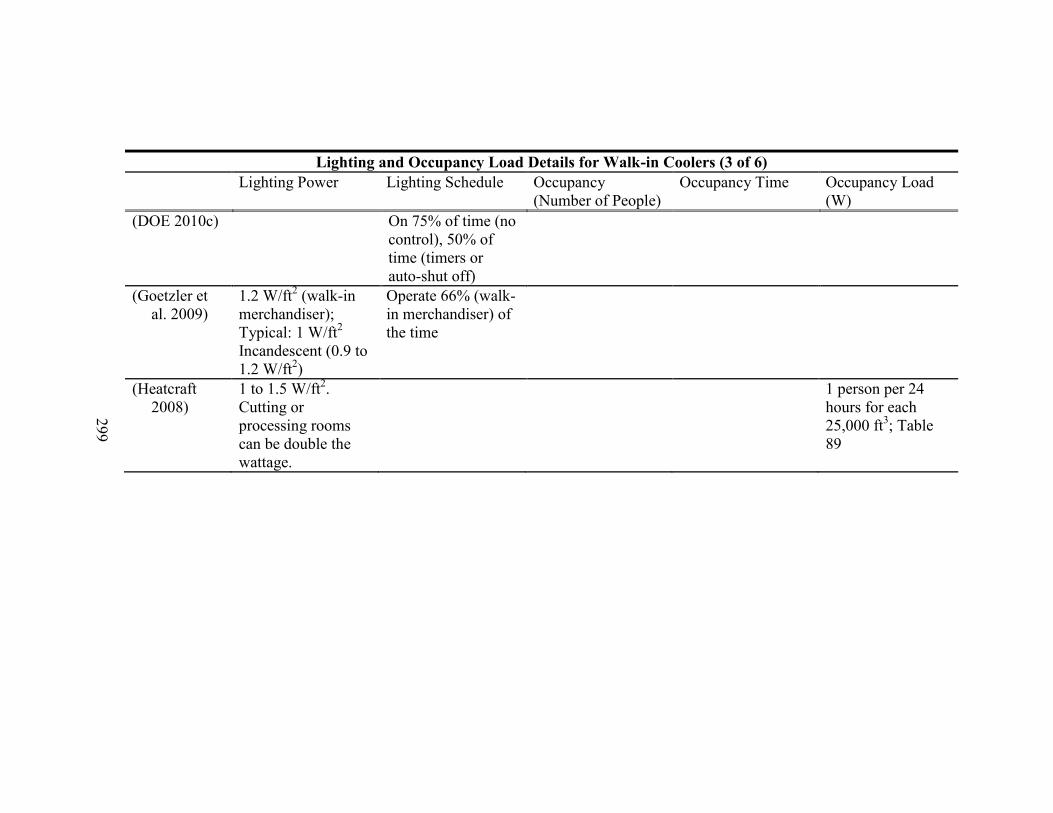
299
Lighting and Occupancy Load Details for Walk-in Coolers (3 of 6)
Lighting Power Lighting Schedule Occupancy
(Number of People)
Occupancy Time Occupancy Load
(W)
(DOE 2010c) On 75% of time (no
control), 50% of
time (timers or
auto-shut off)
(Goetzler et
al. 2009)
1.2 W/ft2 (walk-in
merchandiser);
Typical: 1 W/ft2
Incandescent (0.9 to
1.2 W/ft2)
Operate 66% (walk-
in merchandiser) of
the time
(Heatcraft
2008)
1 to 1.5 W/ft2.
Cutting or
processing rooms
can be double the
wattage.
1 person per 24
hours for each
25,000 ft3; Table
89
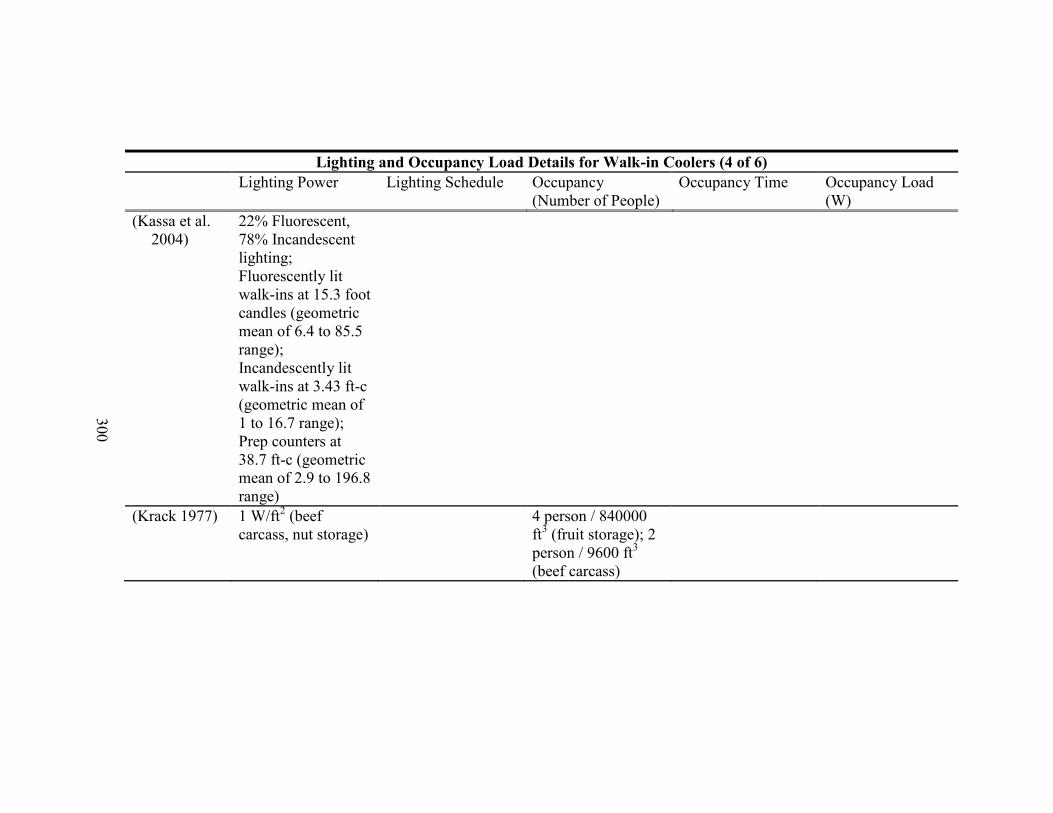
300
Lighting and Occupancy Load Details for Walk-in Coolers (4 of 6)
Lighting Power Lighting Schedule Occupancy
(Number of People)
Occupancy Time Occupancy Load
(W)
(Kassa et al.
2004)
22% Fluorescent,
78% Incandescent
lighting;
Fluorescently lit
walk-ins at 15.3 foot
candles (geometric
mean of 6.4 to 85.5
range);
Incandescently lit
walk-ins at 3.43 ft-c
(geometric mean of
1 to 16.7 range);
Prep counters at
38.7 ft-c (geometric
mean of 2.9 to 196.8
range)
(Krack 1977) 1 W/ft2 (beef
carcass, nut storage)
4 person / 840000
ft3 (fruit storage); 2
person / 9600 ft3
(beef carcass)
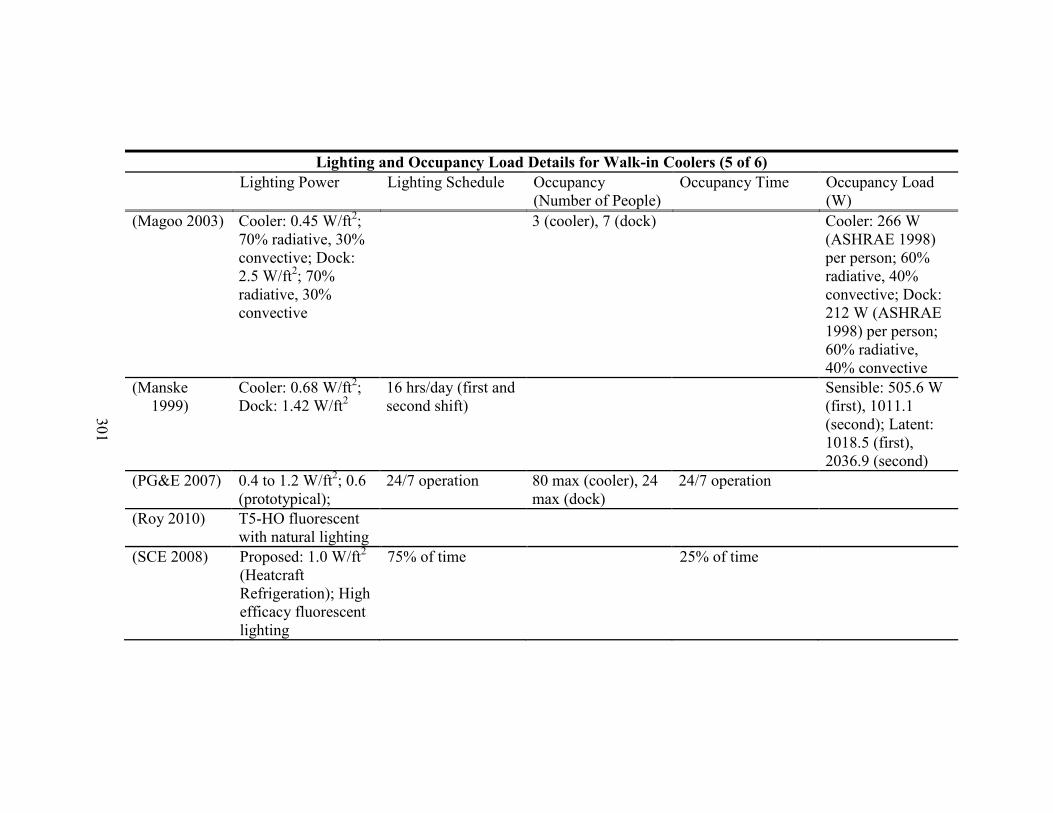
301
Lighting and Occupancy Load Details for Walk-in Coolers (5 of 6)
Lighting Power Lighting Schedule Occupancy
(Number of People)
Occupancy Time Occupancy Load
(W)
(Magoo 2003) Cooler: 0.45 W/ft2;
70% radiative, 30%
convective; Dock:
2.5 W/ft2; 70%
radiative, 30%
convective
3 (cooler), 7 (dock) Cooler: 266 W
(ASHRAE 1998)
per person; 60%
radiative, 40%
convective; Dock:
212 W (ASHRAE
1998) per person;
60% radiative,
40% convective
(Manske
1999)
Cooler: 0.68 W/ft2;
Dock: 1.42 W/ft2
16 hrs/day (first and
second shift)
Sensible: 505.6 W
(first), 1011.1
(second); Latent:
1018.5 (first),
2036.9 (second)
(PG&E 2007) 0.4 to 1.2 W/ft2; 0.6
(prototypical);
24/7 operation 80 max (cooler), 24
max (dock)
24/7 operation
(Roy 2010) T5-HO fluorescent
with natural lighting
(SCE 2008) Proposed: 1.0 W/ft2
(Heatcraft
Refrigeration); High
efficacy fluorescent
lighting
75% of time 25% of time

302
Lighting and Occupancy Load Details for Walk-in Coolers (6 of 6)
Lighting Power Lighting Schedule Occupancy
(Number of People)
Occupancy Time Occupancy Load
(W)
(Stoecker
1998)
.48 W/ft2 for
storage, 1.5 W/ft2
for processing areas
210 W/person at
50°F, 270
W/person at 32°F
(Stoeckle
2000)
2.5 W/ft2 (loading
dock)
(Sujau et al.
2006)
2.88 W/ft2
(Westphalen
et al. 1996)
1 W/ft2
(incandescent box
lighting). 9.83 W/ft
display lighting (4 -
60inch T12 50W
fluorescent lamps
with 2 per ballast)
On when occupied
by employees. 50%
of time. Display
lighting on 66% of
the time.
1 50% of time

303
Miscellaneous Loads
Miscellaneous loads include all other heat loads seen by walk-in coolers. The
primary types of miscellaneous loads are summarized by this study and include vehicle
energy usage, evaporator fan power, and door heater loads.
Authors from which information was gathered include (Adre and Hellickson 1989),
(Becker et al. 2011), (Blackmore 2012), (DOE 2010b), (DOE 2010c), (Goetzler et al.
2009), (Heatcraft 2008), (Krack 1977), (Magoo 2003), (Manske 1999), (PG&E 2007),
(Roy 2010), (SCE 2008), (SCE 2009), (Sujau et al. 2006), and (Westphalen et al. 1996).
Larger coolers typically have at least one battery powered forklift in use but smaller
coolers do not. This is consistent with the ARHI Load Spreadsheet (AHRI 2009a). The
amount of time that forklifts operate and the quantity of forklifts in the space were
consolidated for this analysis by looking at power usage on a space square footage basis.
Literature values ranged from 0.08 to 1.12 W-hr/ft3-day, with an average value of 0.59 W-
hr/ft3-day. AHRI used a value of 0.75 W-hr/ft3-day for the vehicle power usage for the
large cooler whereas this work proposes a value of 1.00 W-hr/ft3-day. The small cooler
will continue to be viewed as not utilizing forklifts as done in the AHRI initial model load.
Most walk-ins utilize door heaters to avoid frosting up of passage ways or reach-in
doors. In the examples found in the literature, 8 to 15 W/ft of heating is used around the
perimeter of the doorways, with an average power usage of 11.5 W/ft. AHRI did not utilize
passage door heating, but this work proposes 8 W/ft.

304
Table 117. Miscellaneous Load Details for Walk-in Coolers
Miscellaneous Load Details for Walk-in Coolers (1 of 3)
Number of
Vehicles
Vehicle Energy Usage Evaporator Fan
Operation
Passage Door
Heater Power
Miscellaneous Heat
Load
Range 0.08 to 1.12 W-hr/ft3-day 8 to 15 W/ft 300 to 20,000 W
Average 0.59 W-hr/ft3-day 11.5 W/ft 5895 W
Proposed 1.00 W-hr/ft
3-day (lrg) 8 W/ft
(AHRI 2009a) 0 sm; 1 lrg 0 sm; 37.3 kW at 60 minutes
per hour – 6am to 7am (lrg)
(Adre and
Hellickson
1989)
2 26 kW per forklift @ 60%
load factor; 1/2 of the 8 hour
day (1/2 of time spent
outside the refrigerated
space)
(Becker et al.
2011)
1 (Large Cooler) 0.746 W-hr/ft3-day (Large
Cooler)
always on
(Blackmore 2012) 4.48 kW/100,000 ft3; 2.98 to
3.73 kW per forklift
(DOE 2010b) 8 W/ft; 24
hr/day
(DOE 2010c) Always on
typically

305
Miscellaneous Load Details for Walk-in Coolers (2 of 3)
Number of
Vehicles
Vehicle Energy Usage Evaporator
Fan Operation
Passage Door
Heater Power
Miscellaneous Heat
Load
(Goetzler et al.
2009)
300 W
Always on;
Passage door
heaters
typically
used.
(Heatcraft 2008) Generally only
battery operated
lift trucks used; 1
motor
horsepower for
each 16,000 ft3
of storage.
2.3 to 4.4 kW over the period
of operation; Heatcraft Table
14 - Heat gain due to
operation of battery operated
lift truck
Heatcraft Table 11 -
Heat Equivalency of
Motors; Banana
ripening room: 6 to 20
kW per half carload to
bring load up to
temperature before
ripening process is
initiated
(Krack 1977) 1 hp / 26250 ft3
storage (fruit
storage)
Forklifts may be estimated at
3.0 to 3.7 kW; 40 min/hr for
8 hours operating time
(Magoo 2003) Cooler: 54.3 kW total; 70%
radiative, 30% convective;
Dock: 9.6 kW total; 70%
radiative, 30% convective
(Manske 1999) Cooler: 17.3 kW (first); 34.6
(second); Dock: 8.1 kW
(first); 16.3 (second)
cycle with
load

306
Miscellaneous Load Details for Walk-in Coolers (3 of 3)
Number of
Vehicles
Vehicle Energy Usage Evaporator
Fan Operation
Passage Door
Heater Power
Miscellaneous Heat
Load
(PG&E 2007) 0.7 W/ft2 (forklifts and
miscellaneous equipment)
(Roy 2010) 92% (80% typical) battery
charger efficiency
(SCE 2008) Anti-sweat heaters
(SCE 2009) Yes (warehouse)
(Sujau et al. 2006) Varies: 3100 W
Sensible, 230 Latent
to 5100 Sensible, 340
Latent
(Westphalen et al.
1996)
Always on Anti-sweat heater
typically not used; 300
W total for
merchandising doors,
100% on
(prototypical)
307
Defrost
The AHRI 1250/1251 Standard (AHRI 2009b; AHRI 2009c) assumes no defrost is
used on walk-in coolers. This is not always the case, however, with fifteen authors giving
examples of coolers utilizing defrosting systems. These works include (Adre and
Hellickson 1989), (Becker et al. 2011), (Cooper 1973), (Devres and Bishop 1995),
(Goetzler et al. 2009), (Heatcraft 2008), (Henderson and Khattar 1999), (Krack 1977),
(Manske 1999),(Nelson 2011), (Stoecker 1998), (Sujau et al. 2006), (Walker et al. 1990),
(Walker 1992), (Walker 2001), and (Westphalen et al. 1996).
Available literature stated that both off-cycle and electric defrost are typical for
coolers operating with an evaporator temperature below freezing. From analyzing the data
in Table 118, electric defrost appears to be most often used for high humidity applications
or coolers that operate very close to freezing, such as a meat cooler. Defrost power ranged
from 19.5 to 29.6 W/ft2, with an average value of 25.7 W/ft
2. Adding refrigeration systems
that do not use defrost or use an off-cycle defrost to this analysis results in an average
defrost power of 11.04 W/ft2. The analysis of the data on defrost duration and frequency,
much like the analysis of the defrost power usage, only includes data about refrigeration
systems that use defrost. For the calculation of the annual walk-in energy factor (AWEF),
defrost will occur twice a day for 1 hour periods.

308
Table 118. Defrost Details for Walk-in Coolers
Defrost Details for Walk-in Coolers (1 of 6)
Defrost Type Defrost Power
(W/ft2)
Defrost Heat Space
Load (Btu/h)
Defrost
Efficiency
Defrost Schedule
Range 19.5 to 29.6 0.8 to 8 times per day; 0.5 to 4 hr/day
Average 25.7 3.0 times per day; 1.3 hr/day
Proposed 2 times per day; 2 hr/day
(AHRI
2009a)
(Adre and
Hellickson
1989)
1 to 8 per day; 10 minutes long
(Becker et al.
2011)
1.75 cycles / day at 41.6 min / cycle
(Tedeschi Cooler), 1.25 cycles / day at
24.3 min / cycle (Chili's Beer Cooler),
4.25 cycles / day at 34.6 min / cycle
(Chili's Food Cooler)
(Cooper 1973) No defrost
needed for
rooms above
35.6°F
309
Defrost Details for Walk-in Coolers (2 of 6)
Defrost Type Defrost
Power (W/ft2)
Defrost Heat Space
Load (Btu/h)
Defrost
Efficiency
Defrost Schedule
(Devres and
Bishop
1995)
Assume 25%
of the
condensed
water turns
into frost on
the coil
50%
(Goetzler et
al. 2009)
25 W/ft2
(Heatcraft
2008)
Off-cycle
(Henderson
and
Khattar
1999)
Off-cycle
(typical), Hot
gas (meat)
(Krack 1977) 4 times per day; 15 to 20 min / cycle
(beef carcass)
310
Defrost Details for Walk-in Coolers (3 of 6)
Defrost Type Defrost
Power (W/ft2)
Defrost Heat Space
Load (Btu/h)
Defrost
Efficiency
Defrost Schedule
(Manske
1999)
Hot gas +
electric
(cooler), Air
(loading
dock)
Cooler: 180 MBH
June to Sept, 144
MBH otherwise
(hot gas); Cooler:
60 MBH June to
Sept, 48 MBH
otherwise (electric,
cooler); Dock: 120
MBH June to Sept,
60 MBH otherwise
(air)
50%
(ASHRAE
1994)
Hot gas defrosted two to three times a
day on a time scheduled basis.
Evaporator defrost cycles are
staggered.

311
Defrost Details for Walk-in Coolers (4 of 6)
Defrost
Type
Defrost
Power (W/ft2)
Defrost Heat Space
Load (Btu/h)
Defrost
Efficiency
Defrost Schedule
(Nelson 2011) Types
include:
water,
electric, hot
gas with hot
gas being the
preferred
method
15 - 20% to melt ice,
60% lost to room via
convection/radiation,
20% required to heat
and cool the metal of
the evaporator, and
5% lost due to hot
gas bypassing the
defrost regulator at
the end of the
defrost (Cole 1989).
32F room: 46%
room loss, 32% melt
frost, 18% heat and
cool metal, 4%
warm melt
max
theoretical
defrost
efficiency:
60 to 70%
(Cole 1989);
Examples:
32% (32ºF
room
typical)
Typical: 30 minutes, Optimized: 8 to
10 minutes
(Stoecker
1998)
Air or electric
(most
common)
(Sujau et al.
2006)
4.6 kW 6, 8, 12, 18, 24, and 30 hr intervals

312
Defrost Details for Walk-in Coolers (5 of 6)
Defrost
Type
Defrost
Power (W/ft2)
Defrost Heat Space
Load (Btu/h)
Defrost
Efficiency
Defrost Schedule
(Walker et
al. 1990)
Off-
cycle,
electric
Conventional Medium Temp Off Cycle: 55 min at
00:00, 12:00 (#3); 60 min at 00:00, 12:00 (#24); 40
min at 00:00, 06:00, 12:00, 18:00 (#25); 40 min at
00:30, 06:30, 12:30, 18:30 (#9); 40 min at 04:00,
13:30, 20:30 (#10); 40 min at 04:30, 12:30, 19:30
(#11); 40 min at 01:30, 07:30, 13:30, 19:30 (#12);
40 min at 02:30, 08:30, 14:30, 20:30 (#13); 60 min
at 01:00, 07:00, 13:00, 19:00 (#15); 36 min at
02:00, 10:00, 17:00 (#20A and B). Meat satellite
Off Cycle: 40 min at 02:00, 08:00, 14:00, 20:00
(#2, #27A and B). High Temp Off Cycle: 54 min at
05:00, 17:00 (#17); 50 min at 01:00 (#26); 50 min
at 00:00 (#23); two systems have no defrost.
Multiplex Medium Temp Off Cycle: 52 min at
05:30, 11:30, 17:30, 23:30 (#B3); 30 min at 02:30,
14:30 (#B24); 52 min at 03:30, 09:30, 15:30, 21:30
(#B25); 52 min at 04:30, 10:30, 16:30, 22:30
(#B9); 50 min at 01:30, 09:30, 18:30 (#B10); 52
min at 02:30, 10:30, 17:30 (#B11); 52 min at 05:30,
11:30, 17:30, 23:30 (#B12); 48 min at 00:30, 06:30,
12:30 (#B13); 30 min at 10:30, 22:30 (#B15); 36
min at 07:30, 14:30, 23:30 (#B20A and B). High
Temp Off Cycle: 48 min at 01:00, 07:00, 13:00,
19:00 (#B2, 27A and B); 54 min at 03:30 (#B17);
50 min at 00:00 (#B26); 50 min at 23:00 (#B23);
two systems have no defrost

313
Defrost Details for Walk-in Coolers (6 of 6)
Defrost Type Defrost
Power (W/ft2)
Defrost Heat Space
Load (Btu/h)
Defrost
Efficiency
Defrost Schedule
(Walker 1992) Off-cycle
commonly;
time
terminated
(Walker 2001) Off-cycle
(multiplex and
distributed),
warm glycol
(secondary
loop)
(Westphalen
et al. 1996)
Electric (meat
walk-in)
19.5 W/ft2
(meat); 19.5
to 29 W/ft2
(typical)
4.2% duty cycle (20 min every 8 hrs)
314
Loading Summary
Through a literature analysis and comparison to the AHRI Load Spreadsheet (AHRI
2009a) a new model load profile was developed for walk-in coolers. Box conditions,
construction, and size were not altered from the AHRI Load Spreadsheet, but convection
coefficients were added to the conduction analysis to improve its accuracy. Review of the
literature showed that the ground temperature used by AHRI was understated at 50°F. This
was increased to 55°F to better match typical ground temperatures.
The infiltration calculation utilized by the AHRI Load Spreadsheet is sound, and
the door sizes are close to the correct size. The percentage of time that doors were open for
the walk-in coolers was increased from 1.18% and 2.78% for the small and large coolers,
respectively, to 5.4% for both coolers.
The product load used by AHRI used a pull-down temperature of 10°F and a pull-
down period of 8 hours, with product loading of 12.11 and 1.60 lbs of product per ft3 for
the small and large coolers, respectively. The literature revealed that a pull-down period of
24 hours was more appropriate than the 8 hr period utilized by AHRI and that the small
cooler load was overstated. Cooler loads were adjusted to 4.0 and 1.8 lbs of product per ft3
of refrigerated space for the small and large coolers, respectively. The product specific heat
was maintained for the product load calculation, but a respiration heat load was also added
to the space.
Lighting power load per square foot was only adjusted slightly from 1.56 W/ft2 and
1W/ft2 for the small and large cooler, respectively, to 1 W/ft
2 for both spaces. AHRI
assumed 98% of the lighting load affects the space for the small cooler whereas only 85%
is assumed to affect the space for the large cooler due to the use of fluorescent lighting. For
315
the modified model all of the lighting load is a heat load added to the refrigerated space.
The number of people in the space at any given time was maintained from the AHRI Load
Spreadsheet, but the schedule of lighting and occupancy were both increased. The lighting
percentage was increased from 3.75 and 12.5% for the small and large cooler, respectively,
to 30% of the time. The occupancy schedule used by AHRI was 5.83 and 12.5% for the
small and large cooler. This was also modified to a percentage of 20%.
Defrost on medium temperature refrigerated spaces is common. Defrost will be
added to the AWEF calculation, occurring twice a day for 1 hour periods. Miscellaneous
loads were adjusted by increasing the vehicle heat addition to the space from 0.75 to 1.00
W-hr/ft3-day for the large cooler. In addition, passage door heaters were added at 8 W/ft of
door perimeter.
Walk-In Freezers
The literature that was located presented a wealth of information on typical
engineering and operation of walk-in freezers. The available sources were analyzed,
compared to each other, and then compared to the model load defined by AHRI in the
AHRI Load Spreadsheet (AHRI 2009a). Modifications to the model load were developed
based on this analysis.
Box Interior Conditions
Box interior conditions refer to the temperature and humidity levels maintained
within the walk-in box and the interior dimensions of the space. Both commercial and
industrial refrigeration application sources were investigated by this study. Commercial
refrigeration, for the purpose of this study, refers to installations at grocery stores,
restaurants, and gas stations. These installations are smaller in size and often interface with
316
customers who access the refrigerated space through glass doors. Industrial refrigeration
refers to large refrigeration systems used for production, processing, and storage of frozen
products. Information on commercial refrigeration is directly applicable to this study
whereas industrial refrigeration information is not always applicable. Industrial warehouse
dimensions were excluded from the analysis of the typical interior dimensions of a
refrigerated space to ensure applicability of the results to this study.
Information related to interior conditions for a walk-in freezer was presented by
fifty-seven authors, including (Altwies 1998), (Altwies and Reindl 1999), (Anonymous
2004), (Aparicio-Cuesta and Garcia-Moreno 1988), (Ashby et al. 1979), (Bauernfeind and
Siemers 1945), (Becker et al. 2011), (Blackmore 2012), (Boggs et al. 1960), (Chen et al.
1999), (Christensen and Bertilsen 2004), (Cleland 1983), (Cleland and O'Hagan 2003),
(Cleland et al. 2004), (Diehl and Berry 1933), (DOE 2010a), (DOE 2010b), (DOE 2010c),
(Foster et al. 2003), (Goetzler et al. 2009), (Gortner et al. 1948), (Gosney and Olama 1975),
(Hayes and Stoecker 1969), (Heatcraft 2008), (Henderson and Khattar 1999), (Hendrix et
al. 1989), (Huan 2008), (Hustrulid and Winters 1943), (IIR 1986), (Krack 1977), (Kun et
al. 2007), (Lutz et al. 1934), (Mago and Sherif 2005), (Magoo 2003), (Manske 1999),
(McHugh 2010), (Morris 2012), (Nagaraju et al. 2001), (Navy 1986), (Nelson 2011),
(O'Hagan et al. 1993), (Patel et al. 1993), (PG&E 2007), (Pham and Oliver 1983), (Plagge
1938), (Sand et al. 1997), (SCE 2008), (SCE 2009), (Sezgen and Koomey 1995), (Stoecker
1998), (Stoeckle 2000), (Tressler and Evers 1947), (USDA 2010), (Westphalen et al.
1996), (Wiegand 1931), and (Woodroof and Shelor 1947). Results of the literature search
for box interior conditions are found in Table 119.
317
Box interior dimensions are discussed by thirty-five works, including (Anonymous
2004), (Arias 2005), (Becker et al. 2011), (Blackmore 2012), (Christensen and Bertilsen
2004) , (DOE 2010a), (DOE 2010b), (DOE 2010c), (Edwards 2010), (Elsayed 1998),
(Foster et al. 2003), (Goetzler et al. 2009), (Heatcraft 2008), (Henderson and Khattar
1999), (Huan 2008), (Jones et al. 1983), (Knudsen and Pachai 2004), (Krack 1977),
(Longdill and Wyborn 1978), (McHugh 2010), (Morris 2012), (Nagaraju et al. 2001),
(Navy 1986), (O'Hagan et al. 1993), (Patel et al. 1993), (PG&E 2004), (Pham and Oliver
1983), (SCE 2008), (SCE 2009), (Sezgen and Koomey 1995), (Sherif et al. 2002), (Walker
et al. 1990), (Walker 1992), (Walker 2001), (Walker and Baxter 2002), and (Westphalen et
al. 1996). The information gathered from these reports is summarized in Table 120.
The box interior temperature varies for walk-in freezers based on the application
and the product being stored, ranging from -40 to 32.4°F, according to the literature. The
average storage temperature is -0.3°F. A majority of the storage temperatures cited as most
typical were either 0 or -10°F, which prompted an adjustment to the AHRI Load
Spreadsheet (AHRI 2009a) storage temperature from -10 to -5°F. Box interior relative
humidities range from 50 to 95%, with an average value of 77.9%. The value used by
AHRI is on the low end of typical relative humidities found in the literature. The modified
model load will use a relative humidity of 80%.
Walk-in freezers are constructed in various sizes ranging from 30 to 3000 ft2 in the
literature. Box dimensions (width x length x height) varied from 5 x 6 x 6 ft tall to 50 x 50
x 69.6 ft tall, with noted box volumes ranging from 7 to 50,000 ft3. AHRI used freezer
dimensions of 8 x 8 x 8 ft tall and 50 x 50 x 20 ft tall for the small and large freezers

318
analyzed, respectively. Through the literature review, it appears that these box dimensions
are appropriate to analyze the range of box sizes.
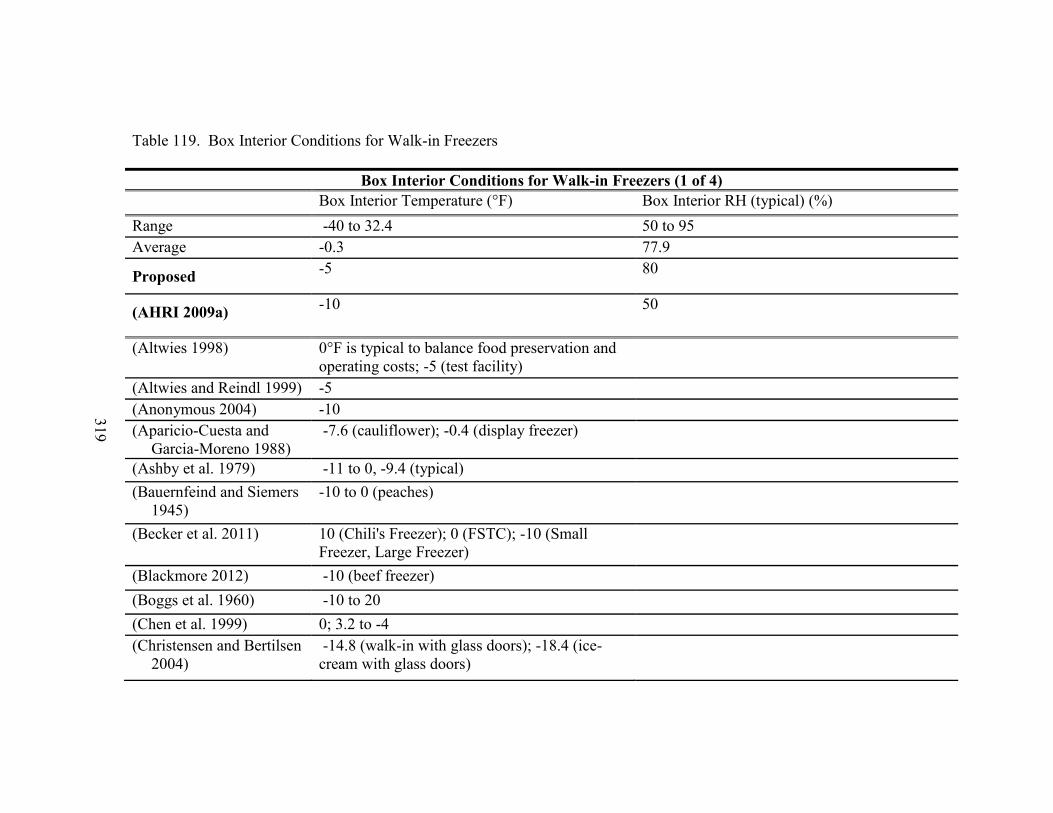
319
Table 119. Box Interior Conditions for Walk-in Freezers
Box Interior Conditions for Walk-in Freezers (1 of 4)
Box Interior Temperature (°F) Box Interior RH (typical) (%)
Range -40 to 32.4 50 to 95
Average -0.3 77.9
Proposed -5 80
(AHRI 2009a) -10 50
(Altwies 1998) 0°F is typical to balance food preservation and
operating costs; -5 (test facility)
(Altwies and Reindl 1999) -5
(Anonymous 2004) -10
(Aparicio-Cuesta and
Garcia-Moreno 1988)
-7.6 (cauliflower); -0.4 (display freezer)
(Ashby et al. 1979) -11 to 0, -9.4 (typical)
(Bauernfeind and Siemers
1945)
-10 to 0 (peaches)
(Becker et al. 2011) 10 (Chili's Freezer); 0 (FSTC); -10 (Small
Freezer, Large Freezer)
(Blackmore 2012) -10 (beef freezer)
(Boggs et al. 1960) -10 to 20
(Chen et al. 1999) 0; 3.2 to -4
(Christensen and Bertilsen
2004)
-14.8 (walk-in with glass doors); -18.4 (ice-
cream with glass doors)

320
Box Interior Conditions for Walk-in Freezers (2 of 4)
Box Interior Temperature (°F) Box Interior RH (typical) (%)
(Cleland 1983) -4 to 5 (cold stores); -22 to -4 (lamb carcass
freezers); -40 to -13 (beef carton freezers)
(Cleland and O'Hagan
2003)
28.8 to 32 68 to 93
(Cleland et al. 2004) -4 (A5 and 6); 3 (A2a and A3); 5 (A7); 30 (A1,
A2b)
(Diehl and Berry 1933) 15 is practical upper limit for frozen storage
(DOE 2010a) 32 or lower
(DOE 2010b) -10 60
(DOE 2010c) 32 or lower, -10
(Edwards 2010) 20
(Foster et al. 2003) -4
(Goetzler et al. 2009) -10 (baseline); -20 to 10 (typical)
(Gortner et al. 1948) 0 to -20; -5 to -15 (pork)
(Gosney and Olama 1975) -22 85
(Hayes and Stoecker
1969)
14
(Heatcraft 2008) Heatcraft Table 7; -1.6 average Heatcraft Table 7; 65 average
(Henderson and Khattar
1999)
-8 (meat), -2 (main storage)
(Hendrix et al. 1989) -15 (#1); 0 (#2); -10 (#3); -15 (#4)
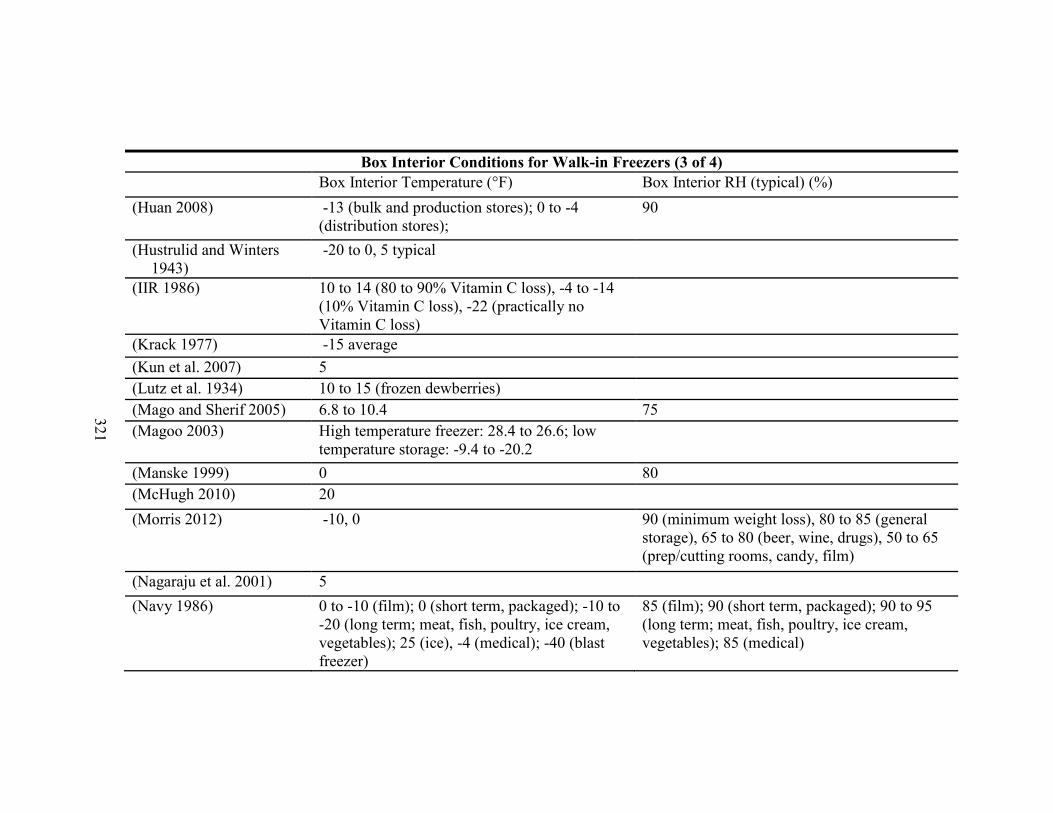
321
Box Interior Conditions for Walk-in Freezers (3 of 4)
Box Interior Temperature (°F) Box Interior RH (typical) (%)
(Huan 2008) -13 (bulk and production stores); 0 to -4
(distribution stores);
90
(Hustrulid and Winters
1943)
-20 to 0, 5 typical
(IIR 1986) 10 to 14 (80 to 90% Vitamin C loss), -4 to -14
(10% Vitamin C loss), -22 (practically no
Vitamin C loss)
(Krack 1977) -15 average
(Kun et al. 2007) 5
(Lutz et al. 1934) 10 to 15 (frozen dewberries)
(Mago and Sherif 2005) 6.8 to 10.4 75
(Magoo 2003) High temperature freezer: 28.4 to 26.6; low
temperature storage: -9.4 to -20.2
(Manske 1999) 0 80
(McHugh 2010) 20
(Morris 2012) -10, 0 90 (minimum weight loss), 80 to 85 (general
storage), 65 to 80 (beer, wine, drugs), 50 to 65
(prep/cutting rooms, candy, film)
(Nagaraju et al. 2001) 5
(Navy 1986) 0 to -10 (film); 0 (short term, packaged); -10 to
-20 (long term; meat, fish, poultry, ice cream,
vegetables); 25 (ice), -4 (medical); -40 (blast
freezer)
85 (film); 90 (short term, packaged); 90 to 95
(long term; meat, fish, poultry, ice cream,
vegetables); 85 (medical)
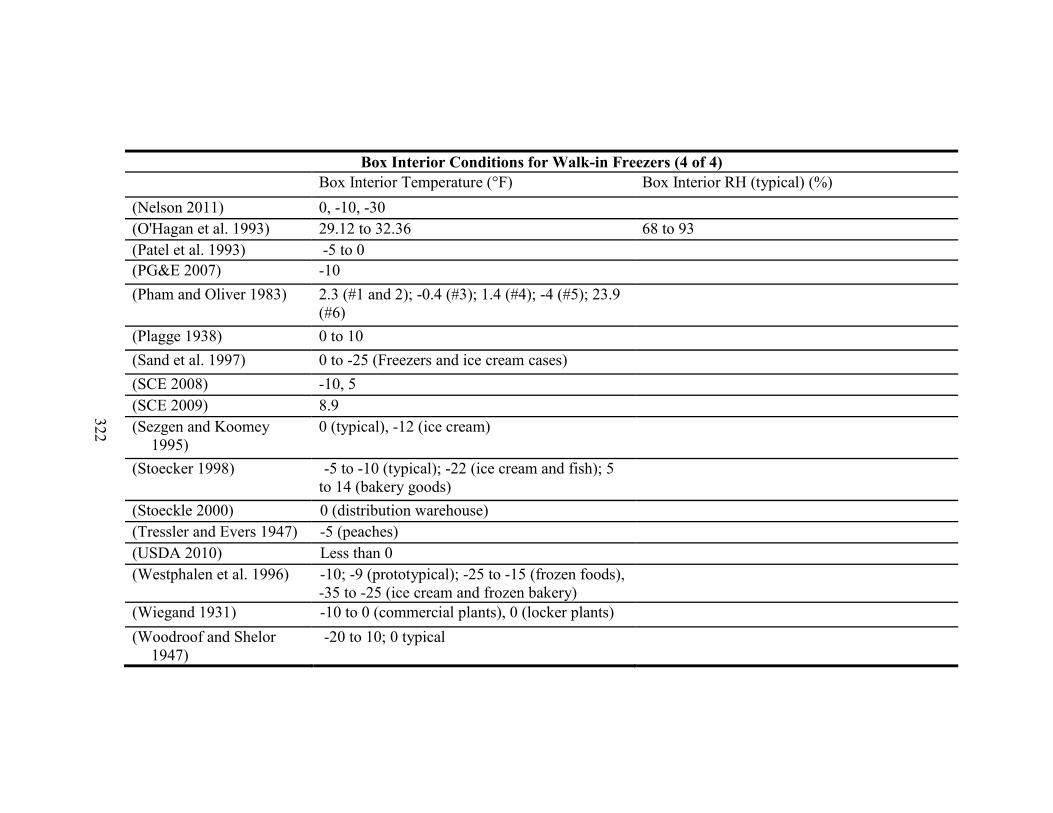
322
Box Interior Conditions for Walk-in Freezers (4 of 4)
Box Interior Temperature (°F) Box Interior RH (typical) (%)
(Nelson 2011) 0, -10, -30
(O'Hagan et al. 1993) 29.12 to 32.36 68 to 93
(Patel et al. 1993) -5 to 0
(PG&E 2007) -10
(Pham and Oliver 1983) 2.3 (#1 and 2); -0.4 (#3); 1.4 (#4); -4 (#5); 23.9
(#6)
(Plagge 1938) 0 to 10
(Sand et al. 1997) 0 to -25 (Freezers and ice cream cases)
(SCE 2008) -10, 5
(SCE 2009) 8.9
(Sezgen and Koomey
1995)
0 (typical), -12 (ice cream)
(Stoecker 1998) -5 to -10 (typical); -22 (ice cream and fish); 5
to 14 (bakery goods)
(Stoeckle 2000) 0 (distribution warehouse)
(Tressler and Evers 1947) -5 (peaches)
(USDA 2010) Less than 0
(Westphalen et al. 1996) -10; -9 (prototypical); -25 to -15 (frozen foods),
-35 to -25 (ice cream and frozen bakery)
(Wiegand 1931) -10 to 0 (commercial plants), 0 (locker plants)
(Woodroof and Shelor
1947)
-20 to 10; 0 typical
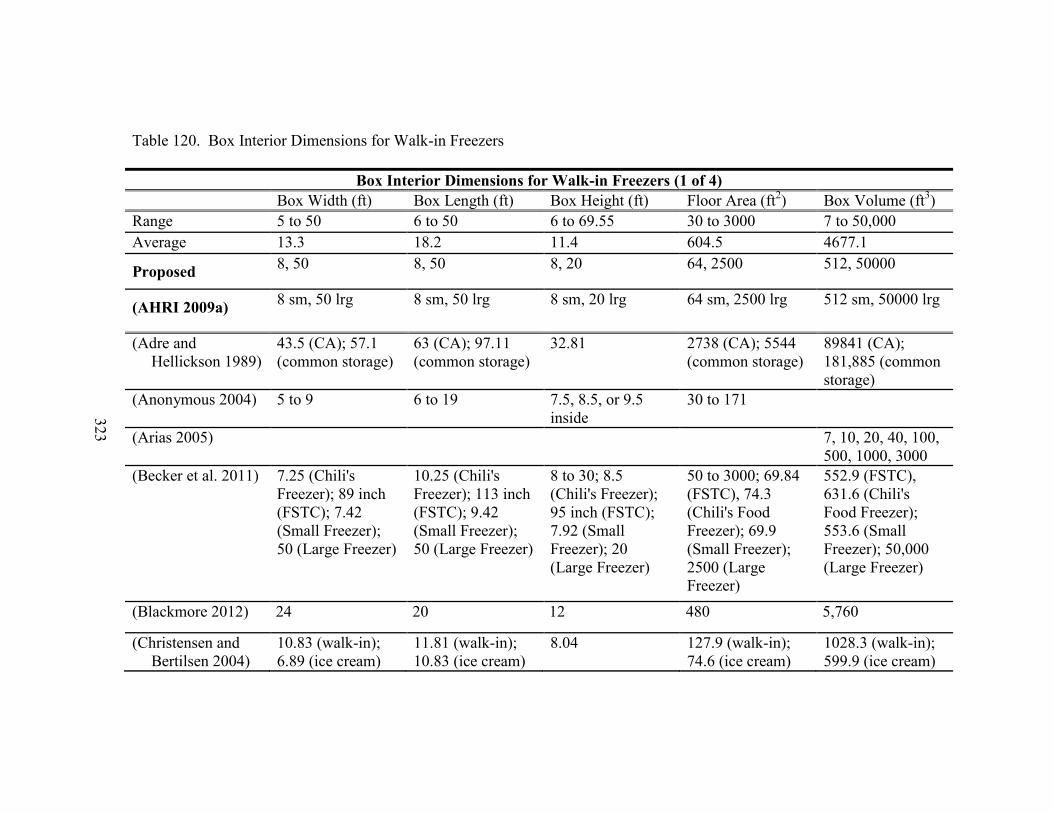
323
Table 120. Box Interior Dimensions for Walk-in Freezers
Box Interior Dimensions for Walk-in Freezers (1 of 4)
Box Width (ft) Box Length (ft) Box Height (ft) Floor Area (ft2) Box Volume (ft
3)
Range 5 to 50 6 to 50 6 to 69.55 30 to 3000 7 to 50,000
Average 13.3 18.2 11.4 604.5 4677.1
Proposed 8, 50 8, 50 8, 20 64, 2500 512, 50000
(AHRI 2009a) 8 sm, 50 lrg 8 sm, 50 lrg 8 sm, 20 lrg 64 sm, 2500 lrg 512 sm, 50000 lrg
(Adre and
Hellickson 1989)
43.5 (CA); 57.1
(common storage)
63 (CA); 97.11
(common storage)
32.81 2738 (CA); 5544
(common storage)
89841 (CA);
181,885 (common
storage)
(Anonymous 2004) 5 to 9 6 to 19 7.5, 8.5, or 9.5
inside
30 to 171
(Arias 2005) 7, 10, 20, 40, 100,
500, 1000, 3000
(Becker et al. 2011) 7.25 (Chili's
Freezer); 89 inch
(FSTC); 7.42
(Small Freezer);
50 (Large Freezer)
10.25 (Chili's
Freezer); 113 inch
(FSTC); 9.42
(Small Freezer);
50 (Large Freezer)
8 to 30; 8.5
(Chili's Freezer);
95 inch (FSTC);
7.92 (Small
Freezer); 20
(Large Freezer)
50 to 3000; 69.84
(FSTC), 74.3
(Chili's Food
Freezer); 69.9
(Small Freezer);
2500 (Large
Freezer)
552.9 (FSTC),
631.6 (Chili's
Food Freezer);
553.6 (Small
Freezer); 50,000
(Large Freezer)
(Blackmore 2012) 24 20 12 480 5,760
(Christensen and
Bertilsen 2004)
10.83 (walk-in);
6.89 (ice cream)
11.81 (walk-in);
10.83 (ice cream)
8.04 127.9 (walk-in);
74.6 (ice cream)
1028.3 (walk-in);
599.9 (ice cream)

324
Box Interior Dimensions for Walk-in Freezers (2 of 4)
Box Width (ft) Box Length (ft) Box Height (ft) Floor Area (ft2) Box Volume (ft
3)
(DOE 2010a) < 3000
(DOE 2010b) 6.0 sm, 9.0 med,
20.0 lrg
8.0 sm, 20.0 med,
25.0 lrg
7.6 sm, 9.5 med,
12.0 lrg
48 sm, 180 med,
500 lrg
364.8 sm, 1710.0
med, 6000.0 lrg
(DOE 2010c) < 3000
(Elsayed 1998) 6.56 to 13.12
(Foster et al. 2003) 15.75 19.02 12.47 299.7 3736.0
(Goetzler et al.
2009)
80, 1000
(Westphalen et al.
1996)
(Heatcraft 2008) 12 (ice cream
hardening), 20
(beef)
14 (ice cream
hardening), 24
(beef)
8 (ice cream
hardening), 12
(beef)
168 (ice cream
hardening), 480
(beef)
1344 (ice cream
hardening), 5760
(beef)
(Henderson and
Khattar 1999)
Store A: 258 (meat
and main); Store
B: 480
(Huan 2008) 35314.7, 3531.5,
353.1
(Jones et al. 1983) 6 12 6 72 432
(Knudsen and
Pachai 2004)
343, 189, 421, 309
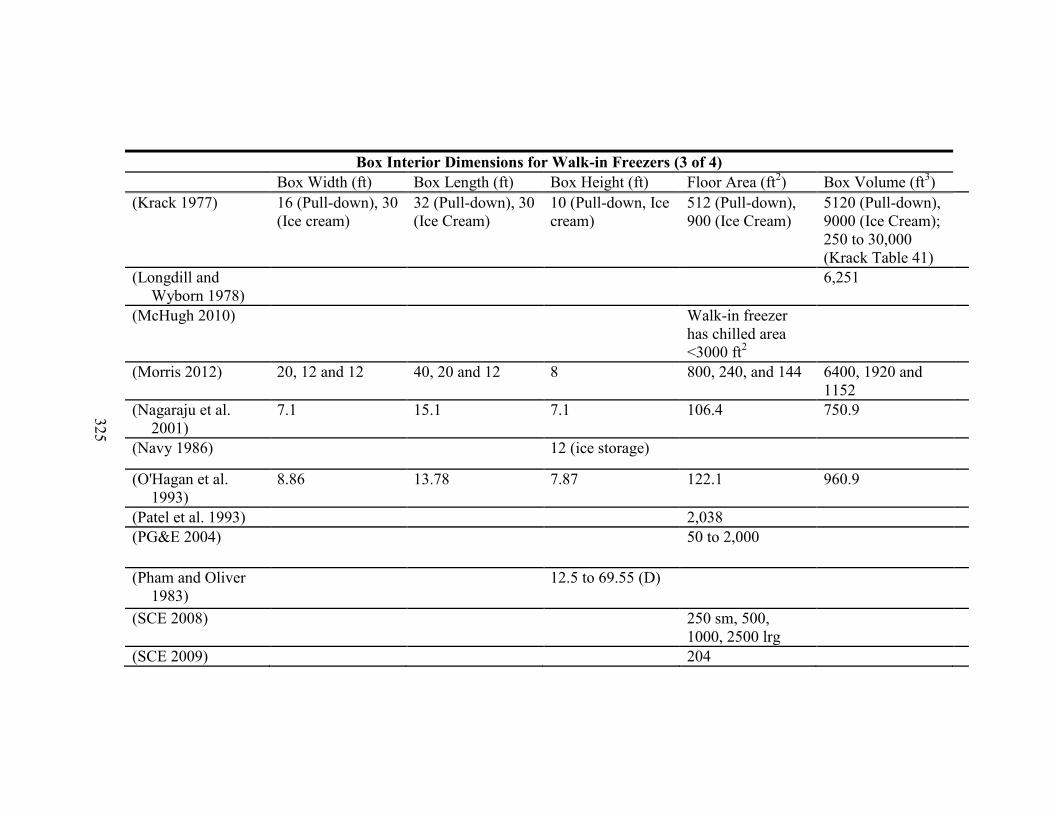
325
Box Interior Dimensions for Walk-in Freezers (3 of 4)
Box Width (ft) Box Length (ft) Box Height (ft) Floor Area (ft2) Box Volume (ft
3)
(Krack 1977) 16 (Pull-down), 30
(Ice cream)
32 (Pull-down), 30
(Ice Cream)
10 (Pull-down, Ice
cream)
512 (Pull-down),
900 (Ice Cream)
5120 (Pull-down),
9000 (Ice Cream);
250 to 30,000
(Krack Table 41)
(Longdill and
Wyborn 1978)
6,251
(McHugh 2010) Walk-in freezer
has chilled area
<3000 ft2
(Morris 2012) 20, 12 and 12 40, 20 and 12 8 800, 240, and 144 6400, 1920 and
1152
(Nagaraju et al.
2001)
7.1 15.1 7.1 106.4 750.9
(Navy 1986) 12 (ice storage)
(O'Hagan et al.
1993)
8.86 13.78 7.87 122.1 960.9
(Patel et al. 1993) 2,038
(PG&E 2004) 50 to 2,000
(Pham and Oliver
1983)
12.5 to 69.55 (D)
(SCE 2008) 250 sm, 500,
1000, 2500 lrg
(SCE 2009) 204

326
Box Interior Dimensions for Walk-in Freezers (4 of 4)
Box Width (ft) Box Length (ft) Box Height (ft) Floor Area (ft2) Box Volume (ft
3)
(Sezgen and
Koomey 1995)
30, 10 50, 20 20, 8 1500, 200 30000, 1600
(Sherif et al. 2002) 12.92 10.33 7.25 133.5 967.6
(Walker 1992;
Walker et al.
1990)
500 (freezer); 81
(bakery)
(Walker 2001) 15 (grocery); 10
(bakery); 8 (deli)
42 (grocery); 12
(bakery); 10 (deli)
630 (grocery); 120
(bakery); 80 (deli)
(Walker and Baxter
2002)
925 (freezer); 100
(meat); 144
(bakery); 1,013
(freezer #2); 506
(freezer #3); 144
(fish); 81 (deli);
180 (ice cream)
(Westphalen et al.
1996)
8 10 8 (typical), 7.58
(prototypical)
1000 (combined);
80 to 250
(typical); 80
(prototypical)
640 to 2000
(typical)

327
Box Conduction
The walk-in freezer conduction load is calculated using numerous inputs, including
the box interior conditions (Table 119), the surface area of the box (Table 120), the exterior
conditions surrounding the box (Table 104 and Table 105), the ground temperature (Table
121), the box construction (Table 122), and the convective coefficient (Table 123).
Information about the floor heat load was presented by, (Adre and Hellickson
1989), (Altwies and Reindl 1999), (Becker et al. 2011), (Cooper 1973), (Devres and Bishop
1995), (DOE 2010a), (DOE 2010b), (DOE 2010c), (Heatcraft 2008), (Krack 1977),
(Magoo 2003), (Manske 1999), (Navy 1986), (PG&E 2007), (SCE 2008), (Somrani et al.
2008), (Stoecker 1998), (Stoeckle 2000), and (Stoeckle et al. 2002). Floor heat load was
presented in two forms: floor heat load (Btu/hr-ft2) and ground temperature.
Box construction varies greatly from one walk-in freezer to another. This is
highlighted by the information obtained from (Altwies and Reindl 1999), (Anonymous
2004), (Ashby et al. 1979), (ASHRAE 1998), (Becker et al. 2011), (Blackmore 2012),
(Chen et al. 1999), (DOE 2010a), (DOE 2010b), (DOE 2010c), (Heatcraft 2008), (Hendrix
et al. 1989), (Jones et al. 1983), (Krack 1977), (Magoo 2003), (Manske 1999), (Nagaraju et
al. 2001), (Navy 1986), (O'Hagan et al. 1993), (Patel et al. 1993), (PG&E 2007), (SCE
2008), (Sherif et al. 2002), (Stoecker 1998), (Stoeckle 2000), (Stoeckle et al. 2002), and
(Westphalen et al. 1996), with R-values ranging up to +202%/-93% from the average
value. Convective film coefficients for calculation of the box conduction load for walk-in
freezers were noted by (DOE 2010b), (Krack 1977), (SCE 2008), (Sherif et al. 2002),
(Stoecker 1998), and (Stoeckle 2000).
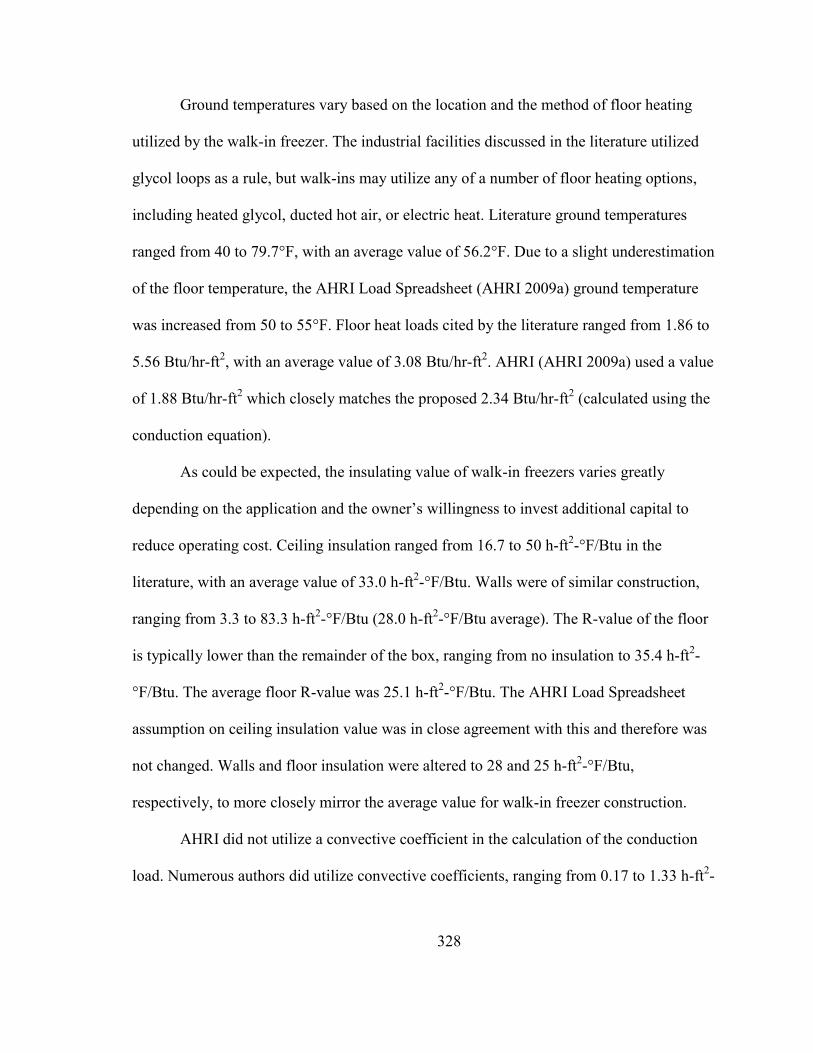
328
Ground temperatures vary based on the location and the method of floor heating
utilized by the walk-in freezer. The industrial facilities discussed in the literature utilized
glycol loops as a rule, but walk-ins may utilize any of a number of floor heating options,
including heated glycol, ducted hot air, or electric heat. Literature ground temperatures
ranged from 40 to 79.7°F, with an average value of 56.2°F. Due to a slight underestimation
of the floor temperature, the AHRI Load Spreadsheet (AHRI 2009a) ground temperature
was increased from 50 to 55°F. Floor heat loads cited by the literature ranged from 1.86 to
5.56 Btu/hr-ft2, with an average value of 3.08 Btu/hr-ft
2. AHRI (AHRI 2009a) used a value
of 1.88 Btu/hr-ft2 which closely matches the proposed 2.34 Btu/hr-ft
2 (calculated using the
conduction equation).
As could be expected, the insulating value of walk-in freezers varies greatly
depending on the application and the owner‟s willingness to invest additional capital to
reduce operating cost. Ceiling insulation ranged from 16.7 to 50 h-ft2-°F/Btu in the
literature, with an average value of 33.0 h-ft2-°F/Btu. Walls were of similar construction,
ranging from 3.3 to 83.3 h-ft2-°F/Btu (28.0 h-ft
2-°F/Btu average). The R-value of the floor
is typically lower than the remainder of the box, ranging from no insulation to 35.4 h-ft2-
°F/Btu. The average floor R-value was 25.1 h-ft2-°F/Btu. The AHRI Load Spreadsheet
assumption on ceiling insulation value was in close agreement with this and therefore was
not changed. Walls and floor insulation were altered to 28 and 25 h-ft2-°F/Btu,
respectively, to more closely mirror the average value for walk-in freezer construction.
AHRI did not utilize a convective coefficient in the calculation of the conduction
load. Numerous authors did utilize convective coefficients, ranging from 0.17 to 1.33 h-ft2-

329
°F/Btu. This study will utilize values of 0.5 h-ft2-°F/Btu for the internal and external
convective film coefficient and use a value of 0.6 h-ft2-°F/Btu for the floor coefficient.
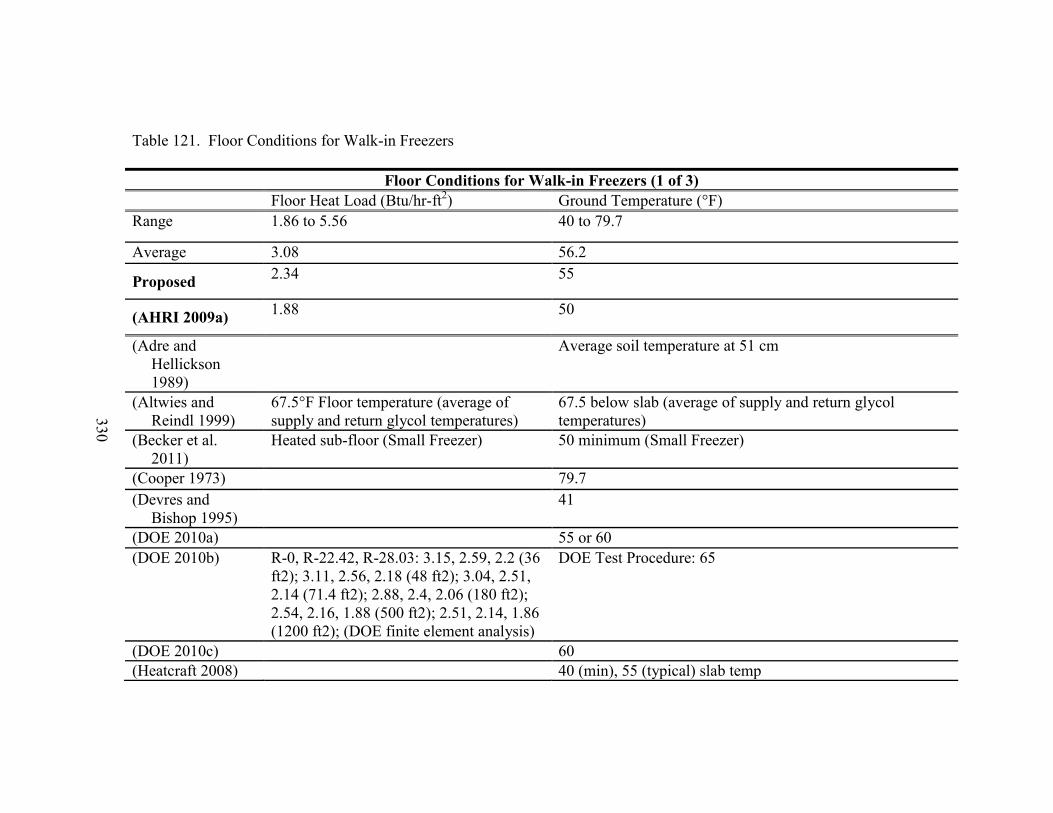
330
Table 121. Floor Conditions for Walk-in Freezers
Floor Conditions for Walk-in Freezers (1 of 3)
Floor Heat Load (Btu/hr-ft2) Ground Temperature (°F)
Range 1.86 to 5.56 40 to 79.7
Average 3.08 56.2
Proposed 2.34 55
(AHRI 2009a) 1.88 50
(Adre and
Hellickson
1989)
Average soil temperature at 51 cm
(Altwies and
Reindl 1999)
67.5°F Floor temperature (average of
supply and return glycol temperatures)
67.5 below slab (average of supply and return glycol
temperatures)
(Becker et al.
2011)
Heated sub-floor (Small Freezer) 50 minimum (Small Freezer)
(Cooper 1973) 79.7
(Devres and
Bishop 1995)
41
(DOE 2010a) 55 or 60
(DOE 2010b) R-0, R-22.42, R-28.03: 3.15, 2.59, 2.2 (36
ft2); 3.11, 2.56, 2.18 (48 ft2); 3.04, 2.51,
2.14 (71.4 ft2); 2.88, 2.4, 2.06 (180 ft2);
2.54, 2.16, 1.88 (500 ft2); 2.51, 2.14, 1.86
(1200 ft2); (DOE finite element analysis)
DOE Test Procedure: 65
(DOE 2010c) 60
(Heatcraft 2008) 40 (min), 55 (typical) slab temp

331
Floor Conditions for Walk-in Freezers (2 of 3)
Floor Heat Load (Btu/hr-ft2) Ground Temperature (°F)
(Krack 1977) 1 Btu/ft2-F-24 hrs (conventional
insulation)
55
(Magoo 2003) Most popular method is a pipe grid system
in the base concrete slab directly under the
insulation. Hot air or glycol is circulated
to keep the slab above freezing.
50 under slab
(Manske 1999) 2.5
(Navy 1986) Facilities > 5000 ft2 or < 32°F: heated by
glycol; Other facilities may use ventilation
pipes as alternative heating method;
Freezing is a concern if storage
temperature ≤ 15°F and room width is
over 10 to 15 ft.
(PG&E 2007) Electric under slab heating is not very
common in large warehouses, but may be
used in small frozen storage spaces
(SCE 2008) 50
(Somrani et al.
2008)
57.2°F soil near temperature
(Stoecker 1998) Underfloor heating fluid supply temp no
higher than 50 to 60°F. Heating is
required to maintain a soil temperature at
about 50°F.
Underfloor heating fluid supply temp no higher than 50 to
60°F. Heating is required to maintain a soil temperature at
about 50°F (freezer).
(Stoeckle 2000) 3.6 (Jekel and Reindl 2000) 67.5 below slab

332
Floor Conditions for Walk-in Freezers (3 of 3)
Floor Heat Load (Btu/hr-ft2) Ground Temperature (°F)
(Stoeckle et al.
2002)
3.6 (Jekel and Reindl 2000)
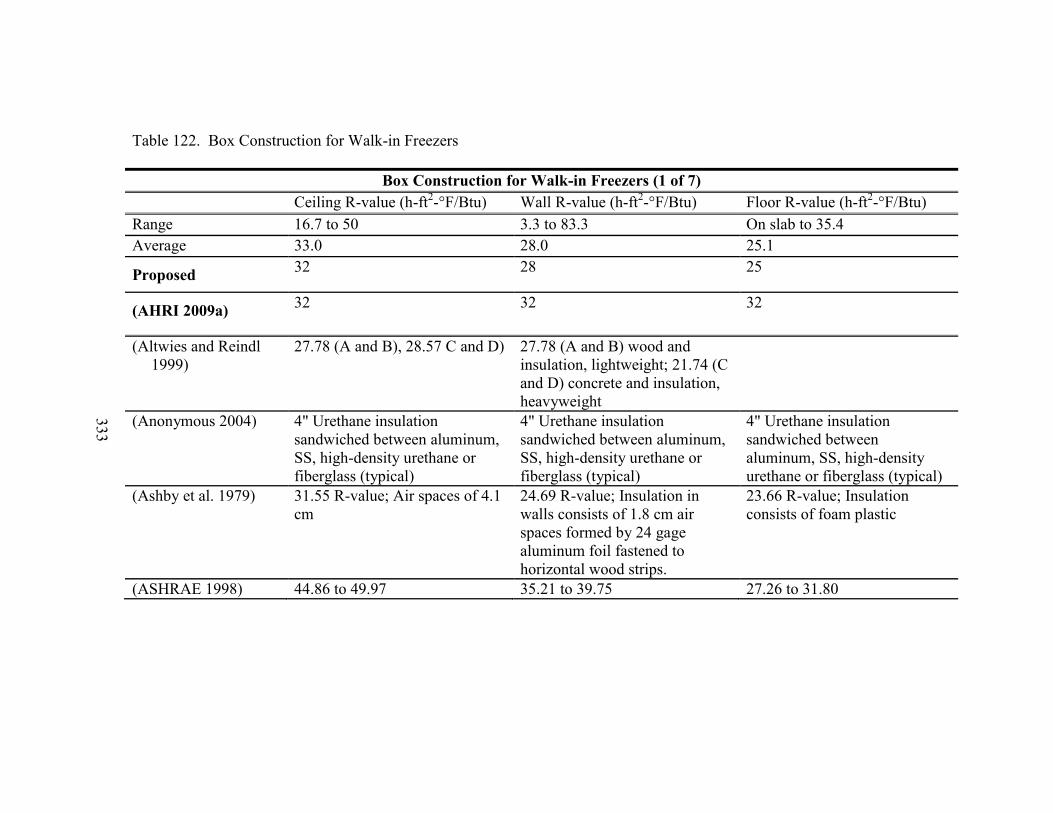
333
Table 122. Box Construction for Walk-in Freezers
Box Construction for Walk-in Freezers (1 of 7)
Ceiling R-value (h-ft2-°F/Btu) Wall R-value (h-ft
2-°F/Btu) Floor R-value (h-ft
2-°F/Btu)
Range 16.7 to 50 3.3 to 83.3 On slab to 35.4
Average 33.0 28.0 25.1
Proposed 32 28 25
(AHRI 2009a) 32 32 32
(Altwies and Reindl
1999)
27.78 (A and B), 28.57 C and D) 27.78 (A and B) wood and
insulation, lightweight; 21.74 (C
and D) concrete and insulation,
heavyweight
(Anonymous 2004) 4" Urethane insulation
sandwiched between aluminum,
SS, high-density urethane or
fiberglass (typical)
4" Urethane insulation
sandwiched between aluminum,
SS, high-density urethane or
fiberglass (typical)
4" Urethane insulation
sandwiched between
aluminum, SS, high-density
urethane or fiberglass (typical)
(Ashby et al. 1979) 31.55 R-value; Air spaces of 4.1
cm
24.69 R-value; Insulation in
walls consists of 1.8 cm air
spaces formed by 24 gage
aluminum foil fastened to
horizontal wood strips.
23.66 R-value; Insulation
consists of foam plastic
(ASHRAE 1998) 44.86 to 49.97 35.21 to 39.75 27.26 to 31.80

334
Box Construction for Walk-in Freezers (2 of 7)
Ceiling R-value (h-ft2-°F/Btu) Wall R-value (h-ft
2-°F/Btu) Floor R-value (h-ft
2-°F/Btu)
(Becker et al. 2011) 4" Extruded polystyrene
sandwich panel, R-17.24 (Small
Freezer); 32 R-value (Large
Freezer)
3.5, 4 or 5.5 inch thick insulated
panels (typical); R-36 (Title 20);
3.5 in urethane foam insulated
panels (FSTC); 4" Extruded
polystyrene sandwich panel, R-
17.24 (Small Freezer); 32 R-
value (Large Freezer)
12 in soil, 6 in concrete, 4"
Extruded polystyrene sandwich
panel (Small Freezer, R-18.9);
12 in soil, 6 in concrete, R-
value 32 (Large Freezer, R-
34.5)
(Blackmore 2012) Spray K = 0.16 Btu / hr-in-ºF,
Foam = 0.12, Styrofoam = 0.26;
4 inch of foamed in-place
urethane (beef freezer)
(Chen et al. 1999) 200 mm polystyrene sandwich
panel attached to a steel portal
frame
(DOE 2010a) No foam insulation degradation
seen in practice
(DOE 2010b) 4” XPS or PU, R-24
(independent testing lab)
4” XPS or PU, R-24
(independent testing lab)
4” XPS or PU, (R-22.42)
(DOE 2010c) 4" Foam :16 to 32 h-ft2-ºF/Btu;
4" Vacuum insulated panel: 120
to 200 h-ft2-ºF/Btu (excluded
from average for Table 122).
Insulating value degrades over
time due to diffusion of gases
and moisture absorption.
28
335
Box Construction for Walk-in Freezers (3 of 7)
Ceiling R-value (h-ft2-°F/Btu) Wall R-value (h-ft
2-°F/Btu) Floor R-value (h-ft
2-°F/Btu)
(Heatcraft 2008) Walk-in: 4 in Urethane (R=25,
k=0.16)
1 to 10 inches of cork/mineral
wool, glass fiber/poly styrene,
sprayed urethane, foamed in
place urethane; Heatcraft Table
13 - General Standard for
Insulation Thickness in Storage
Rooms; 6 in styrofoam, 4.7 in
urethane average; Walk-in: 4 in
Urethane (R=25, k=0.16)
Walk-in: 4 in Urethane (R=25,
k=0.16)
(Hendrix et al. 1989) Pre-fabricated insulated panels
(1, 2, and 3); #3 and #4 share a
wall with two openings between
the spaces
(Jones et al. 1983) Framed plywood, 2 in foam
insulation
(Krack 1977) 3" thick; 6" Polystyrene; 5"
corkboard to 6" slab urethane
(16.7 to 32.4 h-ft2-°F/Btu, 25.9
average)
3" Urethane; 6" Polystyrene; 5"
corkboard to 6" slab urethane
(16.7 to 32.4 h-ft2-°F/Btu, 25.9
average)
6" concrete sealed with 4"
Urethane/ Polystyrene block
(Magoo 2003) 44.86 to 49.97 (ASHRAE 1998),
insulated (polyurethane,
polystyrene, styrofoam)
sandwich with either reinforced
concrete or sheet metal on either
side.
35.21 to 39.75 (ASHRAE 1998),
insulated (polyurethane,
polystyrene, styrofoam)
sandwich with either reinforced
concrete or sheet metal on either
side.
27.26 to 31.8 (ASHRAE 1998),
insulated (polyurethane,
polystyrene, styrofoam)
sandwich with either reinforced
concrete or sheet metal on
either side.
(Manske 1999) 33.09 lightweight 32.85 lightweight

336
Box Construction for Walk-in Freezers (4 of 7)
Ceiling R-value (h-ft2-°F/Btu) Wall R-value (h-ft
2-°F/Btu) Floor R-value (h-ft
2-°F/Btu)
(Nagaraju et al. 2001) 6 inches of extruded
polystyrene, plywood panels
each side
6 inches of extruded
polystyrene, plywood panels
each side
6 inches of extruded
polystyrene
(Navy 1986) 40 to 50 35 to 40 30 to 35
(O'Hagan et al. 1993) 150 mm polystyrene sandwich
panel
(Patel et al. 1993) 2 inches of foam insulation on
all walls
(PG&E 2007) R-31 to R-50 from layers of 5"
isocyanurate (lrg), 6" expanded
urethane metal clad panel
(smaller facilities); R-46
Insulated low mass roof, 0.8
absorptivity (prototypical)
R-32 to R-56 (range); R-35
(typical) made of 5 to 6 inches
expanded urethane metal clad
panels; R-26 insulated panel
(prototypical)
R-18 to R-30; Glycol tubes set
in a mud slab with 4" of rigid
styrene and 6" of reinforced
concrete; There is a shift away
from glycol to electric to negate
issues with leakage
(SCE 2008)
> R-36 > R-36
Proposed: R-28 insulation
(Energy Independence and
Security Act), 6 inches of
concrete at R-1.2 (ASHRAE
2005)

337
Box Construction for Walk-in Freezers (5 of 7)
Ceiling R-value (h-ft2-°F/Btu) Wall R-value (h-ft
2-°F/Btu) Floor R-value (h-ft
2-°F/Btu)
(Sherif et al. 2002) Outside to Inside: 20ga
Galvanized sheet, 3/4" Plywood,
4" Polystyrene molded beads, 1"
Extruded polystyrene, 1/16"
Aluminum sheet (AS), 3.5"
Polystyrene molded beads with
2x4s on 2 ft centers, 1/16" AS
for 35.71 R-value
Wall 1: 1/16" Aluminum sheet
(AS), 3.5" Polystyrene molded
beads with 2x4s on 2 ft centers
(PS), 1/16" AS for 13.33 R-
value; Walls 2-4: 1/16" AS, 3.5"
PS, 1/8" AS, 3.5" PS, 1/6" AS
for 25.64 R-value
Outside to Inside: Insulated
floor, 1/2" Extruded
Polystyrene, 4" Polystyrene
molded beads, 6 mm Visquene,
16g Galvanized sheet
338
Box Construction for Walk-in Freezers (6 of 7)
Ceiling R-value (h-ft2-°F/Btu) Wall R-value (h-ft
2-°F/Btu) Floor R-value (h-ft
2-°F/Btu)
(Stoecker 1998) Combining a structural material
with insulation and applying an
abrasion resistant coating is a
traditional method. Insulation
bonded to metal skin and tongue
and grooved together is
becoming more popular.
Common materials (Btu/hr-ft-
ºF): Cellular foamglass (.029),
Cellular polyurethane (.013),
Expanded polystyrene (.02),
Extruded polystyrene (.015),
Glass fiber (.021),
Polyisocyanurate (.012);
Recommended temperature
application for thickness of
insulation: 32 to -20°F at 4
inches (R-value of 33.3), -20 to -
50°F at 5 inches (R-value of
41.6), -50 to -70°F at 6 inches
(R-value of 50)
(Stoeckle 2000) 21.7 21.7
(Stoeckle et al. 2002) 21.74, Thermally lightweight
(foam-core sandwich) and
massive (concrete) studied
Concrete slab on grade with an
imbedded glycol heating loop
339
Box Construction for Walk-in Freezers (7 of 7)
Ceiling R-value (h-ft2-°F/Btu) Wall R-value (h-ft
2-°F/Btu) Floor R-value (h-ft
2-°F/Btu)
(Westphalen et al.
1996)
3 or more inches of polyurethane
foam insulation encased by
galvanized metal; R-27 (typical),
4 inches R-30 (prototypical); 4
to 5 inches; R value 28.6 to
35.75
Insulation required
340
Table 123. Convection Film Coefficients for Walk-in Freezers
Convection Film Coefficients for Walk-in Freezers
External Equivalent Convective
Film Coefficient (h-ft2-°F/Btu)
Internal Equivalent Convective
Film Coefficient (h-ft2-°F/Btu)
Floor Equivalent Convective
Film Coefficient (h-ft2-°F/Btu)
Range 0.17 to 0.68 0.24 to 1.33 0.61 to 0.87
Average 0.42 0.65 0.70
Proposed 0.5 0.5 0.6
(AHRI 2009a)
(DOE 2010b) 0.68 0.25 0.87
(Krack 1977) 0.17 (outdoor, winds < 15 mph) 0.63 (still air)
(SCE 2008) 0.61 (ASHRAE 2005)
(Sherif et al.
2002)
0.61 (still air) 0.24 (750 fpm moving air)
(Stoecker 1998) 15 mph winter, any orientation:
0.167 Btu/h-ft2-°F; 7.5 mph
summer, any orientation: 0.25
Btu/h-ft2-°F
Still air, vertical surface, heat flow
horizontal: 0.685; Horizontal
surface, heat flow downward:
0.926
Horizontal surface, heat flow
upward: 0.613;
(Stoeckle 2000) 1.33 (average of free and forced
convection in freezer)
341
Infiltration
The infiltration load for walk-in freezers is primarily a function of the door height
and width, the temperature difference between the interior and exterior of the box, and the
door opening schedule, including the duration and frequency of opening. Twenty-six
authors presented their chosen method of infiltration calculation, including (Arias 2005),
(Becker et al. 2011), (Blackmore 2012), (Chen et al. 1999), (Christensen and Bertilsen
2004), (Cleland 1983), (Cleland et al. 2004), (DOE 2010b), (Elsayed 1998), (Foster et al.
2003), (Gosney and Olama 1975), (Heatcraft 2008), (Huan 2008), (Krack 1977), (Longdill
and Wyborn 1978), (Manske 1999), (Nagaraju et al. 2001), (Patel et al. 1993), (PG&E
2007), (Pham and Oliver 1983), (SCE 2008), (Sherif et al. 2002), (Stoecker 1998),
(Stoeckle 2000), (Stoeckle et al. 2002), and (Westphalen et al. 1996).
Four preferred infiltration calculation methods were presented, with the Gosney
Olama equation (Equation 18) being the most prevalent. This method was used by AHRI
(AHRI 2009a) in the development of the model load equations, and was also used in the
modified model load. Given a calculation method and a temperature difference between the
inside and outside temperatures, the only other additional component necessary to calculate
the infiltration load is the door opening schedule. The door opening schedule is a
combination of the door opening frequency and the duration of each opening. To better
analyze the amount of time the door is open, the door schedule is analyzed as a percentage
of time that the door was open. Door open percentages ranged from 0.6 to 25.8% in the
literature, with an average value of 9.0%. The AHRI Load Spreadsheet used an open door
percentage of 0.42% for the small freezer and 1.94% for the large freezer. These values

342
understated typical infiltration loads and were increased to 5.4% in the modified model
load.

343
Table 124. Infiltration Details for Walk-in Freezers
Infiltration Details for Walk-in Freezers (1 of 7)
Infiltration Calculation Misc. Details on Infiltration Number of Door
Openings
Duration of Door
Openings
Range Average Open Door Percentage:
0.6 to 25.8%
0.57 to 1800 7.5 to 900 seconds
Average Average Open Door Percentage:
9.0%
415.1 90.8 seconds
Proposed Gosney Olama 5.4% 13 per hour - 7 am
to 7 pm
30 seconds
(AHRI 2009a) Gosney Olama Equation
(ASHRAE Refrigeration
Handbook)
Air Density Factor: 0.96 8 openings per
hour – 6am to
7am, 2 openings
per hour – 7am to
7pm (sm); 8
openings per hour
- 6am to 7am, 4
openings per hour
- 7am to 7pm (lrg)
30 seconds per
opening – 6am to
7am, 5 seconds per
opening – 7am to
7pm (sm);
30 seconds per
opening – 6am to
7pm (lrg)
(Arias 2005) Air change method 38 Air changes per 24 hrs for
247 ft3 room, 31.5 for 353, 21.5
for 706, 14.5 for 1413, 9 for
3531, 3.5 for 17657, 2.5 for
35315, 1.35 for 105944
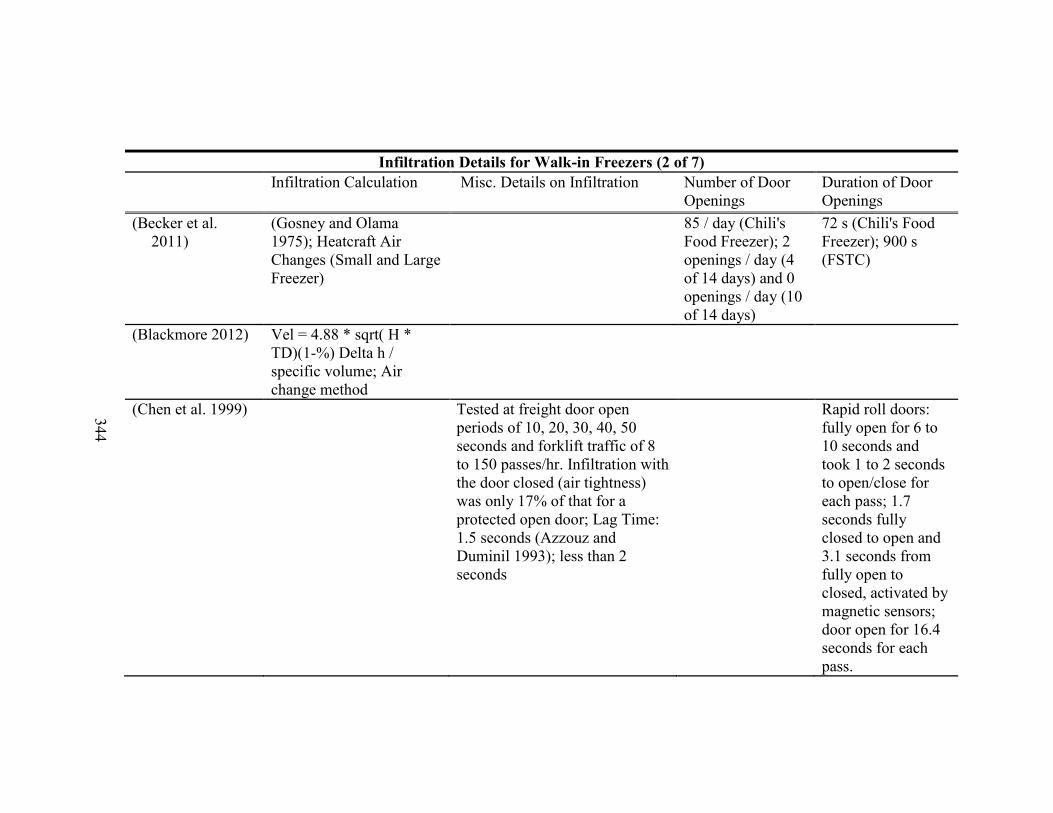
344
Infiltration Details for Walk-in Freezers (2 of 7)
Infiltration Calculation Misc. Details on Infiltration Number of Door
Openings
Duration of Door
Openings
(Becker et al.
2011)
(Gosney and Olama
1975); Heatcraft Air
Changes (Small and Large
Freezer)
85 / day (Chili's
Food Freezer); 2
openings / day (4
of 14 days) and 0
openings / day (10
of 14 days)
72 s (Chili's Food
Freezer); 900 s
(FSTC)
(Blackmore 2012) Vel = 4.88 * sqrt( H *
TD)(1-%) Delta h /
specific volume; Air
change method
(Chen et al. 1999) Tested at freight door open
periods of 10, 20, 30, 40, 50
seconds and forklift traffic of 8
to 150 passes/hr. Infiltration with
the door closed (air tightness)
was only 17% of that for a
protected open door; Lag Time:
1.5 seconds (Azzouz and
Duminil 1993); less than 2
seconds
Rapid roll doors:
fully open for 6 to
10 seconds and
took 1 to 2 seconds
to open/close for
each pass; 1.7
seconds fully
closed to open and
3.1 seconds from
fully open to
closed, activated by
magnetic sensors;
door open for 16.4
seconds for each
pass.

345
Infiltration Details for Walk-in Freezers (3 of 7)
Infiltration Calculation Misc. Details on Infiltration Number of Door
Openings
Duration of Door
Openings
(Christensen and
Bertilsen 2004)
Store operation is
12 hrs per day
(Cleland 1983) 3% of the time
(Cleland et al.
2004)
Good sliding door seals leak at
0.26 to 0.52 ft3 / min-ft
Door opening
frequency
typically cited as 1
per minute.
Loading dock
doors at 40
movements per
hour.
Rapid-roll doors:
Fully open 8 to 20
seconds, 1-2
seconds open/close
(Downing and
Meffert 1993),
Equivalent fully
open time of 35
seconds typical;
Sliding doors: 4 to
10 second
open/close,
Equivalent fully
open time is
typically 60
seconds

346
Infiltration Details for Walk-in Freezers (4 of 7)
Infiltration Calculation Misc. Details on Infiltration Number of Door
Openings
Duration of Door
Openings
(DOE 2010b) Gosney Olama Equation
(ASHRAE Refrigeration
Handbook)
Door Flow Factor: 0.8
(ASHRAE Fundamentals); Flow
between panel joints: 0.13 ft3/hr
per ft2 external surface (DOE
research)
60 openings per
day for passage
and freight doors
(DOE Test
Procedure)
12 seconds per
opening for passage
and freight doors.
Passage and freight
doors stand open an
additional 15
minutes per day
(DOE Test
Procedure)
(Elsayed 1998) 10 to 20 mm can represent a gap
in a closed door that is not well
sealed. Two-dimensional model
citing (Gosney and Olama
1975), (Jones et al. 1983), and
(Cole 1984)
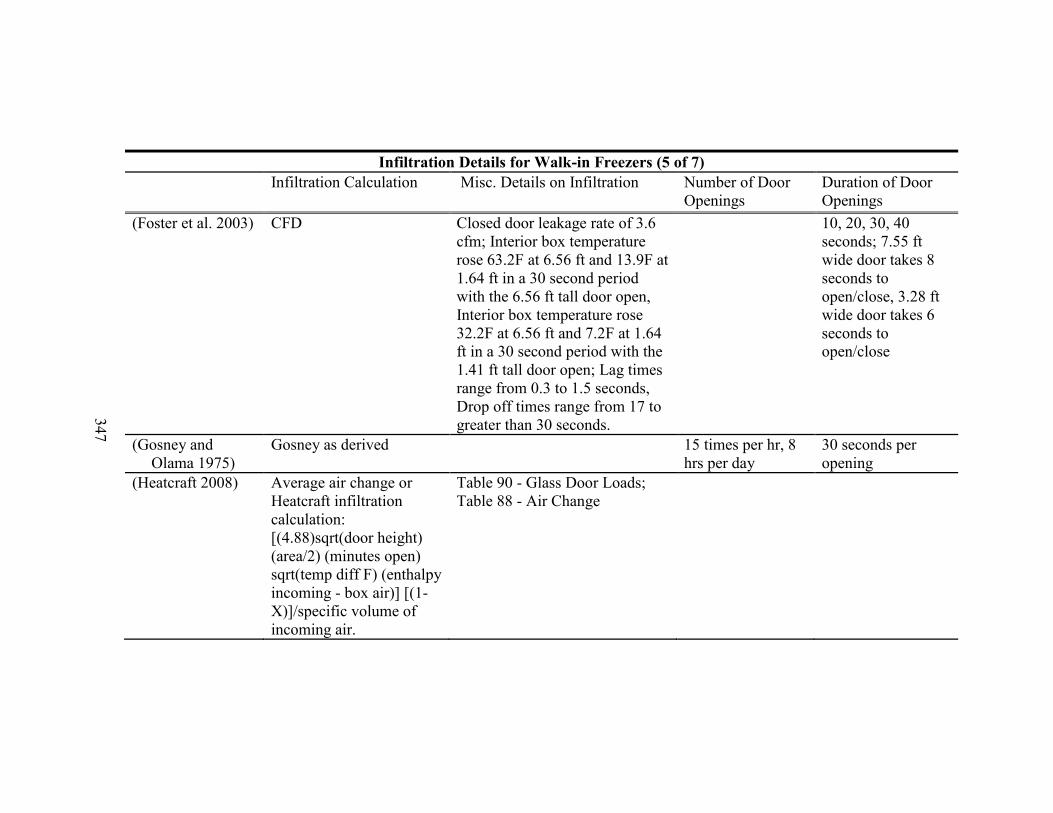
347
Infiltration Details for Walk-in Freezers (5 of 7)
Infiltration Calculation Misc. Details on Infiltration Number of Door
Openings
Duration of Door
Openings
(Foster et al. 2003) CFD Closed door leakage rate of 3.6
cfm; Interior box temperature
rose 63.2F at 6.56 ft and 13.9F at
1.64 ft in a 30 second period
with the 6.56 ft tall door open,
Interior box temperature rose
32.2F at 6.56 ft and 7.2F at 1.64
ft in a 30 second period with the
1.41 ft tall door open; Lag times
range from 0.3 to 1.5 seconds,
Drop off times range from 17 to
greater than 30 seconds.
10, 20, 30, 40
seconds; 7.55 ft
wide door takes 8
seconds to
open/close, 3.28 ft
wide door takes 6
seconds to
open/close
(Gosney and
Olama 1975)
Gosney as derived 15 times per hr, 8
hrs per day
30 seconds per
opening
(Heatcraft 2008) Average air change or
Heatcraft infiltration
calculation:
[(4.88)sqrt(door height)
(area/2) (minutes open)
sqrt(temp diff F) (enthalpy
incoming - box air)] [(1-
X)]/specific volume of
incoming air.
Table 90 - Glass Door Loads;
Table 88 - Air Change
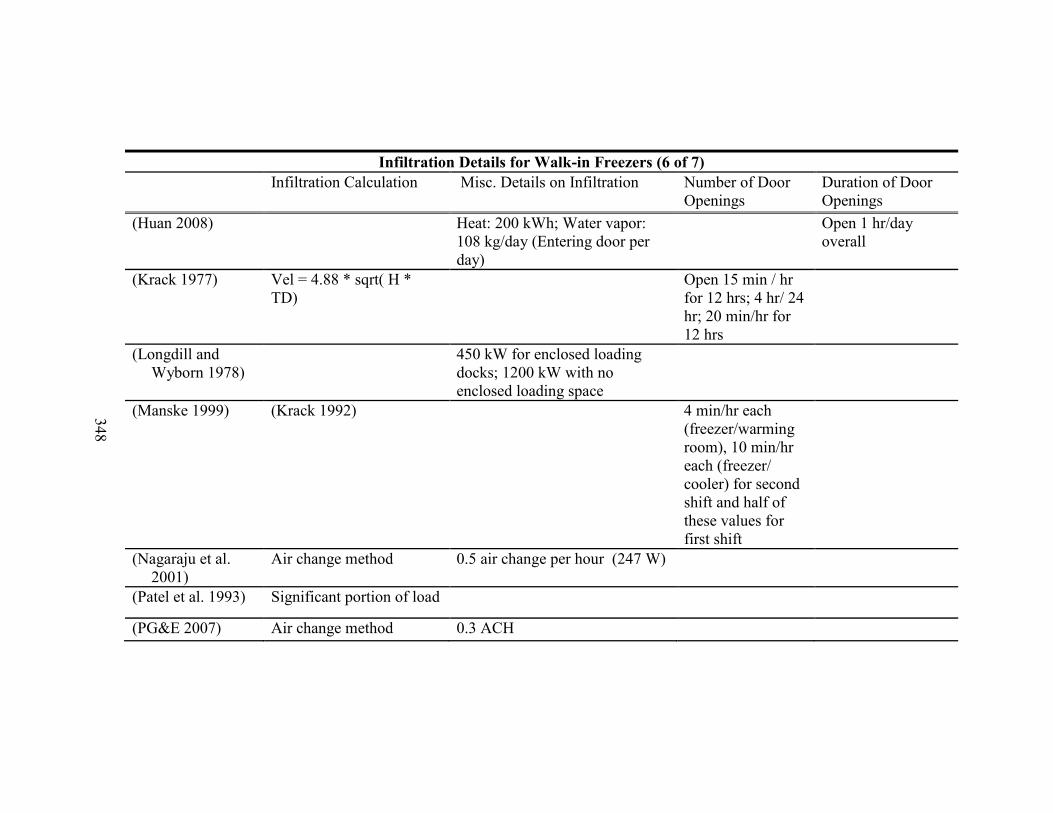
348
Infiltration Details for Walk-in Freezers (6 of 7)
Infiltration Calculation Misc. Details on Infiltration Number of Door
Openings
Duration of Door
Openings
(Huan 2008) Heat: 200 kWh; Water vapor:
108 kg/day (Entering door per
day)
Open 1 hr/day
overall
(Krack 1977) Vel = 4.88 * sqrt( H *
TD)
Open 15 min / hr
for 12 hrs; 4 hr/ 24
hr; 20 min/hr for
12 hrs
(Longdill and
Wyborn 1978)
450 kW for enclosed loading
docks; 1200 kW with no
enclosed loading space
(Manske 1999) (Krack 1992) 4 min/hr each
(freezer/warming
room), 10 min/hr
each (freezer/
cooler) for second
shift and half of
these values for
first shift
(Nagaraju et al.
2001)
Air change method 0.5 air change per hour (247 W)
(Patel et al. 1993) Significant portion of load
(PG&E 2007) Air change method 0.3 ACH
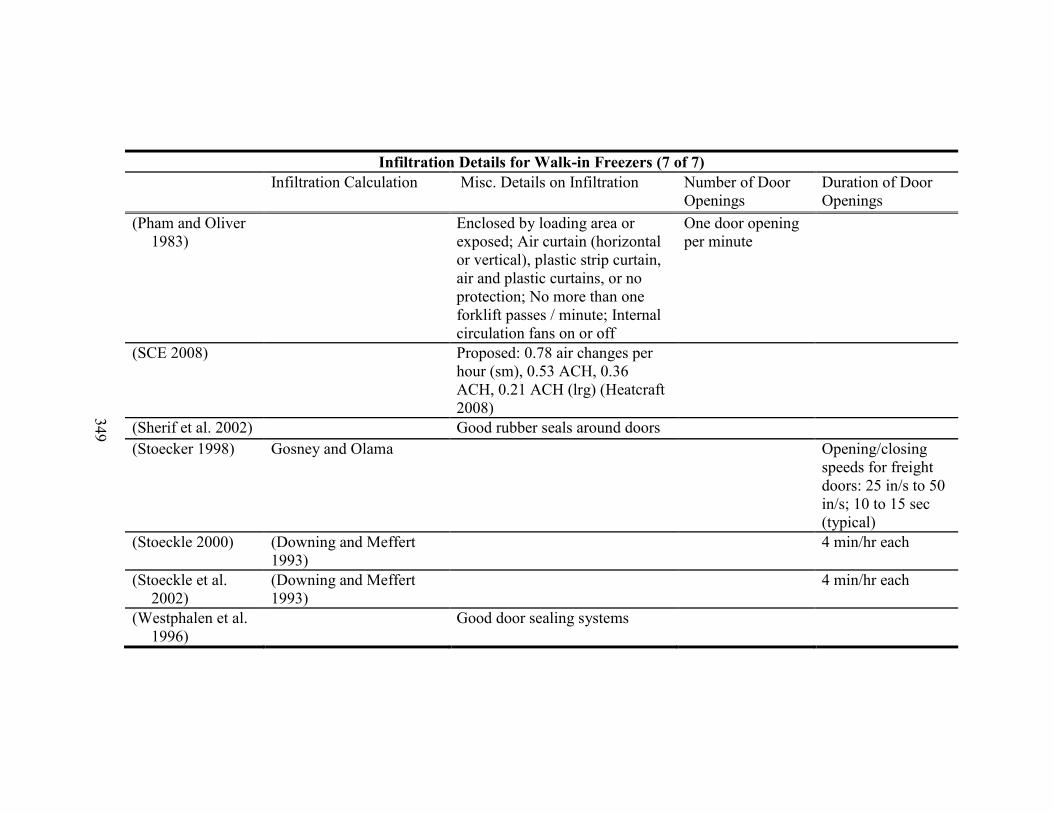
349
Infiltration Details for Walk-in Freezers (7 of 7)
Infiltration Calculation Misc. Details on Infiltration Number of Door
Openings
Duration of Door
Openings
(Pham and Oliver
1983)
Enclosed by loading area or
exposed; Air curtain (horizontal
or vertical), plastic strip curtain,
air and plastic curtains, or no
protection; No more than one
forklift passes / minute; Internal
circulation fans on or off
One door opening
per minute
(SCE 2008) Proposed: 0.78 air changes per
hour (sm), 0.53 ACH, 0.36
ACH, 0.21 ACH (lrg) (Heatcraft
2008)
(Sherif et al. 2002) Good rubber seals around doors
(Stoecker 1998) Gosney and Olama Opening/closing
speeds for freight
doors: 25 in/s to 50
in/s; 10 to 15 sec
(typical)
(Stoeckle 2000) (Downing and Meffert
1993)
4 min/hr each
(Stoeckle et al.
2002)
(Downing and Meffert
1993)
4 min/hr each
(Westphalen et al.
1996)
Good door sealing systems

350
Product
Various products are stored in walk-in freezers, including fruits, vegetables, meat,
and ice cream. The calculation of the product load for a walk-in freezer storing these items
is a function of the product entering temperature, box temperature, loading frequency, and
loading quantity. These components of the product load were collected from works
by(Altwies 1998), (Altwies and Reindl 1999), (Anonymous 2004), (Aparicio-Cuesta and
Garcia-Moreno 1988), (Ashby et al. 1979), (Becker et al. 2011), (Blackmore 2012), (Boggs
et al. 1960), (Cleland 1983), (DOE 2010b), (Gortner et al. 1948), (Heatcraft 2008),
(Henderson and Khattar 1999), (Hustrulid and Winters 1943), (Krack 1977), (Magoo
2003), (Manske 1999), (Morris 2012), (Nagaraju et al. 2001), (Navy 1986), (Goetzler et al.
2009), (Patel et al. 1993), (PG&E 2007), (SCE 2008), (Stoeckle 2000), (Stoeckle et al.
2002), (USDA 2010), (Walker and Baxter 2002), and (Woodroof and Shelor 1947).
Product pull-down temperature difference ranged from 0 to 130°F, with an average
value of 19.7°F. Daily loading ratios for products ranged from 0.16 to 2.47 lb/ft3-day, with
an average value of 0.67 lb/ft3-day. AHRI (AHRI 2009a) applied a product pull down of
10°F with a loading ratio of 0.4 lb/ft3-day for the large freezer and 3.1 lb/ft
3-day for the
small freezer. The pull-down temperature seems appropriate, but to make the loading ratio
more consistent these values will be modified to 0.5 lb/ft3-day for the large freezer and 1.0
lb/ft3-day for the small freezer.

351
Table 125. Product Loading for Walk-in Freezers
Product Loading for Walk-in Freezers (1 of 7)
Product Type Product
Pull-Down
Temp Diff.
(°F)
Product Loading Daily Loading Ratio
(lbs of product per
ft3–day of
refrigerated space)
Range 0 to 130 0.16 to 2.47
Average 19.7 0.67
Proposed Fruits and Vegetables (100%
packaged)
10 1 sm, 0.5 lrg
(AHRI 2009a) Fruits and Vegetables 10 1,600/8 lb per hour from 6:00am to
2:00pm (sm); 20,000/8 lb per hour
from 6:00am to 2:00pm (lrg)
3.1 sm, 0.4 lrg

352
Product Loading for Walk-in Freezers (2 of 7)
Product Type Product
Pull-Down
Temp Diff.
(°F)
Product Loading Daily Loading Ratio
(lbs of product per
ft3–day of
refrigerated space)
(Altwies 1998) 64 ft3 heavy duty cardboard
boxes lined with a plastic
vapor barrier (A, B, C); 1 lb
retail packaged bags/boxes
(D) packed in small 2' x 1' x 1'
cardboard boxes arranged on
4' x 4' x 8' pallets; 86.7% of
Bulk Storage: 4.2% Baby
Lima Beans, 2.8% Broccoli,
10.7% Carrots, 39.1% Corn
(cut and cob), 10.3% Green
Beans, 19.6% Peas; 56.4% of
Cased Storage: 3.5%
Broccoli, 3.3% Carrots,
23.9% Corn (cut and cob),
10.8% Green Beans, 15.0%
Peas
(Altwies and
Reindl
1999)
Product stored in 64 ft3
cardboard boxes
10 50 million lb capacity for warehouses
A through D; Product-to-Air volume
ratio: 0.525 (A and B), 0.694 (C),
0.296 (D)
(Anonymous
2004)
28 lbs of solid food per 1 ft3 of open
storage area
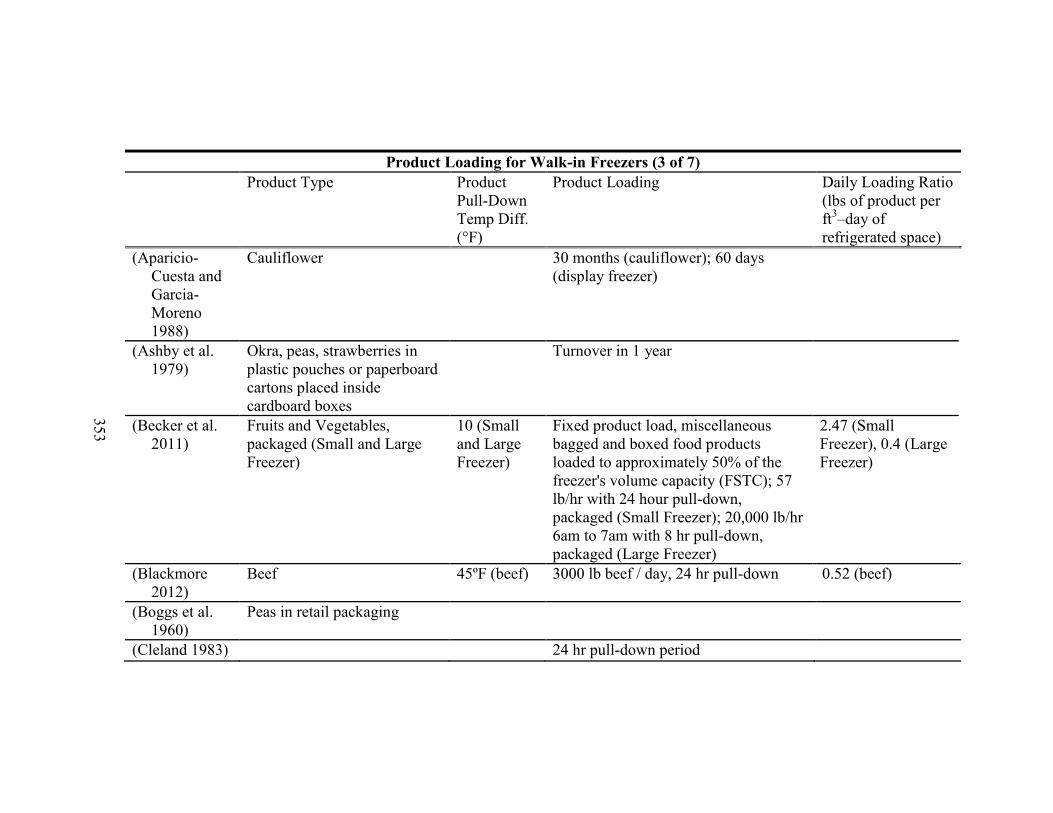
353
Product Loading for Walk-in Freezers (3 of 7)
Product Type Product
Pull-Down
Temp Diff.
(°F)
Product Loading Daily Loading Ratio
(lbs of product per
ft3–day of
refrigerated space)
(Aparicio-
Cuesta and
Garcia-
Moreno
1988)
Cauliflower 30 months (cauliflower); 60 days
(display freezer)
(Ashby et al.
1979)
Okra, peas, strawberries in
plastic pouches or paperboard
cartons placed inside
cardboard boxes
Turnover in 1 year
(Becker et al.
2011)
Fruits and Vegetables,
packaged (Small and Large
Freezer)
10 (Small
and Large
Freezer)
Fixed product load, miscellaneous
bagged and boxed food products
loaded to approximately 50% of the
freezer's volume capacity (FSTC); 57
lb/hr with 24 hour pull-down,
packaged (Small Freezer); 20,000 lb/hr
6am to 7am with 8 hr pull-down,
packaged (Large Freezer)
2.47 (Small
Freezer), 0.4 (Large
Freezer)
(Blackmore
2012)
Beef 45ºF (beef) 3000 lb beef / day, 24 hr pull-down 0.52 (beef)
(Boggs et al.
1960)
Peas in retail packaging
(Cleland 1983) 24 hr pull-down period
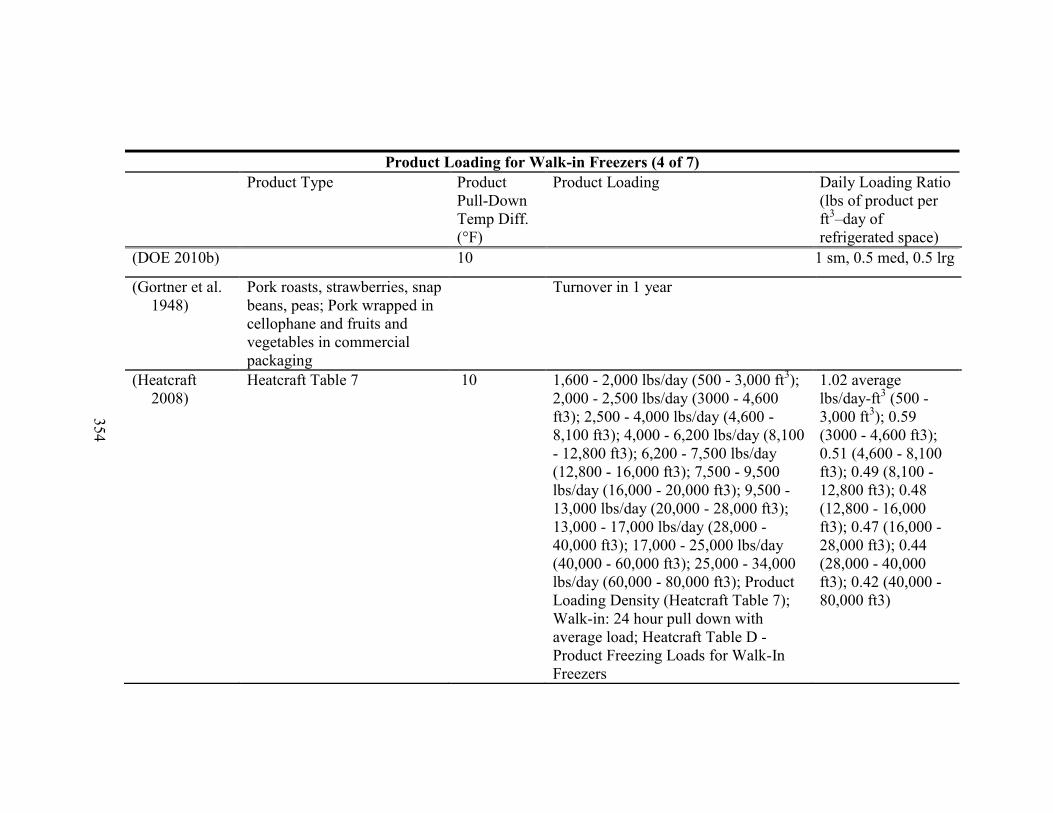
354
Product Loading for Walk-in Freezers (4 of 7)
Product Type Product
Pull-Down
Temp Diff.
(°F)
Product Loading Daily Loading Ratio
(lbs of product per
ft3–day of
refrigerated space)
(DOE 2010b) 10 1 sm, 0.5 med, 0.5 lrg
(Gortner et al.
1948)
Pork roasts, strawberries, snap
beans, peas; Pork wrapped in
cellophane and fruits and
vegetables in commercial
packaging
Turnover in 1 year
(Heatcraft
2008)
Heatcraft Table 7 10 1,600 - 2,000 lbs/day (500 - 3,000 ft3);
2,000 - 2,500 lbs/day (3000 - 4,600
ft3); 2,500 - 4,000 lbs/day (4,600 -
8,100 ft3); 4,000 - 6,200 lbs/day (8,100
- 12,800 ft3); 6,200 - 7,500 lbs/day
(12,800 - 16,000 ft3); 7,500 - 9,500
lbs/day (16,000 - 20,000 ft3); 9,500 -
13,000 lbs/day (20,000 - 28,000 ft3);
13,000 - 17,000 lbs/day (28,000 -
40,000 ft3); 17,000 - 25,000 lbs/day
(40,000 - 60,000 ft3); 25,000 - 34,000
lbs/day (60,000 - 80,000 ft3); Product
Loading Density (Heatcraft Table 7);
Walk-in: 24 hour pull down with
average load; Heatcraft Table D -
Product Freezing Loads for Walk-In
Freezers
1.02 average
lbs/day-ft3 (500 -
3,000 ft3); 0.59
(3000 - 4,600 ft3);
0.51 (4,600 - 8,100
ft3); 0.49 (8,100 -
12,800 ft3); 0.48
(12,800 - 16,000
ft3); 0.47 (16,000 -
28,000 ft3); 0.44
(28,000 - 40,000
ft3); 0.42 (40,000 -
80,000 ft3)

355
Product Loading for Walk-in Freezers (5 of 7)
Product Type Product
Pull-Down
Temp Diff.
(°F)
Product Loading Daily Loading Ratio
(lbs of product per
ft3–day of
refrigerated space)
(Henderson
and Khattar
1999)
Meat
(Hustrulid and
Winters
1943)
Snap beans, corn, peas,
strawberries, raspberries,
cantaloupe; 6 - 9 months
6 month minimum turnover period; 12
to 24 hour pull-down
(Krack 1977) Fish, ice cream 55 (Pull-
down); 0 to
130 (Krack
Table 42)
Blast freezer cools product in 2 hrs.
Product packaged, boxed, and
palletized requires 16 hrs to cool. Chill
factors utilized to compensate for the
non-uniform distribution of product
load. The later portion of the chill is
15-25% of the peak. 2000 lb fish/day
(Pull-down, 16 hr pull-down period,
45.6% of load); 3.3 gal/ft2 * 900
ft2/day (Ice cream, 10 hr pull-down
period, 86.4% of load); Average
product loads: 0.19 to 0.45 Btu/hr-ft3
(30,000 to 250 ft3, 0.25 Btu/hr-ft3
average); Krack Table 42 (specific
product loads)

356
Product Loading for Walk-in Freezers (6 of 7)
Product Type Product
Pull-Down
Temp Diff.
(°F)
Product Loading Daily Loading Ratio
(lbs of product per
ft3–day of
refrigerated space)
(Magoo 2003) Meat, fish, poultry, fruit juices,
processed and canned foods, ice cream,
seasonal agricultural crops
(Manske 1999) 0 None. Assuming product arrives at
storage temperature.
(Morris 2012) Meat 50 (meat) 1000 lb meat / day 0.156 (meat)
(Nagaraju et al.
2001)
Fish 0.9°F per
hour
22,046 lb
(Navy 1986) Film, packaged products,
meat, fish, poultry, ice cream,
vegetables, ice, medical
18 to 24 hrs pull-down time
(Goetzler et al.
2009)
Frozen food
(Patel et al.
1993)
0 Minimal; Typically fresh and frozen
products are received at storage
temperature.
(PG&E 2007) Ice cream and holding
freezers
(SCE 2008) Proposed: 70% of capacity; 57,120
Btu/hr (sm), 113,400 Btu/hr, 226,800
Btu/hr, 633,360 Btu/hr (lrg)
(Stoeckle
2000)
Peas (Altwies 1998) Occupies 43% of floor area using static
pallet rack installation

357
Product Loading for Walk-in Freezers (7 of 7)
Product Type Product
Pull-Down
Temp Diff.
(°F)
Product Loading Daily Loading Ratio
(lbs of product per
ft3–day of
refrigerated space)
(Stoeckle et al.
2002)
Frozen peas (Altwies and
Reindl 1999)
Product is assumed to arrive at storage
temperature
(USDA 2010) Usable percentages: 57.59 min state
ave, 91.85 max state ave, 81.62 median
state ave, 81.70 average overall
(Walker and
Baxter
2002)
Meat, bakery, fish, deli, ice
cream
(Woodroof and
Shelor
1947)
3-lb metal cans of raspberries,
1-lb waxed cartons of
peaches, 10-lb moisture-proof
bags in corrugated boxes of
strawberries and blackberries
Turnover in 1 year

358
Table 126. Product Sensible and Latent Thermal Properties for Walk-in Freezers
Product Sensible and Latent Thermal Properties for Walk-in Freezers (1 of 2)
Specific Heat Above
Freezing (Btu/lb-F)
High Freezing Point
(°F)
Latent Heat of Freezing
(Btu/lb)
Specific Heat Below
Freezing (Btu/lb-F)
Range 0.74 to 0.98 27 to 31 79 to 130 0.37 to 0.47
Average 0.84 29.3 101.3 0.44
Proposed 0.5
(AHRI 2009a) 0.5 0.5
(Altwies and Reindl
1999)
0.401 (Baby lima
beans), 0.471
(broccoli), 0.465
(carrots), 0.423 (corn,
peas), 0.468 (green
beans)
(Becker et al. 2011) 0.47 (Small and Large
Freezer)
(Blackmore 2012) 115 (Fresh Game), 95
(Beef), 79 (Turkey)
(DOE 2010b) 0.45
(Heatcraft 2008)
Estimate Spec. Heat =
0.20 + (0.008 X %
water); Heatcraft Table
7
Heatcraft Table 7 Estimate Latent Heat =
143.3 X % water; Table
7
Estimate Spec. Heat =
0.20 + (0.008 X %
water); Heatcraft
Table 7
(Krack 1977) Krack Table 9

359
Product Sensible and Latent Thermal Properties for Walk-in Freezers (2 of 2)
Specific Heat Above
Freezing (Btu/lb-F)
High Freezing Point
(°F)
Latent Heat of Freezing
(Btu/lb)
Specific Heat Below
Freezing (Btu/lb-F)
(Nagaraju et al. 2001) 0.435
(Stoecker 1998) .902 (apples); .843
(chicken); .792 (peas);
.735 (ham, sirloin
beef); .783 (salmon);
.938 (strawberries)
30 (apples); 27
(chicken); 31 (peas); 29
(ham); 28 (salmon); 31
(strawberries
121 (apples); 107
(chicken, peas); 81
(ham, sirloin beef); 92
(salmon); 130
(strawberries)
.453 (apples); .423
(chicken, peas); .368
(ham, sirloin beef);
.392 (salmon); .471
(strawberries)
(Stoeckle et al. 2002) 0.442
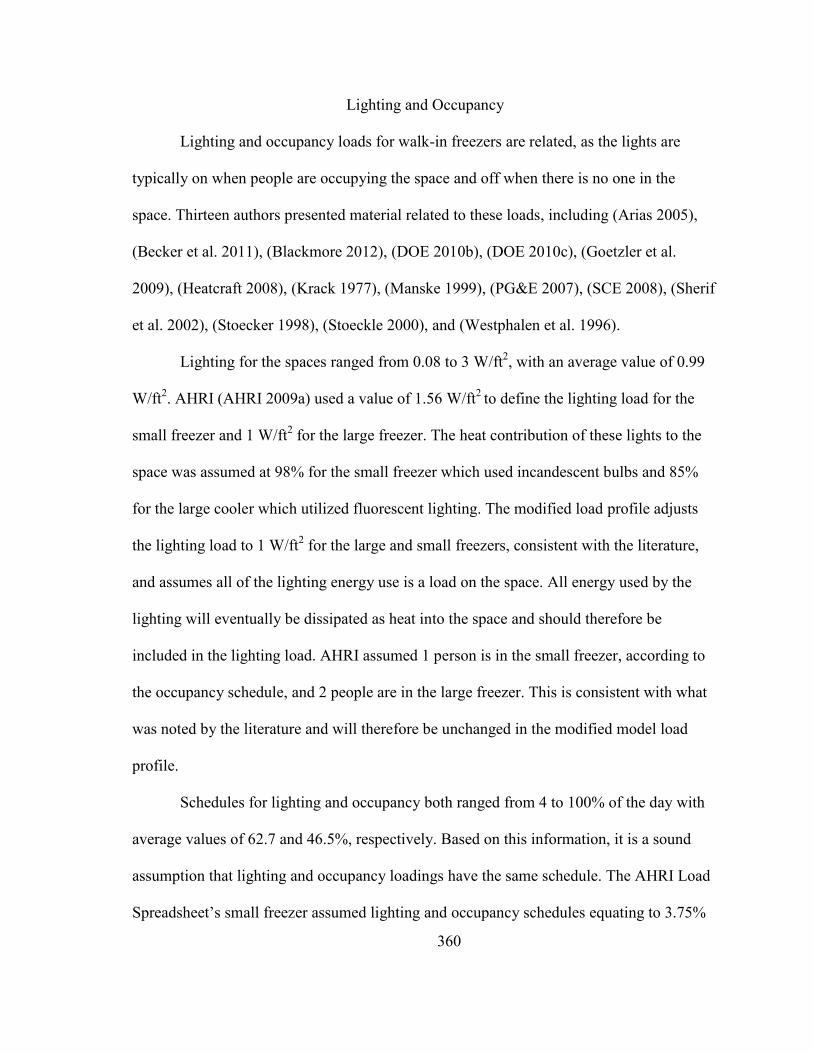
360
Lighting and Occupancy
Lighting and occupancy loads for walk-in freezers are related, as the lights are
typically on when people are occupying the space and off when there is no one in the
space. Thirteen authors presented material related to these loads, including (Arias 2005),
(Becker et al. 2011), (Blackmore 2012), (DOE 2010b), (DOE 2010c), (Goetzler et al.
2009), (Heatcraft 2008), (Krack 1977), (Manske 1999), (PG&E 2007), (SCE 2008), (Sherif
et al. 2002), (Stoecker 1998), (Stoeckle 2000), and (Westphalen et al. 1996).
Lighting for the spaces ranged from 0.08 to 3 W/ft2, with an average value of 0.99
W/ft2. AHRI (AHRI 2009a) used a value of 1.56 W/ft
2 to define the lighting load for the
small freezer and 1 W/ft2 for the large freezer. The heat contribution of these lights to the
space was assumed at 98% for the small freezer which used incandescent bulbs and 85%
for the large cooler which utilized fluorescent lighting. The modified load profile adjusts
the lighting load to 1 W/ft2 for the large and small freezers, consistent with the literature,
and assumes all of the lighting energy use is a load on the space. All energy used by the
lighting will eventually be dissipated as heat into the space and should therefore be
included in the lighting load. AHRI assumed 1 person is in the small freezer, according to
the occupancy schedule, and 2 people are in the large freezer. This is consistent with what
was noted by the literature and will therefore be unchanged in the modified model load
profile.
Schedules for lighting and occupancy both ranged from 4 to 100% of the day with
average values of 62.7 and 46.5%, respectively. Based on this information, it is a sound
assumption that lighting and occupancy loadings have the same schedule. The AHRI Load
Spreadsheet‟s small freezer assumed lighting and occupancy schedules equating to 3.75%

361
of the time. The large freezer was occupied with the lights on for 10.42% of the time. Both
of these schedules are grossly insufficient when compared to the literature. The proposed
model load will use occupancy and lighting schedules equating to 20 and 30% of the time,
respectively. As discussed for walk-in coolers, the typical loading schedule defined by the
literature of around 50% is not used because there is some ambiguity as to whether the
percentage applies to the entire day, normal business hours, or over some other partial day
period.

362
Table 127. Lighting and Occupancy Load Details for Walk-in Freezers
Lighting and Occupancy Load Details for Walk-in Freezers (1 of 4)
Lighting Power Lighting Schedule Occupancy (number
of people)
Occupancy time Occupancy Load
(W)
Range 0.08 to 3 W/ft2 4 to 100% of time 69.9 to 25,000
ft3/person
4 to 100% of time
Average 0.99 W/ft2 62.7% of time 20,845 ft
3/person 46.5% of time
Proposed 1 W/ft
2 30% of time 1 person (sm), 2
people (lrg)
20% of time
(AHRI
2009a)
1.56 W/ft2 sm, 1
W/ft2 lrg (Light
Power Converted
to Heat: 98% sm,
85% lrg)
30 minutes per hour
– 6am to 7am,
2 minutes per hour –
7am to 7pm (sm);
30 minutes per hour
– 6am to 7am,
10 minutes per hour
– 7am to 7pm (lrg)
1 person – 6am to
7pm (sm); 2 people
– 6am to 7pm (lrg)
30 minutes per hour
– 6am to 7am,
2 minutes per hour –
7am to 7pm (sm);
30 minutes per hour
– 6am to 7am,
10 minutes per hour
– 7am to 7pm (lrg)
(Arias 2005) 1.39 W/ft2 200 W per person
(Becker et al.
2011)
1.43 W/ft2
(FSTC); 1 W/ft2
(Small and Large
Freezer)
6 min/hr 8am to 6pm
(Small Freezer); 30
min/hr 6am to 7am,
10 min/hr 7am to
7pm (Large Freezer)
1 person (Small
Freezer); 2 people
(Large Freezer)
6 min/hr 8am to 6pm
(Small Freezer); 30
min/hr 6am to 7am
and 10 min/hr 7am
to 7pm (Large
Freezer)
80.6 W/person
latent, 80.6
W/person sensible
(Small Freezer);
410.3 W/person
(Large Freezer)

363
Lighting and Occupancy Load Details for Walk-in Freezers (2 of 4)
Lighting Power Lighting Schedule Occupancy (number
of people)
Occupancy time Occupancy Load
(W)
(Blackmore
2012)
1 to 1.5 W/ft2
(normal storage),
2.5 to 3 W/ft2
(docks,
workrooms)
4 person / 100,000
ft3
(DOE 2010b) 0.31 W/ft2 sm;
0.08 W/ft2 med;
0.09 W/ft2 lrg
(DOE 2010c) On 75% of time (no
control), 50% of
time (timers or auto
shut-off)
(Goetzler et
al. 2009)
0.93 W/ft2;
Typical: 1 W/ft2
Incandescent (0.9
to 1.2 W/ft2)
Operate 50% of the
time
50% of the time
(Heatcraft
2008)
1 to 1.5 W/ft2.
Cutting or
processing rooms
can be double to
wattage.
1 person per 24
hours for each
25,000 ft3
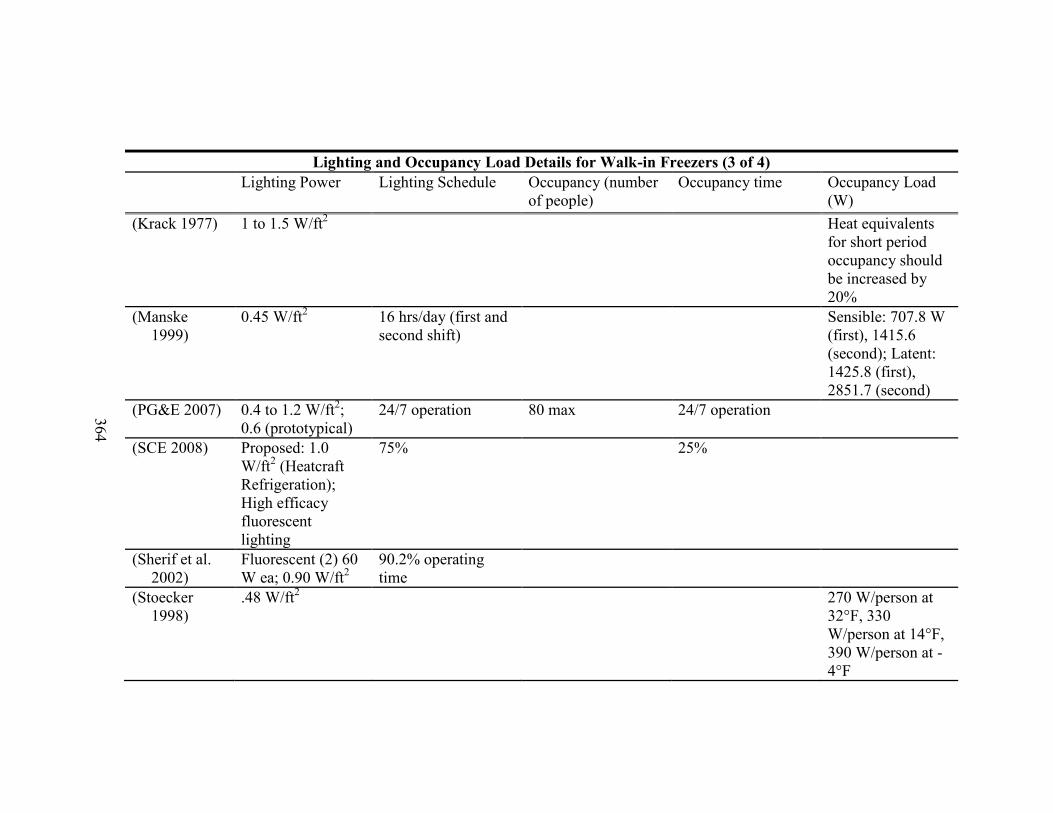
364
Lighting and Occupancy Load Details for Walk-in Freezers (3 of 4)
Lighting Power Lighting Schedule Occupancy (number
of people)
Occupancy time Occupancy Load
(W)
(Krack 1977) 1 to 1.5 W/ft2 Heat equivalents
for short period
occupancy should
be increased by
20%
(Manske
1999)
0.45 W/ft2 16 hrs/day (first and
second shift)
Sensible: 707.8 W
(first), 1415.6
(second); Latent:
1425.8 (first),
2851.7 (second)
(PG&E 2007) 0.4 to 1.2 W/ft2;
0.6 (prototypical)
24/7 operation 80 max 24/7 operation
(SCE 2008) Proposed: 1.0
W/ft2 (Heatcraft
Refrigeration);
High efficacy
fluorescent
lighting
75% 25%
(Sherif et al.
2002)
Fluorescent (2) 60
W ea; 0.90 W/ft2
90.2% operating
time
(Stoecker
1998)
.48 W/ft2 270 W/person at
32°F, 330
W/person at 14°F,
390 W/person at -
4°F

365
Lighting and Occupancy Load Details for Walk-in Freezers (4 of 4)
Lighting Power Lighting Schedule Occupancy (number
of people)
Occupancy time Occupancy Load
(W)
(Stoeckle
2000)
0.45 W/ft2 7920 W
(Westphalen
et al. 1996)
0.9 to 1.0 W/ft2;
Incandescent; 1
W/ft2
(prototypical)
On when occupied
by employees. 50%
of time.
50% of the time
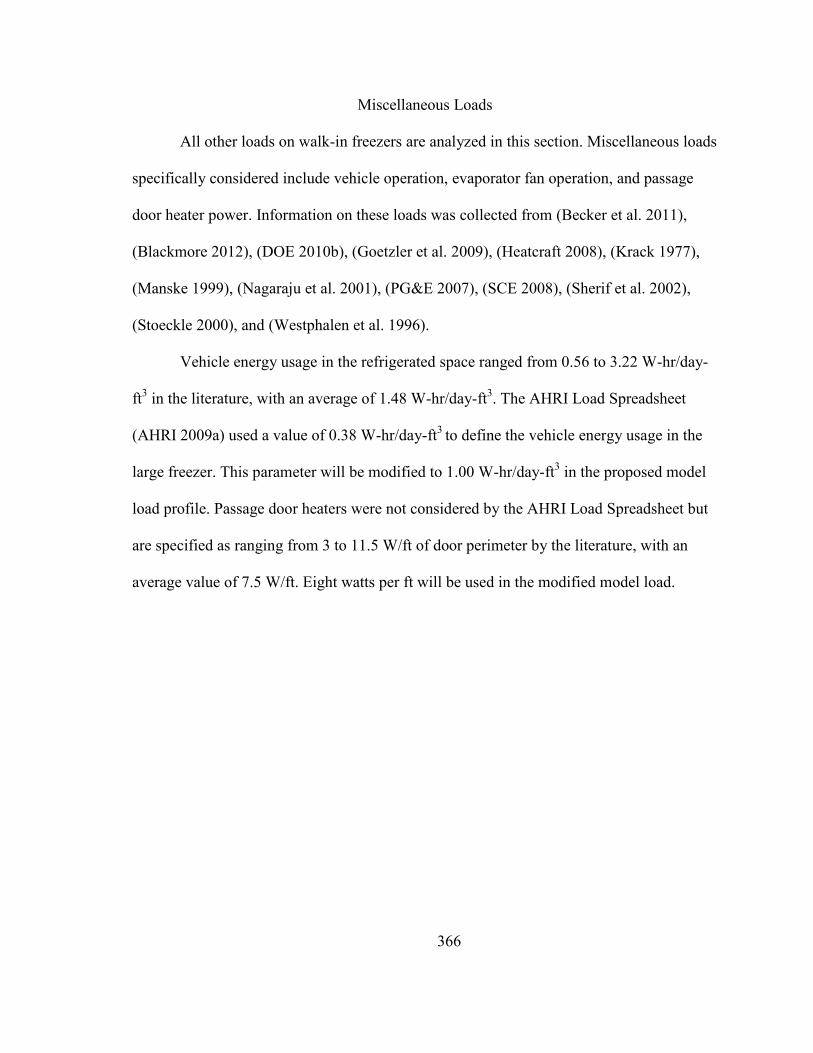
366
Miscellaneous Loads
All other loads on walk-in freezers are analyzed in this section. Miscellaneous loads
specifically considered include vehicle operation, evaporator fan operation, and passage
door heater power. Information on these loads was collected from (Becker et al. 2011),
(Blackmore 2012), (DOE 2010b), (Goetzler et al. 2009), (Heatcraft 2008), (Krack 1977),
(Manske 1999), (Nagaraju et al. 2001), (PG&E 2007), (SCE 2008), (Sherif et al. 2002),
(Stoeckle 2000), and (Westphalen et al. 1996).
Vehicle energy usage in the refrigerated space ranged from 0.56 to 3.22 W-hr/day-
ft3 in the literature, with an average of 1.48 W-hr/day-ft
3. The AHRI Load Spreadsheet
(AHRI 2009a) used a value of 0.38 W-hr/day-ft3
to define the vehicle energy usage in the
large freezer. This parameter will be modified to 1.00 W-hr/day-ft3 in the proposed model
load profile. Passage door heaters were not considered by the AHRI Load Spreadsheet but
are specified as ranging from 3 to 11.5 W/ft of door perimeter by the literature, with an
average value of 7.5 W/ft. Eight watts per ft will be used in the modified model load.

367
Table 128. Miscellaneous Load Details for Walk-in Freezers
Miscellaneous Load Details for Walk-in Freezers (1 of 3)
Number of
Vehicles
Vehicle Energy Usage Evaporator
Fan Operation
Passage Door
Heater Power
Miscellaneous Heat
Load
Range 0.56 to 3.22 W-hr/day-ft3 3 to 11.5 W/ft 23 to 45,700 W
Average 1.48 W-hr/day-ft3 7.5 W/ft 10,446 W
Proposed 1.00 W-hr/day-ft
3 (lrg) 8 W/ft
(AHRI 2009a) 0 sm, 1 lrg 0 sm; 37.3 kW at 30 minutes
per hour – 6am to 7am (lrg)
(Becker et al.
2011)
1 (Large Freezer) 0.746 W-hr/day-ft3 (Large
Freezer)
always on
(Blackmore
2012)
5.97 kW/100,000 ft3; 2.98 to
3.73 kW per forklift
(DOE 2010b) 8 W/ft; 24
hrs/day
2-way Pressure
Relief Valve
Heater: 23 W, 24 hr
operation
(Goetzler et al.
2009)
230 W;
Always on
(Heatcraft 2008) Generally only
battery operated
lift trucks used; 1
motor horsepower
for each 12,500 ft3
of storage.
2.3 to 4.4 kW over the period
of operation; Heatcraft Table
14 - Heat gain due to
operation of battery operated
lift truck
Heatcraft Table 11 -
Heat Equivalency of
Motors

368
Miscellaneous Load Details for Walk-in Freezers (2 of 3)
Number of
Vehicles
Vehicle Energy Usage Evaporator
Fan Operation
Passage Door
Heater Power
Miscellaneous Heat
Load
(Krack 1977) Forklifts may be estimated at
3.0 to 3.7 kW; 40 min/hr
operating time
(Manske 1999) 17.3 kW (first); 34.6 (second) cycle with
load
35.2 kW (warming
room load on
freezer) typical,
45.7 kW during
June to Sept
(Nagaraju et al.
2001)
Varies 700 to 2350
W
(PG&E 2007) 0.7 W/ft2 (forklifts and
miscellaneous equipment)
(SCE 2008) Anti-sweat
(Sherif et al.
2002)
16 ft
Chromalox
per door; 3
W/ft at 40°F.
Assuming
50% of heat
enters the
freezer space;
24 hr/day
operation
10 kW Artificial
load generator
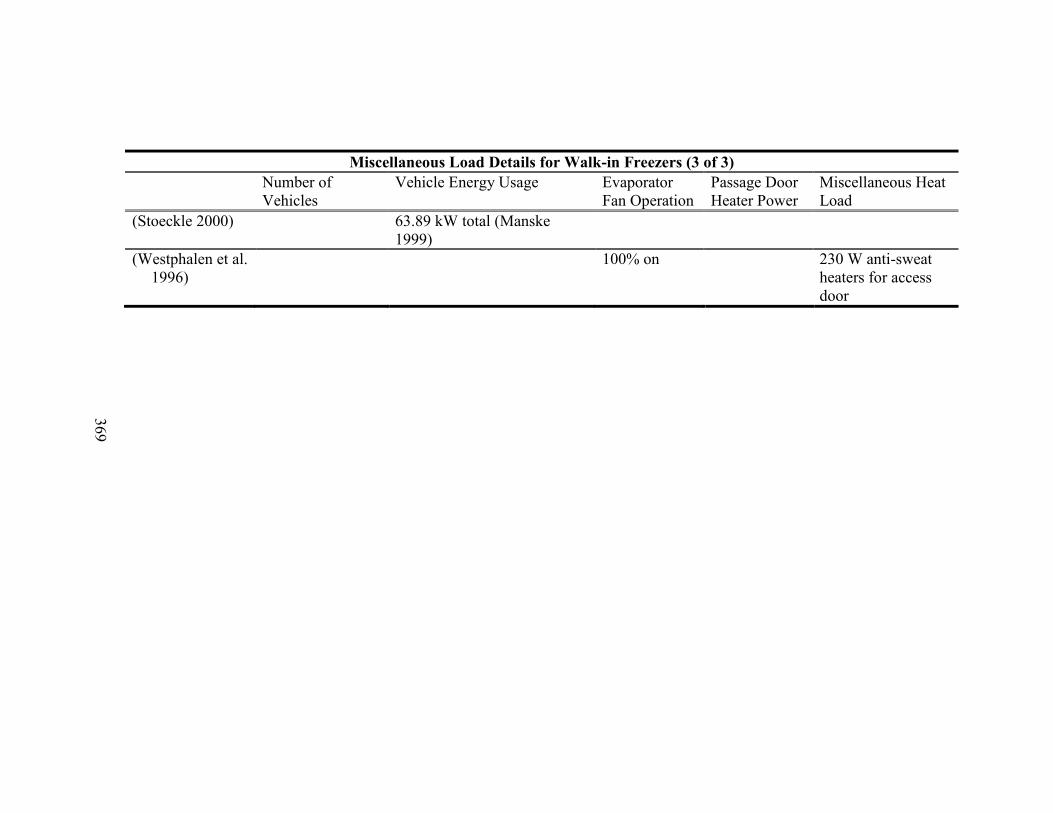
369
Miscellaneous Load Details for Walk-in Freezers (3 of 3)
Number of
Vehicles
Vehicle Energy Usage Evaporator
Fan Operation
Passage Door
Heater Power
Miscellaneous Heat
Load
(Stoeckle 2000) 63.89 kW total (Manske
1999)
(Westphalen et al.
1996)
100% on 230 W anti-sweat
heaters for access
door

370
Defrost
An effective defrost method is necessary for adequate space cooling. Because of the
effect of this component on the refrigeration system, numerous authors have done research
or presented practical information on defrost systems, including (Becker et al. 2011), (DOE
2010b), (Goetzler et al. 2009), (Heatcraft 2008), (Henderson and Khattar 1999), (Krack
1977), (Mago and Sherif 2005), (Manske 1999), (Nelson 2011), (SCE 2009), (Stoecker
1998), (Stoeckle 2000), (Walker et al. 1990), (Walker 1992), (Walker 2001), and
(Westphalen et al. 1996). According to the literature the most prevalent defrost system for
freezers is hot gas, with electric element defrost as the second most utilized.
Electric defrost systems use anywhere from 1.3 to 34.5 W/ft2 according to the
literature, with an average value of 17.8 W/ft2. Defrost schedules range from 1 to 4.8 times
per day, with a total defrost period ranging from 0.5 to 6 hr/day. The average defrost
schedule was 2.4 times/day at 1.7 hr/day. Based on this information, a defrost schedule of 2
times per day at 1 hr per defrost cycle (2 hr/day) will be applied to the AWEF calculation.

371
Table 129. Defrost Details for Walk-in Freezers
Defrost Details for Walk-in Freezers (1 of 5)
Defrost Type Electric
Defrost +
Drain-down
Heater Power
Defrost Heat Space
Load (Btu/h)
Defrost
Efficiency
Defrost Schedule
Range 1.3 to 34.5
W/ft2
1 to 4.8 times per day; 0.5 to 6 hr/day
Average 17.8 W/ft2 2.4 times per day; 1.7 hr/day
Proposed 2 times per day; 2 hr/day
(AHRI
2009a)
(Becker et al.
2011)
Electric
(FSTC)
90 W (FSTC) 3 cycles per day at 37.8 min / cycle
(Chili's Food Freezer)
(DOE 2010b)
1.656 kW
(sm); 2.756
(lrg)
1 hr / day runtime (15 minute cycles, 4
times per day)
(Goetzler et
al. 2009)
25 W/ft2
(typical);
Baseline: 1500
W Defrost,
500 W Pan
Time Initiated/ Temperature
Terminated; 4% of the time; 60 min
every 24 hrs
(Heatcraft
2008)
Electric, hot
gas
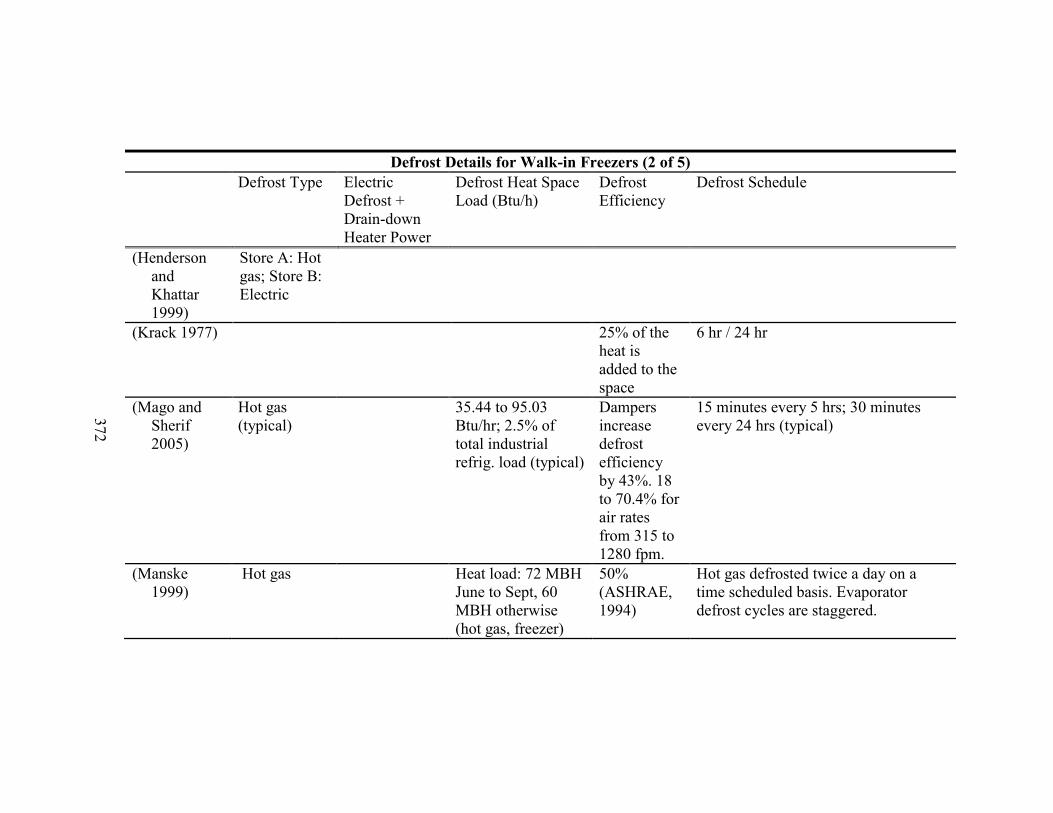
372
Defrost Details for Walk-in Freezers (2 of 5)
Defrost Type Electric
Defrost +
Drain-down
Heater Power
Defrost Heat Space
Load (Btu/h)
Defrost
Efficiency
Defrost Schedule
(Henderson
and
Khattar
1999)
Store A: Hot
gas; Store B:
Electric
(Krack 1977) 25% of the
heat is
added to the
space
6 hr / 24 hr
(Mago and
Sherif
2005)
Hot gas
(typical)
35.44 to 95.03
Btu/hr; 2.5% of
total industrial
refrig. load (typical)
Dampers
increase
defrost
efficiency
by 43%. 18
to 70.4% for
air rates
from 315 to
1280 fpm.
15 minutes every 5 hrs; 30 minutes
every 24 hrs (typical)
(Manske
1999)
Hot gas Heat load: 72 MBH
June to Sept, 60
MBH otherwise
(hot gas, freezer)
50%
(ASHRAE,
1994)
Hot gas defrosted twice a day on a
time scheduled basis. Evaporator
defrost cycles are staggered.

373
Defrost Details for Walk-in Freezers (3 of 5)
Defrost Type Electric
Defrost +
Drain-down
Heater Power
Defrost Heat Space
Load (Btu/h)
Defrost
Efficiency
Defrost Schedule
(Nelson
2011)
Types
include:
water,
electric, hot
gas - with hot
gas being the
preferred
method
15 - 20% to melt ice,
60% lost to room via
convection/radiation,
20% required to heat
and cool the metal of
the evaporator, and
5% lost due to hot
gas bypassing the
defrost regulator at
the end of the
defrost (Cole 1989).
-10F room: 63% lost
to room, 17% melt
frost, 19% heat and
cool metal, and 2%
warm melt
max
theoretical
defrost
efficiency:
60 to 70%
(Cole 1989);
Examples:
17% (3),
11%, 28%
(2), 44%,
34%, 29%,
17% (-10F
room); 14%
(-30F room
typical);
18% (0F
room
typical)
Typical: 30 minutes, Optimized: 8 to
10 minutes
(SCE 2009) Electric 4 times per day (typical)
(Stoecker
1998)
Hot gas,
water, or
electric
4% of refrigeration
load (typical)
20% (hot
gas)
Twice a day 20 minutes each

374
Defrost Details for Walk-in Freezers (4 of 5)
Defrost Type Electric
Defrost +
Drain-down
Heater Power
Defrost Heat Space
Load (Btu/h)
Defrost
Efficiency
Defrost Schedule
(Stoeckle
2000)
20% (Jekel
and Reindl
2000)
(Walker et al.
1990)
Electric, hot
gas
Conventional Low Temp Electric: 48
min at 00:30 (#8); 56 min at 05:00
(#1); 60 min at 01:30 (#4); 60 min at
03:30 (#5); 25 min at 02:00, 10:00, an
18:00 (#18); 50 min at 00:00, 06:00,
12:00, 18:00 (#21); Multiplex Low
Temp Hot Gas: 34 min at 23:30 (#8);
30 min at 03:30 (#7); 40 min at 00:30
(#4); 40 min at 02:30 (#5); Low Temp
Electric: 60 min at 22:30 (#A8); 60
min at 03:30 (#A7); 60 min at 00:30
(#A4); 60 min at 02:30 (#A5); 26 min
at 05:30, 13:30, 21:30 (#A18); 40 min
at 04:30, 10:30, 16:30, 22:30 (#A21)
(Walker
1992)
Electric

375
Defrost Details for Walk-in Freezers (5 of 5)
Defrost Type Electric
Defrost +
Drain-down
Heater Power
Defrost Heat Space
Load (Btu/h)
Defrost
Efficiency
Defrost Schedule
(Walker
2001)
Hot gas
(multiplex
and
distributed),
warm glycol
(secondary
loop)
(Westphalen
et al. 1996)
Electric; Time
Initiated /
Temperature
Terminated
25 W/ft2; 1500
W defrost, 500
W pan heater
time initiated,
temp
terminated
(prototypical)
4.2% duty cycle (60 min every 24 hrs)

376
Loading Summary
Following an in-depth analysis of literature related to the loads on walk-in freezers,
a proposed model load profile was developed. Some assumptions made by the AHRI Load
Spreadsheet (AHRI 2009a) were found to not correlate with information gathered from the
literature while other information seemed appropriate.
Walk-in freezer interior conditions were adjusted from -5°F/50% relative humidity
to -10°F/80% relative humidity to better match typical operating conditions. The box
dimensions and insulating value of the walls, ceiling, and floor were within reasonable
agreement with the literature and were therefore not changed. Conduction load components
that were changed include ground temperature (increased from 50 to 55°F) and convective
coefficients (0.5 h-ft2-°F/Btu for internal and external convection, 0.6 h-ft
2-°F/Btu for floor
convection).
The infiltration calculation used by AHRI (AHRI 2009a) is the same as used by a
majority of the researchers. The other component to determine the infiltration load is the
percentage of time that the doorway is open. Reviewing the literature, highlighted the fact
that the door open percentage was understated by AHRI, at 0.42% for the small freezer and
1.94% for the large freezer. The percentage was increased to 5.4% in the modified model
load.
The product load is determined from the amount of product loaded and the amount
of heat that must be removed from the product to reduce its temperature to the storage
temperature. The product pull-down temperature difference was not modified, but the
loading ratio was modified for the large and small freezers. AHRI used loading ratios of

377
0.4 lb/ft3-day for the large freezer and 3.1 lb/ft
3-day for the small freezer, but these were
modified to 0.5 lb/ft3-day for the large freezer and 1.0 lb/ft
3-day for the small freezer.
Lighting and occupancy loads are composed of a heat load and a schedule defining
when lights are on or when people occupy the space. The lighting heat load was only
modified for the small freezer from 1.56 W/ft2
to 1.0 W/ft2, to match typical lighting levels
and the lighting load for the large freezer. The modified model load assumes that all energy
used by the lighting is eventually converted to heat for the space, unlike AHRI which
assumed that only a portion of it was converted to heat. The number of people in the space
was kept consistent with the AHRI Load Spreadsheet at one person for the small freezer
and two for the larger freezer. The schedules for lighting and occupancy were defined by
the percentage of time that the heat load is applied. The AHRI occupancy and lighting
period was greatly increased from 3.75 and 10.42% for the small and large freezer,
respectively, to 20% for the occupancy period and 30% for the lighting period percentage.
Defrost load was not analyzed by the AHRI Load Spreadsheet but is analyzed by
this work for calculation of the AWEF. Defrost load is assumed to operate twice a day for 1
hr each time.
Miscellaneous loads include the heat generated by forklifts and passage door
heaters. Vehicle loads for the walk-in freezer were modified from an understated value of
0.38 W-hr/day-ft3
to 1.00 W-hr/day-ft3
in the proposed model load profile. Passage door
heaters were not considered by the AHRI Load Spreadsheet but will be assumed to be 8
W/ft of door perimeter by the proposed model load.
378
Summary
Following an in-depth literature search, information related to the model load
profile was compiled and analyzed for walk-in coolers and freezers. The range and average
of each component of the model load was compared to the value used by the AHRI Load
Spreadsheet (AHRI 2009a). If the values did not agree, adjustments were made for the
proposed model load profile.
Variations between the AHRI Load Spreadsheet and the proposed model load
include the consideration of convection, ground temperature, door open percentage, pounds
of product loaded per day, occupancy and lighting percentage, lighting power percentage
added to the refrigerated space, small walk-in lighting load, freezer interior conditions,
vehicle heat load, and the addition of a passage door heater load.

379
CHAPTER 5
DEVELOPMENT OF PROPOSED AHRI STANDARD 1250/1251 EQUATIONS
Following an extensive review and analysis of information found in literature
related to the loads seen by walk-in coolers and freezers, a proposed model load was
developed. Using the AHRI Load Spreadsheet (AHRI 2009a) as a starting point, a
modified calculation method was developed. Using proven methods, proposed AHRI
Standard 1250/1251 (AHRI 2009b; AHRI 2009c) box load equations were determined.
Modifications to Calculation Method
The AHRI Load Spreadsheet (AHRI 2009a) was used as a starting point to develop
the modified model load calculation. Variations in the basic calculations include more
precise values for air density and humidity content, infiltration sensible and latent heat load
calculations via Gosney Olama, addition of respiration load to coolers, modification of
lighting heat load calculation, and addition of door heaters
Approximate air densities and moisture levels are used by AHRI for the site and
box operating conditions. These values are used to calculate the infiltration sensible and
latent loads. The approximate density values are up to 3.5% different than the actual
density, and humidity varies by up to 73.9% from actual. To improve the accuracy of the
calculation, air density and humidity values were calculated using (Sugar_Engineers 2012)
which uses a calculation method based off (ASHRAE 1989).
The infiltration load calculation used by the AHRI Load Spreadsheet used three
main steps to arrive at sensible and latent loads. The infiltration rate was determined via
Gosney and Olama‟s infiltration equation (Equation 12), which is widely accepted as the
best correlation to actual infiltration flow. An infiltration lag factor of 2.5 seconds is

380
applied to each door opening to arrive at an equivalent open door period. To determine the
sensible and latent heat load components Equations 8 and 9 are applied, respectively.
CHsTTV
Fhrft
BtuQ
inf3
min1.1
(
(8)
CHLV
hrft
BtuQ
inf3
min5500
(
(9)
The constant equal to 1.1 in Equation 8 represents the product of air density, the
specific heat of air at constant pressure (Cp), and a conversion from minutes to hours. One
interesting thing to note is that when back calculated, using an excepted value of 0.24
Btu/lbm-ºF for the air specific heat, the air density that composes this constant is not equal
to the average of the box and surrounding approximated densities previously cited in the
load calculation but is 1.5 or 3.8% smaller, depending on whether the walk-in is operating
as a cooler or a freezer. To improve this calculation method, Equation 122 was utilized.
hr
CTTVQ CHpLHs
min60
2inf
( 122 )
The constant of 5500 utilized by Equation 9 is composed of a conversion from
minutes to hours and the quotient of the water vapor properties of enthalpy and specific
volume according to Equation 123. This equation is a fairly rough equation, as the values it
is assuming for specific enthalpy and volume are averaged for the refrigerated space
conditions and surrounding conditions.
hr
h
hrft
Btu
g
g min60
min5500
3
( 123 )

381
Instead of using Equation 9 to calculate the latent load, a method developed by
Gosney and Olama (Gosney and Olama 1975) and presented in Equations 124 and 125
was utilized.
s
CHmixCmixHL
Qhr
hhVQ
min
602
,,inf
( 124 )
1
hhmix ( 125 )
The product load calculated by the AHRI Load Spreadsheet (AHRI 2009a) was
only a sensible heat load. To allow calculation of the latent and sensible heat load due to
continuous respiration of products stored in walk-in coolers the usable storage space and
product heat of respiration as a function of temperature were added to the calculation set.
The latent product load is calculated according to Equation 126, where RT1 is a function of
the box temperature.
ppTprespFRmQ
11 ( 126 )
The lighting load calculation used in the AHRI Load Spreadsheet (AHRI 2009a) is
reduced to take into account different lighting efficiencies. According to the calculation,
incandescent lights convert 98% of this power into heat whereas fluorescent lights only
convert 85% into heat. To determine the refrigerated space lighting load, the lighting power
is reduced by 2% for incandescent bulbs and 15% for fluorescent. This approach was
altered in the modified calculation method, as all energy added to the space either as heat
or radiated light is eventually converted to heat which must be rejected from the
refrigerated space.

382
Passage door heaters are commonly used, as was identified through the literature
search. Calculation of the heat load added by passage door heaters was added to the
calculation method, based off wattage per linear foot of door heater.

383
Proposed Model Load Calculation Inputs
Based on the review and analysis of information gathered from the literature, the
model load inputs are summarized in Table 130, Table 131, and Table 132. This
information was put into a calculation spreadsheet to define the proposed model load
profiles for four walk-ins.
Table 130. Proposed Walk-in Cooler and Freezer Model Load Inputs
Proposed (AHRI 2009a) Average Range
Outdoor Ambient
Temperature (ºF)
80, 95, 110 80, 95, 110 81.8 35 to 122
Sun Loading Effect
on Roof Temp
8 hrs at
Amb + 20ºF
12 hrs at
Amb + 15ºF
Ambient +
33.2ºF
Ambient + 2 to
76ºF
Indoor Ambient
Temperature (ºF)
75 75 73.5 50 to 90
Indoor Ambient
Relative Hum (%)
50 50 49.6 30 to 65
Infiltration
Protection (%)
85 85
Reach-in Door
Quantity
0 0 18.5 3 to 76
Passage Door
Quantity
1 sm 1 sm 1.3 1 to 2
Freight Door
Quantity
1 lrg 1 lrg
Passage Door Width
(ft)
3 sm 4 sm 3.2 1.7 to 4.0
Passage Door Height
(ft)
7 sm 7 sm 6.4 5.2 to 7.9
Passage Door Glass
Area (ft2)
1.2 0.9 to 1.8
Freight Door Width
(ft)
6 lrg 6 lrg 8.6 4.5 to 14
Freight Door Height
(ft)
10 lrg 10 lrg 10.4 7.0 to 14
Door Construction Same as walls Same as walls Typically
same as walls

384
Table 131. Proposed Walk-in Cooler Model Load Inputs
Proposed Walk-in Cooler Model Load Inputs (1 of 2)
Proposed (AHRI 2009a) Average Range
Interior Box
Temperature (ºF)
35 35 38.6 0 to 86
Interior Relative
Humidity (%)
80 90 80.0 40 to 100
Box Width (ft) 8 sm
50 lrg
8 sm
50 lrg
14.9 5 to 50
Box Length (ft) 8 sm
50 lrg
8 sm
50 lrg
24.1 6 to 63
Box Height (ft) 8 sm
20 lrg
8 sm
20 lrg
12.0 6.6 to 32.8
Box Floor Area (ft2) 64 sm
2500 lrg
64 sm
2500 lrg
702.5 30 to 3000
Box Volume (ft3) 512 sm
50,000 lrg
512 sm
50,000 lrg
8863.7 7 to 89,841
Floor Heat Load
(Btu/hr-ft2)
1.28 0.6 3.29 0.97 to 8.61
Ground Temperature
(ºF)
55 50 57.6 40 to 80
Ceiling R-value
(h-ft2-°F/Btu)
25 25 28.4 7.9 to 60
Wall R-value
(h-ft2-°F/Btu)
25 25 23.9 7.9 to 42.5
Floor R-value
(h-ft2-°F/Btu)
15 25 14.0 On slab to 42.5
External Equivalent
Convective Film
Coefficient
(h-ft2-°F/Btu)
0.5 0.35 0.17 to 0.68
Internal Equivalent
Conv Film Coef
(h-ft2-°F/Btu)
0.5 0.52 0.25 to 0.68
Floor Equivalent
Conv Film Coef
(h-ft2-°F/Btu)
0.6 0.70 0.61 to 0.87
Infiltration Flow
Calc Method
(Gosney and
Olama 1975)
(Gosney and
Olama 1975)
(Gosney and
Olama 1975)
most accepted
Open Door
Percentage (%)
5.4 1.18 sm
2.78 lrg
12.7 1.3 to 100

385
Proposed Walk-in Cooler Model Load Inputs (2 of 2)
Proposed (AHRI 2009a) Average Range
Number of Door
Openings / day
156 54 sm
80 lrg
174.2 9.3 to 960
Duration of Each
Door Opening (s)
30 18.9 sm
30 lrg
75.9 8.8 to 316.5
Product Pull-down
Temperature (°F)
10 10 23.8 0 to 68
Product Pull-down
Period (hrs)
24 8 115.7 8 to 720
Daily Loading Ratio
(lb/ft3 walk-in)
4.0 sm
1.8 lrg
12.11 sm
1.60 lrg
1.91 1.23 to 4.06
Product Spec Heat
Above Freezing
(Btu/lb-°F)
0.9 0.9 0.80 0.50 to 0.91
Product Respiration
Coef. at 35°F
(Btu/lb-hr)
0.0292 0.0583 0.0147 to
0.3797
Percentage Product
Vapor-Barrier
Packaged (%)
50
Lighting Power
(W/ft2)
1.00 1.56 sm
1.00 lrg
1.50 0.08 to 9.83
Percentage of Light
Power Impacting
Heat Load (%)
100 98 sm
85 lrg
Lights On
Percentage (%)
30 3.75 sm
12.5 lrg
54.7 4 to 100
People in Space 1 sm
2 lrg
1 sm
2 lrg
1.5 1 to 2
Occupancy
Percentage (%)
20 5.83 sm
12.5 lrg
34.7 3 to 100
Vehicle Power (W-
hr/ft3-day)
1.00 lrg 0.75 lrg 0.59 0.08 to 1.12
Door Frame Heater
(W/ft)
8 11.5 8 to 15
Defrost Power
(W/ft2)
25.7 19.5 to 29.6
Defrost Frequency
(cycles per day)
2 3.0 0.8 to 8
Defrost Duration
(hr/day)
2 1.3 0.5 to 4

386
Table 132. Proposed Walk-in Freezer Model Load Inputs
Proposed Walk-in Freezer Model Load Inputs (1 of 2)
Proposed (AHRI 2009a) Average Range
Interior Box
Temperature (ºF)
-5 -10 -0.3 -40 to 32.4
Interior Relative
Humidity (%)
80 50 77.9 50 to 95
Box Width (ft) 8 sm
50 lrg
8 sm
50 lrg
13.3 5 to 50
Box Length (ft) 8 sm
50 lrg
8 sm
50 lrg
18.2 6 to 50
Box Height (ft) 8 sm
20 lrg
8 sm
20 lrg
11.4 6 to 69.6
Box Floor Area (ft2) 64 sm
2500 lrg
64 sm
2500 lrg
604.5 30 to 3000
Box Volume (ft3) 512 sm
50,000 lrg
512 sm
50,000 lrg
4677.1 7 to 50,000
Floor Heat Load
(Btu/hr-ft2)
2.34 1.88 3.08 1.86 to 5.56
Ground Temperature
(ºF)
55 50 56.2 40 to 79.7
Ceiling R-value
(h-ft2-°F/Btu)
32 32 33.0 16.7 to 50
Wall R-value
(h-ft2-°F/Btu)
28 32 28.0 3.3 to 83.3
Floor R-value
(h-ft2-°F/Btu)
25 32 25.1 On slab to 35.4
External Equivalent
Conv Film Coef
(h-ft2-°F/Btu)
0.5 0.42 0.17 to 0.68
Internal Equivalent
Conv Film Coef
(h-ft2-°F/Btu)
0.5 0.65 0.24 to 1.33
Floor Equivalent
Conv Film Coef
(h-ft2-°F/Btu)
0.6 0.70 0.61 to 0.87
Infiltration Flow
Calc Method
(Gosney and
Olama 1975)
(Gosney and
Olama 1975)
(Gosney and
Olama 1975)
most accepted
Open Door
Percentage (%)
5.4 0.42 sm
1.94 lrg
9.0 0.6 to 25.8
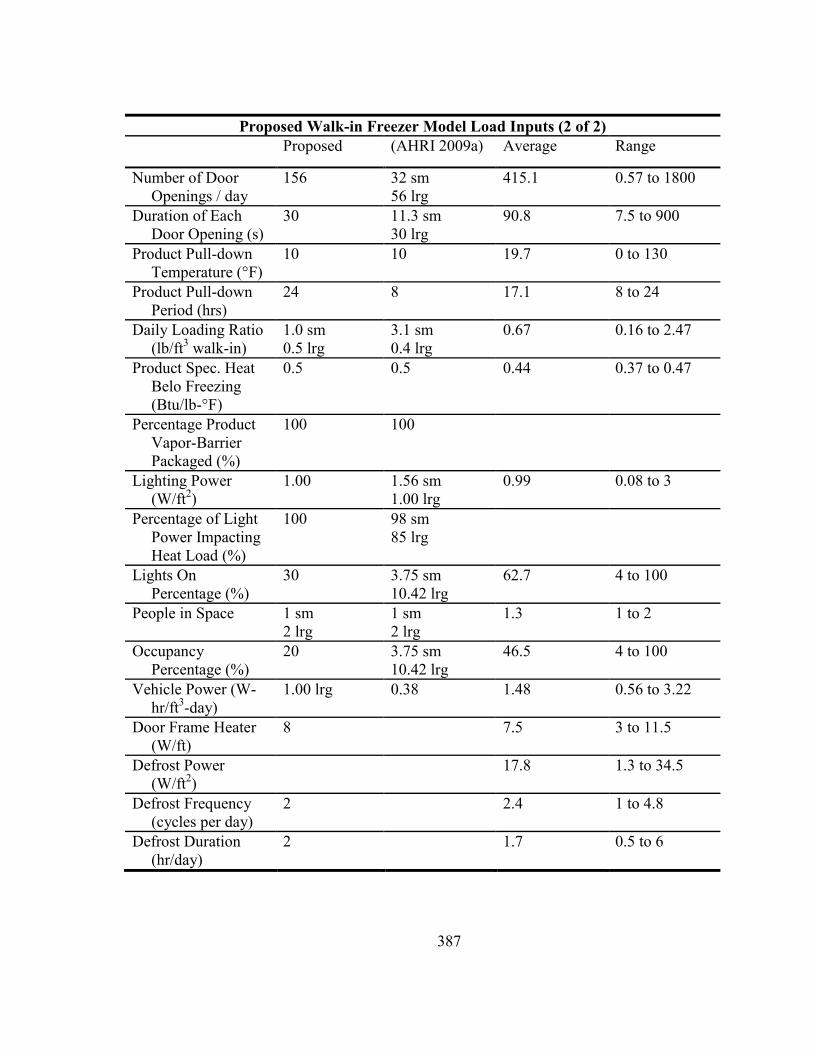
387
Proposed Walk-in Freezer Model Load Inputs (2 of 2)
Proposed (AHRI 2009a) Average Range
Number of Door
Openings / day
156 32 sm
56 lrg
415.1 0.57 to 1800
Duration of Each
Door Opening (s)
30 11.3 sm
30 lrg
90.8 7.5 to 900
Product Pull-down
Temperature (°F)
10 10 19.7 0 to 130
Product Pull-down
Period (hrs)
24 8 17.1 8 to 24
Daily Loading Ratio
(lb/ft3 walk-in)
1.0 sm
0.5 lrg
3.1 sm
0.4 lrg
0.67 0.16 to 2.47
Product Spec. Heat
Belo Freezing
(Btu/lb-°F)
0.5 0.5 0.44 0.37 to 0.47
Percentage Product
Vapor-Barrier
Packaged (%)
100 100
Lighting Power
(W/ft2)
1.00 1.56 sm
1.00 lrg
0.99 0.08 to 3
Percentage of Light
Power Impacting
Heat Load (%)
100 98 sm
85 lrg
Lights On
Percentage (%)
30 3.75 sm
10.42 lrg
62.7 4 to 100
People in Space 1 sm
2 lrg
1 sm
2 lrg
1.3 1 to 2
Occupancy
Percentage (%)
20 3.75 sm
10.42 lrg
46.5 4 to 100
Vehicle Power (W-
hr/ft3-day)
1.00 lrg 0.38 1.48 0.56 to 3.22
Door Frame Heater
(W/ft)
8 7.5 3 to 11.5
Defrost Power
(W/ft2)
17.8 1.3 to 34.5
Defrost Frequency
(cycles per day)
2 2.4 1 to 4.8
Defrost Duration
(hr/day)
2 1.7 0.5 to 6

388
Proposed Model Load Hourly Calculations
Applying the inputs listed in Table 130, Table 131, and Table 132 to a calculation
spreadsheet, hourly loads were determined for the proposed walk-in freezers and coolers.
From the hourly loads that are calculated, the AHRI Standard 1250/1251 (AHRI 2009b;
AHRI 2009c) box load equations may be derived. Hourly model load calculations for the
small cooler, large cooler, small freezer, and large freezer are presented in Table 133, Table
134, Table 135, and Table 136, respectively. Information is presented in these tables in
groups of variables that are used together to calculate certain portions of the refrigeration
heat load.
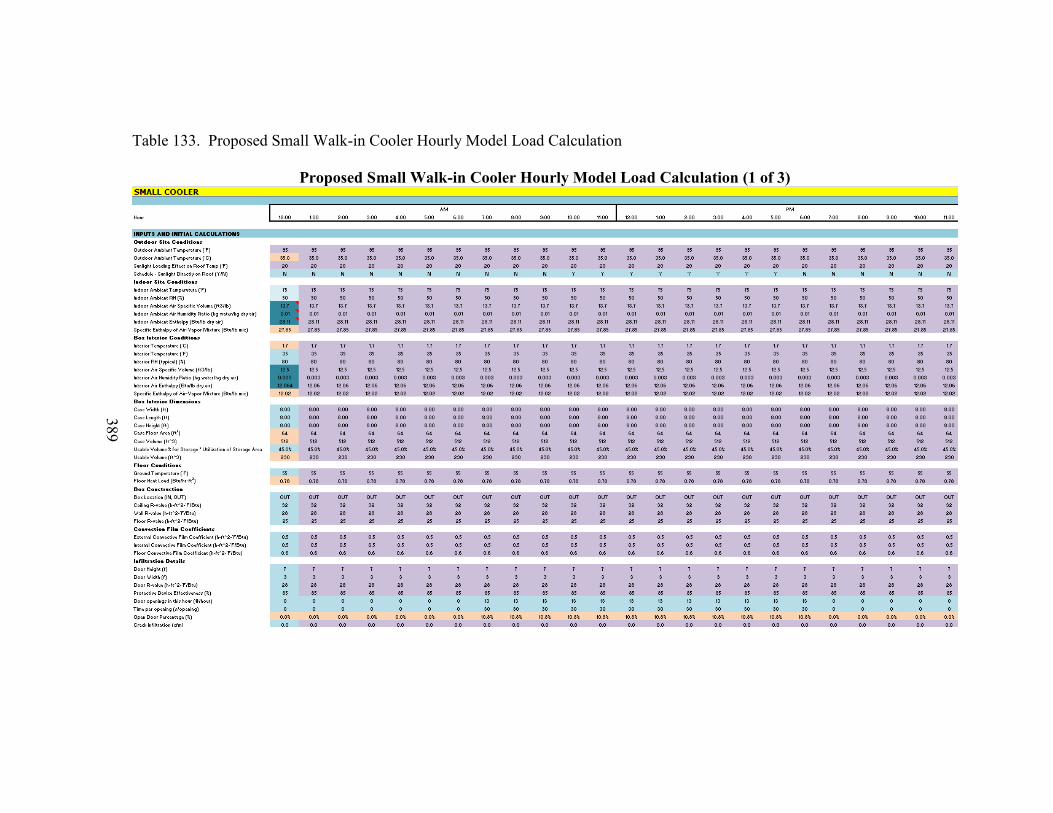
389
Table 133. Proposed Small Walk-in Cooler Hourly Model Load Calculation
Proposed Small Walk-in Cooler Hourly Model Load Calculation (1 of 3)

390
Proposed Small Walk-in Cooler Hourly Model Load Calculation (2 of 3)

391
Proposed Small Walk-in Cooler Hourly Model Load Calculation (3 of 3)
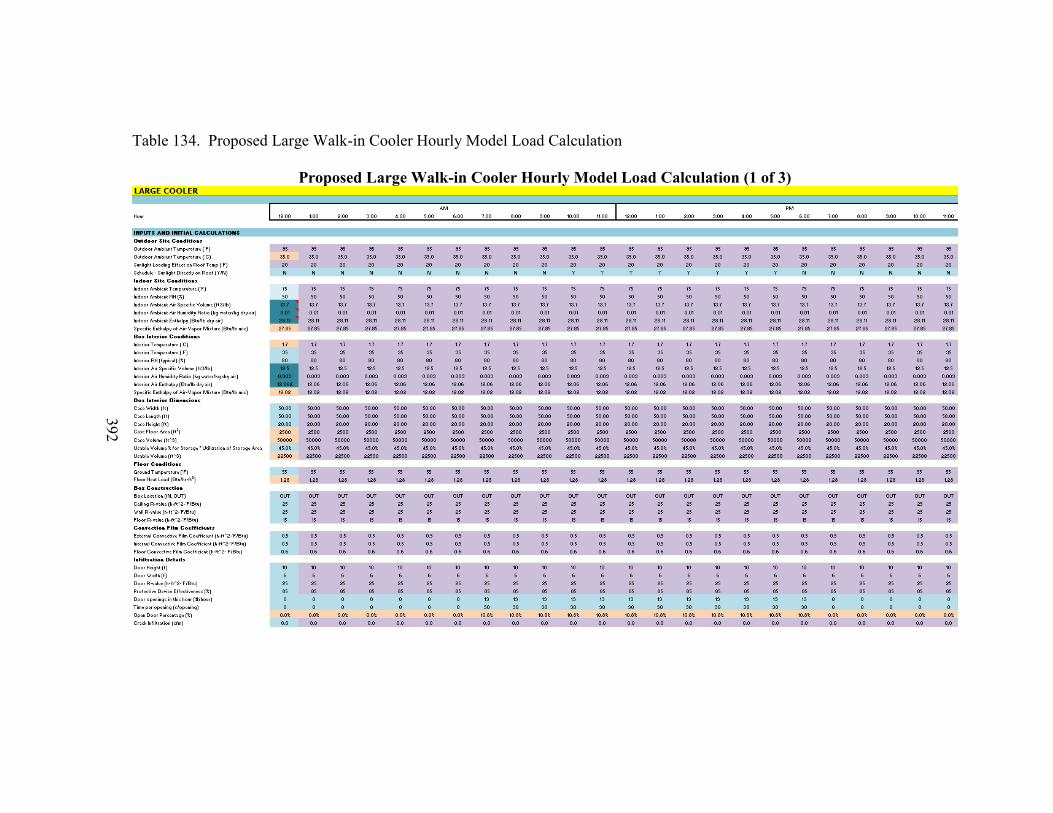
392
Table 134. Proposed Large Walk-in Cooler Hourly Model Load Calculation
Proposed Large Walk-in Cooler Hourly Model Load Calculation (1 of 3)

393
Proposed Large Walk-in Cooler Hourly Model Load Calculation (2 of 3)
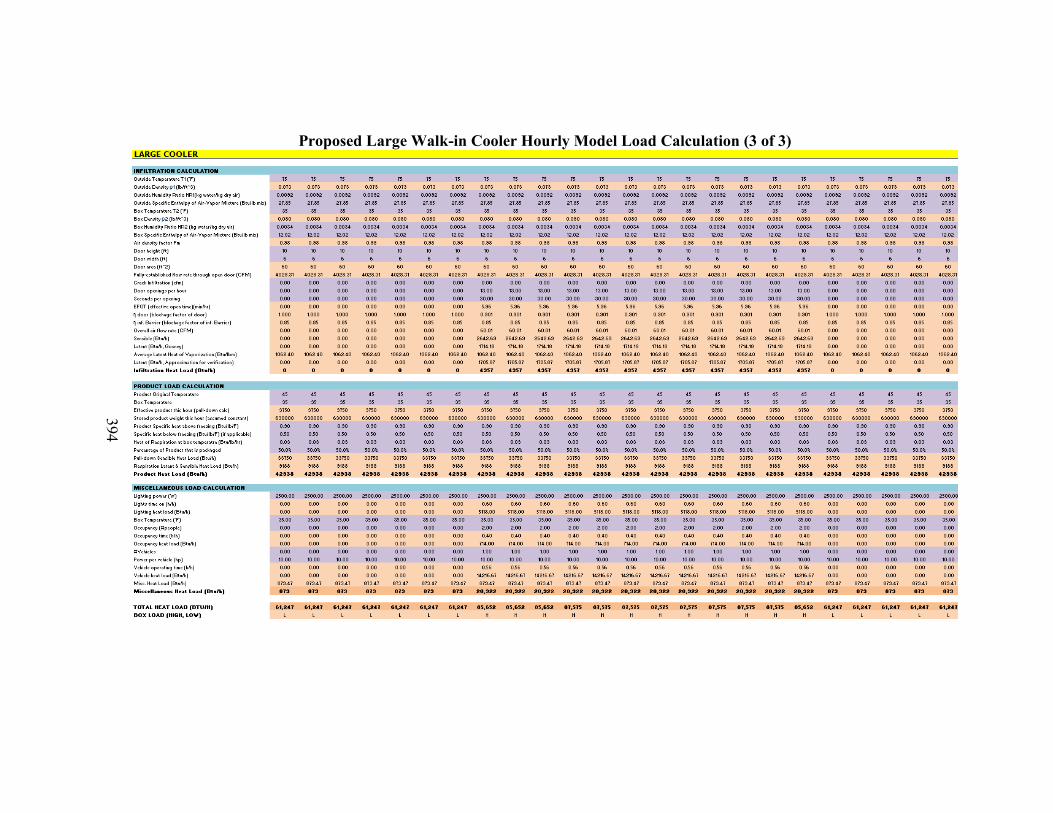
394
Proposed Large Walk-in Cooler Hourly Model Load Calculation (3 of 3)

395
Table 135. Proposed Small Walk-in Freezer Hourly Model Load Calculation
Proposed Small Walk-in Freezer Hourly Model Load Calculation (1 of 3)

396
Proposed Small Walk-in Freezer Hourly Model Load Calculation (2 of 3)

397
Proposed Small Walk-in Freezer Hourly Model Load Calculation (3 of 3)

398
Table 136. Proposed Large Walk-in Freezer Hourly Model Load Calculation
Proposed Large Walk-in Freezer Hourly Model Load Calculation (1 of 3)

399
Proposed Large Walk-in Freezer Hourly Model Load Calculation (2 of 3)

400
Proposed Large Walk-in Freezer Hourly Model Load Calculation (3 of 3)

401
From the hourly calculations, average, peak, and min heat loads are compared in
Table 137, Table 138, Table 139, Table 140, Table 141, and Table 142 on a heat load and
percentage of total heat load basis. Analysis of this information may identify the need for
future alterations to the model load. Average heat loads (Table 137 and Table 138) show
coolers having fairly similar percentages of conduction loads, with conduction loading
being the primary mode of heat loading on the large freezer. Analyzing infiltration loading
for the large refrigerated spaces on a percentage basis depicts a very small infiltration load,
which leads this author to question whether the infiltration schedule is too small.
Comparing infiltration loads in Table 137, however, shows that the large space infiltration
loads are about three times larger than the loads for the smaller spaces. Product heat load
contribution to the freezers is smaller, on a percentage and heat load basis, as the pull-down
portion of the heat load is the same while the coolers have the addition of a respiration heat
load. Miscellaneous loads are fairly consistent on a percentage basis for each refrigerated
space even though each space has different load components and magnitudes.
Peak loads (Table 139 and Table 140) reveal which loads vary the most throughout
the day. The peak load percentage of total load increases for infiltration and miscellaneous
loads, as they vary the most through the day, relative to the conduction and product heat
loads which are more consistent. This load variation is also evident through analysis of the
minimum heat loads seen by the four refrigerated spaces (Table 141 and Table 142).

402
Table 137. Average Heat Loads for the Proposed Model Walk-ins
Small Cooler Small
Freezer
Large
Cooler
Large
Freezer
Walls Heat Load (Btu/h) 485.52 838.62 8461.54 13103.45
Ceiling Heat Load
(Btu/h)
129.29 206.87 6410.26 8080.81
Floor Heat Load
(Btu/hr)
50.00 150.00 3205.13 5859.38
Total Conduction Heat
Load (Btu/h)
664.81 1195.49 18076.92 27043.63
Sensible (Btu/h) 386.93 1104.12 1321.35 3770.51
Latent (Btu/h) 250.98 537.16 857.09 1834.35
Total Infiltration Heat
Load (Btu/h)
637.91 1641.28 2178.44 5604.86
Pull-down Sensible Heat
Load (Btu/h)
768.00 106.67 33750.00 5208.33
Respiration Heat Load
(Btu/h)
94.08 0.00 9187.50 0.00
Total Product Heat
Load (Btu/h)
862.08 106.67 42937.50 5208.33
Lighting heat load
(Btu/h)
65.51 65.51 2559.00 2559.00
Occupancy heat load
(Btu/h)
357.00 270.50 357.00 541.00
Vehicle heat load
(Btu/h)
0.00 0.00 7108.33 7108.33
Misc. Heat Load (Btu/h) 545.92 545.92 873.47 873.47
Total Miscellaneous
Heat Load (Btu/h)
968.43 881.93 10897.81 11081.81
Total Heat Load
(Btu/h)
3133.23 3825.36 74090.67 48938.63

403
Table 138. Average Heat Load Percentages for the Proposed Model Walk-ins
Small
Cooler
Small
Freezer
Large
Cooler
Large
Freezer
Walls Heat Load (% of
Total Load)
15.5% 21.9% 11.4% 26.8%
Ceiling Heat Load (% of
Total Load)
4.1% 5.4% 8.7% 16.5%
Floor Heat Load (% of
Total Load)
1.6% 3.9% 4.3% 12.0%
Total Conduction Heat
Load (% of Total)
21.2% 31.3% 24.4% 55.3%
Sensible (% of Total
Load )
12.3% 28.9% 1.8% 7.7%
Latent (% of Total
Load)
8.0% 14.0% 1.2% 3.7%
Total Infiltration Heat
Load (% of Total)
20.4% 42.9% 2.9% 11.5%
Pull-down Sensible Heat
Load (% of Total)
24.5% 2.8% 45.6% 10.6%
Respiration Heat Load
(% of Total Load)
3.0% 0.0% 12.4% 0.0%
Total Product Heat
Load (% of Total)
27.5% 2.8% 58.0% 10.6%
Lighting heat load (% of
Total Load)
2.1% 1.7% 3.5% 5.2%
Occupancy heat load (%
of Total Load)
11.4% 7.1% 0.5% 1.1%
Vehicle heat load (% of
Total Load)
0.0% 0.0% 9.6% 14.5%
Misc. Heat Load (% of
Total Load)
17.4% 14.3% 1.2% 1.8%
Total Miscellaneous
Load (% of Total)
30.9% 23.1% 14.7% 22.6%

404
Table 139. Peak Heat Loads for the Proposed Model Walk-ins
Small
Cooler
Small
Freezer
Large
Cooler
Large
Freezer
Walls Heat Load (Btu/h) 485.52 838.62 8461.54 13103.45
Ceiling Heat Load
(Btu/h)
155.15 232.73 7692.31 9090.91
Floor Heat Load
(Btu/hr)
50.00 150.00 3205.13 5859.38
Total Conduction Heat
Load (Btu/h)
690.67 1221.35 19358.97 28053.73
Sensible (Btu/h) 773.86 2208.25 2642.69 7541.02
Latent (Btu/h) 501.97 1074.31 1714.18 3668.71
Total Infiltration Heat
Load (Btu/h)
1275.83 3282.56 4356.88 11209.73
Pull-down Sensible Heat
Load (Btu/h)
768.00 106.67 33750.00 5208.33
Respiration Heat Load
(Btu/h)
94.08 0.00 9187.50 0.00
Total Product Heat
Load (Btu/h)
862.08 106.67 42937.50 5208.33
Lighting heat load
(Btu/h)
131.02 131.02 5118.00 5118.00
Occupancy heat load
(Btu/h)
714.00 541.00 714.00 1082.00
Vehicle heat load
(Btu/h)
0.00 0.00 14216.67 14216.67
Misc. Heat Load (Btu/h) 545.92 545.92 873.47 873.47
Total Miscellaneous
Heat Load (Btu/h)
1390.94 1217.94 20922.14 21290.14
Total Heat Load
(Btu/h)
4219.52 5828.51 87575.49 65761.93

405
Table 140. Peak Heat Load Percentages for the Proposed Model Walk-ins
Small
Cooler
Small
Freezer
Large
Cooler
Large
Freezer
Walls Heat Load (% of
Total Load)
11.5% 14.4% 9.7% 19.9%
Ceiling Heat Load (% of
Total Load)
3.7% 4.0% 8.8% 13.8%
Floor Heat Load (% of
Total Load)
1.2% 2.6% 3.7% 8.9%
Total Conduction Heat
Load (% of Total)
16.4% 21.0% 22.1% 42.7%
Sensible (% of Total
Load )
18.3% 37.9% 3.0% 11.5%
Latent (% of Total
Load)
11.9% 18.4% 2.0% 5.6%
Total Infiltration Heat
Load (% of Total)
30.2% 56.3% 5.0% 17.0%
Pull-down Sensible Heat
Load (% of Total)
18.2% 1.8% 38.5% 7.9%
Respiration Heat Load
(% of Total Load)
2.2% 0.0% 10.5% 0.0%
Total Product Heat
Load (% of Total)
20.4% 1.8% 49.0% 7.9%
Lighting heat load (% of
Total Load)
3.1% 2.2% 5.8% 7.8%
Occupancy heat load (%
of Total Load)
16.9% 9.3% 0.8% 1.6%
Vehicle heat load (% of
Total Load)
0.0% 0.0% 16.2% 21.6%
Misc. Heat Load (% of
Total Load)
12.9% 9.4% 1.0% 1.3%
Total Miscellaneous
Load (% of Total)
33.0% 20.9% 23.9% 32.4%

406
Table 141. Minimum Heat Loads for the Proposed Model Walk-ins
Small
Cooler
Small
Freezer
Large
Cooler
Large
Freezer
Walls Heat Load (Btu/h) 485.52 838.62 8461.54 13103.45
Ceiling Heat Load
(Btu/h)
116.36 193.94 5769.23 7575.76
Floor Heat Load
(Btu/hr)
50.00 150.00 3205.13 5859.38
Total Conduction Heat
Load (Btu/h)
651.88 1182.56 17435.90 26538.58
Sensible (Btu/h) 0.00 0.00 0.00 0.00
Latent (Btu/h) 0.00 0.00 0.00 0.00
Total Infiltration Heat
Load (Btu/h)
0.00 0.00 0.00 0.00
Pull-down Sensible Heat
Load (Btu/h)
768.00 106.67 33750.00 5208.33
Respiration Heat Load
(Btu/h)
94.08 0.00 9187.50 0.00
Total Product Heat
Load (Btu/h)
862.08 106.67 42937.50 5208.33
Lighting heat load
(Btu/h)
0.00 0.00 0.00 0.00
Occupancy heat load
(Btu/h)
0.00 0.00 0.00 0.00
Vehicle heat load
(Btu/h)
0.00 0.00 0.00 0.00
Misc. Heat Load (Btu/h) 545.92 545.92 873.47 873.47
Total Miscellaneous
Heat Load (Btu/h)
545.92 545.92 873.47 873.47
Total Heat Load
(Btu/h)
2059.88 1835.15 61246.87 32620.39
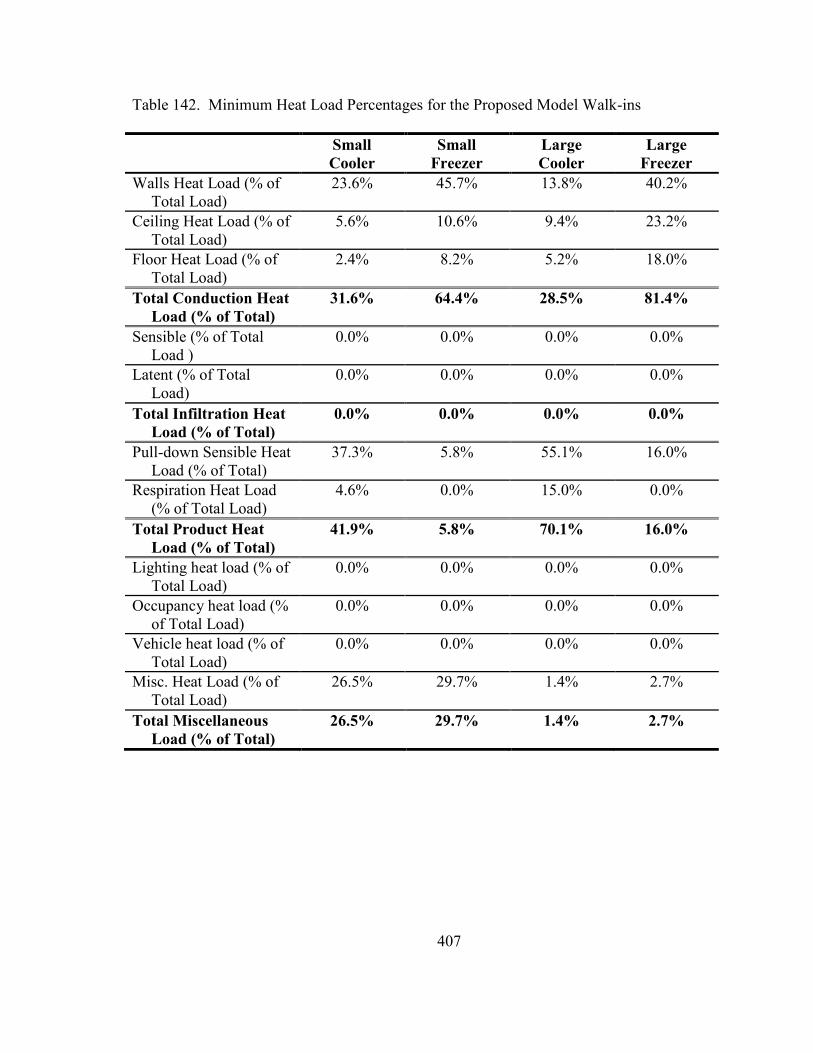
407
Table 142. Minimum Heat Load Percentages for the Proposed Model Walk-ins
Small
Cooler
Small
Freezer
Large
Cooler
Large
Freezer
Walls Heat Load (% of
Total Load)
23.6% 45.7% 13.8% 40.2%
Ceiling Heat Load (% of
Total Load)
5.6% 10.6% 9.4% 23.2%
Floor Heat Load (% of
Total Load)
2.4% 8.2% 5.2% 18.0%
Total Conduction Heat
Load (% of Total)
31.6% 64.4% 28.5% 81.4%
Sensible (% of Total
Load )
0.0% 0.0% 0.0% 0.0%
Latent (% of Total
Load)
0.0% 0.0% 0.0% 0.0%
Total Infiltration Heat
Load (% of Total)
0.0% 0.0% 0.0% 0.0%
Pull-down Sensible Heat
Load (% of Total)
37.3% 5.8% 55.1% 16.0%
Respiration Heat Load
(% of Total Load)
4.6% 0.0% 15.0% 0.0%
Total Product Heat
Load (% of Total)
41.9% 5.8% 70.1% 16.0%
Lighting heat load (% of
Total Load)
0.0% 0.0% 0.0% 0.0%
Occupancy heat load (%
of Total Load)
0.0% 0.0% 0.0% 0.0%
Vehicle heat load (% of
Total Load)
0.0% 0.0% 0.0% 0.0%
Misc. Heat Load (% of
Total Load)
26.5% 29.7% 1.4% 2.7%
Total Miscellaneous
Load (% of Total)
26.5% 29.7% 1.4% 2.7%

408
AHRI Standard 1250/1251 Box Load Calculation
From the proposed model load profiles, the AHRI Standard 1250/1251 (AHRI
2009b; AHRI 2009c) box load equations may be derived using the AHRI Load Spreadsheet
methodology (AHRI 2009a).
Per the AHRI Standards, a walk-in load profile is composed of operation at a high
usage, heavy load condition and low usage, light load condition. These are called high and
low loads. The box high and low loads, as they are defined by AHRI and as they will be
referenced in this work, refer to the refrigeration load, with exclusion of heat added to the
space by the operation of the refrigeration system (defrost and evaporator fans), at the high
and low load conditions, respectively. The box load is assumed to be composed of two
components, a temperature dependent load component and a non-temperature dependent
component (Equations 127 and 128). At the point where the space temperature equals the
box surrounding ambient conditions, the driving potential for the temperature dependent
portion of the load is assumed to go to zero. Likewise, when the ambient temperature is
coincident with the rating point, the box load is assumed to be at the design percentage of
the refrigeration system capacity.
54 CTT
TTCTQTBLH
Cd
Cj
dssj ( 127 )
76 CTT
TTCTQTBLL
Cd
Cj
dssj ( 128 )
The four coefficients that define the box load equations may be determined through
the analysis of the model load outputs and application of the convenient conditions at
certain ambient temperatures mentioned above. The temperature dependent box load

409
coefficients may be solved by using Equations 129 and 130, which take advantage of the
fact that these coefficients define the linear slope between two points on a graph of the box
heat load versus the ratio of the space to ambient temperature difference coincident with
the box heat load and the design point temperature difference. Values for the box heat loads
at two ambient temperatures are obtained using the model hourly load calculation and
applied to the equations below to determine the box load coefficients.
Cd
C
Cd
Cd
d
Cd
C
Cd
Cdss
TT
TT
TT
TT
TBLHTBLH
TBLH
N
TT
TT
TT
TTTQ
TBLHTBLHC
21
21
21
214
( 129 )
Cd
C
Cd
Cd
d
Cd
C
Cd
Cdss
TT
TT
TT
TT
TBLLTBLL
TBLH
N
TT
TT
TT
TTTQ
TBLLTBLLC
21
21
21
216
( 130 )
Equations 131 and 132 are achieved at the design ambient temperature, as
previously noted. Through manipulating these equations and assuming a ratio of the high
box load at the design point and the refrigeration system capacity at the design point, the
non-temperature dependent coefficients may be determined (Equations 133 and 134).
dssddssd TQNTQCCTBLH
54 ( 131 )
dssd TQCCTBLL
76 ( 132 )
45 CNC d ( 133 )
67 C
TBLH
NTBLLC
d
dd
( 134 )
The box load equations may be simplified to Equations 135 and 136, so that box
load values may be determined for any bin temperature (Tj).
410
ddjj TBLHTTTT
TBLHTBLHTBLH
21
21 ( 135 )
ddjj TBLLTTTT
TBLLTBLLTBLL
21
21 ( 136 )
Determination of the BLL/BLH
To determine the box load low and high AHRI Standard 1250/1251 (AHRI 2009b;
AHRI 2009c) equations, the results from the hourly model load profile are needed, as are
assumptions for the additional capacity built into the refrigeration system above the design
heat load. Typical system oversizing may be discerned from the literature through applied
safety factors and noted compressor runtimes. Three references present typical safety
factors applied to the design sizing of refrigeration systems, including (Krack 1977),
(Blackmore 2012), and (Heatcraft 2008). Blackmore and Heatcraft specify a 10% safety
factor be applied to the calculated design heat load whereas Krack specifies an additional 5
to 10%.
Authors, including (Adre and Hellickson 1989), (Ashby et al. 1979), (Becker et al.
2011), (Blackmore 2012), (Cooper 1973), (Goetzler et al. 2009), (Heatcraft 2008), (Krack
1977), (Morris 2012), (Nelson 2011), (Patel et al. 1993), (Sand et al. 1997), (SCE 2009),
(Wade 1984), and (Westphalen et al. 1996), present compressor runtimes. Runtimes for
freezers ranged from 40 to 99.07%, with an average value of 66.49%. Cooler compressor
runtimes ranged from 0.70 to 91.67%, with an average value of 54.90%.
To select an appropriate design load to design capacity ratio, the model loads were
analyzed at various ratios. Compressor runtimes were calculated according to the method
first applied by Becker et al. (Becker et al. 2011) for each design load to capacity ratio. The

411
general equation for calculating the compressor runtime based on the AHRI Standard
1250/1251 (AHRI 2009b; AHRI 2009c) is listed as Equation 137.
n
j j
jss
jjn
TQ
TBLLTBLHCR
1*
67.033.0
8760
1 ( 137 )
Applying the generalized equations for the box load high and low (Equations 127
and 128) the compressor runtime equation is modified to that listed in Equation 138. A new
coefficient, C8, has been added to the equation, defining the percentage of time that the
walk-in box operates in a high load condition. Through information presented in Becker et
al. (Becker et al. 2011), a value of 0.50 will be used for C8. Additional inputs required
include the exterior site conditions at the design point, the system capacity at the design
conditions, the temperature of the refrigerated space, and a weather profile based off bin
hours. The bin weather data used by this work is the same as specified by the AHRI 1250
Standard (AHRI 2009b), modeling Kansas City, Missouri‟s weather (Table 143).
n
j j
jss
dss
Cd
Cjn
TQ
TQCCCCCCCCC
TT
TTCR
1 7785866488760
1 ( 138 )

412
Table 143. AHRI 1250 Condenser Out, Temperature Bins and Corresponding Bin Hours,
Kansas City, MO
Bin Temperature (ºF) Bin Hours (hr)
100.4 9
95 74
89.6 257
84.2 416
78.8 630
73.4 898
68 737
62.6 943
57.2 628
51.8 590
46.4 677
41 576
35.6 646
30.2 534
24.8 322
19.4 305
14 246
8.6 189
3.2 78
-2.2 5
Source: (AHRI 2009b)

413
jss TQ
is approximated using three points of steady state refrigeration system
capacity, coincident with the method of test points ((AHRI 2009b) Equations 18 and 20).
(Becker et al. 2011) obtained these values through simulation of four walk-ins. The values
for system capacity were applied in this work to determine the compressor runtime. The
magnitude of these system capacity values is not important, as there is also a measure of
capacity in the numerator of the compressor runtime equation. Using Becker‟s system
capacity values allows direct comparison of compressor runtime results from the AHRI and
proposed box load equations, as they use the same backdrop.
Tj < 59˚F
3559
35355935
j
ssssssjss
TFQFQFQTQ Equation 18 (AHRI 2009b)
Tj > 59˚F
5995
59599559
j
ssssssjss
TFQFQFQTQ Equation 20 (AHRI 2009b)
The results of the box load high to design capacity ratio and compressor runtime
analysis are presented in Table 144, Table 145, Table 146, and Table 147 for the small and
large coolers and freezers. Figure 8 displays the information listed the in tables noted
above. Walk-in boxes located indoors with indoor condensing units operate at higher
compressor runtimes relative to other box and condenser configurations with the same box
load high to capacity ratio. This is due to the operating conditions being more consistent
through the period. Coolers operate at higher compressor runtimes, when compared to
freezers at the same box load high to capacity ratio. Smaller refrigerated spaces have less

414
variation in the compressor runtime for a given box load high to capacity ratio, compared
to larger refrigerated spaces.
From the information presented in the literature about compressor runtime and
refrigeration system safety factor, it is apparent that systems are designed according to a
particular box load high to capacity ratio, as opposed to being sized with a particular annual
compressor runtime in mind. Systems with more unpredictable operating conditions are
given more oversize than boxes with a consistent load profile, such as indoor walk-in boxes
with indoor condensing units. Through a rough analysis of the literature and the results
from the hourly model load analysis of the box load high to capacity ratio, the ratio will be
set to 70% for walk-in coolers and 85% for walk-in freezers.
Table 144. Small Cooler Compressor Runtime as a Function of Box Load High to
Capacity Ratio
Small Cooler Compressor Runtime
CR: Compressor Runtime
Nd: Box Load High
to Capacity Ratio
Indoor Box
Indoor
Condenser
Indoor Box
Outdoor
Condenser
Outdoor Box
Outdoor
Condenser
70 51.49 46.36 41.80
72 52.96 47.69 43.00
74 54.43 49.01 44.19
76 55.90 50.34 45.39
78 57.37 51.66 46.58
80 58.84 52.99 47.77
82 60.31 54.31 48.97
84 61.78 55.64 50.16
86 63.26 56.96 51.36
88 64.73 58.29 52.55
90 66.20 59.61 53.75
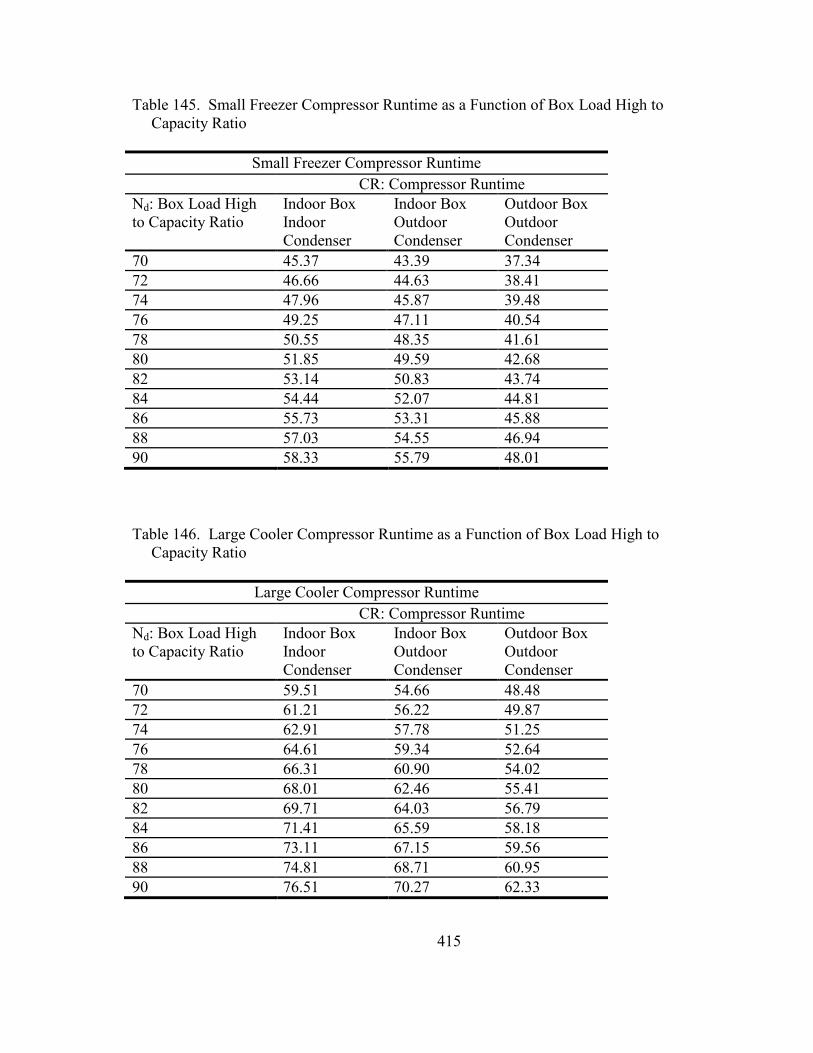
415
Table 145. Small Freezer Compressor Runtime as a Function of Box Load High to
Capacity Ratio
Small Freezer Compressor Runtime
CR: Compressor Runtime
Nd: Box Load High
to Capacity Ratio
Indoor Box
Indoor
Condenser
Indoor Box
Outdoor
Condenser
Outdoor Box
Outdoor
Condenser
70 45.37 43.39 37.34
72 46.66 44.63 38.41
74 47.96 45.87 39.48
76 49.25 47.11 40.54
78 50.55 48.35 41.61
80 51.85 49.59 42.68
82 53.14 50.83 43.74
84 54.44 52.07 44.81
86 55.73 53.31 45.88
88 57.03 54.55 46.94
90 58.33 55.79 48.01
Table 146. Large Cooler Compressor Runtime as a Function of Box Load High to
Capacity Ratio
Large Cooler Compressor Runtime
CR: Compressor Runtime
Nd: Box Load High
to Capacity Ratio
Indoor Box
Indoor
Condenser
Indoor Box
Outdoor
Condenser
Outdoor Box
Outdoor
Condenser
70 59.51 54.66 48.48
72 61.21 56.22 49.87
74 62.91 57.78 51.25
76 64.61 59.34 52.64
78 66.31 60.90 54.02
80 68.01 62.46 55.41
82 69.71 64.03 56.79
84 71.41 65.59 58.18
86 73.11 67.15 59.56
88 74.81 68.71 60.95
90 76.51 70.27 62.33

416
Table 147. Large Freezer Compressor Runtime as a Function of Box Load High to
Capacity Ratio
Large Freezer Compressor Runtime
CR: Compressor Runtime
Nd: Box Load High
to Capacity Ratio
Indoor Box
Indoor
Condenser
Indoor Box
Outdoor
Condenser
Outdoor Box
Outdoor
Condenser
70 51.75 41.76 32.27
72 53.23 42.96 33.19
74 54.71 44.15 34.11
76 56.19 45.34 35.03
78 57.67 46.54 35.96
80 59.15 47.73 36.88
82 60.62 48.92 37.80
84 62.10 50.12 38.72
86 63.58 51.31 39.64
88 65.06 52.50 40.57
90 66.54 53.70 41.49

417
Figure 8. Compressor Runtime vs. Load to Capacity Ratio Analysis
Plugging the above values for the box load high to capacity ratio into Equations 129
to 134, the box load equations (Equations 127 and 128) for each refrigerated space may be
determined. The determined coefficients are listed in Table 148.
54 CTT
TTCTQTBLH
Cd
Cj
dssj ( 127 )
76 CTT
TTCTQTBLL
Cd
Cj
dssj ( 128 )

418
Table 148. Proposed Modified Box Load Equation Coefficients
C4 C5 C6 C7 C8
Small Cooler 0.0855 0.6145 0.0855 0.2573 0.5000
Large Cooler 0.1022 0.5978 0.1022 0.3910 0.5000
Small Freezer 0.1251 0.7249 0.1251 0.1431 0.5000
Large Freezer 0.2334 0.6166 0.2334 0.1915 0.5000
Averaging the coefficients for the small and large refrigerated spaces results in
proposed modified Standard AHRI 1250/1251 box load equations, as follows in Equations
139, 140, 142, and 143. These equations are combined with the coefficient C8 to develop
the complete box load definitions in Equations 141 and 144.
Walk-in Cooler Proposed Box Load Equations:
606.0094.0Cd
Cj
dssjTT
TTTQTBLH ( 139 )
324.0094.0Cd
Cj
dssjTT
TTTQTBLL ( 140 )
jdss
Cd
Cj
j nTQTT
TTTBL
465.0094.0 ( 141 )
Walk-in Freezer Proposed Box Load Equations
671.0179.0Cd
Cj
dssjTT
TTTQTBLH ( 142 )
167.0179.0Cd
Cj
dssjTT
TTTQTBLL ( 143 )
jdss
Cd
Cj
j nTQTT
TTTBL
419.0179.0 ( 144 )

419
Comparison of Proposed Box Load Equations to AHRI Standard 1250/1251
Equations
The AHRI Standard 1250/1251 Equations (AHRI 2009b; AHRI 2009c) are listed
below for comparison to the proposed box load equations.
AHRI Walk-in Cooler Box Load Equations:
65.005.0Cd
Cj
dssjTT
TTTQTBLH ( 145 )
03.007.0Cd
Cj
dssjTT
TTTQTBLL ( 146 )
jdss
Cd
Cj
j nTQTT
TTTBL
235.0063.0 ( 147 )
AHRI Walk-in Freezer Box Load Equations
55.025.0Cd
Cj
dssjTT
TTTQTBLH ( 148 )
15.025.0Cd
Cj
dssjTT
TTTQTBLL ( 149 )
jdss
Cd
Cj
j nTQTT
TTTBL
282.0250.0 ( 150 )
The variation between Equations 139 through 144 and the corresponding Equations
145 through 150 is not simply due to the dynamics of altering the model load profile.
Coefficient C5 decreases for the walk-in cooler (Proposed to AHRI) while C4 and C7
increase. Coefficient C4 decreases for the walk-in freezer (Proposed to AHRI) while C5 and
C7 both increase. When applied to the consolidated box load equation utilizing the new
value for coefficient C8, all equation coefficients are increased for the walk-in cooler, as is
420
the temperature dependent coefficient for the walk-in freezer. The non-temperature
dependent coefficient for the walk-in freezer decreases.
The proposed walk-in cooler box load has a 49.2% higher temperature dependent
coefficient and a 97.9% higher non-temperature dependent coefficient when compared to
the AHRI walk-in cooler box load. The proposed walk-in freezer box load has a 28.4%
smaller temperature dependent coefficient and a 48.6% higher non-temperature dependent
coefficient when compared to the AHRI walk-in freezer box load. Essentially, the walk-in
cooler box load is higher according to the revised model load whereas the walk-in freezer
box load is similar on average, and less affected by the temperature differential between the
space and its surroundings.
Analysis of the Proposed Model Load
Through application of Equation 137, compressor runtimes were calculated for the
walk-in cooler and freezer, for condenser indoor and outdoor conditions, using the system
capacities used by Becker et al., thereby allowing for direct comparison to his results.
Compressor runtimes are listed in Table 149. In comparison to runtime information
obtained from the literature, the proposed values show better correlation to typical
operation of 55 to 65% compressor runtime.

421
Table 149. Compressor Runtimes for the Proposed and AHRI 1250 Box Load Equations
using System Capacities Determined by (Becker et al. 2011)
Proposed 1250 AHRI 1250
Condenser
Indoors
Condenser
Outdoors
Condenser
Indoors
Condenser
Outdoors
Small Cooler 55.90 44.69 29.80 23.43
Large Cooler 55.90 45.70 29.80 23.54
Small Freezer 59.80 45.87 53.20 41.89
Large Freezer 59.80 39.63 53.20 36.16
Source: (Becker et al. 2011)
For the proposed model load the compressor runtimes have increased in all cases.
Coolers with the condenser locating indoors have a compressor runtime increase of 88%
whereas freezer runtimes increased by 12%. Small and large coolers with the condenser
outdoors had runtime increases similar to indoor condensing unit coolers at 91% and 94%,
respectively. Walk-in freezers with outdoor condensers saw a moderate increase in
compressor runtime of 10% for both the small and large freezers.
Comparing the model loads utilized by AHRI and the proposed revision to the
Standard, Table 150 and Table 151 were developed. For consistency the AHRI I-P
calculation was compared to the corresponding I-P calculation performed for the proposed
model load. The average hourly loads for walk-in coolers are comparable for the AHRI
Load Spreadsheet and the proposed model load, decreasing 8% for the small cooler and
increasing 34% for the large cooler. The main variation in the refrigeration loads, between
the two calculations, is the range of the heat loads. Small and large cooler heat loads
calculated by AHRI vary from the average by + 325% / -78% and +369% / -70%,

422
respectively. The Proposed Model Load has heat loads for the small and large coolers
varying from the average by + 35% / - 35% and + 18% / - 17%, respectively.
Table 150. Walk-in Cooler Hourly Load Comparisons for the AHRI Load Spreadsheet
(AHRI 2009a) and the Proposed Model Load
AHRI Load Spreadsheet Proposed Model Load
Small Cooler Large Cooler Small Cooler Large Cooler
Peak Hourly Load 14,547 258,314 4,220 87,576
Conduction (Btu/h) 794 17,800 691 19,359
Infiltration (Btu/h) 5,757 15,728 1,276 4,357
Product Load (Btu/h) 6,975 90,000 862 42,938
Miscellaneous (Btu/h) 1,060 136,286 1,391 20,922
Ave Hourly Load 3,421 55,120 3,133 74,091
Conduction (Btu/h) 774 17,050 665 18,077
Infiltration (Btu/h) 257 1,638 638 2,178
Product Load (Btu/h) 2,325 30,000 862 42,938
Miscellaneous (Btu/h) 65 6,432 968 10,898
Min Hourly Load 755 16,300 2,060 61,247
Conduction (Btu/h) 755 16,300 652 17,436
Infiltration (Btu/h) 0 0 0 0
Product Load (Btu/h) 0 0 862 42,938
Miscellaneous (Btu/h) 0 0 546 873
The average hourly loads for walk-in freezers (Table 151) varied a good amount
from AHRI to the proposed model load. The small freezer average load increased by 126%,
and the large freezer load increased by 36%. Small and large freezer heat loads calculated
by AHRI vary from the average by + 244% / -33% and +216% / -29%, respectively. The
proposed model load has heat loads for the small and large coolers varying from the
average by + 52% / - 52% and + 34% / - 33%, respectively. The variability of the AHRI

423
Load Spreadsheet model loads result in lower compressor runtimes than are typical in
application.
Table 151. Walk-in Freezer Hourly Load Comparisons for the AHRI Load Spreadsheet
(AHRI 2009a) and the Proposed Model Load
AHRI Load Spreadsheet Proposed Model Load
Small Freezer Large Freezer Small Freezer Large Freezer
Peak Hourly Load 5,835 113,805 5,829 65,762
Conduction (Btu/h) 1,160 26,563 1,221 28,054
Infiltration (Btu/h) 2,832 7,254 3,283 11,210
Product Load (Btu/h) 1,000 12,500 107 5,208
Miscellaneous (Btu/h) 872 68,660 1,218 21,290
Ave Hourly Load 1,694 35,959 3,825 48,939
Conduction (Btu/h) 1,145 25,977 1,195 27,044
Infiltration (Btu/h) 150 2,116 1,641 5,605
Product Load (Btu/h) 333 4,167 107 5,208
Miscellaneous (Btu/h) 65 3,700 882 11,082
Min Hourly Load 1,130 25,391 1,835 32,620
Conduction (Btu/h) 1,130 25,391 1,183 26,539
Infiltration (Btu/h) 0 0 0 0
Product Load (Btu/h) 0 0 107 5,208
Miscellaneous (Btu/h) 0 0 546 873
The goal of the AHRI Standard 1250/1251 (AHRI 2009b; AHRI 2009c) is to
calculate the AWEF for manufactured refrigeration equipment. (Becker et al. 2011) noted
variations of the AHRI 1250 Standard AWEF values and compressor runtimes to
simulations of climate zones in his analysis (Table 152).
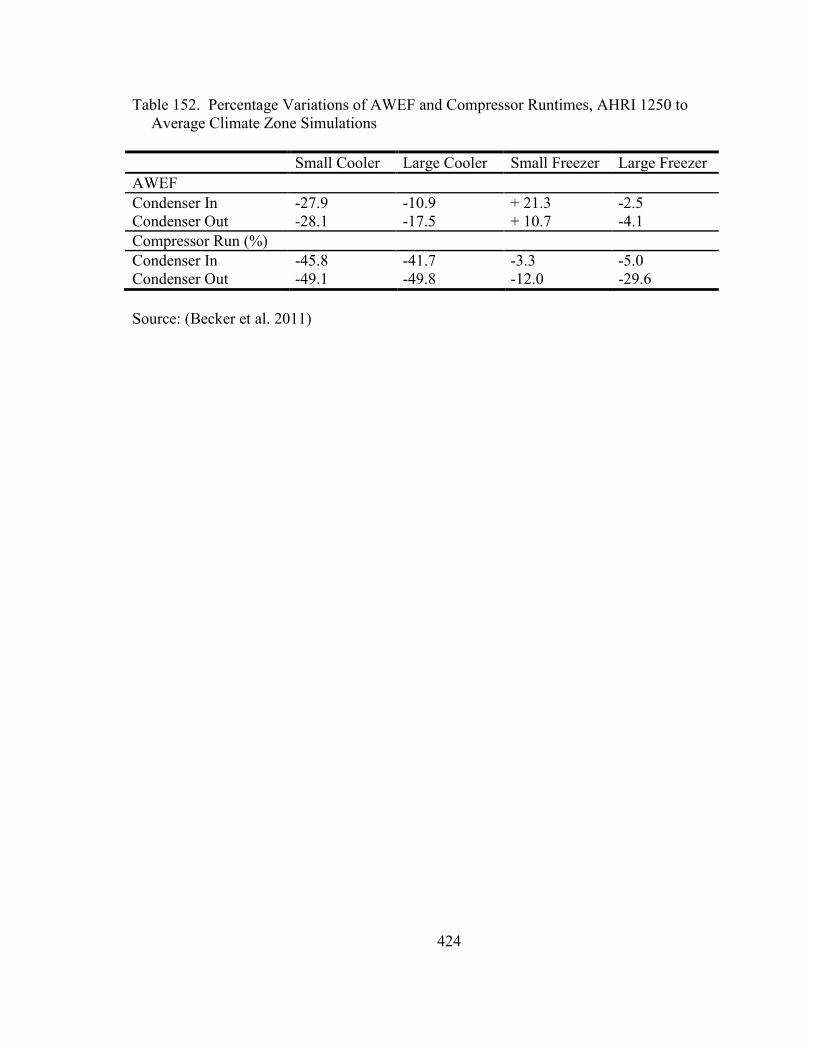
424
Table 152. Percentage Variations of AWEF and Compressor Runtimes, AHRI 1250 to
Average Climate Zone Simulations
Small Cooler Large Cooler Small Freezer Large Freezer
AWEF
Condenser In -27.9 -10.9 + 21.3 -2.5
Condenser Out -28.1 -17.5 + 10.7 -4.1
Compressor Run (%)
Condenser In -45.8 -41.7 -3.3 -5.0
Condenser Out -49.1 -49.8 -12.0 -29.6
Source: (Becker et al. 2011)

425
CHAPTER 6
EQUEST SIMULATIONS
Four sets of simulations were performed to analyze the Proposed 1250 Standard
equations. eQuest (Hirsch 2006), a whole building energy-use simulation software, was
used to simulate each walk-in box and refrigeration system. The simulation software was
initially developed to analyze energy efficiency in building design, but a refrigeration
module has been developed. The modeling tool allows for a detailed representation of the
walk-in construction, walk-in load profile, and refrigeration equipment. eQuest is capable
of utilizing various weather data files, including weather data from the National Oceanic
and Atmospheric Administration (NOAA), to allow energy calculations over a time period
with varying outdoor conditions.
eQuest has been applied by Southern California Edison (SCE 2008) and Becker et
al. (Becker et al. 2011) in their respective simulations of walk-in coolers and freezers.
Southern California Edison did not present a justification for selection of this modeling
software. Becker et al. performed an extensive study in the selection of this modeling tool,
analyzing four additional modeling software products. After selection of eQuest as the best
tool for modeling walk-in coolers and freezers, the software was validated through
simulation of laboratory tests performed by Pacific Gas & Electric Company (PG&E). The
refrigerated space was modeled according to its size and construction. Refrigeration
equipment was modeled according to the specifications provided by PG&E, as were
additional refrigeration loads on the space. Three PG&E laboratory tests were simulated in
eQuest by Becker et al. and the resulting refrigeration system energy usage was tabulated.
Comparison to the PG&E recorded energy usage showed variance of -0.35 to +4.55%, with
426
an average of +2.69%. Therefore, eQuest is capable of developing simulation results for
walk-in refrigeration system operation with good correlation to actual measured data.
As noted previously, four sets of simulations were performed to analyze the
Proposed 1250 Standard equations. Each simulation set was for a different walk-in,
including a small cooler, large cooler, small freezer, and large freezer, in accordance with
the proposed model load (Table 130 through Table 132) and proposed hourly load
calculation (Table 133 through Table 136). Each simulation set was composed of six
simulations and includes simulations representing tests performed in a laboratory setting to
allow calculation of the AWEF according to the Proposed 1250 Standard equations and
hourly simulations representing a walk-in operating over the course of a year.
According to the AHRI 1250/1251 Standard (AHRI 2009b; AHRI 2009c), three
laboratory tests are required to allow determination of the AWEF for refrigeration
equipment operating with an outdoor condenser, and one laboratory test is required for
calculating the AWEF for a walk-in refrigeration system operating with an indoor
condenser. Laboratory tests of refrigeration equipment require two environmental
chambers. One test chamber contains the evaporator for the refrigeration system under test.
Heat and humidity is added to the space to simulate the walk-in box load, and the
evaporator works to maintain a space setpoint temperature, as defined by the Standard.
Heat load is increased until the refrigeration system is operating 100% of the time, but the
evaporator is still maintaining the setpoint temperature. The second test chamber contains
the refrigeration system‟s condensing unit. It is maintained at specific conditions
(temperature and humidity according to the Standard) to simulate condenser operating
conditions.

427
From these tests, the system capacity and system electrical usage is recorded. These
values are then applied to the Proposed 1250 equations to approximate the refrigeration
system‟s AWEF value. The AWEF represents refrigeration system operation over an entire
year, and it is obtained for condenser indoor and outdoor configurations through these four
laboratory tests.
Hourly simulations were performed for four walk-in configurations, including a
small cooler, large cooler, small freezer, and large freezer. These simulations are meant to
represent actual refrigeration operation over an entire year using a weather file to represent
varying outdoor conditions at 15 minutes intervals. The walk-in construction, space heat
loads, and load schedules setup in the simulations are the same as the corresponding system
operating parameters outlined in the proposed model load (Table 130 through Table 132).
After performing the simulation of a year of refrigeration system operation, the walk-in box
load and refrigeration system electrical consumption is summed over the entire year. In
correspondence with the AWEF equation (Equation 1), the annual box load is divided by
the system electrical consumption over the course of the year.
For each simulation set, the proposed model load was used to determine the overall
space load, from which refrigeration equipment was sized according to industry practice
(Heatcraft 2008). Information pertinent to the refrigeration equipment was loaded into the
simulation software. Manufacturer compressor information included the mass flow and
power usage as a function of saturated suction and discharge temperatures. All refrigeration
systems simulated used R-404a refrigerant. The condensing temperature is throttled within
10 ºF of the condenser design temperature with a backflooding setpoint of 65ºF. The
eQuest condenser rated capacity varies from the rated capacity noted on the manufacturer‟s

428
specification sheet, as it also includes the heat of compression added to the system. For the
simulation, an air-side heat balance of the condensing unit was performed at the design
conditions. Condenser fans are assumed to be single-speed, cycling to maintain the desired
operating conditions. Evaporator performance and energy usage is set up by eQuest using
fan affinity and design performance parameters. Fan affinity parameters include the static
pressure that the fan operates at, fan efficiency, and mechanical efficiency (motor and
drive).
Small Cooler Equipment Sizing
The small cooler simulation was set up in accordance with the proposed model load
parameters presented in Table 130, Table 131, and Table 133. Items not included in the
model load include the defrost load, defrost schedule, and the evaporator fan schedule.
Defrost occurs for an hour twice a day at 8 am and 8 pm. Defrost heat load added to
the refrigerated space is assumed to be 60% of the electric usage, in accordance with Cole
(Cole 1989). Over the time periods when defrost is occurring the refrigeration system is
shut off, including the evaporator fans. Box construction is in accordance with the
proposed model load. In addition to the parameters noted in the model load, absorptivity
was set at 0.7 and surface roughness was noted as 5, which corresponds to a smooth
surface, such as glass or paint on pine (Hirsch 2006).
Equipment was sized according to the industry standard by assuming a 16 hour
design condensing unit runtime (Heatcraft 2008; Krack 1977) and then applying a 10%
safety factor. The calculation method used was that presented by Heatcraft in their
Engineering Manual (Heatcraft 2008).

429
Table 153. Small Cooler Heatcraft Load Calculation (Heatcraft 2008)

430
Using the calculated sizing load the condensers and compressors were sized using
Emerson Climate Technologies‟ online product sizing application (Emerson 2012). The
evaporators were selected from product information available from Larkin (Larkin 2007).
Equipment Selection:
One Copeland RST61C1E-CAV compressor: 7,700 Btu/h at
20SST/110SCT.
One Emerson FJAM-A101-TFC-001 condenser: 7,700 Btu/h at
25SST/123.6SCT/90DB
One Larkin LCE665 evaporator: 7,475 Btu/h at 20SST/10TD
Small Freezer Equipment Sizing
The small freezer simulation was set up in accordance with the proposed model
load parameters presented in Table 130, Table 132, and Table 135. Items not included in
the model load include the defrost load and schedule and the evaporator fan schedule.
Defrost occurs for a half hour four times a day at 2 am, 8 am, 2 pm, and 8 pm.
Defrost heat load added to the refrigerated space is assumed to be 60% of the electric
usage, in accordance with Cole (Cole 1989). Over the time periods when defrost is
occurring the refrigeration system is shut off, including the evaporator fans. Box
construction is in accordance with the proposed model load. In addition to the parameters
noted in the model load, absorptivity was set at 0.7 and surface roughness was noted as 5,
which corresponds to a smooth surface, such as glass or paint on pine (Hirsch 2006).
Equipment was sized according to the industry standard by assuming a 18 hour
design condensing unit runtime (Heatcraft 2008; Krack 1977) and then applying a 10%

431
safety factor. The calculation method used was that presented by Heatcraft in their
Engineering Manual (Heatcraft 2008).
Table 154. Small Freezer Heatcraft Load Calculation (Heatcraft 2008)

432
Using the calculated sizing load the condensers and compressors were sized using
Emerson Climate Technologies‟ online product sizing application (Emerson 2012). The
evaporators were selected from product information available from Larkin (Larkin 2007).
Equipment Selection:
One Copeland ZF11K4E-PFV compressor: 11,700 Btu/h at
-25SST/105SCT.
One Emerson DJAL-025Z-CFV-001 condenser: 11,300 Btu/h at
-25SST/108.6SCT/90DB
Two Larkin LCE467 evaporators: 6,365 Btu/h ea at -25SST/10TD
Large Cooler Equipment Sizing
The large cooler simulation was set up in accordance with the proposed model load
parameters presented in Table 130, Table 131, and Table 134. Items not included in the
model load include the defrost load and schedule and the evaporator fan schedule.
Defrost occurs for an hour twice a day at 8 am and 8 pm. Defrost heat load added to
the refrigerated space is assumed to be 60% of the electric usage, in accordance with Cole
(Cole 1989). Over the time periods when defrost is occurring the refrigeration system is
shut off, including the evaporator fans. Box construction is in accordance with the
proposed model load. In addition to the parameters noted in the model load, absorptivity
was set at 0.7 and surface roughness was noted as 5, which corresponds to a smooth
surface, such as glass or paint on pine (Hirsch 2006).
Equipment was sized according to the industry standard by assuming a 18 hour
design condensing unit runtime (Heatcraft 2008; Krack 1977) and then applying a 10%

433
safety factor. The calculation method used was that presented by Heatcraft in their
Engineering Manual (Heatcraft 2008).
Table 155. Large Cooler Heatcraft Load Calculation (Heatcraft 2008)
434
Using the calculated sizing load the condensers and compressors were sized using
Emerson Climate Technologies‟ online product sizing application (Emerson 2012). The
evaporators were selected from product information available from Larkin (Larkin 2007).
Equipment Selection:
One Copeland 4DH3R22ML-TSK compressor: 194,000 Btu/h each at
25SST/110SCT.
Six Emerson FFAS-A35Z-CFV-081 condensers: 30,400 Btu/h ea at
25SST/118.9SCT/90DB
Eight Larkin LCE6200 evaporators: 23,000 Btu/h ea at 20SST/10TD
Large Freezer Equipment Sizing
The large freezer simulation was set up in accordance with the proposed model load
parameters presented in Table 130, Table 132, and Table 136. Items not included in the
model load include the defrost load and schedule and the evaporator fan schedule.
Defrost occurs for an hour twice a day at 8 am and 8 pm. Defrost heat load added to
the refrigerated space is assumed to be 60% of the electric usage, in accordance with Cole
(Cole 1989). Over the time periods when defrost is occurring the refrigeration system is
shut off, including the evaporator fans. Box construction is in accordance with the
proposed model load. In addition to the parameters noted in the model load, absorptivity
was set at 0.7 and surface roughness was noted as 5, which corresponds to a smooth
surface, such as glass or paint on pine (Hirsch 2006).
Equipment was sized according to the industry standard by assuming a 18 hour
design condensing unit runtime (Heatcraft 2008; Krack 1977) and then applying a 10%

435
safety factor. The calculation method used was that presented by Heatcraft in their
Engineering Manual (Heatcraft 2008).
Table 156. Large Freezer Heatcraft Load Calculation (Heatcraft 2008)

436
Using the calculated sizing load the condensers and compressors were sized using
Emerson Climate Technologies‟ online product sizing application (Emerson 2012). The
evaporators were selected from product information available from Larkin (Larkin 2007).
Equipment Selection:
Four Copeland 3DB3F33KL-TFC compressors: 33,100 Btu/h each at
-25SST/105SCT.
Four Emerson CJDK-0750-TSC-001 condensers: 34,030 Btu/h ea at
-25SST/106.2SCT/90DB
Eight Larkin LCE4174 evaporators: 17,400 Btu/h ea at -20SST/10TD
eQuest Hourly Simulation Setup and Procedure
Hourly simulations were set up for box in-condenser in and box out condenser out
configurations. The box in, condenser used a weather file representing 90ºF dry bulb
temperature and a 75ºF wet bulb. Because the condenser is located indoors, it was assumed
for the simulation that there was no wind or solar loading on the walk-in box. This weather
file parallels the AHRI Standard 1250/1251 (AHRI 2009b; AHRI 2009c) definition for
indoor condensing unit walk-in box ambient conditions. Box out condenser out climate
zone simulations were only performed for Kansas City, MO. The Kansas City weather file
is the basis for the algorithm used to make calculations for outdoor condensing unit
systems in the Standard (Table 143). Simulation of the Kansas City weather data allowed
for a direct comparison to the accuracy of the AHRI walk-in rating methodology outlined
by AHRI Standard 1250/1251 (AHRI 2009b; AHRI 2009c). The altitude is set at 1033 ft,
corresponding with the altitude of Kansas City, MO (SEL et al. 2006). Ground
temperatures for the refrigerated space are set at 55ºF.

437
Evaporator design air flow and capacity are input directly from the manufacturer‟s
specification. Evaporator fan power usage is not input directly into eQuest, but it is
calculated by the simulation program using a fan performance curve, an operating pressure,
and equipment efficiencies. Initial guesses for fan efficiency and fan operating pressure are
made, and then a simulation is run. The resulting fan power usage is iterated to the
manufacturer‟s specified energy usage through multiple simulations.
eQuest AHRI 1250 Test Simulation Setup and Procedure
AHRI specifies multiple methods of testing equipment in the Standard 1250/1251
(AHRI 2009b; AHRI 2009c). Systems with indoor condensing unit refrigeration systems
require performance testing at a condenser entering air temperature of 90 ºF DB (75ºF
WB). Rating of refrigeration systems with the condenser outdoors are performed at three
ambient conditions, including 95ºF/75ºF, 59ºF/54ºF, and 35ºF/34ºF. Weather files were
generated that modeled these conditions, and additionally specify no cloud cover, no
precipitation, no wind, and no solar loading.
Testing performed in the laboratory setting to allow calculation of the AWEF is
performed during continuous system operation. The heat load on the refrigeration
equipment is increased until the system reaches continuous steady state operation. At this
point, the refrigeration system is rejecting its maximum potential of heat load. During
testing the energy usage and system heat rejection are recorded to allow determination of
the AWEF. The simulation of this test method is set up to parallel the physical test.
The box that the refrigeration system is operating has its heat resistance increased to
10,000 h-ft2-°F/Btu (limited by eQuest) to greatly reduce the heat lost to the surroundings.
The majority of space heat loads, including occupancy, equipment, product, defrost, and

438
lighting are removed from the simulation. In their place a singular load is added to
represent the heater used to generate the heat load in the AHRI test method. Similar to the
method used to determine the evaporator operating parameters, the heater power is iterated
until the compressor is operating 100% of the time. Careful attention is paid to the space
temperature to ensure that the compressor is operating at 100%, but is not being
outperformed by the heat load. From these three simulations the AWEF can be calculated
using the proposed box load equations.
eQuest Simulation Results
Table 157. Small Cooler eQuest Field Simulation Results
Small Cooler eQuest Field Simulation Results
Box Location Indoor Outdoor
Ambient Indoor Kansas City
Cooling Energy (MBtu) 27.351 25.299
Evaporator Fan Energy (kWh) 1959.264 1958.776
Defrost Heat Load (kWh) 788.400 788.400
Cooling w/o Unit Cooler (MBtu) 17.976 15.925
Electrical Energy (kWh) 8311.74 8006.85
AWEF 2.16 1.99
Average Runtime (%) 54.59 50.28
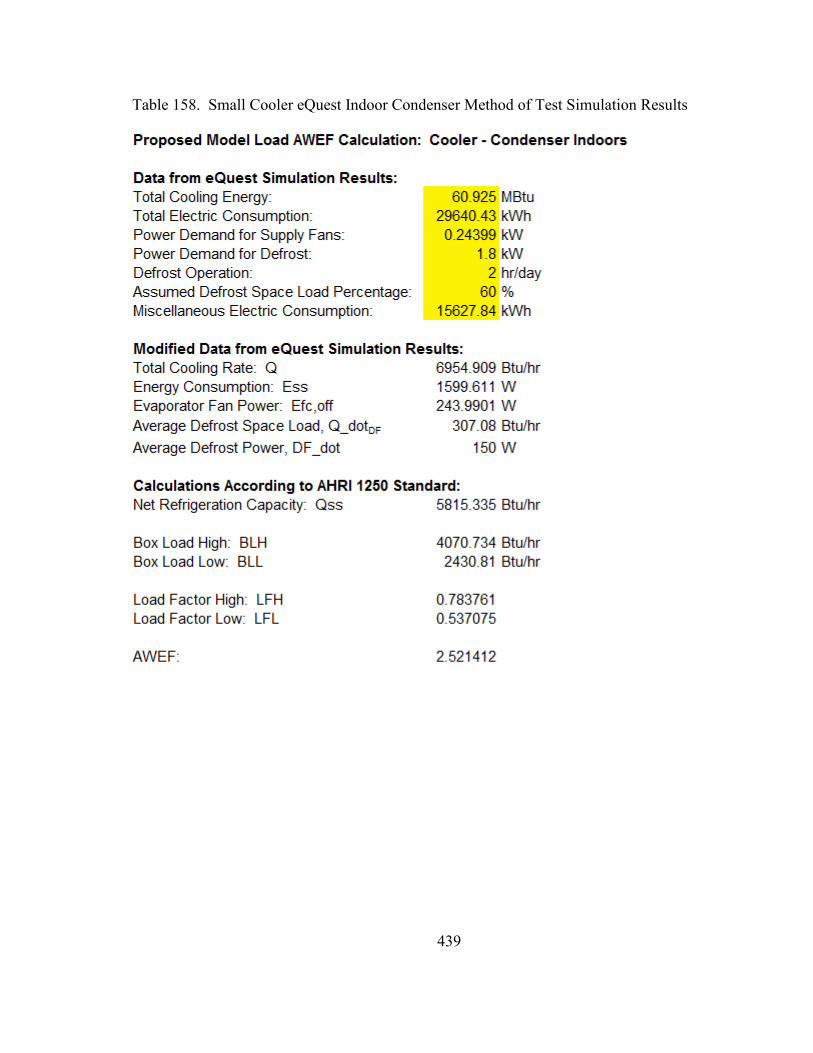
439
Table 158. Small Cooler eQuest Indoor Condenser Method of Test Simulation Results

440
Table 159. Small Cooler eQuest Outdoor Condenser Method of Test Simulation Results

441
Table 160. Small Cooler Proposed Walk-In Compressor Runtimes

442
Table 161. Small Freezer eQuest Field Simulation Results
Small Freezer eQuest Field Simulation Results
Box Location Indoor Outdoor
Ambient Indoor Kansas City
Cooling Energy (MBtu) 36.324 40.631
Evaporator Fan Energy (kWh) 3918.456 3918.456
Defrost Heat Load (kWh) 1576.800 1576.800
Cooling w/o Unit Cooler (MBtu) 17.573 21.880
Electrical Energy (kWh) 19877.43 19686.18
AWEF 0.88 1.11
Average Runtime (%) 48.75 50.02

443
Table 162. Small Freezer eQuest Indoor Condenser Method of Test Simulation Results

444
Table 163. Small Freezer eQuest Outdoor Condenser Method of Test Simulation Results

445
Table 164. Small Freezer Proposed Walk-In Compressor Runtimes

446
Table 165. Large Cooler eQuest Field Simulation Results
Large Cooler eQuest Field Simulation Results
Box Location Indoor Outdoor
Ambient Indoor Kansas City
Cooling Energy (MBtu) 781.665 749.835
Evaporator Fan Energy (kWh) 39187.453 39187.453
Defrost Heat Load (kWh) 15768.000 15768.000
Cooling w/o Unit Cooler (MBtu) 594.149 562.319
Electrical Energy (kWh) 181383.58 166834.94
AWEF 3.28 3.37
Average Runtime (%) 54.59 50.28

447
Table 166. Large Cooler eQuest Indoor Condenser Method of Test Simulation Results

448
Table 167. Large Cooler eQuest Outdoor Condenser Method of Test Simulation Results

449
Table 168. Large Cooler Proposed Walk-In Compressor Runtimes
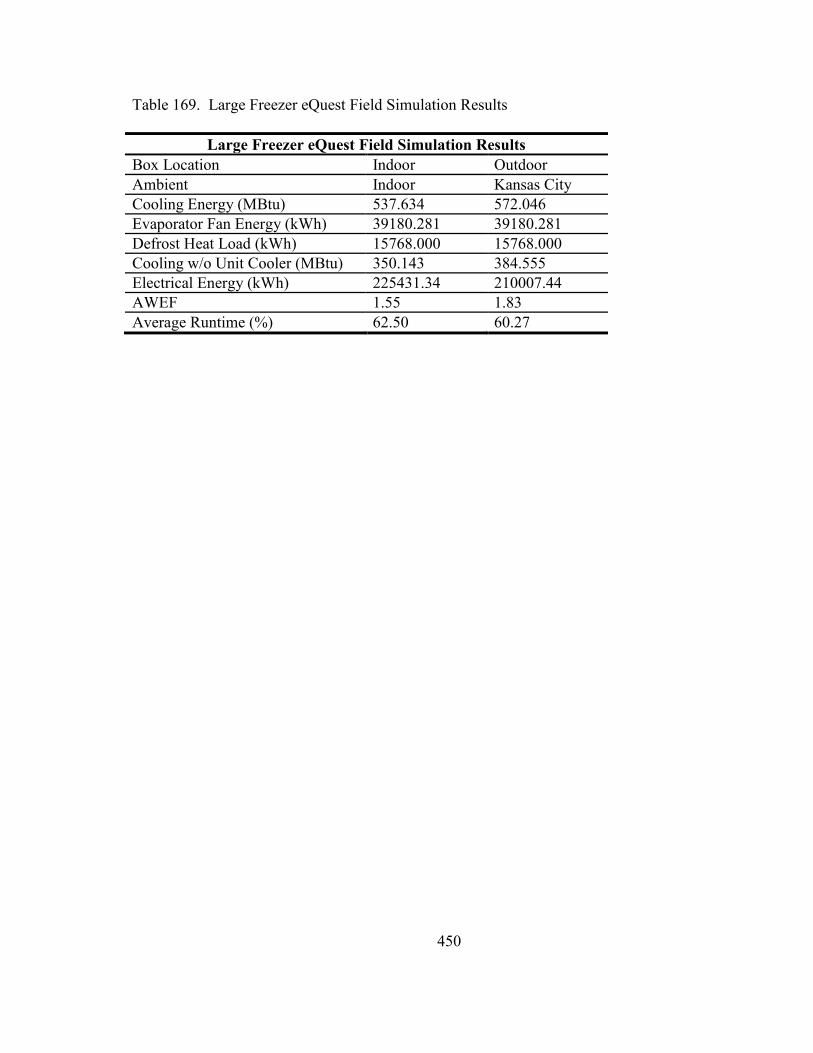
450
Table 169. Large Freezer eQuest Field Simulation Results
Large Freezer eQuest Field Simulation Results
Box Location Indoor Outdoor
Ambient Indoor Kansas City
Cooling Energy (MBtu) 537.634 572.046
Evaporator Fan Energy (kWh) 39180.281 39180.281
Defrost Heat Load (kWh) 15768.000 15768.000
Cooling w/o Unit Cooler (MBtu) 350.143 384.555
Electrical Energy (kWh) 225431.34 210007.44
AWEF 1.55 1.83
Average Runtime (%) 62.50 60.27

451
Table 170. Large Freezer eQuest Indoor Condenser Method of Test Simulation Results
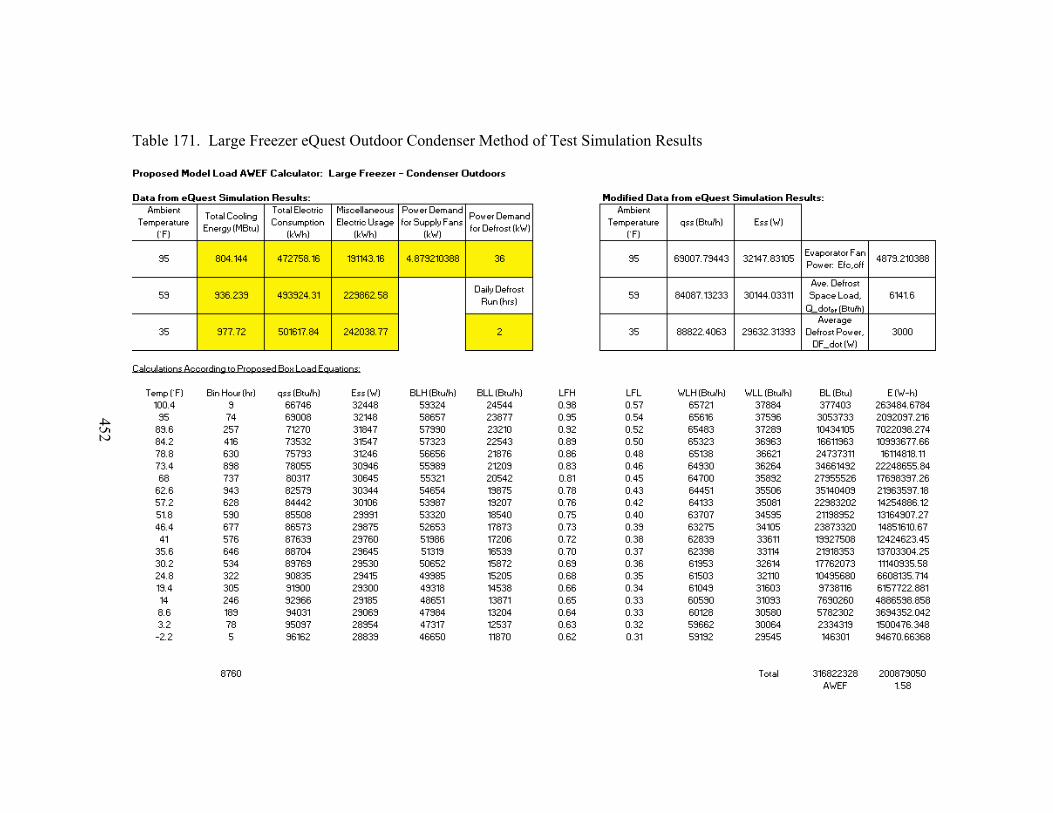
452
Table 171. Large Freezer eQuest Outdoor Condenser Method of Test Simulation Results
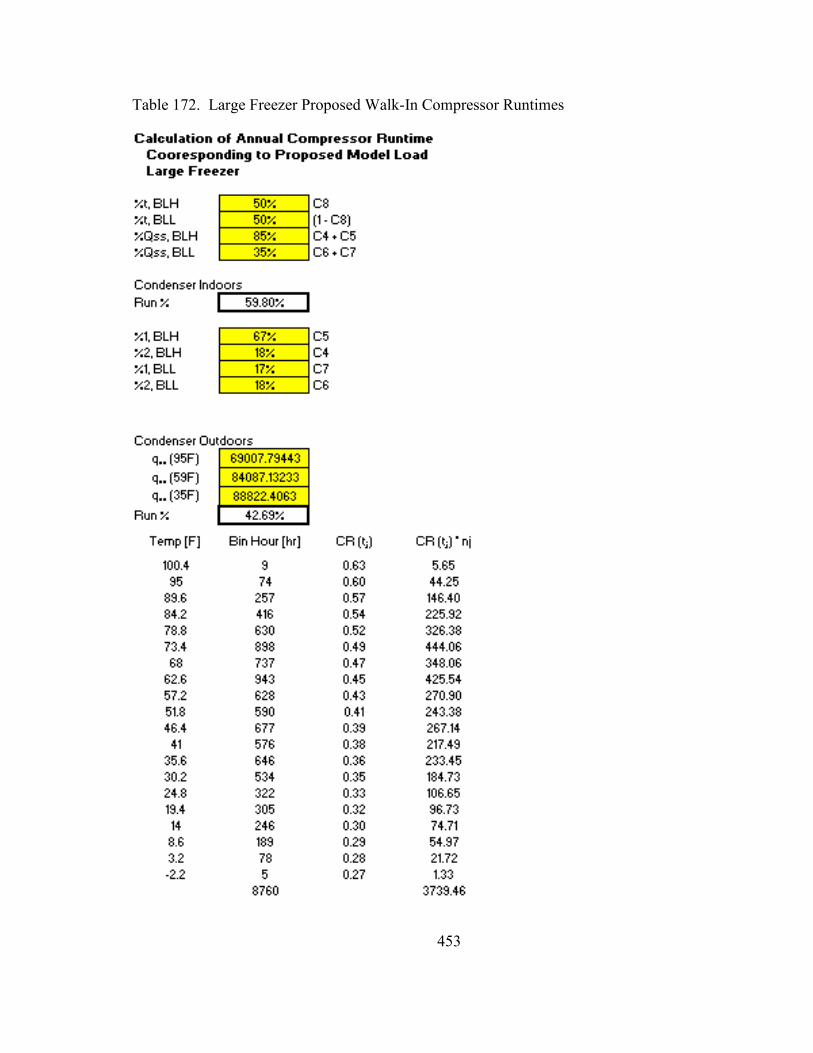
453
Table 172. Large Freezer Proposed Walk-In Compressor Runtimes
454
Simulation results are summarized in Table 173 and Table 174. AWEF calculations
via the Proposed 1250 equations gave similar results to the hourly simulations. Variations
between the two methods may be attributed to differences in the calculation methods, the
derivation of the Proposed 1250 equations, and limitations in equipment available to build
the refrigeration systems. Intuitively, an hourly simulation, calculating energy usage on
fifteen minute intervals, will be more representative of actual refrigeration system
operation than the Proposed 1250 calculation which uses four laboratory tests and a set of
equations to arrive at the refrigeration system AWEF. The simplicity in the Proposed 1250
calculation of the AWEF results in a variance to the performance rating obtained via an
hourly simulation of the refrigeration system. In the development of the Proposed 1250
equations for walk-in coolers, for example, coefficients were developed for a small and
large cooler, and then the coefficients were averaged to arrive at the walk-in cooler box
load coefficients. This adds an inherent variance between the 1250 Proposed equation
calculations and results of simulations of the walk-ins used to develop the 1250 Proposed
equations.
When selecting refrigeration equipment for a given walk-in load, variation is added
to the Proposed 1250 correlation. As the heat load decreases, there is more variation on a
percentage basis between the capacity of the refrigeration equipment and the actual load
simply due to the larger percentage gap in available component refrigeration capacities at
lower loads.

455
Table 173. eQuest Simulation AWEF Calculations
Box In,
Condenser In
Proposed 1250,
Condenser In
Box Out,
Condenser Out,
Kansas City
Proposed 1250,
Condenser Out
Small Freezer 0.88 1.37 1.11 1.28
Small Cooler 2.16 2.52 1.99 2.56
Large Freezer 1.55 1.64 1.83 1.58
Large Cooler 3.28 3.69 3.37 3.58
Table 174. eQuest Simulation Compressor Runtimes
Box In,
Condenser In
Proposed 1250,
Condenser In
Box Out,
Condenser Out,
Kansas City
Proposed 1250,
Condenser Out
Small Freezer 48.75 59.80 50.02 44.70
Small Cooler 45.84 55.90 40.19 45.90
Large Freezer 62.50 59.80 60.27 42.69
Large Cooler 54.59 55.90 50.28 45.99
AWEF and compressor runtime variations are displayed in Table 175. Variation in
the AWEF values primarily trend with the compressor runtime, suggesting that if the
selected refrigeration equipment was oversized precisely the same for all cases, the AWEF
variation would be minimized. Comparisons of the percentage variation of AWEF and
runtimes obtained via the Standard 1250 Equations and the Proposed 1250 Equations are
made in Table 176. AWEF and compressor runtime variations had a higher standard
deviation using the proposed method. Average variations were smaller for the compressor
runtime but larger for the AWEF values determined via the proposed method. The higher
standard deviation is due to a large variation in the proposed coefficients developed in
Table 148, as compared with those developed by the AHRI Load Spreadsheet (AHRI
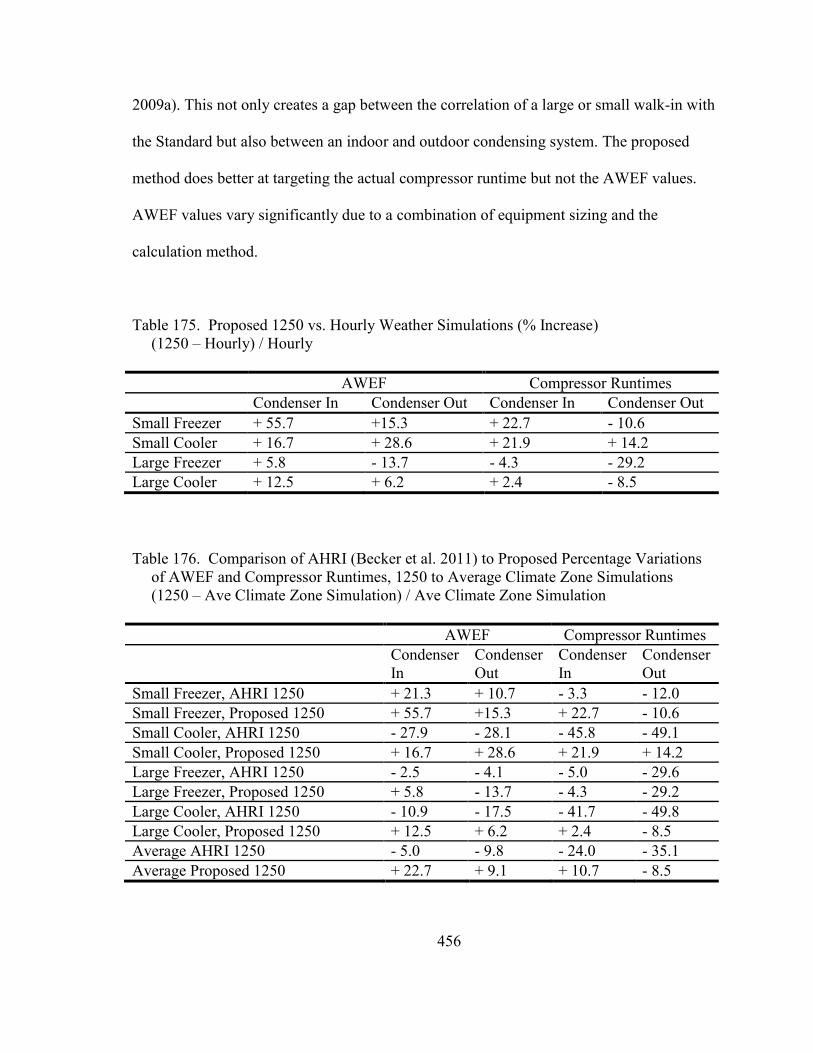
456
2009a). This not only creates a gap between the correlation of a large or small walk-in with
the Standard but also between an indoor and outdoor condensing system. The proposed
method does better at targeting the actual compressor runtime but not the AWEF values.
AWEF values vary significantly due to a combination of equipment sizing and the
calculation method.
Table 175. Proposed 1250 vs. Hourly Weather Simulations (% Increase)
(1250 – Hourly) / Hourly
AWEF Compressor Runtimes
Condenser In Condenser Out Condenser In Condenser Out
Small Freezer + 55.7 +15.3 + 22.7 - 10.6
Small Cooler + 16.7 + 28.6 + 21.9 + 14.2
Large Freezer + 5.8 - 13.7 - 4.3 - 29.2
Large Cooler + 12.5 + 6.2 + 2.4 - 8.5
Table 176. Comparison of AHRI (Becker et al. 2011) to Proposed Percentage Variations
of AWEF and Compressor Runtimes, 1250 to Average Climate Zone Simulations
(1250 – Ave Climate Zone Simulation) / Ave Climate Zone Simulation
AWEF Compressor Runtimes
Condenser
In
Condenser
Out
Condenser
In
Condenser
Out
Small Freezer, AHRI 1250 + 21.3 + 10.7 - 3.3 - 12.0
Small Freezer, Proposed 1250 + 55.7 +15.3 + 22.7 - 10.6
Small Cooler, AHRI 1250 - 27.9 - 28.1 - 45.8 - 49.1
Small Cooler, Proposed 1250 + 16.7 + 28.6 + 21.9 + 14.2
Large Freezer, AHRI 1250 - 2.5 - 4.1 - 5.0 - 29.6
Large Freezer, Proposed 1250 + 5.8 - 13.7 - 4.3 - 29.2
Large Cooler, AHRI 1250 - 10.9 - 17.5 - 41.7 - 49.8
Large Cooler, Proposed 1250 + 12.5 + 6.2 + 2.4 - 8.5
Average AHRI 1250 - 5.0 - 9.8 - 24.0 - 35.1
Average Proposed 1250 + 22.7 + 9.1 + 10.7 - 8.5

457
Plotting the 1250 AWEF calculation values vs. the hourly simulation results,
obtained by Becker et al. (Becker et al. 2011) and the current work, shows very good
correlation between the calculation method and a simulated year of operation (Figure 9 and
Figure 10). The correlation between the calculation method and the hourly simulations was
improved for the coolers while the freezer results gave marginally worse correlation in
most cases.
Figure 9. AHRI or Proposed 1250 Calculated AWEF vs. Hourly Simulation AWEF
Comparison for (Becker et al. 2011) and the Current Work, Condenser Indoors

458
Figure 10. AHRI or Proposed 1250 Calculated AWEF vs. Hourly Simulation AWEF
Comparison for (Becker et al. 2011) and the Current Work, Condenser Outdoors
The relationship between the variations in the AWEF and the compressor runtimes
determined via the Standard 1250 calculation and the hourly simulations are consistent
between the results obtained by Becker et al. (Becker et al. 2011) and those obtained with
the Proposed 1250 calculation (Figure 11 and Figure 12). A trend line of this data does not
pass through the origin of the chart, however. Assuming that the compressor runtime
variance is zero, the AWEF variance would be + 17.7% for the outdoor condenser or
+14.4% for the indoor condenser system. Essentially, both the indoor and outdoor
calculation methods vary from actual by the same amount.

459
Figure 11. Percent Difference in AWEF vs. Percent Difference in Runtime for Proposed
1250 and AHRI 1250 (Becker et al. 2011) vs. Hourly Simulations, Box Out Condenser
Out

460
Figure 12. Percent Difference in AWEF vs. Percent Difference in Runtime for Proposed
1250 and AHRI 1250 (Becker et al. 2011) vs. Hourly Simulations, Box In Condenser In
Simulations completed by this work and Becker et al. (Becker et al. 2011) are
displayed in Figure 13. These simulations are all hourly simulations which were targeted to
represent actual refrigeration system operation. The current work AWEF values have
similar trending to Becker et al. results. The current simulations yielded AWEFs of a
smaller magnitude, primarily due to the inclusion of defrost systems for the coolers and
freezers analyzed. These AWEF values are therefore more representative of what will
actually be observed in practice.

461
Figure 13. AWEF vs. Runtime for eQuest Hourly Simulations of Current Work and
(Becker et al. 2011)
AWEF and compressor runtimes are presented in Figure 14 for the Proposed 1250
calculations and hourly simulations. Through analysis of this graph, one can see the large
discrepancy between the gap in the condenser in and condenser out compressor runtimes
for the Proposed 1250 calculation and the hourly simulations. The compressor runtime
equation (Equation 138) is primarily a function of the box load calculations. The only
variable changing from the box load calculations for the indoor and outdoor cases is the
ambient temperature.
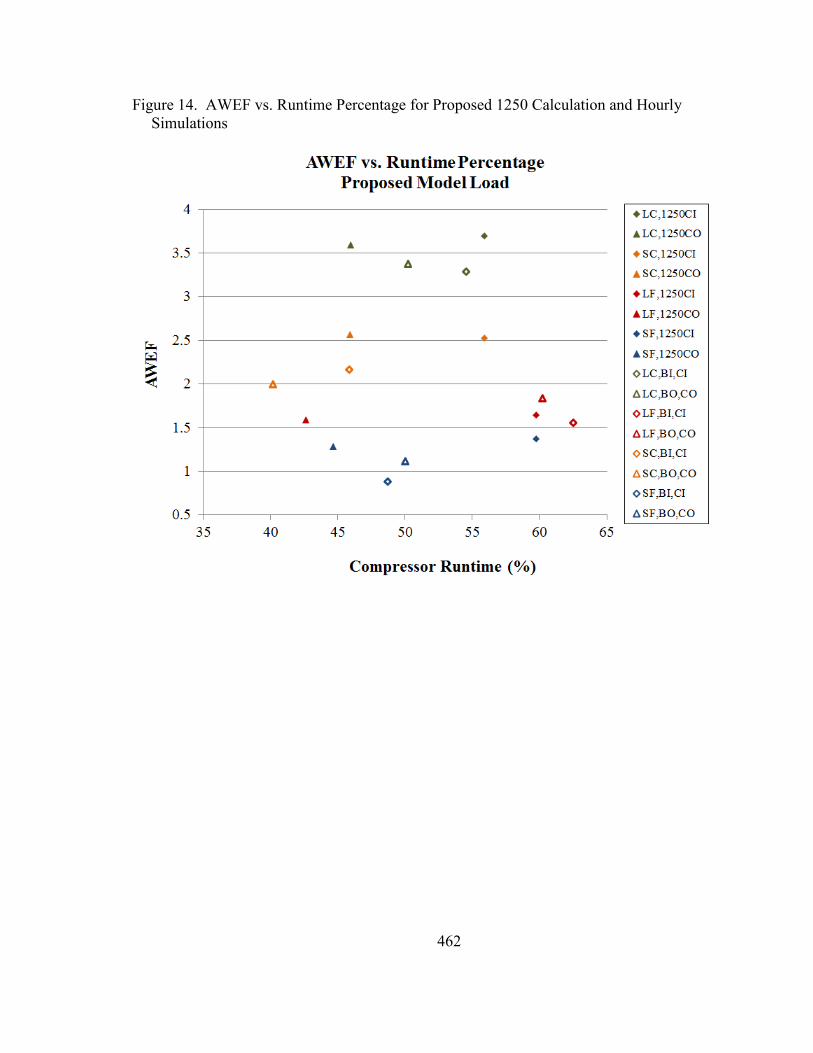
462
Figure 14. AWEF vs. Runtime Percentage for Proposed 1250 Calculation and Hourly
Simulations
463
CHAPTER 7
PROPOSED 1250 CALCULATION METHOD DISCUSSION
The results of this study and those obtained by Becker et al. (Becker et al. 2011)
show similar correlation between the AWEF calculated by the Standard equations, utilized
by either study, and the hourly simulations. Using Figure 11 and Figure 12 it was
determined that the difference between the hourly simulated AWEF and the Standard
calculated AWEF was + 14 to 17% at a compressor runtime difference of zero. Assuming
that this is due to a calculation issue with the AWEF, either the box load calculation is too
high or the electrical consumption calculation is too low. The box load and energy usage
associated with each simulation set was analyzed using Table 177 and Table 178. When
this information is plotted (Figure 15) clear relationships are shown. Variation of the
calculated AWEFs‟ correlation with hourly simulations essentially goes to zero when the
box load variation equals zero.
As a general rule, the box load determined via the proposed calculation method is
larger than the box load obtained via hourly weather data simulations. Some variation is
expected from the Standard calculation because the box load equations that define typical
cooler and freezer operation were developed by averaging box load definitions for large
and small coolers and freezers. Averaging the variations for the large and small units better
represents the discrepancy between the Proposed 1250 calculation and hourly weather data
simulations.

464
Table 177. Comparison of the Box Load and Electrical Usage via Hourly Simulations and
Standard 1250 Calculations
Box Load
(MBtu)
Energy Use
(kW-h)
AWEF
(Btu/W-h)
Runtime
(%)
Box Out, Condenser Out
Small Freezer, Proposed 1250 27.865 21786.43 1.28 44.70
Small Freezer, Hourly Simulation 21.880 19686.18 1.11 50.02
Small Cooler, Proposed 1250 25.753 10051.60 2.56 45.90
Small Cooler, Hourly Simulation 15.925 8006.85 1.99 40.19
Large Freezer, Proposed 1250 316.822 200879.05 1.58 42.69
Large Freezer, Hourly Simulation 384.555 210007.44 1.83 60.27
Large Cooler, Proposed 1250 633.227 176893.17 3.58 45.99
Large Cooler, Hourly Simulation 562.319 166834.94 3.37 50.28
Box In, Condenser In
Small Freezer, Proposed 1250 34.746 25426.27 1.37 59.80
Small Freezer, Hourly Simulation 17.573 19877.43 0.88 48.75
Small Cooler, Proposed 1250 28.477 11300.30 2.52 55.90
Small Cooler, Hourly Simulation 17.976 8311.74 2.16 45.84
Large Freezer, Proposed 1250 397.614 242438.07 1.64 59.80
Large Freezer, Hourly Simulation 350.143 225431.34 1.55 62.50
Large Cooler, Proposed 1250 719.935 195114.72 3.69 55.90
Large Cooler, Hourly Simulation 594.149 181383.58 3.28 54.59
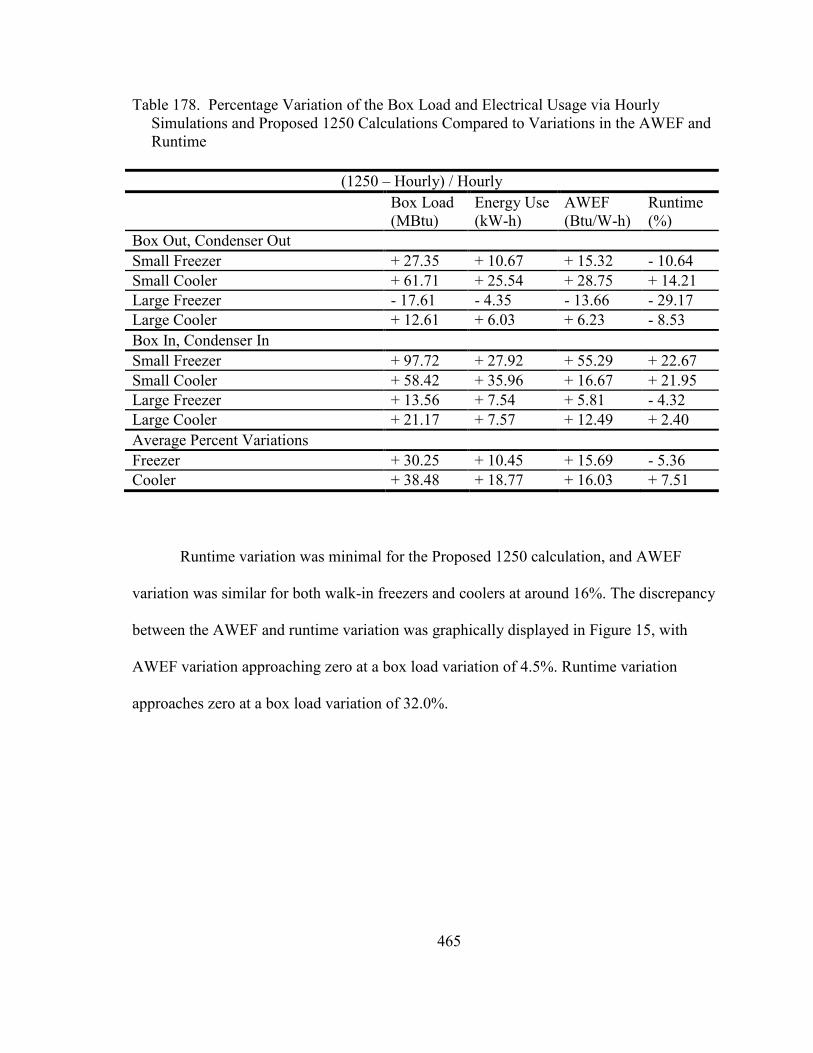
465
Table 178. Percentage Variation of the Box Load and Electrical Usage via Hourly
Simulations and Proposed 1250 Calculations Compared to Variations in the AWEF and
Runtime
(1250 – Hourly) / Hourly
Box Load
(MBtu)
Energy Use
(kW-h)
AWEF
(Btu/W-h)
Runtime
(%)
Box Out, Condenser Out
Small Freezer + 27.35 + 10.67 + 15.32 - 10.64
Small Cooler + 61.71 + 25.54 + 28.75 + 14.21
Large Freezer - 17.61 - 4.35 - 13.66 - 29.17
Large Cooler + 12.61 + 6.03 + 6.23 - 8.53
Box In, Condenser In
Small Freezer + 97.72 + 27.92 + 55.29 + 22.67
Small Cooler + 58.42 + 35.96 + 16.67 + 21.95
Large Freezer + 13.56 + 7.54 + 5.81 - 4.32
Large Cooler + 21.17 + 7.57 + 12.49 + 2.40
Average Percent Variations
Freezer + 30.25 + 10.45 + 15.69 - 5.36
Cooler + 38.48 + 18.77 + 16.03 + 7.51
Runtime variation was minimal for the Proposed 1250 calculation, and AWEF
variation was similar for both walk-in freezers and coolers at around 16%. The discrepancy
between the AWEF and runtime variation was graphically displayed in Figure 15, with
AWEF variation approaching zero at a box load variation of 4.5%. Runtime variation
approaches zero at a box load variation of 32.0%.
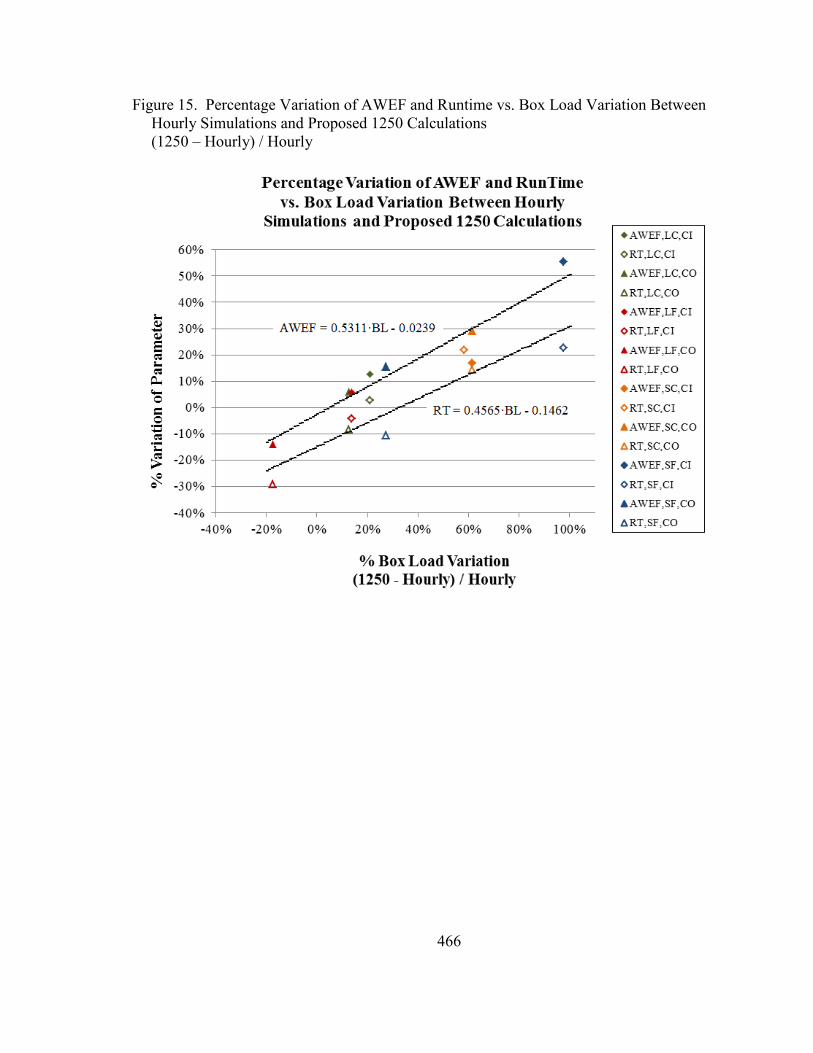
466
Figure 15. Percentage Variation of AWEF and Runtime vs. Box Load Variation Between
Hourly Simulations and Proposed 1250 Calculations
(1250 – Hourly) / Hourly
467
CHAPTER 8
CONCLUSIONS
Walk-in coolers and freezers consume 26.2% of commercial refrigeration energy
use, 1.5% of commercial building energy use, and 0.2% of the nation‟s energy use annually
(Arias 2005; Arias and Lundqvist 2006; Christensen and Bertilsen 2004; DOE 2004; Fricke
and Becker 2011; Goetzler et al. 2009; Henderson and Khattar 1999; Huan 2008; Sugiartha
et al. 2009; Walker 2001; Walker et al. 1990; Westphalen et al. 1996). This is equivalent to
76 trillion Btu/yr of energy use or 242 trillion Btu/yr of primary energy use (Patel et al.
1993). To improve the energy efficiency of the walk-in construction and operation, the
federal government and some state governments have enacted regulations dictating the
minimum design criteria.
The ANSI/AHRI 1250/1251 Standards (AHRI 2009b; AHRI 2009c) are referenced
by the federal regulations (DOE 2011). Because these standards are being applied to
legislature, it is essential that they appropriately represent refrigeration equipment
performance. Similar to the Environmental Protection Agency‟s MPG rating for vehicles,
the ANSI/AHRI 1250/1251 AWEF rating for refrigeration equipment is a relative
performance rating based on some assumptions. For rating mileage, certain driving
conditions, driving methods, and auxiliary loads are assumed. For rating refrigeration
equipment performance, certain operating conditions, operating methods, and walk-in
construction details are assumed. Both of these standard ratings vary from the actual results
based on the correlation of the assumed and actual conditions. Regardless of how precise
these rated values are, they should accurately portray which equipment is better from an
energy efficiency perspective. Additionally, they should portray this within a small range
468
of error from actual case to allow analysis of the integration of this equipment into the
building, for operating cost versus capital cost comparisons of different whole system
designs.
An extensive literature search has allowed the development of a detailed list of
items contributing to the refrigeration load imposed on walk-in coolers and freezers. In
addition to its application to this work, the walk-in load detail provides a foundation for
future investigations related to refrigerated storage.
The Proposed 1250 Standard equations yield an AWEF correlation of -2.4% but do
not accurately calculate the corresponding compressor runtime, with a variation of -14.6%,
when box load variation is removed from the analysis (Figure 15). A new compressor
runtime calculation method is needed to more accurately calculate this parameter.

469
REFERENCES
Adre, N., and Hellickson, M. L. 1989. Simulation of the transient refrigeration load in a
cold storage for apples and pears. ASHRAE Transactions 32(3):1038-1048.
AHRI. 2009a. AHRI Load Spreadsheet used to develop load profiles found in AHRI
Standard 1250/1251. Air-Conditioning, Heating and Refrigeration Institute,
Arlington, VA.
AHRI. 2009b. ANSI/AHRI Standard 1250 (I-P), 2009 Standard for Performance Rating of
Walk-In Coolers and Freezers. Air-Conditioning, Heating and Refrigeration
Institute, Arlington, VA.
AHRI. 2009c. ANSI/AHRI Standard 1251 (SI), 2009 Standard for Performance Rating of
Walk-In Coolers and Freezers. Air-Conditioning, Heating and Refrigeration
Institute, Arlington, VA.
Altwies, J. E. 1998. Electrical demand reduction in refrigerated warehouses. University of
Wisconsin - Madison, Madison, Wisconsin.
Altwies, J. E., and Reindl, D. T. 1999. Passive thermal energy storage in refrigerated
warehouses. 20th International Congress of Refrigeration, IIR/IIF. Sydney.
Anonymous. 2004. Walk-in refrigerators and freezers. Foodservice Equipment and
Supplies Sep 2004. 57(9):84-85.
Aparicio-Cuesta, M. P., and Garcia-Moreno, C. 1988. Quality of frozen cauliflower during
storage. Journal of Food Science 53(2):491-493. Food Technologies.
Arias, J. 2005. Energy usage in supermarkets - modelling and field measurements, Royal
Institute of Technology.
Arias, J., and Lundqvist, P. 2005. Modeling supermarkets energy usage. Proc. Vicenze
Conf.:109-116. IIR.
Arias, J., and Lundqvist, P. 2006. Heat recovery and floating condensing in supermarkets.
Energy & Buildings 38(2):73-81.
Ashby, B. H., Bennett, A. H., Bailey, W. A., Molerratanoud, W., and Kramer, A. 1979.
Energy savings and quality deterioration from holding frozen foods at two daily
temperature levels. Transactions of the American Society of Agricultural
Engineers:938-943.
ASHRAE. 1972. 1972 ASHRAE Handbook - Fundamentals. Atlanta, GA: American
Society of Heating, Refrigerating, and Air-Conditioning Engineers,
ASHRAE. 1977. 1977 ASHRAE Handbook - Fundamentals. Atlanta, GA: American
Society of Heating, Refrigerating, and Air-Conditioning Engineers,
ASHRAE. 1981. 1981 ASHRAE Handbook - Fundamentals. Atlanta, GA: American
Society of Heating, Refrigerating, and Air-Conditioning Engineers,
ASHRAE. 1989. 1989 ASHRAE Handbook - Fundamentals. Atlanta, GA: American
Society of Heating, Refrigerating, and Air-Conditioning Engineers,
ASHRAE. 1990. 1990 ASHRAE Handbook - Refrigeration. I-P Edition. Atlanta, GA:
American Society of Heating, Refrigerating, and Air-Conditioning Engineers,
ASHRAE. 1994. 1994 ASHRAE Handbook - Refrigeration. I-P Edition. Atlanta, GA:
American Society of Heating, Refrigerating, and Air-Conditioning Engineers,
ASHRAE. 1998. 1998 ASHRAE Handbook - Refrigeration. Atlanta, GA: American Society
of Heating, Refrigerating, and Air-Conditioning Engineers,

470
ASHRAE. 2002. 2002 ASHRAE Handbook - Refrigeration. Atlanta, GA: American Society
of Heating, Refrigerating and Air-Conditioning Engineers, Inc.,
ASHRAE. 2005. 2005 ASHRAE Handbook - Fundamentals. Atlanta, Georgia: American
Society of Heating, Refrigerating, and Air-Conditioning Engineers,
Azzouz, A., and Duminil, J. G. M. 1993. Experimental determination of cold loss caused
by opening industrial coldroom doors. International Journal of Refrigeration 16:57-
66.
Bansal, P. K., and Jain, S. 2007. Cascade systems: past, present, and future. ASHRAE
Transactions 113:245.
Bauernfeind, J. C., and Siemers, G. F. 1945. Retardation of discoloration in frozen sliced
peaches. Quick Frozen Foods 7:48.
Becker, B. R., and Fricke, B., A. 1996a. Transpiration and respiration of fruits and
vegetables. New Developments in Refrigeration for Food Safety and Quality,
International Institute of Refrigeration, Paris, France, and American Society of
Agricultural Engineers, St. Joseph, Michigan, 110-121.
Becker, B. R., and Fricke, B. A. 1996b. Simulation of moisture loss and heat loads in
refrigerated storage of fruits and vegetables. Refrigeration Science and Technology
Proceedings. Lexington, KT.
Becker, B. R., Fricke, B. A., and Sartin, B. C. 2011. Performance standards for walk-in
refrigerator and freezer systems (ARTI project 9002) final report.
Birdseye, C. 1946. The preservation of foods by freezing. Refrigerating Engineering
(Application Data 22) 2:51.
Blackmore, T. 2012. Refrigeration load calculations, Heatcraft. University of Missouri -
Kansas City, Thermal Science Systems and Components Lecture 6, February 16.
Kansas City, Missouri.
Boggs, M. M., Dietrich, W. C., Nutting, M., Olson, R. L., Lindquist, F. E., Bohart, G. S.,
Neumann, M. J., and Morris, M. J. 1960. Time-temperature tolerance of frozen
foods XXI: frozen peas. Food Technology 14:181.
Brown, W. G., and Solvason, K. R. 1962. Natural convection through rectangular openings
in partitions. I. vertical partitions. International Journal of Heat and Mass Transfer
5:859-868.
CEC. 2007. Appliance efficiency regulations. CEC-400-2007-016-REV1, California
Energy Commission, Sacramento, CA.
CEC. 2008. 2008 building energy efficieincy standards for residential and nonresidential
buildings. CEC-400-2008-001-CMF, California Energy Commission, Sacramento,
CA.
Chen, P., Cleland, D. J., Lovatt, S. J., and Bassett, M. R. 1999. Air infiltration into
refrigerated stores through rapid-roll doors. Proceedings of the 20th International
Congress of Refrigeration:925-932. IIR/IIF. Sydney.
Chen, P., Cleland, D. J., Lovatt, S. J., and Bassett, M. R. 2002. An empirical model for
predicting air infiltration into refrigerated stores through doors. International
Journal of Refrigeration 25:799-812.
Chourasia, M. K., Chatterjee, G., Biswas, I., Sahu, R., and Kumar, A. 2003. Cooling
parameters of potatoes in a commercial cold store. Journal of Interacademicia
7(2):186-189.
471
Chourasia, M. K., and Goswami, T. K. 2007. Product cooling load and moisture loss under
different loading patterns and cooling rates of potatoes in cold storage. Journal of
Food Process Engineering 31:339-353. Agricultural and Food Engineering
Department, India Institute of Technology. West Bengal, India.
Christensen, K. G., and Bertilsen, P. 2004. Refrigeration systems in supermarkets with
propane and CO2 - energy consumption and economy. EcoLibrium.
Chuangchid, P., and Krarti, M. 2001. Foundation heat loss from heated concrete slab-on-
grade floors. Building and Environment 36(5):637-655.
CIGR. 1999. CIGR Handbook of Agricultural Engineering.
Cleland, A. C. 1983. Simulation of industrial refrigeration plants under variable load
conditions. International Journal of Refrigeration 6(1):11-19.
Cleland, D. J., Boyd, N. S., and Cleland, A. C. 1982. A model for fish freezing and storage
on board small New Zealand fishing vessels. International Institute of
Refrigeration.
Cleland, D. J., Chen, P., Lovatt, S. J., and Bassett, M. R. 2004. A modified model to predict
air infiltration into refrigerated facilities through doorways. ASHRAE
Transactions:58-66.
Cleland, D. J., and O'Hagan, A. N. 2003. Performance of an air cooling coil under frosting
conditions. ASHRAE Transactions 109:243-250.
Cole. 1987. Infiltration load calculation for refrigerated warehouses. Heating, Piping, and
Air Conditioning 59(4):45-54.
Cole, R. A. Year. Infiltration: a load calculation guide. Proceedings of the Sixth
International Institute of Ammonia Refrigeration.
Cole, R. A. 1989. Refrigeration loads in a freezer due to hot gas defrost and their associated
costs. ASHRAE Transactions 95(2).
Congress, U. S. 2007. Energy Independence and Security Act of 2007 (42 USC 17001).
Cooper, C. E. B. 1973. Cold storage design and operation, some practical suggestions. FAO
Agricultural Services Bulletin No. 19. Food and Agriculture Organization of the
United Nations. Rome.
Devres, Y. O., and Bishop, C. F. H. 1995. Computer model for weight loss and energy
conservation in a fresh produce refrigerated store. Applied Energy 50:97-117.
Diehl, H. G., and Berry, J. A. Year. The temperature factor in the freezing preservation of
fruits and vegetables. Proceedings of the American Society for Horticultural
Science, 29:287-289.
DOE. 2004. U.S. Energy Flow Trends - 2002, Net Primary Resource Consumption ~97
Quads. L. L. N. L. Energy and Environment Directorate, ed., U.S. Department of
Energy.
DOE. 2006. 2004 commercial energy end-use splits, building energy data book. Office of
Energy Efficient and Renewable Energy, U.S. Department of Energy.
DOE. 2008. 2006 commercial energy end-use splits, building energy data book. Office of
Energy Efficiency and Renewable Energy, U.S. Department of Energy.
DOE. 2010a. DOE transcript - test procedures for walk-in coolers and freezers, notice of
proposed rulemaking public meeting.
DOE. 2010b. Preliminary technical support document (TSD): energy conservation program
for certain commercial and industrial equipment: walk-in coolers and walk-in

472
freezers. Office of Energy Efficiency and Renewable Energy, U.S. Department of
Energy, Washington, D.C.
DOE. 2010c. Test procedures for walk-in coolers and freezers notice of proposed
rulemaking presentation. Building Technologies Program, U.S. Department of
Energy, March 24.
DOE. 2011. Energy Conservation Program: Test Procedures for Walk-in Coolers and
Walk-in Freezers; Final Rule. O. o. E. E. a. R. Energy, ed., U.S. Department of
Energy, 21580-21612.
Downing, C. C., and Meffert, W. A. 1993. Effectiveness of cold-storage door infiltration
protective devices. ASHRAE Transactions 99(2):356-366.
Edwards, B. 2010. California statewide codes and standards program - comments on walk-
in test method. Re: NOPR for Test Procedures for Walk-in Coolers and Freezers,
Docket No. EERE-2008-BT-TP-0014 and (RIN) 1904-AB85, U.S. Department of
Energy.
Elsayed, M. M. 1998. Infiltration in cold rooms. Heating, Ventilation, Air Conditioning
and Refrigeration Research 4(2):179-202.
Emerson. 2012. Emerson Climate Technologies Online Product Information. Emerson
Climate Technologies,
https://opi.emersonclimate.com/was.extension.opi.web/OPIInterfaceServlet. August
2012.
Faramarzi, R. 1999. Efficient display case refrigeration. ASHRAE Journal 41(11):46.
Faramarzi, R. T., Coburn, B. A., and Sarhadian, R. 2002. Performance and energy impact
of installing glass doors on an open vertical deli/dairy display case. ASHRAE
Transactions 108(1):673-679.
FDA. 2001. Food Code 2001. Washington, D.C.: U.S. Department of Health and Human
Services,
Foster, A. M., Swain, M. J., Barrett, R., and James, S. J. 2003. Experimental verification of
analytical and CFD predictions of infiltration through cold store entrances.
International Journal of Refrigeration-Revue Internationale du Froid 26(8
December):918-925.
Fricke, B. A., and Becker, B. R. 2011. Comparison of vertical display cases: energy and
productivity impacts of glass door versus open vertical display cases. ASHRAE
Transactions 117(1).
Fritzsche, C., and Lilienblum, W. 1968. Neue messengun zur bestimmung der kalterluste
an kuhlraumturen. Kaltetechnik-Kilimatiserung 20:279-286.
Goetzler, W., Goffri, S., Jasinski, S., Leggett, R., Lisle, H., Marantan, A., Millard, M.,
Pinault, D., Westphalen, D., and Zogg, R. 2009. Energy savings potential and
research and development opportunities for commercial refrigeration, final report.
to U.S. Department of Energy, Energy Efficient and Renewable Energy Building
Technologies Program from Navigant Consulting, Inc.
Gortner, W. A., Fenton, F., Volz, F. E., and Gleim, E. 1948. Effect of fluctuating storage
temperatures on quality of frozen foods. Industrial and Engineering Chemistry
Research 40(8):1423-1426.
Gosney, W. B., and Olama, H. A. L. 1975. Heat and enthalpy gains through cold room
doorways. Proceedings of the Institute of Refrigeration:31-41.

473
Granryd, E. 2003. Refrigerating engineering, part 2. Department of Energy Technology,
Royal Institute of Technology, Stockholm, Sweden.
Hardenburg, R. E., Watada, A. E., and Wang, C. Y. 1986. The Commercial Storage of
Fruits, Vegetables, and Florist and Nursery Stocks. Washington, D.C.: U.S.
Department of Agriculture,
Hayes, F. C., and Stoecker, W. F. 1969. Heat transfer characteristics of air curtains and
design data for air curtains. ASHRAE Transactions 75(2):153-180.
Heatcraft. 2008. Engineering Manual: Commercial Refrigeration Cooling and Freezing
Load Calculations and Reference Guide. Stone Mountain, GA: Heatcraft
Refrigeration Products, LLC,
Henderson, H. I. J., and Khattar, M. 1999. Measured impacts of supermarket humidity
level on defrost peformance and refrigerating system energy use. ASHRAE
Transactions 105:508-520.
Hendrix, W. A., Henderson, D. R., and Jackson, H. Z. 1989. Infiltration heat gains through
cold-storage room doorways. ASHRAE Transactions 95(2):1155-1168.
Hirsch, J. J. 2006. eQuest-Refrigeration, version 3.61.
Huan, Z. 2008. Energy saving opportunities in food 'cold chain'. Vaal University of
Technology, School of Mechanical Engineering, Vanderbijlpark.
Hustrulid, A., and Winters, J. D. 1943. The effect of fluctuating storage temperatures on
frozen fruits and vegetables. Agricultural Engineering 24(2):416.
Hwang, Y., Jin, D.-H., and Radermacher, R. 2007. Comparison of R-290 and two HFC
blends for walk-in refrigeration systems. International Journal of Refrigeration
30(4):633-641. Elsevier Ltd. Langford Lane, Kidlington, Oxford, OX5 1GB, United
Kingdom.
IARW. 1999. Energy Conservation Manual. International Association of Refrigerated
Warhouses,
IIR. 1986. Recommendations for the Processing and Handling of Frozen Foods. 3rd.
International Institute of Refrigeration,
ISO. 1998. ISO 13370, Thermal Performance of Building - Heat Transfer via the Ground
Calculation Method.
Jekel, T. B., and Reindl, D. T. 2000. Energy efficiency opportunities at SuperValu.
University of Wisconsin, HVAC&R Center, Madison, WI.
Jones, B. W., Beck, B. T., and Steele, J. P. 1983. Latent loads in low humidity rooms due
to moisture. ASHRAE Transactions 89:35-55.
Kassa, H., Keil, C., and Fent, K. W. 2004. A protocol for quantitative measurement of light
intensity levels in food service operations. Journal of Environmental Health
67(2):9-14.
Kays, S. J. 1991. Postharvest Physiology of Perishable Plant Products. New York: Van
Nostrand Reinhold,
Kimber, D. J. 1998. Final technical progress report. Nevada Energy Control Systems, Inc.,
Incline Village, NV.
Klein, S. A., and Alvarado, F. L. 1999. EES-Engineering Equation Solver. F-Chart
Software, Middleton, WI.
Knudsen, H. J. H., and Pachai, A. C. 2004. Energy Comparisons Between CO2 Cascade
Systems and State of the Art R404a Systems. Technical University of Denmark.
474
Krack. 1977. Krack Refrigeration Load Estimating Manual RLE-278. Krack Corporation,
Krack. 1992. Krack Refrigeration Load Estimating Manual RLE-278. Krack Corporation,
Krarti, M. 1999. Ground-coupled Heat Transfer, a Chapter in: Advances in Solar Energy.
Boulder, CO: ASES,
Krarti, M., Chuangchid, P., and Ihm, P. 2004. Analysis of moisture and heat transfer
beneath freezer foundations. part 1. ASME Journal of Solar Energy Engineering
126(2):716-725.
Krarti, M., Claridge, D., and Kreider, J. 1988. ITPE method applications to time-varying
two-dimensional ground-coupling problems. International Journal of Heat and
Mass Transfer 31(1):899-911.
Kun, X., Ben-zhe, X., Tian-ji, C., and Mao-quan, G. 2007. Analysis of Reclamation of Low
Quality Exhausting Thermal Energy from Refrigerated Warehouse. College of Food
Science, Shanghai Fisheries University, Shanghai, China.
Larkin. 2007. Compak Unit Coolers - Technical Guide; LK-LOPTB. Stone Mountain, GA:
Larkin,
Longdill, G. R., Frazerhurst, L. F., and Wyborn, L. G. 1974. Air curtains. MIRINZ Publ.
No. 385. MIRINZ. Hamilton, New Zealand.
Longdill, G. R., and Wyborn, L. G. 1978. Performance of air curtains in single-storey cold
stores. Proceedings of the 15th International Congress of Refrigeration 4:77-88.
Love, R. J., and Cleland, D. J. 2007. A model for self-contained solid door refrigerated
display cabinets. ASHRAE Transactions 113:253-262.
Lutz, J. M., Wright, R. C., and Caldwell, J. S. 1934. Preservation of young and lucretia
varieties of dewberries. Fruit Prod. Journal 9:267-269.
Mago, P. J., and Sherif, S. A. 2002. Dynamics of coil-defrosting in supersaturated freezer
air. Journal of Mechanical Engineering Science 216(C10):949-958.
Mago, P. J., and Sherif, S. A. 2005. Coil frosting and defrosting issues at low freezer
temperatures near saturation conditions. ASHRAE Transactions 111:3-17.
Magoo, N. 2003. High-temperature refrigerated warehouse operation under real-time
pricing of electricity, University of Wisconsin-Madison, Madison, WI.
Manske, K. A. 1999. Performance optimization of industrial refrigeration systems,
University of Wisconsin - Madison, Madison, WI.
Marchese, J. 2002. Sizing walk-in coolers and freezers. Air Conditioning, Heating and
Refrigeration News June 3, 2002. 216(5):27.
Marshall, S. A., and James, R. W. 1975. Dynamic analysis of an industrial refrigeration
system to investigate capacity control. Proceedings of the Institute of Mechanical
Engineers 189:437-444.
McHugh, J. 2010. California statewide IOU codes & standards program NOPR test
procedures for walk-in coolers and freezers: introductory comments. McHugh
Energy Consultants, Inc., Orangevale, CA.
Mitchell, J. W., and Braun, J. E. 1998. Design, analysis, and control of space conditioning
equipment and systems. University of Wisconsin-Madison.
Mitchell, J. W., Urban, R. E., Beckman, W. A., Dorgan, C. E., and Lindell, C. J. 1992.
Analysis of supermarket dehumidification alternatives. EPRI TR-100352; Project
2891-03; Final Report, Electric Power Research Institute, Solar Energy Laboratory,
University of Wisconsin-Madison.
475
Morris, K. 2012. Equipment Selections. Charles D. Jones Co., University of Missouri -
Kansas City, Thermal Science Systems and Components Lecture 8, March 1.
Kansas City, Missouri.
Nagaraju, J., Vikash, K., and Krishna Murthy, M. V. 2001. Photovoltaic-powered cold
store and its performance. International Journal of Energy Research 25(5):389-396.
John Wiley and Sons Ltd.
Navy. 1986. Refrigeration Systems for Cold Storage. Design Manual 3.04. Naval Facilities
Engineering Command,
Nelson, B. I. 2011. Optimizing Hot Gas Defrost. Colmac Coil Manufacturing, Inc.,
Colville, WA.
Newell, T. 2011. Ground heat transfer. ASHRAE Journal 53(2):62-68.
O'Hagan, A., Cleland, D. J., and Cleland, A. C. 1993. Air cooling coil performance under
frosting conditions. IIF-IIR Commissions B1,B2,D1,D2/3 3:345-362. Palmerston
North (New Zealand).
Patel, R. F., Teagan, P. W., and Dieckmann, J. T. 1993. Characterization of commercial
building appliances. ADL Reference No. 42520, Building Equipment Division,
Office of Building Technologies, U.S. Department of Energy.
PG&E. 2004. Analysis of standards options for walk-in coolers (refrigerators) and freezers.
Pacific Gas and Electric Company.
PG&E. 2007. Final report: refrigerated warehouses. Pacific Gas and Electric Company,
San Francisco, CA.
Pham, Q. T., and Oliver, D. W. 1982. Air infiltration into cold stores. Proceedings of the
22nd Meat Industry Res. Conf.:106-112.
Pham, Q. T., and Oliver, D. W. 1983. Infiltration of air into cold stores. Proceedings of
16th International congress of Refrigeration, IIR, Comm D1 4:67-72. Paris, Frane.
Plagge, H. H. 1938. Suggestions for freezing and storing fruits in refrigerated locker plants.
Ice and Refrigeration 95:31.
Rea, M. S., Ph.D., Editor-in Chief. 2000. The Iesna Lighting Handbook Reference and
Application. Illuminating Engineering Society of North America,
Reindl, D. T., and Jekel, T. B. 2008. Infiltration rate determination for low temperature
freezing systems. ASHRAE Transactions:264-272.
Roy, M. 2010. Green warehouse. ASHRAE Journal:64-70.
Royal, R. 2010. Heat recovery in retail refrigeration. ASHRAE Journal:14-22.
Sami, S. M., and Tulej, P. J. 1996. Drop-in-replacement blend HFC-23/HCFC-22/HFC-
152A for air/refrigerant equipment. International Journal of Energy Research
20(9):787-796. John Wiley & Sons Ltd. Chichester, United Kingdom.
Sand, J. R., Fischer, S. K., and Baxter, V. D. 1997. Energy and global warming impacts of
HFC refrigerants and emerging technologies. Oak Ridge National Laboratory.
SCE. 2008. Preliminary CASE report: analysis of standards option for walk-in refrigerated
storage. Southern California Edison, Sacramento, CA.
SCE. 2009. Evaluation of an internet-based refrigeration monitoring and control system.
Design and Engineering Services, Southern California Edison, Sacramento, CA.
Schulak, E. R., and Horvay, J. B. 2002. Energy transfer system for cold storage facilities.
Sekhar, S. J., Kumar, K. S., and Lal, D. M. 2004. Ozone friendly HFC134a/HC mixture
compatible with mineral oil in refrigeration system improves energy efficiency of a
476
walk in cooler. Energy Conversion and Management 45(7-8):1175-1186. Elsevier
Ltd.
Sekhar, S. J., and Lal, D. M. 2005. HFC134a/HC600a/HC290 mixture a retrofit for CFC12
systems. International Journal of Refrigeration 28(5):735-743. Elsevier Ltd.
SEL, Transsolar, CSTB, and TESS. 2006. Weather Data. TRNSYS 16: A Transient System
Simulation Program, Solar Energy Laboratory, University of Wisconsin-Madison,
TRANSSOLAR Energietechnik GmbH, Centre Scientifique et Technique du
Batiment, Thermal Energy Systems Specialists.
Sezgen, O., and Koomey, J. G. 1995. Technology data characterizing refrigeration in
commercial buildings: application to end-use forecasting with COMMEND 4.0.
Lawrence Berkeley National Laboratory, Berkeley, CA.
Shaw, B. H. 1971. Heat and mass transfer by natural convection and combined natural
convection and forced air flow through large rectangular openings in a vertical
partition. Symposium on Heat and Mass Transfer by Combined Forced and Natural
Convection:31-39.
Sherif, S. A., Mago, P., Mutawa, N. K., Theen, R. S., and Bilen, K. 2001. Psychrometrics
in the supersaturated frost zone. ASHRAE Transactions 107(2).
Sherif, S. A., Mago, P. J., and Theen, R. S. 2002. A study to determine heat loads due to
coil defrosting - phase 2. UFME/SEECL-200201, University of Florida, Atlanta,
GA.
Smith, G. R. 1989a. Theoretical cooling coil calculations at freezer temperatures to avoid
unfavorable coil frost. ASHRAE Transactions 95(2):1138-1148.
Smith, G. R. 1992. Latent heat, equipment-related load, and applied psychrometrics at
freezer temperatures. ASHRAE Transactions 98(2):649-657.
Smith, W. W. 1989b. Computerizing refrigeration load calculations. ASHRAE Journal
31(11).
Somrani, R., Mun, J., and Krarti, M. 2008. Heat transfer beneath ice-rink floors. Building
and Environment 43(10):1687-1698.
Stegmann, R. 2000. Low temperature refrigeration - practical guide. ASHRAE Journal.
Stoecker, W. F. 1998. Industrial Refrigeration Handbook. New York: McGraw Hill,
Stoeckle, R. 2000. Refrigerated warehouse operation under real-time pricing, University of
Wisconsin - Madison, Madison.
Stoeckle, R., Reindl, D. T., and Mitchell, J. W. 2002. Strategies for operating refrigerated
warehouse under real-time pricing. ASHRAE Transactions 108:145-154.
Sugar_Engineers. 2012. Psychrometric Calculations.
http://www.sugartech.co.za/psychro/index.php. March 14, 2012.
Sugiartha, N., Tassou, S. A., Chaer, I., and Marriot, D. 2009. Trigeneration in food retail:
an energetic, economic and environmental evaluation for supermarket application.
Applied Thermal Engineering 29:2624-2632.
Sujau, M., Bronlund, J. E., Merts, I., and Cleland, D. J. 2006. Effect of defrost frequency
on defrost efficiency, defrost heat load and coolstore performance. Innovative
Equipment and Systems for Comfort and Food Preservation, Auckland, New
Zealand, 525-532.
Takahashi, K., and Inoh, M. 1963. Some measurements on air curtain efficiency for cold
rooms. Proceedings of the International Congress of Refrigeration 2:1035-1039.

477
Tamm, W. 1965. Air flow with air curtains to protect cold rooms. Proceedings of the 11th
International Congress of Refrigeration 2:1025-1038.
Tamm, W. 1966. Kälteverluste durch kühlraumtüren. Kältetechnik 18:142-144.
Tamm, W. 1969. Australian Institute of Refrigeration, Air Conditioning, and Heating
23(12):41-43.
Thompson, J. F., and Spinoglio, M. 1996. Small-scale cold rooms for perishable
commodities. University of California, Division of Agriculture and Natural
Resources, Oakland, CA.
Tressler, D. K., and Evers, C. F. 1947. The Freezing Preservation of Foods. New York:
Avi Publishing Co. Inc.,
Unattributed. 1969. Food Engineering November 1969.
USDA. 2010. Capacity of refrigerated warehouses. 2009 summary. United States
Department of Agriculture.
Van Male, J. 1983. New concept for a vertical air curtain for cold storage doors.
Proceedings of the 16th International Congress of Refrigeration 5:89-95.
Wade, N. L. 1984. Estimation of the refrigeration capacity required to cool horicultural
produce. International Journal of Refrigeration 7(6):358-366.
Walker, D. H. 1992. Field testing of high-efficiency supermarket refrigeration. EPRI TF-
100351, Project 2569-06, Final Report, Foster-Miller, Inc., Waltham, MA.
Walker, D. H. 2001. Development and demonstration of an advanced supermarket
refrigeration/HVAC system. Oak Ridge National Lab.
Walker, D. H., and Baxter, V. D. 2002. Field testing of an advanced low-charge
supermarket refrigeration system. IIR Commission D1/B1, International Institute of
Refrigeration, Urbana, IL, 14p.
Walker, D. H., and Baxter, V. D. 2003. Analysis of advanced, low-charge refrigeration for
supermarkets. ASHRAE Transactions 109 PART 1:285-292.
Walker, D. H., and Deming, G. I. 1989. Supermarket refrigeration modeling and field
demonstration. EPRI Report No. CU-6268, Electric Power Research Institute, Palo
Alto, CA.
Walker, D. H., Tsaros, T. L., Deming, G. I., and of Foster-Miller, I. 1990. Guide for
selection of supermarket refrigeration systems. EPRI CU-6740; Project 2569-6;
Final Report, Foster-Miller Inc., Waltham, MA.
Westphalen, D., Zogg, R. A., Varone, A. F., and Foran, M. A. 1996. Energy savings
potential for commercial refrigeration equipment. Building Equipment Division,
Office of Building Technologies, U.S. Department of Energy, Cambridge,
Massachusetts.
Wichman, A., and Braun, J. E. 2009. Fault detection and diagnostics for commercial
coolers and freezers. HVAC&R Research 15(1):77-99.
Wiegand, E. H. 1931. The frozen pack method of preserving berries. Oregon Agricultural
Experiment Station Bulletin 278. Oregon State Agricultural College.
Winters, J. D. 1942. Quality of frozen fruits and vegetables. Minnesota Agricultural
Experiment Station Bulletin 362.
Woodroof, J. G., and Shelor, E. 1947. Effect of freezing storage on strawberries,
blackberries, raspberries, and peaches. Journal of Food Freezing:206-209.

478
Zhang, C., Ding, G., and Li, H. 1999. New three-zone model for performance prediction of
adiabatic capillary tubes. Shanghai Jiaotong Daxue Xuebao/Journal of Shanghai
Jiaotong University 33(8 Aug):934-938.
Zhang, J., and Groll, E. A. 2005. Survey of the design of refrigeration plants for public
refrigerated warehouses. ASHRAE Transactions 111:327-332.
Zhang, M. 2006. Energy analysis of various supermarket refrigeration systems.
International Refrigeration and Air Conditioning Conference.
479
VITA
Bryan Curtis Sartin was born on December 19, 1984, to John Curtis and Peggy Lee
Sartin in Warrensburg, Missouri. He received elementary and secondary education in the
Concordia R2 School District, graduating third in his class. He received a Trustee‟s
Scholarship to the University of Missouri – Rolla (UMR) in 2003. Alongside receiving an
education, Mr. Sartin held membership in Pi Tau Sigma, Tau Beta Pi, and Phi Eta Sigma.
He was active in ASME serving various officerships, managed an intramural sports team,
and spent one year as a residential assistant. Mr. Sartin had five internships at various
companies, including Lexmark, Ford Motor Company, Caterpillar, Hunter Engineering,
and Doe Run Resource Recycling. He also had six additional part-time positions, including
work as an undergraduate assistant for laser-aided manufacturing development and a grader
for the introductory Mechanical Engineering thermodynamics course at UMR. Mr. Sartin
obtained his Engineer-in-Training Certification in March of 2008 and graduated summa
cum laude in December of 2008 with a Bachelor of Science degree in Mechanical
Engineering and a minor in Spanish.
After losing his job offer at graduation due to economic reasons, Mr. Sartin spent
six month working as a laborer and searching for employment as an engineer. In mid-2009,
he started working in the Research and Development group for SPX Cooling Technologies,
Inc. Over the last three years, he has worked in four different departments and led projects
ranging from product development to manufacturing. In the spring of 2010, he began work
toward his M.S. in Mechanical Engineering at the University of Missouri – Kansas City.
Upon completion of his degree requirements, Mr. Sartin plans to continue his work as a

480
design and project engineer, while beginning to work towards obtaining his professional
licensure as an engineer.
His work with “Walk-in Performance Modeling and Validation of Simplified
Performance Rating Methods” has been published with his seniors, Dr. Bryan Becker and
Dr. Brian Fricke, at the 2011 ASHRAE Conference in Montreal, Canada.