The Euro imbalances and Financial Deregulation: A Post Keynesian ...
Federal Communications LawJournal
Volume 58 | Issue 3 Article 12
6-2006
Deregulation and Market Concentration: AnAnalysis of Post- 1996 ConsolidationsEli M. NoamColumbia Institute for Tele-Information
Follow this and additional works at: http://www.repository.law.indiana.edu/fclj
Part of the Administrative Law Commons, Antitrust and Trade Regulation Commons, and theCommunications Law Commons
This Symposium is brought to you for free and open access by the LawSchool Journals at Digital Repository @ Maurer Law. It has been acceptedfor inclusion in Federal Communications Law Journal by an authorizedadministrator of Digital Repository @ Maurer Law. For more information,please contact [email protected].
Recommended CitationNoam, Eli M. (2006) "Deregulation and Market Concentration: An Analysis of Post- 1996 Consolidations," Federal CommunicationsLaw Journal: Vol. 58: Iss. 3, Article 12.Available at: http://www.repository.law.indiana.edu/fclj/vol58/iss3/12
Deregulation and MarketConcentration: An Analysis of Post-1996 Consolidations
Eli M. Noam*
I. THE ISSUE ..................................................................................... 539II. THE CHANGING INDUSTRY STRUCTURE ...................................... 541
HI. EMPIRICAL FINDINGS ................................................................... 542
A. Vertical Concentration .......................................................... 546B. Local Concentration ............................................................. 547
IV. INTERPRETATION OF RESULTS ..................................................... 548V . O UTLOOK ..................................................................................... 549
I. THE ISSUE
For several decades, U.S. policy in telecommunications and electronicmass media focused on the encouragement of competition. This policy,usually known as deregulation but more accurately described asliberalization, is aimed at an opening of the market to competitors and areduction of market power. There were numerous elements andproceedings to this policy by the Federal Communications Commission("FCC"), the states' public service commissions and legislatures, thecourts, and Congress. Of these actions, none was more comprehensive than
*Professor and Director, Columbia Business School, Columbia Institute for Tele-
Information.
540 FEDERAL COMMUNICATIONS LA W JOURNAL
the Telecommunications Act of 1996 ("1996 Act").What has been the impact of this policy? In this Essay, I will focus on
one dimension: the impact of liberalization on market concentration.This question has acquired some urgency in light of the meltdown in
the telecommunications sector following the boom years of the 1990s. Thatdownturn may be temporary, and the industry will recover. But the morefundamental issue is that the telecommunications industry may haveentered into a pattern of boom-bust cycles.
While business cycles are traditional to many industries, intelecommunications they are a new phenomenon. Telecommunicationsused to be less volatile than the economy as a whole. It grew steadily, withlong planning horizons hardly ruffled by the business cycle. But today, insharp contrast, the telecommunications sector is potentially more volatilethan the economy, more like the airline business and less like waterutilities.
Perhaps the major reason for instability has been the fundamentaleconomic characteristic of many network industries with high fixed costsand low marginal costs. The telecommunications industry is characterized,on the supply side, by huge investments followed by tiny costs of servingadditional customers, plus positive network externalities on the demandside. This creates economies of scale, scope, and networking. The resultantincentives are to be large and to expand early, which in the aggregatecreates industry-wide overcapacity. Price competition then drives downprices to unprofitable levels. In telecommunications, price differentiationand asset redeployment are difficult, much harder than for airlines. Bustcycles follow. We have encountered the first of these cycles, but surely notthe last, because the factors of instability will remain: low marginal costs,high fixed costs, inelastic demand, positive network externalities, lags insupply, disinvestment and regulation, and a Wall Street short-termperspective that amplifies industry cycles.
If instability will be part of the environment, what willtelecommunications companies do? The textbook responses are to cutcosts, lower prices, differentiate products, and increase innovation. Butthese strategies can be expensive and will quickly be matched bycompetitors, which will leave every supplier firm even worse off.
The other major strategy will therefore be to raise prices abovecompetitive levels, and to reduce competition and the commodification thatlowers profitability and future investments. To do so requires market powerby a single firm or an oligopoly.
[Vol. 58
POST-1996 CONSOLIDATIONS
II. THE CHANGING INDUSTRY STRUCTURE
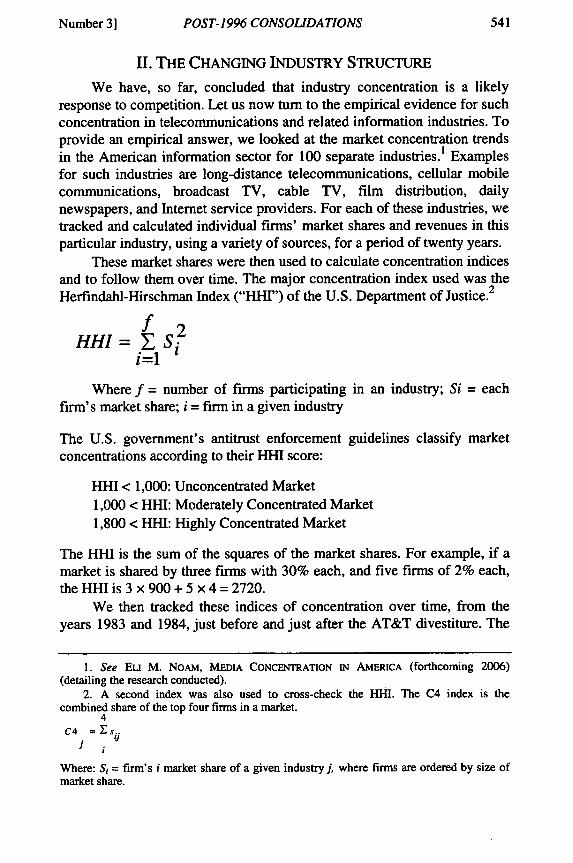
We have, so far, concluded that industry concentration is a likelyresponse to competition. Let us now turn to the empirical evidence for suchconcentration in telecommunications and related information industries. Toprovide an empirical answer, we looked at the market concentration trendsin the American information sector for 100 separate industries.I Examplesfor such industries are long-distance telecommunications, cellular mobilecommunications, broadcast TV, cable TV, film distribution, dailynewspapers, and Internet service providers. For each of these industries, wetracked and calculated individual firms' market shares and revenues in thisparticular industry, using a variety of sources, for a period of twenty years.
These market shares were then used to calculate concentration indicesand to follow them over time. The major concentration index used was theHerfindahl-Hirschman Index ("HHL") of the U.S. Department of Justice. 2
HHI= Si='
Where f = number of firms participating in an industry; Si = eachfirm's market share; i = firm in a given industry
The U.S. government's antitrust enforcement guidelines classify marketconcentrations according to their HHI score:
HHI < 1,000: Unconcentrated Market1,000 < HHI: Moderately Concentrated Market1,800 < HHI: Highly Concentrated Market
The HHI is the sum of the squares of the market shares. For example, if amarket is shared by three firms with 30% each, and five firms of 2% each,the HHI is 3 x 900 + 5 x 4 = 2720.
We then tracked these indices of concentration over time, from theyears 1983 and 1984, just before and just after the AT&T divestiture. The
1. See Eu M. NOAM, MEDIA CONCENTRATION IN AMERICA (forthcoming 2006)(detailing the research conducted).
2. A second index was also used to cross-check the HHI. The C4 index is thecombined share of the top four firms in a market.
4C4 = s..
J i
Where: Si = firm's i market share of a given industry j, where firms are ordered by size ofmarket share.
Number 31
542 FEDERAL COMMUNICATIONS LAW JOURNAL
year 1996 was the important midpoint, permitting a comparison of thetrends preceding and following the 1996 Act.
We then proceed to aggregate the individual industries along thedimensions of broader sectoral categories such as telecommunications ormass media, and along the dimensions of regulated industries, such aswhether they are regulated telecommunications industries or not. Theweighted aggregate HHI is defined as:
n m. f
WAHIZ a
Where j = an industry; mj = total revenue of an industry; Si = eachfirm's market share of an industry; n = number of industries in a specificsubset of the information sector;f= number of firms in an industry.3
We look at the four major subsectors of the information sector: (1)Telecommunications, (2) Mass Media, (3) Internet, (4) InformationTechnology ("IT"). For each of those sectors, we define two categories ofindustries: (a) Regulated (e.g., local telecommunications, TV stations); (b)Unregulated (e.g., film distribution, fax machines).
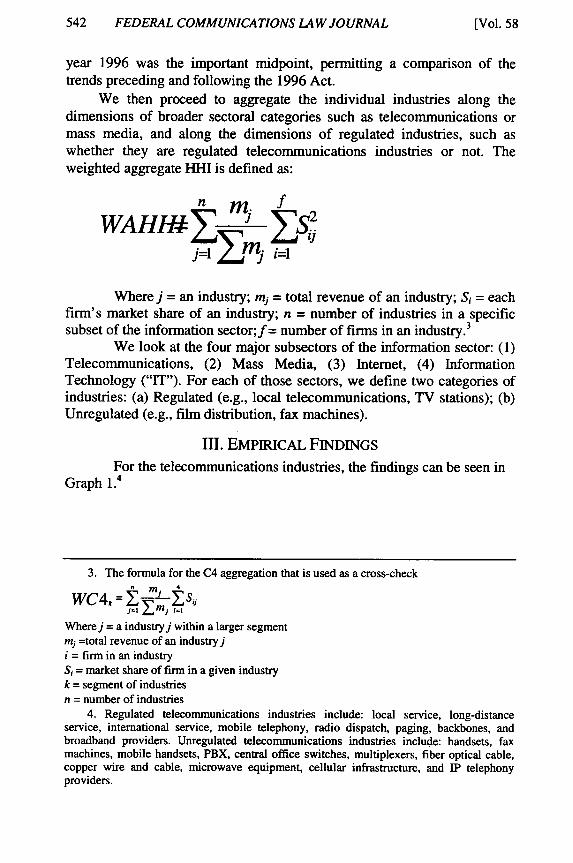
III. EMPIRICAL FINDINGSFor the telecommunications industries, the findings can be seen in
Graph 1.4
3. The formula for the C4 aggregation that is used as a cross-checkn 4
WC4k=z M sj-1 E M j i=1i
Wherej = a industryj within a larger segmentmj =total revenue of an industryji = firm in an industrySi = market share of firm in a given industryk = segment of industriesn = number of industries
4. Regulated telecommunications industries include: local service, long-distanceservice, international service, mobile telephony, radio dispatch, paging, backbones, andbroadband providers. Unregulated telecommunications industries include: handsets, faxmachines, mobile handsets, PBX, central office switches, multiplexers, fiber optical cable,copper wire and cable, microwave equipment, cellular infrastructure, and IP telephonyproviders.
[Vol. 58
POST-1996 CONSOLIDATIONS
Graph 1: Telecom Industries Market Concentration(HHI)
3500
3000
HH
2500
2000 .
1500
1000
500-
01983 2001
[- Regulated -B3- Unregulated
Points below the lower horizontal line are below HHI of 1000, i.e.,in the range of unconcentrated industries. HHI points above the upperhorizontal line are in the concentrated range of >1,800. Unregulatedtelecommunications industries decline in concentration in the 1980s, afterthe AT&T divestiture, which opened equipment and long-distance markets.The trend is flat after 1988, and industry concentration is high. After 2001,with the large equipment makers in decline, market concentration droppedstill further.
But most interesting is the concentration trend of the regulatedtelecommunications industries: starting at highly concentrated levels in theearly 1980s, overall concentration declines, especially after the 1983-84AT&T divestiture, but also thereafter until 1996-the year of thederegulatory 1996 Act. Around that time, the concentration level is at itslowest, though barely touching the bottom range of high concentration. Butfollowing that period, concentration rises again.
We also conducted similar calculations for the mass mediaindustries.5 Several of these were also affected by the 1996 Act. Graph 2
5. The category of regulated mass media industries includes: TV prime timeproduction, radio stations, TV stations, DBS providers, cable TV operators, and TVnetworks. The category of unregulated but materially affected industries includes: DBSequipment, cable TV set-top converters, radio networks, TV syndication, cable TV
Number 3]
544 FEDERAL COMMUNICATIONS LAW JOURNAL
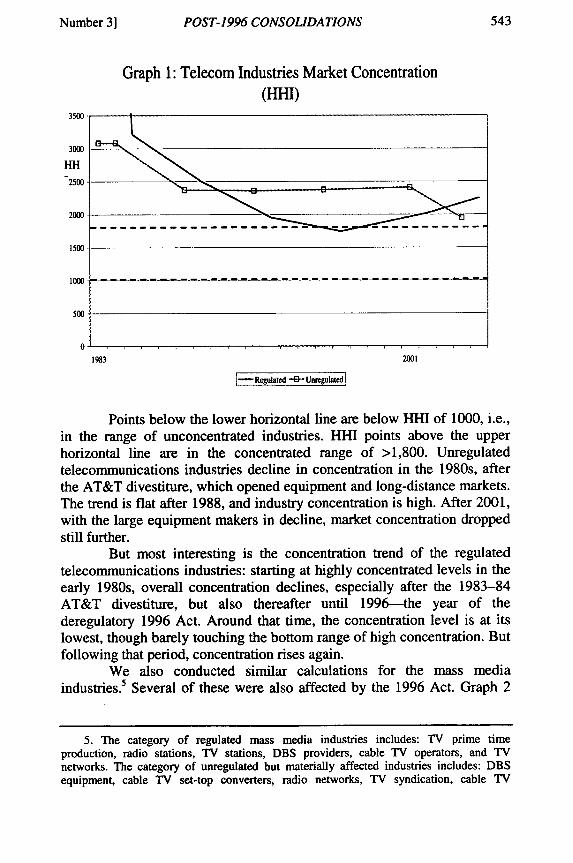
reports concentration trends for regulated mass media andtelecommunications industries.
Graph 2: Market Concentration of All RegulatedInformation Sector Industries
3500
Hill
3000
2500
2000
1500
1000 -
500
01983 2001
-Mass Media "-'TelecomJ
The concentration of regulated mass media industries first declinesin the 1980s, is flat in the early 1990s, and rises around 1996 and continuesto do so until 2004-05. Its levels are much lower than those fortelecommunications industries. Regulated mass media industriesconcentration increased steadily, from low levels in the 1980s and early1990s-maintaining low levels perhaps by regulation-and rose rapidlyafter 1996, which experienced an intermediate level of concentration.Concentration levels for both regulated telecommunications and regulatedmass media have increased steadily after 1996.
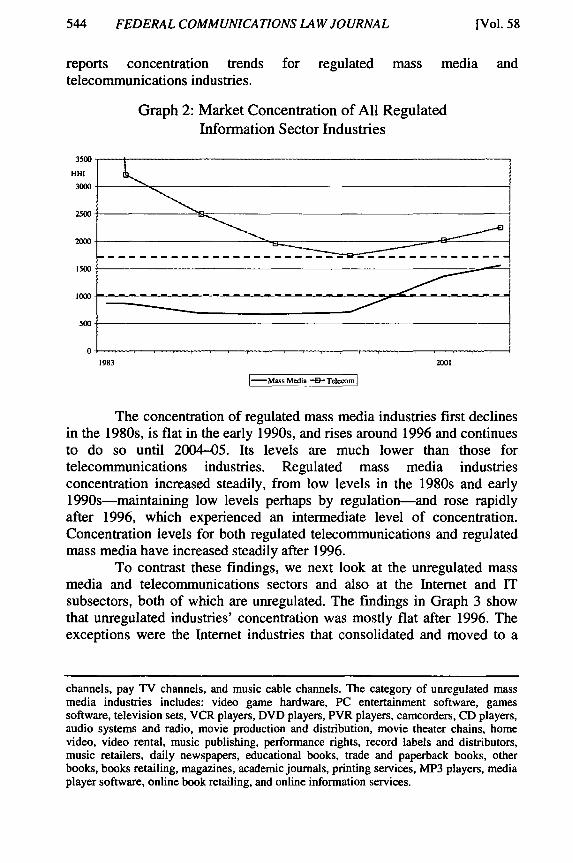
To contrast these findings, we next look at the unregulated massmedia and telecommunications sectors and also at the Internet and ITsubsectors, both of which are unregulated. The findings in Graph 3 showthat unregulated industries' concentration was mostly flat after 1996. Theexceptions were the Internet industries that consolidated and moved to a
channels, pay TV channels, and music cable channels. The category of unregulated massmedia industries includes: video game hardware, PC entertainment software, gamessoftware, television sets, VCR players, DVD players, PVR players, camcorders, CD players,audio systems and radio, movie production and distribution, movie theater chains, homevideo, video rental, music publishing, performance rights, record labels and distributors,music retailers, daily newspapers, educational books, trade and paperback books, otherbooks, books retailing, magazines, academic journals, printing services, MP3 players, mediaplayer software, online book retailing, and online information services.
[Vol. 58
POST-1996 CONSOLIDATIONS
model, in each subindustry, to dominance by a few players.6 We conductthe same analysis for the Internet sector in Graph 3.7
Graph 3: Market Concentration of All UnregulatedInformation Sub-Sectors
1984 1988 1992 1996 2001 2004/5
- Interaet -- o- Mass Media .--- Tecom 0G,- Infonnation Technology]
Next, we group all unregulated information industries together andcontrast them with all regulated information industries.
6. Cf. Eli M. Noam, OXFORD INTERNET INST., The INTERNET: STILL WIDE OPEN ANDCOMPETITIVE? (2003), http://www.oii.ox.ac.uk/resources/publications/IB lall.pdf (examiningthe competitive pressures of the internet market).
7. Internet industries include: backbones and broadband providers, media playersoftware, intemet search engines, portals, and browser software. Industries that areunregulated but materially affected by regulation include: ISPs, IP telephony providers, andinternet working equipment.
Number 3]
546 FEDERAL COMMUNICATIONS LAW JOURNAL
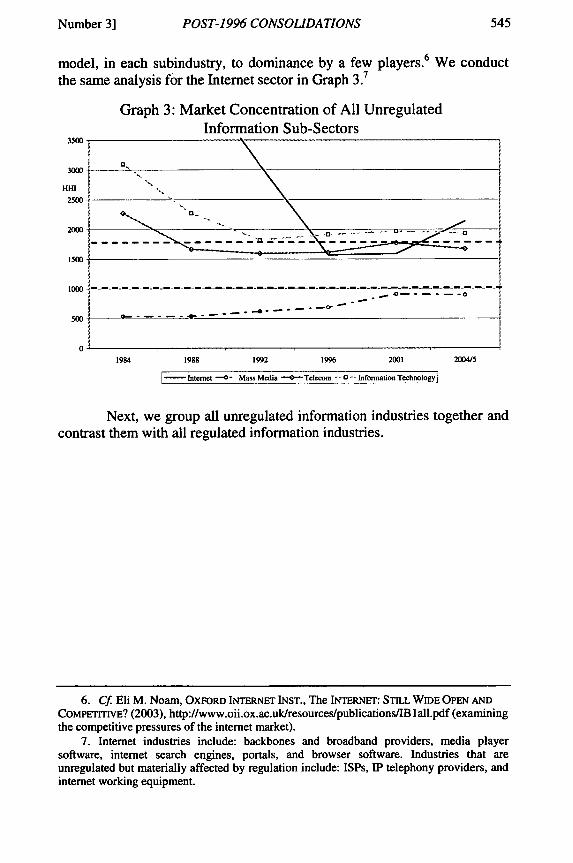
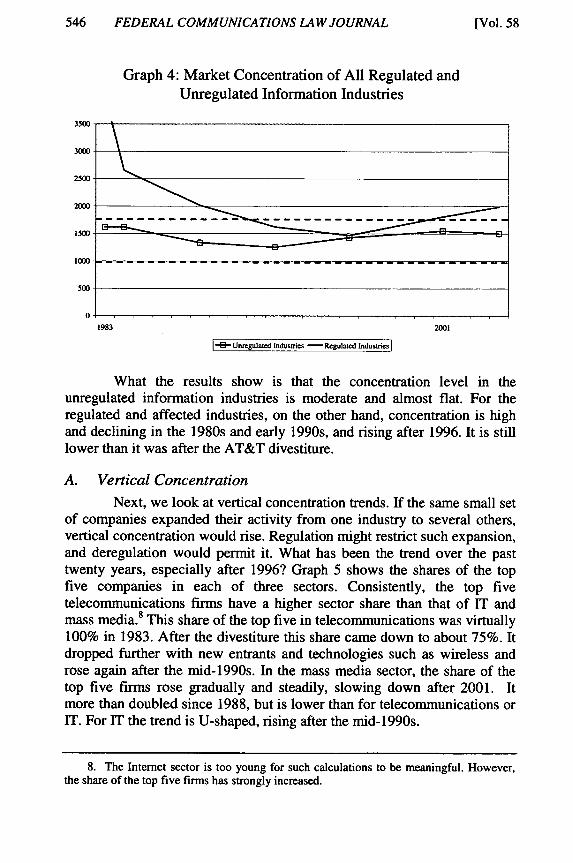
Graph 4: Market Concentration of All Regulated andUnregulated Information Industries
3500
3000
2500
2000
1500
1000-- - - - -
500-
0-1983 2001
-4-Unxeguated Industries -Reglad finduatres
What the results show is that the concentration level in theunregulated information industries is moderate and almost flat. For theregulated and affected industries, on the other hand, concentration is highand declining in the 1980s and early 1990s, and rising after 1996. It is stilllower than it was after the AT&T divestiture.
A. Vertical Concentration
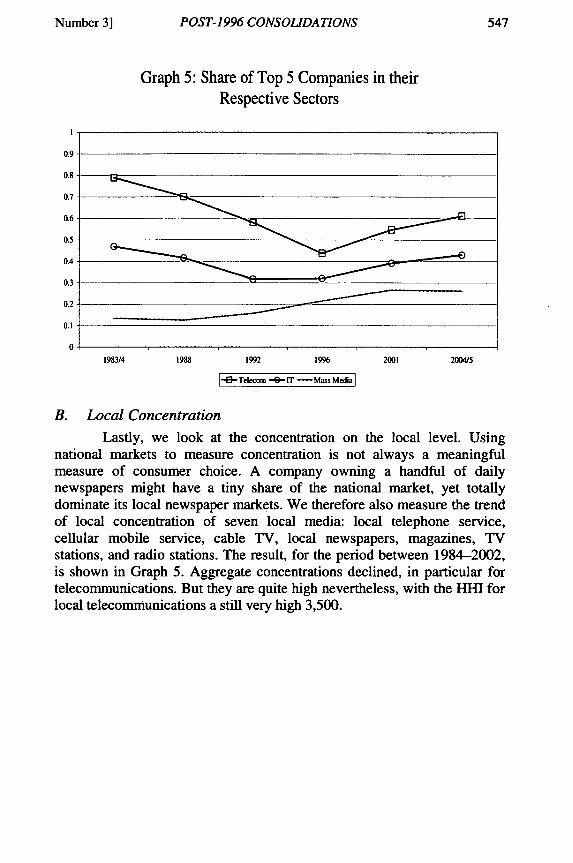
Next, we look at vertical concentration trends. If the same small setof companies expanded their activity from one industry to several others,vertical concentration would rise. Regulation might restrict such expansion,and deregulation would permit it. What has been the trend over the pasttwenty years, especially after 1996? Graph 5 shows the shares of the topfive companies in each of three sectors. Consistently, the top fivetelecommunications firms have a higher sector share than that of IT andmass media.8 This share of the top five in telecommunications was virtually100% in 1983. After the divestiture this share came down to about 75%. Itdropped further with new entrants and technologies such as wireless androse again after the mid-1990s. In the mass media sector, the share of thetop five firms rose gradually and steadily, slowing down after 2001. Itmore than doubled since 1988, but is lower than for telecommunications orIT. For IT the trend is U-shaped, rising after the mid-1990s.
8. The Internet sector is too young for such calculations to be meaningful. However,the share of the top five firms has strongly increased.
[Vol. 58
POST-1996 CONSOLIDATIONS
Graph 5: Share of Top 5 Companies in theirRespective Sectors
1992 1996
G Telecom -8- -T Mass Media
2001 2004/5
B. Local Concentration
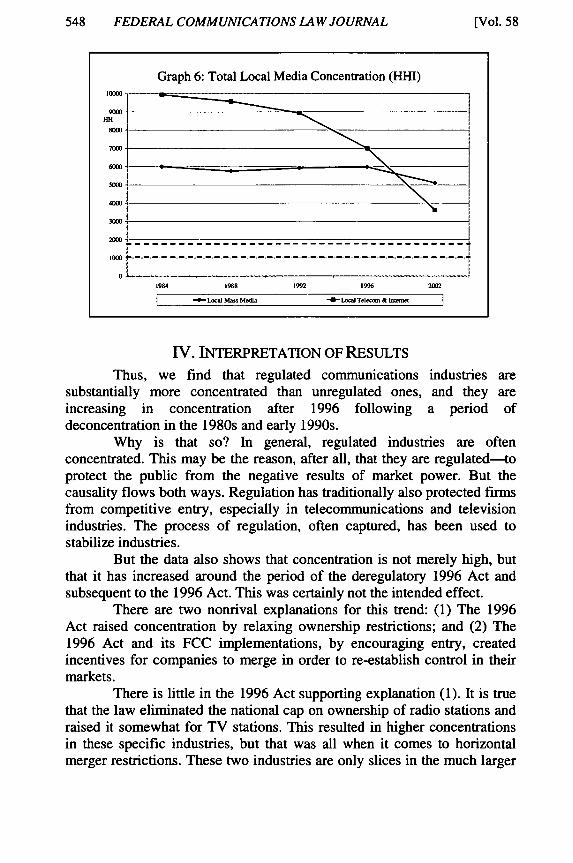
Lastly, we look at the concentration on the local level. Usingnational markets to measure concentration is not always a meaningfulmeasure of consumer choice. A company owning a handful of dailynewspapers might have a tiny share of the national market, yet totallydominate its local newspaper markets. We therefore also measure the trendof local concentration of seven local media: local telephone service,cellular mobile service, cable TV, local newspapers, magazines, TVstations, and radio stations. The result, for the period between 1984-2002,is shown in Graph 5. Aggregate concentrations declined, in particular fortelecommunications. But they are quite high nevertheless, with the HHI forlocal telecommunications a still very high 3,500.
/
Number 3]
548 FEDERAL COMMUNICATIONS LAW JOURNAL
Graph 6: Total Local Media Concentration (HHI)
1000
7000
4000
3000
0-1984 198 1992 1996 2002
-- *--Loc- Mass Media -0- Loa Tele n & ]
IV. INTERPRETATION OF RESULTS
Thus, we find that regulated communications industries aresubstantially more concentrated than unregulated ones, and they areincreasing in concentration after 1996 following a period ofdeconcentration in the 1980s and early 1990s.
Why is that so? In general, regulated industries are oftenconcentrated. This may be the reason, after all, that they are regulated-toprotect the public from the negative results of market power. But thecausality flows both ways. Regulation has traditionally also protected fn-msfrom competitive entry, especially in telecommunications and televisionindustries. The process of regulation, often captured, has been used tostabilize industries.
But the data also shows that concentration is not merely high, butthat it has increased around the period of the deregulatory 1996 Act andsubsequent to the 1996 Act. This was certainly not the intended effect.
There are two nonrival explanations for this trend: (1) The 1996Act raised concentration by relaxing ownership restrictions; and (2) The1996 Act and its FCC implementations, by encouraging entry, createdincentives for companies to merge in order to re-establish control in theirmarkets.
There is little in the 1996 Act supporting explanation (1). It is truethat the law eliminated the national cap on ownership of radio stations andraised it somewhat for TV stations. This resulted in higher concentrationsin these specific industries, but that was all when it comes to horizontalmerger restrictions. These two industries are only slices in the much larger
[Vol. 58
POST-1996 CONSOLIDATIONS
media pie. The 1996 Act, on its face, was not so much proconcentration asprocompetition. However, the effect of such competition was to drivecompanies to defensive moves along the lines of explanation (2), andconcentration became a major strategy to regain market power.
We can also conclude that in enacting the 1996 Act, public policyprojected the deconcentration trends of the 1980s and early 1990s. Furtherliberalization was seen as the means to continue this trend. But as the datashow, it may have contributed to the opposite-to a more concentratedinformation sector.
V. OUTLOOK
For a generation now, liberalization, deregulation, and competitionhave been the keystones of telecommunications policy. But one volatilebusiness cycle later, competition has been giving way to consolidation.The traditional system of regulated market power and concentration isreturning to some new equilibrium level which is not the hoped forcompetition, but one of market power, maybe to a natural oligopoly insteadof a natural monopoly. And with it, inevitably, comes some regulation ofthe negative effects of oligopoly. These oligopoly problems are muchharder to conceptualize and will lead to a new round of policy disputes.
Number 3]
550 FEDERAL COMMUNICATIONS LAW JOURNAL [Vol. 58