Deposit Insurance Schemes: target fund and risk-based
20
Deposit Insurance Schemes: target fund and risk-based contributions in line with Basel II regulation F. Campolongo 1 , R. De Lisa 2 , S. Zedda 2 , F. Vallascas 2 , M. Marchesi 3 1. European Commission, Joint Research Centre, Institute for the Protection and Security of the Citizens 2. University of Cagliari 3. European Commission, DG Internal Market and Services, Financial Institutions Directorate EUR 24281 EN - 2010 1
Transcript of Deposit Insurance Schemes: target fund and risk-based
Deposit Insurance Schemes target fund and risk-based contributions in line with
Basel II regulation
F Campolongo1 R De Lisa2 S Zedda2 F Vallascas2 M Marchesi3
1 European Commission Joint Research Centre Institute for the Protection and Security of the Citizens 2 University of Cagliari 3 European Commission DG Internal Market and Services Financial Institutions Directorate
EUR 24281 EN - 2010
1
2
The mission of the JRC-IPSC is to provide research results and to support EU policy-makers in their effort towards global security and towards protection of European citizens from accidents deliberate attacks fraud and illegal actions against EU policies European Commission Joint Research Centre Institute for the Protection and Security of the Citizen Contact information Francesca Campolongo E-mail francescacampolongojrceceuropaeuPhone +39 0332 78 5476 Fax +39 0332 78 5733 httpipscjrceceuropaeu httpwwwjrceceuropaeu Legal Notice Neither the European Commission nor any person acting on behalf of the Commission is responsible for the use which might be made of this publication
Europe Direct is a service to help you find answers to your questions about the European Union
Freephone number ()
00 800 6 7 8 9 10 11
() Certain mobile telephone operators do not allow access to 00 800 numbers or these calls may be billed
A great deal of additional information on the European Union is available on the Internet It can be accessed through the Europa server httpeuropaeu JRC 57325 EUR 24281 EN ISBN 978-92-79-15226-9 ISSN 1018-5593 DOI 10278872423 Luxembourg Office for Official Publications of the European Union copy European Union 2010 Reproduction is authorised provided the source is acknowledged Printed in Italy The photo on the cover was taken from httpwwwsxchu
3
TABLE OF CONTENTS
1 The model for computing the banksrsquo loss distribution 5 2 Model policy applications 8 3 Application of the model to other countries 11 4 Alternative methodology for the calculation of excess losses 14 5 Conclusions 17
4
1 The model for computing the banksrsquo loss distribution De Lisa et al (2010)1 recently developed a model for estimating the losses coming from banks
defaults in a Basel II regulatory framework
In the Basel II framework each bank has to satisfy a capital requirement that provides a buffer against
unexpected losses at a specific level of statistical confidence set by regulators at 999
The model proposed by De Lisa et al (2010) focuses on the tail risk not covered by the Basel II capital
requirements by assuming that a bank defaults when its losses exceed the buffer provided by its
capital
In this way the model makes an explicit link between two main pillars of the financial safety net -
banks capital requirements and deposit insuranceguarantee - as the latter comes to play a role when
the former is not sufficient (see Figure 1)
Figure 1 Basel II tail risk and deposit insurance
Bank fails
Basel II Var Losses
Pr
Loans losses distribution for the bank j
Expected Loss Provisions Capital Requirements Deposit Insurance
Moreover the model has the feature of considering two channels of banking contagion as sources of
systemic financial instability The first channel depends on the correlation between banksrsquo exposures
that may exist as a consequence of banksrsquo common exposure to the same borrower or more generally
to a particular influence of the business cycle The second channel depends on the linkages among
financial institutions through the interbank credit market (interbank market contagion)
1 De Lisa R Zedda S Vallascas F Campolongo F Marchesi M ldquoModelling Deposit Insurance Scheme Losses in a Basel 2 Framework Journal of Financial Services Research 2010 Second invited revision
5
The model has been applied to unconsolidated accounting data for a sample of 494 Italian banks for
the year 2007 The data are drawn from the ABIBANK dataset managed by the Italian Banking
Association (ABI)
In a first approach the Deposit Insurance Scheme (DIS) loss distribution has been estimated under the
assumption that a bank default any time its simulated loss is higher than the capital requirements The
estimates of the DIS loss distribution thus obtained are reported in the following Tables 1 and 2
Table 1 presents the DIS loss distribution considering all simulations including those where no banks
fail (unconditional loss distribution) Table 2 presents instead the DIS loss distribution considering
only those simulations where at least one bank defaults (conditional loss distribution)
Note that these figures differ from those reported in the paper by De Lisa et al (2010) as in that case
the bank is assumed to default only when its actual capital (and not the regulatory capital) is below the
simulated loss
Table 1 DIS loss distribution for different values of the loading of common factor β Amounts are in meuro
Loading of common factor β
(macroeconomic systemic risk factor)
30 50 70
Panel A without interbank contagion
N Simulations 10611304 13553057 13566756
Mean 089 075 091
Percentile
9990 0 0 0
9999 1321 966 1374
10000 81841 81841 84604
Panel B with interbank contagion
N Simulations 10611304 13553057 13566756
Mean 41 37 43
Percentile
9990 0 0 0
9999 1321 966 1379
10000 381893 381893 381893
Note Panel A shows summary statistics of the DIS loss distribution estimated via Monte Carlo simulation under the assumption of no
interbank contagion Panel B presents the same statistics when the simulations consider the impact of interbank contagion A sample of
494 Italian banks is employed accounting data refer to 2007
6
Table 2 DIS loss distribution constructed on the basis of 10000 scenarios with at least one bank default for different values of the loading of the common factor β Amounts are in meuro
Loadings of common factor β
(macroeconomic systemic risk factor)
30 50 70
Panel A without interbank contagion
Mean 944 1019 1233
St dev 4495 4780 5339
Percentile
25 51 57 69
50 123 131 164
75 316 375 505
90 1512 1765 2284
95 3757 4120 4752
99 22451 22451 26644
999 79479 79479 79656
100 81841 81841 84604
Panel B with interbank contagion
Mean 4339 4970 5796
St dev 37431 40358 43405
Percentile
25 51 57 69
50 123 131 164
75 316 375 505
90 1513 1765 2284
95 3757 4120 4789
99 33341 381854 381893
999 381893 381893 381893
100 381893 381893 381893
Note Panel A shows summary statistics of the DIS loss distribution estimated via Monte Carlo simulation under the assumption of no
interbank contagion Only the 10000 scenarios with at least one bank default are considered Panel B presents the same statistics when
the simulations consider the impact of interbank contagion A sample of 494 Italian banks is employed accounting data refer to 2007
7
2 Model policy applications
The model has several possible applications that are relevant for policy making purposes relating to
banking prudential regulation
21 The choice of the deposit insurance scheme size
The model allows the determination of the distribution of banksrsquo losses that are not covered by banksrsquo
capital requirements (excess losses2) and are therefore passed on to other components of the financial
safety net such as a Deposit Insurance Scheme or the Government (Fig 2) And this allows a risk
based policy choice relating to the size of the Deposit Insurance Scheme
Figure 2 ndash Deposit Insurance Scheme funding endowments and part of its loss distribution left to the possible intervention of Government (GVMT)
4 2 4 4 4 6 4 8 5
0 0 0 0 0 2
0 0 0 0 0 4
0 0 0 0 0 6
0 0 0 0 0 8
0 0 0 0 1
0 0 0 0 1 2
4 2 4 4 4 6 4 8 5
0 0 0 0 0 2
0 0 0 0 0 4
0 0 0 0 0 6
0 0 0 0 0 8
0 0 0 0 1
0 0 0 0 1 2
4 2 4 4 4 6 4 8 5
0 0 0 0 0 2
0 0 0 0 0 4
0 0 0 0 0 6
0 0 0 0 0 8
0 0 0 0 1
0 0 0 0 1 2
DIS
hellip
GVMT
Bank 1 Bank 2 Bank n
Funding needsfinancial endowments of an insurance scheme are in fact influenced most of all by the
level of security that one wants to provide to consumers the higher security one wants to provide with
a guarantee scheme the higher the insurance scheme financial endowmentsfunding needs which will
be obviously needed A key policy decision is therefore the choice of the level of security that a DIS is
expected to provide to consumers
2 In Section 4 more details are provided on the calculation of excess losses The results of an alternative method for calculating excess losses are also presented
8
In practical terms the level of security provided to consumers depositors is determined in relation to
the part (statistically the percentile) of the DIS loss distribution that the DIS financial endowments are
enough to cover
The percentile (level of security) chosen should not only provide a high level of security for consumers
but also be financially realistic that is it should have the potential to be appropriate in terms of
achieving the objective of a sufficiently high protection of the policyholders but also do it without
requiring excessively expensive resources
Several risk based criteria can be envisaged to choose the (target) size of a DIS For instance the
criterion may be to be able to have funds sufficient to cover the average loss that would hit the DIS in
all situations where at least one bank default occurs Following this criterion the loss distribution
computed by means of the presented model allows an estimations of the target size of the DIS size as
the target size of the fund would correspond in the estimations of the model to the average of the
conditional loss distribution For instance in the case of Italy and of a 50 loading of systematic risk
factor the target fund would be 4970 meuro or 1019 meuro under the assumption of interbank contagion or
no interbank contagion respectively (see Table 2) It is worth noticing that the actual size of the Italian
DIS in 2007 was of 1602 meuro
Many other criteria can be chosen as an alternative Once any criterion has been chosen and a target
size has been determined however the presented model allows with its DIS loss distribution to
evaluate the level of security (the percentile) associated with the chosen size providing a valuable risk
related information the percentage of loss scenarios for which the chosen target fund would not be
enough (meaning that other types of intervention for instance by the Government might be needed)
22 Estimating banks risk contributions
Once the target size of the DIS has been established the total amount of money to be collected need to
be distributed among banks belonging to the DIS in accordance to their risk profiles
Several criteria can be used to compute risk-based contributions Examples of possible criteria have
been proposed in the report ldquoPossible models for risk-based contributions to EU Deposit Guarantee
Schemesrdquo3 which takes into account current practices in the EU
Here we propose an alternative The idea is to use the model described above to estimate the
contribution to the total loss of the system (in percentage) that is attributable to each bank These
contributions have been estimated under different assumptions depending on how inter-bank
contagion has been taken into account
More precisely three different scenarios have been considered
(1) Inter-bank contagion is not taken into account A default can occur only as a consequence of credit
9
losses in the bank portfolio
(2) Passive inter-bank contagion is considered A default may occur also as a consequences of losses
induced on the analyzed bank from the failures of other banks
(3) Passive and active inter-bank contagion is considered We not only take into account the losses
that a given bank can receive from the default of another bank but we also take into account the
possible contagion effects that the losses of the analyzed bank can passing on via the inter-bank
market to the other banks
In the first scenario the contribution is obtained by running the model via a Monte Carlo simulation
without inter-bank contagion and considering for each bank the sum of all losses transferred to the
DIS as a consequence of the banks default The obtained figures can then be used to derive the
relative contributions to the total DIS loss attributable to each bank
In the second scenario we use the same approach but we run the model including the possibility of
inter-bank contagion
Finally the contributions in the third scenario are obtained using the ldquoleave-one-outrdquo approach The
model is run to compute first the overall DIS loss and then the loss that would be obtained leaving out
the analysed bank The difference between the two losses represents the marginal contribution of the
given bank to the overall risk
The contributions to the total loss (in percentage) attributable to each bank in the three scenarios are
reported in Table 3
Table 3 Risk contributions ndash Italy ndash 2007 ndash First 30 banks sorted by first column
BANCA Scenario 1 Scenario 2 Scenario 3
INTESA SANPAOLO 22106 18076 15782
UNICREDIT 7910 9245 5178
MONTE PASCHI DI SIENA 7155 6060 15104
BANCA NAZIONALE DEL LAVORO 5599 5106 13890
BANCA ANTONVENETA 2957 2697 12837
BPOP DI MILANO 2534 2941 1647
BANCO DI NAPOLI 2421 2904 2445
CR DI PARMA E PIACENZA 2304 2439 1366
CREDITO EMILIANO 1731 1782 0997
BANCO DI BRESCIA 1658 1619 0946
BIPIELLE 1553 1632 1750
3 httpeceuropaeuinternal_marketbankdocsguarantee2009_06_risk-based-report_enpdf
10
BANCA TOSCANA 1517 1481 0829
CR DI PADOVA ROVIGO 1474 1283 0718
BANCA CARIGE 1335 1444 0808
CREDITO BERGAMASCO 1232 1277 0715
BPOP DI NOVARA 1175 1460 0832
CR DI FIRENZE 1169 1402 0785
BPCI 1030 0992 0555
BANCA DELLE MARCHE 0978 0973 0544
BPOP DELLEMILIA ROMAGNA 0912 1264 1136
BANCA SELLA 0874 0876 0491
UNICREDIT PRIVATE BANKING 0850 0830 0887
BANCA MEDIOLANUM 0847 0827 0894
BRE 0832 0857 0479
UNIPOL BANCA 0830 1113 0623
CR LUCCA PISA LIVORNO 0764 0747 0417
CREDITO ARTIGIANO 0686 0674 0377
BPOP DI VICENZA 0685 0976 1403
CR IN BOLOGNA 0618 0654 0790
VENETO BANCA 0575 0714 0399
The risk-based contributions can then be derived by applying these percentages to the target size of the
fund
3 Application of the model to other countries The model developed by De Lisa et al (2010) has been applied here to other 3 EU countries UK
Germany and Spain It should be noticed however that for these countries it has been necessary to
use consolidated rather than individual bank data data for 2008 and only a more limited sample of
banks compared to Italy The first sample is of 23 banks from UK representing a total of 124 trillion
euro of total assets the second is of 17 banks from Germany representing a total of 5 trillion euro of
total assets and the third of 54 banks for Spain representing a total of 335 trillion euro
The model has been run as in the case of Italy for several million times in order to achieve 10000
scenarios containing at least one bank default The loading of the common macroeconomic systemic
risk factor has been set to 50
11
Tables 4 and 5 report the results of the loss distributions built by considering only the 10000 scenarios
containing at least one bank default These distributions can then be interpreted as the loss distributions
of the DIS in negative market scenarios
Table 4 assumes that the only channel of interbank contagion is represented by the correlation among
banksrsquo exposure (no inter-bank contagion) while Table 5 also assume the existence of a direct linkage
among banks which is due to the inter-bank credit market
Table 4 DIS conditional loss distribution for UK Germany and Spain No direct interbank contagion is assumed The loading of the common factor β is set to 50 Amounts are in meuro
UK DE ES
Mean 186602 79525 25940
St dev 264971 116225 61416
Percentile
025 1892 7312 4175
05 22334 15936 8559
075 262201 121493 17288
09 453129 170203 41919
095 639512 395553 136284
099 1115327 395553 378750
0999 1117081 404956 382132
09999 1377539 517051 420688
1 1485207 565756 617757
12
Table 5 DIS conditional loss distribution for UK Germany and Spain The existence of direct interbank contagion is assumed The loading of common factor β is set to 50 Amounts are in meuro
UK IB DE IB ES IB
Mean 453814 290382 57703
St dev 1078527 464383 229909
Percentile
025 1892 7312 4175
05 22334 15936 8559
075 262201 140119 17288
09 1115327 1119432 42927
095 4180117 1119432 136284
099 4180117 1119432 1350573
0999 4180117 1119432 1350573
09999 4181871 1119432 1357391
1 4181871 1119432 1357391
Table 6 reports the total number of simulations that had to be executed for each country in order obtain
10000 scenarios with at least one default
Table 6 Total number of simulations
UK IB DE IB ES IB
211723252 314511715 95586108
Table 7 and 8 report the percentiles of the unconditional distributions respectively in the absence and
presence of direct interbank contagion Lower percentiles are not reported as they are all equal to zero
as in most simulation scenarios there are no defaults and therefore no loss hitting the fund
13
Table 7 DIS unconditional loss distribution for UK Germany and Spain No direct interbank contagion is assumed The loading of common factor β is set to 50 Amounts are in meuro
UK DE ES
Mean 881 253 271
Percentile Percentile Percentile
0999964576 1892 0999976154 7312 0999921537 4175
0999976384 22334 0999984102 15936 0999947691 8559
0999988192 262201 0999992051 121493 0999973846 17288
0999995277 453129 099999682 170203 0999989538 41919
0999999528 1115327 0999999682 395553 0999998954 378750
0999999953 1117081 0999999968 404956 0999999895 382132
1 1485207 1 565756 1 617757
Table 8 DIS unconditional loss distribution for UK Germany and Spain Presence of interbank contagion is assumed The loading of common factor β is set to 50 Amounts are in meuro
UK IB DE IB ES IB Mean 2143 923 604 Percentile Percentile Percentile
0999964576 1892 0999976154 7312 0999921537 4175
0999976384 22334 0999984102 15936 0999947691 8559
0999988192 262201 0999992051 140119 0999973846 17288
0999995277 1115327 099999682 1119432 0999989538 42927
0999999528 4180117 0999999682 1119432 0999998954 1350573
0999999953 4180117 0999999968 1119432 0999999895 1350573
1 4180117 1 1119432 1 1357391
4 Alternative methodology for the calculation of excess losses The application of the De Lisa et al (2010) model that has been shown above envisages that when a
bank fails the amount of the excess loss transferred to the DIS is equal to its worst case value ie the
value of the banksrsquo insured deposits
This hypothesis is coherent with a worst case scenario where the liquidity needed by the bank is that
caused by a bank run of all depositors and therefore equal to the amount of the bankrsquos insured
deposits
It has however also been analysed a no worst case scenario considering the exact value of banksrsquo
excess losses obtained in the performed simulations
14
The results of the simulations in this case are shown in Tables 9 and 10 Results are reported for an
easy comparison also for the worst case scenario
Table 9 DIS loss distribution ndash Loading of common factor β =50 - Amounts are in meuro
Worst case Exact excess loss
Panel A without interbank contagion
N Simulations 13553057
Mean 075 003
Percentile
9990 0 0
9999 966 20
10000 81841 14388
Panel B with interbank contagion
N Simulations 13553057
Mean 37 45
Percentile
9990 0 0
9999 966 25
10000 381893 381893
15
Table 10 DIS loss distribution constructed on the basis of 10000 scenarios with at least one bank default ndash Loading of common factor β =50 - Amounts are in meuro
Worst case Exact excess loss
Panel A without interbank contagion
Mean 1019 244
St dev 4780 2086
Percentile
25 57 04
50 131 17
75 375 65
90 1765 239
95 4120 607
99 22451 335
999 79479 2801
100 81841 10072
Panel B with interbank contagion
Mean 4970 4115
St dev 40358 38541
Percentile
25 57 04
50 131 17
75 375 67
90 1765 25
95 4120 70
99 381893 363529
999 381893 368660
100 381893 369245
16
5 Conclusions
In this paper we have considered the deposit insurance model recently developed by De Lisa et al
(2010) pointing out its relevance in terms of deposit insurance policies
We argue that the model proposed by De Lisa et al (2010) has two major points of strengths First of
all the model is fully in line with Basel II requirements as it defines the event of ldquodefaultrdquo as a
situation where the Basel II bank capital requirements are not sufficient to cope with the bankrsquos losses
On the contrary the existing literature that aims at estimating the DIS loss distribution is mainly based
on structural models for credit risk and there is no sign of any consideration of the link that exists
between banks capital requirements and the shape and size of the DIS loss distribution
Second the model is extremely flexible and it can provide answers to a number of relevant policy
questions among which the following ones
First by estimating the potential loss hitting a DIS under several economic scenarios we have
highlighted how the model can be employed to establish the target size of the DIS which is the
amount of money that the fund should have available where needed
Moreover the model can be used to set the risk-based premia that banks should pay to the DIS
according to their degree of riskiness
In general we argue that the flexibility of this model makes it very relevant to policy makers as by
changing data and assumptions it allows answering various questions relevant to deposit insurance
regulation
17
European Commission EUR EUR 24281 EN ndash Joint Research Centre ndash Institute for the Protection and Security of the Citizen Title Deposit Insurance Schemes target fund and risk-based contributions in line with Basel II regulation Author(s) F Campolongo R De Lisa S Zedda F Vallascas M Marchesi Luxembourg Office for Official Publications of the European Union 2010 ndash 20 pp ndash 21 times 297 cm EUR ndash Scientific and Technical Research series ndash ISSN 1018-5593 ISBN 978-92-79-15226-9 DOI 10278872423 Abstract This paper discusses a deposit insurance model recently developed by De Lisa et al (2010)
highlighting its policy implications
Compared to existing ones the model proposed by De Lisa et al (2010) presents the important
advantage of taking into account Basel II banking regulation thus linking two pillars of financial
safety net banks capital requirements and deposit insurance
The model which estimates the potential loss hitting a Deposit Insurance Scheme (DIS) under several
economic scenarios can be used to establish the target size of the fund which is the amount of money
that the DIS should have available in case of need
Moreover the model can be used to estimate the contribution (to this loss) that each bank should pay to
the fund according to its degree of riskiness
18
How to obtain EU publications Our priced publications are available from EU Bookshop (httpbookshopeuropaeu) where you can place an order with the sales agent of your choice The Publications Office has a worldwide network of sales agents You can obtain their contact details by sending a fax to (352) 29 29-42758
19
The mission of the JRC is to provide customer-driven scientific and technical supportfor the conception development implementation and monitoring of EU policies As a service of the European Commission the JRC functions as a reference centre of science and technology for the Union Close to the policy-making process it serves the common interest of the Member States while being independent of special interests whether private or national
L
B-N
A-24281-E
N-C
20
- 1 The model for computing the banksrsquo loss distribution
- 2 Model policy applications
- 3 Application of the model to other countries
- 4 Alternative methodology for the calculation of excess losses
- 5 Conclusions
-
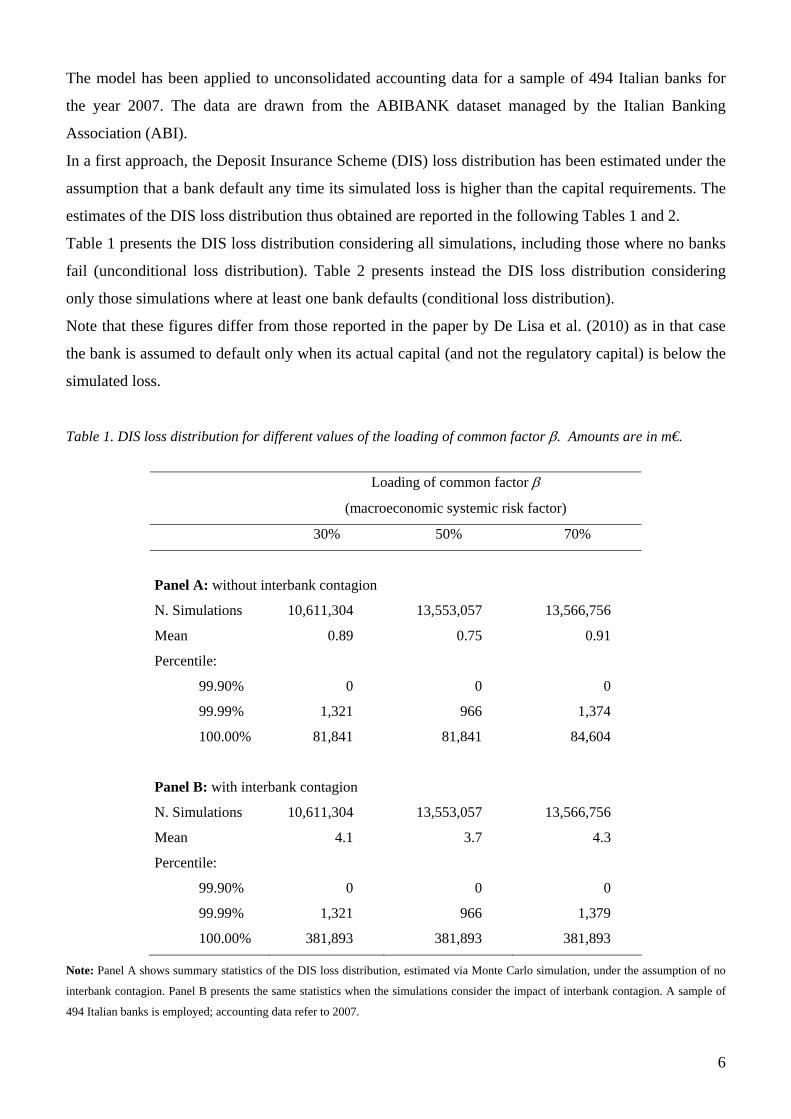
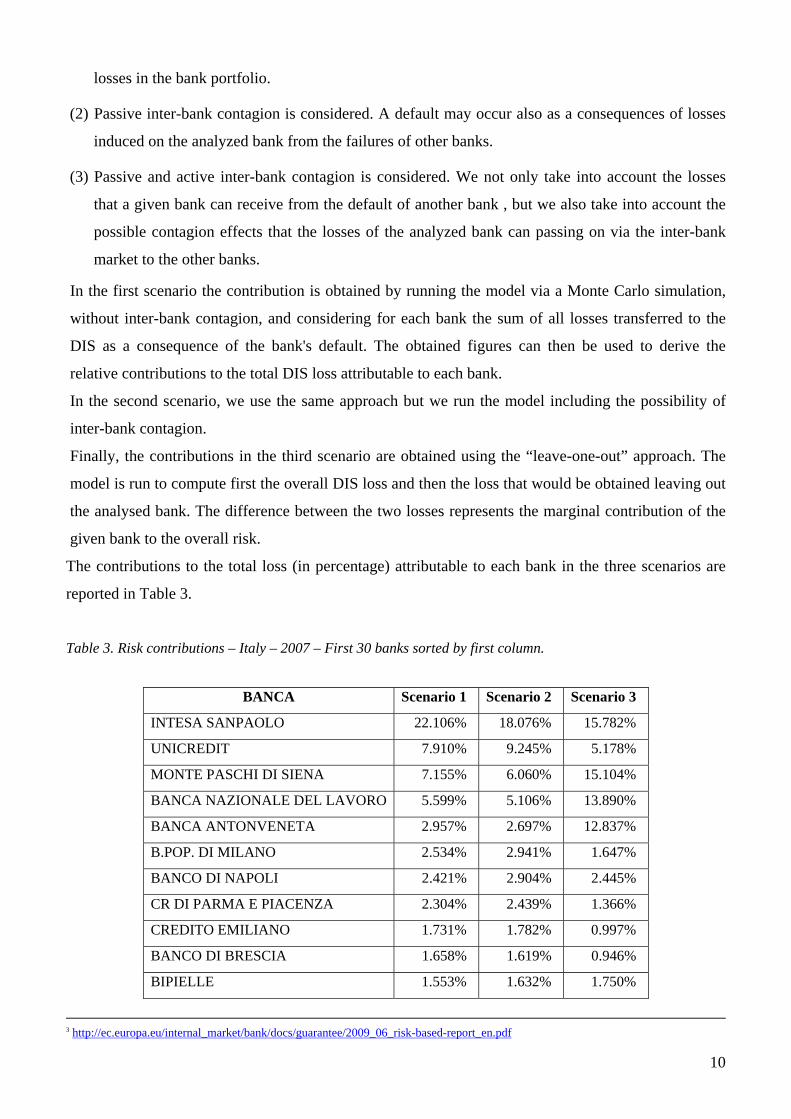