DEPLOYMENT OF A NOVEL AEROSOL … · DEPLOYMENT OF A NOVEL AEROSOL MOBILITY/MASS SPECTROMETER FOR...
45
1 DEPLOYMENT OF A NOVEL AEROSOL MOBILITY/MASS SPECTROMETER FOR QUANTITATIVE CHEMICAL ANALYSIS OF ORGANIC AEROSOLS FROM MOBILE SOURCES FINAL REPORT November 22, 2010 Principle Investigator: Denis J. Phares University of Southern California Department of Aerospace & Mechanical Engineering Contract No. 06-330 Prepared for: California Air Resources Board Research Division Sacramento, CA
Transcript of DEPLOYMENT OF A NOVEL AEROSOL … · DEPLOYMENT OF A NOVEL AEROSOL MOBILITY/MASS SPECTROMETER FOR...

1
DEPLOYMENT OF A NOVEL AEROSOL MOBILITY/MASS SPECTROMETER FOR QUANTITATIVE CHEMICAL ANALYSIS OF ORGANIC AEROSOLS
FROM MOBILE SOURCES
FINAL REPORT
November 22, 2010
Principle Investigator:
Denis J. Phares University of Southern California
Department of Aerospace & Mechanical Engineering
Contract No. 06-330
Prepared for:
California Air Resources Board Research Division Sacramento, CA

2
Disclaimer The statements and conclusions in this Report are those of the contractor and not necessarily those of the California Air Resources Board. The mention of commercial products, their source, or their use in connection with material reported herein is not to be construed as actual or implied endorsement of such products.

3
TABLE OF CONTENTS 1. Introduction………………...………………………………………………….10 1.1. Motivation………...…………………………………………………..10 1.2 Background………...………………………………………………….10 2. PHASE I – Instrumentation Development and Characterization….……………16 2.1 Particle Collection and Sizing…………………………………………16 2.1.1 Instrumentation……………………………………………...16 2.1.2 Electrostatic Collection Theory……………………………..18 2.2 Chemical Ionization …………………………………………………..20 2.3 Ion Mobility Separation……………………………………………….21 2.4 Pressure Interface……………………………………………………..22 2.5 Mass Spectrometer……………………………………………………23 3. PHASE II Results and Disucussion……..……………………………………..28 3.1 Instrument Characterization…………………………………………..28 3.1.1 Inlet Experiments…………………………………………...28 3.1.2. Mass Spectrometer Characterization………………………32 3.1.3. Ion Mobility Cell Characterization………………………...33 3.2 Soot Measurements…………………………………………………...35 3.3 Ambient Measurements………………………………………………37 3.4 Gas/particle Partitioning Experiments………………………………..41 4. Summary and conclusions……………………………………………………..43 5. Recommendations……………………………………………………………..43 5.1 Technical Recommendations…………………………………………43

4
5.2 Administrative/other Recommendations……………………………..44 6. References……………………………………………………………………..45
5
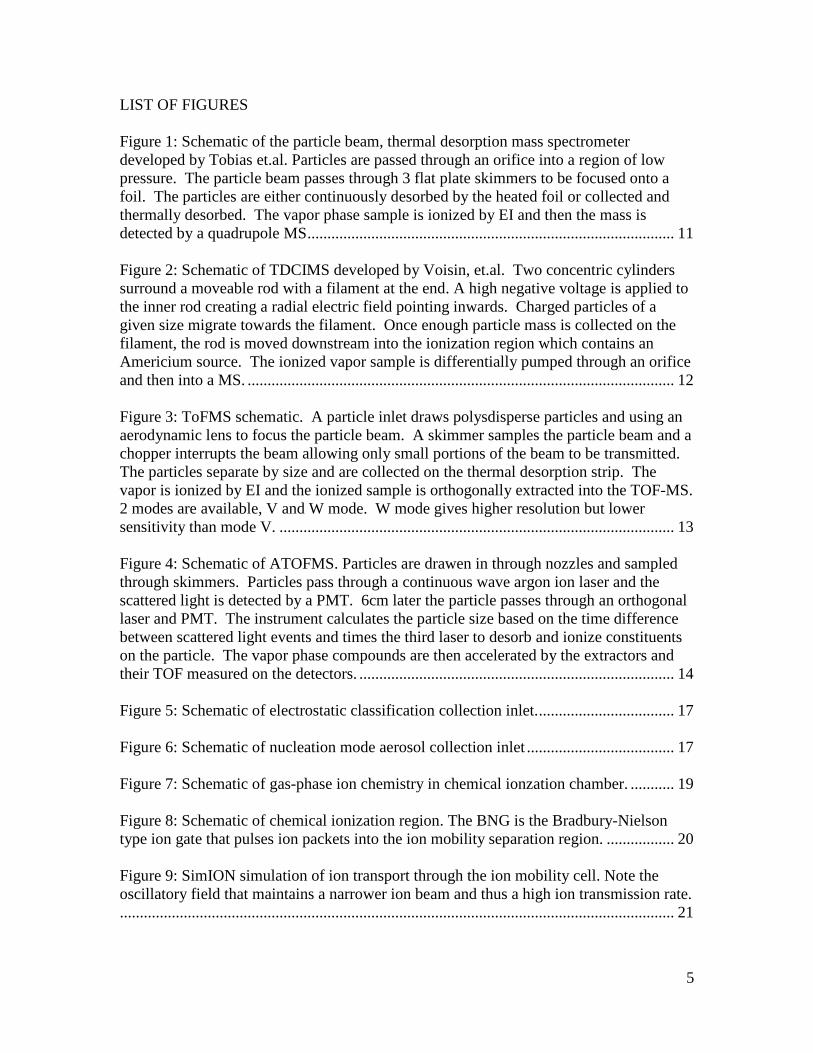
LIST OF FIGURES Figure 1: Schematic of the particle beam, thermal desorption mass spectrometer developed by Tobias et.al. Particles are passed through an orifice into a region of low pressure. The particle beam passes through 3 flat plate skimmers to be focused onto a foil. The particles are either continuously desorbed by the heated foil or collected and thermally desorbed. The vapor phase sample is ionized by EI and then the mass is detected by a quadrupole MS ............................................................................................ 11 Figure 2: Schematic of TDCIMS developed by Voisin, et.al. Two concentric cylinders surround a moveable rod with a filament at the end. A high negative voltage is applied to the inner rod creating a radial electric field pointing inwards. Charged particles of a given size migrate towards the filament. Once enough particle mass is collected on the filament, the rod is moved downstream into the ionization region which contains an Americium source. The ionized vapor sample is differentially pumped through an orifice and then into a MS. ........................................................................................................... 12 Figure 3: ToFMS schematic. A particle inlet draws polysdisperse particles and using an aerodynamic lens to focus the particle beam. A skimmer samples the particle beam and a chopper interrupts the beam allowing only small portions of the beam to be transmitted. The particles separate by size and are collected on the thermal desorption strip. The vapor is ionized by EI and the ionized sample is orthogonally extracted into the TOF-MS. 2 modes are available, V and W mode. W mode gives higher resolution but lower sensitivity than mode V. ................................................................................................... 13 Figure 4: Schematic of ATOFMS. Particles are drawen in through nozzles and sampled through skimmers. Particles pass through a continuous wave argon ion laser and the scattered light is detected by a PMT. 6cm later the particle passes through an orthogonal laser and PMT. The instrument calculates the particle size based on the time difference between scattered light events and times the third laser to desorb and ionize constituents on the particle. The vapor phase compounds are then accelerated by the extractors and their TOF measured on the detectors. ............................................................................... 14 Figure 5: Schematic of electrostatic classification collection inlet. .................................. 17 Figure 6: Schematic of nucleation mode aerosol collection inlet ..................................... 17 Figure 7: Schematic of gas-phase ion chemistry in chemical ionzation chamber. ........... 19 Figure 8: Schematic of chemical ionization region. The BNG is the Bradbury-Nielson type ion gate that pulses ion packets into the ion mobility separation region. ................. 20 Figure 9: SimION simulation of ion transport through the ion mobility cell. Note the oscillatory field that maintains a narrower ion beam and thus a high ion transmission rate............................................................................................................................................ 21

6
Figure 10: Pressure interface schematic. This section reduces the pressure for mass spectrometry analysis, while maintaining ion throughtput using electrostatic lenses. ..... 22 Figure 11: Measured ion current into mass spectrometer for a variety of focusing potentials and organic compounds. Ions are counted for .10 seconds each second, so a count rate of 10000 ions/second corresponds to a total ion current of 100,000 ions/sec, or .02 pA. (I = isopropanol; H = heptane; B = butanol ; A = acetone; T = toluene; P = phenol) .............................................................................................................................. 23 Figure 12: SimION models of the orthogonal extraction mass spectrometer. Ion trajectories are calculated given the optimal potentials of the electrodes using varying input ion kinetic energies. ................................................................................................. 24 Figure 13: Computed ion trajectory in the ion focusing region and mass spectrometer. . 25 Figure 14: High-energy mass spectra of acetone and isopropanol. Note the decrease in the reactant ion peaks with increasing sample signal. ............................................................ 25 Figure 15: Schematic of TOF-MS region mass spectrometer optimized for low-energy ions. The reflector is angled 7 degrees, which corresponds to ions having kinetic energy smaller than 5 eV. ............................................................................................................. 26 Figure 16: Low-energy mass spectra of isopropanol. ....................................................... 26 Figure 17: Schematic of instrument deployed including all components. ........................ 27 Figure 18: Calibration of aerosol electrostatic classification inlet at 18 Torr. .................. 29 Figure 19: Calibration of aerosol electrostatic classification inlet at atmospheric pressure............................................................................................................................................ 30 Figure 20: Calibration of nucleation mode collection inlet. ............................................. 30 Figure 21: Thermal desorption chemical ionization of pyrene particle standards. ........... 31 Figure 22: Thermal desorption chemical ionization of pyrene particle standards. ........... 32 Figure 23: Ion mobility spectra of the reactant ion peak (i.e. water clusters) and oleic acid at a pressure of 18 Torr. .................................................................................................... 33 Figure 24: Comparison between model and experiment for transport of benzene ions through mobilty cell at 10 Torr. ........................................................................................ 34 Figure 25: Direct comparisons between mobility (11 Torr) (left) and mass (right) spectra for acetone clusters (top) and isopropanol clusters (bottom). ........................................... 34

7
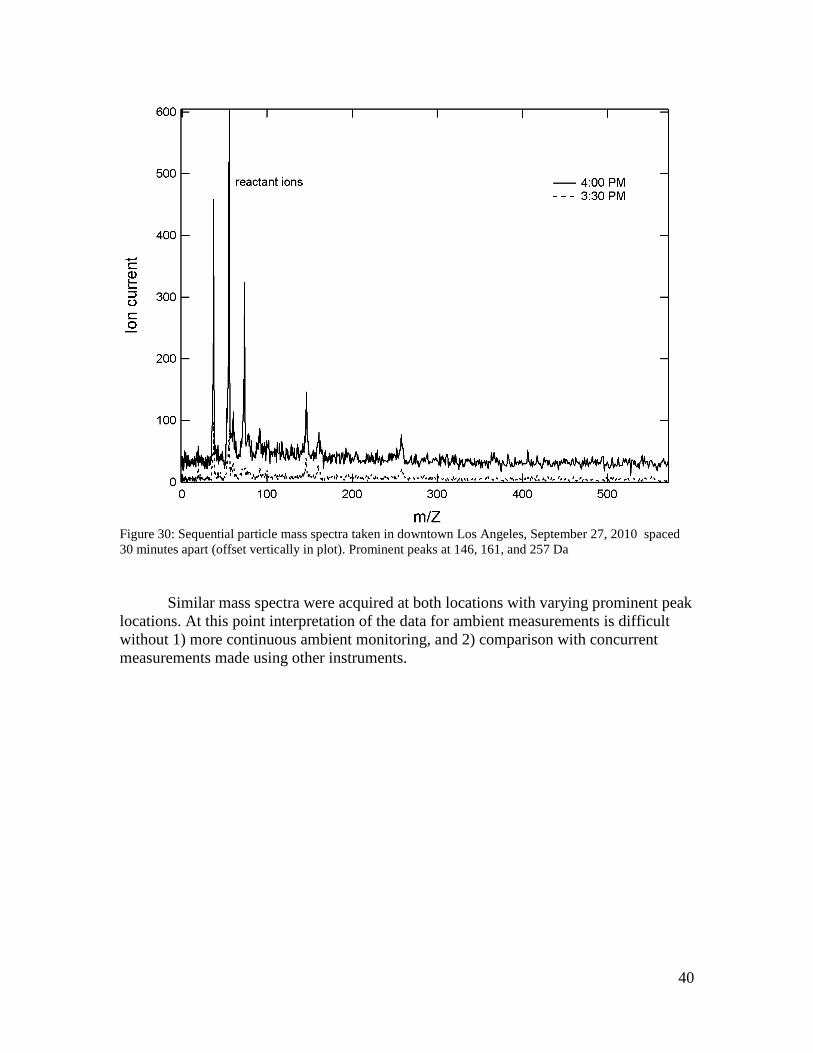
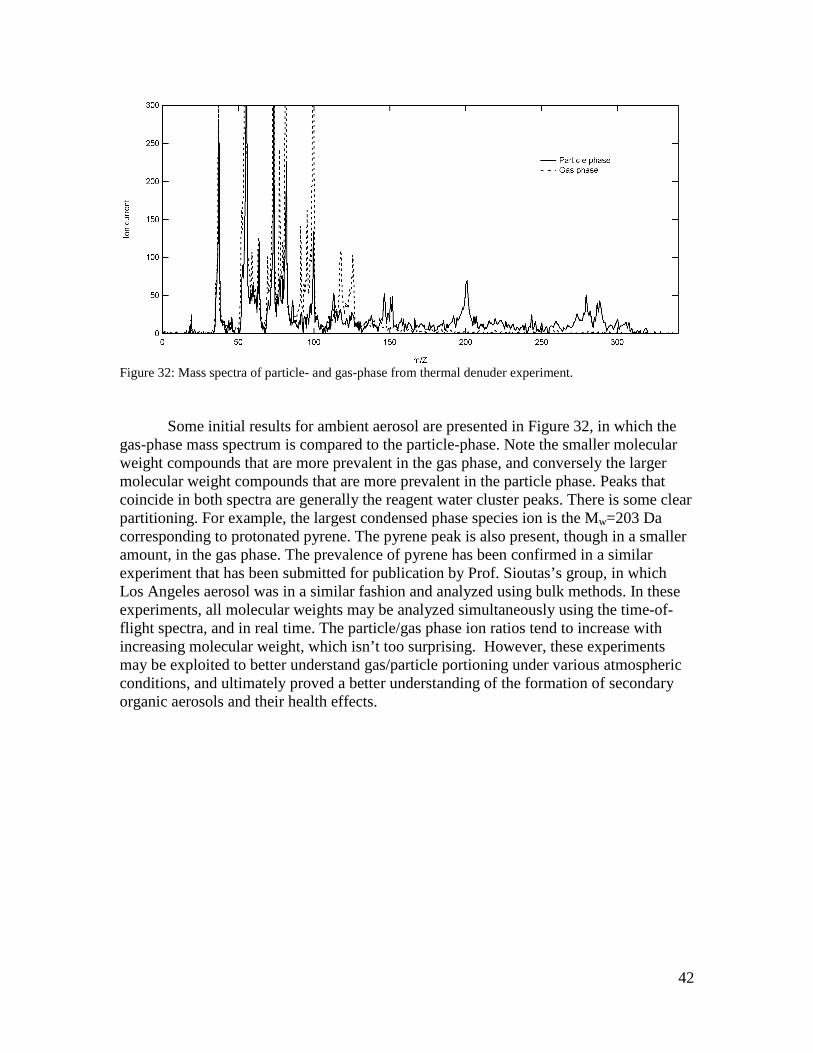
Figure 26: Chemical ionization mass spectrum of freshly formed soot particles from a premixed ethylene/oxygen burner stabilized flame. ......................................................... 36 Figure 27: Photograph of deployed chemical ionization mass spectrometer. .................. 37 Figure 28: Ambient mass spectrum of nominally 200 nm particles acquired in downtown Los Angeles on April 6, 2009. Each represents a 30 minute average. The water cluster reagent ions, labeled in the figure, represent the largest peaks. There is series of complex organic compounds evident between roughly 100 and 250 Da, having a characteristic spacing of 14 amu indicative of - CH2 – group additions. Larger peaks corresponding to larger masses are clearly evident near 280, 350, 410 and 490 amu. There exists a few differences between the two spectra, particularly the peaks at 48 and 65 amu that were present at 6:30, and not 7:30. ............................................................................................ 38 Figure 29: Mass spectra of gas-phase and nominally 150 nm particles, Pasadena, June 7, 2010. Major particle-phase ion peaks at 250 and 278 Da. ................................................ 39 Figure 30: Sequential particle mass spectra taken in downtown Los Angeles, September 27, 2010 spaced 30 minutes apart (offset vertically in plot). Prominent peaks at 146, 161, and 257 Da ........................................................................................................................ 40 Figure 31: Experiment schematic for thermal denuder system coupled to MS. ............... 41 Figure 32: Mass spectra of particle- and gas-phase from thermal denuder experiment. .. 42

8
Abstract This project focuses on the development and deployment of novel instrumentation aimed at identifying the organic compounds that comprise the aerosol in an urban environment. Sampling locations were selected to focus on the contribution for mobile source within the Los Angeles basin. The instrument is based on a novel real-time analysis technique that employs thermal desorption chemical ionization mobility/mass spectrometry of aerosols. Since such instrumentation is never been previously reported within the scientific community, the project itself is heavily oriented towards instrumentation development and optimization. Results were obtained from extensive laboratory optimization and characterization, as well as field deployments in Pasadena and downtown Los Angeles.
9
Executive Summary Background The ongoing development of instruments aimed at determining the chemical composition of ambient aerosols in real-time is driven by the strong correlation between urban aerosol concentrations - primarily combustion-generated aerosols and secondary organic aerosols – and adverse health outcomes. Many such instruments are not well-suited to analyzing organic compounds for several reasons. First, the energy associated with ionization of the sample molecules tends to break them apart into a distribution of fragments, 2) clustering of the sample molecules tends to complicate their analysis, and 3) there are size and cost constraints associated with field deployment of the instruments. In this project, novel instrumentation is characterized and deployed to alleviate some of these issues that tend to hinder real-time identification of organics. Methods The deployed instrumentation combines electrostatic collection, thermal desorption, proton transfer ionization, ion mobility separation, and time-of-flight mass spectrometry into a single deployable unit. Fragmentation and clustering of ions is enabled by low-pressure chemical ionization of the sample molecules. The ionized molecules may be separated based on their electrical mobility prior to mass analysis, allowing for one more dimension of data collection. Each instrument component was modeled, optimized, and tested in the laboratory using gas- and particle-phase organic standards. Measurements of ambient aerosols were made at locations in Pasadena and Los Angeles. Gas/particle partitioning was explored using a thermal denuder system capable of isolating gas-phases and particle-phase species for chemical analysis. Results The results indicate that each component of the instrument may be characterized with the appropriate computational model. Sample ionization is performed with minimal fragmentation and clustering, based on the absolute pressure and electric field strength within the instrument. Ion mobility measurements agree with values reported in the literature for standard organic compounds. The inlet was shown to collect aerosol with a size resolution of near 5. The ion mobility separation cell yielded mobility spectra having resolution near 10. And the mass spectrometer provided mass spectra having resolution over 300. Measurements of laboratory-generated soot aerosol revealed the presence of aromatic ring structures having a range of aliphatic side changes. Ambient aerosol measurements revealed a range of organic compounds, including aromatics such as pyrene in the gas- and particle-phase, as well as various patterns with repeated molecular weight intervals – most notably 14 amu, corresponding to -CH2.

10
1. I NTRODUCTION 1.1 Motivation
Atmospheric aerosols are known to affect health and climate. The link between anthropogenic aerosols and cardiopulmonary disease, asthma, and cancer has been established1,2,3
A further complication to direct aerosol composition measurement is the specific analysis of organic compounds. There is much direct and indirect evidence for the presence of unmeasured or unaccounted for organic aerosol in the atmosphere
. However, the difficulty in making direct quantitative measurements of aerosol composition has prevented the identification of those compounds present in the aerosols that cause the observed health conditions.
4
The two major sources of volatile organic compounds are biogenic and anthropogenic. VOCs can be removed from the atmosphere by various methods including transformation to SOAs, dry and wet deposition, and oxidation to CO and CO2. SOAs in turn are removed by the same methods or recycled to VOCs. While deposition is a physical mechanism, oxidation and SOA formation are inherently chemistry driven. In atmospheric chemical reactions, precursor compounds have a finite lifetime, therefore measurement of a semi-volatile compound in the aerosol phase requires an in-situ technique with high time resolution. Research in the past two decades has been highly geared toward producing instrumentation with this capability.
. Gas chromatography is a commonly used measurement technique but is one-dimensional leaving many compounds unidentified, providing direct evidence of unknown atmospheric constituents. The presence of secondary organic aerosol (SOA) that cannot be explained by current models is one example of indirect evidence. The presence of SOA’s is evidence that organic precursors exist at some point in time. These aerosols are known to cause visibility degradation and adverse health effects for people susceptible to respiratory complications.
1.2 Background
Sampling of the atmosphere most often employs bulk techniques where particles are collected onto filters and taken to labs for analysis. This presents an inherent problem in the analysis of the data, because compounds tend to change chemically and physically between aerosol collection and chemical analysis. Furthermore, results are heavily weighted towards particles having larger sizes which may comprise most of the aerosol mass. This is unfortunate because recent research into health effects of organic aerosol has focused on ultrafine aerosols. This section lists some existing instrumentation for determining fine and ultrafine aerosol chemical composition in real time. Within the context of these instruments, the instrumentation deployed during this project is aimed at optimizing the identification of organic compounds with minimum ion fragmentation and clustering.
11
1.2.1 Thermal Desorption Particle Beam Mass Spectrometry (TDPBMS)
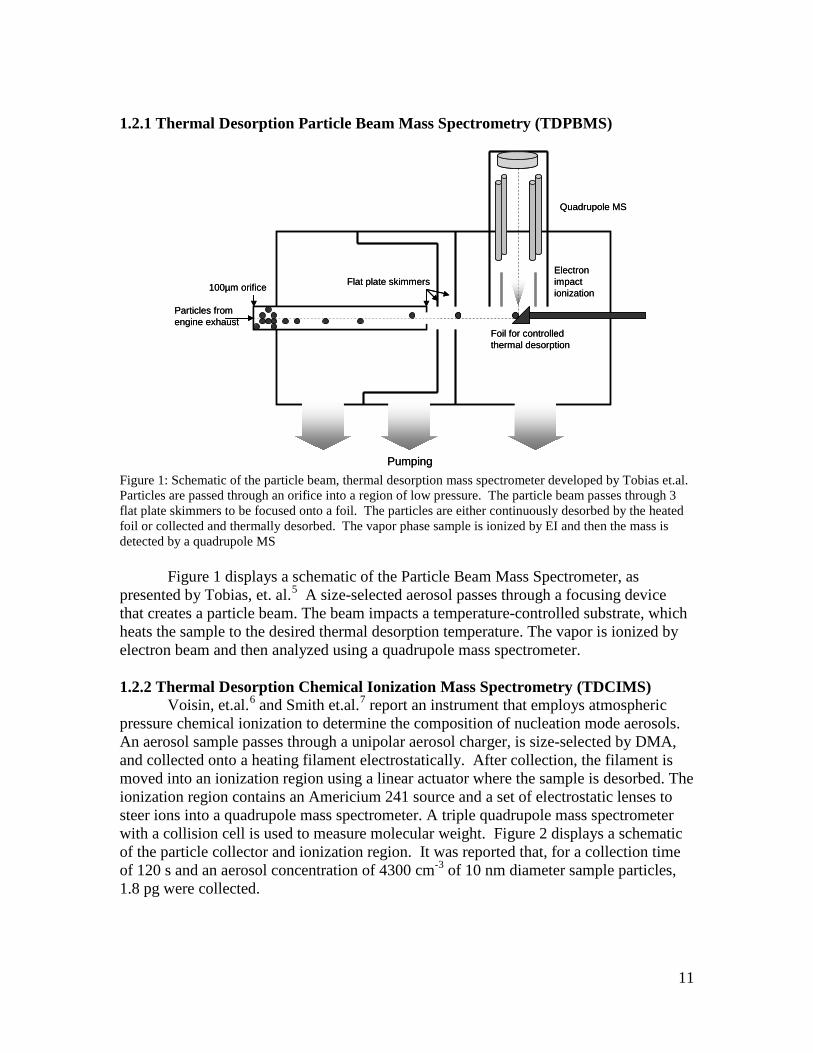
Figure 1: Schematic of the particle beam, thermal desorption mass spectrometer developed by Tobias et.al. Particles are passed through an orifice into a region of low pressure. The particle beam passes through 3 flat plate skimmers to be focused onto a foil. The particles are either continuously desorbed by the heated foil or collected and thermally desorbed. The vapor phase sample is ionized by EI and then the mass is detected by a quadrupole MS
Figure 1 displays a schematic of the Particle Beam Mass Spectrometer, as
presented by Tobias, et. al.5
A size-selected aerosol passes through a focusing device that creates a particle beam. The beam impacts a temperature-controlled substrate, which heats the sample to the desired thermal desorption temperature. The vapor is ionized by electron beam and then analyzed using a quadrupole mass spectrometer.
1.2.2 Thermal Desorption Chemical Ionization Mass Spectrometry (TDCIMS) Voisin, et.al.6 and Smith et.al.7
100µm orifice Flat plate skimmers
Pumping
Quadrupole MS
Electron impact ionization
Foil for controlled thermal desorption
Particles from engine exhaust
100µm orifice Flat plate skimmers
Pumping
Quadrupole MS
Electron impact ionization
Foil for controlled thermal desorption
Particles from engine exhaust
report an instrument that employs atmospheric pressure chemical ionization to determine the composition of nucleation mode aerosols. An aerosol sample passes through a unipolar aerosol charger, is size-selected by DMA, and collected onto a heating filament electrostatically. After collection, the filament is moved into an ionization region using a linear actuator where the sample is desorbed. The ionization region contains an Americium 241 source and a set of electrostatic lenses to steer ions into a quadrupole mass spectrometer. A triple quadrupole mass spectrometer with a collision cell is used to measure molecular weight. Figure 2 displays a schematic of the particle collector and ionization region. It was reported that, for a collection time of 120 s and an aerosol concentration of 4300 cm-3 of 10 nm diameter sample particles, 1.8 pg were collected.

12
Figure 2: Schematic of TDCIMS developed by Voisin, et.al. Two concentric cylinders surround a moveable rod with a filament at the end. A high negative voltage is applied to the inner rod creating a radial electric field pointing inwards. Charged particles of a given size migrate towards the filament. Once enough particle mass is collected on the filament, the rod is moved downstream into the ionization region which contains an Americium source. The ionized vapor sample is differentially pumped through an orifice and then into a MS. When ambient aerosols were sampled, the results indicated that the most prominently observed ions were ammonium in the positive spectrum and nitrate and sulfate in the negative spectrum. Identification of organic compounds is difficult using this instrument because of the clustering that occurs during chemical ionization at atmospheric pressure. 1.2.3 Aerosol Mass Spectrometer
The Aerodyne AMS is capable of high time resolution (0.5 Hz or two complete runs per second) and high mass resolution (4300 maximum resolution for maximum m/z = 200) by coupling a particle time-of-flight (PToF) instrument with a time-of-flight mass spectrometer (ToFMS)8
Particles at ambient pressure are drawn through an orifice and then into an aerodynamic lens where the pressure is dropped to 2 Torr. The particle beam then passes through a skimmer and into the PToF. The flight of the beam is initiated by a rotating chopper that allows only a small portion of the particle beam to be transmitted. Particles impact a resistively heated vaporization strip which is set to 600°C and are ionized by electron ionization (EI) at 70eV. The newly vapor phase ions are directed toward the mass spectrometer entrance using electrostatic lenses. The MS extraction is orthogonal to the flight of the ion beam to decrease the effect of added kinetic energy in the direction of the ion path. A recent variation of the AMS includes a temperature-controlled deposition substrate, and VUV ionization of the sample vapor.
. A schmematic of the AMS is shown in Figure 3.
MSAm 231
Aerosol In
Sheath In
Particle collection position
Thermal desorptionand ionization position
Pumping
MSAm 231
Aerosol In
Sheath In
Particle collection position
Thermal desorptionand ionization position
Pumping

13
Figure 3: ToFMS schematic. A particle inlet draws polysdisperse particles and using an aerodynamic lens to focus the particle beam. A skimmer samples the particle beam and a chopper interrupts the beam allowing only small portions of the beam to be transmitted. The particles separate by size and are collected on the thermal desorption strip. The vapor is ionized by EI and the ionized sample is orthogonally extracted into the TOF-MS. 2 modes are available, V and W mode. W mode gives higher resolution but lower sensitivity than mode V. 1.2.4 Aerosol Time-of-flight Mass Spectrometer (ATOFMS)
One of the earlier instruments aimed at solving the problem of real-time particle speciation is the ATOFMS instrument originally described by Gard, et.al.9 and Prather, et.al.10 This instrument is capable of single particle analysis in real-time. As shown in Figure 4, a polydisperse aerosol is introduced into a pressure interface through an inlet nozzle. The particles travel through successive skimmers forming a collimated particle beam. Each particle then passes through two laser beams where the scattered light allows determination of the size of the particle from the velocity between the two laser spots. A third laser is simultaneously triggered to both ablate and ionize the particle in a single step. A continuous field accelerates the ions toward the detectors in a dual time-of-flight mass spectrometer for for simultaneous mass spectra acquisition of positive and negative ions. The one-step ablation/ionization is known to fragment organics to the point that it is difficult to differentiate organic carbon from elemental carbon. However, the instrument demonstrated the capability to trace salts and metals.11
Pumping
Thermal Desorption and Electron Impact Ionization
Particle inlet and aerodynamic lens
Skimmer Chopper
TOF Mass Spectrometer - Bimodal
Main Reflector Secondary
Reflector
Extractor
MCP Detector
Particle TOF region
Pumping
Thermal Desorption and Electron Impact Ionization
Particle inlet and aerodynamic lens
Skimmer Chopper
TOF Mass Spectrometer - Bimodal
Main Reflector Secondary
Reflector
Extractor
MCP Detector
Particle TOF region

14
Figure 4: Schematic of ATOFMS. Particles are drawen in through nozzles and sampled through skimmers. Particles pass through a continuous wave argon ion laser and the scattered light is detected by a PMT. 6cm later the particle passes through an orthogonal laser and PMT. The instrument calculates the particle size based on the time difference between scattered light events and times the third laser to desorb and ionize constituents on the particle. The vapor phase compounds are then accelerated by the extractors and their TOF measured on the detectors. 1.2.5 Comparison of Instruments Table 1 Summary of aerosol speciation instrumentation Instrument TDPBMS TDCIMS AMS ATOFMS This study Particle Collection and sizing
DMA DMA (optional) Electrostatic Precipitator
Aerodynamic lens and TOF chopper disc
Aerodynamic lens and light scattering
Particle inlet
Particle to gas phase
Thermal Desorption
Thermal Desorption
Thermal Desorption
Laser ablation
Thermal Desorption
Ionization of gas phase
EI Atoms. Pres. CI
EI
Laser ionization
Low Pres. CI
Chemical Analysis
QMS Triple QMS TOF MS Dual TOF MS
IMS – TOF MS
Advantages Quantitative, wide particle size range, Temperature control
Low fragmentation, analysis of nucleation mode
Quantitative, wide particle size range.
Single particle analysis
Low fragmentation, low clustering, IMS capable
Drawbacks E-beam impact high fragmantation of organics
APCI subject to ion clustering, limited size range
E-beam impact high fragmentation of organics
High fragmentation, size/composition biases
Lower sampling rate due to particle charging
PMTContinuous-wave argon ion laser
Positively charged ion TOF-MS Negatively charged ion TOF-MS
Desorption-Ionization laser
6 cm
Orthogonal Laser and PMT
2 Torr
Detectors
Extractors
Reflectors
PMTContinuous-wave argon ion laser
Positively charged ion TOF-MS Negatively charged ion TOF-MS
Desorption-Ionization laser
6 cm
Orthogonal Laser and PMT
2 Torr
Detectors
Extractors
Reflectors

15
Table 1 summarizes the instruments reviewed in this section, in comparison to the
method applied in this study, and detailed in the next section. The primary difference between the instrumentation employed in this study and existing instruments is that the present study focuses on maintaining intact parent ions while minimizing ion clustering. This ensures that a given compound will yield a single peak in the time of flight spectrum, and facilitates the potential identification of organic compounds within a complex atmosphere samples. At the same time, employing time-of-flight mass spectrometry allows for the possibility of dual mobility/mass spectrum acquisition, since a quadrupole mass spectrometer sits on a single mass, or scans masses over time.
16
2. PHASE I- INSTRUMENTATION DEVELOPMENT and CHARACTERIZATION
During this project, a novel aerosol chemical analyzer with the ability to sample
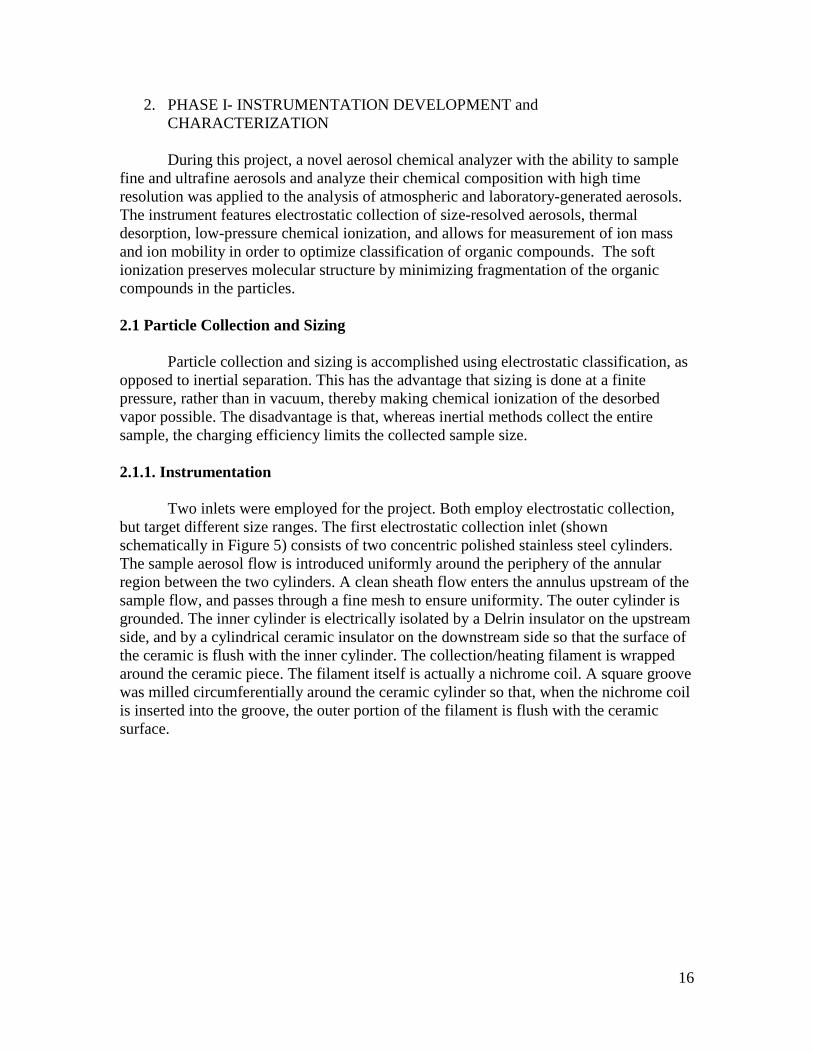
fine and ultrafine aerosols and analyze their chemical composition with high time resolution was applied to the analysis of atmospheric and laboratory-generated aerosols. The instrument features electrostatic collection of size-resolved aerosols, thermal desorption, low-pressure chemical ionization, and allows for measurement of ion mass and ion mobility in order to optimize classification of organic compounds. The soft ionization preserves molecular structure by minimizing fragmentation of the organic compounds in the particles. 2.1 Particle Collection and Sizing Particle collection and sizing is accomplished using electrostatic classification, as opposed to inertial separation. This has the advantage that sizing is done at a finite pressure, rather than in vacuum, thereby making chemical ionization of the desorbed vapor possible. The disadvantage is that, whereas inertial methods collect the entire sample, the charging efficiency limits the collected sample size. 2.1.1. Instrumentation Two inlets were employed for the project. Both employ electrostatic collection, but target different size ranges. The first electrostatic collection inlet (shown schematically in Figure 5) consists of two concentric polished stainless steel cylinders. The sample aerosol flow is introduced uniformly around the periphery of the annular region between the two cylinders. A clean sheath flow enters the annulus upstream of the sample flow, and passes through a fine mesh to ensure uniformity. The outer cylinder is grounded. The inner cylinder is electrically isolated by a Delrin insulator on the upstream side, and by a cylindrical ceramic insulator on the downstream side so that the surface of the ceramic is flush with the inner cylinder. The collection/heating filament is wrapped around the ceramic piece. The filament itself is actually a nichrome coil. A square groove was milled circumferentially around the ceramic cylinder so that, when the nichrome coil is inserted into the groove, the outer portion of the filament is flush with the ceramic surface.
17
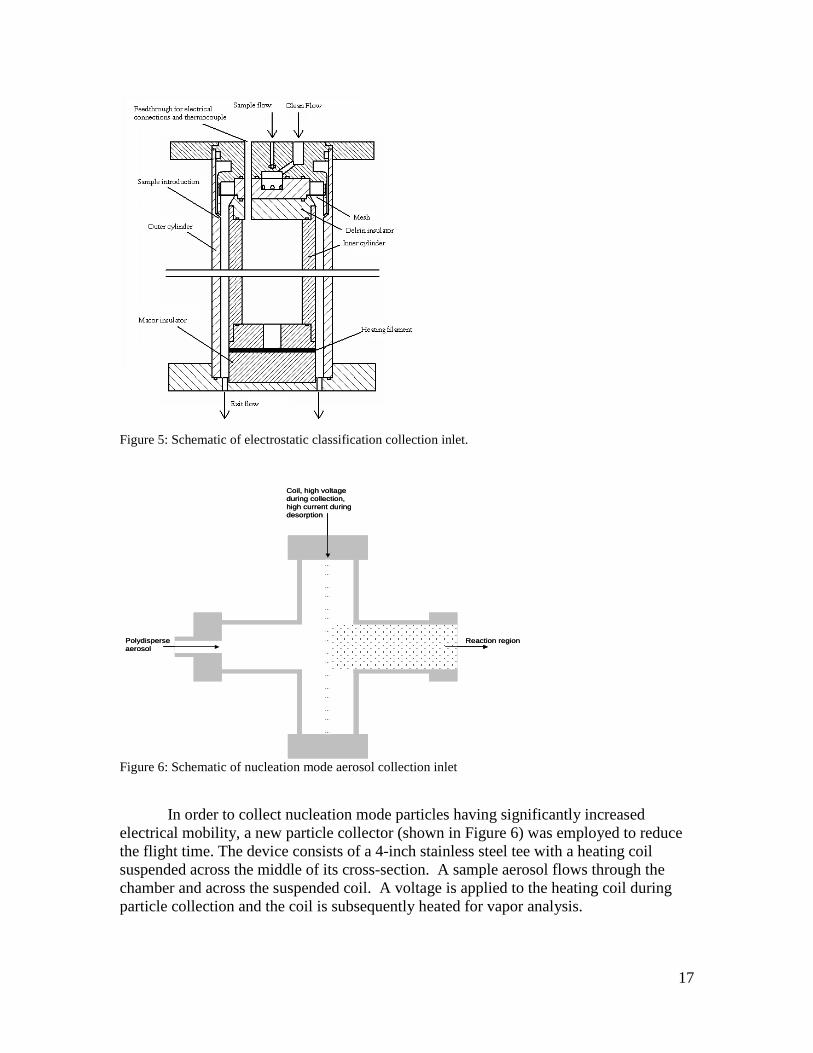
Figure 5: Schematic of electrostatic classification collection inlet.
Figure 6: Schematic of nucleation mode aerosol collection inlet In order to collect nucleation mode particles having significantly increased electrical mobility, a new particle collector (shown in Figure 6) was employed to reduce the flight time. The device consists of a 4-inch stainless steel tee with a heating coil suspended across the middle of its cross-section. A sample aerosol flows through the chamber and across the suspended coil. A voltage is applied to the heating coil during particle collection and the coil is subsequently heated for vapor analysis.
Coil, high voltage during collection, high current during desorption
Polydisperse aerosol
Reaction region
Coil, high voltage during collection, high current during desorption
Polydisperse aerosol
Reaction region

18
2.1.2 Electrostatic Collection Theory
In the absence of Brownian motion, the trajectory of a particle having electrical mobility, Zp, can be completely characterized in terms of the fluid stream function, Ψ , and the electric flux function, Φ :
1 1,r zu ur z r r∂Ψ ∂Ψ
≡ ≡ −∂ ∂
(1)
and 1 1,r zE Er z r r∂Φ ∂Φ
≡ ≡ −∂ ∂
, (2)
where r is the radial coordinate, and z is the axial coordinate increasing in the downstream direction. The trajectory of any particle is such that the particle stream function, pZΨ + Φ , is constant. For the flow between two concentric cylinders, one may define bounding fluid streamlines such that, 1Ψ corresponds to flow adjacent to the outer cylinder, 2Ψ separates the sample flow from the clean flow, and 3Ψ corresponds to flow adjacent to the inner cylinder. The sample flow rate, Qs, and clean sheath flow rate, Qc, may thus be written in terms of these bounding stream functions:
2 12 ( )sQ π= Ψ −Ψ (3)
3 22 ( )cQ π= Ψ −Ψ . (4) The initial value of the electric flux function, inΦ , is constant for all particles. Since pZΨ + Φ is constant along any particle trajectory, the final value of the electric flux function, *Φ , may be written in terms of the bounding flow stream functions:
ininpZ
Φ+Ψ−Ψ=Φ )(13
* . (5)
Particles enter along an initial fluid stream function, inΨ , that is uniform and random in the range { }1 2,Ψ Ψ and *Φ is also a uniform and random in the range:
{ } inpZ
Φ+Ψ−ΨΨ−Ψ∈Φ )(),(13132
* , (6)
or equivalently,

19
incsc
p
QQQZ
Φ+
+
∈Φππ 2
,2
1* . (7)
A particle is collected on the filament if *Φ is between the values of the electric flux function at the upstream and downstream edges of the filament. The collection efficiency, η , onto the filament is thus equal to the fraction of the interval in Eq. 7 that is intercepted by the interval spanned by the filament. Diffusion effects become more pronounced for smaller particles and lower pressures, and tend to broaden this interval of overlap. These may be modeled by assuming a normal distribution around the nominal particle trajectories in the absence of Brownian motion. The resulting probability function is:
2* ** * *( ) ( )1( , ) exp
22p p in p in
in
Z Z Zf d d
σπσ ΓΓ
Ψ + Φ − Ψ + Φ Ψ Φ Φ = − Φ
(8)
which represents the probability of a particle originating along the streamline, inΨ , impacting the inner cylinder between *Φ and * *dΦ + Φ . The resulting efficiency curve is obtained by integrating this function over the electric flux function spanning the collection filament, and over the initial fluid streamline spanning the sample flow:
∫ ∫Ψ
Ψ
Φ′
Φ ′′ Ψ−ΨΨ
ΦΨ= 2
1 12
* ),( inin
dfη (9)
Figure 7: Schematic of gas-phase ion chemistry in chemical ionzation chamber.

20
2.2 Chemical Ionization The energy inadvertently imparted into an organic molecule in order to add a charge often results in its fragmentation. This occurs frequently in high energy processes such as laser ablation/ionization or electron beam impact ionization. By contrast, chemical ionization may be utilized to minimize the extent of fragmentation that occurs. A frequently reported mode of chemical ionization is a gas-phase proton transfer reaction whereby a protonated water molecule transfers its proton to an organic molecule having a higher proton affinity. This reaction occurs with near unity efficiency upon collision. In the present study, the gas phase ion chemistry is initiated by an Americium strip that emits alpha particles, as depicted in Figure 7.
The flow through the ionization region consists of the buffer gas and a small amount of sample gas. As the gas flows over the americium source, the alpha particles ionize the buffer gas upon impact. Each alpha particle is emitted with a kinetic energy of 5.4 MeV, orders of magnitude greater than the required energy for an ionizing collision. Each emitted alpha particle is able to ionize numerous molecules. The number of ionizations per distance travelled of an alpha particle can be estimated to be 30,000 per cm in open air. Extrapolating to low pressure yields 400 per cm at 10 Torr. For the 0.5 mCi Americium source used in this study, a maximum current of 1.2 nA may be theoretically generated by the alpha source. However, the ion current measured by a faraday plate placed at the end of the reaction region was found to be an order of magnitude smaller. This may be attributed to diffusional losses, ion recombination, and the fact that the penetration is larger than the inner diameter of the reaction region.
Figure 8 displays a sketch of the chemical ionization region, including the Americium strip, and a series of electrodes that maintain a high electric field strength that minimizes ion fragmentation and maintains a unipolar environment. The ionization region is maintained at the low pressure close to that of the aerosol inlet, which also prevents ion clustering.
Dry Scroll Pump
Sample α
10-12 Torr 90 mm Drift cell
BNG High Voltage Insulation Resistor Chain
Figure 8: Schematic of chemical ionization region. The BNG is the Bradbury-Nielson type ion gate that pulses ion packets into the ion mobility separation region.

21
2.3 Ion Mobility Separation
The electrical mobility of an ion is defined as the average drift velocity of an ion ensemble divided by the electric field through which the cloud of ions is moving in the presence of a pressure field. An ion packet introduced into a uniform electric field containing a neutral gas at a finite pressure will follow the field while also interacting with the neutral molecules. The ion packet will travel at an average drift velocity that is determined by the nature of the collisions with the neutral molecules. Ions with higher mobility will have higher drift velocities. The packet will thus separate spatially such that higher mobility ions will traverse the field more quickly. Ion Mobility Spectrometers exploit this phenomenon to identify unknown compounds
In addition to attaining a limiting drift velocity, an ion packet will also broaden along the direction of motion. This longitudinal diffusion limits the mobility resolution of the ion mobility cell. This may be modeled using Fickian diffusion, whereby the flux, J, is given by:
J D φ= − ∇ (10) where φ is the ion concentration. The mobility of an ion is sensitive to the temperature and pressure. Therefore, it is convenient to express mobility as a reduced mobility Zo, which is normalized to standard conditions:
(273/ )( / 760)o pZ Z T P= (11) Compounds are commonly tabulated in the literature as reduced mobilities. In this study, the pressure in the mobility cell was kept between 10 and 18 Torr. This minimizes clustering of ions in the reaction region, while still providing a sufficient ion current for sampling by the mass spectrometer. However, the lower pressures also lead to enhanced diffusion, both tranverse and longitudinal. In order to minimize the effects of tranverse diffusion and to optimize ion transmission, an a spatially oscillatory field was applied through careful design of the electrodes. Simulations demonstrate that this field may be optimized for ion transmission (see Figure 9).
The ion mobility cell in this study consists of a series of high voltage electrodes that maintain the approprate electric field. The residence time in this region is directly proportional to the electrical mobility of the ions. Thus, when this element is placed in between the ion source region and the detector, the time of detection may be correlated
Figure 9: SimION simulation of ion transport through the ion mobility cell. Note the oscillatory field that maintains a narrower ion beam and thus a high ion transmission rate.

22
with the ion mobility. An ion tracking model in a finite drift gas was implemented and used to optimize the geometry of the ion mobility cell. Results of the model are shown as ion trajectories in Figure 9. 2.4 Pressure Interface
Mass spectrometry requires pressures low enough such that the ion mean free path is larger than the size of the chamber. In order to achieve such low vacuum while still maintaining the sample ion throughput, a pressure interface is placed between the ion source and the mass spectrometer, which removes neutral molecules using an orfice/skimmer assembly (as shown in Figure 10). A series of focusing electrodes are placed to along the ion trajectories to ensure that the ions remain collimated and focused into the mass spectrometer.
This focusing region is critical to the instrument operation, because the target ions are separated from the neutral molecules in this region. The components of this region, displayed in Fig. 10, include an orifice plate, gas skimmer, Einzel lens, and ion deflectors. We have explored a wide range of potentials applied to these electrodes in order to optimize the ion transmission efficiency into the extraction region of the mass spectrometer. A series of experiments were completed, in which a microchannel plate detector was placed where ions are normally extracted in the mass spectrometer and masked in the shape of the entrance to the extraction region. Sample results from these experiments are shown in Figure 11, which displays a plot of the measured ion count rate for various electrode potentials and a series of organic compounds, including isopropanol, heptane, butanol, acetone, toluene, and phenol.
551 L/s Pump
2x70 L/s Pump
To MS
Einzel Skimme
Deflector
x z
Thin plate sampling orifice
1E-3 Torr 1E-5 Torr
ds-o
Figure 10: Pressure interface schematic. This section reduces the pressure for mass spectrometry analysis, while maintaining ion throughtput using electrostatic lenses.

23
Figure 11: Measured ion current into mass spectrometer for a variety of focusing potentials and organic compounds. Ions are counted for .10 seconds each second, so a count rate of 10000 ions/second corresponds to a total ion current of 100,000 ions/sec, or .02 pA. (I = isopropanol; H = heptane; B = butanol ; A = acetone; T = toluene; P = phenol)
There are a few notable features in Figure 11. First it is clear that the potentials may be adjusted to better focus the ion beam into the extraction region. Second, the change in ion current when an organic compound is introduced indicates that there exist some mobility and mass effects in the ion transmission efficiency. The relative differences in ion current between the organics are also affected by their vapor pressures – as evidenced by the large changes induced by acetone (labeled A) Third, the small change produced by heptane (labeled H) is consistent with the smaller proton affinities of smaller alkanes as compared to the alcohols and aromatics. 2.5 Mass Spectrometer The mass spectrometer used in the study is an orthogonal-extraction time-of-flight reflectron mass spectrometer, which features a rapidly pulsed orthogonal extraction voltage which redirects incoming ions towards a reflector. The reflector compensates for the finite distribution of ion energies and focuses the ions back towards a microchannel plate ion detector. Individual ions are counted and time-stamped with very high accuracy using a time-to-digital converter. As the extraction voltage is pulsed, spectra are integrated over the desired time duration, forming a high-resolution mass spectrum of the incoming ions. The performance was found to be sensitive to the electrode potentials, reflectron angle, and incoming ion kinetic energy, which is a function of the upstream ion focusing electrode potentials. Therefore, SimION was used to determine the optimal operating parameters (see Figure 12).

24
A sample trajectory of an ion that was transmitted, extracted, and detected is
shown in Figure 13. It may be clear from the figure that the kinetic energy of the ions entering the mass spectrometer and the angle of the reflector both determine whether an extracted ion will hit the detector. Moreover, one can tune the angle of the reflector to examine ions entering the mass spectrometer with various energies. For example, Figure 14 displays the mass spectra of acetone and isopropanol obtained from the configuration displayed in Figure 13 – the reflector is perfectly flat, and only ions entering with relatively high velocities may hit the detector. That is, the spectrum in Figure 14 corresponds to high energy ions. This in turn corresponds to ions that have not experienced many collisions, and thus remain intact. The peaks in Figure 14 correspond to the reactant ions (protonated water and its first cluster) and the protonated sample molecules. There are also small peaks corresponding to water clusters labeled in the graph. These high-energy ions (near 60 eV) have entered the mass spectrometer completely intact with zero fragmentation.
A
B
Figure 12: SimION models of the orthogonal extraction mass spectrometer. Ion trajectories are calculated given the optimal potentials of the electrodes using varying input ion kinetic energies.

25
Figure 13: Computed ion trajectory in the ion focusing region and mass spectrometer.
Figure 14: High-energy mass spectra of acetone and isopropanol. Note the decrease in the reactant ion peaks with increasing sample signal.
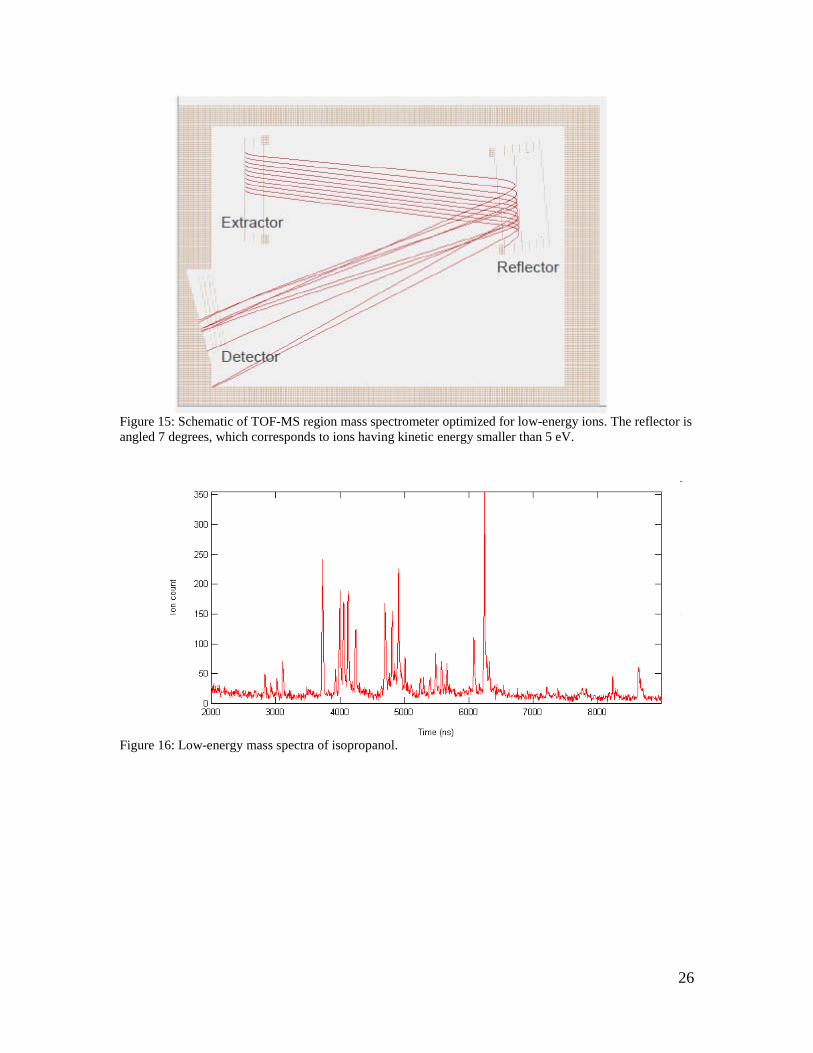
By contrast, if the reflector angle is optimized for smaller incoming ion velocities, as in Figure 15, then we are selecting for low energy ions. These are the ions that experienced many collisions with the neutral gas molecules and consequently fragmented. An arrival time spectrum of these “low-energy” ions is displayed in Figure 16. It is immediately evident that a large number of fragments and clusters are present in this case, as compared to the mass spectrum obtained when the system was optimized for high-energy ions.
26
Figure 15: Schematic of TOF-MS region mass spectrometer optimized for low-energy ions. The reflector is angled 7 degrees, which corresponds to ions having kinetic energy smaller than 5 eV.
Figure 16: Low-energy mass spectra of isopropanol.

27
A schematic of the complete instrument deployed during this project to determine the chemical composition of ambient and laboratory generated aerosols is shown in Figure 12. Over the course of the project, three primary configurations were imployed: 1) the ion mobility cell alone, 2) the mass spectrometer alone, and 3) the mobility cell and mass spectrometer in series. The benefits to isolating the components were the increased time resolution and ease for data acquisition when each component was used separately. Results from these experiments are detailed in the next section.
Figure 17: Schematic of instrument deployed including all components.

28
3. PHASE II - RESULTS AND DISCUSSION
Phase II of the project allowed for more extensive instrument characterization, model comparison, lab experiments, and some field deployment.
3.1 Instrument Characterization
3.1.1 Inlet Experiments A series of experiments were developed in order to determine the collection efficiency of the inlet as a function of particle size. At atmospheric pressure, the inlet could be characterized using conventional aerosol techniques, such as direct particle counting using a condensation particle counter. The number of particles collected on the filament could be easily determined by subtracting the number of particles exiting the inlet with the filament voltage turned on and off. At low-pressure, however, particles may not be readily counted using conventional techniques. Therefore, the particle number collected on the filament at low pressure was determined using the ion mobility cell to detect the presence of vapor from the collected particles. This low-pressure electrostatic collection is unique, in that differential mobility analysis and electrostatic precipitation is exclusively done at atmospheric pressures. This alone offers the possibility of low-pressure chemical ionization, which is necessary to minimize clustering of ions that may complicate the mass spectra. Figures 18 and 19 display the results of these experiments at both low pressure and atmospheric pressure, respectively, as compared to the theoretical model that was developed to take electrostatics, gas flow, and Brownian motion into account. The high level of agreement between the measurements and the model demonstrate that the aerosol collection is fairly well understood.

29
Figure 18: Calibration of aerosol electrostatic classification inlet at 18 Torr.

30
Figure 19: Calibration of aerosol electrostatic classification inlet at atmospheric pressure.
Figure 20: Calibration of nucleation mode collection inlet.
0.00
10.00
20.00
30.00
40.00
50.00
60.00
70.00
80.00
90.00
100.00
1 10 100 1000
VCc/(QDp)
Col
lect
ion
Effic
ienc
y
Normalized Data 0.3 LPM
Normalized Data 1 LPM
Fitted Exponential for 0.3 LPM
Fitted Exponential for 1.0 LPM

31
The nucleation mode inlet was also calibrated at atmpospheric pressure using laboratory-generated aerosols, and was found to exhibit a near-universal collection efficiency curve when normalized with a dimensionless mobility diameter (see Figure 20). This scaling allowed for extrapolation of the inlet behavior at low pressure. In general, the inlet was very efficient for collecting particles smaller than 30 nm at flow rates and pressures consistent with the general operating parameters of the instrument. In contrast to the electrostatic classification inlet (Figure 5), the nucleation mode aerosol is not size-resolved. Rather, all particles smaller than 30 nm in mobility diameter are collected. 3.1.2 Mass Spectrometer Characterization Extensive studies of ion fragmentation and clustering were necessary in order to optimize the prevalence of parent ions in the resulting spectra. In short, the electric field strength within the ion source and pressure interface regions need to be large enough to break up ion clusters (depending on the target pressure of the inlet and source regions), and small enough to minimize collision induced fragmentation of the ions.
Figure 21: Thermal desorption chemical ionization of pyrene particle standards. The success of the instrument in maintaining parent organic ions is demonstrated in the mass spectra shown in Figures 21 and 22. These correspond to chemical analyses of particle standards composed of pyrene and oleic acid, respectively. The overwhelming peaks in both spectra, corresponding to protonated parent ions, suggest a higher level of

32
certainty is possible in the identification of specific organic compounds within ambient aerosol samples.
Figure 22: Thermal desorption chemical ionization of pyrene particle standards. 3.1.3 Ion Mobility Cell Characterization The mobility cell was also tested using particle-phase and gas-phase organic standards. The primary configuration for these results removed the mass spectrometer, so that ion detection occurred using the microchannel plate detector located within the pressure interface, directly within the ion beam. Figure 23 displays two mobility spectra corresponding to the reactant ion peak as compared to the mobility spectrum of pure oleic acid. The shift in the peak corresponds to the decreased electrical mobility of oleic acid ions as compared to the reactant water cluster ions. The peak width is primarily caused by the finite width of the ion gate pulse. Given this constraint, and that extra broadening caused by longitudinal diffusion of the ions along the direction of motion, a model was implemented to account for ion collisions with neutral molecules, in order to determine the nature of the limits in mobility resolution. These results are displayed in Figure 24, which shows the mobility spectrum of benzene ions as compared to the model. There is excellent agreement in the absolute mobility, the lower measured resolution may be caused by enhanced clustering, fragmentation, or non-idealities in the ion gate pulse. Nevertheless, the resolution is sufficient to resolve peaks of reactant ions, benzene, and oleic acid.

33
Figure 23: Ion mobility spectra of the reactant ion peak (i.e. water clusters) and oleic acid at a pressure of 18 Torr.

34
Figure 24: Comparison between model and experiment for transport of benzene ions through mobilty cell at 10 Torr.
Figure 25: Direct comparisons between mobility (11 Torr) (left) and mass (right) spectra for acetone clusters (top) and isopropanol clusters (bottom).
0
0.2
0.4
0.6
0.8
1
1.2
0 1000 2000 3000 4000 5000 6000
Time (micro-sec)
Num
ber
Benzene data
Sim 11 Torr 10 m/s
35
Direct comparisons between mobility and mass spectra are shown for gas-phase organic standards in Figure 25. Note the presence of the residual water cluster ion at mass 37 (H2O -H3O+) that appears in both the mobility and the mass spectrum under similar electric field strengths.
Table 2: Measured reduced mobility as compared to literature values.
Compound Ko Measured
Ko Beta Source Ionization* Ko EVM* Ko Eiceman
Water 2.21 2.20 Methanol 1.95 2.06 2.08 Ethanol 1.83 1.99 1.90 2.06 Acetone 2.10 2.13 2.13 Acetone-Water 1.94 IPA 2.02 2.07 1.98 1.93 IPA-water 1.79 1.83 1.75 Benzene 1.95 1.94 Toluene 1.90 1.87 Butanol 1.90 1.82 1.82 Butanol-water 1.58 1.59 1.54
Table 2 summarizes the reduced mobilities of the various compounds tested in
this study as compared to values found in the literature from two sources. The first column contains the values for this study. The second and third columns are the values found by Sielemann et al (2001)12
using two different methods (chemical ionization using a beta source and ionization using a UV-lamp) and the fourth column is from the compilation work of Eiceman et al (2005)41.
3.2 Soot measurements
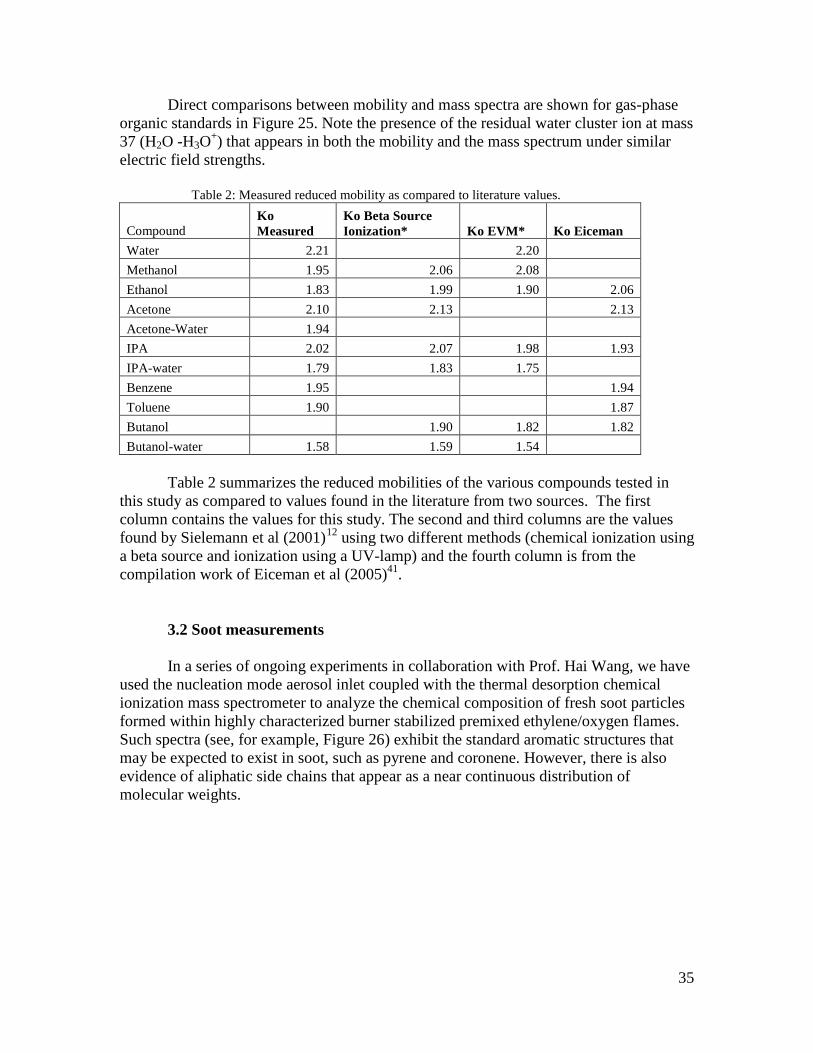
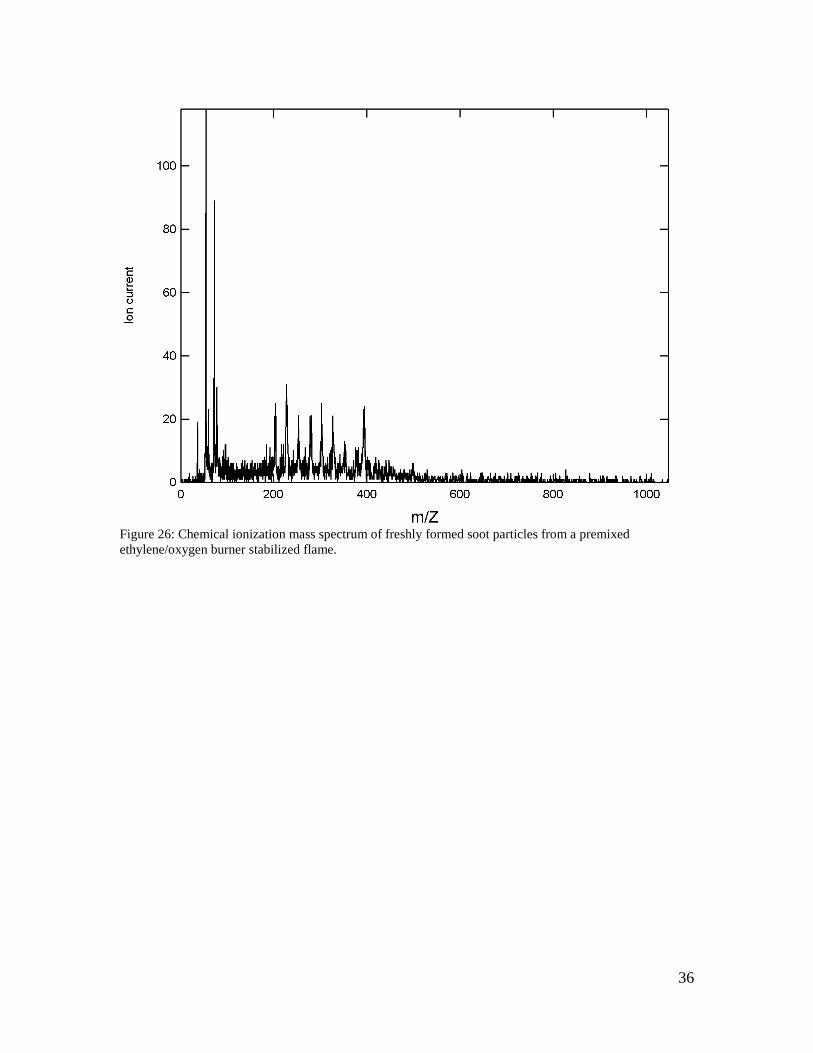
In a series of ongoing experiments in collaboration with Prof. Hai Wang, we have used the nucleation mode aerosol inlet coupled with the thermal desorption chemical ionization mass spectrometer to analyze the chemical composition of fresh soot particles formed within highly characterized burner stabilized premixed ethylene/oxygen flames. Such spectra (see, for example, Figure 26) exhibit the standard aromatic structures that may be expected to exist in soot, such as pyrene and coronene. However, there is also evidence of aliphatic side chains that appear as a near continuous distribution of molecular weights.
36
Figure 26: Chemical ionization mass spectrum of freshly formed soot particles from a premixed ethylene/oxygen burner stabilized flame.

37
3.3 Ambient measurements
Figure 27: Photograph of deployed chemical ionization mass spectrometer.
The field deployment of the instrumentation tested and characterized in the laboratory required a reconstruction of sorts, such that the entire instrument was contained within a mobile structure. A shown in the photograph in Figure 27, the instrument was mounted on large casters within an 80/20 frame. The assembly was designed for stability and allowed for minimization of the instrument footprint. The resulting instrument fits through doorways and is transportable by a small moving truck, without requiring disassembly. In this form the instrument was transported to a sampling location in Pasadena located roughly 100 m downwind of the 110 light-duty freeway. Thermal-desorption chemical ionization mass spectra were obtained for gas-phase and particle-phase ambient samples sporadically at this location and in a downtown Los Angeles location at the USC campus. Resulting spectra from these deployments are shown in Figures 28 – 30.

38
Figure 28: Ambient mass spectrum of nominally 200 nm particles acquired in downtown Los
Angeles on April 6, 2009. Each represents a 30 minute average. The water cluster reagent ions, labeled in the figure, represent the largest peaks. There is series of complex organic compounds evident between roughly 100 and 250 Da, having a characteristic spacing of 14 amu indicative of - CH2 – group additions. Larger peaks corresponding to larger masses are clearly evident near 280, 350, 410 and 490 amu. There exists a few differences between the two spectra, particularly the peaks at 48 and 65 amu that were present at 6:30, and not 7:30.
0
50
100
150
200
250
300
350
400
450
0 100 200 300 400 500 600
Mass (amu)
Arb
itrar
y U
nits
April 6, 6:30 PMApril 6, 7:30 PM
H3O+
(H2O)-H3O+
(H2O)2-H3O+
(H2O)3-H3O+
83 142
156
N2+
170
91184

39
Figure 29: Mass spectra of gas-phase and nominally 150 nm particles, Pasadena, June 7, 2010. Major particle-phase ion peaks at 250 and 278 Da.
40
Figure 30: Sequential particle mass spectra taken in downtown Los Angeles, September 27, 2010 spaced 30 minutes apart (offset vertically in plot). Prominent peaks at 146, 161, and 257 Da Similar mass spectra were acquired at both locations with varying prominent peak locations. At this point interpretation of the data for ambient measurements is difficult without 1) more continuous ambient monitoring, and 2) comparison with concurrent measurements made using other instruments.

41
3.4 Gas/Particle Partitioning Experiments In another series of ongoing experiments in collaboration with Prof. Costas Sioutas, we have incorporated a thermal denuder system that isolates the gas- and particle- phase species for separate or combined chemical analysis. Too address the last stement in the last section, these experiments may be immediately compared to identical measurements made by this group using bulk samplers couple with laboratory analysis.
Figure 31: Experiment schematic for thermal denuder system coupled to MS. The basic procedure involves testing the system using particle standards to determine the extent to which the gas-phase plus the particle-phase ion count matches the combined signal. For ambient samples, a large number of unknown compounds may be present, so the basic procedure involves repeating the measurements but for a wide variety of ion peaks present in the spectrum. This will likely require longer sampling times, and potentially a VACES inlet.
42
Figure 32: Mass spectra of particle- and gas-phase from thermal denuder experiment. Some initial results for ambient aerosol are presented in Figure 32, in which the gas-phase mass spectrum is compared to the particle-phase. Note the smaller molecular weight compounds that are more prevalent in the gas phase, and conversely the larger molecular weight compounds that are more prevalent in the particle phase. Peaks that coincide in both spectra are generally the reagent water cluster peaks. There is some clear partitioning. For example, the largest condensed phase species ion is the Mw=203 Da corresponding to protonated pyrene. The pyrene peak is also present, though in a smaller amount, in the gas phase. The prevalence of pyrene has been confirmed in a similar experiment that has been submitted for publication by Prof. Sioutas’s group, in which Los Angeles aerosol was in a similar fashion and analyzed using bulk methods. In these experiments, all molecular weights may be analyzed simultaneously using the time-of-flight spectra, and in real time. The particle/gas phase ion ratios tend to increase with increasing molecular weight, which isn’t too surprising. However, these experiments may be exploited to better understand gas/particle portioning under various atmospheric conditions, and ultimately proved a better understanding of the formation of secondary organic aerosols and their health effects.
43
4. SUMMARY AND CONCLUSIONS
A chemical ionization, thermal desorption chemical analyzer was characterized and deployed in various configurations. Each component of the instrument, including the inlets, chemical ionization region, mobility cell, pressure interface, and mass spectrometer were characterized with an appropriate computational model. Ion mobility measurements agree with values reported in the literature for standard organic compounds. The inlet was shown to collect aerosol with a size resolution of near 5. This held true for measurements made at atmospheric pressure using conventional aerosol counting techniques, and at 18 Torr using ion mobility spectrometry to determine the mass of oleic acid particles that had been collected on the heating filament. The ion mobility separation cell yielded mobility spectra having resolution near 10. This was tested using particle- and gas-phase organic standards. The mass spectrometer provided mass spectra having resolution over 300, due to the reflector reducing the effects of the finite kinetic energy distribution among the sample ions. Measurements on laboratory-generated soot aerosol revealed the presence of aromatic ring structures having a range of aliphatic side changes. This opens up a few questions concerning combustion-generated aerosols, as the primary soot formation models do not incorporate such chemical structures during early soot formation. This may also affect the reactivity and behavior of newly formed soot particles in the atmosphere. Ambient aerosol measurements revealed a range of organic compounds, including aromatics such as pyrene in the gas- and particle-phase, as well as various patterns of structures with repeated molecular weight intervals – most notably 14 amu, corresponding to -CH2.
5. RECOMMENDATIONS 5.1 Technical Recommendations
The instrumentation characterization and ambient measurement results generated throughout the course of this project represent the evolution of a new class of instruments aimed at the in-situ chemical analysis of ambient fine and ultrafine aerosols. In general, progress was rapid in that no such instrumentation had existed prior to the start of the project, and the resulting ambient measurements represent the first in situ measurements of their kind. Indeed, there is an active push among the aerosols community to better identify organic compounds within ambient aerosols. This is evidenced by the increase in thermal desorption as the preferred vaporization mechanism. The temperature-controlled substrate presented by Paul Ziemann’s group is the most elegant, and can be readily adopted into Aerodyne’s AMS for VUV ionization. Indeed this instrument will likely yield large amounts of novel data sets, particularly considering the capacity of such organizations to build and deploy instrumentation on relatively rapid timescales. However, the chemical ionization ion mobility and time-of-flight mass spectrometry results presented here suggest that they may be unique, and should be further applied to

44
ambient measurements and compared to existing in-situ instrumentation, as well as bulk methods.
5.2 Administrative/Other Recommendations
This project was the most difficult in my career to manage. There were a number of issues that put a level of continuous uncertainty on the project. And this most definitely affected my ability to achieve the goals that I think I could have through this project. These issues are listed below. Budget Adminstration The two-year budget was set up to be front-loaded in the first year. Apparently, this is standard procedure within ARB for instrumentation projects for the obvious reason that equipment needs to be acquired before any results can be obtained. However, the problem with this is that I (the PI) was unaware of this until after the first year. My proposed budget was split equally between years 1 and 2, so the spending pattern that I followed did not coincide with the required spending rate. This necessitated a major rebudget at the end of the first year, and left me with a smaller than expected budget for the second year. State Budget Crisis The state budget crisis adversely affected the project because it created a long and undefined dead period between the first and second years of the project. The reasonable requirement that Phase I of the project be approved prior to continuation to Phase II was complicated by a delay in the approval process. Practically, this resulted in the loss of the graduate students (through graduation) who were familiar with the instrumentation. Thus Phase II continued with no adequate replacement for the graduate students. Invoicing There was much confusion within the USC Contracts & Grants office about how to invoice ARB correctly. Apparently, not all of the expenditures were correctly invoiced, and this resulted funds reverting back to the state. Communication The communication between myself and the project manager was good pertaining to the technical progress of the project. However, there were several layers of miscommunication between ARB and the USC administration. For example, somehow the Contracts & Grants department at USC was unaware that Phase I of the project required approval prior to the continuation of Phase II. Somehow, there needs to be a better communication structure between the state agency and the administration of the PI institution.

45
REFERENCES 1 Longest, P.W.; Vinchurkar, S.; Martonene, T; Transport and deposition of respiratory aerosols in models of childhood asthma; Journal of Aerosol Science; 37; 1234-1257; 2006 2 Hornberg, C; Seemayer, N.H.; Kainka, E.; Strong genotoxicity on human tracheobronchial epithelial cells (BEAS-2B) in vitro by the coarse (PM-10) and fine fraction (PM-2.5) of airborne particulates as an indicator of potential adverse health effects; Journal of Aerosol Science; 29; S317-S318; 1998 3 Donaldson, K.; Li, X.Y.; MacNee, W.; Ultrafine (nanometer) particle mediated lung injury; Journal of Aerosol Science; 29; 553-560; 1998 4 Goldstein, A.H.; Galbally, I.E.; Known and Unexplored Organic Constituents in the Earth’s Atmosphere; Environmental Science and Technology; 1515-1521; March; 2007 5 Tobias, et. al.; “Chemical Analysis of Diesel Engine Nanoparticles Using a Nano-DMA/Thermal Desorption Particle Beam Mass Spectrometer”; Environmental Science and Technology; 2001, 35, 2233-2243 6 D. Voisin, et.al.; “Thermal Desorption Chemical Ionization Mass Spectrometer for Ultrafine Particle Chemical Composition”; Aerosol Science and Technology; 2003; 37: 471-475 7 J.N. Smith, et.al.; “Atmospheric Measurements of Sub-20 nm Diameter Particle Chemical Composition by Thermal Desorption Chemical Ionization Mass Spectrometry”; Aerosol Science and Technology; 2004; 38:100-110 8 P.F. DeCarlo, et.al.; “Field-Deployable, High Resolution, Time-of-Flight Aerosol Mass Spectrometer”; Analytical Chemistry; 2006; 78: 8281-8289 9 Gard, et.al.; “Real-Time Analysis of Individual Atmospheric Aerosol Particles: Design and Performance of a Portable ATOFMS”; Analytical Chemistry; 1997; 69, 4083-4091 10 Prather, K.A., et.al.; “Real-Time Characterization of Individual Aerosol Particles Using Time-of-Flight Mass Spectrometry”; Analytical Chemistry; 1994; 66, 1403-1407 11 Whiteaker, J.R., et.al.; “Hydroxymethanesulfonate as a tracer for fog processing of individual aerosol particles”; Atmospheric Environment; 2003; 37: 1033-1043 12 Sielemann, St.; Baumbach, J.I.; Schmidt, H; Pilzecker, P.; Detection of alcohols using UV-ion mobility spectrometers; Analytica Chimica Acta; 2001; 431; 293-301