Deploying Electric Buses in the Kathmandu Valley -...
75
1 Deploying Electric Buses in the Kathmandu Valley A Pre-Feasibility Study January 2018
Transcript of Deploying Electric Buses in the Kathmandu Valley -...

1
Deploying Electric Buses in the Kathmandu Valley
A Pre-Feasibility Study
January 2018
2
Global Green Growth Institute
January 2018
Global Green Growth Institute
Jeongdong Building 19F
21-15 Jeongdong-gil
Jung-gu, Seoul 04518
Republic of Korea
Recommended citation:
GGGI (2018). Deploying Electric Buses in the Kathmandu Valley: A Pre-Feasibility Study. Seoul: Global Green Growth Institute.
The Global Green Growth Institute does not make any warranty, either express or implied, or assumes any legal liability or
responsibility for the accuracy, completeness, or any third party’s use or the results of such use of any information, apparatus,
product, or process disclosed of the information contained herein or represents that its use would not infringe privately owned
rights. The views and opinions of the authors expressed herein do not necessarily state or reflect those of the Global Green
Growth Institute.
All photos, including the cover photo, by Robic Upadhayay.

3
Deploying Electric Buses in the Kathmandu Valley
A Pre-Feasibility Study
January 2018

4

5
Foreword
This pre-feasibility study was undertaken to support Sajha
Yatayat’s desire to transition to electric buses. Already
Sajha Yatayat has an impressive track record as a
progressive and pioneering transport service provider
within the Kathmandu Valley, and more broadly within
Nepal. By starting the exciting exploration of moving
towards electric mobility, Sajha Yatayat once again
demonstrated its leadership in the sector.
We would like to thank Sajha Yatayat for commissioning
this study and partnering with the Global Green Growth
Institute in the pursuit of electric mobility in Nepal. We
would also like to thank the Government of Nepal, in
particular the Ministry of Forests and Environment and the
Ministry of Physical Infrastructure and Transport, for their
collaboration in undertaking this study.
More generally, we hope that other public and private
transport operators may find the results of this study
useful. As the findings of the study indicate, there are
numerous operational benefits which operators may expect
and leverage to off-set the higher upfront costs of electric
vehicles. Similarly, benefits are set to accrue to
government, the economy and society and these are
important considerations when exploring subsidies and
other financial assistance to transport operators in
switching to electric.
I look forward to joining other passengers and riding
Nepal’s first battery electric bus in due course!
Vikram Basyal
Country Representative Nepal
Global Green Growth Institute

6
Abbreviations
ADB Asian Development Bank
BAU business as usual
BEV battery electric vehicle
BEST Brihanmumbai Electricity Supply and Transport
BMS battery management system
BPKM billion passenger kilometers
BYD Build Your Dreams
CO2 carbon dioxide
COP21 21st Conference of Parties
dB decibels
DoC Department of Customs
DoD depth of discharge
DoE Department of Environment
DoED Department of Electricity Development
DoTM Department of Transport Management
EPI Environmental Protection Index
EV electric vehicle
EVAN Electric Vehicle Association of Nepal
EVC Electric Vehicle Charging
EVI Electric Vehicles Initiative
EVSE electric vehicle supply equipment
FAME Faster Adoption and Manufacturing of Electric Vehicles
FLA flooded lead acid
GBP Great British pound
GDP gross domestic product
GGGI Global Green Growth Institute
GHG greenhouse gas
HEV hybrid electric vehicle
ICE internal combustion engines
ICEV internal combustion engine vehicles
ICIMOD International Centre for Integrated Mountain Development
IPCC Intergovernmental Panel on Climate Change
kWh kilowatt hours
LIB lithium-ion battery

7
MoPE Ministry of Forests and Environment
MoPIT Ministry of Physical Infrastructure and Transport
MoUD Ministry of Urban Development
MW megawatts
NAAQS National Ambient Air Quality Standards
NEA Nepal Electricity Authority
NDC Nationally Determined Contribution
Ni–Cd nickel–cadmium
Ni–MH nickel–metal hydride
Ni–Zn nickel–zinc
NRB Nepal Rastra Bank
NSTS National Sustainable Transport Strategy
NYCT New York City Transit
OBD on-board diagnostics
OCV open-circuit voltage
PHEV plug-in hybrid electric vehicle
p-HEV parallel hybrid electric vehicle
PM particulate matter
PM-DC permanent magnet-based motors
PV photovoltaic
ROI return on investment
SAE Society for Automotive Engineers
SCM Smart City Mission
SLA sealed lead acid
SMG Seoul Metropolitan Government
SoC state of charge
TCO total cost of ownership
TfL Transport for London
TOD transit-oriented development
UNFCCC United Nations Framework Convention for Climate Change
UNCRD United Nations Centre for Regional Development
USD United States dollar
WB World Bank
WHO World Health Organization

8
Contents
Executive Summary 1
Overview 1
Electric Vehicle Technology and its Benefits 1
Policy and Regulation Linked to Electric Mobility in Nepal 2
Sajha Yatayat’s Operations and Emissions Reduction Potential 2
Total Cost of Ownership Analysis of Deploying Diesel versus Electric Buses 2
Analysis of Local Manufacturing of Electric Buses 3
Transformative Potential of the Electric Bus Pilot Initiative 3
Chapter 1. Introduction 5
1.1 Growth of the Transport Sector in Nepal 5
1.2 Environmental Impacts of Growing Transport Sector 7
1.3 Government of Nepal and the Global Green Growth Institute 9
1.4 Deploying Electric Buses in Kathmandu 9
Chapter 2. Electric Vehicle Technology 11
2.1 Introduction 11
2.2 What is a Battery Electric Vehicle? 11
2.3 Major Components of BEV 11
2.3 Comparison of Diesel, Hybrid Electric and Full Electric Buses 18
Chapter 3. Benefits and Challenges of Battery Electric Vehicles 21
3.1 Introduction 21
3.1 Technology 21
3.2 Environment 22
3.3 Socio-Economic 23
Chapter 4. Regulatory Landscape 25
4.1 Introduction 25
4.2 Summary of Policies and Regulation 25
Chapter 5. Route and Vehicle Analysis 29
5.1 Introduction 29
5.2 Local Conditions in Kathmandu and Advantages for Electric Buses 29
5.3 Sajha Yatayat’s Fleet and Operations 30

9
5.4 Proposed Route for Electric Bus 33
5.5 Proposed Vehicle Options 35
5.6 Engagement with Bus Manufacturers 38
Chapter 6. Greenhouse Gas Emissions Analysis 39
6.1 Introduction 39
6.2 Assumptions and Data 39
6.3 Greenhouse Gas Emissions Results 40
Chapter 7. Total Cost of Ownership Analysis 41
7.1 Introduction 41
7.2 Data and Assumptions 41
7.3 Lifetime Costs 42
7.4 Economic, Social and Environmental Costs 44
7.5 Summary of Total Lifetime Cost Analysis 45
Chapter 8. Options for Local Manufacturing 49
8.1 Introduction 49
8.2 Review of Electric Vehicle Manufacturing in Nepal 49
8.3 Estimated Demand for Electric Buses 50
8.4 Estimated Local Manufacturing Process and Requirements 51
8.5 Direct Benefits of Local Manufacturing 53
8.6 Action for Local Manufacturing 53
Chapter 9. Summary of Findings and Recommendations 55
9.1 Electric Buses are Viable 55
9.2 Summary of Key Findings 55
9.3 Recommendations and Next Steps 56
References 58
Annex 1 – Case Study Cities 62
A. Electric Bus Initiative in the State of Karnataka 62
B. Electric Bus Initiative in the State of Himachal Pradesh 63
Annex 2 – Summary of Vendors 64
Introduction 64
Ashok Leyland, India 64
BYD (Build Your Dreams) Auto, China 65
1
1
Executive Summary
Overview
Since 1990, the number of vehicles on Nepal’s roads has
risen by 14 % annually, driven by urbanization and rising
incomes.1 As a result, road transport is now the
predominant form of transport in the country, accounting
for some 80% of all trips.2 The majority of this transport is
private, with the overall share of public transport vehicles
registered falling from 11% in 1990, to just 3% in 2015.3
This has led to a corresponding increase in greenhouse gas
emissions from the transport sector. In 1995, annual
greenhouse gas emissions from the sector totaled 716
kilotons. This had risen to 3,170 kilotons by 2013. Similarly,
there has been a substantial increase in particulate matter
pollution, particularly in Nepal’s metropolitan cities.
Particulate matter (PM2.5), which includes dust from
construction and other sources, as well as carbon particles
released from the burning of fossil fuels and operation of
vehicles, has risen in Kathmandu to an average annual
30.40 µg/m3. This is three times higher than the standard
prescribed by the World Health Organization.
Approximately 9,000 premature deaths occur annually in
Nepal as a result of ambient air pollution.4
Working under the overall direction of the Ministry of
Population and Environment, and in partnership with the
Ministry of Physical Infrastructure and Transport, the
Global Green Growth Institute (GGGI) launched the joint
Electric Mobility Program to support a transition towards
clean and sustainable transportation in Nepal. Under the
program, which aims to boost the adoption of electric
vehicles in Nepal, GGGI is also partnering with Sajha
1 Department of Transport Management. 2 ADB. 2016. Transport Sector Assessment: Country Partnership Strategy. 3 Department of Transport Management.
Yatayat, Kathmandu’s largest public bus operator, to seek
opportunities to deploy electric buses in Sajha Yatayat’s
fleet. This pre-feasibility study reports on the results of an
extensive analysis undertaken by GGGI, in consultation with
Sajha Yatayat, the Department of Roads, the Department of
Transport Management, the Kathmandu Municipal
Corporation, and the Asian Development Bank. It draws on
data provided by Sajha Yatayat, as well as a range of
secondary sources.
Electric Vehicle Technology and its Benefits
Technology for electric vehicles is improving, and
production systems are maturing, reducing the per unit
cost. Four components that are needed for efficient
operation of an electric vehicle are a traction source, an
energy source (battery), a battery management system and
a charging facility. Within these four components,
numerous options exist.
The battery size and type are critical. There are two types
of batteries predominantly used in electric vehicles,
namely, nickel-based aqueous batteries and lithium-ion
batteries. Due to their high voltage, reliable discharge and
good lifecycle, lithium-ion batteries are currently the most
widely used battery system for electric buses. For a battery
to perform at its optimum level, its operating windows of
temperature, voltage, and structural changes should be
considered.
4 World Health Organization. 2016. Ambient air pollution: A global
assessment of exposure and burden of disease. Retrieved from
http://apps.who.int/iris/bitstream/10665/250141/1/9789241511353-
eng.pdf

2
Electric vehicles bring a range of benefits. These include
reduced greenhouse gas emissions, reduced air and noise
pollution, reduced fuel consumption, increased energy
security, increased road safety and employment
opportunities. For example, at low speeds, the switch from
diesel buses to electric buses can cause noise levels to fall
by more than 20%, which translates to improved health and
productivity. In addition, electric buses typically enjoy 50%
lower maintenance costs, demonstrate higher capacity to
provide greater torque at slow speeds and maintain high
performance at low temperatures. These are all favorable
given Nepal’s context. In this regard, Nepal can also stand
to benefit from adopting electric buses.
Policy and Regulation Linked to Electric
Mobility in Nepal
A number of policies, and increasing regulatory refinement,
facilitate the adoption of electric vehicles in Nepal. The
government has put in place a robust policy framework to
support sustainable and electric transport, through the
adoption of the National Transport Policy (2001) and
Environment Friendly Transport Policy (2015). This latter
policy sets specific targets for electric vehicle adoption.
More broadly, Nepal’s adoption of the Sustainable
Development Goals, and the submission of its Nationally
Determined Contribution (NDC) to the United Nations
Framework Convention for Climate Change (UNFCCC) have
further cemented its overall policy shift towards electric
mobility.
In addition, the Nepal Rastra Bank and the Ministry of
Finance are consistently improving the lending regulations
to support electric vehicle consumption and including
through significantly reduced import tax and other duties
on electric vehicles, especially for public sector or transport
usage.
Sajha Yatayat’s Operations and Emissions
Reduction Potential
Sajha Yatayat is the principal organized bus cooperative in
Nepal, and the largest full-size bus operator in Kathmandu
Valley. It has a current fleet of 46 full size buses, expected
to rise to 58 in 2018. These buses operate across six routes,
travelling more than 6000 kilometers daily and catering to
an average daily ridership of 18,498 passengers. Five of the
six routes cater to passengers inside Kathmandu Valley and
the remaining route caters to passengers traveling from
Kathmandu to Baglung and back (600 km return trip).
Of the current 46 buses, 16 are manufactured by Tata
Motors and 30 by Ashok Leyland, both major Indian
automobile manufacturers. The Lagankhel-Budanilkantha
route, a major 17-kilometer route that travels across the
main north-south trunk route in the Kathmandu
metropolitan region, has been identified as the most
attractive option for deployment of electric buses for a
number of reasons. These include road quality and
gradient, length of route, passenger demand on route,
visibility and promotional capacity of route, and capacity of
terminus stations to hold charging facilities. The three
electric bus models are proposed as viable for this route,
namely BYD’s K9 and K7 buses, and the Ashok Leyland
Circuit bus.
In terms of greenhouse gas emissions reduction potential, if
all buses within the projected 58-vehicle fleet of 2018 were
to switch to electric, a reduction of 2,537 tons of CO2e per
year would be possible. This is based on a weighted average
fuel economy of 2.8 liters per bus, over a total annual
distance of 2.5 million kilometers.
In 2017, Nepal imported around 30% of its electricity from
India. Since the electricity being imported is predominantly
generated from coal-based power plants, any end-use
technology, including electric buses, using this electricity
will effectively be contributing to global emissions.
However, Nepal has targeted to increase its hydropower
capacity to 10,000 MW by 2025. Gradually, as supply in the
country increases, import from India will decrease. In the
long-run, since more than 95% of electricity generated in
Nepal is expected to come from hydropower, it can be
safely assumed that electric vehicles will have no
greenhouse gas emissions. This analysis does not consider
upstream or downstream emissions – such as for the
production of the buses themselves.
Total Cost of Ownership Analysis of
Deploying Diesel versus Electric Buses
To be operationally feasible, the deployment of electric
buses needs to make financial sense. With this in mind, a
total cost of ownership analysis was undertaken comparing
the identified electric bus options with the current diesel
bus operating on the Lagankhel-Budanilkantha route.
Of the three bus alternatives, the analysis found that the
diesel bus was the most expensive over the lifetime of the
vehicle, due to higher operational and maintenance cost,
and significant social (health- and productivity-related costs
due to air and noise pollution), environmental and

3
economic costs. Among the electric buses, the Ashok
Leyland Circuit bus was the costliest option – indeed
costlier than the current diesel model. Both the BYD buses
are cheaper than diesel. The BYD K9 bus is 24% cheaper
than diesel and the BYD K7 is 39% cheaper. See Table 1
below for a breakdown of these costs projected over the
life of the bus (10 years).
Analysis of Local Manufacturing of Electric
Buses
Nonetheless, acquisition costs of electric buses are
significantly higher, and this presents an initial hurdle, even
if total lifetime costs of electric buses are less than those of
diesel. One way to address this higher acquisition cost is
through local assembly and manufacturing. In this regard,
Nepal has two experiences with electric vehicle
manufacturing to build off.
Following consultations with private sector, the investment
required to setup a local manufacturing unit to assemble a
5-meter-long 20-seater midi-bus, was estimated at around
NPR 71.5 million (USD 695,525). This includes cost of land,
cost of construction of manufacturing infrastructure and
the cost of tools. The total cost of assembly of a single unit
of vehicle will range from NPR 900,000 to 1.5 million (USD
8754-14,591) depending on the battery type being used.
After all the different components of the vehicle have been
imported, the 20-seater bus can be assembled by around
22 staff members within a week. This presents an
opportunity to supply the market with significantly cheaper
buses than can be otherwise obtained through importing.
Nonetheless, this initial analysis would require further in-
depth study and greater, more detailed consultation with
private sector operations to verify all associated costs.
Transformative Potential of the Electric Bus
Pilot Initiative
This electric bus pilot initiative has the potential to provide
long-term strategic benefit to Nepal. Although socio-
economic, operational and environmental benefits have
been quantified in this study, the long-term transformative
potential of the initiative has not been strategically valued.
This initiative will provide an opportunity for public and
private operators to assess viability of electric buses in
routes around Kathmandu and in Nepal more generally. It
will also provide policy makers and institutional bodies with
the knowledge to sharpen policy instruments that can aid in
further strengthening fiscal measures and incentives to
upscale adoption of EVs in Nepal. As the world is turning a
new leaf by shifting towards electric mobility, an electric
vehicle revolution in Nepal is imminent and this electric bus
pilot initiative will provide the right platform to jumpstart
this revolution. The value of this is immeasurable.
Table 1. Summary of total cost of ownership of electric versus diesel bus (NPR)
Cost component (NPR) Bus models
Diesel (Viking) Electric (K7)** Electric (K9)** Electric (Circuit)**
Acquisition cost*** 3,198,345 23,104,100 30,618,500 42,738,500
Lifetime fuel cost 13,087,901 2,861,036 2,861,036 2,861,036
Lifetime maint. cost 6,576,587 3,288,293 3,288,293 3,288,293
Economic cost 10,393,303 - - -
Social cost 11,723,683 - - -
Environmental cost 3,338,927 - - -
Total (NPR) 48,318,746 29,253,429 36,767,829 48,887,829
Total (USD)* 470,027 284,566 357,664 475,563
% cheaper than diesel - 39% 24% -1%
Source: GGGI
*1 USD = 102.8 NPR
** ‘-’ here denotes a negligible value
*** Acquisition cost is exclusive of VAT as the operator is eligible for a VAT refund after purchase of the electric bus

4

5
Chapter 1.
INTRODUCTION
1.1 Growth of the Transport Sector in Nepal
Since 1990, the number of vehicles operating in Nepal has
risen significantly. National vehicle registration numbers – a
good indicator of national demand – demonstrate an
annual average growth rate of 14% during 1990-2015, as
shown in Figure 1 below.5 Growth over more recent years,
has been particularly high, driven by urbanization and rising
incomes. As a result, road transport is now the
predominant form of transport in the country, accounting
for some 80% of all trips.
Much of this growth has occurred in the Kathmandu Valley,
home to Nepal’s largest metropolitan region.
Approximately 24,000 vehicles were registered in
Kathmandu Valley in 2000. This number had risen to over
67,000 vehicles by 2016 – a threefold increase.6 Vehicles
registered in the Kathmandu Valley now comprise some
66% of total registered vehicles in Nepal. Of the total
registered vehicles in the Valley, more than 90% are for
personal use.7.
Source: Department of Transport Management, 2015
Figure 1.1. Total cumulative registered vehicles in Nepal (thousand)
5 Ministry of Urban Development. 2015. National Urban Development
Strategy 2015, Nepal. Urban Development and Physical Planning Division.
Ministry of Urban Development (MoUD). Government of Nepal (GoN).
6 Bajracharya and Bhattarai. 2016. ‘Road Transportation Energy Demand
and Environmental Emission: A Case of Kathmandu Valley’ in Hydro Nepal,
no. 18, January 2016 p. 30-40. 7Ibid.
0
500
1000
1500
2000
2500
19
90
19
91
19
92
19
93
19
94
19
95
19
96
19
97
19
98
19
99
20
00
20
01
20
02
20
03
20
04
20
05
20
06
20
07
20
08
20
09
20
10
20
11
20
12
20
13
20
14
20
15

6
Average annual growth rates of 11% for personal cars, and
of 12% for two-wheelers (motorcycles) was recorded during
1991-2014.8 Indeed, nationally, two-wheelers dominate
passenger transport These increases are exerting
tremendous pressure on the Government of Nepal to
introduce policies to manage emissions from the transport
sector, as well as administer proper traffic practices. It’s
worth noting that these growth rates are based on
cumulative datasets maintained by the national
Department of Transport Management. However, each
year, a large number of vehicles are scrapped due to age,
and this rate of scrapping is unknown As such, while
estimates exist, the total fleet of vehicles in the country is
uncertain.
While much of the growth in vehicle registration numbers is
the result of acquisition for personal usage, the number of
public transport vehicles has also risen. In 1990, there were
around 4000 buses in Nepal, rising to more than 35,000 by
2015.9 Although the number of public transport vehicles,
especially bus, minibus, microbus and tempos, in the
transport sector of the country has increased in absolute
terms, its share has decreased from 11% in 1990 to 3% in
2015, as shown in Figure 1.2.
Source: Department of Transport Management, 201510
Figure 1.2. Modal distribution of passenger transport during 1990-2014.
Table 1.1. Origin of imported vehicles in Nepal (% of total)
Country Percent
India 89.0
Japan 4.5
Nepal 2.4
South Korea 1.3
China 1.2
Germany 0.6
Indonesia 0.5
Other 0.6
Total 100
Source: Central Bureau of Statistics 201411
8 United Nations Centre for Regional Development. 2015. National
Sustainable Transport Strategy (NSTS) for Nepal (2015-2040). Ninth
Regional Environmentally Sustainable Transport (EST) Forum in Asia, 2015.
Ministry of Physical Infrastructure and Transport (MoPIT), Nepal. Ministry
of Environment (MoE), Japan. United Nations Economic and Social
Commission for Asia and the Pacific (UNESCAP).
9 UNCRD. Ibid. 10 Department of Transport Management. Ibid. 11 Central Bureau of Statistics. 2014. Nepal Public Land Transport Survey
2013. National Planning Commission Secretariat.
0%
10%
20%
30%
40%
50%
60%
70%
80%
90%
100%
1990 1994 1998 2002 2006 2010 2014
Two-Wheelers Four-Wheelers Others Bus Minibus MiniTruc k Microbu s Three-Wheelers

7
Within this total pool of vehicles, a small but growing share
are electric. There are some 714 electric three-wheelers
(safa tempos) on the streets of Kathmandu, offering public
transport services (see Chapter 8 for more information). In
addition, a growing range of electric car manufacturers,
including Kia, Mahindra and BYD are importing electric cars
for private consumption. Total estimates for the number of
electric cars in Nepal vary, but tend to range between 300 -
500 units at July 2017. Currently, around 300 Mahindra
Reva and 4 BYD E6 have been sold in the market. In
addition, efforts to introduce electric rickshaws and electric
two-wheelers have also met with some success, though
final vehicle numbers remain low.
Essentially, all conventional fossil fuel and electric vehicles
in Nepal are imported, with only 3% being produced locally.
Of the 97% imported, the majority come from India (89%),
followed by Japan (4.5%) (see Table 1.1.).
Total taxes levied on imported fossil fuel vehicles are
extremely high, amounting to 238%. Taxes, however, on
electric vehicles are significantly reduced (see Chapter 4 for
more information).
1.2 Environmental Impacts of Growing
Transport Sector
The rising numbers of vehicles in Nepal, exacerbated by
insufficient planning and management, is leading to a range
of environmental challenges, including air and noise
pollution, as well as challenges such as heightened
congestion on metropolitan roads. A report by the
Government of Nepal and United Nations Center for
Regional Development on National Sustainable Transport
Strategy (NSTS) for Nepal, released in 2015, emphasizes
that this rapid growth in motorization threatens energy
security, can undermine social equity, increases
greenhouse gas emissions and other air pollutants, and
negatively impact ecosystem.12
In particular, emissions from the transport sector are on the
rise. Consumption of petroleum products in the transport
sector has increased by an average annual growth rate of
9%. However, growth in CO2 emissions from the sector has
been higher – at an annual average rate of 11% during
1994-2013 (see Figure 1.3).
In addition to greenhouse gas emissions, other air
pollutants are also rising, particularly in Nepali cities. In
Kathmandu Valley, annual average exposure to fine
particulate matter (PM2.5) as per the Environmental
Performance Index (EPI) was 30.40 µg/m3 in 2014, three
times higher than the WHO standard of 10 µg/m3 (EPI
2016)13, though less than the maximum concentration of 50
µg/m3 set in the National Ambient Air Quality Standard of
Nepal.14
In 2016, only the rapidly developing economies of China,
India and Bangladesh performed worse than Nepal in this
indicator (ibid.). In 2016, the annual average concentration
of PM 2.5 in Kathmandu Valley was nearly five times higher
than the WHO standard15, and more than four times higher
than the average across the rest of the country16. The
concentration has almost doubled within the past three
decades.
In addition to PM2.5, PM10 is a growing problem. 63% of
the total PM10 in Kathmandu Valley has been estimated to
come from vehicles and road dust17. During morning rush
hours, it has been observed that PM10 emissions in certain
locations in Kathmandu, for example in Putalisadak,
Sohrakhutte and Maharajgunj is three to seven times
higher than the NAAQS standard.
12 UNCRD, 2015 13 EPI. 2016. Environmental Performance Index 2016. Yale University.
http://epi.yale.edu/sites/default/files/2016EPI_Full_Report_opt.pdf 14 For an overview of the NAAQS, see
http://doenv.gov.np/files/download/Report%20on%20AQM%20Action%2
0Plan%202017.pdf 15 WHO. 2016. Ambient air pollution: A global assessment of exposure and
burden of disease. World Health Organization.
http://apps.who.int/iris/bitstream/10665/250141/1/9789241511353-
eng.pdf?ua=1 16 World Bank. 2016b. The Cost of Air Pollution. Strengthening the
Economic Case for Action.
http://documents.worldbank.org/curated/en/781521473177013155/pdf/
108141-REVISED-Cost-of-PollutionWebCORRECTEDfile.pdf 17http://www.cen.org.np/uploaded/AQ%20Status%20and%20Managment
%20in%20KV_Maya%20Factsheet% 205.pdf

8
Source: World Bank, 201718; Nepal Oil Corporation, 201619
Figure 1.3. Petroleum consumption and CO2 emissions from the transport sector
Table 1.2. Standards versus levels of PM concentrations in Nepal
PM Pollution Standards Nepal NAAQS WHO Spring Monsoon
2012 2005 Kathmandu 2014
PM10 Annual average - 20 µg/m3
Daily average 120 µg/m3 50 µg/m3
PM2.5
Annual average - 10 µg/m3
Daily average 40 µg/m3 25 µg/m3 124.8 ± 55.9 µg/m3 45.1 ± 16.4
µg/m3
Source: Ministry of Science, Technology and Environment 201220; Greenstone et al. 201521; Shakya et al., 201722
18 World Bank. 2017. CO2 emissions (kt). Carbon Dioxide Information Analysis Center, Environmental Sciences Division, Oak Ridge National Laboratory,
Tennessee, United States. https://data.worldbank.org/indicator/EN.ATM.CO2E.KT?locations=NP 19 Nepal Oil Corporation. 2016. Sales of Petroleum Products. http://www.nepaloil.com.np/import-and-sales-22.html 20 Ministry of Science Technology and Environment. 2012. National Ambient Air Quality Standard. 21 Greenstone, Michael, Janhavi Nilekani, Rohini Pande, Nicholas Ryan, Anant Sudarshan, and Anish Sugathan. 2015. “Lower Pollution, Longer Lives, Life
Expectancy Gains If India Reduced Particulate Matter Pollution.” Economic & Political Weekly. 22 Shakya, K.M., Rupakheti, M., Shahi, A., Maskey, R., Pradhan, B., Pandey, A., Puppala, S., Lawrence, M., Peltier, R. 2017. Near-road sampling of PM2.5, BC, and
fine-particle chemical components in Kathmandu Valley, Nepal. Atmospheric Chemistry and Physics; 17: 6503-6516.
0
500
1000
1500
2000
2500
3000
3500
0
100
200
300
400
500
600
700
800
900
1000
1995 1997 1999 2001 2003 2005 2007 2009 2011 2013
Emis
sio
n (
kt)
Pet
role
um
(kL
)
Petroleum consumption CO2 emissions

9
In 2013, more than 22,000 deaths in Nepal were attributed
to air pollution (ibid.). In that same year, air pollution-
induced loss of welfare was recorded at 2.8 billion USD,
equivalent to nearly 5% of the country’s GDP (ibid.). This is
equivalent to approximately 40% of the losses and damages
caused by the 2015 earthquake, estimated at 7 billion
USD23. It is, however, important to note that the economic
losses due to air pollution occur annually. The projected
increase of PM 2.5 will have substantial effect on the
economy, i.e. healthcare cost will increase, lost working
days will affect labor productivity, and crop yields will
decline24.
1.3 Government of Nepal and the Global
Green Growth Institute
In order to proactively manage and address these issues,
the Government of Nepal has initiated a range of policy and
regulatory action. These are outlined in Chapter 5. In
particular, the Government of Nepal has prepared and
submitted its Nationally Determined Contributions (NDCs)
to the United Nations Framework Convention on Climate
Change (UNFCCC), which includes important targets for
electric mobility and air quality improvement and general
reduction in GHG such as increasing the share of electric
vehicles in the total vehicle fleet to 20% by 2020 from 2010
levels, reducing fossil fuel consumption in the transport
sector by 50% in 2050 by promoting efficient transport
services and reducing air pollution levels by 2025.
In addition to policy action, the Government of Nepal,
through its Ministry of Population and Environment, has
directed the Global Green Growth Institute to provide
technical assistance in support of the implementation of a
range of ambitious targets for sustainable, clean
transportation… This partnership with the GGGI has led to
the design and implementation of the joint GGGI-
Government of Nepal Electric Mobility Program. There are
three components of the EMP, namely:
• Nationally Determined Contribution Action Plan
for Electric Mobility - In this component, GGGI
aims to develop actions to accelerate
implementation of targets specific to electric
vehicles, outlined in Nepal’s Nationally
Determined Contribution. These actions will
pertain specially to improving governance,
mitigating greenhouse gas emissions, improving
monitoring, reporting as well as verification and
23 NPC. 2015b. Nepal earthquake 2015. Post Disaster Needs Assessment,
Vol. A: Key Findings. National Planning Commission.
http://www.un.org.np/sites/default/files/PDNA-volume-B.pdf
increasing visibility to financing tools to increase
the share of electric vehicles in the transport
sector.
• Pipeline of Bankable Projects – This component is
designed to introduce bankable project ideas
concerning electric vehicles in the transport
sector. The project design will be optimized
according to availability of investment
opportunities.
• Electric Bus Pilot Initiative – Through this
component, GGGI and Sajha Yatayat, are aiming to
introduce pilot electric buses in Sajha Yatayat’s
Lagankhel-Budanilkantha route. This initiative can
be a potential model to public bus operators,
including Sajha Yatayat, in proving viability of
electric buses in Nepal.
These components are being implemented during 2017-
2018.
1.4 Deploying Electric Buses in Kathmandu
In order to implement the Electric Bus Pilot Initiative,
outlined above, GGGI has partnered with Sajha Yatayat,
Nepal’s largest publicly owned public bus operator. Under
the partnership, Sajha Yatayat and GGGI, in close
coordination with the Ministry of Physical Infrastructure
and Transport, has sought to fully understand the feasibility
of deploying electric buses as part of the existing Sajha
Yatayat fleet.
Within this context, this pre-feasibility study was
undertaken in order to:
• Understand how the current policies and
strategies create an enabling environment for
deployment of electric vehicles, specifically electric
buses.
• Understand the long-term non-operational (social,
economic and environment) costs of a diesel bus
• Identify the most viable route of Sajha Yatayat for
deployment of electric buses;
• Understand greenhouse gas mitigation potential of
electric buses in Sajha Yatayat’s fleet.
• Analyze the financial viability of electric buses in
Sajha Yatayat’s Lagankhel-Budanilkantha route
• Compare operations and maintenance costs of
diesel and electric buses.
• Explore the resource requirements and benefits of
local manufacturing of electric buses.
24 OECD. 2016. The economic consequences of outdoor air pollution. Policy
Highlights. Organisation for Economic Co-operation and Development.
https://www.oecd.org/environment/indicators-modelling-outlooks/Policy-
Highlights-Economic-consequences-of-outdoor-air-pollution-web.pdf

10
Primary data source for the analysis was Sajha Yatayat.
Secondary level data was obtained from stakeholder
consultations with the Ministry of Physical Infrastructure
and Transport (MoPIT), Department of Environment (DoE),
Nepal Electricity Authority (NEA), Department of Transport
Management (DoTM), International Centre for Integrated
Mountain Development (ICIMOD), Department of Customs
(DoC), Electric Vehicle Association of Nepal (EVAN) as well
as a literature review of published sources.
This study builds on GGGI’s technical expertise deployed for
the pre-feasibility study on Deployment of Electric Buses in
Himachal Pradesh, along with the Green Growth Strategy
for Karnataka, both undertaken by the GGGI team in India
(see Annex 3 for detailed information of the Himachal
Pradesh and Karnataka case studies). This work in Nepal is
indebted to the work of colleagues in India and elsewhere
within GGGI, and the technical precedent set by the work in
Himachal Pradesh above all.
This report, which presents the findings and results of the
prefeasibility study, is structured as follows:
• Chapter 2: Electric Bus Technology – This chapter
provides a brief overview of the different
components of an electric bus, including batteries,
charging stations, etc.
• Chapter 3: Benefits of Electric Vehicles – Benefits
of electric vehicles have been elaborated in this
chapter.
• Chapter 4: Regulatory Landscape – Existing
policies, strategies and fiscal instruments in
escalating deployment of electric vehicles have
been identified in this chapter.
• Chapter 5: Route and Vehicle Analysis - This
chapter explores the most viable route option of
Sajha Yatayat, in which electric buses can
potentially be deployed. In addition, route specific
electrical bus specification has also been outlined
in this chapter.
• Chapter 6: Greenhouse Gas Emissions Analysis –
Greenhouse gas emissions of the projected fleet of
Sajha Yatayat in 2018 is analyzed in this chapter.
• Chapter 7: Financial Analysis – This chapter
compares the operational and non-operational
costs of electric buses with that of diesel buses in
order to justify financial viability of an electric bus
on Sajha Yatayat’s Lagankhel-Budanilkantha route.
• Chapter 8: Options for Local Manufacturing –
Local electric bus manufacturing specifications and
benefits have been introduced in this chapter. In
addition, this chapter discusses the various
strategies that need to be adopted in order to
optimize electric vehicle assembly in Nepal.
• Chapter 9: Summary of Vendors – This chapter
provides a brief summary of the two potential
electric bus suppliers, Ashok Leyland and BYD.
• Chapter 10: Conclusion – This chapter presents
summary of the key findings as well as
recommendations.

11
Chapter 2
ELECTRIC VEHICLE TECHNOLOGY
2.1 Introduction
Conventional road transport vehicles are powered by
burning fossil fuels, namely gasoline or diesel, in internal
combustion engines (ICE) whereas pure electric vehicles
(EVs) are powered by electricity and propelled by traction
motors. The first patent for an electric motor was granted
to Thomas Davenport in 1837. Since then electric motors
have evolved significantly and are in use for propulsion in
locomotives, surface and underwater vessels, inter-
planetary vehicles, UAVs and road transport electric
vehicles. EVs can get electric energy from on-board sources
(e.g. battery, fuel cell, ultra-capacitor etc.), from electricity
generator connected to ICE, and from off-vehicle energy
sources such as overhead lines or underground wireless
energy transfer systems. Vehicles with two energy sources,
primarily ICE and battery, are called hybrid electric vehicles
(HEV).
2.2 What is a Battery Electric Vehicle?
Battery electric vehicles (BEV), also known as fully electric
vehicles, have an electric propulsion system, which consists
of a battery and an electric motor connected to the
driveshaft. Electricity from a source such as a chemical
battery, ultra-capacitor or fuel cell, is used to energize the
electric motor in an electric vehicle.
The traction motor is connected to a gear-train that
transfers motor power to drive wheels. The motor is
controlled electronically through a battery management
system to generate the required torque and power for
vehicle motion, maintain stable electric current, and
optimize battery operation for battery life and safety.
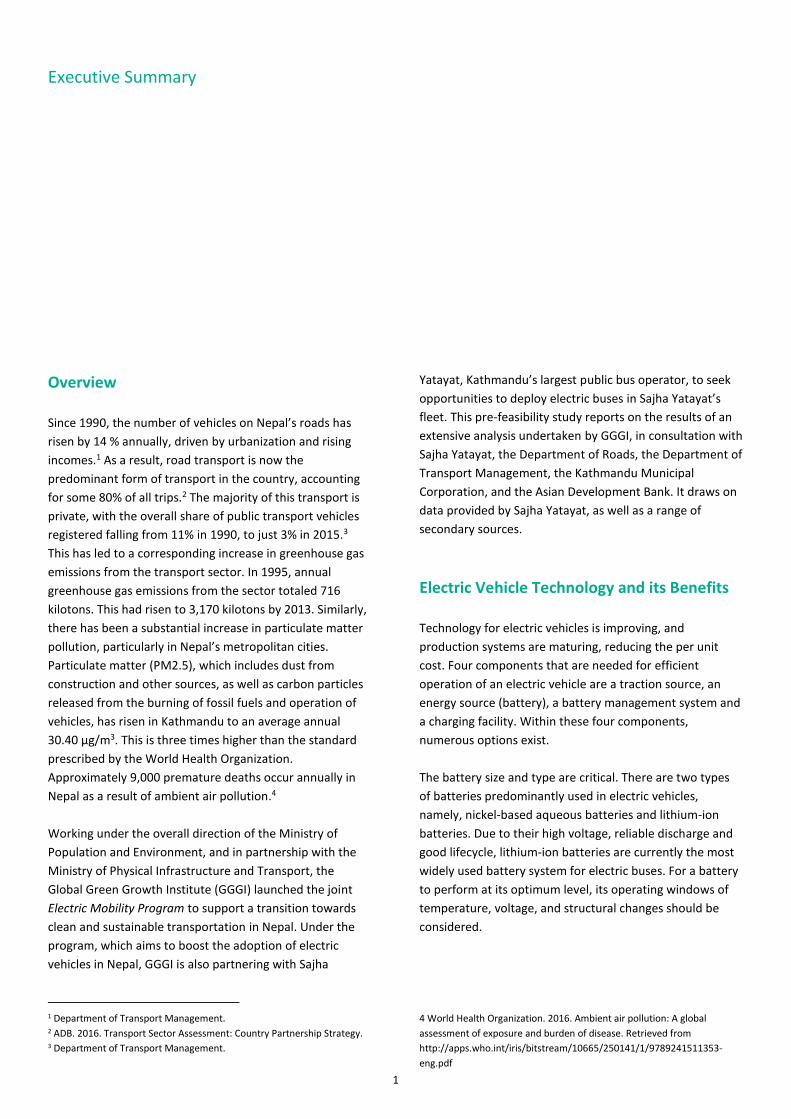
There are two popular configurations for connecting motor
power to wheels, namely a) connecting the motor to a
differential and transferring power to both wheels from a
single motor, as shown in Figure 2.1 having in-wheel
motors to drive the vehicle, as shown in Figure 2.2.
There are competing technologies in electric vehicles for
traction, energy storage and overall technology
implementation. Currently, most commercially available
electric vehicles use onboard chemical batteries as the
source of electricity for operation.
2.3 Major Components of BEV
Battery electric vehicles use chemical battery as a source
for electricity. Major components of a BEV that differ from
a conventional internal combustion engine (ICE) are:
• Traction source – electric motor
• Energy source - battery
• Battery charging station
• Battery management system for safe and optimal
use of batteries
Each of these three components will be explored in turn
below.
2.3.1 Traction Source The ideal vehicle propulsion source provides constant
power to the driveline throughout its operating range.
Vehicles starting from rest require a high starting torque to
overcome the inertia of rest. The vehicle overcomes
resistance due to gradient, rolling and wind to achieve a
steady drive speed.
12
Source: GGGI, 201525
Figure 2.1. Electric vehicle with basic elements in front/rear configuration
Source: GGGI, 201526
Figure 2.2 Electric vehicle with basic elements for an in-wheel mounted motor configuration
25 Global Green Growth Institute. 2015. Deployment of Electric Buses in Himachal Pradesh 26 Ibid.

13
In Figure 2.3, variation of power output, torque output, and
specific fuel consumption with respect to engine speed is
plotted for an ICE. As can be inferred from this figure, the
power output from an ICE increases with increasing engine
speed, reaches a maximum and then drops very quickly.
The torque from an ICE increases with engine speed,
reaches a maximum value and then decreases with
increasing engine speed.
In Figure 2.4, variation of power output and torque output
with respect to engine speed is plotted for an electric
motor. As can be inferred from this figure, the power
output from an electric motor increases with increasing
motor speed, reaches a maximum and remains constant
after that. The speed at which it attains peak power is
called the ‘base speed’ of the motor. An electric motor
starts with the maximum torque which stays at that level
for most of its operating range.
Power Band: The power band of an engine or electric motor
refers to the range of operating speeds under which the
engine or motor is able to operate efficiently. It is defined
by the engine speed range from peak torque to peak
power. ICEs have a large range of operating speeds but the
power band is a much smaller range of engine speed.
Conversely, electric motors produce constant torque for
most of their operating speed.
An ICE has a lower operating efficiency in low gear than in
high gear. Thus, on hilly terrain, ICE buses driving in low
gear give poor fuel economy.
The torque speed characteristics of an ICE do not match the desired ideal characteristics of a propulsion system. As a result, a gear box is added. As plotted in Figure 3.3, a mechanical transmission with different gear ratios is employed to achieve desired tractive effort over the full range of vehicle speeds. For an electric motor, a single gear transmission allows for desired tractive effort over the full range of vehicle speeds. A vehicle overcomes different types of external resistance
to achieve motion. Such resistances include gradient,
rolling, wind, and grade resistance, which is a function of
the weight of the vehicle and the gradient of the road. For a
given vehicle, grade resistance increases with an increase in
gradient. The maximum gradient a vehicle can traverse at a
speed is referred to as the vehicle’s gradeability. Also, the
maximum gradient a vehicle can traverse starting from a
stop condition is referred to as the vehicles stop-start
gradeability. Rolling resistance is an experimentally
determined value and is a property of the vehicle wheels
and road condition. Wind resistance is dependent on
vehicle velocity and vehicle body profile.
For a hilly area, vehicle wheels and road conditions remain similar and wind resistance is low at slow speeds. Grade resistance becomes the dominant resistance to motion of the vehicle. ICE and EV handle gradient differently – an elec-tric motor can achieve the required tractive effort with a single gear reduction. Conversely, an ICE operates in low gear and at high engine speed to achieve the same level of tractive effort. An ICE operating at a lower gear ratio gives poor fuel efficiency whereas an EV can overcome similar gradients without much loss of efficiency. Given the above review, a suitably sized electric motor in an electric vehicle can:
• Provide high torque at low speeds
• Effectively handle gradients and provide better fuel
economy that ICE
• Match the performance of ICE vehicles on tractive
effort parameters
2.3.2 Battery Technology The source of energy in a battery EV is onboard battery
packs which store energy as electrochemical potential.
These battery packs are charged through dedicated electric
charging stations. Different battery technologies have
evolved over time as shown in Figure 3.4. Currently, lithium
ion batteries are most suitable for EV applications due to
the capacity of these batteries to provide high specific
energy and high specific power.
Classes of rechargeable battery that have been used for EV
applications are as follows:
• Nickel-based aqueous batteries – viable but
unsuitable
• Lithium ion batteries – most viable option
• Lead acid batteries – unsuitable for electric bus
Nickel-based aqueous battery - These batteries are mainly
nickel cadmium (Ni-Cd), nickel zinc (Ni-Zn) and nickel metal
hydride (Ni-MH). The cathode in all these variants is nickel
hydroxide, with potassium hydroxide as the electrolyte. The
anode is different in each of the above systems, being
either cadmium, zinc or a complex metal alloy (a mix of rare
earths, nickel, zirconium and aluminum etc.) respectively.
Although Ni-Cd were an upgrade from lead acid batteries,
the Ni-Cd is being phased out world over due to the toxicity
of cadmium. Of these variants, the Ni-MH battery performs
better than the Ni-Cd battery in terms of higher specific
energy, longer life, higher discharge rate, and greater
environment friendliness. However, the Ni-MH battery
shows poor performance when operating below freezing,
has a low shelf life and has a high self-discharge rate when
not in service. On the other hand, the Ni-Zn battery displays
good performance in terms of cell voltage, charge storage
capacity and high rate discharge capability but suffers from
growth of dendrites on the zinc anode during cycling
causing internal short circuits and material (storage
capacity) loss over time.

14
Source: Mehrdad et al.27
Figure 2.3 Typical characteristics of a conventional vehicle
Source: Mehrdad et al.
Figure 2.4 Typical characteristics of an electric motor
27 Mehrdad Ehsani et al., Modern electric, hybrid and fuel cell vehicles, fundamentals, theory and design.

15
Source: Mehrdad et al.28
Figure 2.5 Tractive effort from manual 4-gear transmission conventional vehicle and 1-gear transmission electric motor
Source:
European Rare Earth Recycling Network, 201429
Figure 2.6. Specific energy and specific power for different battery types
28 Mehrdad Ehsani et al., Modern electric, hybrid and fuel cell vehicles, fundamentals, theory and design. 29 European Rare Earth (Magnet) Recycling Network. 2014. Rare earths in energy storage and conversion (2014). http://erean.eu/wordpress/2014/10/
16
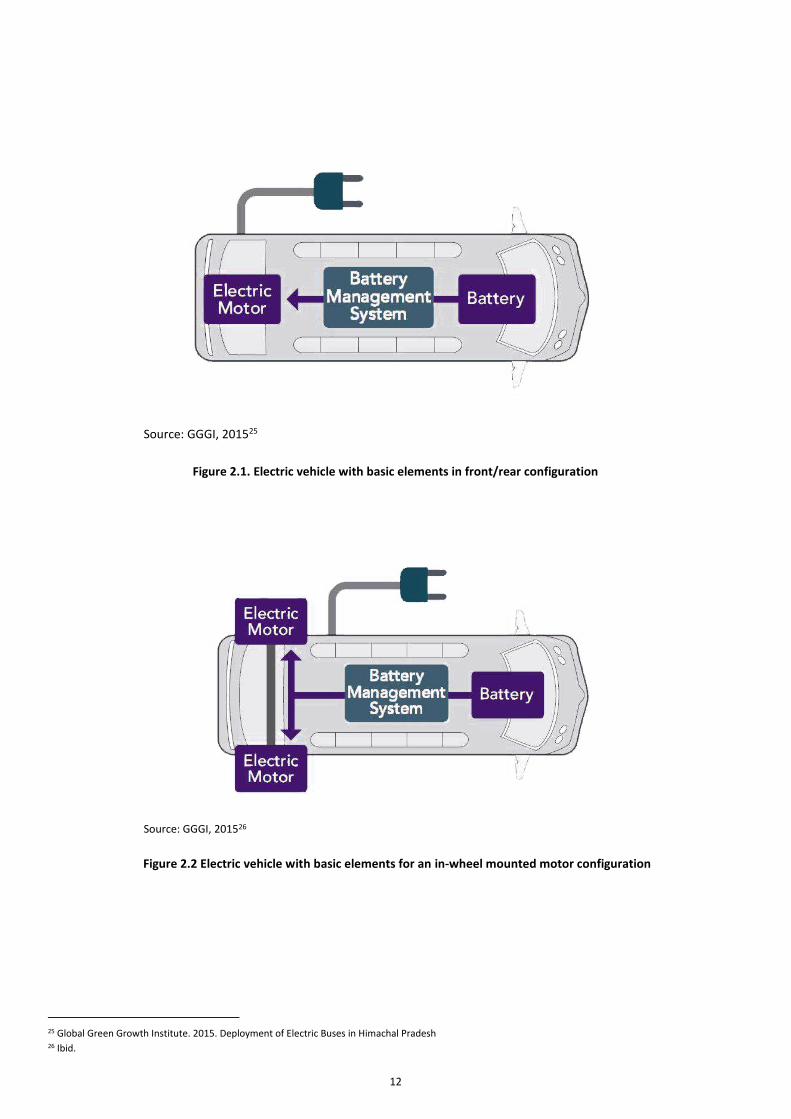
Source: Saft, 201430
Figure 2.7. Life of lithium ion battery measured against depth of discharge.
Lithium ion battery
The lithium ion battery displays high cell voltage, reliable
high discharge rate, and good cycle-life. It has a cathode,
which is a compound of lithium and transition metal oxides
(or phosphates), an anode, which is mostly carbon-based,
and electrolyte made up of organic solvents with lithium
salts. Cell voltage is dependent upon the cathode
chemistry, which can be increased using cathode materials
with higher voltage.
There are newer high voltage candidate cathode materials
but due to electrolyte stability issues beyond 4.8 V, the
favorable chemistry of these cathodes remains under-
exploited. Discovery of high-voltage-compatible electrolyte
materials is crucial. However, new safer cathode
chemistries have to be optimized as high inherent oxygen
partial pressure in the popular oxide-based cathodes can
result in explosions. This issue was highlighted in recent
battery related fire incidents in Chevy Volt electric car and
Dreamliner aircraft. At present, phosphate-based cathode
chemistries (e.g. lithium iron phosphate cathode) are
preferred over oxide-based alternatives due to higher
safety features despite having lower operating voltage.
The high cost of cathodes is due to the presence of lithium.
In many battery technologies, the anode is the less
expensive component. The electrolyte is a mixture of
organic solvents like ethylene carbonate or dimethyl
carbonate, and contain dissolved salts of lithium (e.g.,
30 Saft. (2014). Litium Battery Life; Solar photovoltaic (PV) - Energy Storage Syatems (Ess). Saft. http://www.saftbatteries.com/system/files_force/li_ion_battery_life__ TechnicalSheet_en_0514_Protected.pdf
LiPF6). The major challenges of the lithium ion battery are
lower safety and high cost.
Depth of discharge is a measure of the utilization of a
battery against the maximum charge it can hold. As seen in
Figure 2.7, an increase in the depth of discharge
exponentially reduces the number of charge cycles a
battery can serve. Even at 90 % depth of discharge a lithium
ion battery can last for more than 3000 charge cycles,
which is equivalent to nine years of active life (assuming
vehicle operating for 333 days in a year on daily charge).
Lead acid batteries
There are two types of Lead acid batteries: sealed lead-acid
(SLA) and flooded lead-acid (FLA) batteries. The FLA
batteries have been the most commonly used EV batteries
as it has a long life (up to four years) and provides the least
cost amp-hour among all the available batteries. Unlike the
FLA, in the SLA, the electrolyte is held either in mats of glass
fibers or in gel form. However, these are more resistant to
damage from physical shocks than the FLAs. SLAs are
maintenance free but once its electrolytes leak out, there is
no way to fix it.
The FLAs survive in high temperature, whereas with the SLA
batteries, high temperatures cause a loss in electrolyte that
decreases efficiency of the batteries. However, one major
drawback of the FLA batteries is that it produces hydrogen
gas, which can be flammable in high concentrations. Thus,
it should be kept in a protective box with a duct that can

17
release the hydrogen gas to the atmosphere (Home Power
Inc., 2017).
Lead acid batteries are not suitable for electric bus
operation due to following technology limitations:
• Low energy density
• Low charge cycles
• Environmental damage due to lead content
However, for smaller electric vehicles with low loads over
small distances, lead acid batteries can be viable. In
Kathmandu, sealed lead acid batteries are being used for
three-wheeled EV, such as safa tempos and small electric
rikshaws. Lead acid batteries also tend to be low cost.
2.3.3 Battery Charging Facilities
Infrastructure for battery charging is essential for a sustainable EV fleet. In order to charge, the batteries of plug-in EVs require a physical connection with electric vehicle supply equipment at the charging station. There are two principal methods of charging batteries:
• Conductive charging - Conductive charging
requires a physical connection between the EV and
EVSE at the charging station. This technology has
been historically the most popular option for
accessing grid electricity for various charging
applications. The automotive standard voltage
plugs and sockets interface between the
distribution lines and the on-board sockets. All
battery systems currently use the conductive
charging technology.
• Inductive or contactless charging - Major
approaches to transfer energy to on-board
batteries has been through direct electrical
contact but innovators have experimented with
wireless charging to remove the hassle of
connecting high potential electric points. This is a
relatively new technology that has emerged in
recent years. Inductive charging uses an
electromagnetic field to enable the exchange of
energy between the EV and the charging station.
In this method, no physical contact is needed
between the energy source and the vehicle.
Inductive charging works by using an induction coil
placed within a charging station to create an
electromagnetic field. A second induction coil,
placed on the EV, takes power from the
electromagnetic field and converts it into an
electrical current that is used to charge the on-
board battery. The advantages of such wireless
charging systems include safety (no exposed
conducting surfaces, hence no electric shock), no
cable needs, high reliability, low maintenance
(automatic, minimum intervention required),
reduced risk of theft and long product life due to
less wear and tear.
The time taken to charge a battery is an important issue for
the larger adoption of EVs and is a crucial factor in making
decisions regarding charging methods as well as EV route
selection. Charging time depends on the charging
methodology and also on the battery type, storage capacity
and size. Opting for a reduced charging time increases costs
due to several associated factors like usage of more
expensive battery variants that are made up of materials
having higher charge storing capacity, and more efficient
and sophisticated charging techniques. As a result, the
method of charging should be decided by considering the
application needs after doing a thorough techno-economic
analysis. The advantages and disadvantages of different
charging types are presented in Table 2.1 below.
2.3.4 Battery Management System
A battery functions optimally within certain operating
windows of temperature, voltage, structural changes
(during charge-discharge) and other parameters. In order to
ensure optimal functionality, EV use a battery management
systems (BMS).
A BMS contains sensors and controllers. Sensors measure
operating parameters like temperature, current and voltage
in the circuit to help manage the cells within the optimum
windows – for lithium ion batteries, for example, optimal
charging temperature is between 0 C to 45 C and optimal
discharging temperature is between -20 C to 55 C). This in
turn assists in managing the depth of discharge, prevents
cell voltage from falling below the tolerance limit, and
prevents over charging of cells which can lead to a fire or
explosion. A BMS monitors the temperature at various
locations within the cells and also outside each cell and
module to prevent any decomposition of the electrode and
electrolyte. In addition, a BMS includes an embedded
software network which estimates and manages battery
state of charge, provides an onboard diagnosis, and
manages battery safety control, battery operating
parameters, battery equalization (i.e. consistency between
all cells within a module), information storage and thermal
management.

18
Table 2.1 Types of charging facilities
Type of Charging Charging*
Time
Advantages Disadvantages Market Segment
Onboard AC to DC charger -
Slow (220 V, 13 A)
24 h Easy to
implement
Slow Private cars, two-wheeler
AC to DC via special extra
converter and DC charging of
onboard batteries - Fast
12 h Moderate,
flexibility
More investment Public cars, public buses
Rapid (50 kW+) 90 min Fast Restricted to three phases,
high cost, loading issue,
low efficiency
Public buses, public cars
Battery swapping 2–5 min Very fast Cost of battery, space
requirement at EVCPs,
robotics
Public buses
Source: GGGI, 201531 *Estimated
2.3 Comparison of Diesel, Hybrid Electric and
Full Electric Buses
Diesel, hybrid electric and electric buses all perform
differently, and an understanding of these comparative
differences is useful. Such a comparison is summarized in
Table 2.2 below and includes a range of factors.
Overall, the greatest hurdle to increased uptake of EV is
their higher price tag when compared to ICE vehicles. This is
mainly attributed to battery costs, the complex design of
powertrain systems and nascent technology. Since an HE
bus is powered by an ICE, as well as a battery with an
electric motor, the HE models cost the most among the
three bus segments under discussion.
The number of moving parts in a full electric bus is less than
in a diesel bus. On the other hand, HE buses have more
moving parts, making their design the most complicated
amongst the three vehicle types. Therefore, diesel and HE
buses have higher maintenance requirements as compared
with those of BE buses. The types of maintenance in diesel
buses include frequent oil changes, filter replacements,
periodic tune ups, exhaust system repairs, water pump, fuel
pump and alternator replacements, etc. The maintenance
requirement for HE buses can be similar, or higher, than
those of diesel buses.
Battery electric buses have controllers and chargers, which
manage the power and stored energy levels in the battery.
These are electronic devices without any moving parts, and,
hence, they require little or no maintenance. The lithium-
31 Global Green Growth Institute, 2015. Electric Buses in India: Technology, Policy and Benefits
ion batteries that are used in electric buses require minimal
maintenance. Battery replacement is one type of
maintenance, which may need to be undertaken every
several years. However, continual technological
advancement aims to make batteries co-terminus with the
service life of a bus.
Battery charging, which is similar to refueling, is not
considered maintenance work, even though it contributes
to significant downtime in bus operations. In developed
electricity markets, due to a time of usage (ToU) tariff
policy, off-peak charging allows the application of lowest
utility rates, leading to significant operating cost
advantages. In this way, the total cost of operating a BE bus
is less than an ICE bus due to lower maintenance, cheap
power and high fuel efficiency. However, BE buses are
more expensive to acquire initially, a result of a higher price
tag on the bus itself, and the need to install charging
facilities.
Diesel hybrid buses typically demonstrate 7-44% better fuel
economy than diesel buses at slow and medium speeds.
However, the fuel economy for the hybrid bus is reported
to be the same, or lower, than the diesel bus at high
speeds. The majority of city transport buses (90%) operate
at slow or medium speeds.
The external features of the battery electric bus design are
similar to those of an ICE bus. The main difference is that
BE buses do not have tail pipe emissions. However, the
internal design of the components is moderately different
among ICE buses, HE buses and battery electric buses.

19
Table 2.2. General comparison of three segments of buses
Parameters BE Bus HE Bus Diesel Bus
Power source Electricity Electricity and diesel Diesel
Power generator Battery ICE and battery ICE
Costs (NPR) >1.5-3.5 crores32 >4.8 crores33 0.32–1.41 crores34
Fuel efficiency 1.12 kWh/km35 2.75–4 km/L36 2.2–3.3 km/L37
Fuel tariff 4.69 NPR/kWh38 77.5 NPR/L39 77.5 NPR/L
Fuel cost 40 NPR 3.12/km NPR 19–28/km NPR 23–35/km
Emissions Zero (local) Low (less CO2, SOx, NOx and
NMHC)
High (baseline)
Noise Minimum (at slow speeds) Low (at slow speeds) High (baseline)
Secondary benefits High Moderate Low
Maintenance Lowest High High
Components EV propulsion system,
transmission, battery charging
system, power accessories,
body
ICE propulsion system, EV
propulsion system,
transmission, battery charging,
power accessories, body
ICE propulsion
system, transmission,
power accessories,
body
Source: GGGI, 201541
According to California’s Advanced Transportation
Consortium, up to 70% of the components of an electric
bus can be different from those of an ICE bus. Diesel and
hybrid electric buses have a distinct feature; both have a
fuel tank, which is absent in BE buses. Diesel buses have
only one energy source, ICE, which uses diesel fuel. A HE
bus contains both an ICE and a battery pack with an electric
motor.
32Global Green Growth Institute. 2014. “Green Growth Strategy for Karnataka.” Case Studies. http://gggi.org/wp-content/uploads/2014/12/Karnataka-GG-
Case-Studies_FINAL_Web-Version.pdf.
33Noel, Lance, and Regina McCormack. 2014. “A Cost Benefit Analysis of a V2G-Capable Electric School Bus Compared to a Traditional Diesel School Bus.”
Applied Energy. http://www.udel.edu/V2G/resources/V2G-Cost-Benefit-Analysis-Noel-McCormack-Applied-Energy-As-Accepted.pdf. 34 Adapted from a range of global studies exploring fuel efficiency of battery electric buses. Also see Global Green Growth Institute. 2014. “Green Growth
Strategy for Karnataka.” Case Studies. http://gggi.org/wp-content/uploads/2014/12/Karnataka-GG-Case-Studies_FINAL_Web-Version.pdf.;
Truckaurbus.com. 2015. “Tata Starbus 32 AC (BS4), ₹ 20,19,000.” August 23. http://www.truckaurbus.com/new-cv/tata/starbus/tata-starbus-32-ac-bs4-
8377-20-19-000-l1232.html.
35Global Green Growth Institute. 2014. “Green Growth Strategy for Karnataka.” Case Studies. http://gggi.org/wp-content/uploads/2014/12/Karnataka-GG-
Case-Studies_FINAL_Web-Version.pdf.
36M.J. Bradley & Associates LLC. n.d. “Comparison of Modern CNG, Diesel and Diesel Hybrid-Electric Transit Buses: Efficiency & Environmental Performance.”
http://mjbradley.com/sites/default/files/CNG%20Diesel%20Hybrid%20Comparison%20FINAL%2005nov13.pdf.
37Global Green Growth Institute. 2014. “Green Growth Strategy for Karnataka.” Case Studies. http://gggi.org/wp-content/uploads/2014/12/Karnataka-GG-
Case-Studies_FINAL_Web-Version.pdf.
38Nepal Electricity Authority. 2016. Annual Report. 39 Nepal Oil Corporation. 2017. Oil prices. 40 Fuel cost per km is calculated using fuel efficiency and fuel tariff. 41 Global Green Growth Institute, 2015. Electric Buses in India: Technology, Policy and Benefits

20

21
Chapter 3
BENEFITS AND CHALLENGES OF BATTERY ELECTRIC VEHICLES
3.1 Introduction
Numerous benefits are associated to introduction electric
vehicles in Nepal. Sajha Yatayat’s vision to adopt a fleet of
pure battery electric buses, starting from the pilot initiative,
has evolved from the recognition of multiple benefits such
as improved operations, environmental quality, enhanced
socio-economic conditions with a positive impact on
tourism and associated business opportunities. Study of
electric bus fleet operations in Himachal Pradesh and
Karnataka in India by GGGI has provided a solid basis for
assessing the costs and benefits of running electric buses in
the roads of Kathmandu (see Annex 3 for detailed
discussion on Himachal Pradesh and Karnataka case
studies). The key technical, environmental, social and
economic benefits viewed in the context of the Kathmandu
are presented below.
3.1. Technology
3.1.1 Torque and Power Curves
Most local buses ply at speeds in the range of 10-30 km/hr.
Even then, climbing maximum gradients of 4-12% at speeds
12-20 km/hr specified in Nepal Roads Standards 2070,
demands a much greater power requirement to sustain
such slopes for longer durations. Diesel engines inefficiently
generate such torques as engine runs at a much higher rpm
to deliver required power. Electric buses on the other hand
are capable of providing greater torques at slow speeds
without much loss of efficiency.
3.1.2 Reduced Maintenance Cost
The hilly terrain as well as poor road conditions has a
negative impact on the overall machinery of diesel buses. It
is observed that the scheduled servicing of buses in
Kathmandu occurs at a lower value of cumulative km
(7,000-8,000 km) than that recommended by the
manufacturer (15,000 km). Electric buses on the other hand
have an advantage on both hilly and flat routes. This is
owing to the absence of a mechanical drive train. Due to
significantly less number of moving parts in an electric bus,
it is a preferred option against diesel buses. The
maintenance cost analysis detailed later in the report,
indicates 90% reduction in maintenance cost for electric
buses, when both direct and indirect costs are captured for
diesel buses undergoing repair and maintenance.
3.1.3 Performance at Low Temperature
Kathmandu experiences overnight lows of 2oC during
winter. Diesel buses incur extra costs at such low
temperatures because diesel gels. Thus, electric vehicles
are more efficient during winter in Kathmandu.
3.1.4 Challenges
The main technology challenges include:
• Weight of vehicle and batteries - Electrical vehicles have to carry the dead weight of batteries at all times irrespective of energy content in them. To support additional weight of batteries the vehicle structure is redesigned which adds weight. Such additional weight of vehicle and batteries consumes energy to move.
• Range - Net amount of energy on board an electric bus adds to the curb weight of electric bus. Thus, suitable sizing of batteries is required to meet operational requirements at optimum energy (thus weight) levels.
• Concurrent development of charging
infrastructure - The range anxiety and refueling
concerns can only be addressed by a reliable
charging infrastructure. A thriving electric bus
ecosystem would need a supporting network of
charging stations.

22
3.2. Environment
Apart from offering superior performance than ICE vehicles, Electric vehicles also offer major environmental benefits due to their inherent technological design where they have zero tail pipe gas emissions and significantly low noise levels.
3.2.1 Improved Air Quality Diesel vehicles are a major source of air pollution.
Correspondingly, Kathmandu is one of the most polluted
cities in Nepal due greenhouse gas (GHG) emissions
(complete combustion of 1 l of diesel causes 2.65 kg of CO2
emissions, density of diesel = 835 g/l) and particulate
matter emissions from diesel buses. The impact of these
emissions is further worsened by congestion and directly
harmful to the individuals caught in traffic. With the
growing number of vehicles on road, the direct impact of
air pollution will be felt even more.
Air quality benefits from electric buses can be attributed to
a reduction in local air pollution compared with that of
conventional diesel buses. Electric buses contribute to zero
tail-pipe emissions, which are a major source of air
pollution in urban areas. The introduction of electric buses
will be beneficial in urban areas, where local air pollution is
a concern. Electric buses combined with renewable
electricity will ensure future reduction in fossil fuel demand
and a way forward for cleaner technologies and fuels.
3.2.2 Reduced Noise Pollution Noise pollution is linked to several health issues, including
stroke, hypertension, dementia and coronary heart disease.
In addition to these concerns are the less serious but more
prevalent issues of annoyance and sleep disturbance, which
in itself can have an added cost in the workplace or
classroom the next day. Further still, one can also consider
the effects of excess noise pollution on economic
productivity; it not only causes health problems, but also
decreases economic efficiency. The benefits on health due
to electric vehicles are substantial. Noise pollution is
significantly reduced when switching from a diesel vehicle
to an electric vehicle.
Source: Rose and Staiano, 200742
Figure 3.1. Bus categories, travel speed and associated noise levels.
42 Rose, Jason C, and Michael A Staiano. 2007. “A Comparison of Green and Conventional Diesel Bus Noise Levels.” In . Reno, Nevada.
http://staianoengineering.com/images/NC07_Ross_Staiano_-_A_comparison_of_green_and_conv.pdf.
60
65
70
75
80
85
32.2 40.2 48.3 56.3 60.4 72.4 80.5 88.5 96.5
Max
imu
m S
ou
nd
leve
l at
50
fee
t (d
BA
)
Speed (kph)
Diese: Lmax = 79 + 9* Log10(Speed/50)
Hybrid: Lmax = 80 +25* Log10(Speed/50)
Electric Trolleybus: Lmax = 78 +45* Log10 (Speed/50)

23
Generally, electric vehicles are quieter than diesel vehicles,
for example, at low speeds, an electric bus is about 17
decibels (dB) quieter than a diesel bus travelling at the
same speed. Fossil fuel buses can produce noise that is as
loud as 72 dB, whereas electric buses tend to operate at
about 64 dB at higher speeds. Since dB is on a logarithmic
scale, this means that electric buses are half as loud as
diesel buses. This is equally true for other vehicle
categories, such as 2-wheelers and cars. Such a significant
reduction in noise “at the source” has the potential to have
a significant impact on well-being.
It is important to note, however, that at high speeds, all
types of large vehicles, especially buses, generate roughly
the same amount of noise, as the main source of noise is
the tires on the pavement and not the engine. According to
a study, the difference between the noise levels generated
by larger vehicles such as diesel and electric buses is most
significant at speeds up to 25 mph (40 kmph) (Rose and
Staiano 2007) as shown in Figure 3.1. However, mobility
indicators for vehicles in Nepal urban driving conditions
show that traffic rarely exceeds these speeds. Thus, the
reduction in noise from electric vehicles will be quite
tangible in the context of urban Nepal.
3.2.3 Reduced Greenhouse Gas Emissions Introduction of electric buses becomes favorable in regions
where the grid has a major share from renewable energy.
This is the case in Nepal, where hydropower is the primary
source, accounting from 70-80% of Nepal’s electricity, with
the remainder being imported from India.43 The total
hydropower potential of Nepal is estimated at 83,000 MW.
When the electric buses are charged using electricity
generated by renewable energy, the benefits are way
beyond the local air quality.
3.2.4 Challenges
The main environmental challenge lies in battery disposal.
All modern batteries use rare and/ or poisonous materials
(lithium, lead etc.), thus proper disposal after use is an
environmental challenge to avoid any chance of local
pollution.
3.3. Socio-Economic
Some of the socio-economic benefits of using electric buses
are as below:
43 See http://www.nepalenergyforum.com/260-mw-to-be-imported-from-
india/ 44 Diesel bus consumes about 15,884 l of diesel per year (approx. 1.5 GWh
energy per year) -Assumption: Energy required by electric bus =
3.3.1 Energy Security Replacement of diesel buses with electric buses can
improve energy security of the country. When compared to
a Sajha Yatayat diesel bus, in the Lagankhel to
Budhanilkantha route, an electric bus consumes 65,522
kWh of electricity per year for operation, which is 4% of the
energy consumed by a diesel bus.44 Implementation of
Electric Vehicles are directly related to decreasing reliance
on other countries for fossil fuel imports- All the fossil fuel
being consumed in the transport as well as the residential
sectors in Nepal is imported, which presents a serious
threat to the country’s energy security. Reliance on only
one source of fuel to run priority sectors of the country
limits its growth. Implementation of electric vehicles in
priority areas will also ensure environmental sustainability
and help diversify the energy-mix, which also aligns with
GoN’s aim to limit the use of petroleum products. Since
Nepal aims to develop 10,000 MW hydropower capacity by
2025 as outlined in the National Energy Crisis Reduction
and Electricity Development Decade Plan (2016), the
electricity generated can be supplied to the transport
sector, thereby reducing the burden of importing fossil
fuels. An increase in its energy mix can aid the country in
greatly enhancing its energy security.
3.3.2 Dynamic Charging Nepal has an estimated 43,000 MW of hydroelectric
potential of which 904 MW has been harnessed and 3833
MW is under construction as of September 2017, (DoED,
2017). This capacity has been installed by National level and
Private sector entities. Usage of this renewable energy
source for operation of electric buses will result in a robust
and environmentally sustainable mobility solution.
3.3.3 Lower Price Volatility
The commercial rate of per unit cost of electricity has
remained far more stable than the cost of petroleum
products, which have fluctuated over the past 2-3 years.
Every hike in price of diesel due to negative externalities,
causes the public bus operating companies to incur losses,
since a corresponding increase in the bus fare is not an
option. Bus operators are not permitted to alter bus fares
to reflect actual costs of doing business. Rather, the federal
government sets bus fares across the board. Thus, it might
be fiscally prudent for public bus operating companies,
such as Sajha Yatayat to move to a basket of clean
technologies including electric vehicles whose prices are
largely stable.
1.50kWh/km, Mileage of diesel bus = 2.7 km/l, Avg. km travelled per bus
per year = 43,681km]

24
3.3.4 Increased Road Safety A shift from clutch gear system (conventional diesel bus) to
automatic drive (electric bus) would be more comfortable
[11] and reduce the fatigue experienced by drivers,
especially those logging overtime hours. A corresponding
increase in road safety can also be envisaged due to
automatic buses and better driver control.
3.3.5 Increased Comfort and Ease of Access New electric buses are equipped with AC and have higher
quality seats than the existing diesel buses in Sajha
Yatayat’s fleet. As such, electric buses tend to be more
comfortable.
In addition, as is the case with diesel buses in Sajha
Yatayat’s fleet, electric buses will have seats reserved for
women and children, helping to ensure their security and
comfort while travelling. The proposed electric buses are
low-floor buses, whereas Sajha Yatayat’s existing diesel
buses are almost all high-floor buses. It is much harder for
users in wheelchairs and the elderly to access these buses
due to the high steps. However, low-floor electric buses are
much easier to access as there is no step between the curb
and the bus floor. In addition, access is improved as a result
of an extendable ramp for wheelchair users and the elderly,
as well as special reserved wheelchair spaces on the bus.
3.3.6 Job Creation The operation of electric buses requires the same human
resource inputs as diesel buses in terms of drivers,
conductors and depot staff. However, due to much less
servicing and maintenance, electric buses require less time
from technicians, reducing demand for jobs in this area.
However, outside of servicing, electric buses generate other
job opportunities. Growth in the EV sector will produce
direct and indirect jobs. The development of certain sectors
in Nepal, such as vehicle manufacturing along with
development of batteries, charging stations and other EV-
related accessories would result in direct job creation. The
potential for job creation can be gauged from the instance
of EV manufacturing in China. Evidence from that country
suggests that the manufacture of EVs can constitute 15% of
the total automobile production. The Chinese government
has an official program that aims to produce 1.67 million
new EVs and create of 1.2 million jobs annually from 2010–
2020.
Introduction of EVs has also provided the lower income
population with job opportunities. There have been many
examples of development partners supporting country
governments to implement clean transport services. An
example of such an effort is the introduction of electric
three-wheelers in Kathmandu Valley in 1993 that has
empowered both females and disadvantaged populations.
In addition to this, ADB piloted electric pedicabs in
Kathmandu and Lumbini in April 2017 in a bid to provide
employment opportunities to people from the low-income
group.45 Another such example, but at a significantly larger
scale, was implementation of 100,000 electric three-
wheelers in Manila, Philippines. This project was aimed at
not only curbing local pollutant emissions and managing
traffic but also in boosting income of the low-income drives
in the country (IEA, 2014). Such examples are effective in
illustrating the opportunities clean vehicles can provide to
low-income population in-terms of income generation.
3.3.7 Challenges Electric cars have recently been introduced in Nepal. There are no cases of electric bus manufacturing systems or deployment in regular operations yet. The ecosystem that supports electric vehicles and electric bus on an industrial scale is still evolving. This offers a challenge as well as opportunity to Nepal to create demand for required manufacturing units to support deployment of electric buses in the country.
45 Support Global Voices. 2017. The Pedicab Project Is Giving Nepal's
Rickshaws a Modern Update. Retrieved from
https://globalvoices.org/2017/06/01/the-pedicab-project-is-giving-nepals-
rickshaws-a-modern-update/
25
Chapter 4
REGULATORY LANDSCAPE
4.1 Introduction
In recent years, air pollution has become the cause of
concern in numerous urban centers across Nepal, especially
Kathmandu. Increasing imports of oil due to an increasing
number of fossil fuel vehicles is causing environmental
degradation, creating public health risk, and undermining
the energy security of the country.
Since cleaner modes of transport, such as electric vehicles,
have numerous co-benefits (as discussed in Chapter 3)
ranging from improved air quality to job creation, the
government has realized the necessity of shifting to
environmentally friendly transport services in the country,
and have set about translating this objective into different
policy and regulatory measures, creating a wide, quite
comprehensive and increasingly robust policy landscape for
EV. A summary of this policy landscape is presented below.
4.2. Summary of Policies and Regulation
4.2.1 Fourteenth Three Year Plan (2016)
The Fourteenth Three Year Plan (2016/17 to 2018/19)
recognizes the need to identify sustainable transport
services and implement an electric railway connecting the
east and the west of the country. It also states that a study
for possibility of metro or monorail service in Kathmandu is
being carried out. Disruption to Nepal’s fuel supply during
2015-2016 made government planning bodies more
cognizant of the need to reduce dependence on imported
fossil fuel in addition to decreasing pollution in the capital
city46. The proposed electric bus pilot initiative can be a
start to the change that NPC has envisioned for 2018/19.
46 NPC. 2017. Fourteenth Three Year Plan 2073/74-75/76. National
Planning Commission. Government of Nepal.
4.2.2 National Transport Policy (2001)
The National Transport Policy is an overarching policy
document which is aimed at providing clean transport
services (powered by gas, electricity and solar) in order to
manage air and noise pollution levels in Nepal, particularly
from public transport, in addition to building sustainable
transport infrastructure. It covers key components of the
transport system, including developing infrastructure to
connect Strategic Road Networks to Local Road Networks
as well as ensuring public transport services (vehicles
powered by gas and electricity) are sustainable and reliable
through the introduction of different standards.
4.2.3 Environment Friendly Transport Policy
(2014) Whereas the National Transport Policy only broadly
specifies provisions for clean transport services, the
Environment Friendly Transport Policy 2014/15 sets specific
targets related to clean transport. These include some
critical electric transport targets, such as:
• Increasing the share of what the policy terms
“environment friendly vehicles” to a minimum of
20% of the total vehicle fleet by 2020;
• Encourage manufacturing of environment friendly
vehicles, which include electric vehicles
• Encourage private sector to invest in construction
and management of EV parking stations as well as
service centers.
• Facilitate land for construction of 10 charging
stations around ring-road in Kathmandu under a
pilot initiative. In addition, specify provisions for

26
installing charging facilities in retail outlets such as
shopping malls, hotels and large parking areas.
• To ease access to batteries, chargers, motor,
controller and chassis related to environment
friendly vehicles
These targets provide substantial support to programs that
aim at strengthening clean transport services, specifically
EVs, in the Nepalese market47. In addition to unlocking
opportunities for EV sales and retrofitting existing vehicles
to a hybrid system, this policy and its targets also
recognizes the need to kick-start the electric vehicle
manufacturing industry to increase local job opportunities,
decrease production costs and encourage local resource
use.
4.2.4 National Sustainable Transport Strategy
(NSTS) (2015) The National Sustainable Transport Strategy48 provides
overall strategic direction to strengthen the economic,
social and environmental indicators in providing sustainable
transport solutions in the country. The strategy was drafted
in 2015, but is still awaiting approval by Cabinet.
In addition to streamlining existing strategies and
guidelines on transport to make it more robust, the NSTS
specifies strategic actions necessary for a sustainable
transport system. Some of these strategic actions pertain to
electric vehicles, including:
• Encourage investment in electric railway projects;
• Introduce trolley buses or electric buses in urban
areas; and
• Provide electric vehicles in tourist areas.
The strategy emphasizes that escalating hydropower
generation in the country will provide numerous
opportunities to integrate electric vehicles (EVs), both for
passenger and freight transport, into the transport system
(UNCRD, 2015). The commitment to initially piloting electric
buses to provide cleaner and more sustainable mode of
transport services is in line with the actions outlined in the
National Sustainable Transport Strategy.
47 Ministry of Physical Infrastructure and Transport. 2015. Environmentally
Friendly Transport Policy 2015. Government of Nepal.
http://www.mopit.gov.np/uploads/files/policies&directives/
Watawaranmaitri%20Sawari%20tatha%20Yatayat%20Niti%202071.pdf. 48 United Nations Centre for Regional Development, 2015. National
Sustainable Transport Strategy. Ministry of Physical Infrastructure and
Transport (MOPIT), Nepal Ministry of the Environment (MOE), Japan
4.2.5 National Urban Development Strategy
(2017)
The National Urban Development Strategy recognizes the
growing concern for air pollution and the need for
sustainable urban public transport systems to cater to the
demand of Nepal’s rising urban population. The NUDS
(2017)49 presents a range of strategies to improve public
transport services in urban areas through:
• Integrating land-use and transportation by
developing related institutional mechanisms and
capacity;
• Providing balanced urban road infrastructure;
• Promoting sustainable urban public transport; and
• Preparing comprehensive transport management
standards and plans.
This strategy document emphasizes the need to enhance
inter-urban connectivity through route planning to
introduce Bus Rapid Transit (BRT), Light Rail Transit (LRT)
and Mass Rapid Transit (MRT) in metropolitan cities and
improving institutional mechanisms to regulate public
transport.
4.2.6 Fiscal and Financial Regulation
Recognizing the importance of fiscal measures to accelerate
EV adoption, the Ministry of Finance has gradually shifted
its attention to decreasing duties for both small and large
EVs in its recent Budget Speech of FY 2016/17. The
following fiscal parameters are in place, as outlined in the
Ministry of Finances Budget Speech of 2016/201750:
For electric vehicles for public transport:
• A customs (import) duty of 1% is in place
(compared to a customs duty of 5% for fossil fuel
vehicles with more than 40 seats for public
transport mentioned in the Budget Speech for FY
2015/16);
• Exemption of value added tax (compared to a VAT
of 13 % leveed on fossil fuel vehicles for public
transport);
For electric vehicles for private transport:
• A customs (import) duty of 10 % is in place
(compared to a customs duty of 80 % for fossil fuel
vehicles for private usage);
United Nations Economic and Social Commission for Asia and the Pacific
(UN ESCAP).
49 Ministry of Urban Development. 2017. National Urban Development
Strategy 2017, Nepal. Urban Development and Physical Planning Division.
Ministry of Urban Development (MoUD). Government of Nepal (GoN).
50 Ministry of Finance. 2016. Budget Speech 2016/17

27
• Exemption of value added tax (compared to a VAT
of 13 % leveed on fossil fuel vehicles for private
usage);
For battery recycling equipment:
• A customs duty of 1 % is in place on machinery and
equipment used for the recycling of batteries;
For electric rickshaw parts:
• Exemption of value added tax (compared to a VAT
of 13 % leveed on fossil fuel vehicle parts).
In addition to this, Nepal Rastra Bank in its Monetary Policy
for FY 2074/75 has set the loan-to-value ratio for private
loans used by consumers to purchase electric vehicles to
80% of the vehicles value, whereas the same for fossil fuel
vehicles is only at 65%51. This policy came into effect in July
2017. Interest rates on these loans are high, ranging from
10% at Global IME Bank (a development bank) to 15.5% at
the NMB Bank (a commercial bank).
4.2.7 Climate Change Policy 2011
The Climate Change Policy52 is the principal document
outlining the government’s objectives and targets specific
to climate change mitigation and adaptation in the country.
As part of a suite of measures designed to expedite low
carbon development, reduce greenhouse gas emissions and
build climate resilience, the document highlights the
importance of promoting electric transport industries such
as electric train, ropeway and cable car.
The electric bus pilot initiative can potentially jumpstart
adoption of electric vehicles in the public transport sector
throughout the country, and facilitate a reduction in
greenhouse gas emissions, supporting wider climate change
mitigation efforts in Nepal. In this way, the pilot program
will be a step towards meeting the objectives of the Climate
Change Policy.
4.2.8 Nationally Determined Contributions Nepal has prepared its Nationally Determined
Contributions (NDCs)53, which is a collection of sectoral
plans and policies that provide the building blocks for
addressing climate change in Nepal. The NDC was prepared
in 2015 and constitutes Nepal’s international commitments
submitted at the 2015 Paris Climate Conference or 21st
Conference of Parties (COP21).
51 NRB. 2017. Summary of Monetary Policy for Fiscal Year 2074/75. Nepal
Rastra Bank, Nepal. 52 Ministry of Environment. 2011. Climate Change Policy. Government of
Nepal.
53 Ministry of Population and Environment. 2016. Nationally Determined
Contribution. Communicated to United Nations Framework Convention
The NDCs include a list of sectoral and cross-cutting actions
and targets that will contribute to economic growth and
reduce greenhouse gas emissions. Air pollution and
emission mitigation from the transport sector through
implementation of clean transport services are priority
areas in Nepal’s NDCs as pointed out as follows:
• NDC Action Point 9: By 2020, Nepal aims to
increase the share of electric vehicle up to 20%
from 2010 level.
• NDC Action Point 10: By 2050, Nepal will decrease
its dependency on fossils in the transport sector by
50% through effective mass public transport
means while promoting energy efficient and
electrical vehicles.
• NDC Action Point 11: Nepal will develop its
electrical (hydro-powered) rail network by 2040 to
support mass transportation of goods and public
commuting.
• NDC Action Point 14: By 2025, Nepal will strive to
decrease the rate of air pollution through proper
monitoring of sources of air pollutants like wastes,
old and unmaintained vehicles, and industries.
4.2.9 Sustainable Development Goals
Implementation of programs in achieving the sustainable
development goals (SDGs) is a major objective of the
Government of Nepal for low emissions development and
sustainable use of its vast natural resource base.
Specifically, in response to the global adoption of the SDGs,
the Government of Nepal’s National Planning Commission
prepared the Sustainable Development Goals 2016-2030
National (Preliminary) Report54 which outlined focus and
priority areas for SDG implementation in Nepal. The report
outlines target specific to each of the goals. Under this
report, the introduction and widespread adoption of EVs in
the country is supported by five SDGs, as set out below,
namely:
• SDG 3: Ensure healthy lives and promote well-
being for all at all ages
Target 3.4a1: Reduce death of population
aged 30-70 years from cardiovascular
diseases, chronic respiratory diseases,
cancers and diabetes from 22% in 2014 to
16.5% in 2020 and 7.3% in 2030.
on Climate Change, Ministry of Population and Environment (MoPE).
Government of Nepal (GoN) 54 Nepal Planning Commission. 2015. Sustainable Development Goals
2016-2030. National (Preliminary) Report. National Planning Commission
(NPC). Government of Nepal.
http://www.npc.gov.np/images/category/23rd_Jan_final_for_print_Sust
ainable_DevelopmentGoals1.pdf

28
• SDG 7: Ensure access to affordable, reliable,
sustainable and modern energy for all
Target 7.3g: 50% electric vehicles in the
public transport system by 2022 and
100% by 2030.
• SDG 11: Make cities inclusive, safe, resilient and
sustainable
Target 11.2b: 25.1% availability of safe
public transport system by 2022 and 50%
by 2030.
• SDG 13: Take urgent action to combat climate
change and its impacts
Target 13.1c: Reduce greenhouse gas
(GHG) emitted by transport sector from
12% in 2014 to 6% in 2030.
• SDG 17: Revitalize the global partnership for
sustainable development
The electric bus pilot program can initiate the process of
contributing to the meeting of targets specified. This
initiative can specifically support the meeting of SDG 7
target 7.3.
4.2.10 National Ambient Air Quality Standards
In order to address the rising challenges of air pollution in
Nepali cities, the National Ambient Air Quality Standards of
Nepal was revised in 2012 by the Department of
Environment. This revision introduced new standards for
PM2.5 emissions. The target states that PM2.5
concentration can only exceed 40 µg/m3 for 18 days per
year. However, in many larger cities, PM2.5 concentrations
regularly exceed this level. In Kathmandu, for example,
PM2.5 exceeds this level on an estimated 90% of days.
Since the transport sector largely contributes to PM2.5
emissions, increased adoption of electric vehicles can
substantially reduce PM2.5 emissions to meet this target55
.
55 Ministry of Science Technology and Environment. 2012. National
Ambient Air Quality Standard

29
Chapter 5
ROUTE AND VEHICLE ANALYSIS
5.1 Introduction
Given the range of high-level policy, regulatory and fiscal
support for electric vehicles in Nepal, as explored in the
proceeding chapter, public transport operators are in an
increasingly favorable position to deploy electric vehicles in
their fleets. Indeed, many small transport operators in
Kathmandu, such as minivan and microbus operators are
exploring and have deployed electric vehicles. However, to
date, no operators of full size public transport vehicles have
deployed electric vehicles within their fleets.
This chapter sets out the parameters for changing this. The
chapter analyzes the current conditions and terrain in
Kathmandu, by far the largest of Nepal’s cities, and
explores the current routes and operations of the Nepal’s
and Kathmandu’s largest public bus operator, Sajha
Yatayat. An analysis of Sajha Yatayat’s operations allows for
the identification of the most favorable route for electric
buses and sets out the trip parameters and vehicle
specifications required to most optimally meet these
parameters. Based on this, two electric buses are proposed
as viable vehicle options.
5.2 Local Conditions in Kathmandu and
Advantages for Electric Buses
When compared to diesel buses, electric buses can present
certain distinct advantages (as discussed in Chapter 3).
These advantages are realized when certain terrain,
climatic and route conditions are present. The following key
conditions in Kathmandu all generate an advantage for
electric buses over diesel buses.
Advantages include:
• Better bus performance in hilly terrain – The
efficiency of diesel buses is lower than that of
electric buses in hilly areas. As a valley, the
Kathmandu metropolitan region (comprising
Kathmandu, Lalitpur and Bhaktapur) is largely hill.
In particular, on the route under consideration,
from Lagankhel to Budhanilkantha, buses travel
uphill from Narayangopal Chowk to reach
Budhanilkantha, which is located on Shivapuri Hill.
When travelling uphill, all buses consume energy
as per the weight of the bus and efficiency of
traction source. However, unlike electric buses,
when travelling downhill, diesel buses lose energy
as a result of dissipation of kinetic energy through
braking, which leads to high wear and tear on the
clutch and brakes. With electric buses, this wear
and tear can be significantly avoided, which
lowering maintenance costs.
• Better bus performance in low temperatures -
temperatures in Kathmandu is around 2oC in
winter and 28oC during summer. Since electric
buses have been operated successfully in Nordic
countries and the Rohtang-Manali pass in
Himachal Pradesh, India, where sub-zero
temperature is normal, the temperature in
Kathmandu is optimum for its efficient operation.
For a diesel vehicle, diesel has gelling issues at low
temperatures and additives are added to diesel to
maintain its viscosity causing additional expense.
Electric vehicles are limited only by the operating
temperature range of batteries. Current batteries
(Li-ion) are rated for operation up to -20o C, thus
suitable for nominal public transport operation
conditions within Kathmandu.
• Higher stability of electricity prices – Time of day
(ToD) electricity prices for electric vehicles in Nepal

30
have been relatively stable since 2012 with
increase observed once in 2016. Time of day rates
have been determined for electric vehicles,
specifically Trolley Buses and other vehicles. The
off-peak rates jumped by 5% in 2012 and
increased from NPR 3.1 per unit in 2012 to NPR 3.7
per unit in 2016. The Nepal Electricity Authority
has so far maintained two dedicated lines at the
safa tempo charging stations, in an effort to
reduce losses even during load-shedding hours.
This stability in electricity supply and prices for
electric buses is highly favorable in Nepal when
compared to diesel buses that have to withstand
losses due to high fluctuation in diesel price and
supply.
• Better bus performance in start-stop traffic - The
traffic conditions of Kathmandu is such that traffic
movement is quite slow. The average speed of any
vehicle ranges from 17 to 25 kph. When compared
with a diesel bus, electric buses have very high
efficiency as conversion, transmission and
distribution losses are very low. This puts electric
vehicles at an advantage in Kathmandu’s roads
because at stop-and-go traffic, their energy waste
gets minimized (as shown in Table 5.1.).
5.3 Sajha Yatayat’s Fleet and Operations
Sajha Yatayat is Nepal’s largest public transport operator,
and one of its best known, operating iconic dark green full-
size diesel buses. It’s 46 buses operate primarily in
Kathmandu Valley, servicing more than 17,000 passengers
daily across the metropolitan region. The fleet covers over
6000 kilometers daily, and connects two metropolitan
cities, namely, Kathmandu Metropolitan City and Lalitpur
Metropolitan City; and three municipalities namely,
Budhanilkantha Municipality, Madhya Thimi Municipality
and Bhaktapur Municipality.
The organization also services an increasing number of
districts neighboring Kathmandu Valley, including Baglung
District, some 275 kilometers west of Kathmandu. Talks are
ongoing for the introduction of additional routes.
The organization is a cooperative. It began operations in
early 1962 with the aim of providing affordable
transportation to the population of Kathmandu Valley and
increasing connectivity with surrounding districts. During
the 1990s and 2000, the cooperative faced significant
operational challenges, a period of intense instability. As a
result, the cooperative closed operations in 2007. At the
time, Sajha Yatayat owned a fleet of 183 buses.
In 2011, the organization was revived. In April 2013, 16 new
buses were procured for operation. In 2016, a further 30
buses were procured and deployed. Until the middle of
August 2017, the fleet of 46 full size buses operated across
five metropolitan routes, as shown in Figure 5.1 below.
From the third week of August 2017, 6 buses were
allocated to operate in the sixth route, Ratnapark-Sanga
route (see Table 5.3)
Box 5.1 Electricity generation in Nepal
Nepal is endowed with 43,000 MW hydropower
potential but only 904 MW small and large hydropower
plants are in operation so far (as of September 2017).
With only 92 MW of storage type hydropower plants in
operation, run-off river hydropower plants constitute a
significant portion of the hydropower landscape.
There are many hydropower plants that will come into
operation in the coming years. Nepal Electricity
Authority (NEA) has recently stated that when the 456
MW Upper Tamakoshi Hydropower (run-off river) comes
into operation in 2018, there will be excess electricity at
night, which can potentially be utilized to charge electric
buses. 56 The capacity available during the night,
excluding imports from India, is around 570 MW. During
the six off-peak hours at night (from 11pm to 5am),
electricity demand is around 700 MW. When the 456
MW is added onto the grid in 2018, the total available
energy at the grid will be around 1000 MW, with 300
MW excess. This capacity can be used to charge around
6,000 electric buses, with battery capacity of 300 kWh,
at night.
Source: Nepal Electricity Authority, 201757
56 Republica. 2017. NEA setting up charging stations for electric vehicles.
Retrieved at: http://www.myrepublica.com/news/29166/
57 Nepal Electricity Authority. 2017. Annual Report.

31
Table 5.1 Comparison of energy loss in diesel and battery electric buses
Loss category Diesel bus (Wh/km) Battery electric bus
Aerodynamic losses 90 90
Braking losses 370 20
Wheels losses 350 350
Transmission losses 130 270
Ancillary equipment losses 480 270
Engine/battery losses 2,220 20
Total loss 3,640 1,020
Source: Lajunen, 201558
Table 5.2 Overview of fleet by 2018
Make Model Quantity Age Capacity Length
Tata Motors Name59 16 2013 40 seats 10 meters
Ashok Leyland Viking60 30 2016 54 seats 11 meters
TBD TBD 12 2018 40-50 seats TBD
Source: Sajha Yatayat
Table 5.3 Ridership of five metropolitan routes
No Start Stop Length (km) No. of buses Av. daily
commuters
Av. daily
distance
(km)
1 New Bus Park Airport 7 4 1,045 450
2 Swayambhu Bhaktapur 21 14 5,880 2,450
3 Lagankhel Bus Park 14.5 12 5,926 1,103
4 Lagankhel Budhanilkantha 17 8 4,187 825
5 Kathmandu Baglung 300 2 60 600
6 Ratnapark Sanga 21 6 1400 650
Source: Sajha Yatayat. All data from July 2017.
58 Lajunen, Antti. 2015. “Evaluation of Electric Buses.” Alto University. http://www.ecv.fi/@Bin/211333/ECV-seminaariesitys_10-3-2015_Evaluation-of-
EBuses_Antti-Lajunen.pdf 59 Model number: LPO/1512 60 Model number: ALPSV4/186

32
Source: Sajha Yatayat
Figure 5.1. Composition of projected fleet (2018)
Source: Sajha Yatayat, 2017
Figure 5.2. Total average daily passengers riding Sajha Yatayat services (2013-2017)
27%
52%
21%
TATA (40 seater) Ashok Leyland (54 seater) TBD (under bidding process)

33
Source: Sajha Yatayat
Figure 5.3. Six metropolitan routes of Sajha Yatayat
Its fleet is comprised of two models, one from Ashok
Leyland and the other from Tata Motors, both Indian auto
manufacturing firms. With the financial contribution of
Kathmandu Metropolitan City, a further 12 buses will be
procured in 2018, which will take the total projected fleet
to 58 buses. An overview of the total projected fleet,
including the 2018 procurement, showing bus make, model
and capacity is indicated in Table 5.1 below.
As noted below, these buses currently operate across six
routes. These routes traverse the Kathmandu metropolitan
region, connecting northern and southern extremities and
eastern and western extremities, thereby integrating
neighboring municipalities and communities into the wider
Kathmandu metropolitan system.
The fleet of 46 buses is distributed across these six routes
as set out in Table 5.2 below. The fifth route, from
Kathmandu to Banglung, was introduced in late 2016.
Passenger traffic on this route is significantly lower than on
local routes, with the buses only reaching full capacity
during special occasions and national holidays, such as
Dashain and Tihar. The sixth route, Ratnapark-Sanga, is a
recent addition. This is a 21 km long route in which 6 buses
serve around 1400 passengers daily (see Table 5.3).
These services have seen steady growth in passenger
numbers. Since 2013, annual average growth in passenger
numbers across all routes is estimated to be around 25%, as
shown in Figure 5.3 below. Growth is due to management’s
sustained decision to provide highest quality public
transport possible, with a range of policies to ensure
passenger comfort. Naturally, the additional 30 buses
introduced in 2016 generated a significant rise in passenger
numbers.
5.4 Proposed Route for Electric Bus
Following analysis of the above routes, and through
discussion with Sajha Yatayat, route number four, from
Lagankhel to Budhanilkantha, was selected as the most
appropriate upon which to deploy electric buses. This route
is 17 kilometers long and takes just over an hour for each
bus to complete a single trip (i.e. one way, from terminal to
terminal).

34
Source: Google Maps 2017
Figure 5.4. Route from Lagankhel – Budhanilkantha
Source: Google Maps 2017
Figure 5.5. Route profile of the Lagankhel - Budhanilkantha route

35
This selection was based on a range of operational factors,
including route length and terrain, as well as strategic
longer-term considerations. The major factors are
presented below, as rationale.
• Route length: The existing Sajha Yatayat bus fleet
operating along the Lagankhel to Budhanilkantha
route has a one-way distance of 17 km. This route
length provides greater advantages to adopting an
electric bus as a battery range of around 150 km
can be adopted without going beyond the
budgetary limits. In addition, feasible charging
infrastructure can also be designed and
implemented for this distance, especially a normal
charging station at the Sajha Yatayat premises in
Pulchowk.
• Greater number of passengers travelling per day:
The Lagankhel-Budhanilkantha route cut across
the city and caters to a significant number of daily
commuters as shown in Table 5.3. If an electric bus
is introduced, more citizens can avail the benefits
of traveling in an electric bus that connects the
north to the southern areas of the Kathmandu
Valley. Since this route falls along the main trunk
of the city with Sajha Yatayat availing its services
to a large percentage of the population, an electric
bus in this route will have maximum promotional
power. This will help make the population of the
valley more cognizant of the services and benefits
provided by an electric bus.
• Highest number of connector stations along the
route: There are around four stops, among the 28
stops along the Lagankhel – Budhanilkantha route
where passenger traffic is relatively higher than
the remaining stops. Apart from the Lagankhel
stop, from where public transport services head
towards destinations in all directions, the
Kupondole bus stop, NAC stop and Narayangopal
Chowk stop have the largest passenger exchange
as these are main connector stations along the
route (see Figure 6.5.).
• Demand for better quality services: Sajha Yatayat
has already been known to provide better service
to the population, when compared to other
private operators that squeeze in more people
than the carrying capacity of the bus. Since the city
routes cater to a larger proportion of the working
population, there is a strong demand for better
service levels in terms of reliability, connectivity
and comfort. Electric buses can provide these
facilities in addition to enhancing the air quality
and lowering the noise levels.
• Possibility of charging facilities along route: There
is around 2000 m2 of area available at Sajha
Yatayat where both fast charging and slow
charging stations can be installed. Since the
Lagankhel-Budhanilkantha route passes through
the Sajha Yatayat depot and is at a distance of
about 2 km from the Lagankhel terminal, the
electric buses could potentially charge between
trips at the Sajha Yatayat depot.
A further detailed breakdown of the route and trip
parameters follows in Table 5.4 below.
5.5 Proposed Vehicle Options
To meet the above route and trip parameters, two electric
buses have been identified as viable. The selection of these
two options followed a round of consultations with
manufacturers in India, United States, China and South
Korea. These included, BYD (China), Hyundai (South Korea),
and KPIT (United States/India), and Ashok Leyland (India).
Discussions with manufacturers centered on the viability of
the vehicle in question and scope of vehicle optimization to
meet the local conditions and needs in Kathmandu. To a
large extent, customization was sought to improve the
financial viability of the proposal – i.e. to find the least cost
vehicle option.
The overall guide, outside of route and trip parameters
presented above, when discussing electric bus options with
manufacturers, was to identify full-size bus. This allows the
pilot electric bus fleet to directly replace existing diesel bus
options currently deployed on the route.
Two electric bus options were identified, one from BYD and
one from Ashok Leyland. Due to the relatively low unit
volume, the scope for customization of buses was reduced
to almost zero. During discussions with manufacturers, a
proposed pilot fleet volume of five units was used as the
reference. BYD was not able to offer any customization on
its vehicle, and Ashok Leyland was able to provide only
limited customization.

36
Table 5.4. Key route and trip parameters
Parameter Unit Specification
ROUTE
Route type Intra-city, commuter
Altitude m 1400 from MSL
Annual average relative humidity % 67
Average gradient % 3.6
Maximum gradient % 21%**
Climate Temperate
Ambient temperature oC 2-28
Terrain Generally flat, some minor hills
General road conditions Good; bituminous road with small
potholes
TRIP
Start Lagankhel Bus Station
End Narayansthan
Trip distance km 17 km
Average trip duration hr/min 1 hr 7 minutes
Average speed km/hr 17-25
Lunch break duration* mins 30 – 40
Hours of operation hr 6:00 – 22:00
First departure hr 06:00
Last departure hr 20:30
Buses starting at both ends Y/N Y
Source: GGGI
*Time during which the bus driver and conductor break to eat lunch. This break takes place during one of the terminal stops.
** Indicated gradeability is drawn from Google Earth. The maximum gradient of 21% occurs once on the route but this value does
not appear to align with actual road grade. Maximum gradeability is therefore most likely lower. Actual maximum grade should be
verified using on-site instruments.
Table 5.5 Electric bus vehicle specifications
Parameter Unit Specification
Seating capacity no. 30-50
Standing capacity no. 10-20
Average daily distance travelled km 126
Forecast drive range from full charge km 150
Vehicle length m 9-11
Turning circle diameter mm 20,000
Air-conditioning required Y/N N
Energy regeneration capability required Y/N N
Ground clearance mm 230
Source: GGGI

37
Optimization was especially sought on the following
parameters:
• Drive range and battery size – With a one-way trip
length of 17 kilometers, and an average daily
distance of 126 kilometers, electric buses were
sought that could deliver a drive range of around
150 kilometers per day. A drive range beyond this
was excessive to requirements and would result in
unutilized battery capacity, unnecessarily inflating
price.
• Air conditioning and battery size – A non-AC bus is
required. This reduces battery capacity
significantly and therefore the price of the vehicle.
However, BYD was only able to offer current off-
the-market models, all of which have AC.
In addition to overall technical specifications of the bus,
discussions with manufacturers explored bus charging
options. There was overall agreement that overnight
charging at reduced preferential night tariffs was optimum.
These slow charging stations would be utilized during the
night (from 10 pm to 5 am) when all the buses are at the
Sajha Yatayat Depot. Since lunch time for each bus operator
(driver and conductor) lasts from between 30 and 45
minutes, overnight charging could be supplemented by fast
charging station installed at one of the terminal stations.
This would allow a top-up charge to be given to the buses.
However, the options proposed below rely solely on
overnight charging. In order to obtain further operational
savings, Sajha Yatayat may wish to consider reducing the
number of charging stations it acquires and using one
station per two buses. This would require consecutive
overnight charging – i.e. each charging station would
charge two buses each night, with each bus requiring 3-4
hours for full charge. An overview of the three bus options,
including price range are presented in Table 5.6 below.
Price includes for delivery of the vehicle to Kathmandu.
Table 5.6 Three electric bus options
Parameter Unit Ashok Leyland BYD
VEHICLE
Model Circuit K9 K7
Seating capacity no. 32 44 (2 wheelchair) 25 (2 wheelchair)
Drive range km 120 260 230
Gradeability % - 18% 17%
Vehicle length m 9 12 8
Air-conditioning Y/N N Y Y
Battery life yrs - 12 years* 12 years*
Battery type - Iron Phosphate Iron Phosphate
Battery capacity kWh - 324 kWh 197 kWh
Estimated price61 NPR 43 million
(USD 389,105)
31 million
(USD 272,374)
23 million (USD
224,748)
CHARGING FACILITY
Method Overnight Overnight Overnight
Charging capacity kWh - 80 kWh 80 kWh
Charging time hrs - 3-4 hours 3-4 hours
Service center in KTM No Yes Yes
Estimated price NPR 2 million
(USD 18,000
2 million
(USD 18,000)
2 million
(USD 18,000)
Source: GGGI, BYD and Ashok Leyland
* Per BYD warranty
61 This does not include VAT as the operators are eligible for a VAT refund after purchase of the electric buses

38
5.6 Engagement with Bus Manufacturers
A series of meetings with current and potential electric bus
manufacturers from Korea, India and China were carried
out to discuss specifications and viability of buses for the
market in Nepal. The list of manufacturers that were
consulted are presented in Table 5.7 below.
Table 5.7 Electric bus manufacturers consulted
Manufacturers Country
KPIT India
Tata India
Ashok Leyland India
BYD China
Hyundai Korea
Woojin, Korea
Daewoo Korea
TGM Korea
Ashok Leyland, Tata and KPIT are two manufacturers that
have just started manufacturing electric buses in India. KPIT
has a better grip on hybridizing smaller vehicles, such as
taxis, and is still developing its expertise in producing
electric buses. Ashok Leyland and Tata have also started
producing electric buses that can be customized to local
conditions, but they have not introduced their electric
options in Nepal. BYD, on the other hand, does not provide
any options for customization although its presence has
been growing in Nepal through sales of electric cars. Korean
manufacturers such as Hyundai is producing electric buses
to cater to the domestic market only and has not yet
ventured into the international market, with the possible
exception of China. Woojin, Daewoo and TGM are not
offering electric buses on the international market.
39
Chapter 6
GREENHOUSE GAS EMISSIONS ANALYSIS
6.1 Introduction
Following from the analysis of Sajha Yatayat’s current fleet,
this greenhouse gas analysis explores the emissions
reduction potential of replacing the entire fleet with
electric buses. With Nepal’s electricity generated
exclusively from hydro, the emissions associated with
electricity are effectively zero (disregarding any emissions
associated with construction of hydropower stations, and
distribution infrastructure etc.). As a result, the overall
favorability of switching to electric buses is heightened. In
effect, a switch to electric results in an elimination of GHG
emissions – not just a reduction.
This chapter sets out the key assumptions and data points
underpinning this GHG emissions analysis. It then presents
the key findings of the analysis, including emissions per
vehicle and for the whole fleet. While the financial analysis
in the next chapter works on a timescale of vehicle lifetime,
in this chapter, the analysis is yearly. The environmental
and social costs of these GHG emissions, as well as
particulate matter emissions, are calculated in the next
chapter.
6.2 Assumptions and Data
A range of assumptions structure this analysis, and many
have direct implications on data. These are presented
below. Overall, as much of the operational data as possible
was drawn from the management records kept by Sajha
Yatayat. A preference for data drawn from actual ‘real
world’ performance of vehicles was maintained throughout
62 Soni, A.R., Ballare, S., Chandel, M.K. 2014. Greenhouse gas mitigation
potential of Mumbai’s public transport system. Centre for Environmental
the analysis, over data drawn from test conditions. For
example, the fuel economy of Sajha Yatayat’s fleet is much
higher under test conditions, per manufacturer’s
specification, than for real world conditions on the road in
Kathmandu.
The overall method utilized was of simple extrapolation.
Please refer to Annex 1 for the full analysis. Given that
Kathmandu Metropolitan City maintains no GHG inventory,
and that limited research has been undertaken into GHG
emissions at the city-level, it was not possible to compare
the calculated fleet GHG emissions against a known actual.
Nevertheless, fleet emissions were compared to Indian
examples and found to be broadly aligned in value, namely
diesel bus fleet of the Brihanmumbai Electricity Supply and
Transport (BEST) in Mumbai62 in 2014.
Key data and assumptions were set as follows:
• Total fleet – The total projected fleet expected for
2018, accommodating the planned procurement
of 12 additional buses was taken as the total fleet.
Specifications of these new buses were, at the
time of analysis, still to be determined by Sajha
Yatayat. As a result, averages from the existing
fleet were assumed to apply also to these
anticipated vehicles. As such, the total fleet of 58
vehicles was used in this analysis.
• Average fuel economy of diesel bus – Mileage of
the TATA and Ashok Leyland, under test conditions
were observed to be above 3 km per liters.
However, since the actual mileage is lower, a
weighted average of the mileage of TATA and
Ashok Leyland buses were taken. As such, a fuel
Science and Engineering, Indian Institute of Technology Bombay, Mumbai,
India.

40
economy (mileage) of 2.8 kilometer per liter was
used in this analysis.
• Annual distance travelled of fleet – Considering a
total of 58 buses in the fleet, the total annual
distance travelled by the fleet is taken as 2.5
million km.
• Diesel emission factor – The diesel emission factor
used is 2.79 kg CO2eq per liter of diesel63.
• Upstream and downstream emissions – In
addition, it is important to note that this analysis
does not take into account upstream or
downstream greenhouse gas emissions, for
example associated with the manufacture of diesel
versus electric buses. It considers only emissions
due to fleet operations.
6.3 Greenhouse Gas Emissions Results
Sajha Yatayat’s projected total fleet in 2018 is expected to
emit 2,537 tons of CO2 equivalent on an annual basis (12-
month period). This is a quite significant amount within the
context of Kathmandu.
Table 6.1 Greenhouse Gas Emissions of Fleet
Greenhouse gas emissions (ton CO2
eq)
Diesel Electric
Whole fleet 2,537 0.0
Source: GGGI using data from US EPA (2015) and Sajha Yatayat
As Table 6.1 demonstrates, switching the electric for the
entire fleet would result in a significant reduction in GHG
emissions from traffic in Kathmandu.
This analysis assumes that electricity powering electric
buses in Kathmandu is sourced from hydropower stations
within Nepal. Under this assumption, there are zero
emissions associated with electric buses. However, if other
emissions-intensive means of electricity production were
adopted, the emissions reduction presented in Table 6.1
above would be void. Furthermore, the electricity being
imported from India has a high carbon footprint as it is
being generated from coal-based power plants. If vehicles
are charged with this electricity, the emission reduction
from electric buses would be lower. However, electricity
import from India is estimated to decline as inhouse
hydropower supply increases. With this, it can be safely
assumed that emissions from electric vehicles will decline in
the next couple of years.
Nonetheless, there is clearly a significant advantage to be
had in switching to electric buses. With Nepal’s hydropower
generation capacity expected to rise as new stations come
online, there is significant scope for full adoption of electric.
63 US Environment Protection Agency. 2015. Emission Factors for
Greenhouse Gas Inventories. Center for Corporate Climate Leadership.
https://www.epa.gov/sites/production/files/2015-
11/documents/emission-factors_nov_2015.pdf

41
Chapter 7
TOTAL COST OF OWNERSHIP ANALYSIS
7.1 Introduction
A detailed analysis was undertaken to compare the
maintenance, operational and socio-economic costs of
diesel versus electric buses within the context of
Kathmandu. This financial analysis is expected to support
decision making around the feasibility of pursuing a
broader program of electric mobility within Sajha Yatayat’s
operations. This lifetime cost analysis utilizes a range of
perspectives, and explores costs associated both with the
operation and maintenance of vehicles, as well as the
health and environmental cost of diesel buses. In addition,
the cost of the energy insecurity of diesel buses is also
analyzed with specific reference to the tourism industry.
This analysis is structured by three essential parameters.
Firstly, as identified in Chapter 5, the Lagankhel to
Budhanilkantha Route (route 4), is the most ideal route
upon which to deploy a pilot fleet of electric buses. The
specifics of this route have been utilized in the following
analysis. Secondly, the analysis was conducted for a single
bus. This allows for direct diesel bus versus electric bus
comparison, on a per unit basis. Thirdly, the time scale
under consideration is the life of the bus, which for both
electric and diesel buses is assumed to be ten years (see
Section 7.2 below).
7.2 Data and Assumptions
Data for this analysis was collected from a variety of
primary and secondary sources. Primary data included field
research along the route, to collect specific details of trip
times, passenger numbers, distance travelled and other
data points. Primary data collected by Sajha Yatayat as part
of its operational management was also utilized. Such data
included data on fuel economy, trip quantity, fuel
consumption, fuel cost and other points. Finally, secondary
data from a range of sources was also utilized, especially for
data requirements around emissions factors for particulate
matter and greenhouse gases, external health cost of air
pollution, external health costs of noise pollution, cost of
carbon and tourism related spending.
Key data points and assumptions are outlined below:
• Life of bus – The life of both diesel and electric
vehicles was assumed to be ten years. This follows
management and accounting practices within
Sajha Yatayat, which set the life of existing vehicles
at ten years. For the sake of ease of comparison,
this was assumed to be the life of electric buses
also. This is broadly in line with industry averages,
which tend to range of 8-12 years.
• Days of operation – Buses on this route operate
for an average of 29 days per month, some 345
days per year.
• Annual distance travelled – As it travels along the
Lagankhel-Budanilkantha route, a bus travels
about 126.3 km on a daily basis. The average
annual distance traveled by a bus on this route is
estimated at 43,574 km.
• Fuel economy of diesel bus – The fuel economy of
all these buses average to around 2.75 km per liter
of diesel.
• Energy efficiency of electric bus – This was
assumed to be 1.12 kWh/km. This is in line with a
range of international reviews.
• Annual fuel consumed – The average annual diesel
consumed by a bus, considering the average
distance traveled, has been calculated as 15,845
liters.

42
7.3 Lifetime Costs
A major cost component is initial purchase of the vehicle, or
acquisition cost. In Nepal, as in many countries, the price of
an electric vehicle is much higher than an equivalent
conventional ICE vehicle. In Nepal, conventional vehicles
are subject to extremely high customs tax, amounting to
nearly 250% of the value of the vehicle, while for electric
vehicles it is only 10%. This massively favors electric
vehicles. However, for both types of vehicle, if the vehicle is
to be used for public transportation, a customs tax of only
1% is levied, effectively eliminating the fiscal advantage of
going electric in this sector. Prices are specific to buses
running on the nominated route.
Anticipated acquisition costs include:
• Purchase price of diesel bus – The price of an
Ashok Leyland Viking diesel bus, delivered to
Kathmandu is approx. NPR 3.19 million (USD
31,031) in 2016. This includes a 5% customs tax,
5% roads tax, 5% other taxes, 13% VAT and
registration fee.
• Purchase price of electric bus – The price of an
Ashok Leyland Circuit electric bus, delivered to
Kathmandu is NPR 49 million (USD 480,000) in
2017. The price of a BYD K9 electric bus, delivered
to Kathmandu is NPR 37 million (USD 369,000) in
2017. Given that no electric buses have been
imported to Nepal yet, both these prices are
indicative, and based on best estimation by the
manufacturer in question. These prices are
inclusive of the 1% import duty but do not include
13% VAT, as VAT is paid by the consumer and then
later refunded. Electric buses are exempt of road
taxes. In addition, the cost of charging is also
included (cost of one charging infrastructure = USD
18,85764), on a one-to-one basis, as one charging
facility is required per bus (for overnight charging).
In terms of operational and maintenance costs for diesel
and electric buses, these are summarized in Table 7.2
below. The following discussion explores these cost
components in more detail.
Table 7.1 Final acquisition cost of diesel and electric buses
Bus make and model Fuel type Indicative price
(106 NPR)**
Indicative price
(thousand USD)***
Ashok Leyland - Viking Diesel 3.19 29
BYD K7 Battery electric 23 225
BYD – K9* Battery electric 31 298
Ashok Leyland – Circuit* Battery electric 43 416
Source: GGGI. Data drawn from Sajha Yatayat, and through discussion with manufacturers.
* For more information on these two proposed electric bus models please see Annex 2.
**Does not include VAT as the operator is entitled to a VAT refund after purchasing the bus. *** USD 1 = NPR 102.8
Table 7.2 Operational and maintenance costs over lifetime
Cost component Diesel Electric Delta
Lifetime fuel cost (NPR) 13,087,901 2,861,036 10,226,865
Lifetime maintenance cost (NPR) 6,576,587 3,288,293 3,288,293
Total (NPR) 19,664,488 6,149,329 13,515,158
Total (USD)* 191,289 59,818 131,470
Source: GGGI. Data drawn from Sajha Yatayat.
*** USD 1 = NPR 102.8
64 Wang, N. Li, Y. Liu, Y. 2014. Economic Evaluation of Electric Bus Charging
Infrastructure. 17th International Conference on Intelligent Transport
Systems (ITSC). IEEE.

43
• Cost of diesel – Daily average operating cost for
the eight buses plying on the Lagankhel-
Budhanilkantha route in 2017 is just over NPR.
50,000 (USD 486), and daily operating cost for one
bus is estimated as NPR 6,250 (USD 60). Fuel cost
has the highest share (i.e. 41%) of the total
operating cost of a diesel bus (see Figure 7.1).
With this in mind, the average daily fuel cost per
diesel bus was around NPR 22,000 (USD 214)65. In
the analysis that follows, only fuel costs were
compared (see Table 7.2.). Salary, administrative
and other costs were assumed to be constant for
both diesel and electric buses (see Figure 7.1). The
current price of diesel is NPR 74 per liter (USD
0.72). Since the price of diesel has been lower than
NPR 80 in the last two years, the price of diesel
was assumed to increase from NPR 73 to NPR 78
during the 10-year life of an electric bus.
• Cost of electricity –Nepal Electricity Authority has
set time-of-day (ToD) rates for electric vehicles
which increases from NPR 3.7 per unit during the
off-peak hour (23.00 hrs – 05.00 hrs) to NPR 5.6
per unit during the day time (05.00 hrs to 17.00
hrs) and NPR 7 per unit during the peak hour
(17.00 hrs – 23.00 hrs) (NEA, 2017)66. A weighted
average, assuming 80% of the vehicles are charged
during off-peak hours and 10% each during the day
and peak hour, was calculated to arrive at NPR 4.6
per unit (USD 0.04). This has been assumed to be
constant for the 10-year life of an electric bus.
• Maintenance cost of diesel bus – Average annual
maintenance cost for a single bus on this route
was NPR 94,202 (USD 916.36) in 2013/14. This
included both scheduled servicing and
unscheduled maintenance and repairs.
Maintenance spending has risen rapidly since
2013, when operations began: an average annual
growth rate in spending of 106% is observable.
However, this is considered unsustainable.
Maintenance spending as a percentage of asset
value (purchase price) is high in Kathmandu, at
9.6%. This is part due to the quality of roads, and
high levels of congestion. For the purposes of this
analysis, an annual average growth rate in
maintenance spending of 40% was assumed.67 This
yields a total maintenance cost for a diesel bus of
NPR 6,576,587 (USD 63,975) over the lifetime of
the vehicle (see Table 7.2).
• Maintenance cost of electric bus – With far fewer
moving parts, electric buses incur less
maintenance and require fewer repairs. On
average, the cost of maintaining an electric bus is
considered to be around 50% of that of a diesel
bus.68 As such, the annual maintenance cost of an
electric bus on the nominated route is projected to
be around NPR 328,829 (USD 3,199).
Source: Sajha Yatayat
Figure 7.1 Breakdown of the operational cost of a diesel bus69
65 USD 1 = NPR 102.8 66 Nepal Electricity Authority. 2017. Annual Report. 67 Aber, J. 2016. Electric Bus Analysis for New York City Transit. Columbia
University
68 Aber, Ibid. 69 The depreciation rate is 10%
Fuel cost, 41%
Salary for administration,
drivers and conductors, 40%
Miscellaneous cost, 7%
Insurance payments, 3%
Depreciated cost, 9%

44
7.4 Economic, Social and Environmental
Costs
Beyond immediate operational costs, diesel buses also
generate health costs as a result of air and noise pollution
and environmental costs as a result of the emissions of
carbon. In addition, given Nepal’s total dependence on
foreign sources of oil, exacerbated by the fact that the
country is landlocked, and therefore unable to directly
import oil (due to the absence of a sea port), a reliance on
diesel buses generates energy insecurity. This also has a
cost. Below, these costs are explored in turn.
As for operational costs outlined above, the analysis of
economic, social and environmental costs below was
undertaken over a projected ten-year lifetime of a bus.
7.4.1 Economic cost of energy insecurity Nepal imports 100% of its fuel from India. Any fuel supply
disruptions have significant negative impact on the
economy. An example of such a case is the five-month long
fuel supply disruption that occurred at the southern border
of Nepal during 2015/201670. This disruption caused severe
fossil fuel shortages in Kathmandu, and Nepal more
generally, which in turn severely affected services in the
transport sector. With a drop in transport options, as well
as disturbances due to the 2015 earthquakes, the number
of tourists declined by 32% in 2015, compared to that in
2014. As a result, almost NPR 5 billion was lost due to
decrease in tourist arrivals during 2015.
Tourism is one sector that has made significant
contributions to Nepal’s economy in recent years. The
World Travel and Tourism Council (WTWC)71 estimated that
tourism contributed to almost 4.3% and 4.0% of the
country’s GDP in 2014 and 2016, respectively. The number
of tourists have been observed to grow with increasing
quality of facilities provided by the service sector. In
addition to hotels, travel agencies and airlines, a reliable
transport sector also plays a significant role in encouraging
tourists to plan a trip to the country. As such, with
reference to the fossil fuel supply disruption of 2015/2016,
this study analyzes the economic benefits of tourism in
70 Nepal Economic Forum. 2016. Post Disaster Assessment Blockade 2015/2016. Alliance for Social Dialogue 71 World Travel and Tourism Council. 2017. https://www.wttc.org/research/economic-research/economic-impact-analysis/country-reports/ 72 This analysis is carried out with the assumption that major disruptions in fuel supply may occur once every decade 73 World Travel and Tourism Council. 2017. https://www.wttc.org/research/economic-research/economic-impact-analysis/country-reports/ 74 Buekers, J., Holderbeke, M.V., Blerkens, J.G.E.A., Panis L. 2014. Health and environmental benefits related to electric vehicle introduction in EU countries.
Transportation research Part D Transport and Environment. 75 Sen, A.K., Tiwari, G., Upadhyay, V. 2010. Estimating marginal external costs of transport in Delhi. Transport Policy; 17:27-37. 76 Sengupta, R.P., Mandal, S., 2002. Health Damage Cost of Automotive Air Pollution: Cost–Benefit Analysis of Fuel Quality Upgradation for Indian Cities.
Research Study for National Institute of Public Finance & Policy, New Delhi.
Nepal due to stable electric transport services. Such
services, by being electric, would be impervious to fossil
fuel supply disruptions.72 Such a disruption was assumed to
take place on average once every 10 years. Specifically, the
introduction of electric buses in the public transport sector
in Kathmandu would lead to increased energy security and
as a result, provide sustained benefits to the economy.
Specifically, this analysis accepted that fossil fuel supply
disruptions and other disturbances would reduce tourist
numbers, but that 20% of tourists (some 17,100 visitors)
would still visit Kathmandu if the metropolitan area was
serviced by electric buses, making travel around the city
fluent. From data drawn across 2014-2016, a typical tourist
spends an average of 12.44 days in Nepal, and NPR 4410
(USD 44) per day73. As such, with 17,100 visitors still making
the trip to Kathmandu, supported by electric bus transport
services, total spending that would accrue to the economy
amounts to NPR 938,112,840 (USD 9 million). To support
these tourists, 90 electric buses would be required in daily
service, making a per bus contribution to the economy of
NPR 10,393,303 (USD 101,102).
7.4.2 Social cost of air and noise pollution Air and noise pollution from a diesel bus are significantly
higher compared to an electric bus. The analysis considers
both components below.
In terms of air, air quality in Kathmandu has been observed
to be at alarming levels in the past few years. Several
causes have been identified for this increase in air pollution
levels in the valley, out of which rapid motorization and
ineffective management of public transport systems have
been identified to contribute significantly to the degrading
air quality. Fossil fuel vehicles are the main causes of high
levels of PM emissions within the country. Beuker’s et al.
(2014)74 state that 100% of the external costs of PM are
related to health effects. PM emissions can chronically
sicken or even kill significantly more people than other
pollutants that come out of the exhaust of fossil fuel
vehicles75. Sengupta and Mandal (2002)76 emphasize that
numerous studies have outlined that as the size of particles
become smaller, their effect becomes more lethal. In
addition, health costs associated with one kg of PM
45
emissions in Delhi, India was used to calculate health costs
in Nepal. This health costs are estimates of lost work days,
restricted activity, tolerating certain symptoms of illness,
value of life, etc.77. This cost in Nepal was then multiplied
with the total PM emissions from a single diesel bus to
arrive at an overall value that reflected health costs due to
PM emissions from a bus78. Since there are zero PM
emissions from electric buses, this health cost will be saved
if a diesel bus is replaced by an electric bus. The cost of PM
emissions on health is estimated to be NPR 4,611,619
(USD44,860) during the 10-year life of an electric bus.
In terms of noise, noise pollution from transport also has a
high negative impact on health. At low speeds (i.e., 20 -25
mph, approx. 32 – 40 kph), the difference in noise levels
between an electric bus and a diesel bus is substantial. This
high level of noise from diesel buses can cause acute
myocardial infraction, stroke, dementia and annoyance.
Government of UK (2013)79 has estimated cost per
household of a single decibel increase in noise levels from
road transport. From this data, the cost of change in noise
levels from 30 db to 77 db was estimated. This value was
then adapted to conditions in the Lagankhel –
Budhanilkantha route in Kathmandu. Total savings from
decrease in noise levels from 77 db to 30 db when switched
to an electric bus is NPR. 7,721,415 (USD 75,111).
The total social cost due to air and noise pollution, as
indicated above, is around NPR 11,723,683 (USD 114,043)
over the lifetime of a diesel bus.
7.4.3 Environmental cost of carbon
The emission of greenhouse gas, as explored in Chapter 6,
shows that the total fleet of Sajha Yatayat is estimated to
have a significant amount of annual emissions, which has
high environmental cost. A carbon tax is typically
introduced to internalize the external costs of carbon
emitted in different sectors, including the transport sector.
Carbon tax plays a significant role in regulating GHG
emissions from different energy intensive sectors around
the world. There are numerous advantages to introducing
carbon tax, which include encouraging alternative and
more efficient energy systems, raising revenue and leading
to socially efficient outcomes. In case of Nepal, there are
no carbon taxes being levied on emissions in any of the
sectors yet. The carbon tax benefit is estimated with the
assumption that a global carbon tax exists where Nepal can
trade. Also, it has been assumed that the value of carbon
tax may increase in the 10-year life of an electric bus. Thus,
in this study, the carbon tax levied on emissions from the
transport sector has been assumed to increase from USD
40 per ton in year 1 to USD 80 per ton in year 10 as most
countries around the world imposed carbon taxes in this
range.
Since there are no tail-pipe emissions from electric buses,
the study shows that replacing a single diesel bus by an
electric bus will incur savings of NPR 3,338,927 (USD
32,479) during the 10-year life of the bus.
7.5 Summary of Total Lifetime Cost Analysis
Based on the above analyses, the cumulative lifetime costs
of electric buses can be compared to the cumulative
lifetime costs of diesel buses. The results favor BYD’s K7, at
39% lower cost than diesel.
Although the acquisition cost of diesel buses is significantly
lower when compared to electric buses, its social,
economic, environmental, along with operation and
maintenance costs outweigh the total cost of electric buses
(see Figure 7.2). Tables 7.3 and 7.4 below summarize these
results for each of the proposed bus types
As Figure 7.2 clearly demonstrates, the electric bus options
are significantly cheaper over the total lifetime of the
vehicle, accounting for all mayor direct and indirect costs.
The costs of diesel buses, to the operator and to society,
the environment and the economy, far exceed the costs of
electric buses. As such, although the acquisition cost of
diesel buses is significantly lower when compared to
electric buses, its social, economic, environmental, along
with operation and maintenance costs make it an inferior
choice. Of the electric bus options, the BDY K7 bus is almost
half the cost of the current diesel buses deployed by Sajha
Yatayat. These cost differentials are explored in Tables 7.3,
Table 7.4 and Table 7.5 below.
77 Delucchi, M.A., 2000. Environmental externalities of Motor Vehicles Use
in the US. Journal of Transport Economics & Policy 34 (2), 135–168 78 Note: PM emission factor was adopted from a study by Bajracharya and
Bhattarai, 2016. http://media-energy.com.np/wp-
content/uploads/2016/05/iswor-Bajcharye.pdf
79 Government of UK. Study Available at https://www.gov.uk/noise-
pollution-economic-analysis. 2013.

46
Table 7.3 Summary of costs electric (K7) vs. diesel bus
Cost (NPR)
Cost component Diesel (Viking) Electric (K7)** Delta
Acquisition cost*** 3,198,345 23,104,100 -19,905,755
Lifetime fuel cost 13,087,901 2,861,036 10,226,865
Lifetime maintenance cost 6,576,587 3,288,293 3,288,293
Economic cost 10,393,303 - 10,393,303
Social cost 11,723,683 - 11,723,683
Environmental cost 3,338,927 - 3,338,927
Total (NPR) 48,318,746 29,253,429 19,065,317
Total (USD)* 470,027 284,566 185,460
Source: GGGI.
*USD 1 = NPR 102.8. ** ‘-’ here denotes a negligible value.
*** Acquisition cost is exclusive of VAT as the operator is eligible for a VAT refund after purchase of the electric bus
Table 7.4 Summary of costs electric (K9) vs. diesel bus
Cost (NPR)
Cost component Diesel (Viking) Electric (K9)** Delta
Acquisition cost*** 3,198,345 30,618,500 -27,420,155
Lifetime fuel cost 13,087,901 2,861,036 10,226,865
Lifetime maintenance cost 6,576,587 3,288,293 3,288,293
Economic cost 10,393,303 - 10,393,303
Social cost 11,723,683 - 11,723,683
Environmental cost 3,338,927 - 3,338,927
Total (NPR) 48,318,746 36,767,829 11,550,917
Total (USD)* 470,027 357,664 112,363
Source: GGGI.
*USD 1 = NPR 102.8. ** ‘-’ here denotes a negligible value
*** Acquisition cost is exclusive of VAT as the operator is eligible for a VAT refund after purchase of the electric bus
Table 7.5 Summary of costs electric (Circuit) vs. diesel bus
Cost (NPR)
Cost component Diesel (Viking) Electric (Circuit)** Delta
Acquisition cost*** 3,198,345 42,738,500 -39,540,155
Annual fuel cost 13,087,901 2,861,036 10,226,865
Annual maintenance cost 6,576,587 3,288,293 3,288,293
Economic cost 10,393,303 - 10,393,303
Social cost 11,723,683 - 11,723,683
Environmental cost 3,338,927 - 3,338,927
Total (NPR) 48,318,746 58,887,829 -569,083
Total (USD)* 470,027 475,563 -5,536
Source: GGGI.
*USD 1 = NPR 102.8. ** ‘-’ here denotes a negligible value
*** Acquisition cost is exclusive of VAT as the operator is eligible for a VAT refund after purchase of the electric bus
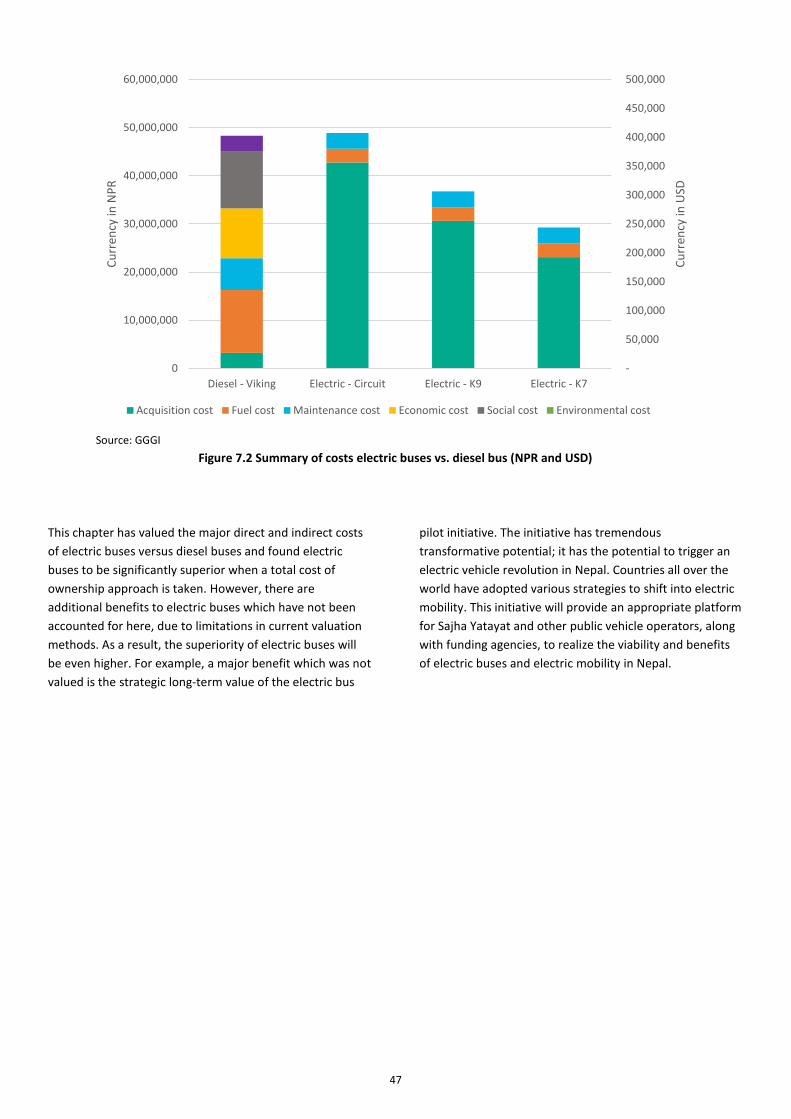
47
Source: GGGI
Figure 7.2 Summary of costs electric buses vs. diesel bus (NPR and USD)
This chapter has valued the major direct and indirect costs
of electric buses versus diesel buses and found electric
buses to be significantly superior when a total cost of
ownership approach is taken. However, there are
additional benefits to electric buses which have not been
accounted for here, due to limitations in current valuation
methods. As a result, the superiority of electric buses will
be even higher. For example, a major benefit which was not
valued is the strategic long-term value of the electric bus
pilot initiative. The initiative has tremendous
transformative potential; it has the potential to trigger an
electric vehicle revolution in Nepal. Countries all over the
world have adopted various strategies to shift into electric
mobility. This initiative will provide an appropriate platform
for Sajha Yatayat and other public vehicle operators, along
with funding agencies, to realize the viability and benefits
of electric buses and electric mobility in Nepal.
-
50,000
100,000
150,000
200,000
250,000
300,000
350,000
400,000
450,000
500,000
0
10,000,000
20,000,000
30,000,000
40,000,000
50,000,000
60,000,000
Diesel - Viking Electric - Circuit Electric - K9 Electric - K7
Cu
rren
cy in
USD
Cu
rren
cy in
NP
R
Acquisition cost Fuel cost Maintenance cost Economic cost Social cost Environmental cost

48

49
Chapter 8
OPTIONS FOR LOCAL MANUFACTURING
8.1. Introduction
Given Nepal’s electricity production potential (see Box 6.1),
the high economic cost of energy insecurity resulting from
total dependence on foreign sources of oil, and the high
social and environmental costs of continuing to deploy
diesel buses in Nepal, systematic replacement of all forms
of diesel and petrol vehicles by electric vehicles should be a
long-term goal for the country. To support this, Nepal has
the option of strengthening its already existing electric
vehicle manufacturing base, with the objective of locally
producing electric buses, including microbuses, minibuses
and midi-buses. Under the Environment Friendly Transport
Policy, 2015, there is provision for local manufacturing80. As
such, at the highest level, there is government support for
the concept. While additional policy, regulatory and
institutional refinement and work is necessary (see Section
7.6 below), there is clear scope for the possibility of
development.
This chapter explores this possibility. It does this by
reviewing previous experiences with electric vehicle
production in Nepal, before exploring a tentative process
and the proposed requirements of producing electric
vehicles in Nepal. The cost of producing a 9-meter, 20
seater midi-bus is detailed. In addition, supporting and
enabling conditions for such local production are set out.
This chapter was compiled with the support of
consultations electric vehicle operators and investors.
80 Ministry of Physical Infrastructure and Transport. 2015. Environmentally
Friendly Transport Policy 2015. Government of Nepal.
http://www.mopit.gov.np/uploads/files/policies&directives/
Watawaranmaitri%20Sawari%20tatha%20Yatayat%20Niti%202071.pdf.
8.2. Review of Electric Vehicle
Manufacturing in Nepal
There are two examples of electric vehicle manufacturing in
Nepal. The first involved the local assembly of electric
three-wheelers in Kathmandu during 1993-2011. This small
industry saw the production of 721 electric vehicles during
this period. The industry was initiated by Global Resources
Institute, as an electric vehicle program in Kathmandu
during 1993-1996. The initiative produced a fleet of eight
electric three-wheelers or safa tempos, as they are locally
known. On the strength of this, and recognizing the
business opportunity of local production, five
manufacturers namely, Nepal Electric Vehicle Industry,
Electric Vehicle Company, Green Electric Vehicle, Green
Valley and Bagmati Electricals produced a total of 714 safa
tempos from 1996-2011, an average of 47 a year. Most of
these safa tempos are still deployed on the streets of
Kathmandu.81
The initial pilot of eight vehicles involved importing all parts
required to produce the electric three-wheelers. However,
in 2000, four years of private sector manufacturing began,
local industry began manufacturing the required parts for
the safa tempos, increasing production of vehicles and
holding down cost. As a result, in 2011, the central
government moved to restrict three-wheeler registration,
citing issues of congestion on the smaller tertiary routes
that safa tempos tend to ply. Since 2011, the total number
of registered safa tempos in Nepal has remained fixed at
714. In this way, the industry, was a victim of its own
81 Global Resources Institute. 2006. Electric Vehicles in Kathmandu. Global
Resources institute (GRI). http://www.grilink.org/ktm.htm-

50
success. Initially parts were imported, however, the process
evolved to include local production of parts for assembly.
The second experience is more recent, involving electric
two-wheelers and rickshaws. Tailg is a Chinese company,
producing electric scooters and electric bicycles in China for
both domestic and international sale. The company is
expanding heavily and is seeking to increase international
production and sales of its products.82 As part of this, Tailg
Nepal has established an assembly unit in Gothatar, on the
outskirts of Kathmandu. As of October 2017, the company
has assembled and sold 22 electric rickshaws and is still in
the process of an assembly system for electric scooters.83
Both these examples demonstrate scope for development
of the local electric vehicle manufacturing industry. In the
case of electric buses, the scope for development is both a
function of financing and government policy, as well as
local demand.
8.3. Estimated Demand for Electric Buses
There has been no research into the size of the demand for
electric buses in Nepal. However, this report assumes that
national demand for diesel buses is a viable proxy or
indicator of national demand for electric buses. This
assumption is consistent with the overall logic of this report
and analysis, which is that electric buses are feasible,
indeed preferable, replacements to diesel buses. As such,
trade and customs data showing import numbers for diesel
buses are presented below.
Using data from 1990 – 2017, the total number of diesel
buses of all categories operating in Nepal is growing at an
annual rate of 10%, as showing in Figure 8.1. This gives an
average import volume of some 1655 units per year.
Driving this trend is overall population growth and
socioeconomic development, as well as urbanization, which
generates demand for commuter (intra-city) public
transport, and tourism growth, generating inter-city bus
transport demand.
Source: Department of Transport Management, 201784
Figure 8.1. Number of registered buses in Nepal (cumulative) (1990 – 2017)
82 China Daily. 2017. “TAILG plugs right into Belt and Road opportunities”,
in China Daily. Accessed at http://usa.chinadaily.com.cn/epaper/2017-
05/09/content_29267407.htm
83 Following phone interviews with Tailg Nepal representatives undertaken
by GGGI 84 DoTM. 2017. Vehicle Registration Data. Department of Transport
Management.
0
5000
10000
15000
20000
25000
30000
35000
40000
45000
50000
19
90
19
91
19
92
19
93
19
94
19
95
19
96
19
97
19
98
19
99
20
00
20
01
20
02
20
03
20
04
20
05
20
06
20
07
20
08
20
09
20
10
20
11
20
12
20
13
20
14
20
15
20
16
20
17
Nu
mb
er o
f b
use
s
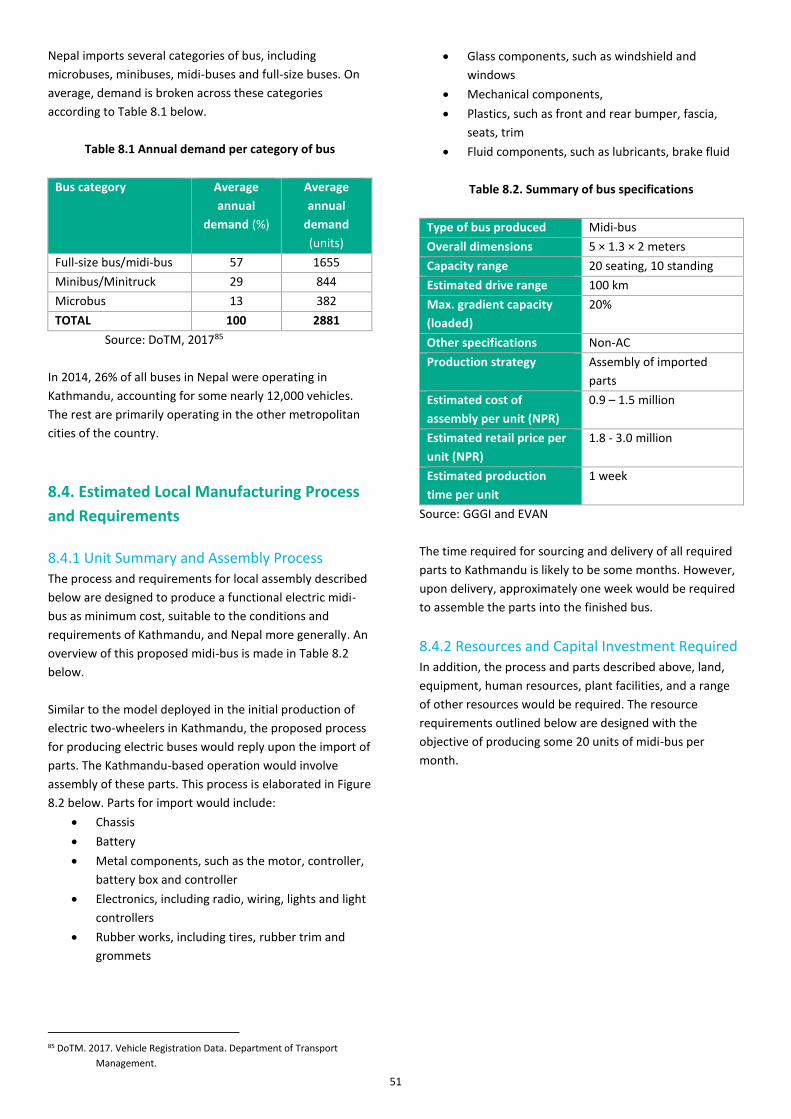
51
Nepal imports several categories of bus, including
microbuses, minibuses, midi-buses and full-size buses. On
average, demand is broken across these categories
according to Table 8.1 below.
Table 8.1 Annual demand per category of bus
Bus category Average
annual
demand (%)
Average
annual
demand
(units)
Full-size bus/midi-bus 57 1655
Minibus/Minitruck 29 844
Microbus 13 382
TOTAL 100 2881
Source: DoTM, 201785
In 2014, 26% of all buses in Nepal were operating in
Kathmandu, accounting for some nearly 12,000 vehicles.
The rest are primarily operating in the other metropolitan
cities of the country.
8.4. Estimated Local Manufacturing Process
and Requirements
8.4.1 Unit Summary and Assembly Process The process and requirements for local assembly described
below are designed to produce a functional electric midi-
bus as minimum cost, suitable to the conditions and
requirements of Kathmandu, and Nepal more generally. An
overview of this proposed midi-bus is made in Table 8.2
below.
Similar to the model deployed in the initial production of
electric two-wheelers in Kathmandu, the proposed process
for producing electric buses would reply upon the import of
parts. The Kathmandu-based operation would involve
assembly of these parts. This process is elaborated in Figure
8.2 below. Parts for import would include:
• Chassis
• Battery
• Metal components, such as the motor, controller,
battery box and controller
• Electronics, including radio, wiring, lights and light
controllers
• Rubber works, including tires, rubber trim and
grommets
• Glass components, such as windshield and
windows
• Mechanical components,
• Plastics, such as front and rear bumper, fascia,
seats, trim
• Fluid components, such as lubricants, brake fluid
Table 8.2. Summary of bus specifications
Type of bus produced Midi-bus
Overall dimensions 5 × 1.3 × 2 meters
Capacity range 20 seating, 10 standing
Estimated drive range 100 km
Max. gradient capacity
(loaded)
20%
Other specifications Non-AC
Production strategy Assembly of imported
parts
Estimated cost of
assembly per unit (NPR)
0.9 – 1.5 million
Estimated retail price per
unit (NPR)
1.8 - 3.0 million
Estimated production
time per unit
1 week
Source: GGGI and EVAN
The time required for sourcing and delivery of all required
parts to Kathmandu is likely to be some months. However,
upon delivery, approximately one week would be required
to assemble the parts into the finished bus.
8.4.2 Resources and Capital Investment Required In addition, the process and parts described above, land,
equipment, human resources, plant facilities, and a range
of other resources would be required. The resource
requirements outlined below are designed with the
objective of producing some 20 units of midi-bus per
month.
85 DoTM. 2017. Vehicle Registration Data. Department of Transport
Management.

52
Source: Adapted from Global Asset Protection Services, 201586
Figure 8.2. Proposed assembly process
Requirements include:
• Land requirements – Total land required to
establish a viable assembly unit is estimated at
2500 square meters (some 5 ropani). Facilities
would include steel and body works facility, trim
and final assembly garage, charging station, and
offices.
• Equipment requirements – A range of tools and
equipment would be required including general
tools; grinder, drill and cutting tools; tools used for
air brakes; welding machines; hydraulic machines.
• Human resource requirements – A total of 22 staff
would be expected to operate and manage the
assembly unit. These include a draft-person,
electrical technicians and engineers, mechanical
engineers and assistants, procurement officer,
maintenance technician, quality control officer,
lathe and milling machine operators, and cleaners.
Overall, the total capital investment is expected to be
around NPR 70 million (USD 670,000). Land, the most-costly
86 Global Asset Protection Services LLC. 2015. Vehicle Manufacturing.
component, is expected to be located outside of
Kathmandu Valley.
Table 8.3. Summary of investment (million NPR)
Component Cost
Land 56
Construction of facilities 12
Tools and machinery 3.5
Total (million NPR) 71.5
Total (USD)* 695,525
Source: EVAN
*USD 1 = NPR 102.8
8.4.3 Per Unit Assembly Cost and Retail Price
The estimated per unit cost of assembly ranges from NPR
0.9 - 1.5 million (USD 8600 – 14500) depending on the size
of the battery being used (see Table 8.4.). The battery
constitutes around 50-60 % of the manufacturing cost,
which is followed by 20-40% body design cost, 10%
controller, 5% motor, 5% transmission and 5% other costs.
Table 8.5 shows the breakdown of the retail price of a bus.

53
Table 8.4 Breakdown of per unit assembly cost (NPR)
Component Lower end
of range
Higher end
of range
Battery 495,000 825,000
Controllers 90,000 150,000
Motor 45,000 75,000
Transmission 45,000 75,000
Body Design 180,000 300,000
Other 45,000 75,000
Total (NPR) 900,000 1,500,000
Total (USD) 8,754 14,591
Source: JMBS, 2012; Cuenca et.al. 1999
*USD 1 = NPR 102.8
Table 8.5 Breakdown of per unit retail price (NPR)
Component Lower end
of range
Higher end
of range
Manufacturer 900,000 1,500,000
Warranty 90,000 150,000
Selling & Admin 360,000 600,000
Overhead 270,000 450,000
Profit Margin 180,000 300,000
Total (NPR) 1,800,000 3,000,000
Total (USD) 17,509 29,182
Source: JMBS, 2012; Cuenca et.al. 1999
*USD 1 = NPR 102.8
8.5. Direct Benefits of Local Manufacturing
The development of such an assembly unit, and the longer-
term goal of systematic manufacture of required parts for
electric buses would deliver a range of immediate and
direct benefits, such as the availability of cheaper electric
buses and improved vehicle servicing. In addition, strategic
benefits of increased industrial independence and
economic development. This does not include indirect
benefits resulting from the wider-spread uptake of electric
vehicles across Nepal, such as improved public health and
reduced carbon emissions.
Direct benefits of local manufacturing include:
• Increased affordability –The use of local
resources, such as labor and raw materials, will
reduce the cost of production, making electric
buses more financially attractive.
87 Ghimire, L.S. 2016. Nepal's Widening Trade Deficit (Some Issues,
Challenges and Recommendations). Economic Management Division: Staff
Discussion Paper. Nepal Planning Commission.
• Generation of local employment – Local
manufacturing plants will generate employment.
This will not only provide opportunities for skills
development in manufacturing but also provide
livelihoods to both skilled and unskilled workers.
• Increased industrial independence – Currently, the
majority of viable electric vehicles available on the
Nepali market, including electric buses, have been
imported from India and China. Local
manufacturing will decrease reliance on other
countries for electric vehicles.
• Increased scope for customization – With local
manufacturing, there are increased options for
local customization at affordable prices, as well as
increased availability of spare parts.
• Improved after-sales vehicle servicing – Local
manufacturing units will have expertise as well as
spare parts available to service the local produced
vehicles. This means the consumer and bus
operator receives improved servicing, potentially
at a lower cost.
• Increased economic development – A stronger
local manufacturing industry will contribute to the
economic development of the Kathmandu Valley,
and Nepal more generally. With a national goal of
becoming a middle-income country by 2030, the
establishment of local manufacturing units could
be valuable.
• Reduced trade deficit long-term - The gap
between import and export in Nepal has
continuously widened during the last two
decades87. Local manufacturing plants can help in
reducing that gap.
8.6. Action for Local Manufacturing
To support local manufacturing, various actions from
government, civil society and the business community are
needed. Increasingly, as Chapter 5 explored, there is a
favorable and robust policy and regulatory environment for
electric vehicles. However, additional action could be taken
to improve the scope of local electric vehicle manufacturing
more specifically. These actions are outlined below:
• Building public-private consensus for local
manufacturing – Greater collaboration and
consensus amongst relevant government bodies
and the business community on the need, benefits
and necessary steps to boost local manufacturing

54
is critical. This can be achieved through greater
dialogue, and high-level discussions, as well as
formalized through private-public commissions.
• Refining the fiscal landscape – Steps in the right
direction to improve the fiscal attractiveness of
shifting towards electric vehicles. These were
highlighted in Chapter 5. However, with specific
reference to local manufacturing, more can be
done. Specifically, spare parts for the assembly of
electric vehicles are leveed with a customs duty
which could be excepted.
• Improving the non-fiscal regulation – Prioritized
registration of locally produced electric buses, for
example, as well as preferential electric tariffs,
would greatly support local manufacturing
companies in promoting their products, as well as
support consumers through reduced operational
costs.
• Establishing quality standards for locally
produced electric buses – Currently, there is no
institution or body tasked with ensuring the
quality of locally produced electric vehicles of any
type. The establishment of such a body would
facilitate consumer trust by a) setting clear
standards to manufacturers; and b) monitoring
and verifying that manufacturers are in
compliance with standards set.
• Establishing a shared procurement channel – A
consortium of manufacturers could jointly procure
batteries and other parts required for the
assembly of electric buses. Such a shared
procurement channel would reduce costs to local
manufacturers, and ultimately the consumer. This
will also help to boost competition in terms of
assembly and retail cost.
• Establishing a battery recycling plant – With
batteries constituting such a large share of the
overall assembly cost of an electric vehicle, a
battery recycling facility could help to extend the
life of batteries and provide recycled batteries for
use in assembly chains, as well as minimize waste.
Customs duty on equipment required for battery
recycling already receives a preferential low rate
of 1%, however, a recycling plant has yet to be
established.

55
Chapter 9
SUMMARY OF FINDINGS AND RECOMMENDATIONS
9.1 Electric Buses are Viable
This study has demonstrated the viability of deploying
electric buses in Kathmandu. Such deployment is feasible
from policy, operational and financial perspectives. As such,
Sajha Yatayat is in a strong position to shift towards
deploying electric buses within its current fleet.
Additionally, the financial viability of electric buses is
expected to increase as the technology becomes cheaper,
and production systems mature. However, this is not an
argument for waiting. Even at current market prices, it is
cheaper for Sajha Yatayat to deploy electric buses than
diesel buses, when major associated costs are internalized.
More broadly, it is cheaper for the society and economy of
Kathmandu, and those institutions that represent the
public interest, to deploy electric buses when compared
against diesel.
9.2 Summary of Key Findings
A summary of the key findings is presented below:
• Technology is increasingly ready and available –
While this report focuses on two most-viable
vendors, namely BYD and Ashok Leyland, other
manufacturers also represent solid options. More
generally, the technology behind electric buses is
becoming more widespread, generating important
economies of scale. As markets grow and
production systems mature, the per unit cost of
electric bus reduces.
• Supportive policy, regulation and politics is in
place – A robust policy and regulatory framework
exists already and is widely supportive of electric
vehicles and sustainable technology. Such support
ranges from the policy and planning level, through
to specific fiscal incentives. In addition, air quality
in metropolitan Nepal has become an important
political issue, with local and national politicians
recognizing and capitalizing on it with promises of
measures for air quality improvements. As such,
while there is certainly scope for further
improvement of policy and regulation, and further
techno-political discussion on the topic, sufficient
progress has been made within this space to
ensure that deployment of electric vehicles by
Sajha Yatayat will be viewed favorably by
government.
• Supportive public is in place – Similarly, the
general public and commuters on Sajha Yatayat’s
current services view electric buses favorably.
During field discussions with both segments, the
trolley buses of the 1970s-2000s were consistently
praised. Most members of the public recognize the
need for zero- or low-emissions vehicles. As such,
there is an already existing very positive public
image associated with electric buses in
Kathmandu. This public image meshes well with
Sajha Yatayat’s current image. If Sajha Yatayat
more assertively adopts electric buses, the
organization would benefit from a boost in public
image accordingly, and effectively capture some of
the goodwill held by the public for the trolley
buses.
• Sajha Yatayat’s cross-city routes are well suited
for electric – Working across several cross-city
routes, Sajha Yatayat’s set-up is well suited for
electric buses. The Lagankhel-Budhanilkantha
route is especially well suited. This 17-kilometer
route follows a reasonable gradient on decent

56
roads, is well populated, and receives steady
ridership at above 4000 passengers per day. Total
distance travelled daily, some 125 kilometers, is
such that most standard electric transit buses can
deliver the required drive-range.
• Greenhouse gas emissions mitigation potential of
electric is considerable - If Sajha Yatayat were to
replace its total projected 2018 fleet of 58 buses
by electric buses, the annual reduction in GHG
emissions would be 2,537 tons of CO2e. Per bus
annual emissions savings would be 43 tons of CO2e
This quantity of savings contributes to reducing
GHG emissions from the transport sector, as well
as reducing air and noise pollution.
• Switching to electric brings lifetime financial
advantages – While the initial upfront price of an
electric bus is higher than that of a diesel bus, over
its total lifetime, electric buses are cheaper by
some 24-39%. Total costs to be considered include
the acquisition cost of the vehicle (i.e. its price),
and the higher operational (fuel) and maintenance
costs of diesel. The operation and maintenance
costs of an electric bus is over 60% lower than that
of a diesel bus. Similarly, there are higher
economic, social and environmental costs
associated with diesel. The energy insecurity of
diesel costs the economy around NPR 13,087,901
(USD 273,394) over the lifetime of the single bus.
Healthcare and productivity costs associated with
air and noise pollution cost society around NPR
11,723,683 (USD 101,102) per diesel bus over its
lifetime. And the carbon emitted by a diesel bus
over its lifetime costs the environment around
NPR 3,338,927 (USD 32,479). All these costs add
up, to make electric buses 24-39% cheaper than
diesel over the life of the vehicle.
• BYD’s K7 electric bus is the cheapest lifetime
option, cheaper than current diesel – Of course,
the cost and performance of electric buses vary. Of
the two main manufacturers expressing interest in
delivering electric buses to market in Kathmandu,
namely BYD and Ashok Leyland, the results of the
BYD K7 bus was superior. It was some 40 per cent
cheaper, overall, when compared with the Ashok
Leyland electric bus, and it had a better drive
range and included AC.
• Local manufacturing of electric buses is financially
feasible - Establishing electric bus manufacturing
facilities in Nepal is an option that can
substantially decrease acquisition cost of electric
buses, increase access to spare parts, facilitate
localized vehicle customization, stimulate the
economy and decrease trade deficits. Moving
ahead with local manufacturing requires both
government and private sector action. Namely,
commitment of electric bus demand (market) from
bus and transit operators, and commitment of
resources for production from the government
and private sector.
9.3 Recommendations and Next Steps
As a result of the findings outlined above, this report
recommends that:
In terms of operation:
• Sajha Yatayat initiate a process of procurement of
a micro-fleet of electric buses (some five units),
through which cheaper prices for the electric
models identified may be obtained.
• Sajha Yatayat consider securing dedicated charging
facility space within its terminal stations or within
its central bus depot, depending on the final
charging strategy pursued.
• Sajha Yatayat consider investing in training of its
existing engineers and technicians to service
electric buses.
• Sajha Yatayat initiate discussions with the Nepal
Electricity Authority on the possibility of
collaboration for low-tariff charging.
• Sajha Yatayat, upon deploying electric buses in its
fleet, maintain datasets specific to the electric
buses to ensure adequate monitoring and benefit
optimization.
In terms of financing:
• Sajha Yatayat, the Ministry of Finance and the
Ministry of Population and Environment, explore
methods or strategies by which financing from the
national pollution fund might be mobilized to
support increased electric bus acquisition.
• Sajha Yatayat and the Kathmandu Municipal
Corporation, explore the possibility of apply for
financing by the Town Development Fund.
• Sajha Yatayat, the Ministry of Physical
Infrastructure and Transport, the Kathmandu
Municipal Corporation, and GGGI, explore
financing opportunities with international donors,
including green and climate financing sources.
In terms of manufacturing:
• The Department of Transport Management
consider active support for local manufacturing of
electric buses.
• Sajha Yatayat, in collaboration with private sector,
explore committing to demand for electric buses,
to support investment in manufacturing facilities

57

58
References
Aber, J. 2016. Electric Bus Analysis for New York City
Transit. Columbia University.
Asian Development Bank. 2013. Sector Assessment
(Summary): Transport and Information and
Communication Technology. Country Partnership
Strategy.
ADB. 2016. Transport Sector Assessment: Country
Partnership Strategy.
Bajracharya and Bhattarai. 2016. ‘Road Transportation
Energy Demand and Environmental Emission: A
Case of Kathmandu Valley’ in Hydro Nepal, no. 18,
January 2016 p. 30-40.
Buekers, J., Holderbeke, M.V., Blerkens, J.G.E.A., Panis L.
2014. Health and environmental benefits related
to electric vehicle introduction in EU countries.
Transportation research Part D Transport and
Environment.
Central Bureau of Statistics. 2014. Nepal Public Land
Transport Survey 2013. National Planning
Commission Secretariat.
China Daily. 2017. “TAILG plugs right into Belt and Road
opportunities”, in China Daily. Accessed at
http://usa.chinadaily.com.cn/epaper/2017-
05/09/content_29267407.htm
Delucchi, M.A., 2000. Environmental externalities of Motor
Vehicles Use in the US. Journal of Transport
Economics & Policy 34 (2), 135–168
Department of Transport Management. 2015. Vehicle
registration data. Ministry of Physical
Infrastructure and Transport
EPI. 2016. Environmental Performance Index 2016. Yale
University.
http://epi.yale.edu/sites/default/files/2016EPI_Ful
l_Report_opt.pdf
European Rare Earth (Magnet) Recycling Network. 2014. Rare earths in energy storage and conversion (2014). http://erean.eu/wordpress/2014/10/
Ghimire, L.S. 2016. Nepal's Widening Trade Deficit (Some
Issues, Challenges and Recommendations).
Economic Management Division: Staff Discussion
Paper. Nepal Planning Commission.
Government of UK. Study Available at
https://www.gov.uk/noise-pollution-economic-
analysis. 2013.
Global Asset Protection Services LLC. 2015. Vehicle
Manufacturing.
Global Green Growth Institute. 2014. “Green Growth
Strategy for Karnataka.” Case Studies.
http://gggi.org/wp-
content/uploads/2014/12/Karnataka-GG-Case-
Studies_FINAL_Web-Version.pdf
Global Green Growth Institute, 2015. Electric Buses in India:
Technology, Policy and Benefits
Global Resources Institute. 2006. Electric Vehicles in
Kathmandu. Global Resources institute (GRI).
http://www.grilink.org/ktm.htm-
Greenstone, Michael, Janhavi Nilekani, Rohini Pande,
Nicholas Ryan, Anant Sudarshan, and Anish
Sugathan. 2015. “Lower Pollution, Longer Lives,
Life Expectancy Gains If India Reduced Particulate
Matter Pollution.” Economic & Political Weekly.
Lajunen, Antti. 2015. “Evaluation of Electric Buses.” Alto
University. http://www.ecv.fi/@Bin/211333/ECV-
seminaariesitys_10-3-2015_Evaluation-of-
EBuses_Antti-Lajunen.pdf
Mehrdad Ehsani et al., Modern electric, hybrid and fuel cell vehicles, fundamentals, theory and design.
Ministry of Environment. 2011. Climate Change Policy.
Government of Nepal.
Ministry of Finance. 2016. Budget Speech 2016/17.
Government of Nepal.
Ministry of Physical Infrastructure and Transport. 2015.
Environmentally Friendly Transport Policy 2015.
Government of Nepal.

59
http://www.mopit.gov.np/uploads/files/policies&
directives/
Watawaranmaitri%20Sawari%20tatha%20Yatayat
%20Niti%202071.pdf.
Ministry of Physical Planning and Works. 2001. National
Transport Policy. Department of Roads. MoPPW,
Government of Nepal.
Ministry of Population and Environment. 2016. Nationally
Determined Contribution. Communicated to United
Nations Framework Convention on Climate Change,
Ministry of Population and Environment (MoPE).
Government of Nepal (GoN)
Ministry of Science Technology and Environment. 2012.
National Ambient Air Quality Standard.
Ministry of Urban Development. 2017. National Urban
Development Strategy 2017, Nepal. Urban
Development and Physical Planning Division.
Ministry of Urban Development (MoUD).
Government of Nepal (GoN).
M.J. Bradley & Associates LLC. n.d. “Comparison of Modern
CNG, Diesel and Diesel Hybrid-Electric Transit Buses:
Efficiency & Environmental Performance.”
http://mjbradley.com/sites/default/files/CNG%20Die
sel%20Hybrid%20Comparison%20FINAL%2005nov13
.pdf.
Nepal Economic Forum. 2016. Post Disaster Assessment
Blockade 2015/2016. Alliance for Social Dialogue.
Nepal Electricity Authority. 2016. Annual Report.
Nepal Oil Corporation. 2016. Sales of Petroleum Products.
http://www.nepaloil.com.np/import-and-sales-
22.html
Nepal Oil Corporation. 2017. Oil prices.
Nepal Planning Commission. 2015. Sustainable
Development Goals 2016-2030. National
(Preliminary) Report. National Planning Commission
(NPC). Government of Nepal.
http://www.npc.gov.np/images/category/23rd_Jan_
final_for_print_Sustainable_DevelopmentGoals1.pdf
Noel, Lance, and Regina McCormack. 2014. “A Cost Benefit
Analysis of a V2G-Capable Electric School Bus
Compared to a Traditional Diesel School Bus.”
Applied Energy.
http://www.udel.edu/V2G/resources/V2G-Cost-
Benefit-Analysis-Noel-McCormack-Applied-Energy-
As-Accepted.pdf.
NPC. 2015b. Nepal earthquake 2015. Post Disaster Needs
Assessment, Vol. A: Key Findings. National Planning
Commission.
http://www.un.org.np/sites/default/files/PDNA-
volume-B.pdf
NPC. 2017. Fourteenth Three Year Plan 2073/74-75/76.
National Planning Commission. Government of
Nepal.
NRB. 2017. Summary of Monetary Policy for Fiscal Year
2074/75. Nepal Rastra Bank, Nepal.
OECD. 2016. The economic consequences of outdoor air
pollution. Policy Highlights. Organisation for
Economic Co-operation and Development.
https://www.oecd.org/environment/indicators-
modelling-outlooks/Policy-Highlights-Economic-
consequences-of-outdoor-air-pollution-web.pdf
Rose, Jason C, and Michael A Staiano. 2007. “A Comparison
of Green and Conventional Diesel Bus Noise
Levels.” In . Reno, Nevada.
http://staianoengineering.com/images/NC07_Ross
_Staiano_-
_A_comparison_of_green_and_conv.pdf.
Sen, A.K., Tiwari, G., Upadhyay, V. 2010. Estimating
marginal external costs of transport in Delhi.
Transport Policy; 17:27-37.
Sengupta, R.P., Mandal, S., 2002. Health Damage Cost of
Automotive Air Pollution: Cost–Benefit Analysis of
Fuel Quality Upgradation for Indian Cities. Research
Study for National Institute of Public Finance &
Policy, New Delhi.
Shakya, K.M., Rupakheti, M., Shahi, A., Maskey, R.,
Pradhan, B., Pandey, A., Puppala, S., Lawrence, M.,
Peltier, R. 2017. Near-road sampling of PM2.5, BC,
and fine-particle chemical components in
Kathmandu Valley, Nepal. Atmospheric Chemistry
and Physics; 17: 6503-6516.
Soni, A.R., Ballare, S., Chandel, M.K. 2014. Greenhouse gas
mitigation potential of Mumbai’s public transport
system. Centre for Environmental Science and
Engineering, Indian Institute of Technology Bombay,
Mumbai, India.
Truckaurbus.com. 2015. “Tata Starbus 32 AC (BS4), ₹
20,19,000.” August 23.
http://www.truckaurbus.com/new-
cv/tata/starbus/tata-starbus-32-ac-bs4-8377-20-19-
000-l1232.html
United Nations Centre for Regional Development, 2015.
National Sustainable Transport Strategy. Ministry of
Physical Infrastructure and Transport (MOPIT), Nepal
Ministry of the Environment (MOE), Japan United
Nations Economic and Social Commission for Asia
and the Pacific (UN ESCAP).
US Environment Protection Agency. 2015. Emission Factors
for Greenhouse Gas Inventories. Center for
Corporate Climate Leadership.
https://www.epa.gov/sites/production/files/2015-
11/documents/emission-factors_nov_2015.pdf
Wang, N. Li, Y. Liu, Y. 2014. Economic Evaluation of Electric
Bus Charging Infrastructure. 17th International
Conference on Intelligent Transport Systems (ITSC).
IEEE.

60
WHO. 2016. Ambient air pollution: A global assessment of
exposure and burden of disease. World Health
Organization.
http://apps.who.int/iris/bitstream/10665/250141/1/
9789241511353-eng.pdf?ua=1
World Travel and Tourism Council. 2017.
https://www.wttc.org/research/economic-
research/economic-impact-analysis/country-reports/
World Bank. 2016. The Cost of Air Pollution. Strengthening
the Economic Case for Action.
http://documents.worldbank.org/curated/en/78152
1473177013155/pdf/108141-REVISED-Cost-of-
PollutionWebCORRECTEDfile.pdf
World Bank. 2017. CO2 emissions (kt). Carbon Dioxide
Information Analysis Center, Environmental Sciences
Division, Oak Ridge National Laboratory, Tennessee,
United States.
https://data.worldbank.org/indicator/EN.ATM.CO2E.
KT?locations=NP

61
62
Annex 1 – Case Study Cities
A. Electric Bus Initiative in the State of
Karnataka
Background Karnataka is the eighth most populous state in India,
located in the southwest of the country. There is a high
demand for mobility in the state. Road transport passenger
demand was 180 billion passenger kilometers in 2010, out
of which the passenger transport demand in urban areas
like Bangalore was 100 billion passenger kilometers. A
fourfold increase in demand for urban transport was
observed in Karnataka during the last 20 years.88
Although the diesel bus fleet under management by
Bangalore Metropolitan Transport Corporation (BMTC) is
serving a large proportion of the population, it is also
contributing significantly to air pollution in the city and
state. Currently, there are more than 65,000 diesel buses in
Bangalore being managed by BMTC, accounting for some
30% of the total particulate matter emissions in the city in
2010. It is estimated that the city has faced 1.7% loss in
GDP due to air pollution from fossil fuel vehicles.89
Pilot Electric Bus Initiative Owing to the high pollution caused by diesel buses in
Bangalore, BMTC piloted a single electric bus for three
months in 2014 to assess its direct and secondary monetary
benefits.90 Although this pilot project proved the viability of
the vehicle, and the technology benefits of going electric, as
well as received wide-spread consumer approval, its high
88 GGGI 2014. Green Growth Strategy for Karnataka. 89 Ibid. 90 https://www.mybmtc.com/en/press-release/approval-induction-150-
electric-buses 91 1 USD = INR 65.17
acquisition cost of INR 30 million (USD 460,334)91 and lack
of charging infrastructure posed a hindrance to further
uptake of electric buses.
However, the Fast Adoption and Manufacturing of Electric
Vehicles (FAME) scheme under the National Electric
Mobility Mission Plan introduced in April 2015,92 provided
incentives for BMTC to increase the size of electric bus
fleet. The FAME scheme93 is designed to provide financial
incentives for technology development, demand creation,
pilot projects and charging infrastructure boosting growth
in electric and hybrid vehicle adoption across India.
As a result, the BMTC partnered with the Global Green
Growth Institute to analyse and support greater adoption
of electric buses into the fleet. Part of this analysis included
a review of benefits of switching to electric. In the case of
Bangalore, the social benefit (i.e. improvement in public
health) of replacing one diesel bus with an electric bus was
estimated to be valued at INR 22.7 (USD 34,947).94 In
addition, the operation of pilot electric bus showed that
noise levels decreased by 21%. There was also a decrease in
the average maintenance and operation cost of the electric
bus by 64% each when compared to the diesel bus.
Current Situation
As a result of these strong benefits and sound financial
sense, BMTC initiated a formal procurement process for an
additional 150 electric buses. Currently, the procurement
team is exploring customization of the vehicles for
92 http://www.dnaindia.com/business/report-faster-adoption-and-
manufacturing-of-electric-vehicles-in-2513405 93 A total of INR 1.97 billion (USD 30,2 million) was allocated for the FAME
scheme in 2015/16 and 2016/17. 94 Global Green Growth Institute, 2014. Green Growth Strategy for
Karnataka: Case Studies.

63
Bangalore specifications. These electric buses are being
partly financed by the FAME scheme.
B. Electric Bus Initiative in the State of
Himachal Pradesh
Background Himachal Pradesh is a state in the far north of India. A hilly
state, it is famed for its tourism and natural landscape.
Similar to Kathmandu, the number of privately owned
vehicles in Himachal Pradesh is increasing at an annual
average rate of 10%. This has led to significant congestion
in the state’s main cities, increasing air pollution and
greenhouse gas emissions. In an effort to combat
congestion and deliver efficient public transport solutions,
Himachal Pradesh has envisioned adding some 1,500 buses
to its fleet95.
Pilot Electric Bus Initiative
An opportunity to shift towards electric buses was
identified and Himachal Pradesh Road Transport
Corporation (HRTC) and the Global Green Growth Institute
partnered to support a pilot initiative. HRTC’s main aim in
introducing electric buses was to reduce greenhouse gas
emissions, promote tourism and increase efficiency and
profits96.
In the case of Himachal Pradesh, where many buses ply
mountainous and hilly routes, at high altitudes in often sub-
zero temperatures, electric buses present many advantages
over diesel buses. Electric buses have far lower
maintenance and repair costs, increasing the percentage
utilization of the vehicle – on average it takes 40 days to
repair a bus in Himachal Pradesh. In addition, electric buses
can operate well even in sub- zero temperatures, such as
those experienced along the Manali-Kullu and Mandi routes
in the state. Previously, the waxing and gelling of diesel in
diesel buses due to low temperatures would incur extra
costs and reduce the efficiency of the buses. Another
benefit of running electric buses in Himachal Pradesh is that
since power generation is predominantly through run-off
river hydropower plants, any excess electricity previously
going to waste can be utilized by electric buses.
For the pilot, Goldstone Infratech Ltd, in partnership with
BYD Auto Industry, developed a sample 25-seater bus for
deployment in Himachal Pradesh. The vehicle, called a
Goldstone eBuzz K7 electric bus, was supplied to HRTC. Two
vehicles were deployed on the Kullu-Manalli-Rohtang pass
route in September 2017.
Current Situation As a result of good performance of the Goldstone eBuzz K7,
HRTC plans to procure an additional fifty units for
deployment on various routes in the state97.
95 GGGI. 2015. Deployment of Electric Buses in Himachal Pradesh: Pre-
feasibility Report 96 https://chandigarhmetro.com/first-electric-bus-service-launched-
himachal-pradesh-india-rohtang-manali/
97 https://chandigarhmetro.com/first-electric-bus-service-launched-
himachal-pradesh-india-rohtang-manali/

64
Annex 2 – Summary of Vendors
Introduction
A number of vendors were engaged in discussions
regarding viable electric bus models for deployment in
Kathmandu. These vendors including the Nepal license
holder of BYD, China; Ashok Leyland, India; the India office
of KPIT, USA; and Hyundai, South Korea. In addition, a
range of other manufacturers were reviewed for
preliminary viability.
As noted in the preceding chapter, the two vendors whose
vehicles were considered most viable - based on a
combination of overall vehicle specifications, vehicle model
availability, price appropriateness, and vendor enthusiasm
– were BYD and Ashok Leyland. The following are brief
summaries of these vendors, and their principal product.
Ashok Leyland, India
Ashok Motors was founded in 1948, becoming Ashok
Leyland in 1955. The company is the second largest vehicle
manufacturer in India, and fourth largest bus manufacturer
in the world, with a turnover of USD 3.3 billion in 2016-17.
Source: Ashok Leyland
Figure A.1. The Circuit by Ashok Leyland
Ashok Leyland developed the first hybrid electric vehicle of
India in 2002. Its first fully battery electric bus, the Circuit,
was developed during 2016 and released to the market in
early 2017 – the first fully electric bus in India. It has a drive

65
range of 120 kilometers, powered by an imported, USA-
produced lithium ion battery. It has a seating capacity of 31.
The vehicle was specifically engineered to India’s roads and
terrain.
Fifty units of the model were sold in 2016, with some 200
units expected to be sold over 2017. The main market so
far has been domestic.
BYD (Build Your Dreams) Auto, China
BYD Auto is a Chinese vehicle manufacturer founded in
2003 in Xi’an, China. It is a subsidiary of BYD Company,
which manufacturers batteries. While the parent company
engages in a diverse range of activities, BYD Auto is
exclusively focused on the manufacture and distribution of
passenger vehicles, buses, trucks and forklifts.
It produced its first mass-produced, plug-in hybrid car in
2008. Since then, it has expanded its fleet of electric vehicle
models, and introduced a line of electric buses in 2010,
which have been extremely popular, both in China and
globally – selling some 1200 units in both 2011 and 2012,
climbing to over 6000 units during 2015. BYD’s was the first
mass-produced pure battery electric bus in the world. This
line, known as the K line, includes a range of electric transit
buses of various lengths, capacity and specification. The
line of buses is powered by BYD’s iron phosphate batteries,
with a typical drive range of some 250 kilometers. Global
distribution of K9s is supported by a global network of
after-sales servicing centers, including in Nepal, where
CIMEX Ltd has been granted exclusive license to distribute
and service BYD products
BYD K7 The BYD K7 bus is 8 meters long. The bus has a seating
capacity of 23. The drive rage of this bus is greater than 240
km. The battery capacity of the bus is 162 kWh, which takes
less than three hours to charge at a fast charging station. In
the region, BYD K7s have been running in China, Japan and
India.
BYD K9 The BYD K9 bus has a length of 12 meters and has proven
to be a popular city transit bus around the world. It has a
seating capacity of 30, with two folding seats and a single
wheel-chair space. It has a top-speed of around 70
kilometres per hour and can manage route grades of up to
around 15%. The battery has a capacity of 324 kilowatt
hours, typically taking around six hours for an overnight
slow charge (or three hours for a fast charge). In the region,
Bangalore, India is running K9s, as are cities in Malaysia
(Kuala Lumpur) and the Philippines. Japan, Hong Kong and
Singapore have all signed contracts for K9s.
.
Source: BYD
Figure A.2. The K9 by BYD Auto


![BPKM 2012_2013[1]](https://static.fdocuments.us/doc/165x107/55cf987e550346d03397f731/bpkm-201220131.jpg)