
Deploying 8Gb Fibre Channel with Oracle Database · Deploying 8Gb Fibre Channel with Oracle...
12
1 Deploying 8Gb Fibre Channel with Oracle Database James Morle, Scale Abilities Ltd
-
Upload
hoanghuong -
Category
Documents
-
view
228 -
download
1
Transcript of Deploying 8Gb Fibre Channel with Oracle Database · Deploying 8Gb Fibre Channel with Oracle...
1
Deploying 8Gb Fibre Channel with Oracle Database James Morle, Scale Abilities Ltd

Scale Abilities Ltd 2012
2
Executive Summary
Many Oracle Database customers are wondering if it makes sense to upgrade their existing 4Gb Fibre Channel (4GFC) implementations to 8GFC, while others must determine if 8GFC is the better choice for a new Oracle deployment. The study described in this white paper was designed to help answer these questions by comparing the performance of 4GFC and 8GFC Emulex host bus adapters (HBAs) in an Oracle-based test environment that was running a simple, parallel query-based test. The only changes made between test runs were the HBAs themselves, making possible a direct performance comparison. Test results indicated that bandwidth was approximately 13percent higher when two 8GFC ports were used to replace four 4GFC ports. While such a gain might not make it worthwhile to replace 4GFC HBAs in some existing deployments, 8GFC HBAs certainly make sense for new deployments. Furthermore, for existing 4GFC deployments that are heavily dependent on the amount of bandwidth available to them, a 13 percent gain would certainly be worth considering. Indeed, it is sufficient to knock a full hour off some eight-hour batch runs. Thus, when even a small server with a single six-core processor now has the capacity to process more than 30Gbps of data, and storage devices can easily deliver tens or hundreds of Gbps on request, 8GFC has the bandwidth needed to keep both CPU and storage array busy. While the ability to match CPU and storage bandwidths with the fabric is beneficial for most applications, high-bandwidth connections to storage may be critical for workloads such as data warehouse (DW) / business intelligence (BI). In addition, choosing 8GFC over 4GFC can free up one or more slots in the host server, reducing real estate, power and cooling requirements. This white paper outlines the performance testing carried out on behalf of Emulex and provides a few tips for optimizing Oracle query performance.
Target audience – This white paper is intended for Oracle Database administrators, storage administrators, storage architects and server administrators.
Scale Abilities Ltd 2012
3
1. Introduction
This white paper describes a study of the potential benefits of deploying 8GFC HBAs in an Oracle Database environment. FC is a widely-used storage connectivity solution for Oracle databases, with most legacy systems currently deployed using 4GFC infrastructure and many newer systems shipping with 8Gbs infrastructure. This study focused on determining whether or not there are compelling reasons for considering 8GFC solutions for new or even existing Oracle databases. Disclosure: Scale Abilities was commissioned commercially by Emulex Corporation to conduct this study. To ensure impartial commentary under this arrangement, Scale Abilities was awarded sole editorial control and Emulex granted sole veto rights for publication. About the author James Morle is a specialist large-scale, Oracle-based systems consultant with over 20 years of experience in IT consulting. His success is based on two key factors: deep domain expertise in the full Oracle stack, together with extensive credibility with senior IT and business leaders. James is the founder of Scale Abilities Ltd, co-founder of the OakTable Network, and an Oracle ACE Director. He is the author of the critically-acclaimed book, “Scaling Oracle8i,” and a co-author of “Oracle Insights.” He is passionate about gaining a deep understanding of all the components in the stack, applying that knowledge to solve complex customer problems, and communicating his findings in an honest, lucid and candid way.
Scale Abilities Ltd 2012
4
2. Test Configuration
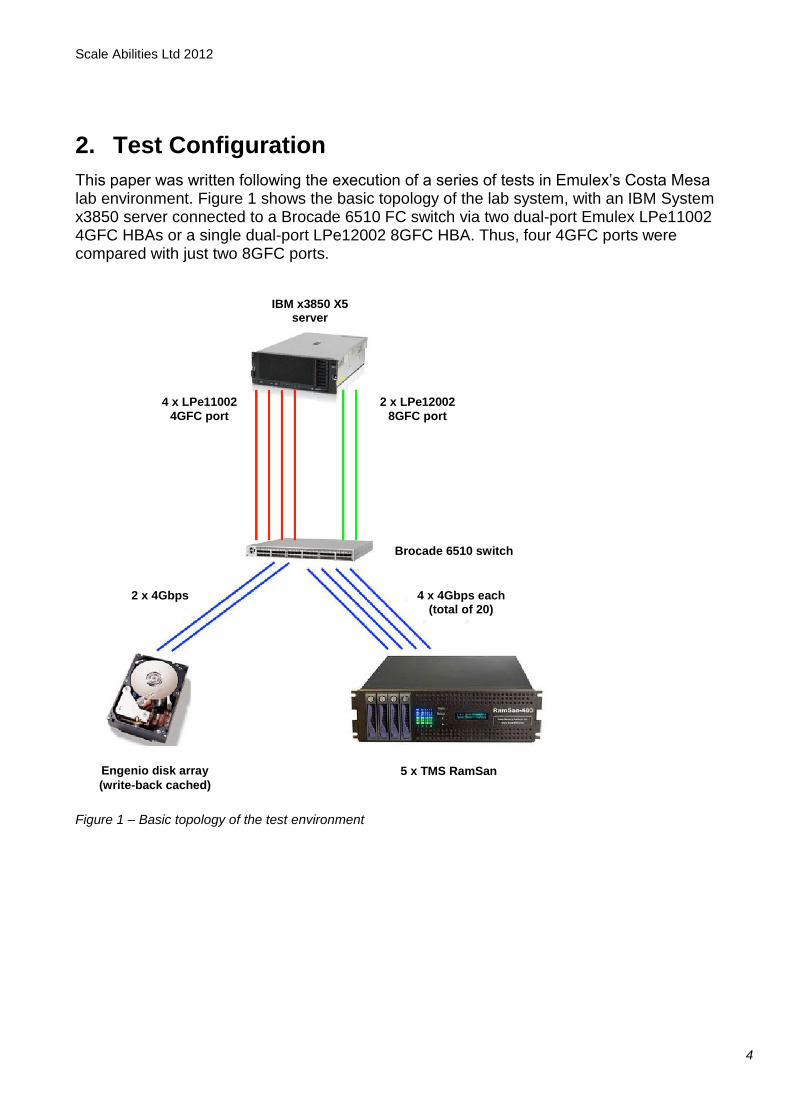
This paper was written following the execution of a series of tests in Emulex’s Costa Mesa lab environment. Figure 1 shows the basic topology of the lab system, with an IBM System x3850 server connected to a Brocade 6510 FC switch via two dual-port Emulex LPe11002 4GFC HBAs or a single dual-port LPe12002 8GFC HBA. Thus, four 4GFC ports were compared with just two 8GFC ports.
Figure 1 – Basic topology of the test environment
4 x 4Gbps each (total of 20)
5 x TMS RamSan Engenio disk array
(write-back cached)
2 x 4Gbps
Brocade 6510 switch
2 x LPe12002
8GFC port
4 x LPe11002
4GFC port
IBM x3850 X5 server
Scale Abilities Ltd 2012
5
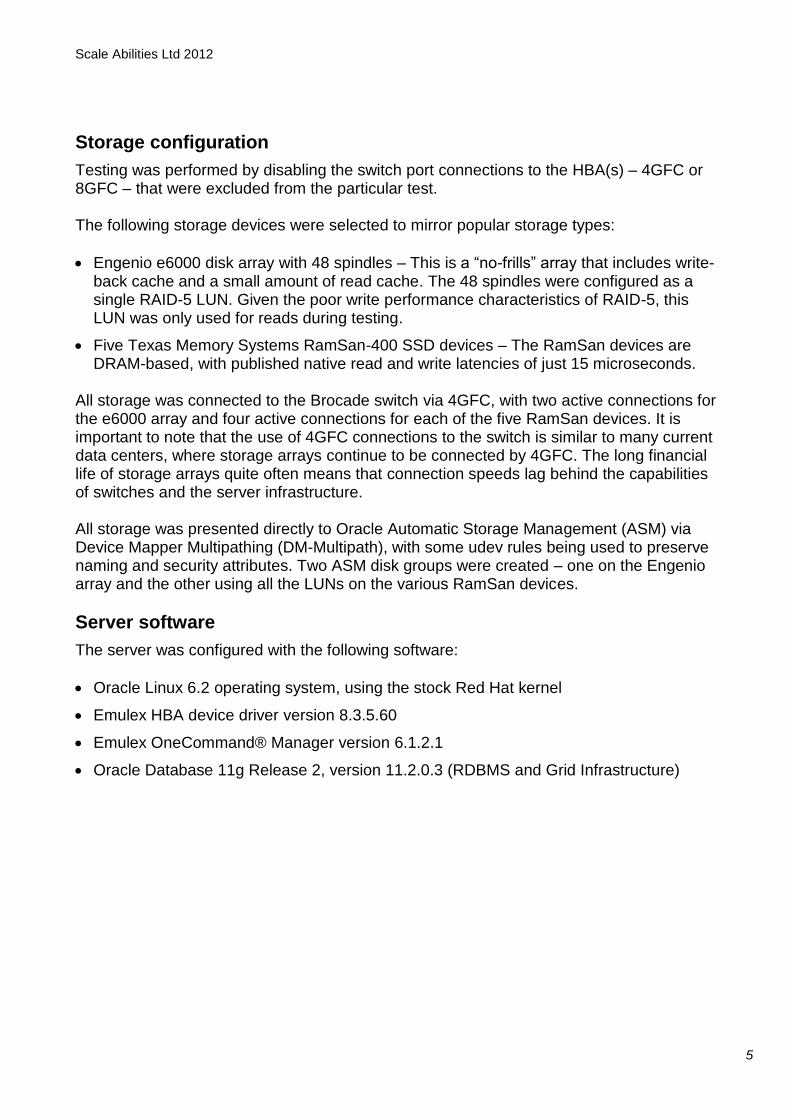
Storage configuration
Testing was performed by disabling the switch port connections to the HBA(s) – 4GFC or 8GFC – that were excluded from the particular test. The following storage devices were selected to mirror popular storage types:
Engenio e6000 disk array with 48 spindles – This is a “no-frills” array that includes write-back cache and a small amount of read cache. The 48 spindles were configured as a single RAID-5 LUN. Given the poor write performance characteristics of RAID-5, this LUN was only used for reads during testing.
Five Texas Memory Systems RamSan-400 SSD devices – The RamSan devices are DRAM-based, with published native read and write latencies of just 15 microseconds.
All storage was connected to the Brocade switch via 4GFC, with two active connections for the e6000 array and four active connections for each of the five RamSan devices. It is important to note that the use of 4GFC connections to the switch is similar to many current data centers, where storage arrays continue to be connected by 4GFC. The long financial life of storage arrays quite often means that connection speeds lag behind the capabilities of switches and the server infrastructure. All storage was presented directly to Oracle Automatic Storage Management (ASM) via Device Mapper Multipathing (DM-Multipath), with some udev rules being used to preserve naming and security attributes. Two ASM disk groups were created – one on the Engenio array and the other using all the LUNs on the various RamSan devices.
Server software
The server was configured with the following software:
Oracle Linux 6.2 operating system, using the stock Red Hat kernel
Emulex HBA device driver version 8.3.5.60
Emulex OneCommand® Manager version 6.1.2.1
Oracle Database 11g Release 2, version 11.2.0.3 (RDBMS and Grid Infrastructure)

Scale Abilities Ltd 2012
6
3. Choice of Test
The test chosen for this performance comparison was a simple, high-bandwidth, parallel execution-based test, making it very easy to understand the workload and interpret the results. Parallel queries allowed the bandwidth capabilities of the 8GFC and 4GFC HBAs to be compared. Although the 8GFC HBA should theoretically provide slightly improved latency over the 4GFC devices, this characteristic was not evaluated with the chosen test.
4. Parallel Query Testing
The preparation for this test consisted of populating the following large tables (as shown in Figure 2):
BIGTABLE – Created on the e6000 array using a cartesian join of dba_objects with themselves,1 producing a table of 5,661,960,516 rows with a segment size of 630,618MB
SSD_BIGTABLE – Created on the RamSan SSD devices from the same data but only 77,052,928 rows and 12,307MB
SQL> select segment_name,bytes/1048576 size_mb
2 from dba_segments
3 where segment_name like '%BIGTABLE';
SEGMENT_NAME SIZE_MB
-------------------- ----------
SSD_BIGTABLE 12307
BIGTABLE 630618
Figure 2 – Tables used for the parallel query testing
Since the testing was solely designed to demonstrate the differences between HBAs, the parallel queries were carefully designed to avoid physical device contention in the storage arrays. Given the smaller sizes of the SSD devices and their relatively high performance, the query for the SSD table was wrapped in a tight PL/SQL loop to ensure that it ran continuously.
1 Designed to create a large amount of data with little effort

Scale Abilities Ltd 2012
7
There was an Engenio query (Figure 3) to stress storage residing on the e6000 array and an SSD query (Figure 4) for storage residing on the SSDs.
select /*+ parallel(bt,8) */ count(*) from bigtable bt
Figure 3 – Engenio query
declare
i number;
j number;
begin
for i in 1..1000 loop
select /*+ parallel(bt,32) */ count(*) into j from ssd_bigtable
bt;
end loop;
end;
Figure 4 – SSD query
By design – only a count(*) function2 was being evaluated – the queries had low computational overhead in order to eliminate the possibility of host CPU contention, even though the server had plenty of CPU capacity. Initial testing and call tracing of the query execution ensured that the correct calls were being made by Oracle. To achieve maximum throughput for queries such as these, it is important to ensure that Oracle is using both direct I/O and asynchronous I/O. The direct I/O path ensures that I/Os are not submitted via any kind of filesystem buffer cache. In our case, since we were using ASM with raw disk devices, there was no possibility of filesystem caching; however, it is still a good practice to explicitly enable direct I/O. Using asychronous I/O can be more complex. Depending upon the version of Oracle, the platform, whether Oracle has been linked to the correct libraries, and the settings of a couple of parameters, Oracle may elect not to perform asynchronous I/O – even with ASM files. The best way to determine if it is being used is to correctly set the following two parameters and then check a running query for asynchronous I/O:
disk_async_io – This parameter should always be set to true, which is also the default.
filesystemio_options – This parameter should be set to setall, which, in almost all cases, specifies both Direct I/O and Asynchronous I/O.
2 This function counts the number of items in a particular selection
Scale Abilities Ltd 2012
8
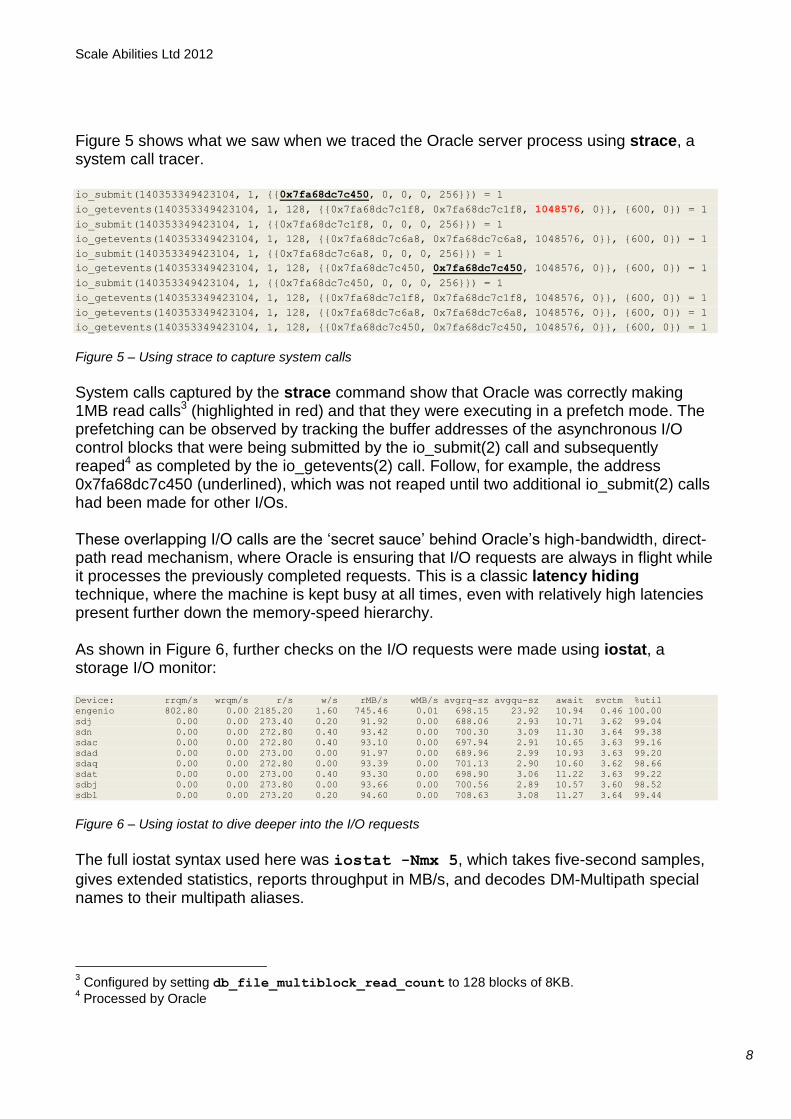
Figure 5 shows what we saw when we traced the Oracle server process using strace, a system call tracer. io_submit(140353349423104, 1, {{0x7fa68dc7c450, 0, 0, 0, 256}}) = 1
io_getevents(140353349423104, 1, 128, {{0x7fa68dc7c1f8, 0x7fa68dc7c1f8, 1048576, 0}}, {600, 0}) = 1
io_submit(140353349423104, 1, {{0x7fa68dc7c1f8, 0, 0, 0, 256}}) = 1
io_getevents(140353349423104, 1, 128, {{0x7fa68dc7c6a8, 0x7fa68dc7c6a8, 1048576, 0}}, {600, 0}) = 1
io_submit(140353349423104, 1, {{0x7fa68dc7c6a8, 0, 0, 0, 256}}) = 1
io_getevents(140353349423104, 1, 128, {{0x7fa68dc7c450, 0x7fa68dc7c450, 1048576, 0}}, {600, 0}) = 1
io_submit(140353349423104, 1, {{0x7fa68dc7c450, 0, 0, 0, 256}}) = 1
io_getevents(140353349423104, 1, 128, {{0x7fa68dc7c1f8, 0x7fa68dc7c1f8, 1048576, 0}}, {600, 0}) = 1
io_getevents(140353349423104, 1, 128, {{0x7fa68dc7c6a8, 0x7fa68dc7c6a8, 1048576, 0}}, {600, 0}) = 1
io_getevents(140353349423104, 1, 128, {{0x7fa68dc7c450, 0x7fa68dc7c450, 1048576, 0}}, {600, 0}) = 1
Figure 5 – Using strace to capture system calls
System calls captured by the strace command show that Oracle was correctly making 1MB read calls3 (highlighted in red) and that they were executing in a prefetch mode. The prefetching can be observed by tracking the buffer addresses of the asynchronous I/O control blocks that were being submitted by the io_submit(2) call and subsequently reaped4 as completed by the io_getevents(2) call. Follow, for example, the address 0x7fa68dc7c450 (underlined), which was not reaped until two additional io_submit(2) calls had been made for other I/Os. These overlapping I/O calls are the ‘secret sauce’ behind Oracle’s high-bandwidth, direct-path read mechanism, where Oracle is ensuring that I/O requests are always in flight while it processes the previously completed requests. This is a classic latency hiding technique, where the machine is kept busy at all times, even with relatively high latencies present further down the memory-speed hierarchy. As shown in Figure 6, further checks on the I/O requests were made using iostat, a storage I/O monitor: Device: rrqm/s wrqm/s r/s w/s rMB/s wMB/s avgrq-sz avgqu-sz await svctm %util
engenio 802.80 0.00 2185.20 1.60 745.46 0.01 698.15 23.92 10.94 0.46 100.00
sdj 0.00 0.00 273.40 0.20 91.92 0.00 688.06 2.93 10.71 3.62 99.04
sdn 0.00 0.00 272.80 0.40 93.42 0.00 700.30 3.09 11.30 3.64 99.38
sdac 0.00 0.00 272.80 0.40 93.10 0.00 697.94 2.91 10.65 3.63 99.16
sdad 0.00 0.00 273.00 0.00 91.97 0.00 689.96 2.99 10.93 3.63 99.20
sdaq 0.00 0.00 272.80 0.00 93.39 0.00 701.13 2.90 10.60 3.62 98.66
sdat 0.00 0.00 273.00 0.40 93.30 0.00 698.90 3.06 11.22 3.63 99.22
sdbj 0.00 0.00 273.80 0.00 93.66 0.00 700.56 2.89 10.57 3.60 98.52
sdbl 0.00 0.00 273.20 0.20 94.60 0.00 708.63 3.08 11.27 3.64 99.44
Figure 6 – Using iostat to dive deeper into the I/O requests
The full iostat syntax used here was iostat -Nmx 5, which takes five-second samples,
gives extended statistics, reports throughput in MB/s, and decodes DM-Multipath special names to their multipath aliases.
3 Configured by setting db_file_multiblock_read_count to 128 blocks of 8KB.
4 Processed by Oracle

Scale Abilities Ltd 2012
9
This iostat output shows that, although Oracle was making 1MB read calls, the Linux kernel was breaking these calls into multiple smaller calls – in this case, around 350KB in size. This is a function of the Linux block layer, which was operating correctly based on the default configuration of the system. No tuning of the kernel-block layer took place for this testing because, although more throughput could be obtained by eliminating this request fracturing, as long as this phenomenon was the same for both HBA types then the comparison remained valid. Indeed, it reflected the reality that many end-user environments do not tune the block layer at all.
5. Results Summary
The results of the testing are presented here from data collected using iostat, which allows data to be collected in a non-invasive way at relatively fast sample rates (every five seconds), as opposed to using common Oracle-based methods, such as AWR reports, that have an I/O requirement of their own and thus influence the results. The iostat command/script shown in Figure 7 was used to collect data from only the devices in use.
$ iostat -tdN -mx 5 tms31 tms24 tms23 tms28 tms19 tms12 tms29
tms20 tms15 tms30 tms32 engenio
Figure 7 – The iostat command/script used to collect performance data
Scale Abilities Ltd 2012
10
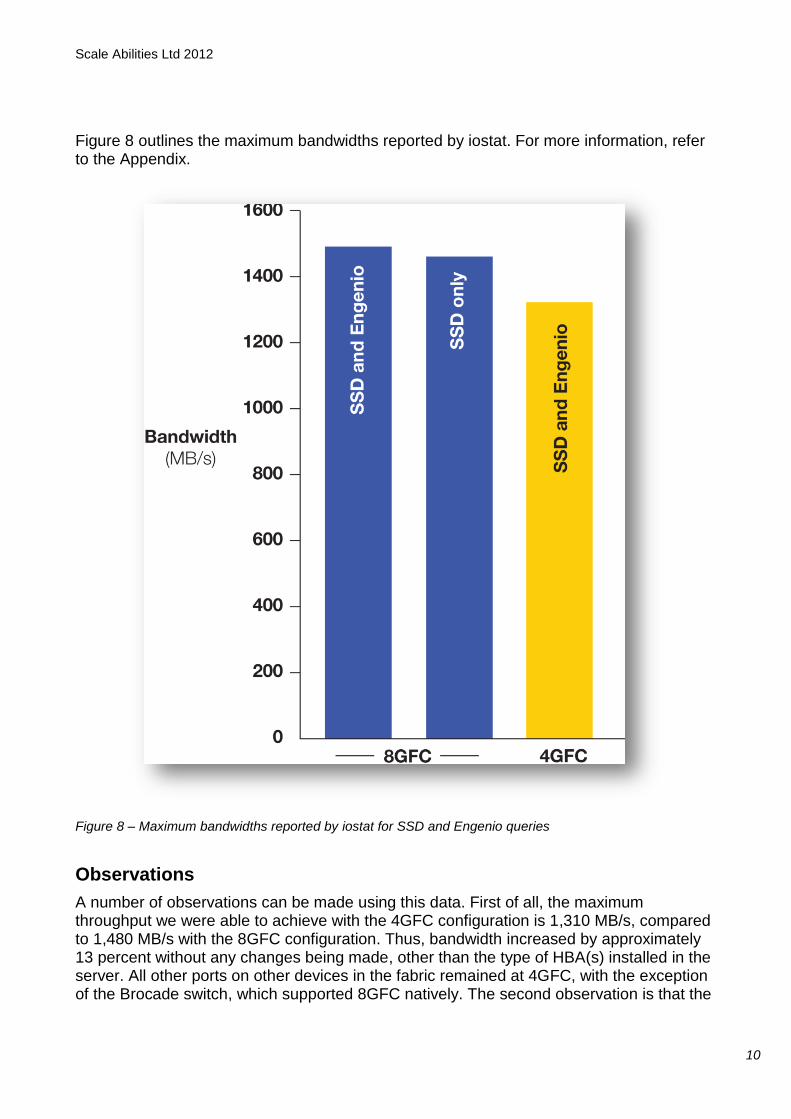
Figure 8 outlines the maximum bandwidths reported by iostat. For more information, refer to the Appendix.
Figure 8 – Maximum bandwidths reported by iostat for SSD and Engenio queries
Observations
A number of observations can be made using this data. First of all, the maximum throughput we were able to achieve with the 4GFC configuration is 1,310 MB/s, compared to 1,480 MB/s with the 8GFC configuration. Thus, bandwidth increased by approximately 13 percent without any changes being made, other than the type of HBA(s) installed in the server. All other ports on other devices in the fabric remained at 4GFC, with the exception of the Brocade switch, which supported 8GFC natively. The second observation is that the

Scale Abilities Ltd 2012
11
respective bandwidth figures for both HBA types are almost maximized just by running the SSD query; the Engenio query simply tops up the bandwidth with an independent, uncontended data source.
6. Conclusions
Achieving 100 percent of theoretical bandwidth in a storage infrastructure is always difficult. Many layers of software and hardware – often from different vendors – are involved and may conspire to stop you reaching the holy grail of 100 percent bandwidth utilization. However, the pleasantly surprising outcome of this testing was seeing just how much difference simply replacing four 4GFC ports with two 8GFC ports actually made, when nothing else in the architecture had changed. For many Oracle installations, a 13 percent gain would not make it worthwhile to replace 4GFC cards with 8GFC cards; however, such a gain certainly makes it worthwhile to ensure that new deployments adopt 8GFC. For others – those that are heavily dependent upon the amount of bandwidth available to them – a 13 percent gain in an existing installation would certainly be worth considering. For example, 13 percent is sufficient to knock a full hour off an eight-hour batch run, if that batch run spends most of its time waiting on data from the storage layer. It is increasingly important to maintain high bandwidth connections to storage, particularly for data warehouse (DW) / business intelligence (BI) workloads, where query runtime is often directly proportional to available bandwidth. Recent advances in host CPU technologies mean that the host is capable of significant bandwidth consumption – for example, each CPU core can typically support more than 500MB/s (0.5Gbps) of moderately complex Oracle data processing. Thus, even a small server with a single, six-core processor has the capacity to process more than 30Gbps of data. Similarly, even a single hard disk drive can deliver data at rates higher than 1.6Gbps; with SSDs, these rates exceed 5Gbps. When deployed in larger numbers, these storage devices can easily deliver tens or hundreds of Gbps upon request. In order to keep both host CPU and storage array busy, it is necessary to match those bandwidth numbers with FC bandwidth if balance is to be achieved and performance optimized.
Scale Abilities Ltd 2012
12
7. Appendix
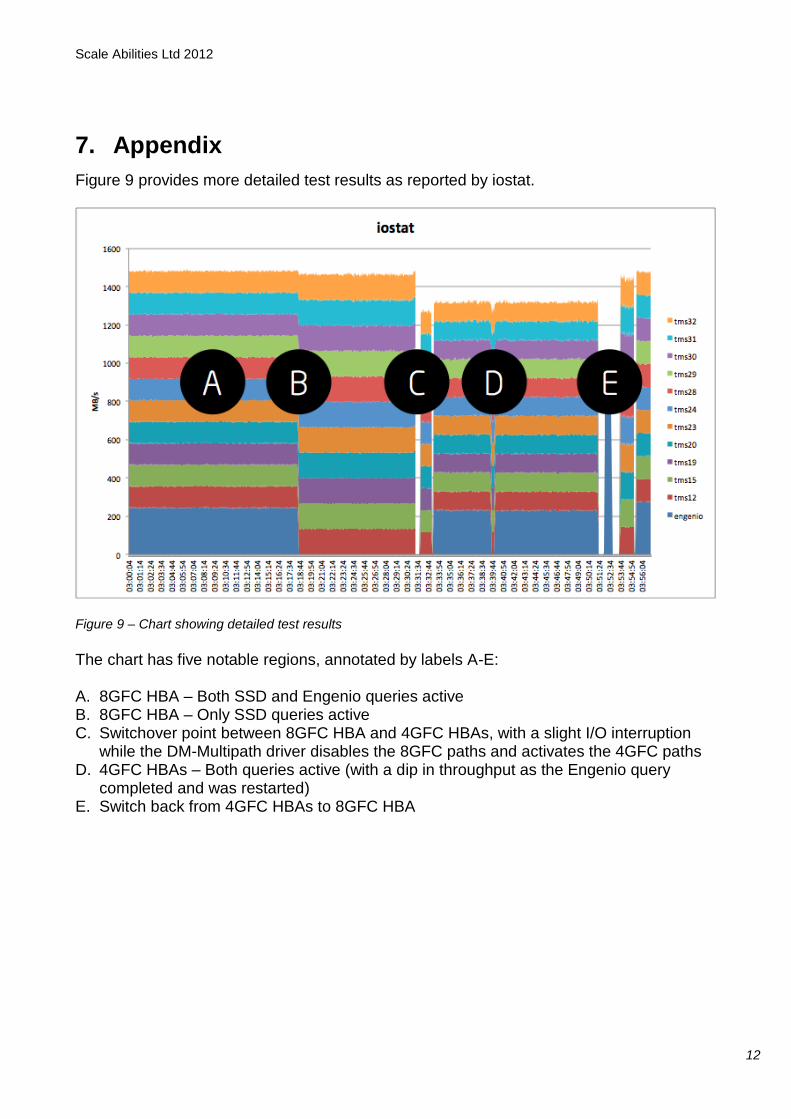
Figure 9 provides more detailed test results as reported by iostat.
Figure 9 – Chart showing detailed test results
The chart has five notable regions, annotated by labels A-E: A. 8GFC HBA – Both SSD and Engenio queries active B. 8GFC HBA – Only SSD queries active C. Switchover point between 8GFC HBA and 4GFC HBAs, with a slight I/O interruption
while the DM-Multipath driver disables the 8GFC paths and activates the 4GFC paths D. 4GFC HBAs – Both queries active (with a dip in throughput as the Engenio query
completed and was restarted) E. Switch back from 4GFC HBAs to 8GFC HBA