Dependable Computer Systems - Institute of Computer ......Course: Dependable Computer Systems 2016,...
52
Course: Dependable Computer Systems 2016, © Stefan Poledna, All rights reserved Dependable Computer Systems Part 5: Failure Modes and Models
Transcript of Dependable Computer Systems - Institute of Computer ......Course: Dependable Computer Systems 2016,...
Course: Dependable Computer Systems 2016, © Stefan Poledna, All rights reserved
Dependable Computer
Systems
Part 5: Failure Modes and Models

Course: Dependable Computer Systems 2016, © Stefan Poledna, All rights reserved
Contents
• Recap from Part 3: Canonical Failure Classification
• Failure Mode Hierarchy
• Fault-Hypothesis, Failure Semantics, and Assumption
Coverage
• Failure Hypothesis Estimation
• Overview of Safety Analysis Methods
• Comparison of Safety Analysis Methods
2

Course: Dependable Computer Systems 2016, © Stefan Poledna, All rights reserved
Recap from Part 3: Canonical
Failure Classification
3

Course: Dependable Computer Systems 2016, © Stefan Poledna, All rights reserved
Failures
Recap:
A (service) failure is an event that occurs when the delivered
service deviates from correct service.
• Thus, a failure is a transition from correct service to incorrect
service.
4
Course: Dependable Computer Systems 2016, © Stefan Poledna, All rights reserved
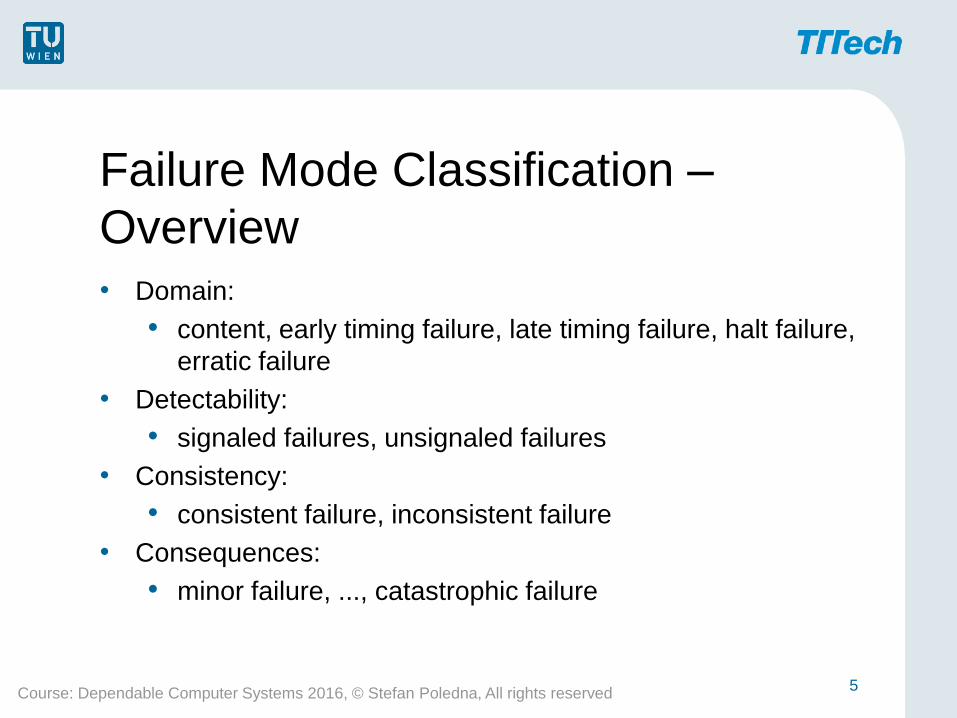
Failure Mode Classification –
Overview
• Domain:
• content, early timing failure, late timing failure, halt failure,
erratic failure
• Detectability:
• signaled failures, unsignaled failures
• Consistency:
• consistent failure, inconsistent failure
• Consequences:
• minor failure, ..., catastrophic failure
5

Course: Dependable Computer Systems 2016, © Stefan Poledna, All rights reserved
Failure Mode Classification –
Domain
• Content
• Early timing failure
• Late timing failure
• Halt failure
the external state becomes constant, i.e., system activity
is no longer perceptible to the users
silent failure mode is a special kind of halt failure in that
no service at all is delivered
• Erratic failure
not a halt failure, e.g., a babbling idiot failure
6

Course: Dependable Computer Systems 2016, © Stefan Poledna, All rights reserved
Failure Mode Classification –
Consistency
When there are more than one users of a service.
• Consistent failure:
• All users experience the same incorrect service.
• Inconsistent failure
• Different users experience different incorrect services.
7

Course: Dependable Computer Systems 2016, © Stefan Poledna, All rights reserved
Failure Mode Classification –
Consequences, e.g., Aircraft Minor: 10E-5 per flight hour or greater
no significant reduction of aeroplane safety, a slight reduction in the
safety margin
Major: between 10E-5 and 10E-7
significant reduction in safety margins or functional capabilities,
significant increase in crew workload or discomfort for occupants
Hazardous: between 10E-7 and 10E-9
large reduction in safety margins or functional capabilities, causes
serious or fatal injury to a relatively small number of occupants
Catastrophic: less than 10E-9
these failure conditions would prevent the continued safe flight and
landing of the aircraft
8

Course: Dependable Computer Systems 2016, © Stefan Poledna, All rights reserved
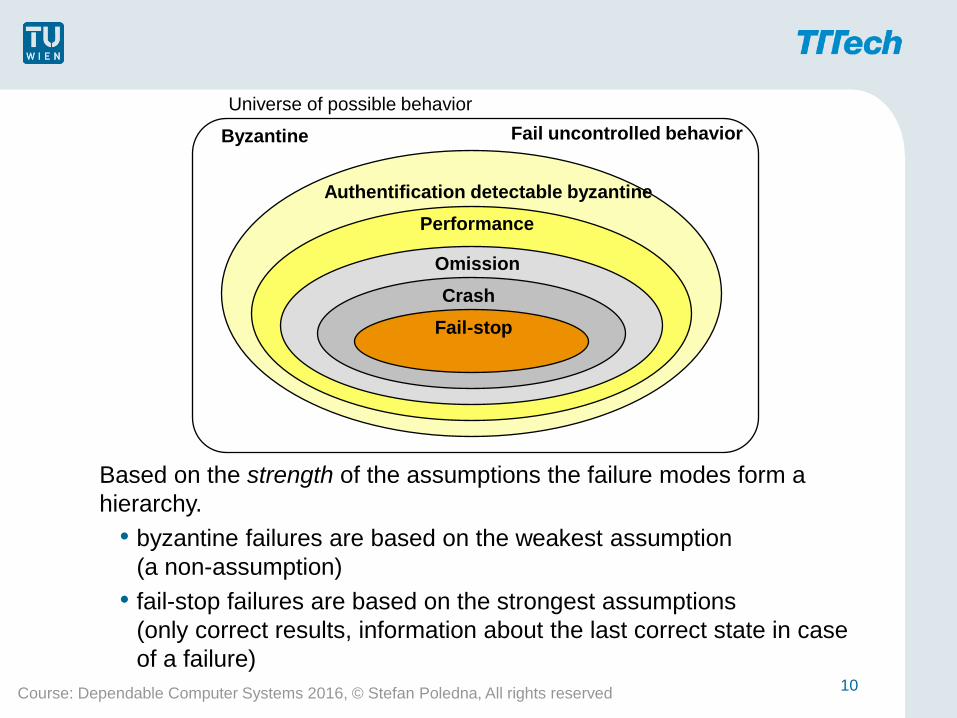
Failure Mode Hierarchy
9
Course: Dependable Computer Systems 2016, © Stefan Poledna, All rights reserved
Based on the strength of the assumptions the failure modes form a
hierarchy.
• byzantine failures are based on the weakest assumption
(a non-assumption)
• fail-stop failures are based on the strongest assumptions
(only correct results, information about the last correct state in case
of a failure)
10
Byzantine
Performance
Authentification detectable byzantine
Omission
Crash
Fail-stop
Universe of possible behavior
Fail uncontrolled behavior

Course: Dependable Computer Systems 2016, © Stefan Poledna, All rights reserved
Failure Mode Hierarchy (cont.)
• Byzantine or arbitrary failures:
there is no restriction on the behavior at the system interface,
this mode is often called fail-uncontrolled
(“two-faced” behavior, forging of messages)
• Authentification detectable byzantine failures:
the only restriction on the behavior at the system interface is
that messages of other systems cannot be forged
(this failure mode applies only to distributed systems)
11
Course: Dependable Computer Systems 2016, © Stefan Poledna, All rights reserved
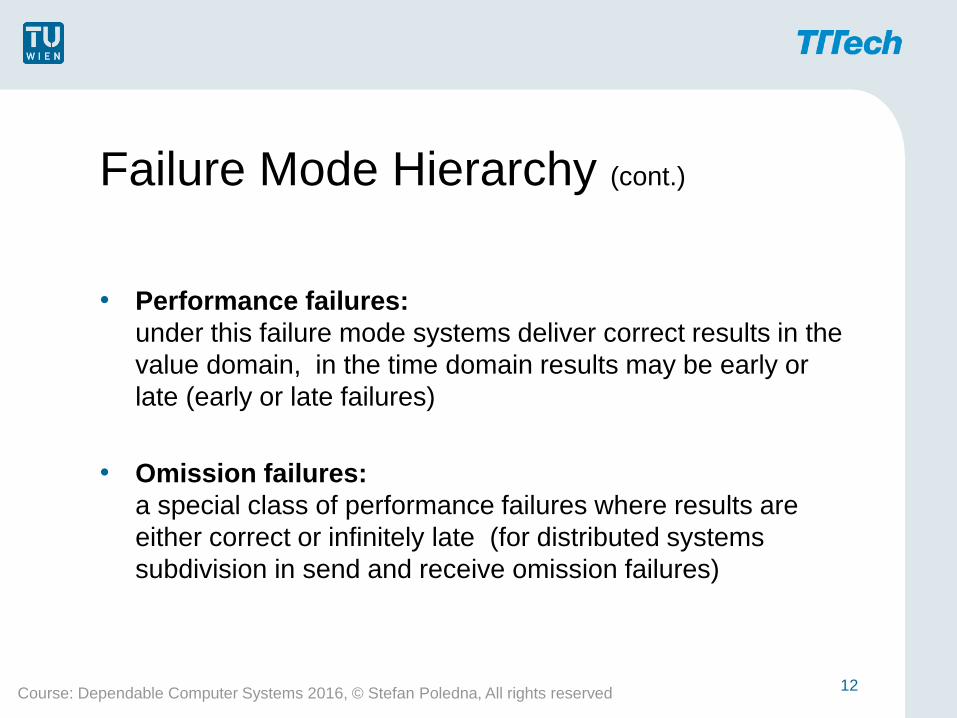
Failure Mode Hierarchy (cont.)
• Performance failures:
under this failure mode systems deliver correct results in the
value domain, in the time domain results may be early or
late (early or late failures)
• Omission failures:
a special class of performance failures where results are
either correct or infinitely late (for distributed systems
subdivision in send and receive omission failures)
12

Course: Dependable Computer Systems 2016, © Stefan Poledna, All rights reserved
Failure Mode Hierarchy (cont.)
• Crash failures:
a special class of omission failures where a system does not
deliver any subsequent results if it has exhibited an omission
failure once
(the system is said to have crashed)
• Fail-Stop failures:
besides the restriction to crash failures it is required that
other (correct) systems can detect whether the system has
failed or not and can read the last correct state from a stable
storage
13

Course: Dependable Computer Systems 2016, © Stefan Poledna, All rights reserved
Fault-Hypothesis, Failure Semantics,
and Assumption Coverage
14

Course: Dependable Computer Systems 2016, © Stefan Poledna, All rights reserved
Fault-Hypothesis, etc. Concepts
• Fault hypothesis:
The fault hypothesis specifies anticipated faults which a
server must be able to handle (also fault assumption).
• Failure semantics:
A server exhibits a given failure semantics if the probability of
failure modes which are not covered by the failure semantics
is sufficiently low.
• Assumption coverage:
Assumption coverage is defined as the probability that the
possible failure modes defined by the failure semantics of a
server proves to be true in practice conditions on the fact that
the server has failed.
15

Course: Dependable Computer Systems 2016, © Stefan Poledna, All rights reserved
Fault-Hypothesis, etc. (cont.)
Importance of assumption coverage
• The definition of a proper fault hypothesis, failure semantics
and achievement of sufficient coverage is one of the most
important factors.
• If the fault hypothesis (or failure semantics) is violated a
system may fail as a whole.
16
Course: Dependable Computer Systems 2016, © Stefan Poledna, All rights reserved
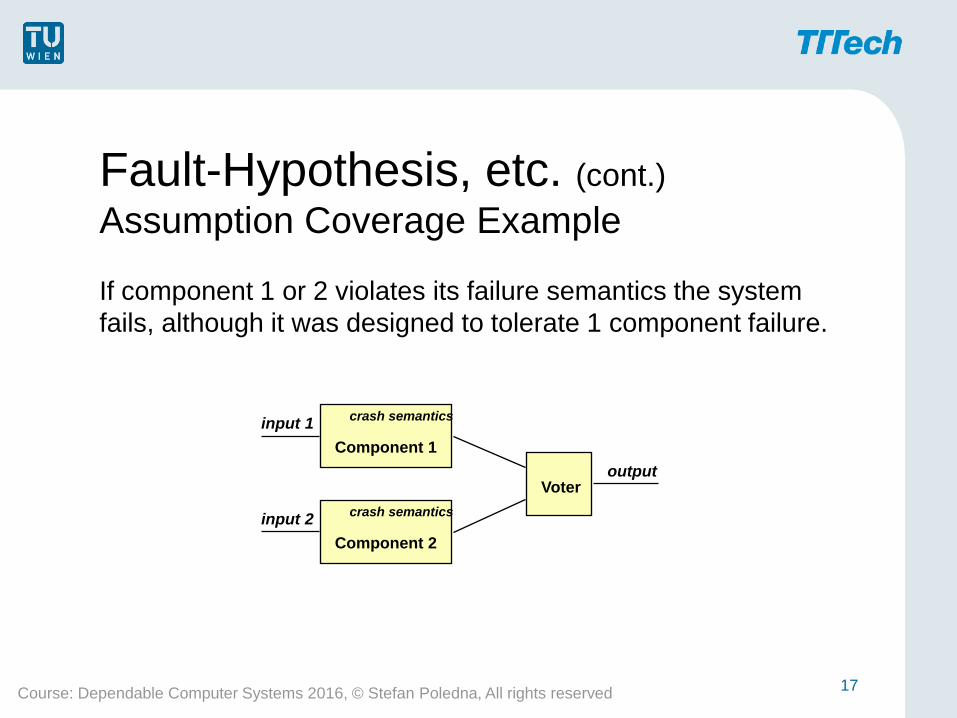
Fault-Hypothesis, etc. (cont.)
Assumption Coverage Example
If component 1 or 2 violates its failure semantics the system
fails, although it was designed to tolerate 1 component failure.
17
Component 1
Component 2
Voter
input 1
input 2
output
crash semantics
crash semantics

Course: Dependable Computer Systems 2016, © Stefan Poledna, All rights reserved
Fault-Hypothesis, etc. (cont.)
The Titanic or: violated assumption coverage
• The fault hypothesis:
The Titanic was built to stay afloat if less or equal to 4 of the
underwater departments were flooded.
• Rationale of fault hypothesis:
This assumption was reasonable since previously there had
never been an incident in which more than four
compartments of a ship were damaged.
• But:
Unfortunately, the iceberg ruptured five spaces, and the
following events went down to history.
18

Course: Dependable Computer Systems 2016, © Stefan Poledna, All rights reserved
Failure Hypothesis Estimation
19
Course: Dependable Computer Systems 2016, © Stefan Poledna, All rights reserved
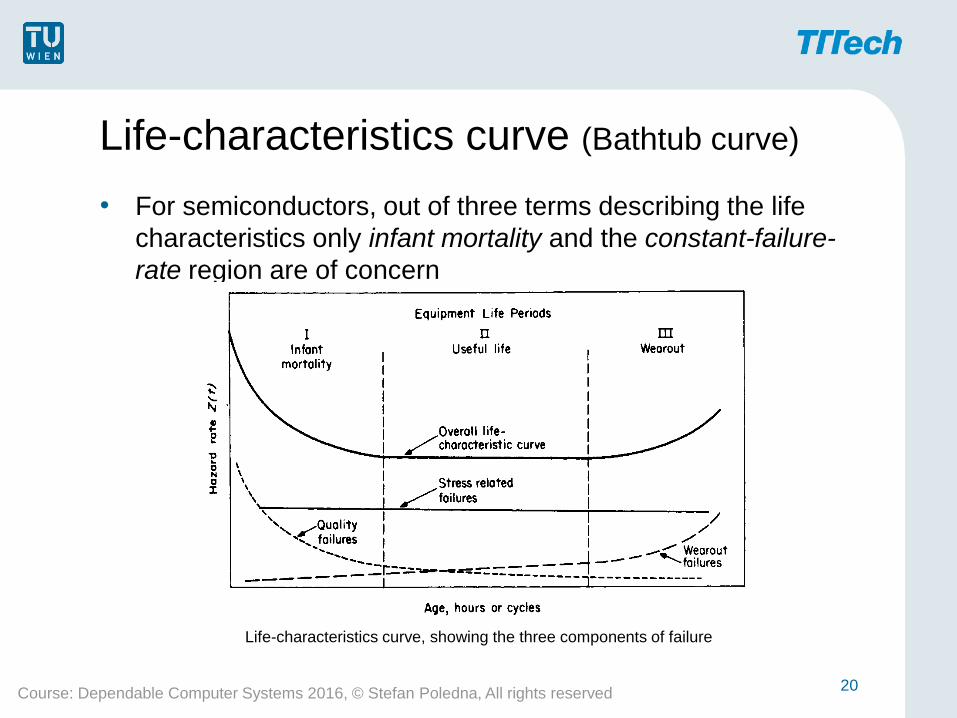
Life-characteristics curve (Bathtub curve)
• For semiconductors, out of three terms describing the life
characteristics only infant mortality and the constant-failure-
rate region are of concern
20
Life-characteristics curve, showing the three components of failure

Course: Dependable Computer Systems 2016, © Stefan Poledna, All rights reserved
Semiconductor failure rate
• a typical failure rate distribution for semiconductors shows
that wear out is of no concern
21
Semiconductor failure rate

Course: Dependable Computer Systems 2016, © Stefan Poledna, All rights reserved
Stress Tests
• semiconductor failures are stress dependent
• the most influential stress factor is temperature
22

Course: Dependable Computer Systems 2016, © Stefan Poledna, All rights reserved
Stress Tests (cont.)
Arrhenius equation
• the basic relationship between the activation rate of failures
and temperature is described by the Arrhenius equation
23
Arrhenius plot (EA = 1 eV)
R0 .. constant
T .. absolute temperature (K)
EA .. activation energy (eV)
k .. Boltzmann’s constant 8.6 10-5 eV/K
R R0e
EA
kT

Course: Dependable Computer Systems 2016, © Stefan Poledna, All rights reserved
Stress Tests (cont.)
Accelerated stress testing of semiconductors
• to remove freaks and infant-mortality failures (screening)
• to determine the expected failure rate
Accelerated conditions:
accelerated temperature lowering of temperature
cycling of temperature high temperature and current
temperature and voltage stress particles
temperature, voltage and high voltage gradients
humidity stress
24
Course: Dependable Computer Systems 2016, © Stefan Poledna, All rights reserved
Stress Tests (cont.)
Software stress
• For software there is no sound empirical and mathematical basis to
use stress as a method to characterize the behavior of components.
• it is currently unknown how to characterize stress for software
• it is impossible to carry out accelerated stress tests to examine
failure rates for software
• for software there is no such relation as the Arrhenius equation
which describes the activation rate of failures
• there is no general possibility to “over-engineer” a system to
handle conditions which are more stressful
25

Course: Dependable Computer Systems 2016, © Stefan Poledna, All rights reserved
Hardware/Software
Interdependence
• software depends on hardware:
• software requires hardware to execute
(e.g. Intel’s Pentium bug)
• hardware depends on software:
• VLSI design uses software tools
• PCB layout and routing by software tools
• EMC analysis by software tools
• hardware testers are software driven
26

Course: Dependable Computer Systems 2016, © Stefan Poledna, All rights reserved
Overview of Safety Analysis
Methods
27

Course: Dependable Computer Systems 2016, © Stefan Poledna, All rights reserved
Safety Analysis (cont.)
Concepts
System Safety: is a subdiscipline of system engineering that
applies scientific, management, and engineering principles to
ensure adequate safety, throughout the operational life cycle,
within the constraints of operational effectiveness, time and cost.
Safety: has been defined as “freedom from those conditions that
can cause death, injury, occupational illness, or damage to or
loss of equipment or property”. safety has to be regarded as a
relative term.
Software Safety: to ensure that the software will execute within a
system context without resulting in unacceptable risk
28
Course: Dependable Computer Systems 2016, © Stefan Poledna, All rights reserved
Safety analysis Overview
• includes complete life cycle of project/product
(specification, design, maintenance, modification, ... )
• definition of responsibilities
• communication with other groups
• complete documentation
• analysis of complex processes
• management procedures
(specialists, meetings, action reviews, time schedule, ... )
29
Course: Dependable Computer Systems 2016, © Stefan Poledna, All rights reserved
Safety Analysis (cont.)
Major topics of Safety analysis
• which (hazard analysis)
• how (accident sequencing)
• how likely (quantitative analysis)
30
Course: Dependable Computer Systems 2016, © Stefan Poledna, All rights reserved
Safety Analysis (cont.)
Safety analysis methodologies
• Preliminary Hazards Analysis (PHA)
• Hazards and Operability Study (HAZOP)
• Action Error Analysis (AEA)
• Fault Tree Analysis (FTA)
• Event Tree Analysis (ETA)
• Failure Modes and Effect Analysis (FMEA)
Failure Modes, Effect and Criticality Analysis (FMECA)
• Cause-consequence analysis
31
Course: Dependable Computer Systems 2016, © Stefan Poledna, All rights reserved
Safety Analysis (cont.)
Preliminary hazard analysis (PHA)
• The first step in any safety program is to identify hazards and
to categorize them with respect to criticality and probability
• define system hazards
• define critical states and failure modes
• identify critical elements
• determine consequences of hazardous events
• estimate likelihood of hazardous events
• issues to be analyzed in more detail
32
Course: Dependable Computer Systems 2016, © Stefan Poledna, All rights reserved
Safety Analysis (cont.)
Hazards and Operability Study (HAZOP)
Based on a systematic search to identify deviations that may
cause hazards during system operation
Intention: for each part of the system a specification of the
“intention” is made
Deviation: a search for deviations from intended behavior which
may lead to hazards
Guide Words: Guide words on a check list are employed to
uncover different types of deviations
(NO, NOT, MORE, LESS, AS WELL AS, PART OF,
REVERSE, OTHER THAN)
Team: the analysis is conducted by a team, comprising different
specialists
33

Course: Dependable Computer Systems 2016, © Stefan Poledna, All rights reserved
Safety Analysis (cont.)
Example for HAZOP
• Intention: pump a specified amount of A to reaction tank B.
Pumping of A is complete before B is pumped over.
34
NO or NOT
– the tank containing A is empty
– one of the pipe’s two valves V1 or V2 is closed
– the pump is blocked, e.g. with frozen liquid
– the pump does not work (switched off, no power, ... )
– the pipe is broken
CONSEQUENCE is serious, a possible explosion
MORE
– the pump has a too high capacity
– the opening of the control valve is too large
CONSEQUENCE not serious, tank gets overfilled
AS WELL AS
– valve V3 is open, another liquid or gas gets pumped
– contaminants in the tank
–A is pumped to another place (leak in the connecting
pipe)
CONSEQUENCE is serious, a possible explosion
. . .
A
C
B V1
V3 V2
V5
V4

Course: Dependable Computer Systems 2016, © Stefan Poledna, All rights reserved
Safety Analysis (cont.)
Action Error Analysis (AEA)
Considers the operational, maintenance, control and supervision
actions performed by human beings. The potential mistakes in
individual actions are studied.
• list steps in operational procedures (e.g. “press button A”)
• identification of possible errors for each step, using a check-list of
errors
• assessment of the consequences of the errors
• investigations of causes of important errors
(action not taken, actions taken in wrong order, erroneous actions,
actions applied to wrong object, late or early actions, ... )
• analysis of possible actions designed to gain control over these
process
• relevant for software in the area of user interface design
35

Course: Dependable Computer Systems 2016, © Stefan Poledna, All rights reserved
Safety Analysis (cont.)
Fault Tree Analysis (FTA)
A graphical representation of logical combinations of causes that
may lead to a hazard (top-event). Can be used as a quantitative
method.
• identification of hazards (top-events)
• analysis to find credible combinations which can lead to the
top-event
• graphical tree model of parallel and sequential faults
• uses a standardized set of symbols for Boolean logic
• expresses top-event as a consequence of AND/OR
combination of basic events
• minimal cut set is used for quantitative analysis
36
Course: Dependable Computer Systems 2016, © Stefan Poledna, All rights reserved
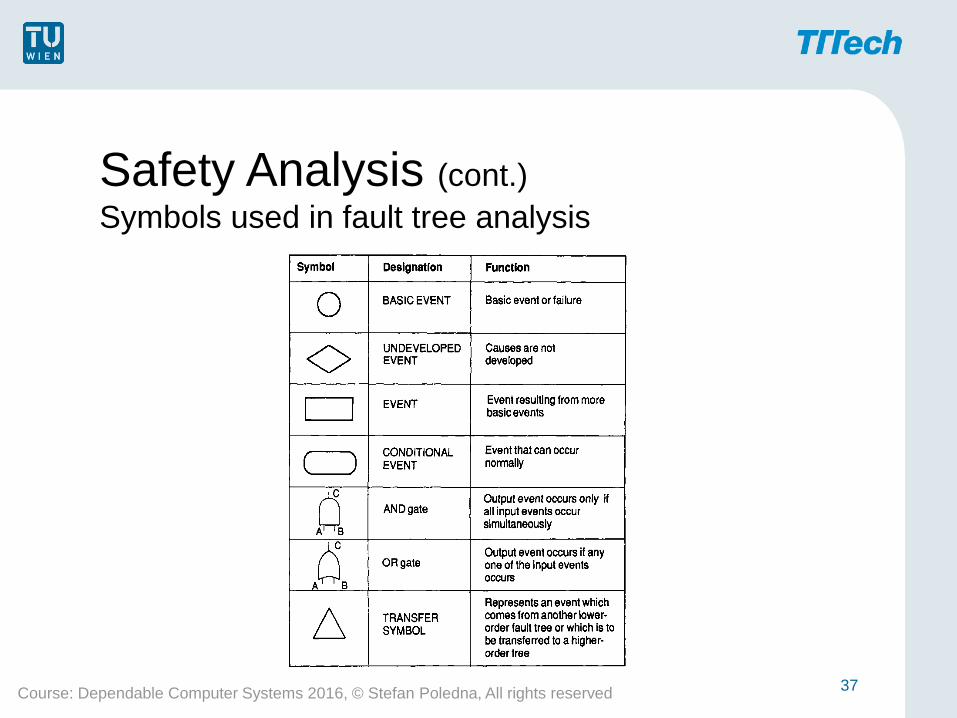
Safety Analysis (cont.)
Symbols used in fault tree analysis
37
Course: Dependable Computer Systems 2016, © Stefan Poledna, All rights reserved
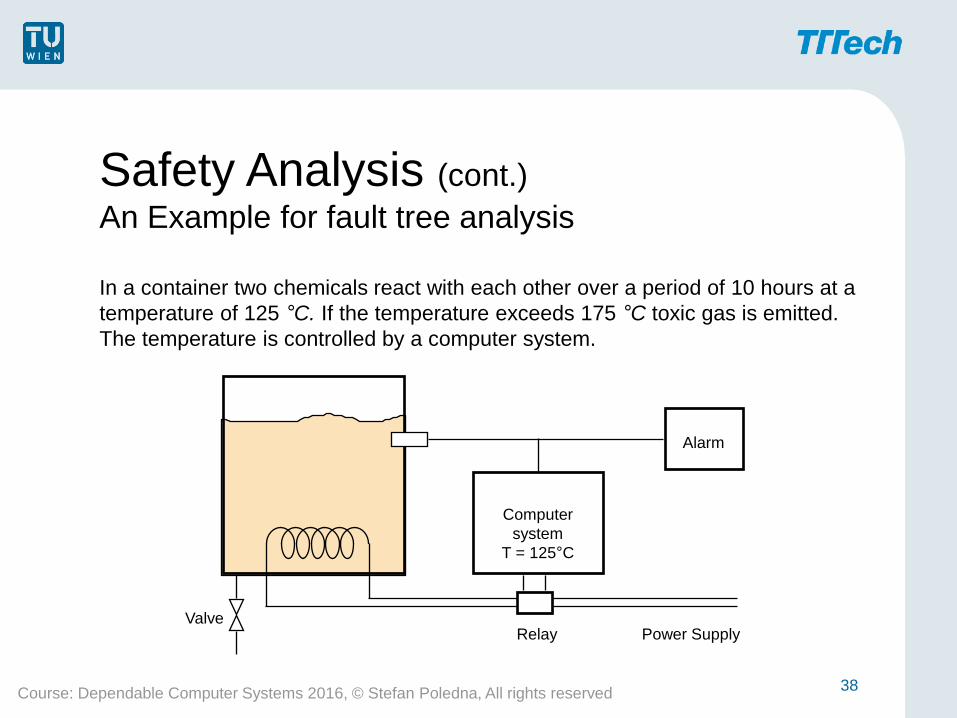
Safety Analysis (cont.)
An Example for fault tree analysis
In a container two chemicals react with each other over a period of 10 hours at a
temperature of 125 °C. If the temperature exceeds 175 °C toxic gas is emitted.
The temperature is controlled by a computer system.
38
Relay Valve
Alarm
Computer
system
T = 125°C
Power Supply

Course: Dependable Computer Systems 2016, © Stefan Poledna, All rights reserved
Safety Analysis (cont.)
An Example for fault tree analysis (cont.)
Identification of the top-event:
Emission of poisonous gas
is the top event
39
The upper part of the fault tree

Course: Dependable Computer Systems 2016, © Stefan Poledna, All rights reserved
Safety Analysis (cont.)
An Example for fault tree analysis (cont.)
Subtree for temperature
measurement failure
40

Course: Dependable Computer Systems 2016, © Stefan Poledna, All rights reserved
Safety Analysis (cont.)
An Example for fault tree analysis (cont.)
Subtree for heating
cut off failure
41
Course: Dependable Computer Systems 2016, © Stefan Poledna, All rights reserved
Safety Analysis (cont.)
Event Tree Analysis (ETA)
Models the potential consequences of faults which are
considered as events. Can be used as a quantitative method.
• identification of basic events
• start with basic events and describe possible consequences
of this event
• binary decision for consequences of events
• opposite of FTA which starts with top events
42

Course: Dependable Computer Systems 2016, © Stefan Poledna, All rights reserved
Safety Analysis (cont.)
Failure Modes and Effect Analysis (FMEA)
A common method where the designer in a systematical way
has to answer the questions “How can the component fail?” and
“What happens then?”.
• the system is dived up into different components in the form
of a block diagram
• failure modes are identified for all components
• causes, consequences and the significance of failures are
assessed for each failure mode
43
Course: Dependable Computer Systems 2016, © Stefan Poledna, All rights reserved
Safety Analysis (cont.)
Failure Modes and Effect Analysis (FMEA) (cont.)
• an investigation is made into how the failure can be detected
• if necessary, recommendations for suitable control measures
are made
• analysis is supported by tabular sheets (e.g. IEC
standard 1985)
• failure mode, effects and criticality analysis (FMECA) puts
special emphasis on the criticality aspect
44
Course: Dependable Computer Systems 2016, © Stefan Poledna, All rights reserved
Safety Analysis (cont.)
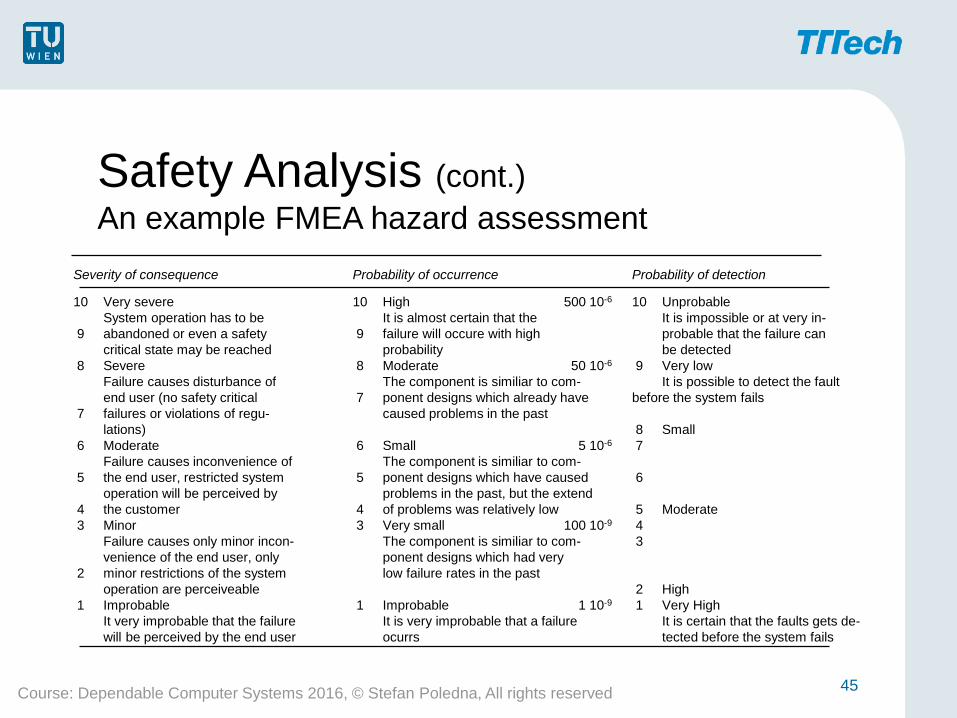
An example FMEA hazard assessment
45
Severity of consequence Probability of occurrence Probability of detection
10 Very severe 10 High 500 10-6 10 Unprobable
System operation has to be It is almost certain that the It is impossible or at very in-
9 abandoned or even a safety 9 failure will occure with high probable that the failure can
critical state may be reached probability be detected
8 Severe 8 Moderate 50 10-6 9 Very low
Failure causes disturbance of The component is similiar to com- It is possible to detect the fault
end user (no safety critical 7 ponent designs which already have before the system fails
7 failures or violations of regu- caused problems in the past
lations) 8 Small
6 Moderate 6 Small 5 10-6 7
Failure causes inconvenience of The component is similiar to com-
5 the end user, restricted system 5 ponent designs which have caused 6
operation will be perceived by problems in the past, but the extend
4 the customer 4 of problems was relatively low 5 Moderate
3 Minor 3 Very small 100 10-9 4
Failure causes only minor incon- The component is similiar to com- 3
venience of the end user, only ponent designs which had very
2 minor restrictions of the system low failure rates in the past
operation are perceiveable 2 High
1 Improbable 1 Improbable 1 10-9 1 Very High
It very improbable that the failure It is very improbable that a failure It is certain that the faults gets de-
will be perceived by the end user ocurrs tected before the system fails

Course: Dependable Computer Systems 2016, © Stefan Poledna, All rights reserved
Safety Analysis (cont.)
An example FMEA hazard assessment (cont.)
46
Function Failure Mode Cause Effect Controls
speed sensor open connector or no operation supplier quality control and 9 4 3 108
harness possible end of line testing
computer no operation computer supplier quality control 9 3 3 81
possible and end of line testing
sensor no operation sensor supplier quality control, 9 4 3 108
possible module and end of line testing
short to connector or no operation supplier quality control and 9 2 3 54
supply harness possible end of line testing
computer no operation computer supplier quality control 9 2 3 54
possible and end of line testing
sensor no operation sensor supplier quality control, 9 2 3 54
possible module and end of line testing
short to connector or no operation supplier quality control and 9 1 3 27
ground harness possible end of line testing
computer no operation computer supplier quality control 9 1 3 27
possible and end of line testing
sensor no operation sensor supplier quality control, 9 1 3 27
possible module and end of line testing
Severity
Probability
Dedection
Product
Course: Dependable Computer Systems 2016, © Stefan Poledna, All rights reserved
Safety Analysis (cont.)
Cause-consequence analysis
Combination of fault tree analysis and event tree analysis
• starts at a critical event
• works forward by using event tree analysis (consequences)
• works backward by using fault tree analysis (causes)
• very flexible
• well documented method
47

Course: Dependable Computer Systems 2016, © Stefan Poledna, All rights reserved
Comparison of Safety Analysis
Methods
48

Course: Dependable Computer Systems 2016, © Stefan Poledna, All rights reserved
Comparison of Safety Analysis
Methods
49
Method
Preliminary hazards analysis Hazards and operability study Action error analysis
Advantages
A required first step. Suitable for large chemical plants. Results in a list of actions, design changes and cases identified for more detailed study. Enhances the information exchange between system designers, process designers and operating personnel. Gives the computer system designer proposals for proper interface design. Helps the personnel or users to monitor the process during operation and helps to prevent operator mistakes.
Restrictions and deficiencies
None. Technique is not well standardized and described in the literature. Most often applied to continuos processes. AEA is an analysis of the technical system, and does not analyze the behavior of operators. The thoughts and intentions of human beings, i.e. the reasons for mistakes, are not considered.
Course: Dependable Computer Systems 2016, © Stefan Poledna, All rights reserved
Comparison of Safety Analysis
Methods (cont.)
50
Method
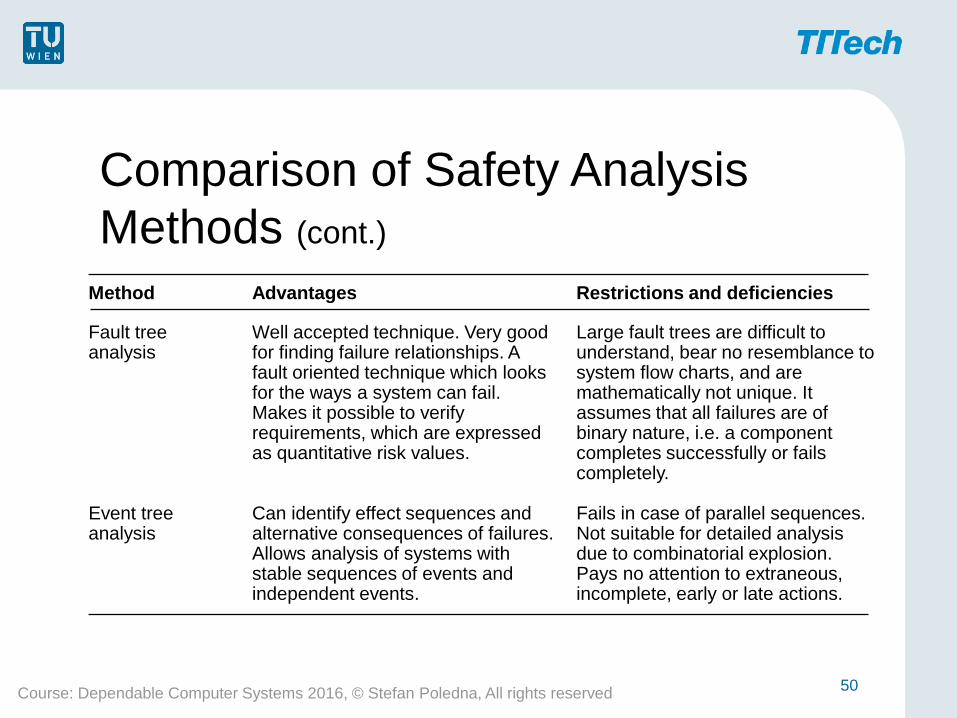
Fault tree analysis Event tree analysis
Advantages
Well accepted technique. Very good for finding failure relationships. A fault oriented technique which looks for the ways a system can fail. Makes it possible to verify requirements, which are expressed as quantitative risk values. Can identify effect sequences and alternative consequences of failures. Allows analysis of systems with stable sequences of events and independent events.
Restrictions and deficiencies
Large fault trees are difficult to understand, bear no resemblance to system flow charts, and are mathematically not unique. It assumes that all failures are of binary nature, i.e. a component completes successfully or fails completely. Fails in case of parallel sequences. Not suitable for detailed analysis due to combinatorial explosion. Pays no attention to extraneous, incomplete, early or late actions.

Course: Dependable Computer Systems 2016, © Stefan Poledna, All rights reserved
Comparison of Safety Analysis
Methods (cont.)
51
Method
Failure modes and effects analysis Cause-consequence analysis
Advantages
Easily understood, well accepted, standardized technique. Non-controversial, non-mathematical. Studies potential failures and their effects on the function of the system. Extremely flexible and all-encompassing methodology. Well documented. Sequential paths for critical events are clearly shown.
Restrictions and deficiencies
Examines non-dangerous failures and is therefore time consuming. Often combinations of failures and human factors not considered. It is difficult to consider multiple and simultaneous failures. Cause-consequence diagrams become too large very quickly (as FTA, ETA). They have many of the disadvantages of fault tree analysis.
Course: Dependable Computer Systems 2016, © Stefan Poledna, All rights reserved
Problems with software safety
analysis
• relatively new field
• lack of systematic engineering discipline
• no agreed or proven methodologies
• time and cost
• complexity
(understanding of the problem domain, separation of knowledge)
• discrete nature of software
(difficulties with large discrete state spaces)
• real-time aspects
(concurrency and synchronization)
• (partially) invalid assumption of independent failures
52