Department of Transport Annual Report 2007-2008s3.amazonaws.com/zanran_storage/ CityLink Melbourne...
231
Department of Transport Annual Report
Transcript of Department of Transport Annual Report 2007-2008s3.amazonaws.com/zanran_storage/ CityLink Melbourne...
Department of Transport Annual Report
Departm
ent of Transport Annual R
eport 2007-08DOI3659/08
Published by Department of Transport 121 Exhibition Street, Melbourne
www.transport.vic.gov.au
© State Government of Victoria 2008
This publication is copyright. No part may be reproduced by any process except in accordance with the Provisions of the Copyright Act 1968.
Authorised by the Victorian Government, 121 Exhibition Street, Melbourne
ISSN 1441-4805
Printed by Geon-Impact Printing, 69-79 Fallon Street, Brunswick VIC 3056
If you would like to receive this publication in an accessible format, such as large print or audio please telephone Public Affairs Branch on 9655 6000.
Printed on environmentally friendly paper. Cover and text pages printed on LIFE Recycled.
Building a safer, fairer and greener transport system for all Victorians to create a more prosperous and connected community.
Contents
Abbreviations 6
2007-08 Annual Report 7
Secretary’s foreword 8
Department of Transport 12
Vision, mission and values 14
Transport portfolios 15
Organisational structure 18
Chief Finance Officer’s executive summary 25
Outcome One
Public safety and security 26
Outcome Two
Infrastructure delivery and management 38
Outcome Three
Access and mobility 48
Outcome Four
Rural and regional development 62
Outcome Five
Efficient movement of freight 70
Outcome Six
Integrated policy development 80
Outcome Seven
Organisational capability building 90
Office of the Chief Investigator 96
Financial Statements 100
Appendices 170
4 Department of Transport Annual Report 2007-08

6 Department of Transport Annual Report 2007-08
Abbreviations
AIFRS Australian Equivalents to International Financial Reporting Standards
ALCAM Australian Level Crossing Assessment Model
ARTC Australian Rail Track Corporation
BAV Bus Association Victorian
CALD culturally and linguistically diverse
CAG community action group
CCTV closed-circuit television
CEO Chief Executive Officer
CML CityLink Melbourne Ltd
CSI Customer Satisfaction Index
CTO Chief Technology Officer
DDA Disability Discrimination Act 1992
DET Department of Education and Training
DIIRD Department of Industry, Innovation and Regional Development
DHS Department of Human Services
DOI Department of Infrastructure
DOT Department of Transport
DPC Department of Premier and Cabinet
DPCD Department of Planning and Community Development
DPI Department of Primary Industries
DSE Department of Sustainability and Environment
DTF Department of Treasury and Finance
DVC Department of Victorian Communities
ED Executive Director
EES Environmental Effects Statement
EMS Environmental Management Statement
EPA Environment Protection Authority
ESC Essential Services Commission
ESV Energy Safe Victoria
FTE full-time equivalent
GST Goods and Services Tax
ICT Information and Communication Technology
IRI International Roughness Index
LPG liquid petroleum gas
MMV Multimedia Victoria
MOTC Meeting Our Transport Challenges
MPTP Multi Purpose Taxi Program
MPV Major Projects Victoria
MSV Marine Safety Victoria
NSW New South Wales
NTS New Ticketing Solution
OCI Office of the Chief Investigator
OH&S/OHS Occupational Health and Safety
PoHC Port of Hastings Corporation
PoMC Port of Melbourne Corporation
PPP Public Private Partnership
PTD Public Transport Division
PTSV Public Transport Safety Victoria
RFNR Rail Freight Network Review
RFR Regional Fast Rail
SCSA Southern Cross Station Authority
SEES Supplementary Environment Effects Statement
SEITA Southern and Eastern Integrated Transport Authority
SEMD Security and Emergency Management Division
TAC Transport Accident Commission
TPWS Train Protection Warning System
TTA Transport Ticketing Authority
URTIC Urban Redevelopment Transport Infrastructure Coordination
VAGO Victorian Auditor-General’s Office
VCAT Victoria Civil and Administrative Tribunal
VCEC Victorian Competition and Efficiency Commission
V/Line V/Line Passenger Corporation
VicRoads Roads Corporation of Victoria
VicTrack Victorian Rail Track Corporation
VicUrban Victorian Urban Development Authority
VIPP Victorian Industry Participation Policy
VPS Victorian Public Service
VRCA Victorian Regional Channels Authority
VTD Victorian Taxi Directorate

7
2007-08 Annual Report
29 October 2008
Lynne Kosky MP Minister for Public Transport
Tim Pallas MP Minister for Roads and Ports
121 Exhibition Street Melbourne Victoria 3000
Dear Ministers
Annual Report 2007-08
In accordance with provisions of the Financial Management Act 1994, I have pleasure in submitting for presentation to Parliament the Department of Transport’s Annual Report for the year ended 30 June 2008.
Yours sincerely
Jim Betts Secretary Department of Transport
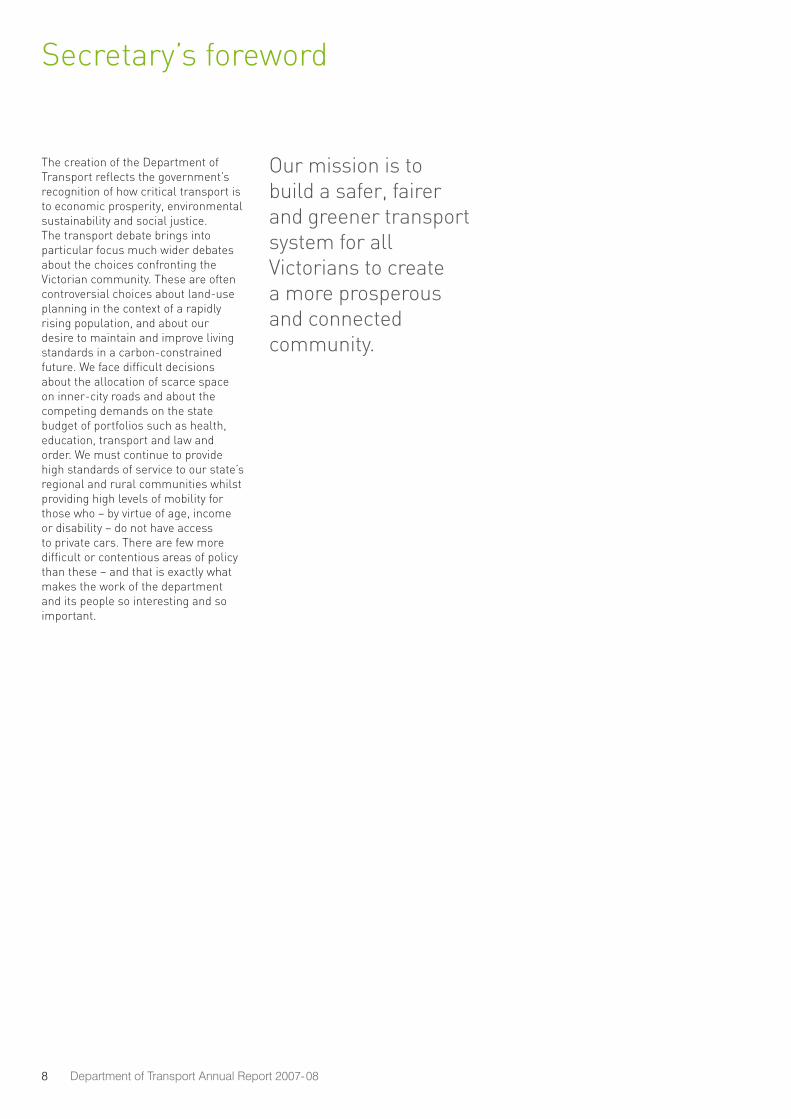
The creation of the Department of Transport reflects the government’s recognition of how critical transport is to economic prosperity, environmental sustainability and social justice. The transport debate brings into particular focus much wider debates about the choices confronting the Victorian community. These are often controversial choices about land-use planning in the context of a rapidly rising population, and about our desire to maintain and improve living standards in a carbon-constrained future. We face difficult decisions about the allocation of scarce space on inner-city roads and about the competing demands on the state budget of portfolios such as health, education, transport and law and order. We must continue to provide high standards of service to our state’s regional and rural communities whilst providing high levels of mobility for those who – by virtue of age, income or disability – do not have access to private cars. There are few more difficult or contentious areas of policy than these – and that is exactly what makes the work of the department and its people so interesting and so important.
Secretary’s foreword
8 Department of Transport Annual Report 2007-08
Our mission is to build a safer, fairer and greener transport system for all Victorians to create a more prosperous and connected community.
9
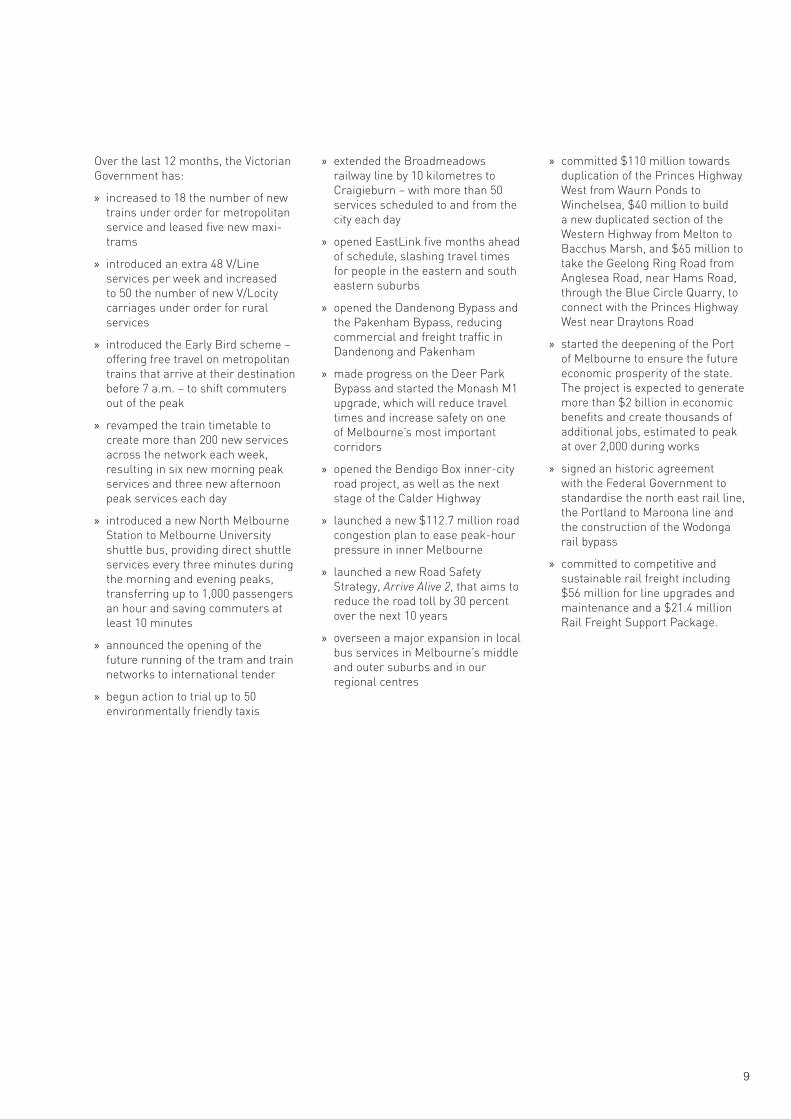
Over the last 12 months, the Victorian Government has:
increased to 18 the number of new »trains under order for metropolitan service and leased five new maxi-trams
introduced an extra 48 V/Line »services per week and increased to 50 the number of new V/Locity carriages under order for rural services
introduced the Early Bird scheme – »offering free travel on metropolitan trains that arrive at their destination before 7 a.m. – to shift commuters out of the peak
revamped the train timetable to »create more than 200 new services across the network each week, resulting in six new morning peak services and three new afternoon peak services each day
introduced a new North Melbourne »Station to Melbourne University shuttle bus, providing direct shuttle services every three minutes during the morning and evening peaks, transferring up to 1,000 passengers an hour and saving commuters at least 10 minutes
announced the opening of the »future running of the tram and train networks to international tender
begun action to trial up to 50 »environmentally friendly taxis
extended the Broadmeadows »railway line by 10 kilometres to Craigieburn – with more than 50 services scheduled to and from the city each day
opened EastLink five months ahead »of schedule, slashing travel times for people in the eastern and south eastern suburbs
opened the Dandenong Bypass and »the Pakenham Bypass, reducing commercial and freight traffic in Dandenong and Pakenham
made progress on the Deer Park »Bypass and started the Monash M1 upgrade, which will reduce travel times and increase safety on one of Melbourne’s most important corridors
opened the Bendigo Box inner-city »road project, as well as the next stage of the Calder Highway
launched a new $112.7 million road »congestion plan to ease peak-hour pressure in inner Melbourne
launched a new Road Safety »Strategy, Arrive Alive 2, that aims to reduce the road toll by 30 percent over the next 10 years
overseen a major expansion in local »bus services in Melbourne’s middle and outer suburbs and in our regional centres
committed $110 million towards »duplication of the Princes Highway West from Waurn Ponds to Winchelsea, $40 million to build a new duplicated section of the Western Highway from Melton to Bacchus Marsh, and $65 million to take the Geelong Ring Road from Anglesea Road, near Hams Road, through the Blue Circle Quarry, to connect with the Princes Highway West near Draytons Road
started the deepening of the Port »of Melbourne to ensure the future economic prosperity of the state. The project is expected to generate more than $2 billion in economic benefits and create thousands of additional jobs, estimated to peak at over 2,000 during works
signed an historic agreement »with the Federal Government to standardise the north east rail line, the Portland to Maroona line and the construction of the Wodonga rail bypass
committed to competitive and »sustainable rail freight including $56 million for line upgrades and maintenance and a $21.4 million Rail Freight Support Package.

2007-08 was a big year for the Transport Portfolio and the pace of activity will remain formidable in the year that lies ahead as key long-term programs come to fruition and as the next wave of short-, medium- and long-term planning gathers momentum. As it prepares itself for another year of intense activity, the department will be endeavouring to improve its performance in several key areas.
Our role is to facilitate the safe and efficient movement of people and goods: the only solutions that matter will be integrated solutions which span the various transport modes.
First, we will take an integrated, holistic approach to transport planning, ensuring a greater level of coordination between agencies to improve transport connectivity. Agencies and authorities such as VicRoads, SEITA, the TTA, VicTrack and the Port of Melbourne Corporation will play key roles as partners in that integrated joint planning process, as will the land-use planning team in the Department of Planning and Community Development.
Second, we will engage constructively and frequently with key stakeholders in local government, industry and the community sector. The department must be responsive to a wide range of perspectives, interests and views. We do not have a monopoly on wisdom and should use transport’s increased prominence in the public sphere to enrich our own thinking through open communication and open minds.
Third, we will gear up to ensure the prompt delivery of services and projects in a way that is both efficient and productive.
Fourth, and most importantly, the department must turn itself into a truly great place to work. I want to lead a department that is full of people who are happy, ambitious, passionate, talented and committed to improving the lot of all Victorians. This is not some remote ambition: it is my key personal target for the next 12 months and is within our reach. I hope that anyone reading this report, within or outside the department, will join us on what promises to be an exciting journey.
Jim Betts Secretary Department of Transport
10 Department of Transport Annual Report 2007-08

11

12 Department of Transport Annual Report 2007-08
13
Department of Transport
14 Department of Transport Annual Report 2007-08
Vision
To become the best performing workplace in the Australian public sector.
Mission
Building a safer, fairer and greener transport system for all Victorians to create a more prosperous and connected community. We do this by:
linking the transport system »of road, rail, air and sea channels to promote economic and social development through increased mobility and access, and a more cost-effective freight and logistics sector
promoting efficient and integrated »transport services across different modes while managing road and freight traffic growth in order to address the needs of the travelling public and industry
delivering the government’s major »transport infrastructure investment projects
providing strategic policy »advice, analysis and support to government, our stakeholders and our community.
Values
Our values inform the way we work together as a department.
Teamwork: We acknowledge and support shared goals. We openly cooperate and communicate our knowledge and we share our expertise and information within our work units and across DOT, individually and organisationally.
Diversity: We value our people’s diversity. We respect, recognise and help cultivate each others diverse knowledge, skills and capabilities.
Integrity: We are ethical, accountable and transparent in our dealings with colleagues, stakeholders and clients.
Commitment: We are committed to provide high-quality services and are responsive to the changing demands of the community, government and other stakeholders.
Innovation: We support lifelong learning, flexible working and innovation.
DOT aims to move Victoria into the future by being a cohesive, responsive department that delivers the best possible transport infrastructure and services for Victorians.
Vision, mission and values
15
Ministerial Portfolios
DOT has two portfolios:
Minister for Public Transport, »Lynne Kosky
Minister for Roads and Ports, »Tim Pallas
Machinery of government changes
As a result of machinery of government changes announced in April 2008 a new Department of Transport was created from the former Department of Infrastructure.
Major Projects Victoria was transferred to the Department of Innovation, Industry and Regional Development (DIIRD). The outputs for Major Projects Victoria are contained in the 2007-08 Annual Report of DIIRD.
Revenues and expenses associated with the outputs transferred out of DOT have been recorded in the Financials section of this report.
Transport portfolios
Public Transport Safety
Public Transport Safety Victoria and the Office of the Chief Investigator operate as independent bodies with administrative links to the department. Both organisations fulfil financial reporting requirements through the DOT Annual Report however PTSV also prepares an Annual Safety Review to provide an overview of activities and highlights for the financial year. As such, PTSV no longer has a separate section within the DOT annual report. Key achievements of the Office of the Chief Investigator have been included in this annual report (pg 97).
16 Department of Transport Annual Report 2007-08
The Public Transport portfolio covers:
contract and lease arrangements »for train, tram, route bus, school bus services and infrastructure
regulation of the taxi industry »
regulation of public transport safety »
accessible transport services and »facilities
management of large and complex »transport infrastructure projects crucial to state development.
Statutory authoritiesPublic Transport Ticketing Body »(Transport Ticketing Authority – TTA)
V/Line Passenger Corporation »(V/Line Passenger)
Victorian Rail Track Corporation »(VicTrack)
Southern Cross Station Authority »(SCSA).
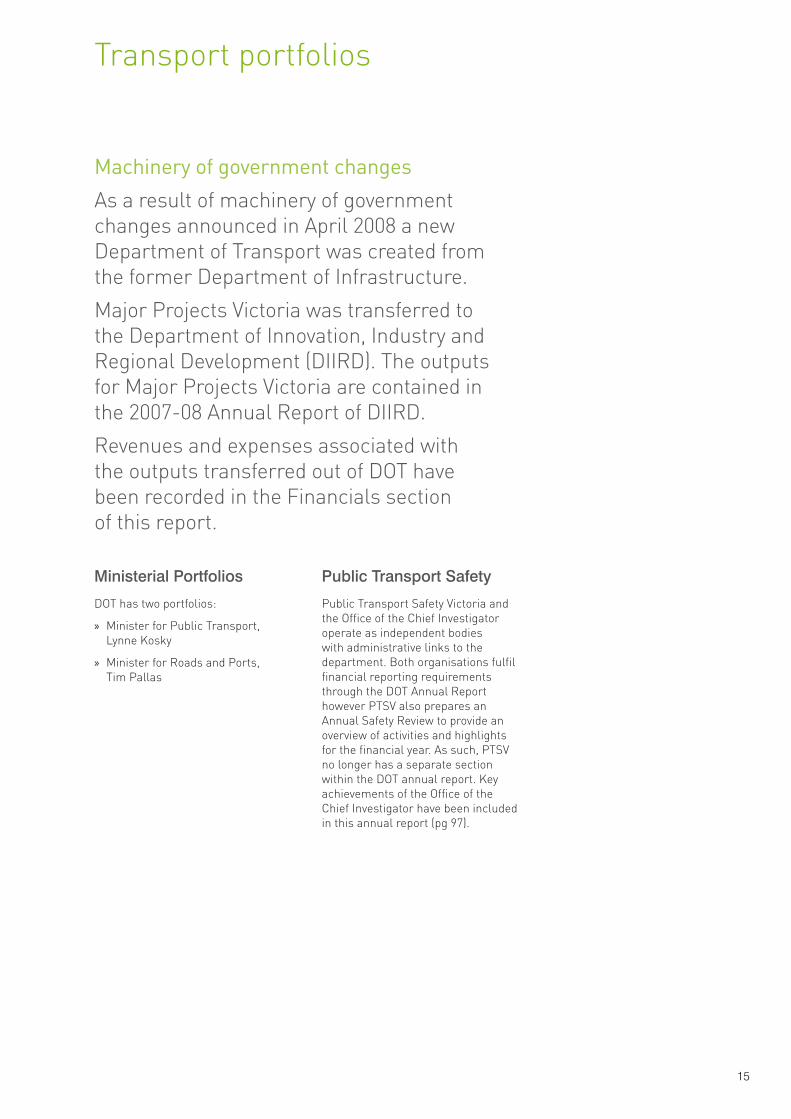
The Public Transport portfolio oversees Victoria’s extensive public transport system and the implementation of the $10.5 billion transport and liveability statement Meeting Our Transport Challenges.
Public Transport portfolio
Lynne Kosky MP Minister for Public Transport
Rob Hudson MP
The Parliamentary Secretary for Public Transport provides policy support to DOT Ministers in relation to:
taxi administration and reform »
bus routes review »
transport legislation review. »
Parliamentary Secretary for Public Transport
17
The Roads and Ports portfolio includes:
maintaining and enhancing »Victoria’s arterial road network
responding to the Eddington East- »West Link Needs Assessment
improving road safety for all road »users
ensuring our ports remain »competitive and are integrated with our transport network
supporting Australia’s freight and »logistics industries
growing alternative transport »modes such as walking and cycling
regulating marine safety for »Victoria’s bays, coastline and waterways.
The Minister for Roads and Ports and the Minister for Public Transport are the Victorian representatives on the Australian Transport Council – the peak body for Commonwealth, State, Territory and New Zealand Governments to coordinate and integrate national transport and road policy issues.
Statutory authoritiesRoads Corporation of Victoria »(VicRoads)
Port of Hastings Corporation »(PoHC)
Port of Melbourne Corporation »(PoMC)
Southern and Eastern Integrated »Transport Authority (SEITA)
Victorian Regional Channels »Authority (VRCA).
The Roads and Ports portfolio oversees the development and integration of Victoria’s extensive roads network and world-class commercial ports to help grow our state’s economy, cater for a rapidly growing population and to preserve the liveability and connectivity of our towns and suburbs.
Roads and Ports portfolio
Tim Pallas MP Minister for Roads and Ports
Martin Pakula MP
The Parliamentary Secretary for Roads and Ports provides policy support to DOT Ministers in relation to:
port development and »intermodal hubs
regional road safety »
motorcycle safety. »
Parliamentary Secretary for Roads and Ports
18 Department of Transport Annual Report 2007-08
DOT Divisions
As a result of the machinery of government changes announced in April 2008, a new Department of Transport was formed from the former Department of Infrastructure. Major Projects Victoria was transferred to the Department of Industry and Regional Development (DIRD) while all other divisions remained as part of the Department of Transport.
A new organisational structure was announced on 17 June 2008 and DOT now has a total of 14 divisions and a project management office that contribute to the achievement of the department’s core outcomes. DOT has a staff of approximately 1,800 and, in conjunction with VicRoads, is responsible for public transport, roads and ports throughout Victoria.
Jim Betts Secretary
Jim Betts took up his position as Secretary of the Victorian Government’s newly formed Department of Transport on 14 May 2008. Prior to his appointment as Secretary, Jim had served as Director of Public Transport overseeing train, tram, bus and taxi operations throughout Victoria.
Jim has extensive experience in commercial and policy development, particularly in public transport, with both the Victorian and UK Governments.
Jim graduated from Oxford in 1987 with a BA in modern history and then from Imperial College, London University in 1988 with a management science degree. He worked with the UK Government in roles such as Assistant Private Secretary to the Secretary of State for Transport and Policy Adviser in the Railways Directorate.
In Victoria Jim has also worked as Director, Transport Reform in the Department of Treasury and Finance (DTF), Assistant Director in the Project Development and Commercial Division of DTF and Deputy Director of Public Transport.
Ray Van Kuyk Deputy Secretary
Ray has recently taken up the Deputy Secretary’s position, having been the Acting CEO of the Transport Ticketing Authority, and the General Manager of Programs, Systems and Finance within the Public Transport Division over the last two years.
Ray has extensive experience in the development and delivery of large complex strategies and programs of work in a range of differing environments, including Defence, Information Communications and Technology and Transport.
Ray has spent some 25 years in the project environment, including 14 years in the Australian Army, which he left in 1994 as a Major. Senior general management roles at NEC and Fujitsu Australia followed, whereupon Ray commenced his involvement with the Victorian Government in 2002.
Ray has a Masters in Project Management and a Post Graduate Diploma in Telecommunications and Systems Management.
Organisational structure
19
Public Transport
The role of the Public Transport Division (PTD), as the government-appointed coordinator of Victoria’s public transport system, is to manage contractual and regulatory relationships (rail, tram and bus operators and others) effectively to meet the government’s objectives for public transport. PTD works closely with other parts of government, councils, external stakeholders and community groups to achieve this.
PTD has a key role to play in facilitating the development and implementation of major policies and projects which either enhance the public transport system or impact upon it.
Hector McKenzie Director of Public Transport
Following the formation of the Department of Transport, Hector McKenzie was appointed as the Director of Public Transport.
Hector has had many years experience including managing Victoria’s bus service contracts for 10 years, managing significant aspects of the privatisation of the former Public Transport Corporation (including leading the sale of the Yarra Trams business), planning public transport for the 2006 Commonwealth Games and overseeing the commercial arrangements for Victoria’s rolling stock procurements.
Prior to his current role he was responsible for managing the service arrangements with Connex and Yarra Trams, Melbourne’s train and tram operator respectively. The role encompassed procurement of new rolling stock, development of infrastructure requirements necessary to meet growth and overseeing of issues related to access to public transport by people with disabilities.
Commercial
The Commercial Division has the lead role for commercial activity for the Department of Transport. It advises on major commercial transactions across the department and with some agencies, providing support and assistance on business activity as required . The division also has overall responsibility to manage the world wide tender for the operation of Melbourne’s tram and train franchises, as well as procuring new arrangements for regional and school bus services across Victoria.
Ross Alexander Executive Director
Ross joined the Public Transport Division of the Department of Infrastructure in 2003. His primary role was working on the 2003 rail re-franchising, informed inpart by his previous experience with the National Express Group.
Following the successful negotiation with Connex and Yarra Trams for new franchises, Ross moved to TTA to head up the commercial procurement process for the New Ticketing System, before taking up the position of Deputy Director, Commercial in PTD. Since then, Ross has been in charge of the tender for bus shelter advertising and the recently completed negotiation of new metropolitan bus contracts. In his new role as Executive Director, Commercial, Ross is leading the tender for operation of Melbourne’s train and tram systems and continues to oversee the bus contract development for regional, school and orbital bus services. Ross has a Commerce degree and a Law degree from Melbourne University.
Hector McKenzie Director of Public Transport
Ross Alexander Executive Director
20 Department of Transport Annual Report 2007-08
Freight, Logistics and Marine
The efficient movement of freight and commercial traffic on Victoria’s roads, rail and port systems is essential for the state’s continued economic growth and prosperity. The Freight, Logistics and Marine Division is responsible for delivering the government’s policies in the ports, maritime, freight and logistics sectors in partnership with agencies, industry stakeholders and the community; and for the effective management of marine safety. Marine Safety Victoria reports directly to the Executive Director of the Freight, Logistics and Marine Division. The division encourages better use of Victoria’s freight network, plans for freight growth and works to overcome critical bottlenecks through infrastructure investment.
Terry Garwood Executive Director
Terry has been an officer of the Australian and Victorian Public Services for almost 29 years. Terry commenced this role in March 2007. Prior to this Terry held the position of Regional Director, Loddon Mallee Region, of the Department of Human Services from February 2000 until March 2007. Terry also held the positions of Regional Director, Hume Region, Department of Human Services (three years) and Director of the Victorian Office of Aboriginal Affairs (eight years). Terry has occupied senior management positions in the Australian Public Service in the Department of Employment, Education and Training, the Aboriginal Development Commission and Aboriginal Hostels Limited. Terry holds a Diploma of Arts and Graduate Diploma of Education from Latrobe University.
Integrated Transport Planning
The Intergrated Transport Planning Division seeks to achieve whole of government coordination of transport and land use planning through strengthening links between key transport and land use authorities including DOT, VicRoads, the Department of Planning and Community Development and the Department of Sustainability and Environment. It is also tasked with strengthening the state’s transport policy and planning capability and better integrate activities across the respective transport modes (road, rail, air and marine). This division has replaced the former Office of the Coordinator General for Infrastructure.
Meredith Sussex Executive Director
Since her appointment in August 2006 as Coordinator-General, Infrastructure, Meredith Sussex has worked to achieve whole of government coordination of transport and land-use planning. In early 2008, Meredith took on the role of Program Coordinator for the Federal Government’s Australia 2020 Summit. With the creation of the new Department of Transport in April 2008, Meredith assumed the role of Executive Director, Integrated Transport Planning, continuing the strong focus on integrated planning. From 2002 to 2006, Meredith was Executive Director, Office of Commonwealth Games Coordination. Other previously held roles include Director of Employment, Training and Tertiary Education and Deputy Secretary of Education from 1998 to 2002, and Head of the Cabinet Office and Deputy Secretary of the Department of Premier and Cabinet from 1994 to 1998.
Terry Garwood Executive Director
Meredith Sussex Executive Director
21
People and Organisational Development
The People and Organisational Development Division was created to strengthen and support DOT’s performance by building capability, by understanding the workforce, encouraging diversity, developing DOT people and promoting employee health and better people management. The People and Organisational Development Division has a critical role in helping the department meet its current and future challenges.
Robyn Clark Executive Director
Robyn Clark was appointed Executive Director of the People and Organisational Development Division in June 2008. Robyn joined the Department of Transport having run her own strategic human resources consulting business for the past seven years. Robyn has held senior roles within the HR field including Victorian Manager of a global HR Consulting company; Regional and National Manager of Employee Relations/Human Resources for Telstra and also worked with the Department of Human Services and Department of Health for 11 years. Robyn has been nominated for Telstra’s Business Woman of the Year Award for the past six years and holds an Associate Diploma in Welfare Studies, Bachelor of Arts (Human Services), Graduate Diploma in Adult Education and Training, Masters Degree in Education (Workplace) and has successfully completed an Executive MBA subject in Strategic Human Resource Management.
Policy and Communications
The Policy and Communications Division has been established to lead portfolio-wide transport policy development and provide policy and communications advice across the entire department. The division coordinates the delivery of the TravelSmart program and the Local Area Access program, and raises awareness and understanding of the department’s programs, projects and policies among key clients, stakeholders and the community.
Michael Hopkins Executive Director
Michael Hopkins was appointed Executive Director of the Policy and Communications Division in June 2008, having joined the Department of Infrastructure in 2000. Michael worked as Director of Market Development in the Public Transport Division in 2004. From late 2007 to June 2008 Michael was Director of DOI’s Corporate Public Affairs, responsible for the department’s communications and media management. Prior to 2000, he held a number of positions in the Australian Public Service and the ACT Government, including senior roles in strategic and environmental policy and several years as Chief of Staff to the ACT Minister for Urban Services. His career has focussed on strategic land-use planning; transport, infrastructure and environment policy; and more recently, communications. Michael has a Bachelor of Arts in philosophy and a Masters Degree in Public Administration.
Robyn Clark Executive Director
Michael Hopkins Executive Director
22 Department of Transport Annual Report 2007-08
DOT Legal
DOT Legal creates, maintains and enforces the policy, legal, regulatory and insurance environment for the delivery of transport for Victoria. The division provides critical advice and assistance on matters such as commercial transactions, risk, compliance, prosecutions and investigations and supports parliamentary and cabinet processes.
James Lavery Executive Director
James Lavery was appointed as Executive Director of DOT’s Legal Division and General Counsel for DOT in June 2008. James joined the Department of Infrastructure in 2004, as Commercial Counsel for the Public Transport Division. In 2005, he was appointed as General Manager of the Public Transport Division’s legal branch. Before joining the Department of Infrastructure, James was in private practice at law firm Phillips Fox, and was made a Senior Associate of that firm in 2001. James has practised in many areas of law, including administrative law, commercial law, major projects law and litigation. James holds a Bachelor of Laws (Honours) from Monash University and a Bachelor of Arts in history from Melbourne University.
Intergovernmental Relations
Intergovernmental Relations Division is responsible for managing Commonwealth, state and regional relations in transport.
Lachlan McDonald Executive Director
Lachlan has worked in infrastructure and industry policy roles in the public and private sectors for more than 20 years, including at the Master Builders Association of Victoria, Regional Development Victoria and as a consultant to Melbourne Water. He was previously Director of Regional Infrastructure Development for the Victorian Government and Chief of Staff to the former Minister for Transport and Major Projects. Lachlan joined the Department of Transport in April 2007. His current role focuses on providing the Secretary, Leadership Committee and Ministers with advice on Commonwealth policy and investment processes, identification of national infrastructure priority projects and coordination of the transport portfolio input to the Council of Australian Governments’ transport reform agenda.
James Lavery Executive Director
Lachlan McDonald Executive Director
23
Infrastructure Projects
The Infrastructure Projects Division is responsible for the development and delivery of major rail infrastructure projects within the government’s policy framework of Growing Victoria Together. A further policy driver is the government’s Meeting Our Transport Challenges plan, for which the division manages several projects including the Dynon Port Rail Link, Clifton Hill Rail Project and the Dandenong Rail Corridor Project.
Security and Emergency Management
The Security and Emergency Management Division (SEMD) is responsible for providing security and emergency coordination, advice and support to DOT and contributes to the whole of Victorian Government security and emergency management processes.
URTIC
Urban Redevelopment Transport Infrastructure Coordination (URTIC) coordinates the delivery of projects and the development of Transit Cities. Transit Cities is a government program to revitalise key suburban and regional centres through improved infrastructure and urban design to create better quality places for people to live, work, relax and visit.
Finance
The Finance Division supports the depatment’s internal and external financial management and financial reporting responsibilities. This includes budget management, financial operations and associated systems, taxation and financial management compliance.
Systems and Information Services
The Systems and Information Services Division manages the department’s information and communications technology systems and services, including the delivery of projects involving electronics and computing systems. It leads the development of DOT’s information and communication technology strategy, enterprise architecture and governance framework. This division guides IT investment and helps to maximise opportunities for information, business process and technology use.
Business and Executive Services
This division supports the functions of the department in areas such as corporate plannng, library services, property procurement and contracting, risk management, record and document management, online services, administrative services and ministerial services.
24 Department of Transport Annual Report 2007-08
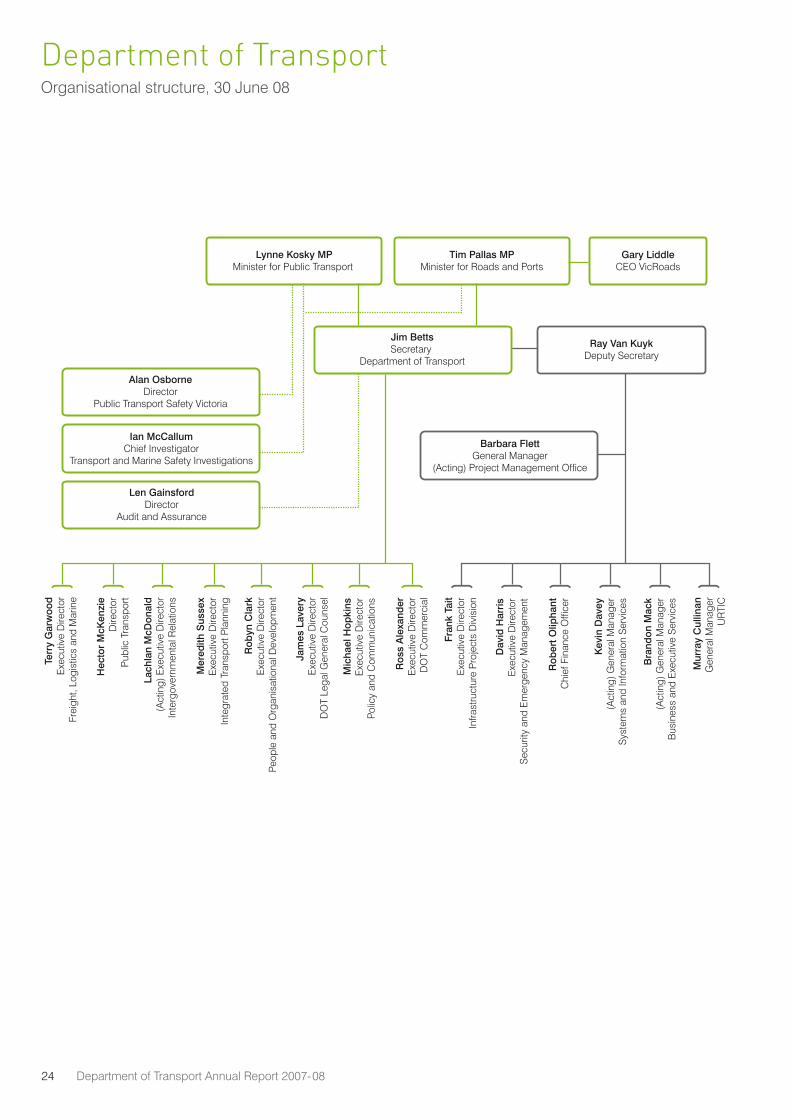
Department of TransportOrganisational structure, 30 June 08
Terr
y G
arw
ood
Exe
cutiv
e D
irect
orFr
eigh
t, Lo
gist
ics
and
Mar
ine
Hec
tor
McK
enzi
eD
irect
orP
ublic
Tra
nspo
rt
Lach
lan
McD
onal
d(A
ctin
g) E
xecu
tive
Dire
ctor
Inte
rgov
ernm
enta
l Rel
atio
ns
Mer
edith
Sus
sex
Exe
cutiv
e D
irect
orIn
tegr
ated
Tra
nspo
rt P
lann
ing
Rob
yn C
lark
Exe
cutiv
e D
irect
orPe
ople
and
Org
anis
atio
nal D
evel
opm
ent
Jam
es L
aver
yE
xecu
tive
Dire
ctor
DO
T Le
gal G
ener
al C
ouns
el
Mic
hael
Hop
kins
Exe
cutiv
e D
irect
orPo
licy
and
Com
mun
icat
ions
Ros
s A
lexa
nder
Exe
cutiv
e D
irect
orD
OT
Com
mer
cial
Jim BettsSecretary
Department of Transport
Lynne Kosky MPMinister for Public Transport
Tim Pallas MPMinister for Roads and Ports
Gary LiddleCEO VicRoads
Ray Van KuykDeputy Secretary
Barbara FlettGeneral Manager
(Acting) Project Management Office
Fran
k Ta
itE
xecu
tive
Dire
ctor
Infra
stru
ctur
e P
roje
cts
Div
isio
n
Dav
id H
arris
Exe
cutiv
e D
irect
orS
ecur
ity a
nd E
mer
genc
y M
anag
emen
t
Rob
ert O
lipha
ntC
hief
Fin
ance
Offi
cer
Kev
in D
avey
(Act
ing)
Gen
eral
Man
ager
Sys
tem
s an
d In
form
atio
n S
ervi
ces
Bra
ndon
Mac
k (A
ctin
g) G
ener
al M
anag
er B
usin
ess
and
Exe
cutiv
e S
ervi
ces
Mur
ray
Cul
linan
Gen
eral
Man
ager
UR
TIC
Ian McCallumChief Investigator
Transport and Marine Safety Investigations
Alan OsborneDirector
Public Transport Safety Victoria
Len GainsfordDirector
Audit and Assurance
25
Chief Finance Officer’s executive summary
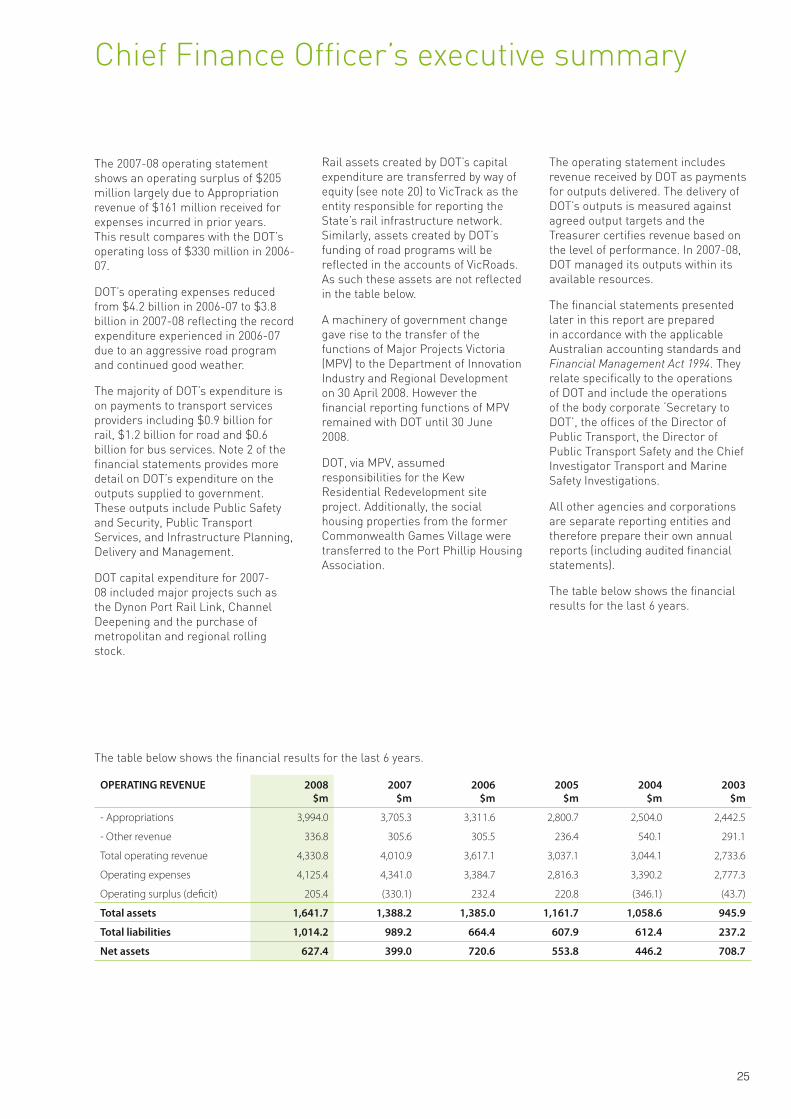
The 2007-08 operating statement shows an operating surplus of $205 million largely due to Appropriation revenue of $161 million received for expenses incurred in prior years. This result compares with the DOT’s operating loss of $330 million in 2006-07.
DOT’s operating expenses reduced from $4.2 billion in 2006-07 to $3.8 billion in 2007-08 reflecting the record expenditure experienced in 2006-07 due to an aggressive road program and continued good weather.
The majority of DOT’s expenditure is on payments to transport services providers including $0.9 billion for rail, $1.2 billion for road and $0.6 billion for bus services. Note 2 of the financial statements provides more detail on DOT’s expenditure on the outputs supplied to government. These outputs include Public Safety and Security, Public Transport Services, and Infrastructure Planning, Delivery and Management.
DOT capital expenditure for 2007-08 included major projects such as the Dynon Port Rail Link, Channel Deepening and the purchase of metropolitan and regional rolling stock.
Rail assets created by DOT’s capital expenditure are transferred by way of equity (see note 20) to VicTrack as the entity responsible for reporting the State’s rail infrastructure network. Similarly, assets created by DOT’s funding of road programs will be reflected in the accounts of VicRoads. As such these assets are not reflected in the table below.
A machinery of government change gave rise to the transfer of the functions of Major Projects Victoria (MPV) to the Department of Innovation Industry and Regional Development on 30 April 2008. However the financial reporting functions of MPV remained with DOT until 30 June 2008.
DOT, via MPV, assumed responsibilities for the Kew Residential Redevelopment site project. Additionally, the social housing properties from the former Commonwealth Games Village were transferred to the Port Phillip Housing Association.
The operating statement includes revenue received by DOT as payments for outputs delivered. The delivery of DOT’s outputs is measured against agreed output targets and the Treasurer certifies revenue based on the level of performance. In 2007-08, DOT managed its outputs within its available resources.
The financial statements presented later in this report are prepared in accordance with the applicable Australian accounting standards and Financial Management Act 1994. They relate specifically to the operations of DOT and include the operations of the body corporate ‘Secretary to DOT’, the offices of the Director of Public Transport, the Director of Public Transport Safety and the Chief Investigator Transport and Marine Safety Investigations.
All other agencies and corporations are separate reporting entities and therefore prepare their own annual reports (including audited financial statements).
The table below shows the financial results for the last 6 years.
The table below shows the financial results for the last 6 years.
OPERATING REVENUE 2008$m
2007$m
2006$m
2005$m
2004$m
2003$m
- Appropriations 3,994.0 3,705.3 3,311.6 2,800.7 2,504.0 2,442.5
- Other revenue 336.8 305.6 305.5 236.4 540.1 291.1
Total operating revenue 4,330.8 4,010.9 3,617.1 3,037.1 3,044.1 2,733.6
Operating expenses 4,125.4 4,341.0 3,384.7 2,816.3 3,390.2 2,777.3
Operating surplus (deficit) 205.4 (330.1) 232.4 220.8 (346.1) (43.7)
Total assets 1,641.7 1,388.2 1,385.0 1,161.7 1,058.6 945.9
Total liabilities 1,014.2 989.2 664.4 607.9 612.4 237.2
Net assets 627.4 399.0 720.6 553.8 446.2 708.7

26 Department of Transport Annual Report 2007-08

27
Public safety and security
Outcome One1
28 Department of Transport Annual Report 2007-08
Victoria has one of the safest transport systems in the world. DOT, in conjunction with transport partners such as VicRoads, VicTrack and rail operators, works diligently to upgrade transport infrastructure and systems to improve safety across the network.
Road safety
Deaths and serious injuries resulting from road crashes have a devastating impact on individuals and local communities. VicRoads works in partnership with the Transport Accident Commission (TAC), Victoria Police, Department of Justice, the Department of Transport, local communities and other key stakeholders to deliver Victoria’s road safety strategy, arrive alive 2008-2017.
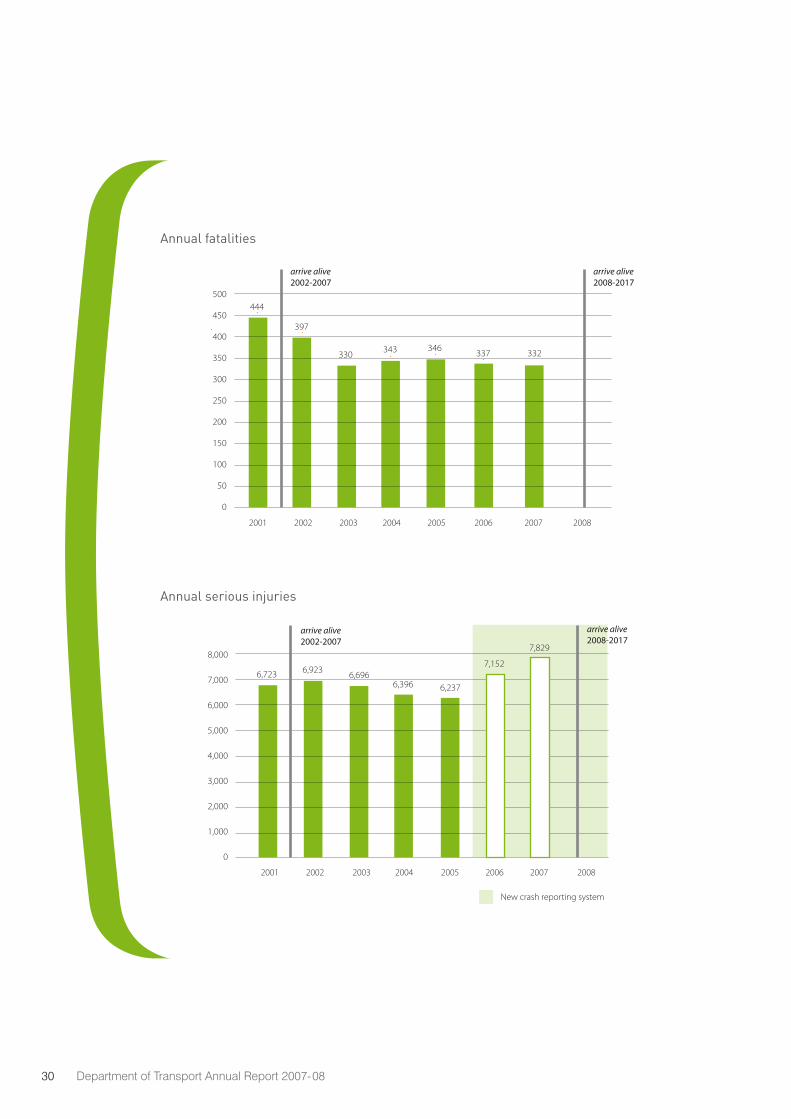
Victoria’s road toll for 2007 was 332, its second lowest annual road toll since comprehensive records began. For the 2007 calendar year, Victoria delivered the best state road safety record in Australia with only 6.4 deaths per 100,000 head of population. This is a 30 percent reduction compared with the rate of 9.2 deaths per 100,000 population at the start of Victoria’s road safety strategy, arrive alive! 2002–2007. The rate for the rest of Australia in 2007 was 8.1 deaths per 100,000 head of population.
From January 2002 to December 2005 there was a seven percent reduction in the number of Victorians seriously injured on our roads. A new electronic crash reporting system introduced by Victoria Police in December 2005 means it is not possible to directly compare pre- and post-December 2005 serious injury data. The new reporting system reveals a nine percent increase in serious injuries between 2006 and 2007. The latest available data at 30 June 2008 showed an 11 percent reduction in serious injuries in the first quarter of 2008 compared with the first quarter of 2007.
Full details of VicRoads’ road safety achievements are outlined in VicRoads 2007–08 Annual Report which is available at www.vicroads.vic.gov.au
Public safety and security
29
Highlights included:
coordinating the development of »Victoria’s new road safety strategy, arrive alive 2008-2017 which was launched in February 2008
delivering 245 projects across »Victoria under the Safer Roads Infrastructure Program and State and Federal Blackspot programs
progressing the implementation of »the Graduated Licensing System including developing a driving guide for new P plate drivers and their parents that encourages personal safety strategies and a new drive test for introduction on 1 July 2008
completing a trial of reduced speed »limits at strip shopping centres resulting in the announcement of an ongoing program to reduce speed limits in high pedestrian activity areas
playing a lead role in the »introduction of legislation in December 2007 enabling the Heavy Vehicle Driver Fatigue Management reform to be implemented from 29 September 2008. The package introduces ‘chain of responsibility’ principles to manage heavy vehicle driver fatigue
completing the Enhanced »Motorcycle Crash Investigation Project which has provided a more practical understanding of why motorcycle crashes occur and the factors that affect their severity
partnering with CityLink and »EastLink to develop a public education campaign called Share the road, reminding all road users to respect others on the road and act responsibly, particularly when using tunnels.
Accident towing reform
The Accident Towing Services Act 2007, which provides for safer and more efficient towing services, was developed to improve road safety and customer service for accident victims. The Act introduces modern industry accreditation for accident towing, whilst removing unnecessary regulation on the trade towing sector. As a result of the Act, regulatory responsibility moved from the Director of Public Transport to VicRoads on 3 September 2007. VicRoads’ responsibility for managing traffic congestion makes it well placed to deliver safer, efficient and more timely accident towing services.
Railway crossing safety
Level crossing safety package
Significant progress was made in delivering the State Government’s $33 million level crossing improvement package, announced following the tragic accident at Kerang in June 2007. Achievements in 2007-08 included:
installation of automated advanced »warning signs at five locations, with signs to be installed at a further 48 by June 2009
installation of rumble strips at »200 locations
increased penalties for railway »crossing infringements introduced in April 2008, along with a new infringement penalty for racing trains at railway crossings
an accelerated works program to »eliminate ‘line of sight’ problems such as overgrown vegetation at approximately 75 level crossings
trial of enforcement camera »technology at one metropolitan and one regional location
commencing work to reduce speed »limits from 100 kph to 80 kph at 73 locations, with all sites to be completed in 2008.
The Don’t Risk It! level crossing advertising campaign was updated to reference new safety measures such as rumble strips and advanced warning signs and ran across metropolitan and regional media in December 2007 and January 2008.
Level crossing upgrades
In the 2005-06 State Budget, the Level Crossing Upgrade Program was allocated $10.8 million over four years, on top of the annual investment of up to $3 million. Meeting Our Transport Challenges allocated a further $208.7 million over 10 years to improve railway crossing safety.
In 2007-08, 46 railway crossings were upgraded under the Level Crossing Upgrade and Railway Pedestrian Crossing Control Upgrade Programs, including 37 road/rail crossings and nine pedestrian crossings. A further 13 pedestrian railway crossings were made compliant with the Commonwealth Disability Discrimination Act 1992.
ALCAM
DOT used the Australian Level Crossing Assessment Model (ALCAM) method of risk assessment to survey 2,927 public road/rail and pedestrian level crossings on the Victorian rail network, which extends into southern New South Wales, and includes Victorian tourist and heritage rail lines. This assessment model helps to identify risk exposure at each crossing to provide a basis for prioritising upgrades. It helps road and rail safety authorities to identify safety improvements which will mitigate risks on their network. All surveys were completed on schedule by December 2007.
30 Department of Transport Annual Report 2007-08
2001 2002 2003 2004 2005 2006 2007 2008
2001 2002 2003 2004 2005 2006 2007 2008
New crash reporting system
arrive alive 2002-2007
arrive alive 2002-2007
arrive alive 2008-2017
arrive alive 2008-2017
500
450
400
350
300
250
200
150
100
50
0
8,000
7,000
6,000
5,000
4,000
3,000
2,000
1,000
0
6,723 6,923 6,6966,396 6,237
7,152
7,829
444
397
330 343 346 337 332
2001 2002 2003 2004 2005 2006 2007 2008
2001 2002 2003 2004 2005 2006 2007 2008
New crash reporting system
arrive alive 2002-2007
arrive alive 2002-2007
arrive alive 2008-2017
arrive alive 2008-2017
500
450
400
350
300
250
200
150
100
50
0
8,000
7,000
6,000
5,000
4,000
3,000
2,000
1,000
0
6,723 6,923 6,6966,396 6,237
7,152
7,829
444
397
330 343 346 337 332
Annual fatalities
Annual serious injuries

31
Safety Interface Agreements
Legislation was passed in December 2007 which provides for Safety Interface Agreements to deal with the intersection of rail and roads. The Agreements, between rail infrastructure managers, road authorities and, where necessary, private landholders, are based on risk assessments and aim to ensure there is a clear process for allocating responsibilities in order to improve safety at level crossings. Victoria was the first jurisdiction to pass these provisions, which will take effect nationally in 2010.
Systems and communications
Train safety and communications
The new Metropolitan Train Safety Communications System will use a secure digital radio system to improve the coverage, capacity and reliability of voice communications and enable data exchange across the rail system. In February 2008, three short-listed parties submitted tenders and tender evaluation is in progress. The main contract covering the GSM-R radio network portion of the system is planned to be awarded in October 2008 with system acceptance planned for December 2010.
A project to replace analogue CCTV recording technology with digital recorders at all metropolitan train stations began in July 2007. A procurement process, including equipment trials, was completed in June 2008 and a preferred supplier has been engaged.
The Flinders Street Station security/access control system was upgraded to enhance security and has been operational since February 2008. New security cameras were installed on three floors covering lifts and stairs, and a security workstation was established for the ground floor security guard.
During 2007-08, improvements were made to the intruder detection and passenger safety systems in the Melbourne Underground Rail Loop. Further improvements will be completed in 2008-09.
In 2007-08, a feasibility study was completed into delivering commercial FM radio broadcasts into the Melbourne Underground Rail Loop for public convenience and emergency communication. A 10-channel system is planned for deployment during 2008-09.
Tram service improvements
The Tram Supervisory Control and Data Acquisition (SCADA) project is replacing the tram traction power control system, with funding provided in the 2008-09 budget. Tender documents and specifications for the Tram SCADA system were completed ready for tender in February 2008.
In November 2007, two trams were involved in a trial of external video cameras called TramCam to assess how to best enforce road rules to improve tram passenger safety. It showed how footage can be used as evidence of infringements, such as cars passing trams when passengers are alighting.
Taxi safety
Taxi service improvements
A specification has been developed to supply upgraded safety cameras for new taxis from 2009.
Taxi industry reform
Amendments were made to transport legislation to improve the taxi industry through the introduction of tougher touting laws. The changes have reduced annoyance of passengers and made the system fairer for taxi drivers. These reforms complement the implementation of accreditation-based initiatives to improve taxi industry services.
Improved driver and passenger safety measures
The Taxi Industry Safety Taskforce (TIST) chaired by the Director of Public Transport and including representatives of the Victorian Taxi Directorate (VTD), Victoria Police, the Equal Opportunities Commission, WorkCover and the Multicultural Commission of Victoria issued an eight point Victorian Taxi Safety Strategy covering the following:
introducing conflict resolution »training to the Course in Taxi Driving
safe taxi ranks for Richmond, »St. Kilda and Bendigo
new security cameras technology »to be progressively phased in from January 2009
driver protection screens »
a taxi driver safety pack for all »active taxi drivers including a driver safety card and the handbook Victorian Taxi Driver Safety: Your Guide to a Safer Workplace
promotion of » victims of crime support services to active taxi drivers. A safer workplace via a Victorian WorkCover Authority program of education and awareness around occupational health standards and requirements for taxi drivers, operators and networks
ongoing forums for taxi drivers »through the Victorian Taxi Drivers Association (VTDA). The VTD has also recruited a Taxi Driver Liaison Officer for information and driver support.
32 Department of Transport Annual Report 2007-08
Following on from the Victorian Taxi Safety Strategy announced in 2007, a range of safety measures were announced in late April to further improve taxi driver and passenger safety. These include pre-paid fares between 10pm and 5am, mandatory driver protection screens and free conflict resolution workshops. These initiatives will be introduced later in 2008.
Further details of achievements to improve the taxi industry are included in Outcome Three.
Passenger safety
Personal safety on public transport
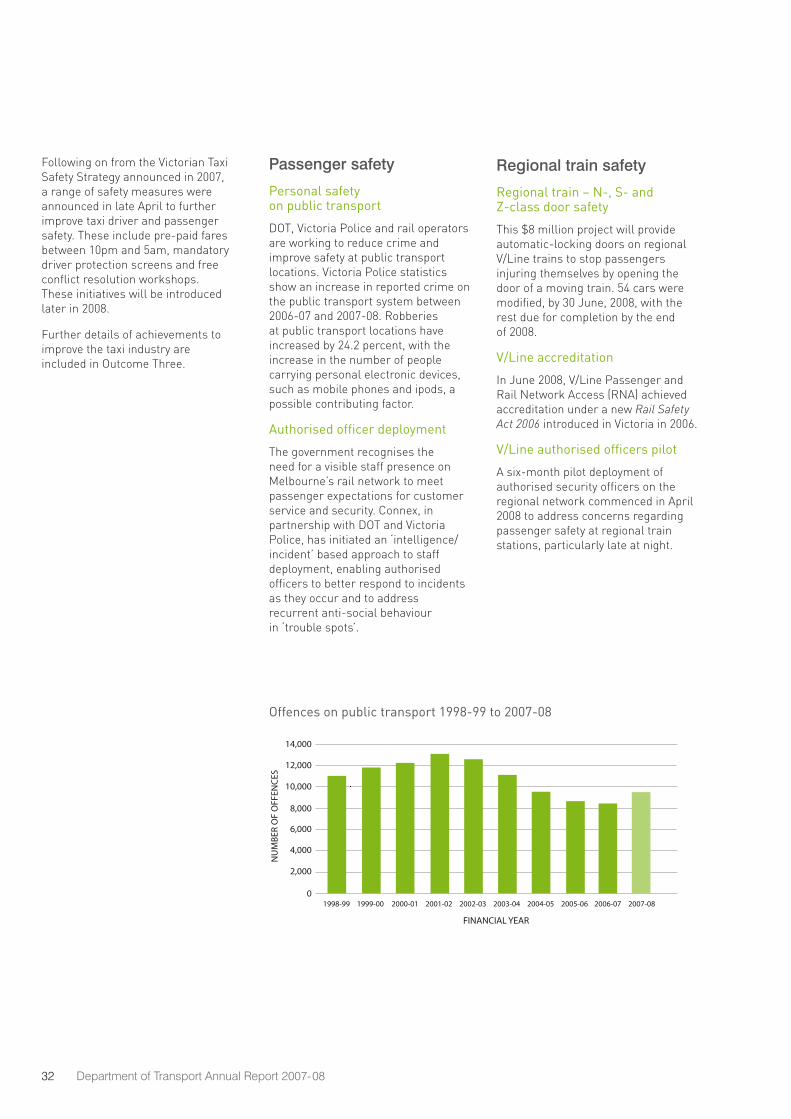
DOT, Victoria Police and rail operators are working to reduce crime and improve safety at public transport locations. Victoria Police statistics show an increase in reported crime on the public transport system between 2006-07 and 2007-08. Robberies at public transport locations have increased by 24.2 percent, with the increase in the number of people carrying personal electronic devices, such as mobile phones and ipods, a possible contributing factor.
Authorised officer deployment
The government recognises the need for a visible staff presence on Melbourne’s rail network to meet passenger expectations for customer service and security. Connex, in partnership with DOT and Victoria Police, has initiated an ‘intelligence/ incident’ based approach to staff deployment, enabling authorised officers to better respond to incidents as they occur and to address recurrent anti-social behaviour in ‘trouble spots’.
Regional train safety
Regional train – N-, S- and Z-class door safety
This $8 million project will provide automatic-locking doors on regional V/Line trains to stop passengers injuring themselves by opening the door of a moving train. 54 cars were modified, by 30 June, 2008, with the rest due for completion by the end of 2008.
V/Line accreditation
In June 2008, V/Line Passenger and Rail Network Access (RNA) achieved accreditation under a new Rail Safety Act 2006 introduced in Victoria in 2006.
V/Line authorised officers pilot
A six-month pilot deployment of authorised security officers on the regional network commenced in April 2008 to address concerns regarding passenger safety at regional train stations, particularly late at night.
1998-99 1999-00 2000-01 2001-02 2002-03 2003-04 2004-05 2005-06 2006-07 2007-08
14,000
12,000
10,000
8,000
6,000
4,000
2,000
0
NU
MBE
R O
F O
FFEN
CES
FINANCIAL YEAR
Offences on public transport 1998-99 to 2007-08
33
Bus safety
The Improving Bus Safety in Victoria discussion paper, which proposes a modern, flexible legislative framework to meet Victoria’s transport needs, was released in May 2008. The submissions, consultations and briefings which followed indicate strong support for the proposals. The framework is designed to embed a safety culture in the growing and dynamic bus industry.
The paper contained a detailed reform proposal to improve bus safety in Victoria including:
an expanded definition of the type »of vehicles that quality as “buses”
safety duties on several bus »industry participants, not just operators
accreditation for commercial »services (including commercial “courtesy services”)
a wide array of enforcement powers »and sanctions for the Director, Public Transport Safety (as exists for the rail sector).
A new Bus Safety Bill based on these initiatives is due to be introduced into Parliament in late 2008.
Security and emergency management
Security risk management and compliance regime for declared essential service operators
Public transport operators that are declared essential services under Part 6 of the Terrorism (Community Protection) Act 2003 (the Act), have continued to develop their capabilities in security risk and emergency. This has contributed to an improvement in the sector’s overall preparedness and resilience, and its interaction with other essential services such as energy.
Security and emergency management exercises
DOT facilitated government and industry involvement in national and state exercise programs including the National Counter-Terrorism Investigation and Consequence Management Exercise Nexus in February 2008. These exercises helped develop industry and government emergency response preparedness.
Business continuity
DOT commenced a complete review and reorganisation of business continuity program arrangements with a consolidated focus on IT disaster recovery, divisional plans and pandemic planning.
Pandemic planning
DOT assisted transport operators in their development of influenza pandemic planning measures through workshops and regular information. DOT identified and commenced prioritisation of planning measures within the department as part of its Business Continuity Management program.
Incident management coordination
With relocation to 121 Exhibition Street, DOT consolidated its incident management and coordination functions to ensure the provision of advice to government and industry during major incidents and emergencies such as the Burnley tunnel crash, the April 2007 windstorms and the Gippsland floods. DOT introduced a new incident management web-based communications system to allow for contact with all stakeholders during an incident.
Security and continuity network
DOT continued its security and continuity network for transport as the principal forums for government and industry to coordinate sector-wide risk, security, business continuity and emergency management issues.
Public transport security capital works
DOT continued to implement the capital works programs announced in 2005-06 and 2006-07 relating to public transport security such as CCTV retrofits and upgrades and initial purchase of rail network emergency response vehicles.

34 Department of Transport Annual Report 2007-08
35
Marine Safety Victoria
Responsibilities
The core functions of MSV are to:
set standards for the design, »construction and equipment of commercial vessels to maintain structural integrity and seaworthiness
determine crewing for vessels and »issue certificates of competency
set safety standards related to »recreational vessels and zoning rules
license pilots and harbour masters »and determine standards for the training of pilots, pilot exempt masters and harbour masters
investigate marine incidents »and accidents and implement appropriate action on the findings
develop, review, coordinate and »manage the Victoria marine pollution contingency plan
promote education and training »on marine safety matters
commission and sponsor research »in marine safety matters.
Recreational boating and fatalities
Over the last four years there was an average of 192 hospital admissions and 471 emergency department presentations as a result of recreational boating accidents. This represents a 30% increase from 2004-05 to 2005-06 (note: there is a 12 to 18 month delay for data). This increase is due to better case capture by hospitals and more hospitals collecting data.
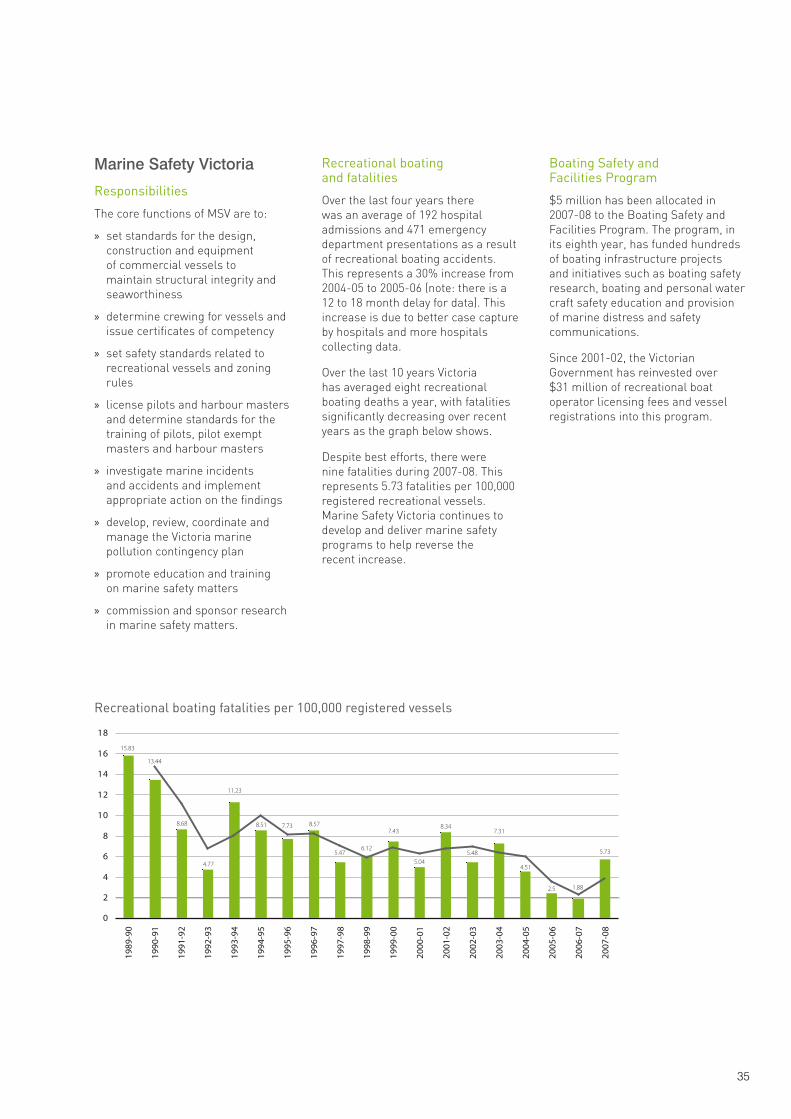
Over the last 10 years Victoria has averaged eight recreational boating deaths a year, with fatalities significantly decreasing over recent years as the graph below shows.
Despite best efforts, there were nine fatalities during 2007-08. This represents 5.73 fatalities per 100,000 registered recreational vessels. Marine Safety Victoria continues to develop and deliver marine safety programs to help reverse the recent increase.
Boating Safety and Facilities Program
$5 million has been allocated in 2007-08 to the Boating Safety and Facilities Program. The program, in its eighth year, has funded hundreds of boating infrastructure projects and initiatives such as boating safety research, boating and personal water craft safety education and provision of marine distress and safety communications.
Since 2001-02, the Victorian Government has reinvested over $31 million of recreational boat operator licensing fees and vessel registrations into this program.
0
2
1989
-90
1990
-91
1991
-92
1992
-93
1993
-94
1994
-95
1995
-96
1996
-97
1997
-98
1998
-99
1999
-00
2000
-01
2001
-02
2002
-03
2003
-04
2004
-05
2005
-06
2006
-07
2007
-08
4
6
8
10
12
14
16
18
15.83
13.44
8.68
4.77
11.23
8.51 7.73 8.57
5.476.12
7.43
5.04
8.34
5.48
7.31
4.51
2.5 1.88
5.73
Recreational boating fatalities per 100,000 registered vessels
36 Department of Transport Annual Report 2007-08
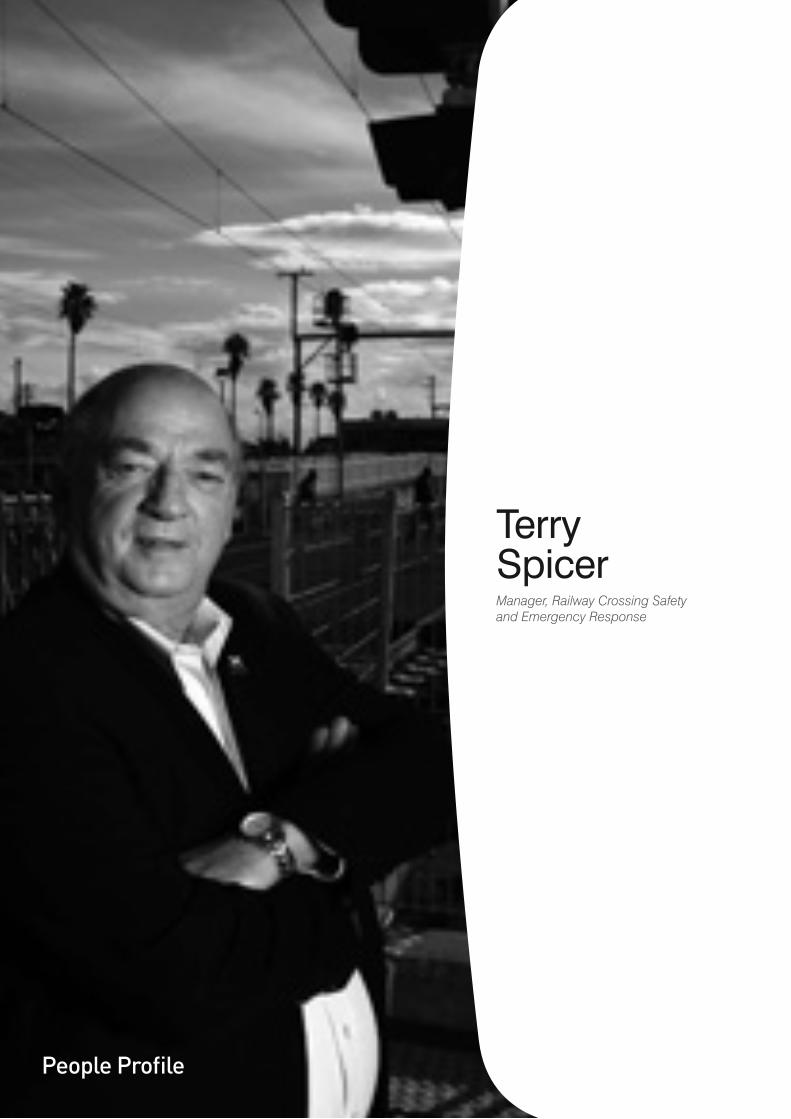
Terry SpicerManager, Railway Crossing Safety and Emergency Response
People Profile
37
I suppose you would say I am one of Victoria’s railway crossing safety experts. I provide advice to the Minister and Director of Public Transport about everything to do with railway crossing safety.
A couple of years ago we were upgrading 12 railway crossings a year and now we are doing over 60.
In 2007-08, we upgraded safety controls at 45 road and pedestrian railway crossings and made 13 pedestrian crossings DDA (Disability Discrimination Act 1992) compliant. We also installed five active advanced warning signs – which will flash to warn cars of a train crossing well before the crossing controls activate – and, along with VicRoads, installed rumble strips at 200 railway crossings with stop or give-way signs.
I am also a member of the Australian Level Crossing Assessment Model (ALCAM) National Committee. The committee has developed a national railway crossing risk assessment model to identify public risk and to assist with prioritising the state railway crossing control annual upgrade program.
Between December 2005 and December 2007 we completed almost 3,000 ALCAM field surveys for every public road and pedestrian railway crossing in Victoria including those level crossings on Victorian rail lines which cross the border into NSW and on nine heritage and tourist rail lines. The results of these are being analysed and reviewed to identify potential risk mitigation treatments at all railway crossings.
I have just come back from attending the 10th World Railway Crossing Safety Conference in Paris. There were 166 delegates from 37 countries at the symposium. I delivered a paper on a case study of $1.2 million of railway pedestrian crossing safety initiatives
being trialled at Bentleigh. It was pleasing to discover that Australia and Victoria are considered world leaders in many facets of railway crossing safety. I also travelled to the UK and liaised with experts there.
Part of my job is to make sure that the recommendations of the three bodies which investigate deaths on railway crossings – the State Coroner, the Australian Transport Safety Bureau and the Office of the Chief Investigator, Transport and Marine – are appropriately addressed.
Even though I am a bureaucrat now, I still consider myself a railway man and have had 47 years experience in the industry. I started my career at 16 with the old Victorian Railways. I then worked on the iron ore railways in Western Australia. I moved back to Melbourne and worked for the State Transit Authority and then the Public Transport Corporation. I helped set up VicTrack and then in 1999 moved to the Office of the Director of Public Transport.
In 1967 I was the first of the new breed of station masters and at 22 was the youngest station master ever appointed. Now, I want to be the new breed of mature worker. I want to keep working until I have worked for the railways for 50 years, which I will hit in 2011.
Between the 1960s and the 1990s, we reduced our motor vehicle fatal accidents at railway crossings by 85 percent in Victoria, compared to the national average of 70 percent. But the problem is that this figure has plateaued from an average of 22 a year to an average of four a year. One of the things that excites me is how the application of new technology will help us reduce this figure to zero deaths. Victoria is leading the trialling of a number of these new technologies.

38 Department of Transport Annual Report 2007-08
39
Infrastructure delivery and management
Outcome Two2
40 Department of Transport Annual Report 2007-08
Safe, modern and efficient rail and road infrastructure is vital to connect Victorian communities, transport freight and keep our economy competitive. This Outcome reports on achievements in delivering and managing infrastructure projects. Completion of the Craigieburn rail electrification and completion of the EastLink, Australia’s largest urban road project, were among the highlights of 2007-08.
Some of DOT’s projects are delivered in conjunction with the private sector, while statutory authorities, such as VicRoads, also contribute to this Outcome. Summaries of the achievements of these authorities are included in this Outcome, with further detail available from their respective annual reports.
The outputs of Major Projects Victoria are reported in the 2007-08 annual report for the Department of Innovation, Industry and Regional Development following machinery of government changes in April 2008.
Infrastructure delivery and management
41
Channel deepening
In February 2008, the Port of Melbourne Corporation began deepening Melbourne’s shipping channels to allow 14 metre draught vessels access at all stages of the tide within Port Phillip Bay and the Yarra River.
An independent environmental monitor is overseeing the project’s strict environmental conditions, with deepening expected to be completed during summer 2009-10. As at 30 June 2008, the project was ahead of schedule, within all environmental limits and 23 percent complete.
Net dredge volumes (cubic metres) as at 30 June 2008:
Port Melbourne Channel – »2.22 million
South Channel – 2.56 million »
Entrance – 277,000 »
Yarra River – 245,000 »
Total: Almost 5.3 million »cubic metres.
Rail infrastructure
In May 2008, the Federal and State Governments announced the $500 million North-East Rail Revitalisation Project. The project will remove the rail line from the Wodonga CBD and convert 200 kilometres of track from broad to standard gauge. This will support the delivery of an upgraded passenger and rail freight link between Melbourne and Sydney and improve passenger rail services between Melbourne and Albury-Wodonga. Works will commence later this year and be completed in 2010. Further details of this project are included in Outcome Five.
Clifton Hill Rail Project
The $52 million Clifton Hill Rail Project is the second stage of the South Morang Rail Extension Project. It will improve the efficiency and reliability of Epping and Hurstbridge train services and provide capacity for the future rail extension to South Morang. The project involves:
duplicating approximately 750 »metres of track between Clifton Hill and Westgarth Railway Stations
constructing a new 170 metre »rail bridge over the Merri Creek, parallel to the existing 1880s structure
upgrading four pedestrian »crossings with the installation of automatic gates and audible warning signals
associated signalling and overhead »power works.
Connex started early works in January 2008. John Holland Pty Ltd won the main works contract and commenced work in August 2008 for completion in early 2010. The project team and the Yarra and Darebin Councils have been in close consultation to facilitate the planning approvals required for the project.
Craigieburn Rail Project
The $115 million Craigieburn Rail Project was completed in 2007-08 and extended electrified metropolitan train services from Broadmeadows to Craigieburn.
Work included:
upgrading Craigieburn to a »premium station that is fully staffed from first train to last
a new station at Roxburgh Park »
track and civil works »
extension and upgrading of the »existing Craigieburn Station car park
the installation of an overhead »power system and a new signalling system.
Services commenced on 30 September 2007, with trains seven days a week from early morning to late at night and most services connecting directly to the City Loop.
Dandenong Rail Corridor Project
The Dandenong Rail Corridor (DRC) is a vital public transport link for south-east Melbourne and serves a rapidly growing area of more than half a million people. Enhancements to rail services along the DRC will be provided by the staged delivery of projects. This approach will minimise the impacts of construction while introducing capacity and reliability improvements.
Stage 1 Cranbourne Stabling and Station Upgrade Project
This $37.1 million project involves the design and construction of new train stabling to support improved services, the upgrading of Cranbourne Railway Station to meet Disability Discrimination Act 1992 (DDA) compliance, and 400 new car parking spaces. The contract for main works was won by Thiess Pty Ltd in December 2007. Work started in January 2008 and will be completed during 2009.
Stage 2 Westall Rail Upgrade
Funding was allocated in the 2008-09 budget for the $153 million Westall Rail upgrade. This project involves construction of 2.7 kilometres of third track, a third platform, additional stabling, improvements to passenger amenities, safety and DDA access, additional drivers’ facilities, and more car parking. Works will take place between 2009 and 2011. This upgrade will improve train reliability for a growing number of passengers.

42 Department of Transport Annual Report 2007-08
43
Laverton Rail Upgrade Project
Funding was allocated in the 2008-09 budget for the $92.6 million Laverton Rail upgrade, which will feature a third track, third platform and additional station facilities. These works will enable “short starter” trains to begin and finish their journeys at Laverton, improving reliability for the Werribee line and V/Line Geelong services. Works are expected to commence in 2009 and be completed in 2011.
Systems and signalling
The State Government has committed to upgrading older train control and management systems to deliver a modern, reliable rail network. High quality systems are essential to operating a safe, reliable and efficient network and allowing for future expansion of the network.
Upgrading the existing signalling system in Melbourne’s inner west to a computer-based interlocking signalling system will improve the reliability and operability of regional and interstate rail lines. It will also improve operating efficiency between North Melbourne Station and the western edge of the central business district. Works started in August 2007 and include track works (renewing old points and crossings), construction of a new Motorail facility to load cars onto trains, and the extension of Southern Cross Station’s platform two. Works will be completed by October 2008.
The Rail Operations Management System Project will deliver planning and day-of-operation management tools that allow fleet and staff to be planned based on timetable requirements. The project will deliver the following systems:
Timetable Management »System (TMS)
Fleet Management System (FMS) »
Staff Management System (SMS). »
The project has a staged approach with the first stage of TMS expected to be delivered by December 2008.
Work is also under way to improve real time monitoring of train movements by extending telemetry infrastructure.
Suburban rolling stock
The present train fleet is made up of 165.5 trains (331 units). For the proposed November 2008 timetable, Connex will have 148 trains available for the morning peak and 140 for the evening peak. Prior to the commencement of this franchise in April 2004, the rail operators provided 134 trains for the morning peak and 132 for the evening peak. The ability to provide these additional trains for passenger services has come from a significant improvement in maintenance practices driven by investment by Connex and the state.
Steps being undertaken by Connex to further improve the performance and availability of its fleet include:
increased maintenance workshop »utilisation and efficiency
additional staff employed to support »higher train availability
introduction of an additional shift »at Epping depot
delivery of improvement works »at depots
targeted programs aimed at »improving vehicle reliability reducing reactive maintenance.
Connex has also commenced a project to improve the reliability of four Comeng trains’ “chopper units” which suffer from poor performance as a result of modifications made to their traction motors in the1990s. This project is due to be completed by October 2008.
In addition there has been a $16 million upgrade of seven Hitachi vehicles. It was originally intended to retire the remaining Hitachi fleet after the Commonwealth Games in March 2006, but patronage growth has necessitated their retention. The trains are now being refurbished and an additional Hitachi train has been secured to maintain fleet numbers during the refurbishment program.
In December 2007, Alstom was awarded an order to make and supply 18 new six carriage Xtrapolis trains for the Melbourne metropolitan network. They will be delivered from late 2009 and carry at least 14,500 passengers during the peak period, equivalent to more than six freeway lanes of capacity.
New and refurbished rolling stock – V/Line and CountryLink
New rolling stock for the regional fleet is being acquired to help meet increasing patronage and operational demands. This program includes the purchase of two new VLocity trains, the acquisition of Intermediate carriages to increase capacity on the VLocity fleet and the transfer of two Sprinter trains to operation on the Stony Point line.
The two VLocity cars were delivered in December 2007. The first intermediate carriage was accepted for testing in June 2008 with the remaining vehicles to be progressively introduced into service over 2008-09 and 2009-10.
A $13.2 million refurbishment program is under way to deliver enhanced amenity for those services where VLocity trains do not operate. By June 2008, six Sprinter cars and two H-car sets had been refurbished, with the remaining vehicles to be refurbished by June 2010.
44 Department of Transport Annual Report 2007-08
Victoria has an ownership interest in eight XPT cars within the CountryLink fleet and RailCorp is conducting a refurbishment of the entire CountryLink fleet. As at 30 June, 2008, two powered cars and three first-class carriages had been refurbished.
Tram improvements
The state is funding the Yarra Trams lease of five low-floor Alstom Citadis trams originally built for the town of Mulhouse in France. With the Mulhouse network expansion delayed, Melbourne has been given the opportunity of a temporary lease. Delivery has been progressive, with the first tram arriving in February 2008 and the final by the end of 2008. Each tram will require modifications for operation in Melbourne, such as upgraded air conditioning systems and installation of Melbourne ticketing system and wheel profiles.
North Melbourne Station
This $38.6 million station upgrade will add a concourse spanning all six platforms and a new commuter entrance. Construction has commenced with the completion of heritage restoration works and the concourse foundations, enabling works and services relocation. The project is scheduled for completion in 2010.
EastLink stations
$20 million was allocated to upgrade accessibility, safety and amenity of Dandenong, Kananook, Noble Park and Heatherdale stations as part of EastLink. The upgrade was completed in November 2007 following the completion and commissioning of improved lighting, CCTV cameras, car parks and DDA compliance works.
Park and Ride
The 2006 budget allocated $7 million to provide around 800 additional car parks and improved lighting and CCTV coverage at eleven metropolitan and regional stations. 1,270 additional car parks were created during 2007-08 at the following sites.
Beaconsfield (approximately »120 car parks)
Cranbourne (approximately »90 car parks)
Pakenham (approximately »55 car parks)
Wattle Glen (approximately »60 car parks)
Ballan (approximately »125 car parks)
Drouin (approximately »160 car parks)
Gisborne (approximately »135 car parks)
Lara (approximately »125 car parks)
Wallan (approximately »150 car parks)
Garfield (approximately »80 car parks)
Bacchus Marsh (approximately »170 car parks).
Craigieburn Stabling Project
In September 2007, five train stabling sites costing $12.5 million were constructed and commissioned to provide train operational capacity and flexibility at Craigieburn station.
Stations and modal interchanges
$20 million has been allocated to upgrade the stations and modal interchanges at Coburg, Frankston, Broadmeadows and Preston. A design contract was awarded in October 2007 for:
DDA compliance works »
enhanced lighting and »CCTV cameras
improved station facilities, »amenities and signage
weather protection. »
Works at Frankston station are scheduled for completion by the end of 2009 with the remaining stations scheduled for completion in 2011.
Premium Station Project
The May 2007 budget carried a program to upgrade a further seven stations to premium status. This requires each station to be staffed from first to last train and improvements to security and customer amenity. During 2007-08, Darling, Watsonia, Mentone and Upfield stations were upgraded. Design work on Bell and Burnley stations was completed and works due to start in late 2008 for completion in early 2009. The final station will be designed and constructed by December 2010.
45
Graffiti removal
The Department of Transport, along with Connex and Community Corrections Victoria, has developed a cleaning program involving people on community-based work orders. This program has resulted in the removal of graffiti and posters from a number of public transport assets, including the Flinders Street Station viaduct. It is being expanded across the metropolitan network to clean up rail assets and deter vandals.
In April 2008, an anti-access mechanism to protect the rail bridge at Sherbourne Road, Montmerency, was trialled as a joint venture between the Department of Transport, Connex and VicTrack to address community concerns surrounding ongoing graffiti at the site, which is the main gateway to the suburb.
Road infrastructure
Growing Victoria Together is a vision to grow and link all of Victoria, connecting people, communities and businesses. VicRoads delivers this vision through road and bridge improvements to enhance the efficiency and accessibility of the arterial road network.
Full details of VicRoads achievements are outlined in VicRoads 2007-08 annual report which is available at www.vicroads.vic.gov.au
Highlights include:
completing the $242 million »Pakenham Bypass in December 2007
completing the $40.5 million »Goulburn Valley Highway Arcadia duplication in June 2008
progressing the Monash-CityLink- »West Gate Freeway upgrade, Calder Freeway upgrade, Geelong Ring Road and Deer Park Bypass
completing 14 and progressing »11 outer metropolitan road projects
completing 30 and progressing »seven regional road projects
maintaining 53,163 lane kilometres »of road and 3,407 bridges, achieving targets of 91 percent of travel on smooth roads in metropolitan Melbourne and 93 percent in regional Victoria.
EastLink
Australia’s largest urban road project, Eastlink, was opened to traffic five months ahead of schedule on 29 June 2008. EastLink was the state’s most significant Public Private Partnership in 2007-08, with construction costs of $2.5 billion funded by concessionaire ConnectEast.
The project will significantly improve travel through Melbourne’s east and south east and deliver a $15 billion boost for the local economy. The number of jobs located within a 30 minute drive of the City of Greater Dandenong alone has doubled with the opening of Eastlink and it is expected that an additional 6,500 jobs will exist in Victoria as a result of Eastlink’s operation. EastLink adds new capacity to our road network, slashing travel times between Mitcham and the Frankston Freeway on EastLink to 24 minutes and reducing congestion on surrounding arterial roads. A shared use pathway, including 35 kilometres of new pathway, along the EastLink route from Mitcham to Carrum Downs, opened in June 2008.
Over 150,000 people attended the EastLink Community Open Day on EastLink on 15 June 2008, which featured cycling and running events, vintage car parades and a community festival and celebration. The ‘share the road’ tunnel walkthrough element was jointly funded by government to promote Eastlink’s outstanding safety features.
A tunnel naming competition for the EastLink tunnels attracted more than 2,000 entries with Melba and Mullum Mullum selected as the winning names. Victoria’s biggest and busiest interchange at the Monash Freeway was named after Tom Wills by the Minister for Roads and Ports in recognition of one of the founding fathers of Australian Rules Football. The Bend Road heritage site and surrounding wetlands was named in consultation with the Wurundjeri Council in recognition of its aboriginal significance.
Other key milestones included the Minister planting the one millionth plant on the EastLink project and the opening of the Dandenong Bypass by the Premier.
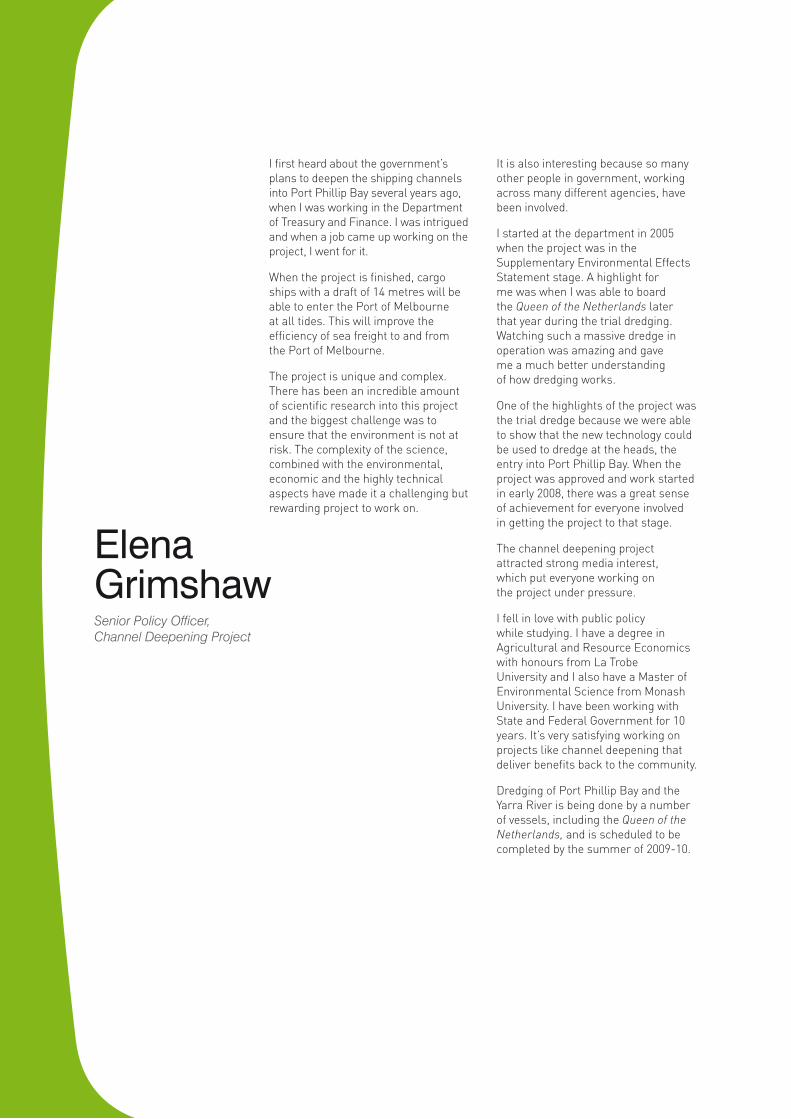
46 Department of Transport Annual Report 2007-08
I first heard about the government’s plans to deepen the shipping channels into Port Phillip Bay several years ago, when I was working in the Department of Treasury and Finance. I was intrigued and when a job came up working on the project, I went for it.
When the project is finished, cargo ships with a draft of 14 metres will be able to enter the Port of Melbourne at all tides. This will improve the efficiency of sea freight to and from the Port of Melbourne.
The project is unique and complex. There has been an incredible amount of scientific research into this project and the biggest challenge was to ensure that the environment is not at risk. The complexity of the science, combined with the environmental, economic and the highly technical aspects have made it a challenging but rewarding project to work on.
It is also interesting because so many other people in government, working across many different agencies, have been involved.
I started at the department in 2005 when the project was in the Supplementary Environmental Effects Statement stage. A highlight for me was when I was able to board the Queen of the Netherlands later that year during the trial dredging. Watching such a massive dredge in operation was amazing and gave me a much better understanding of how dredging works.
One of the highlights of the project was the trial dredge because we were able to show that the new technology could be used to dredge at the heads, the entry into Port Phillip Bay. When the project was approved and work started in early 2008, there was a great sense of achievement for everyone involved in getting the project to that stage.
The channel deepening project attracted strong media interest, which put everyone working on the project under pressure.
I fell in love with public policy while studying. I have a degree in Agricultural and Resource Economics with honours from La Trobe University and I also have a Master of Environmental Science from Monash University. I have been working with State and Federal Government for 10 years. It’s very satisfying working on projects like channel deepening that deliver benefits back to the community.
Dredging of Port Phillip Bay and the Yarra River is being done by a number of vessels, including the Queen of the Netherlands, and is scheduled to be completed by the summer of 2009-10.
Elena GrimshawSenior Policy Officer, Channel Deepening Project

47People Profile

48 Department of Transport Annual Report 2007-08
49
Access and mobility
Outcome Three3
50 Department of Transport Annual Report 2007-08
Providing transport services and infrastructure that are accessible and efficient is essential to connect people with employment opportunities, healthcare services, and recreational facilities. DOT is working to ensure Victoria’s transport system connects communities through a range of initiatives to improve safety, access, performance and reliability, minimise travel delays and disruptions, improve liveability and encourage sustainable travel choices.
Public transport performance
Metropolitan train services
A total of 99 percent of scheduled metropolitan train services ran in 2007-08 compared to 98.9 percent in 2006-07. Punctuality for metropolitan train services for 2007-08 was 92.3 percent compared with 92.2 percent for 2006-07.
Tram services
Service delivery by Yarra Trams during 2007-08 has been excellent, with 99.7 percent scheduled services running. When measured as an average across the journey, tram punctuality was at 81.8 percent for 2007-08 with an average ‘at destination’ result of 71.7 percent. These figures are lower than those recorded for the 2006-07 financial year, with increased road congestion and patronage impacting tram punctuality. Despite this, tram service performance has improved since the franchising of tram services in 1999.
Metropolitan bus services
Metropolitan bus services have maintained levels of performance consistent with previous years. On average, 95 percent of services were on time and 99.9 percent of services ran.
Access and mobility
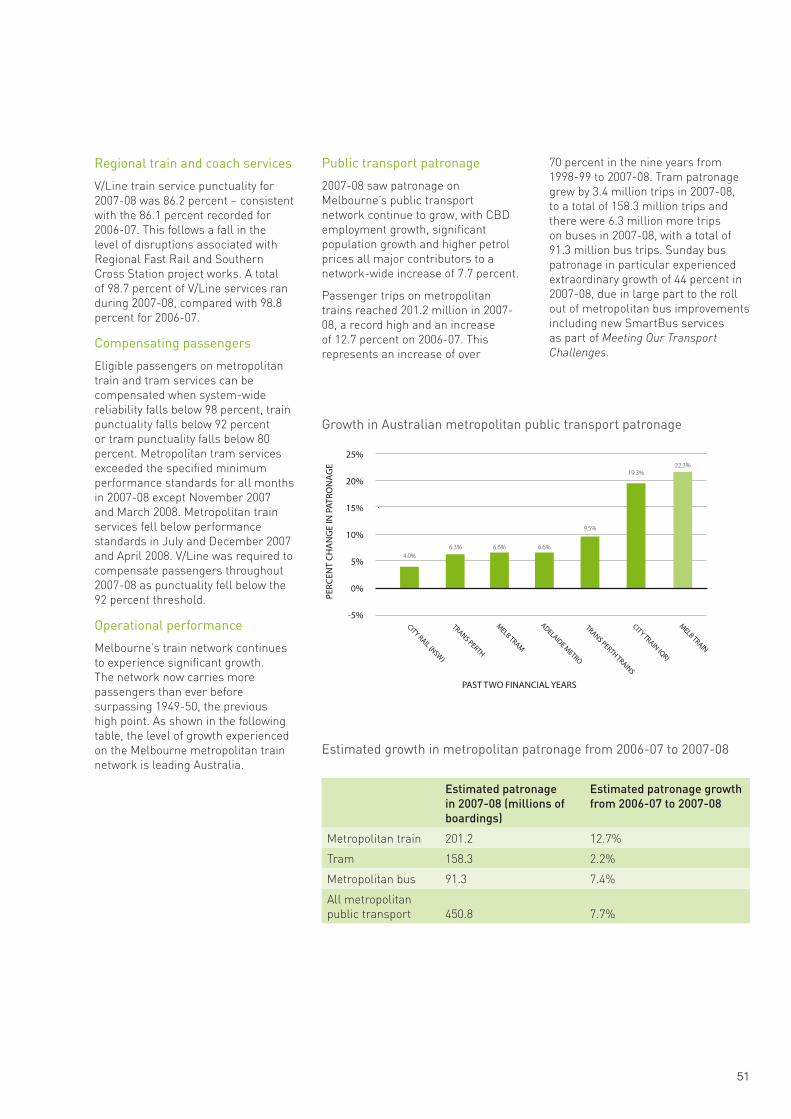
51
Regional train and coach services
V/Line train service punctuality for 2007-08 was 86.2 percent – consistent with the 86.1 percent recorded for 2006-07. This follows a fall in the level of disruptions associated with Regional Fast Rail and Southern Cross Station project works. A total of 98.7 percent of V/Line services ran during 2007-08, compared with 98.8 percent for 2006-07.
Compensating passengers
Eligible passengers on metropolitan train and tram services can be compensated when system-wide reliability falls below 98 percent, train punctuality falls below 92 percent or tram punctuality falls below 80 percent. Metropolitan tram services exceeded the specified minimum performance standards for all months in 2007-08 except November 2007 and March 2008. Metropolitan train services fell below performance standards in July and December 2007 and April 2008. V/Line was required to compensate passengers throughout 2007-08 as punctuality fell below the 92 percent threshold.
Operational performance
Melbourne’s train network continues to experience significant growth. The network now carries more passengers than ever before surpassing 1949-50, the previous high point. As shown in the following table, the level of growth experienced on the Melbourne metropolitan train network is leading Australia.
Public transport patronage
2007-08 saw patronage on Melbourne’s public transport network continue to grow, with CBD employment growth, significant population growth and higher petrol prices all major contributors to a network-wide increase of 7.7 percent.
Passenger trips on metropolitan trains reached 201.2 million in 2007-08, a record high and an increase of 12.7 percent on 2006-07. This represents an increase of over
70 percent in the nine years from 1998-99 to 2007-08. Tram patronage grew by 3.4 million trips in 2007-08, to a total of 158.3 million trips and there were 6.3 million more trips on buses in 2007-08, with a total of 91.3 million bus trips. Sunday bus patronage in particular experienced extraordinary growth of 44 percent in 2007-08, due in large part to the roll out of metropolitan bus improvements including new SmartBus services as part of Meeting Our Transport Challenges.
25%
20%
15%
10%
5%
0%
-5%
PERC
ENT
CHA
NG
E IN
PAT
RON
AG
E
PAST TWO FINANCIAL YEARS
19.3%22.3%
9.5%
6.3% 6.6% 6.6%4.0%
CITY RAIL (NSW)
TRANS PERTH
MELB TRAM
ADELAIDE METRO
TRANS PERTH TRAINS
CITY TRAIN (QR)
MELB TRAIN
Growth in Australian metropolitan public transport patronage
Estimated growth in metropolitan patronage from 2006-07 to 2007-08
Estimated patronage in 2007-08 (millions of boardings)
Estimated patronage growth from 2006-07 to 2007-08
Metropolitan train 201.2 12.7%
Tram 158.3 2.2%
Metropolitan bus 91.3 7.4%
All metropolitan public transport
450.8
7.7%
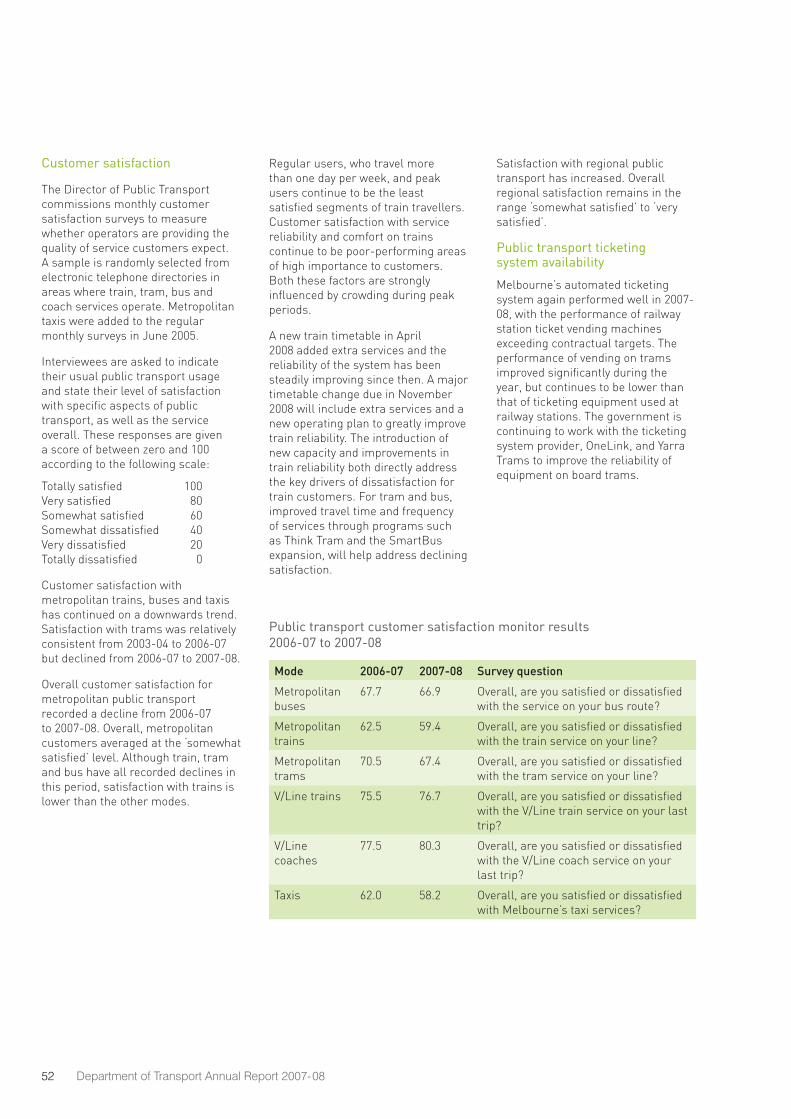
52 Department of Transport Annual Report 2007-08
Customer satisfaction
The Director of Public Transport commissions monthly customer satisfaction surveys to measure whether operators are providing the quality of service customers expect. A sample is randomly selected from electronic telephone directories in areas where train, tram, bus and coach services operate. Metropolitan taxis were added to the regular monthly surveys in June 2005.
Interviewees are asked to indicate their usual public transport usage and state their level of satisfaction with specific aspects of public transport, as well as the service overall. These responses are given a score of between zero and 100 according to the following scale:
Totally satisfied 100Very satisfied 80Somewhat satisfied 60Somewhat dissatisfied 40Very dissatisfied 20Totally dissatisfied 0
Customer satisfaction with metropolitan trains, buses and taxis has continued on a downwards trend. Satisfaction with trams was relatively consistent from 2003-04 to 2006-07 but declined from 2006-07 to 2007-08.
Overall customer satisfaction for metropolitan public transport recorded a decline from 2006-07 to 2007-08. Overall, metropolitan customers averaged at the ‘somewhat satisfied’ level. Although train, tram and bus have all recorded declines in this period, satisfaction with trains is lower than the other modes.
Regular users, who travel more than one day per week, and peak users continue to be the least satisfied segments of train travellers. Customer satisfaction with service reliability and comfort on trains continue to be poor-performing areas of high importance to customers. Both these factors are strongly influenced by crowding during peak periods.
A new train timetable in April 2008 added extra services and the reliability of the system has been steadily improving since then. A major timetable change due in November 2008 will include extra services and a new operating plan to greatly improve train reliability. The introduction of new capacity and improvements in train reliability both directly address the key drivers of dissatisfaction for train customers. For tram and bus, improved travel time and frequency of services through programs such as Think Tram and the SmartBus expansion, will help address declining satisfaction.
Satisfaction with regional public transport has increased. Overall regional satisfaction remains in the range ‘somewhat satisfied’ to ‘very satisfied’.
Public transport ticketing system availability
Melbourne’s automated ticketing system again performed well in 2007-08, with the performance of railway station ticket vending machines exceeding contractual targets. The performance of vending on trams improved significantly during the year, but continues to be lower than that of ticketing equipment used at railway stations. The government is continuing to work with the ticketing system provider, OneLink, and Yarra Trams to improve the reliability of equipment on board trams.
Public transport customer satisfaction monitor results 2006-07 to 2007-08
Mode 2006-07 2007-08 Survey question
Metropolitan buses
67.7 66.9 Overall, are you satisfied or dissatisfied with the service on your bus route?
Metropolitan trains
62.5 59.4 Overall, are you satisfied or dissatisfied with the train service on your line?
Metropolitan trams
70.5 67.4 Overall, are you satisfied or dissatisfied with the tram service on your line?
V/Line trains 75.5 76.7 Overall, are you satisfied or dissatisfied with the V/Line train service on your last trip?
V/Line coaches
77.5 80.3 Overall, are you satisfied or dissatisfied with the V/Line coach service on your last trip?
Taxis 62.0 58.2 Overall, are you satisfied or dissatisfied with Melbourne’s taxi services?
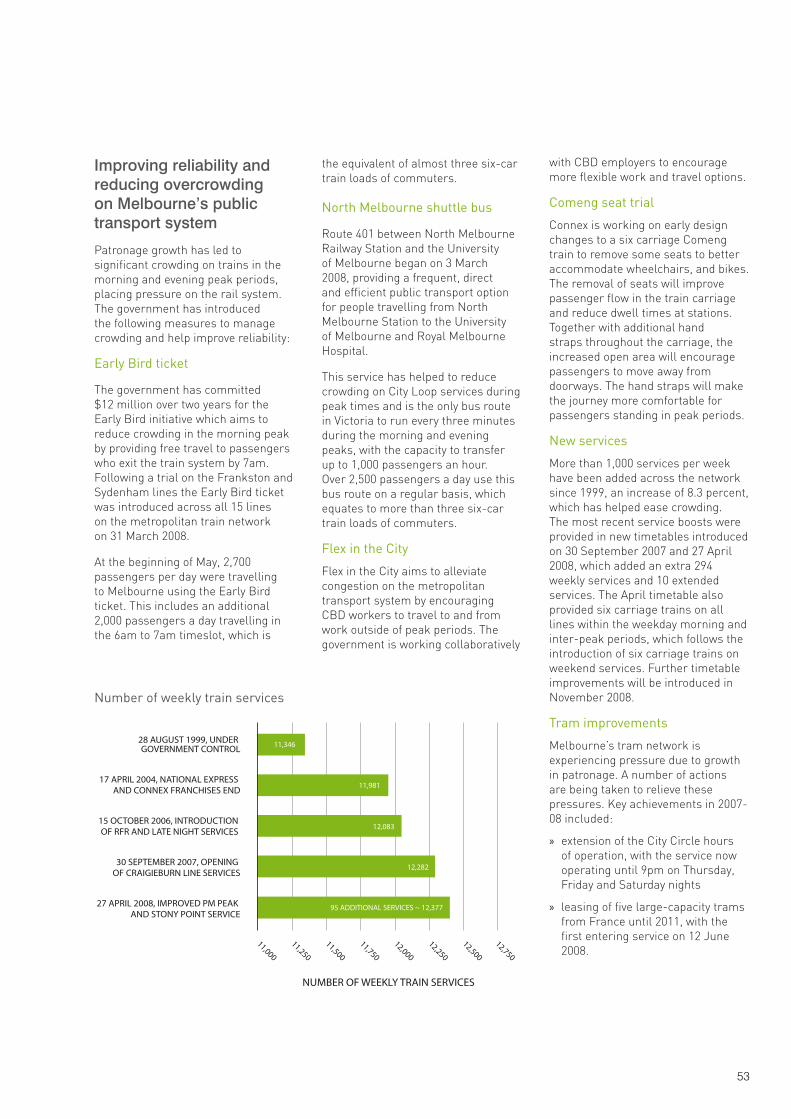
53
Improving reliability and reducing overcrowding on Melbourne’s public transport system
Patronage growth has led to significant crowding on trains in the morning and evening peak periods, placing pressure on the rail system. The government has introduced the following measures to manage crowding and help improve reliability:
Early Bird ticket
The government has committed $12 million over two years for the Early Bird initiative which aims to reduce crowding in the morning peak by providing free travel to passengers who exit the train system by 7am. Following a trial on the Frankston and Sydenham lines the Early Bird ticket was introduced across all 15 lines on the metropolitan train network on 31 March 2008.
At the beginning of May, 2,700 passengers per day were travelling to Melbourne using the Early Bird ticket. This includes an additional 2,000 passengers a day travelling in the 6am to 7am timeslot, which is
the equivalent of almost three six-car train loads of commuters.
North Melbourne shuttle bus
Route 401 between North Melbourne Railway Station and the University of Melbourne began on 3 March 2008, providing a frequent, direct and efficient public transport option for people travelling from North Melbourne Station to the University of Melbourne and Royal Melbourne Hospital.
This service has helped to reduce crowding on City Loop services during peak times and is the only bus route in Victoria to run every three minutes during the morning and evening peaks, with the capacity to transfer up to 1,000 passengers an hour. Over 2,500 passengers a day use this bus route on a regular basis, which equates to more than three six-car train loads of commuters.
Flex in the City
Flex in the City aims to alleviate congestion on the metropolitan transport system by encouraging CBD workers to travel to and from work outside of peak periods. The government is working collaboratively
with CBD employers to encourage more flexible work and travel options.
Comeng seat trial
Connex is working on early design changes to a six carriage Comeng train to remove some seats to better accommodate wheelchairs, and bikes. The removal of seats will improve passenger flow in the train carriage and reduce dwell times at stations. Together with additional hand straps throughout the carriage, the increased open area will encourage passengers to move away from doorways. The hand straps will make the journey more comfortable for passengers standing in peak periods.
New services
More than 1,000 services per week have been added across the network since 1999, an increase of 8.3 percent, which has helped ease crowding. The most recent service boosts were provided in new timetables introduced on 30 September 2007 and 27 April 2008, which added an extra 294 weekly services and 10 extended services. The April timetable also provided six carriage trains on all lines within the weekday morning and inter-peak periods, which follows the introduction of six carriage trains on weekend services. Further timetable improvements will be introduced in November 2008.
Tram improvements
Melbourne’s tram network is experiencing pressure due to growth in patronage. A number of actions are being taken to relieve these pressures. Key achievements in 2007-08 included:
extension of the City Circle hours »of operation, with the service now operating until 9pm on Thursday, Friday and Saturday nights
leasing of five large-capacity trams »from France until 2011, with the first entering service on 12 June 2008.
28 AUGUST 1999, UNDER GOVERNMENT CONTROL
17 APRIL 2004, NATIONAL EXPRESS AND CONNEX FRANCHISES END
15 OCTOBER 2006, INTRODUCTION OF RFR AND LATE NIGHT SERVICES
30 SEPTEMBER 2007, OPENING OF CRAIGIEBURN LINE SERVICES
27 APRIL 2008, IMPROVED PM PEAK AND STONY POINT SERVICE
NUMBER OF WEEKLY TRAIN SERVICES
11,346
11,981
12,083
12,282
95 ADDITIONAL SERVICES ~ 12,377
11,000
11,250
11,500
11,750
12,000
12,250
12,500
12,750
Number of weekly train services
54 Department of Transport Annual Report 2007-08
the retention in service of the »remaining Z1/2 trams and recommissioning the two that had been withdrawn from service
the construction of platform stops »to comply with DDA requirements and improve efficiency at busy trams stops, with a further seven sites completed in 2007-08, including three locations on Bourke Street to provide platform stops along its entire length
a major new platform stop at the »Arts Centre, including provision of a 60 metre section of triple track and a tram turning lane at Southbank Boulevard to improve tram operations and reduce delays
a trial to assess the feasibility of »mounting closed circuit television cameras (CCTV) on trams in order to record instances of cars passing stationary trams at stops, to improve enforcement of road rules for cars when driving with trams and increase safety for passengers
extension of the route 95 Bourke »Street shuttle to Latrobe/Spencer Street to improve the connectivity with Southern Cross station following the construction of platform stops at Spencer Street
development work continuing on »a major tram acquisition program announced as part of Meeting our Transport Challenges.
VicRoads Think Tram Program
In addition to installing the platform tram stops discussed previously, VicRoads worked with the Department of Transport ,Yarra Trams and local councils to complete a number of other initiatives to improve tram travel times, reliability and safety, including:
providing tram priority and »separation from other road users on multiple tram routes by adjusting 60 sets of traffic signals and installing 6.8 kilometres of raised dividing strips adjacent to tram tracks
improving signage and installing »red pavement at 34 median openings and eight roundabouts on the tram network to improve safety and reduce delays to trams
installing electronic overhead tram »signs and flashing road markers for two part-time tram lane locations in Brunswick and Fitzroy. The signage reminds motorists to keep off the tram tracks during peak periods.
installing CCTV at 10 intersections »linked to the Yarra Trams Operation Centre via VicRoads Traffic Management Centre, to allow early detection of and response to tram incidents
undertaking a multimedia » Obey the Yellow campaign during February to April 2008 to educate motorists on their obligations in relation to tram lanes
producing a » Driving with Trams DVD to inform motorists of their obligations when driving near trams. The DVD was widely distributed to taxi drivers, bus drivers, driving schools, metropolitan high schools and libraries.
Metropolitan bus services
On 23 June 2008, new 10-year contracts were signed with 29 individual metropolitan bus operators to take effect on 1 July 2008. Negotiations were initially conducted with the BAV on behalf of all metropolitan bus operators. The new contracts feature comprehensive changes, including:
more accountable, transparent »service
operator bonuses for exceeding »agreed performance targets
sanctions for poor or failing »performance
increased flexibility for quick »and efficient introduction of new services.
Bus service reviews
Bus services are being reviewed across metropolitan Melbourne as part of Meeting Our Transport Challenges (MOTC) with a view to:
ensuring local bus services are well »connected to growing facilities like community centres and shopping centres
proposing a bus service network »that will increase patronage
providing accessible transport for »social inclusion
reviewing route structures to »ensure geographic coverage
reviewing individual bus timetables »with a view to increase modal coordination at interchanges
documenting and assessing »adequacy of existing bus stops
identifying overcrowded routes that »need more buses
determining the need for new »routes.
55
Over a four-year period there will be 16 metropolitan bus service reviews across Melbourne. The following were completed in 2007-08:
Banyule/Nillumbik – completed »May 2008
Frankston/Mornington Peninsula – »completed December 2007
Hobsons Bay/Maribyrnong/Moonee »Valley – completed September 2007 and released publicly June 2008
Hume/Moreland – completed »January 2008 and released publicly April 2008
Whittlesea – completed May 2008. »
Service reviews were commenced in January 2008 for:
Cardinia/Casey »
Casey/Greater Dandenong »
Hobsons Bay/Wyndham »
Manningham/Monash/Whitehorse. »
Metropolitan bus service improvements
As part of MOTC, $165 million over four years (part of the government’s commitment of $646 million over 10 years) was allocated to improve metropolitan bus services. During 2007-08, 51 initiatives were introduced on 59 routes. The majority of these improvements involved
an extension of operating hours to 9pm seven days a week. In addition, new bus routes were introduced, frequencies were upgraded and some existing routes were either extended or rerouted. Over 4,000 extra weekly trips have been introduced – over 2,400 on weekdays, 500 on Saturdays and 1,100 on Sundays.
Outside of MOTC there have been other significant metropolitan bus improvements, including:
upgrade of the peak operating »frequencies of two bus routes servicing La Trobe University, including improvements to train connectivity at Heidelberg, Reservoir and Macleod Railway Stations and an extended late evening service on one route
upgrade of the Sunbury bus »network comprising six bus routes, to provide extra weekday trips.
These improvements have helped to boost bus patronage across Melbourne, with 44 percent growth in the number of passengers travelling on Sundays.
A snapshot of routes upgraded since June 2007 shows:
a 58 percent rise in patronage »on the Route 901 SmartBus (Ringwood-Frankston)
a 50 percent rise patronage on »Route 784 (Mornington-Osborne)
a 32 percent rise in patronage on »Route 564 (Bundoora RMIT-Epping Plaza & Northern Hospital)
a 25 percent growth on Route 408 » (St Albans-Highpoint City).
SmartBus
SmartBus is a high frequency and reliable premium bus service with extended operating hours on major arterial roads, connections to activity centres and interchanging with rail networks. Its traffic light priority means it is fast and reliable and its up-to-the-minute digital displays give useful service and timetable information.
Over 170 DDA (Disability Discrimination Act 1992) compliant SmartBus bus stops have been built for SmartBus Route 901, as have 59 real-time passenger information displays and 18 ultra low floor buses equipped with the SmartBus Technology.
Consultation and development work, including bus stop design and on-road bus priority treatments, has been undertaken for the Green Orbital Stage 2 (Nunawading to Airport West) SmartBus route.
Since trials began on the selected routes in Melbourne’s east in August 2002, patronage has grown by over 50 percent with high levels of customer satisfaction. SmartBus Route 901 along Stud Road and Dandenong-Frankston Road between Frankston and Ringwood commenced operation in March 2008, with a 30 percent improvement in patronage in its first full month of operation. Construction of on-road bus priority treatments for Stud Road and the Red Orbital SmartBus routes continued, with numerous treatments completed and operational.
Average daily passenger trips by day type on Metropolitan bus routes
Financial Year Weekday Saturday Sunday
2005 – 2006 251,191 81,038 26,773
2006 – 2007 270,221 90,925 36,767
2007 – 2008 285,930 104,625 53,078
Growth from 06-07 to 07-08 6% 15% 44%
56 Department of Transport Annual Report 2007-08
VicRoads Bus Priority Program
VicRoads Bus Priority Program aims to improve on-road conditions for key bus routes complementing the SmartBus program discussed previously. These works include improved traffic signal phases for bus priority and providing or reallocating road space for buses.
VicRoads completed bus priority treatments at 20 sites in 2007-08. It also worked with the Department of Transport and the City of Melbourne to implement new bus lanes on Lonsdale Street (south side) and Queen Street (east side) in the CBD. Red pavement was installed on the bus lanes in Johnston Street, Collingwood by VicRoads and the Department of Transport to improve road user awareness of the bus lanes.
Metropolitan tram and train franchising project
The metropolitan tram and train franchising project (MR3) designs, procures and transitions new arrangements for the future operation of Melbourne’s tram and train networks. On 21 August 2007, the Victorian Government put tram and train operations out to competitive tender.
2007-08 achievements include:
an extension of current Franchise »Agreements with Connex and Yarra Trams for 12 months to 30 November 2009
a comprehensive review of existing »Franchise Agreements
the design of the legal and »commercial framework to implement new arrangements
an extensive market sounding »activities, including a registration of interest process
a call for Expressions of Interest »to operate the train and tram networks as part of a two stage tender process concluding 30 November 2009.
Public transport for special events
Free travel was provided on metropolitan trains, trams and buses, and V/Line services, on New Year’s Eve. Metropolitan trains and trams operated all night and there were extended NightRider bus services. The provision of free public transport was a road safety initiative to reduce serious injury and death caused by drink driving, with revellers urged to leave their car at home. Around 160,000 travellers made use of the free public transport option.
Free travel was also provided on Christmas Day on all metropolitan train, tram and bus networks, on V/Line services and on major bus services travelling to and from Melbourne.
New crowd management arrangements were put into place for the 2007 Melbourne Cup Carnival at Flemington Station in partnership with the VRC, Connex and Victoria Police.
A general increase in the number of events in Melbourne was reflected in the launch of the Royal Melbourne Showgrounds as a new multipurpose event venue, in the increased number of sporting events being held in the city, in the return of the St Kilda Festival and in road-based events such as fun runs, bicycle events, demonstrations and rallies.
Additional transport services were provided for a range of special events, including the Australian Open, the Grand Prix, the Spring Racing Carnival, St Kilda Festival and a range of other sporting and entertainment events.
Additional transport services were also provided for the cruise shipping season, including the inaugural visit to Melbourne of the Queen Victoria.
Taxi service improvements
Accreditation
The government’s commitment to improving Victoria’s taxi services saw it launch two new accreditation schemes in 2007-08. Driver accreditation, introduced in July 2007, sets clear guidelines about who can drive, what is expected of them and sanctions for non-compliance. The new laws focus on improving the customer experience and exclude people with a serious criminal history from the industry.
The taxi industry-wide accreditation scheme introduced on 31 December 2007 is the most significant policy and legislation reform to the taxi industry in 20 years. It increases professionalism and accountability by extending the chain of responsibility to all industry participants. Until now, Network Service Providers (NSP) were unregulated but from 31 December 2009 they must be accredited by DOT. Minimum business and service standards for licence holders and operators will result in better services to passengers.
Steps to improve taxi driver standards
The Course in Taxi Driving has been upgraded and from 1 July 2008 all drivers will require stronger literacy skills and must complete a comprehensive knowledge of Melbourne test in addition to existing accreditation requirements. Applicants will also receive conflict resolution training to handle and prevent verbal and physical assault.

57
58 Department of Transport Annual Report 2007-08
VTD is also developing stronger communication channels including a Taxi Drivers Advisory Group for taxi drivers to provide regular feedback on government policies and initiatives.
Greater focus on compliance
The VTD has strengthened enforcement of regulations, including compliance with the Taxi Industry Accreditation scheme, with provision for 36 new Transport Safety Officers. 75 percent of the 9,000 taxis audited by VTD during 2007-08 were compliant.
Taxi fare increases
Taxi fares increased by 1.1 percent in September 2007, in line with the Essential Services Commission (ESC) recommendation. The annual Multi Purpose Taxi Program cap also increased 1.1 percent to $1,045 and will automatically increase in line with future taxi fare increases to ensure fairness to program members.
To offset the substantial rise in fuel costs particularly LPG, an interim taxi fare increase of 4.2 percent was issued in April 2008, in line with ESC recommendations.
Fares and ticketing
Revenue protection
Fare evasion costs the community $35-40 million in lost revenue each year. A mix of enforcement, education and ticketing has helped to reduce fare evasion on Melbourne’s public transport system to 7.8 percent over the past year, the lowest result since Metlink fare evasion surveys began.
Public transport ticketingThe new 5xWeekend Daily ticket »was introduced in April 2008 for travel across Melbourne on Saturdays and Sundays for $2.90 per day. The ticket represents a 70 percent discount on Saturday travel costs.
The 10xEarly Bird ticket was »extended to all electrified train services in April 2008 and more than 40,000 trips per week are now made before 7am.
The 5xSeniors Daily Metcard was »launched in April 2008. It can be purchased in bulk and is estimated to have reduced individual ticket sales by around 125,000 per annum.
Bus fares in more than 30 regional »cities are being aligned with metropolitan fares, providing two hour, daily and weekly tickets. As at 30 June 2008, the new ticket arrangements had been introduced in Benalla, Wangaratta, Echuca/Moama, Rochester, Hamilton, Seymour, Wallan, Kilmore, Shepparton, Mooroopna and Portland.
Work was completed in 2007-08 to »allow the new fare arrangements to be introduced on 1 July 2008 in Korumburra, Cobram, Lakes Entrance, Sale, Yarrawonga, Colac, Horsham, Wonthaggi, Wodonga and Warrnambool.
The profile of public transport was »significantly raised in September 2007 after all Victorian Seniors (one in five Victorians) received public transport information and two free off-peak travel vouchers.
The Doncaster Park and Ride »became Victoria’s first prepay bus stop in January 2008, meaning that no tickets are sold on board. Every four tickets purchased on board a bus delays the service by approximately one minute so this initiative reduces the time a bus dwells at a bus stop by up to three hours a day. Victoria’s first prepay bus route started in March 2008 on the new 401 Route between North Melbourne Railway Station and Melbourne University.
Metlink fare evasion survey results
Year Train Tram Bus Network-wide
2005–2006 10.7% 14.2% 13.0% 12.5%
2006–2007 11.5% 10.1% 8.1% 10.3%
2007–2008 6.3% 9.6% 7.3% 7.8%
NB: Unprecedented patronage growth and subsequent crowding on train services made collecting survey information difficult, during 2007-08 financial year. Consequently, the train figure above is based on the results of a single survey conducted in May 2008. Figures for all modes between 2005-06 and 2006-07, and figures for tram and bus for 2007-08, are based on the results of two surveys. Metlink has reviewed the survey process to allow for improved data collection.
59
Metlink
Metlink is a private, not-for-profit organisation which has a contract with the State Government to provide services across the public transport system including marketing and customer information. Metlink uses the Viclink brand for regional services.
The bus component of Metlink’s »signage and wayfinding project reached practical completion at 30 June 2008, with new signage and customer information at approximately 19,000 bus stops and interchanges around metropolitan Melbourne. The $28 million multi-modal signage project was delivered on time and under budget across all modes.
A four-year mass media campaign »promoting improvements and initiatives for metropolitan buses was launched in July 2007. The campaign is supported by direct marketing and local level advertising promoting route and area-specific improvements.
Metlink launched a major new »brand campaign in September 2007, with the positioning statement “A Better Way”. The campaign positions public transport as a ‘better way’ economically, environmentally and for convenience and is aimed at building patronage on off-peak services.
A state-wide brochure was »developed by Metlink to raise awareness of the customer feedback process, including the role of the Public Transport Ombudsman
The Metlink website continued to »grow by approximately 40 percent over the year with between eight and 10 million hits a month in the first half of 2008. Traffic figures over the past year put it in the top five travel websites in Australia, alongside Qantas, Virgin Blue, Jetstar and Tiger. The journey planner, which represents about a third of website activity, also grew over the year by around 70 to 80 percent.
New ticketing solution
Work continued throughout 2007-08 on the new ticketing solution, referred to as myki.
Key achievements included:
completion without any disruption »to passenger services of all undertrack works at metropolitan and regional train stations to allow for future installation of ticketing devices
all available trams and tram depots »were pre-wired and are ready to accept NTS devices
94 percent of buses and coaches »were pre-wired, and 97 percent of bus depots pre-wired, and are ready to accept NTS devices
completion of civil works at regional »train stations and at 99 percent of metropolitan stations
completion of a comprehensive »system testing program on Geelong buses, yielding a 90 percent success rate for scenarios tested.
Congestion Improvements Program
VicRoads is implementing the Victorian Government’s $30 million three year Congestion Improvements Program (2007-08 to 2009-10) and the $112.7 million Keeping Melbourne Moving, to treat routes and sites where delays are significant or increasing. In 2007-08 the following works were completed:
installation of intersection traffic »signals at High Street/Warner Street, Ashburton
installation of intersection traffic »signals at Main Road/Cecil Street/ Diamond Street, Eltham
installation of intersection traffic »signals at Karingal Drive/Weidlich Road, Briar Hill
construction of an additional right »turn lane on Yan Yean Road at Diamond Creek Road intersection, Diamond Creek.
Work also commenced on converting the roundabout to intersection traffic signals at Pascoe Vale Road/ Somerton Road, Coolaroo.
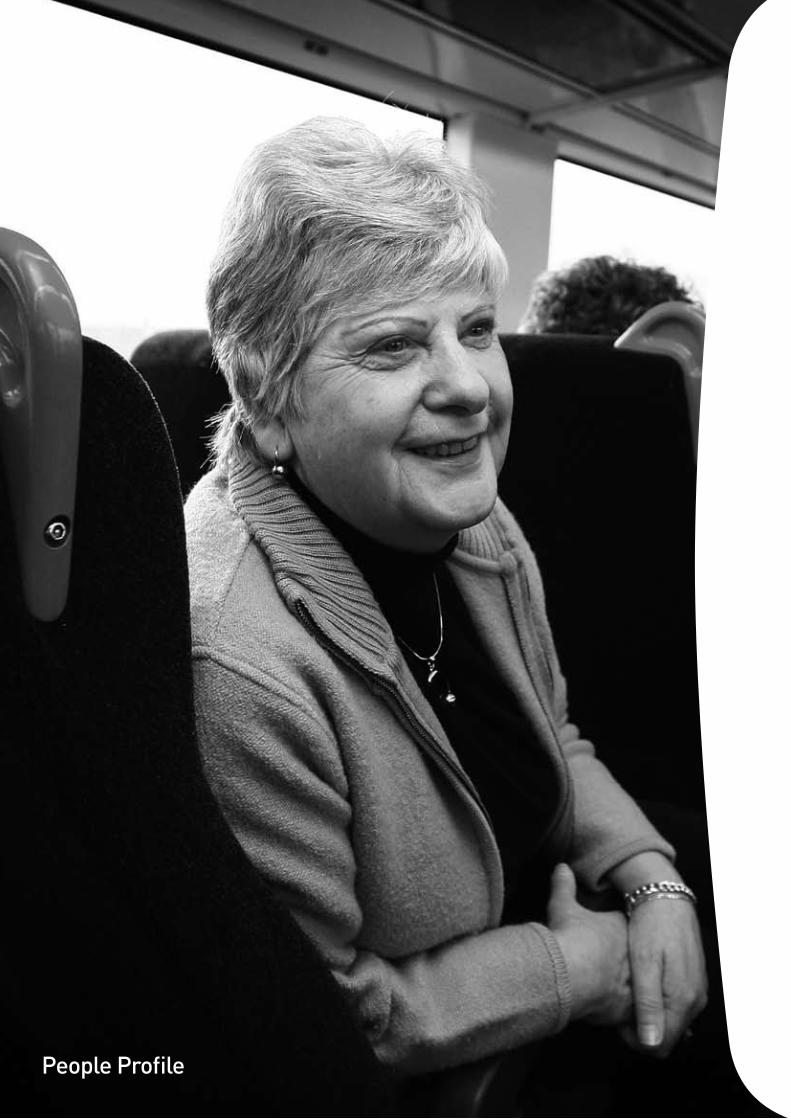
60 Department of Transport Annual Report 2007-08People Profile
61
A group of us started to meet years ago after the brother of one of my friends got cancer. He said: “You should keep in touch but you never will.” After he died, we were determined not to lose touch.
We call ourselves the Fools. There are eight couples and three singles and we are all between 60 and 70 years old. There is one couple from Bacchus Marsh but the rest of us live in Ballarat. We are the Fools because someone will always forget which night we have arranged to meet up.
We catch up every six weeks or so. Sometimes we meet in Ballarat but we often go into Melbourne to catch a show, such as Guys and Dolls or Menopause, or just to have a look around and watch people.
We are all seniors. With a seniors’ card, getting the train into Melbourne is so reasonable. It is only about $10 or $11 if we travel off-peak. There is no way you could drive your car into Melbourne and park for that sort of money. With the price of petrol these days, it makes sense to travel by train, especially with a seniors’ card.
Once we saw a show and went to Southbank for an early meal. I love watching people and wondering where they have been. We then caught the 7pm train home again.
Another time we put on our running shoes and caught a train into Melbourne and then caught a tram to Richmond and had a look at the shops there and on Chapel Street before coming home again. I don’t think we bought anything!
Getting the train is much nicer because you don’t have to worry about car parking. Lots of groups from Ballarat take the train, like Probus, and I also see people of all ages on the train. It makes for a great day out.
I live around the corner from the new station in Wendouree so it will be easier to catch the train when that opens. But for the moment, I drive into Ballarat to catch the train.
Joan LumpsonSenior, Ballarat

62 Department of Transport Annual Report 2007-08

63
Rural and regional development
Outcome Four4
64 Department of Transport Annual Report 2007-08
DOT strives to boost prosperity in regional Victoria by improving road and transport services and infrastructure. Transport is vital to local economies and a range of initiatives are underway to help create vibrant and connected regional communities. Ensuring that services are integrated, and infrastructure is safe and modern is a key focus of the department.
Country taxi services reviewThe government continues to improve country taxi services with measures including:
$3.3 million for wheelchair »accessible taxis
subsidies for wheelchair accessible »taxis in Lakes Entrance, Orbost, Wodonga, Warragul, Heathcote, Castlemaine, Cobram, Rushworth, Wandong/Broadford/Kilmore, Winchelsea and Bairnsdale. 22 applications have been approved since early 2007.
The soon-to-be implemented Country Taxi Operators Up-skilling Program will help regional operators grow their businesses.
Ballarat Stations ProjectThe Ballarat Stations project forms part of a transit cities project. It is a response to significant parking pressures at Ballarat and increased demand for services, following the completion of Regional Fast Rail and the introduction of an expanded V/Line rail timetable.
The project includes construction of a new station and car park in Wendouree, four kilometres northwest of the city, and the upgrading of Ballarat Station’s bus interchange and car parking.
Wendouree station will serve the 27,000 residents in Wendouree, Alfredton and Lake Wendouree who presently travel into Ballarat for a train.
The contract for main works at Wendouree Station was awarded in May 2008, with works starting in July 2008.
Works on the Ballarat Station car park commenced in June 2008 and work on the bus interchange will begin later in 2008.
Rural and regional development

65
Wodonga Rail BypassThe Wodonga Rail Bypass (WRB) is part of the $500 million North-East Rail Revitalisation Project announced on 30 May 2008. It will improve rail efficiency and revitalise the commercial centre of one of Victoria’s fastest growing regional cities. The interstate and broad gauge rail tracks will be removed from the central business district of Wodonga and replaced with a five kilometre single standard gauge bypass track west of the city. This will open up a large area of Wodonga CBD for redevelopment and close 11 rail crossings, improving safety for road users. A new railway station will be built in West Wodonga.
Funding for the WRB includes $45 million AusLink from the Federal Government.
Work on the Wodonga Bypass will begin in late 2008.
Further information on the North-East Rail Revitalisation Project is included in Outcome Five.
Parkways $5 million was allocated to establish premium facilities at key regional stations by providing additional car parks, improved lighting and CCTV coverage. The following parkways were designed, constructed and opened to the public during 2007-08:
Bacchus Marsh (160 car parking »spaces)
Garfield (80 car parking spaces) »
Wallan (215 car parking spaces) »
Gisborne (135 car parking spaces) »
Ballan (125 car parking spaces) »
Lara (125 car parking spaces) »
Drouin (160 car parking spaces). »
New and refurbished rolling stock – V/Line and CountryLinkV/Line is experiencing record patronage growth, with passenger numbers passing the one million mark for the first time in April 2008.
The regional fleet needs new rolling stock to increase capacity and meet operational demands. Meeting Our Transport Challenges allocated $100 million to purchase two new VLocity trains to replace Sprinter sets being transferred to the Stony Point line, along with 22 new Intermediate carriages for use with the VLocity fleet.
The two new VLocity cars were delivered by December 2007.
Construction of the first intermediate carriage was completed in June 2008, with each of the carriages to be progressively introduced into service over 2008-09 and 2009-10.
In addition, a $13.2 million program commenced to improve comfort levels on those services where the VLocity fleet does not operate. By June 2008, six Sprinter cars and two H-car sets had been refurbished to VLocity standard, with the rest to be done by June 2010.
RailCorp is embarking on a two-year refurbishment program of the entire CountryLink fleet, including Victoria’s eight XPT cars. Two powered cars and three first-class carriages had been completed as at 30 June, 2008.
V/Line Stations ProgramA number of major regional railway stations have been significantly upgraded as part of a state-wide program including Echuca, Swan Hill and Kangaroo Flat, which was reopened in April 2008 after closing due to a major fire.
V/Line timetable Changes were made to V/Line timetables to improve integration with metropolitan services and coordinate long-distance coach services and rail services. The main features were:
on 30 September 2007: improved »weekend and evening train services on the North-Eastern line (coinciding with the extension of electrified train services to Craigieburn), improved Geelong line services, additional coach services to Moama and Kyabram, and improved coach schedules to Barmah and Maryborough
on 28 April 2008: increased »services to Kangaroo Flat Station, improved scheduling of Bairnsdale services, additional weekday coach services between Portland and Warrnambool, and improved schedules for services to Burrumbeet, Ouyen and between Ballarat and Geelong.
66 Department of Transport Annual Report 2007-08
Regional bus improvements
Commitments under MOTC include additional coach and bus services to build on the successful ‘Moving Forward’ Regional Bus Service Rollout, which included 950 new trips a week to benefit around 70 regional communities.
MOTC’s $90 million 10-year regional bus improvement package includes $10.2 million in new funding in the first four years, with $3.9 million of new money funded in 2007-08.
In 2007-08 20, regional bus improvement projects were completed, providing an extra 1,800 trips every week. Highlights include:
upgraded services in the major »regional centres of Bendigo (April 2008) and Ballarat (June 2008)
an innovative town service using »a bus and taxi combination in Lakes Entrance (January 2008)
a new connection to V/Line long »haul coach services between Foster and Wilson’s Promontory (May 2008)
new and improved services »and routes in Ararat, Colac and Portland (February 2008).
DOT progressed planning for future bus initiatives in Shepparton, Mooroopna, Murrindindi Shire, Sale, Swan Hill and Mildura.
Additionally, $14.7 million was allocated in the 2008-09 budget for increased services and better connections between communities in South Gippsland and Bass Coast. These improvements will include:
major improvements to premium »road coach services from Leongatha and the Bass Coast (including Phillip Island)
more frequent services between »townships on the South Gippsland and Bass Coast Highways
new and upgraded links from »Leongatha, Wonthaggi and Inverloch via Koo-Wee-Rup to Pakenham
a new cross-corridor connection »between Koo-Wee-Rup and Pakenham.
These services improvements will be rolled out by late 2009.
Regional Interchange Upgrade ProgramA $5 million program was announced to upgrade bus and rail interchange infrastructure at regional locations to improve passenger safety and amenity. The program began in 2006-07 with upgrades targeted at 15 sites across regional Victoria. In 2007-08 the major projects were completed at Kilmore East, Koo-Wee-Rup, Sale, Drouin, Wallan, Castlemaine and Lara. The largest project, the bus interchange works at Seymour, will be completed in August 2008.
Bus infrastructure improvements$14 million was allocated for 107 grants and 48 bus infrastructure projects across metropolitan Melbourne and regional Victoria. These projects have improved the level of bus passenger amenities across the state. The projects were commenced during the 2007-08 year and the final two projects, Lonsdale St Bus interchange and Kangaroo Flat Station car park, are expected to be completed by October 2008.
Rural School Bus Safety ProgramThe four-year $8 million Rural School Bus Safety Program has two years to run and is on budget. This program upgrades bus infrastructure at primary and secondary schools and roadside school bus stops in regional Victoria to improve safety for students. Improvements delivered as part of the program include road works, building bus bays, new shelters and waiting areas and safety fencing. To date across the state, the program has improved 37 school bus interchanges, 11 school bus interchanges are in progress and 250 bus stops have been upgraded.
School bus service reviewsImprovements in service efficiency has resulted in annual savings in the cost of rural school bus services of $1.5 million over a full year and a saving of $0.9 million for the year ending 30 June 2008.
Launch of Viclink DOT is working to build on the success of Metlink as a unifying brand for public transport in Melbourne by creating a similar brand for regional Victoria called “Viclink”.
An $80,000 pilot program distributed Viclink branded public transport information throughout Wallan and Kilmore during September 2007. The pack included information on local buses, coaches, trains, taxis and community transport services in the area.
A further $3 million in funding has been approved to roll the project out to all households in regional Victoria, beginning in 2008-09.
V/Line marketingV/Line won the Victorian 2007 Marketing Excellence award for brand revitalisation, a major achievement for the business.

67
Road infrastructure improvementsMeeting our Transport Challenges recognised that maintaining and improving the regional arterial road network is vital for the prosperity of regional industries and liveability of regional communities.
VicRoads contributed to regional development by achieving the following in 2007-08:
completing the $40.5 million »Goulburn Valley Highway Arcadia duplication in June 2008
completing a further 30 regional »road development projects including the Midland Highway widening at Mooroopna, Bena Bypass and stage two of the Bendigo Inner Box widening
progressing the Calder Freeway »upgrade, Geelong Ring Road and a further seven regional road development projects
completing 133 and progressing 16 »regional road safety infrastructure improvement projects.
Details of other achievements which have boosted transport in regional Victoria are included in Outcomes One, Two, Three and Five.
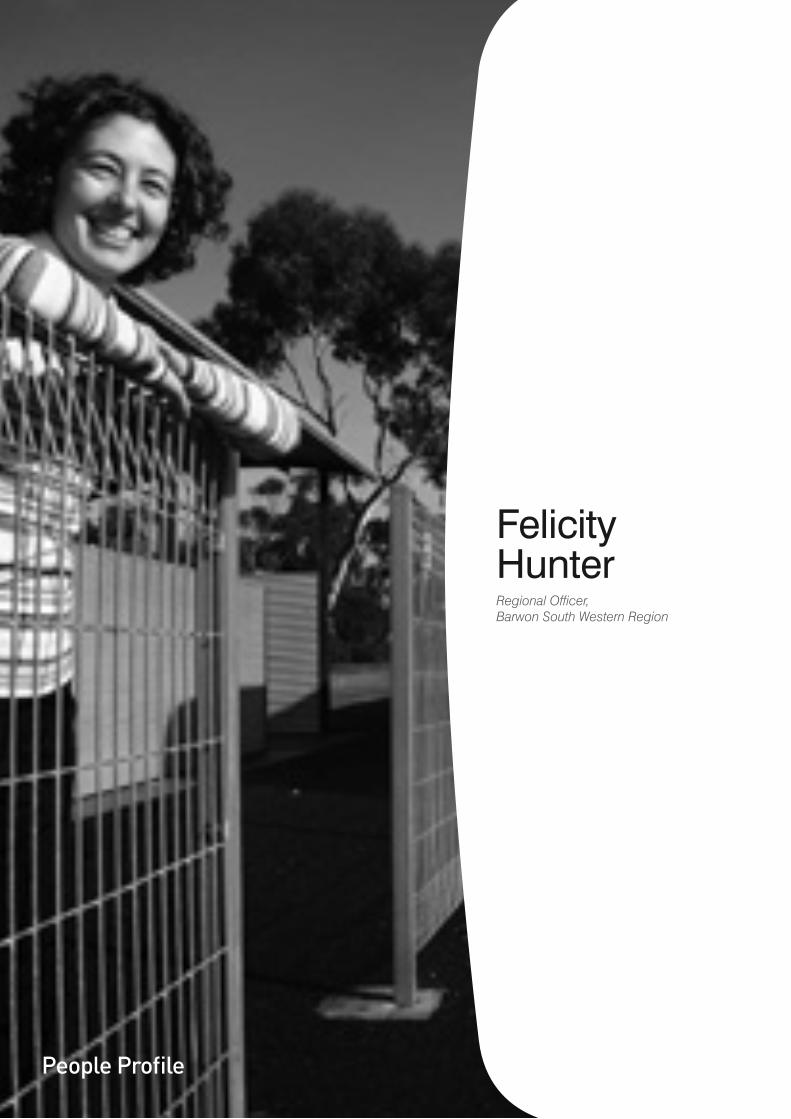
68 Department of Transport Annual Report 2007-08
Felicity HunterRegional Officer, Barwon South Western Region
People Profile
69
I am directly responsible for managing public transport service contracts including 252 school bus contracts in the Barwon South Western Region. The school buses transport 10,700 students to and from school and cover a total of 26,000 kilometres every school day.
I work closely with the school principals who coordinate the students. I also spend time doing site inspections and recommending improvements to bus stops and routes.
I grew up in Geelong and moved to Melbourne to study at Victoria University. I graduated with a Bachelor of Arts in town planning and lived in Melbourne for seven years. I started my career working for the Department of Human Services working for the Office of Housing.
I have family and friends in Geelong and when my partner got a job in Geelong, I moved back here. Geelong is a great place to live; it’s like a mini Melbourne. We have easy access to Melbourne for day trips on the weekend and have the best of both worlds with beautiful coastlines and countryside just 15 minutes away. My journey to work is an eight minute walk.
I love and have used public transport all over the world. I have always had a love of cities and the country and how they work and so it was a natural progression to be working at the Department of Transport.
I work closely with two staff in the Barwon South Western Regional Office and, as a team, we manage all the public transport service contracts and transport planning in the region.
This includes hundreds of public bus services in Geelong, Warrnambool, Colac, Hamilton and Portland as well as the inter-town services. We are always looking at how we can do things more efficiently and service more people. Our region has a population of more than 340,000 and covers 12.7 percent of Victoria’s total land area.
Since I started at the department three years ago, there has been more money available for service improvements. I love being able to make a difference. We can improve things and see the difference it makes to people’s lives. For example, I recently received a thank you for changing a school bus route in a remote area after a new family moved into the region. This would not make the front page of the newspaper but it is a big deal to the family involved.

70 Department of Transport Annual Report 2007-08
71
Efficient movement of freight
Outcome Five5
72 Department of Transport Annual Report 2007-08
Freight and logistics is one of Victoria’s most important industry sectors. It employs thousands of people, every day transports goods to households and businesses and gets our products to the world. Victoria’s freight task is continuing to grow and ensuring our freight network is efficient and sustainable is one of our key priorities.
Rail Freight Network Review
The Victorian Government commissioned a Rail Freight Network Review (RFNR) committee to conduct a comprehensive review of Victoria’s rail freight network and identify opportunities for further development and improvement.
The RFNR report was provided to the Minister for Public Transport on 6 December 2007. The committee consulted widely across regional Victoria from June 2007 receiving over 100 submissions.
The principal recommendations related to the cost of access to the rail network and a track rehabilitation program. The report also recommended a number of rail-related projects including standardisation of the North East line and upgrading the Mildura line.
The Government allocated $42.7 million in the 2008-09 budget for the rehabilitation of major freight lines, which the review termed ‘Gold lines’, and to undertake general network maintenance.
In accordance with the recommendations of the review, any decisions to rehabilitate the silver lines will be based on industry commitment to use rail and to develop efficient supply chains.
Rail support package
In February, the State Government announced a two-year, $20 million package for Victoria’s rail freight industry. The package provides a temporary rebate for rail container freight carried from Warrnambool, Horsham, Mildura and Shepparton/Tocumwal and extends the rail access fee rebate to both domestic and export grain.
Efficient movement of freight
73
The government recognises the economic and environmental advantages for bulk commodities of rail over road and is actively encouraging its use. To support carrying bulk grain by rail, and in response to Rail Freight Network Review recommendations, the DOT will operate a rebate scheme for 12 months from 1 January 2008 for domestic grain and for two years from 1July 2008 for export grain.
Workforce Strategy for Freight Drivers
The Workforce Strategy for Freight Drivers is a response to the current and likely future labour and skills’ shortages of Victorian freight drivers. It has been developed in partnership with the Transport and Logistics (T&L) industry, supporting the sector’s workforce planning endeavours and focuses on the road freight sector.
Issues the strategy aims to address include:
overall industry image »
training culture, for specific and »general skills
identification of clear career »pathways
matching of working conditions »and practices to lifestyle aspirations
remuneration relative to skills »required and task undertaken.
North-East Rail Revitalisation Project
On 30 May 2008, Premier John Brumby, in association with Federal Minister for Infrastructure, Transport, Regional Development and Local Government, Anthony Albanese, and Chief Executive, Australian Rail Track Corporation (ARTC), David Marchant, announced the $500 million North-East Rail Revitalisation Project which includes the Wodonga Rail Bypass. This historic nation-building investment of a rail super highway between Sydney and Melbourne is jointly funded by the Victorian Government ($170 million), the Federal Government’s AusLink program ($45 million), and ARTC ($285 million).
The project will involve:
converting approximately 200 »kilometres of existing broad gauge track from Seymour to Albury to standard gauge using concrete sleepers
building additional standard gauge »platforms at Broadmeadows, Avenel, Violet Town, Euroa, Chiltern and Springhurst together with a new broad gauge platform at Seymour and special intermediate crossovers at Benalla and Wangaratta
gauge converting and upgrading »three V/Line locomotives and 15 passenger carriages to ensure high-quality, reliable service
the Wodonga Rail Bypass, which »will remove rail infrastructure from the centre of Wodonga to allow redevelopment and improve traffic safety. A new station will be built west of Wodonga.
Construction begins in late 2008 for completion in 2010.
Dynon Port Rail Link
The Dynon Port Rail Link (DPRL) project will separate road and rail traffic to significantly improve access and increase rail freight capacity directly to the Port of Melbourne. The new overpass will reduce traffic congestion by removing three level crossings on Footscray, Enterprise and Appleton Dock Roads.
The DPRL supports the government’s policy to increase the volume of rail freight and accommodates Port of Melbourne growth by reducing road congestion and improving the overall freight efficiency.
In June 2007, Leighton Contractors won the main design and construct tender. Service relocation and preliminary traffic management works commenced in August 2007, and a full traffic management strategy started in December 2007.
Bridge works commenced in October 2007, with Stage 1, the westbound carriageway, opened in July 2008. Stage 2, the Footscray Road inbound, will open in early 2009.
Total budget is $173.96 million including $110 million from Federal AusLink funding. The Port of Melbourne Corporation has allocated $12.1 million for the project, plus $1.5 million for associated works in the port. The project is on schedule for completion in mid-2009.
74 Department of Transport Annual Report 2007-08
Mildura Rail Corridor
The $73 million Mildura line freight upgrade will deliver substantial economic benefits for the economies of Mildura and Victoria. The project is jointly funded, with $53 million from the State Government and $20 million from the Federal Government’s AusLink program. The upgrade will improve the reliability and efficiency of the line and give producers more incentive to transport goods by rail.
Replacement of two in every five sleepers along the 525 kilometre line with gauge convertible timber sleepers will make the rail link faster and more reliable and allow freight trains to travel up to 80 kilometres per hour, reducing travel times between Melbourne and Mildura from 14 hours to less than 10.
Work commenced in Mildura in December 2007. By June 2008, over one third of the 525 kilometre track upgrade had been completed.
Road freight
The great majority of Victoria’s freight task is transported by road and DOT works closely with VicRoads to develop and implement projects that improve the efficiency of the road freight network.
VicRoads contributed to this outcome in 2007-08 by:
continuing to play a key role in »developing and implementing national transport reform projects including:
performance-based standards -for heavy vehicles which allow for greater innovation in the design of vehicles
the Intelligent Access Program -(IAP) which, when introduced in Victoria in late 2008, will enable remote tracking of the movement and location of heavy vehicles to ensure they are complying with agreed conditions
designing and implementing »the ‘Connect Freight’ transport information system to deliver travel time, traffic alerts and roadwork reports to transport operators via email and SMS, and completing the following four road improvement projects that specifically target freight efficiency:
Plummer Street Bypass, between -Graham Street and West Gate Freeway, Port Melbourne
Boundary Road duplication, -Fitzgerald Road to Raymond Road, Laverton North
Grieve Parade duplication, just -north of Kororoit Creek Road to just south of Dohertys Road, Altona North
Princes Highway West, road -widening at the intersection with Bacchus Marsh Road and Cox Road, Corio.
Port of Geelong Rail Access Improvement Project
The Port of Geelong Rail Access Improvement Project (GRAIP) will improve standard gauge rail access to the port, and increase rail’s share of freight transport into the Geelong Port. The major components of the works are the construction of the dual gauge Corio independent goods line off the Geelong grain loop to North Shore Road, and construction of three new standard gauge tracks (sidings) in North Shore Yard.
The project supports the government’s policy to increase the volume of freight moved on rail and will help reduce transport costs and generate savings for local and regional businesses.
The estimated cost of the GRAIP is $33.36 million. The project is on schedule and is expected to be completed by first quarter of 2009.

75
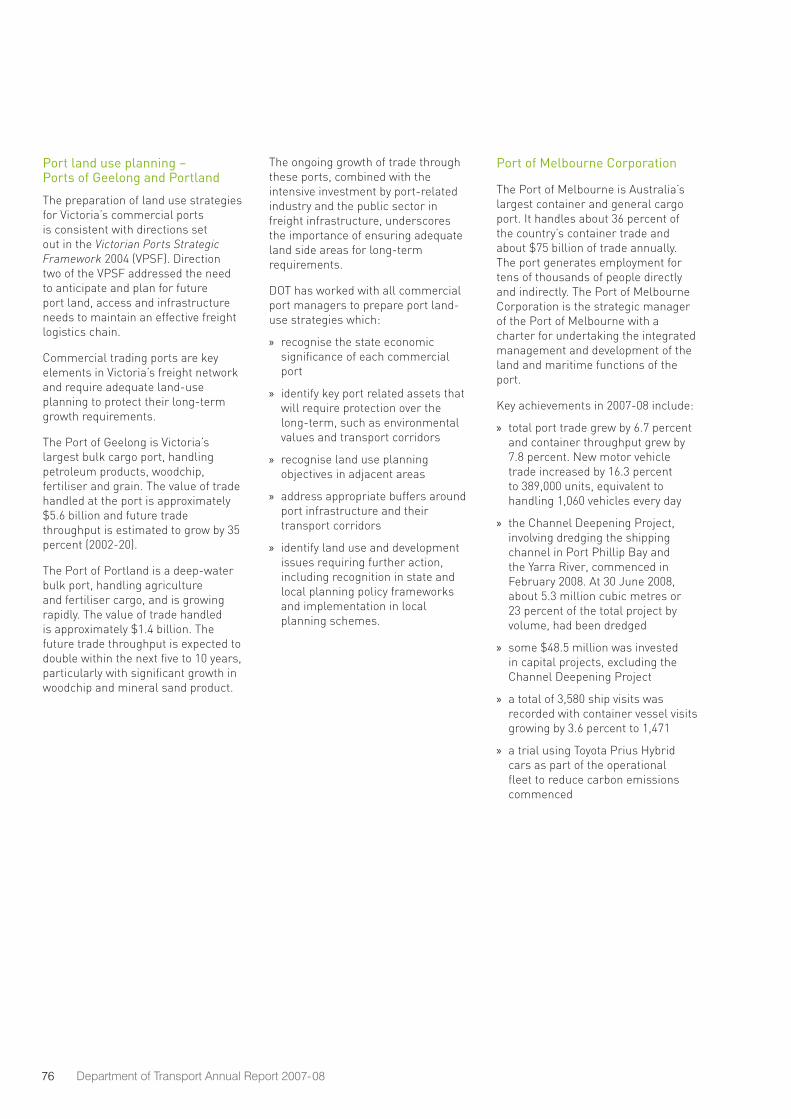
76 Department of Transport Annual Report 2007-08
Port land use planning – Ports of Geelong and Portland
The preparation of land use strategies for Victoria’s commercial ports is consistent with directions set out in the Victorian Ports Strategic Framework 2004 (VPSF). Direction two of the VPSF addressed the need to anticipate and plan for future port land, access and infrastructure needs to maintain an effective freight logistics chain.
Commercial trading ports are key elements in Victoria’s freight network and require adequate land-use planning to protect their long-term growth requirements.
The Port of Geelong is Victoria’s largest bulk cargo port, handling petroleum products, woodchip, fertiliser and grain. The value of trade handled at the port is approximately $5.6 billion and future trade throughput is estimated to grow by 35 percent (2002-20).
The Port of Portland is a deep-water bulk port, handling agriculture and fertiliser cargo, and is growing rapidly. The value of trade handled is approximately $1.4 billion. The future trade throughput is expected to double within the next five to 10 years, particularly with significant growth in woodchip and mineral sand product.
The ongoing growth of trade through these ports, combined with the intensive investment by port-related industry and the public sector in freight infrastructure, underscores the importance of ensuring adequate land side areas for long-term requirements.
DOT has worked with all commercial port managers to prepare port land-use strategies which:
recognise the state economic »significance of each commercial port
identify key port related assets that »will require protection over the long-term, such as environmental values and transport corridors
recognise land use planning »objectives in adjacent areas
address appropriate buffers around »port infrastructure and their transport corridors
identify land use and development »issues requiring further action, including recognition in state and local planning policy frameworks and implementation in local planning schemes.
Port of Melbourne Corporation
The Port of Melbourne is Australia’s largest container and general cargo port. It handles about 36 percent of the country’s container trade and about $75 billion of trade annually. The port generates employment for tens of thousands of people directly and indirectly. The Port of Melbourne Corporation is the strategic manager of the Port of Melbourne with a charter for undertaking the integrated management and development of the land and maritime functions of the port.
Key achievements in 2007-08 include:
total port trade grew by 6.7 percent »and container throughput grew by 7.8 percent. New motor vehicle trade increased by 16.3 percent to 389,000 units, equivalent to handling 1,060 vehicles every day
the Channel Deepening Project, »involving dredging the shipping channel in Port Phillip Bay and the Yarra River, commenced in February 2008. At 30 June 2008, about 5.3 million cubic metres or 23 percent of the total project by volume, had been dredged
some $48.5 million was invested »in capital projects, excluding the Channel Deepening Project
a total of 3,580 ship visits was »recorded with container vessel visits growing by 3.6 percent to 1,471
a trial using Toyota Prius Hybrid »cars as part of the operational fleet to reduce carbon emissions commenced
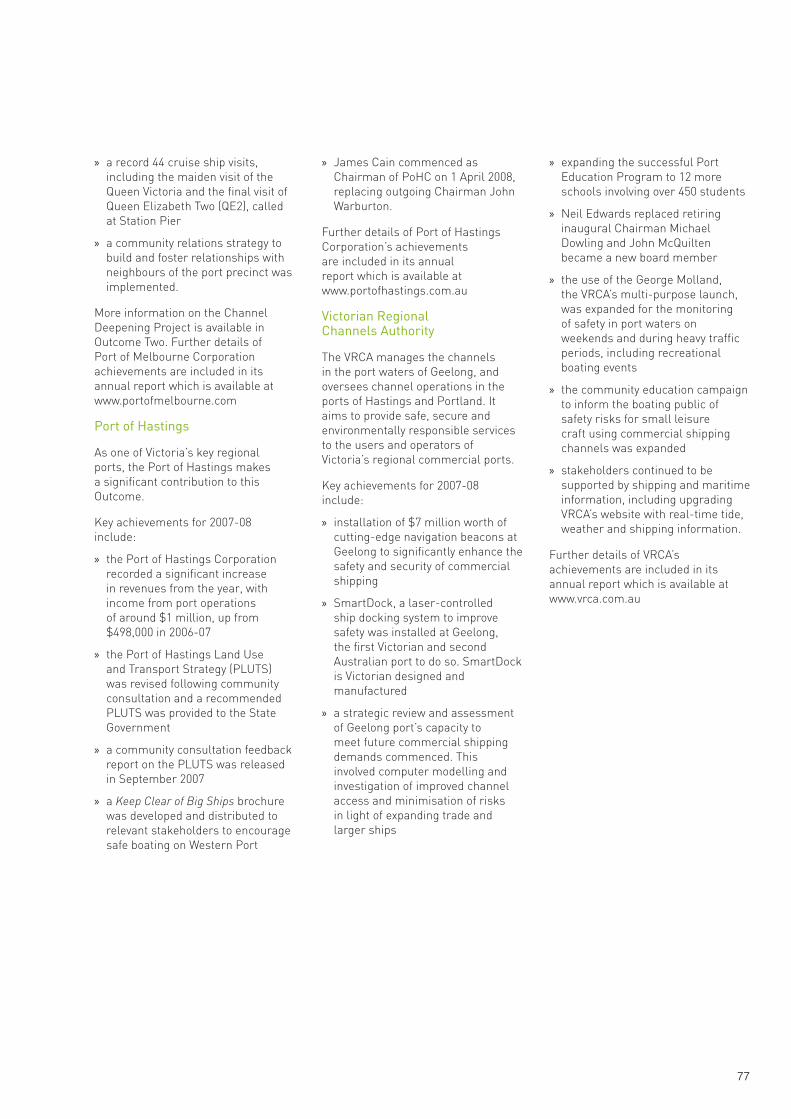
77
a record 44 cruise ship visits, »including the maiden visit of the Queen Victoria and the final visit of Queen Elizabeth Two (QE2), called at Station Pier
a community relations strategy to »build and foster relationships with neighbours of the port precinct was implemented.
More information on the Channel Deepening Project is available in Outcome Two. Further details of Port of Melbourne Corporation achievements are included in its annual report which is available at www.portofmelbourne.com
Port of Hastings
As one of Victoria’s key regional ports, the Port of Hastings makes a significant contribution to this Outcome.
Key achievements for 2007-08 include:
the Port of Hastings Corporation »recorded a significant increase in revenues from the year, with income from port operations of around $1 million, up from $498,000 in 2006-07
the Port of Hastings Land Use »and Transport Strategy (PLUTS) was revised following community consultation and a recommended PLUTS was provided to the State Government
a community consultation feedback »report on the PLUTS was released in September 2007
a » Keep Clear of Big Ships brochure was developed and distributed to relevant stakeholders to encourage safe boating on Western Port
James Cain commenced as »Chairman of PoHC on 1 April 2008, replacing outgoing Chairman John Warburton.
Further details of Port of Hastings Corporation’s achievements are included in its annual report which is available at www.portofhastings.com.au
Victorian Regional Channels Authority
The VRCA manages the channels in the port waters of Geelong, and oversees channel operations in the ports of Hastings and Portland. It aims to provide safe, secure and environmentally responsible services to the users and operators of Victoria’s regional commercial ports.
Key achievements for 2007-08 include:
installation of $7 million worth of »cutting-edge navigation beacons at Geelong to significantly enhance the safety and security of commercial shipping
SmartDock, a laser-controlled »ship docking system to improve safety was installed at Geelong, the first Victorian and second Australian port to do so. SmartDock is Victorian designed and manufactured
a strategic review and assessment »of Geelong port’s capacity to meet future commercial shipping demands commenced. This involved computer modelling and investigation of improved channel access and minimisation of risks in light of expanding trade and larger ships
expanding the successful Port »Education Program to 12 more schools involving over 450 students
Neil Edwards replaced retiring »inaugural Chairman Michael Dowling and John McQuilten became a new board member
the use of the George Molland, »the VRCA’s multi-purpose launch, was expanded for the monitoring of safety in port waters on weekends and during heavy traffic periods, including recreational boating events
the community education campaign »to inform the boating public of safety risks for small leisure craft using commercial shipping channels was expanded
stakeholders continued to be »supported by shipping and maritime information, including upgrading VRCA’s website with real-time tide, weather and shipping information.
Further details of VRCA’s achievements are included in its annual report which is available at www.vrca.com.au
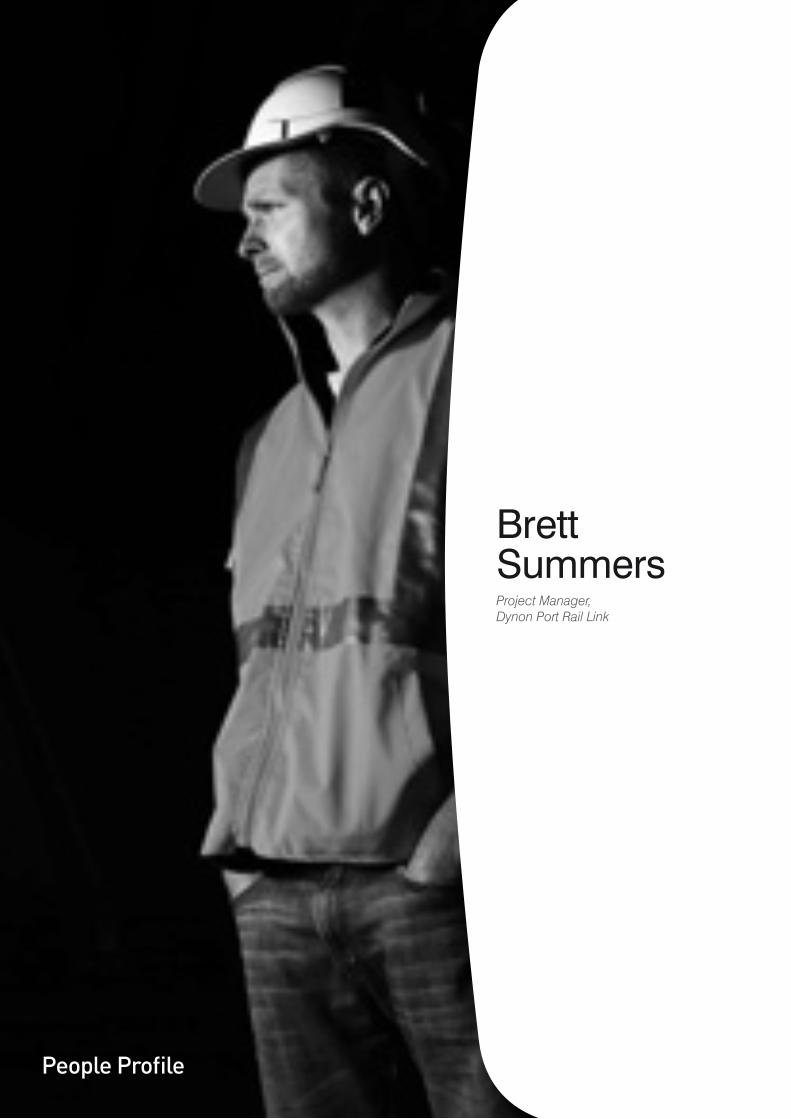
78 Department of Transport Annual Report 2007-08
Brett SummersProject Manager, Dynon Port Rail Link
People Profile
79
The aim of the Dynon Port Rail Link is to increase the efficiency of rail freight movements into the Port of Melbourne. We are building a road bridge and constructing the rail line underneath to give us uninterrupted rail access to and from the port.
I have been working on the project since early 2006. I have a Bachelor of Engineering from Swinburne University and started my career working in private sector construction. I then took a completely different tack and worked in exhibition and event project management before joining the department’s Regional Fast Rail team.
This project has a little bit of everything: road, rail, signalling and structures. This is complicated by the stakeholder and environmental issues. It is a challenge but it is a project which motivates me to come to work each day.
There are a lot of diverse stakeholders including the port operators, the market operators, Maribyrnong and Melbourne City councils, VicRoads, VicTrack and the Federal Government. Keeping them all happy is difficult because of competing interests so it involves a lot of negotiation to achieve mutually beneficial outcomes.
Ultimately, we are all working for the same end result: increasing rail freight efficiency. The project is not very high profile, but commuters will see some real benefits from the removal of a level crossing on Footscray Road.
The main economic benefit will be delivered at the completion of works when multiple trains will have the ability to access the port at any given time. The project will help contribute to a government objective of having more freight carried by rail.
I enjoy being based on-site and watching the project grow from day-to-day. Seeing it develop in real-time is great because I have been part of the project since the early days. It is satisfying to develop something on paper and then watch it take shape in the form of bridges, roads and rail being built.
Construction work started on the Dynon Port Rail Link in 2007. Things are going well and it is due to be finished in 2009. I will feel a real sense of achievement when the project is delivered.

80 Department of Transport Annual Report 2007-08
81
6Integrated policy development
Outcome Six
82 Department of Transport Annual Report 2007-08
DOT works closely with key transport agencies and land use authorities to develop policies and implement projects that will meet Victoria’s transport infrastructure and service needs.
Several divisions contribute to this Outcome, working closely with other government departments to develop integrated policy solutions.
Contributions to this Outcome span a broad range of topics including walking and cycling, transport planning, climate change and older drivers.
Transport information modelling and analysis
The Victorian Integrated Survey of Travel and Activity 2007 (VISTA 07) is a 12-month multi-modal survey of the personal travel and activity of 16,250 households across the Melbourne Statistical Division (MSD), the City of Greater Geelong and the regional centres of Ballarat, Bendigo, Shepparton and the Latrobe Valley.
VISTA 07 collects data on how, why, when, where, how much and what travel and activity is undertaken on a typical day and by whom. The VISTA 07 data will be used in transport model development and transport policy and project development and assessment.
Maintaining Mobility: - The Transition from Driver to Non-driver
The Victorian Government recognises the importance of understanding the mobility needs of older Victorians, particularly in light of our ageing population. Guided by a Specialist Steering Group, DOT has developed the strategic policy framework Maintaining Mobility: The Transition from Driver to Non-driver to inform discussion and identify practical actions to help senior Victorians maintain their mobility as they start to reduce the amount of driving they do, or as they stop driving altogether. The framework was launched by Minister Kosky at the Longevity Symposium: Policy Implications of Victoria’s Ageing Population hosted by the DPCD on 27 November 2007.
Integrated policy development
83
One of the initiatives in the document is the Mobility Advisor Pilot, which is a tailored program to help maintain people’s mobility and access to activities when they are transitioning from driving to non-driving. The pilot will trial a mobility advisor service, which will provide personalised mobility advice and support related to the participants’ local residential areas, and their abilities and needs. The pilot will commence in two metro local government areas in September 2008 and is due to conclude by March 2009.
Transport Demand Information Atlas
The first edition of the Transport Demand Information Atlas (TDIA) was published in 2007-08. TDIA is a compilation of statistics that provide important insights into transport demand. It compiles reliable and recent data relating to key aspects of the passenger and freight tasks.
Transport legislation review
As recognised in MOTC, an integrated and sustainable transport system for Victoria requires a comprehensive transport legislation review.
DOT commenced the Transport Legislation Review (the Review) in 2007 with a discussion paper, ‘Towards an Integrated and Sustainable Transport Future: A new legislative framework for transport in Victoria’, released for public comment in October 2007.
A comprehensive stakeholder engagement program on the discussion paper received 78 formal submissions with a feedback summary released in March 2008 covering general expectations and appropriate objectives for any legislation. The stakeholder engagement process, which found significant support for the government’s policy directions, included:
40 stakeholder briefings »
eight forums attended by 170 »stakeholders (in both Melbourne and rural and regional areas)
workshops with 120 local »government and state government stakeholders
two Ministerial Round Tables. »
The Review and the development of a new, overarching transport statute, the Transport Integration Act, to replace the Transport Act 1983 will set the direction for a more integrated transport system as set out in the Annual Statement of Government Intentions (February 2008). The new statute is expected to be introduced to parliament in late 2008
The new legislative and policy settings continue Victoria’s national leadership in policy and legislation reform and will provide a contemporary framework to deliver an integrated and sustainable transport system to meet the long-term needs of Victorians.
Transport Research and Policy Analysis Bulletin
This quarterly publication is produced by DOT to communicate findings of policy analysis and research activities undertaken by the department. The bulletin goes to about 3,000 recipients, including community libraries. The broad range of issues covered so far include the new personal travel and activity survey, VISTA; the Transport Demand Information Atlas; climate change and transport; transport energy and land-use; AusLink2 and time use research.
Macro-Urban Form, Transport Energy and Greenhouse Gas Emissions Project
This project aims for a better understanding of the impact of and urban form on greenhouse gas (GHG) emissions and transport energy outcomes in Melbourne. The project seeks to:
develop a better understanding of »how urban structures influence transport costs/energy use and behavioural responses to changes in transport costs
assess urban development that »supports efficient transport choices
quantify transport energy outcomes »and greenhouse gas emissions at the small area level across Melbourne
develop land-use/transport »scenarios to test transport energy and greenhouse gas outcomes and consider which scenario will produce the most efficient transport energy use and the lowest emissions.

84 Department of Transport Annual Report 2007-08
85
Transport Connections Program II
The Transport Connections Program is funded till June 2010 through an $18.3 million budget allocation as part of the Meeting Our Transport Challenges statement. The Program is a partnership between the Department of Planning and Community Development (DPCD); Department of Transport; the Department of Human Services; and the Department of Education and Early Childhood Development.
Community groups and organisations, individuals, transport providers and local businesses work together to develop tailored transport solutions to make better use of their existing public and private transport resources.
The Transport Connections Program commenced as a pilot program in 2003 with nine local project partnerships across Victoria. Now, through the $18.3 million allocation, the Program has expanded to 32 project partnerships covering all rural, regional and interface municipalities.
Walking and Cycling
The Victorian Government Walking and Cycling branch encourages greater use of sustainable, healthy and community-based transport options.
It is making the largest investment into walking and cycling in the state’s history.
A range of walking and cycling research programs were conducted in 2007-08. Results from this research are helping to inform funding decisions and policy direction.
Funding of $28.2 million was secured for the Walking and Cycling Infrastructure Program, which
will be delivered by VicRoads. $11.6 million has been allocated for central Melbourne projects, with the remaining $16.5 million to be used for projects across the state.
In 2007-08, VicRoads added 13.8 kilometres to Victoria’s existing network of bicycle facilities at a cost of $5.7 million. New pedestrian facilities, such as pedestrian operated signals, were installed at 16 locations and 89 sites were upgraded with audio-tactile pedestrian push buttons and textured tiles to provide safer walking surfaces. New infrared detection systems were installed at 26 signalised pedestrian crossings to reduce delays for pedestrians.
TravelSmart
The TravelSmart initiative aims to reduce people’s dependency on cars and encourage them to use sustainable travel alternatives such as walking, cycling and public transport.
In May 2008, 23 workplaces, including 10 government departments, were surveyed, generating over 9,000 responses, with this information now being used to support the development of travel plans.
A number of resources were developed to support TravelSmart, including six TravelSmart Maps, and the CycleSmart and WalkSmart websites, which were completed in March 2008.
The collegiate network of TravelSmart officers was convened six times over the year, helping our partners to enhance their skills.
Local Area Access program and TravelSmart grants
In 2006 TravelSmart began a new program of grants which sought to increase the capacity of councils and other organisations to develop and implement projects that encourage changes in travel behaviour. A complementary program of grants,
the local Area Access Program, provides funding for small scale infrastructure projects which aim to improve access to walking, cycling and public transport within local areas.
The second grants round for Local Area Access and TravelSmart was successfully run from April to October 2007. This round attracted 60 applications, with 22 projects funded. This represents a commitment of over $3.2 million, with local government to provide equal funding to deliver TravelSmart and local access infrastructure throughout the state.
Eight projects from the first grants round were completed during 2007-08.
Transit Cities
The Urban Redevelopment Transport Infrastructure Coordination unit was established in September 2006 to provide leadership and portfolio oversight and coordination of the government’s Transit Cities projects. The unit has a key involvement in the planning, development and delivery of integrated transport and infrastructure outcomes and provides a development facilitation role to support practical and timely achievement of Transit City objectives.
In May 2008, the government announced $51.9 million of funding over four years for the Transit Cities program including:
$24.5 million for improvements in »the Geelong railway station precinct
$8.4 million for design work that »will lead to the integration of Broadmeadows railway station with the town centre
planning and delivery of integrated »transport and infrastructure initiatives across several other Transit Cities.
86 Department of Transport Annual Report 2007-08
Key achievements for URTIC in 2007-08 include:
providing $11.2 million for further »development of Geelong and Ringwood Transit Cities
providing transport planning, »analysis and technical information, and jointly contributing to the preparation of business cases for Geelong, Broadmeadows and Ringwood Transit Cities
establishing » Footscray Renewal to deliver the $52.1 million Footscray Transit City program. This will provide a modern footbridge and forecourts at Footscray station, an upgrade of main streets in the town centre, facilitation of private sector development of strategic sites in central Footscray, development of traffic management strategies and establishment of a one-stop shop for planning approvals and development facilitation
continuing to build strong »relationships across government departments and agencies to assist in achieving Transit City objectives.
Infrastructure planning
The Director of Public Transport became a Referral Authority under the Planning and Environment Act 1987 in October 2006. This ensures that public transport, walking and cycling are accounted for in nominated major developments.
The Director considers every referred planning application and may attach conditions to development approvals. This improves public transport outcomes, better integrates land-use and transport planning and furthers the objectives of Melbourne 2030.
280 applications were considered in 2007-08. Concurrently, the department, worked with councils, the Growth Areas Authority, the Department of Planning and Community Development and other stakeholders to develop structure plans to guide development in metropolitan activity centres and growth areas.
Intergovernmental Relations
DOT works closely with the Commonwealth Department of Infrastructure, Transport, Regional Development and local government, particularly on projects that are being delivered under the AusLink program. The Commonwealth Government has made commitments to fund 25 transport projects in Victoria, including 20 projects nominated in the state’s AusLink 2 policy document, National Transport Links – Growing Victoria’s Economy. These projects are a mix of road, rail and intermodal projects.
In the 2008 Federal Budget, Victoria received Commonwealth funding for eight projects to enable early commencement of AusLink 2 projects. These projects are:
West Gate Bridge ($25 million) »
Western Ring Road ($14 million) »
Geelong Ring Road Stage 4A »($6.5 million)
Colac-Lavers Hill Road ($3 million) »
Nagambie Bypass ($5 million) »
Western Highway ($5 million) »
Princes Highway West ($1 million) »
Princes Highway East ($1.2 million). »
This complements funding provided in the state budget for three AusLink 2 projects:
Anthony’s Cutting ($5 million) »
Geelong Ring Road Stage 4B »($5 million)
Princes Highway West ($5 million). »
Green Triangle Freight Summit
The department helped to coordinate the Green Triangle Freight Summit, convened by the Victorian and South Australian Governments on 9 May 2008 in Portland and Mt. Gambier.
The summit provided an opportunity for industry and local government to brief the Victorian and South Australian Governments on the local transport impacts of the harvesting of timber plantations in the Green Triangle from 2009 onwards.
Presentations were made by timber companies, the Port of Portland, Freight Logistics Councils and local government.
The Victorian and South Australian Ministers agreed to a number of actions, including:
development of a Freight Action »Plan for the region, with a draft to be completed by state and local government officials by December 2008
establishment of a Cross-Border »Regulatory Efficiencies Taskforce to identify regulatory barriers to the efficient and seamless movement of freight between the two states
convening a Freight Summit twice- »yearly
undertaking joint advocacy between »the state and local governments and industry to the Commonwealth Government to highlight the strategic value to national supply chain efficiency of addressing constraints in the Green Triangle transport network.
87
National Transport Policy – incorporating passenger transport and land-use planning into the national transport planning process
As part of the Australian Transport Council (ATC) infrastructure planning and investment work-stream led by DOT, a National Working Group is identifying how best to include transport and land-use planning in a new national transport planning process.
Guideline and case study development has commenced, with a view to having a working draft agreed by all states and territories and the Commonwealth by November 2008.
The aim is to develop practical guidelines that integrate land-use and transport at the implementation stage.
Integrated Transport Planning
DOT is continuing a range of integrated transport planning initiatives commenced by the former office of Coordinator General, Infrastructure.
ITPD coordinates whole of government transport and land use planning. It strengthens links between key transport and land use authorities, including the Department of Transport, VicRoads and the Department of Planning and Community Development. ITPD worked closely with other DOT divisions and VicRoads on a range of initiatives during 2007-08.
Key achievements include:
leading the development of a »comprehensive transport plan for Victoria, in the context of future urban development and regional planning. The plan will respond to the proposals for Melbourne’s east-west corridor in Sir Rod Eddington’s report: Investing in Transport: East West Link Needs Assessment, (EWLNA report) as well as other transport priorities for the state. It is due for release by the end of 2008
continuing to the government’s »response to the Melbourne 2030 Audit (Planning for all of Melbourne), the Victorian Competition and Efficiency Commissions‘ inquiry into Melbourne’s liveability; and precinct structure planning with the Growth Areas Authority and relevant agencies
developing a national congestion »issues paper and work program
coordinating the Premier’s »Congestion Roundtable in January 2008
developing and launching »Keeping Melbourne Moving, a $112.7 million short-term congestion management plan, released in April 2008. Keeping Melbourne Moving is aimed at easing congestion in the short-term, while medium- and longer-term solutions, like major road upgrades and the purchase of new trains and trams are underway. Key features of the plan are:
standardisation and extension of -more than 150 clearways within 10 kilometres of the Melbourne CBD
extension of the bus and tram -priority programs
extension of rapid response -patrols
funding boost for cycling and -pedestrian facilities
information campaign for -motorists.
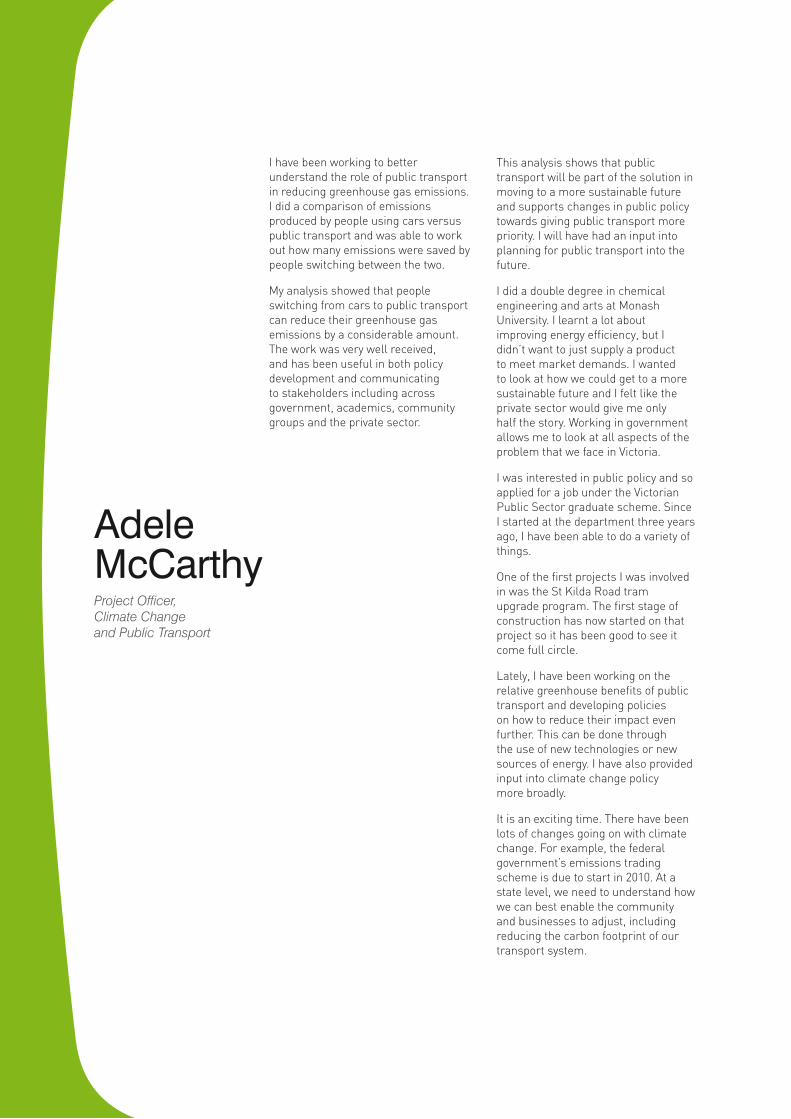
88 Department of Transport Annual Report 2007-08
I have been working to better understand the role of public transport in reducing greenhouse gas emissions. I did a comparison of emissions produced by people using cars versus public transport and was able to work out how many emissions were saved by people switching between the two.
My analysis showed that people switching from cars to public transport can reduce their greenhouse gas emissions by a considerable amount. The work was very well received, and has been useful in both policy development and communicating to stakeholders including across government, academics, community groups and the private sector.
This analysis shows that public transport will be part of the solution in moving to a more sustainable future and supports changes in public policy towards giving public transport more priority. I will have had an input into planning for public transport into the future.
I did a double degree in chemical engineering and arts at Monash University. I learnt a lot about improving energy efficiency, but I didn’t want to just supply a product to meet market demands. I wanted to look at how we could get to a more sustainable future and I felt like the private sector would give me only half the story. Working in government allows me to look at all aspects of the problem that we face in Victoria.
I was interested in public policy and so applied for a job under the Victorian Public Sector graduate scheme. Since I started at the department three years ago, I have been able to do a variety of things.
One of the first projects I was involved in was the St Kilda Road tram upgrade program. The first stage of construction has now started on that project so it has been good to see it come full circle.
Lately, I have been working on the relative greenhouse benefits of public transport and developing policies on how to reduce their impact even further. This can be done through the use of new technologies or new sources of energy. I have also provided input into climate change policy more broadly.
It is an exciting time. There have been lots of changes going on with climate change. For example, the federal government’s emissions trading scheme is due to start in 2010. At a state level, we need to understand how we can best enable the community and businesses to adjust, including reducing the carbon footprint of our transport system.
Adele McCarthyProject Officer, Climate Change and Public Transport

89People Profile

90 Department of Transport Annual Report 2007-08
91
Organisational capability building
Outcome Seven7
92 Department of Transport Annual Report 2007-08
To ensure successful delivery of projects and objectives, peoples’ skills and organisational efficiency need to be constantly monitored and developed. Strategies that increase engagement, commitment and satisfaction, but reduce stress will enhance performance and employer reputation.
DOT recruits individuals with specific skills sets and offers targeted learning and career development opportunities. As initiatives are delivered as part of the Meeting Our Transport Challenges, project management skills have become a key part of the career development strategy.
DOT recognises that it is essential to identify future workforce needs and design appropriate programs to meet them.
During 2007-08, DOT continued to build upon existing capability by focussing on developing our people, processes and systems with a range of initiatives.
DOT’s People Strategy 2007-10
Launched in October 2007, this strategy aims to build and secure a strong workforce in a climate of economic prosperity, an ageing population and labour shortages. The strategy is focussed on three key objectives:
1. attracting and recruiting the right people
2. creating a great place to work
3. retaining valuable knowledge and skills.
Key achievements in 2007-08 include the following:
a short promotional DVD for DOT »shown at local and international careers fairs has helped fill difficult roles
in addition to the existing VPS-wide »graduate program, an 18-month engineering program and a three year rail engineering graduate program with specialist technical streams have attracted highly qualified graduates
Organisational capability building
93
creation and testing of an employee »value proposition
2007 DOT biennial engagement »survey revealed engagement levels had increased by five percent. DOT has now set 12 benchmarks covering job flexibility, workloads and a safe working environment against similar-sized organisations
retention strategies included »promoting all positions internally and externally, building management skills and providing learning and development opportunities
work continues around better »understanding the workforce, including demographic composition and capability levels. Succession management strategies for building a talent pipeline were developed including a pilot Accelerated Development Program for high potential VPS grade 6 people
‘Flex-Ability’ guide, released in »April 2008, encourages employee participation in work/life balance and diversity initiatives. This was supported by a range of related presentations and activities, including managing time as a working parent, retirement planning and building understanding of different health issues
VPS grade 4,5 and 6 management »staff attended the ‘managing with confidence’ program
design and implementation »of various programs to build the recruitment skills of DOT managers.
Support for train drivers
In an Australian first, legislation was amended to enable the Director of Public Transport to provide financial assistance to drivers of trains involved in fatal collisions. This support is in recognition of the trauma and significant mental stress experienced by train drivers in the event of a suicide or fatal accident.
Accommodation
DOT completed two major accommodation projects in 2007-08, both on time and within budget. In November 2007, the head office of DOT was established at 121 Exhibition Street, Melbourne. The new office has a four-star Australian Building Greenhouse Rating.
DOT also refurbished its accommodation at 80 Collins Street. Although working to a tight timeframe this project was completed on time and within budget.
Records and document Management
In 2007-08 DOT implemented an electronic document and record management strategy. This included integrating a document management system (TRIM Context) on all desktops and providing education and training for all DOT people, via a mandatory half-day course, e-learning, manuals and quick reference guides. DOT also migrated documents and records from both legacy and retired systems. A strong operational team was established to support people through a successful implementation.
Risk management
A range of activities to identify and address areas of risk were undertaken.
Key achievements include:
a review of the Risk Management »Framework
development of a new Strategic »Risk Register
a major review of the DOT Fraud »and Corruption Detection and Prevention Program
substantial completion of the first »phase Business Continuity Plan
a series of risk management »workshops across DOT
an increased focus on project risk »management through a Project Management Framework
risk management training for »managers and development of a program to further embed risk management in all departmental business planning.
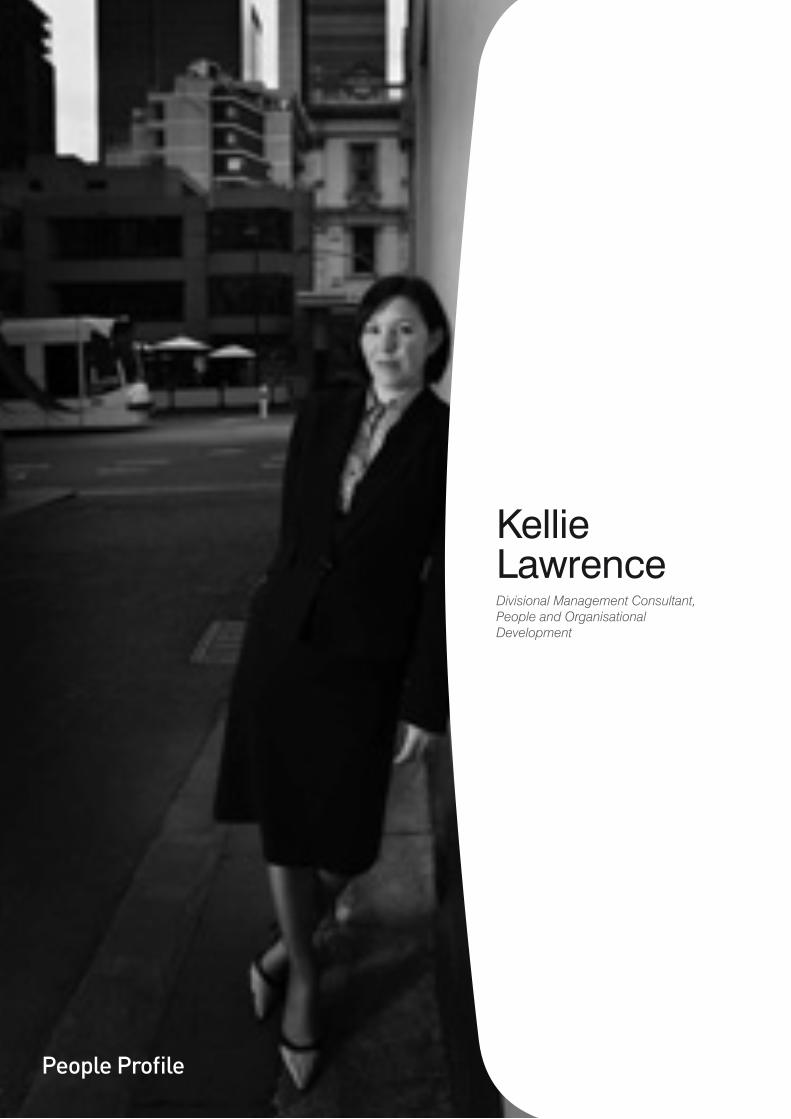
94 Department of Transport Annual Report 2007-08People Profile
Kellie LawrenceDivisional Management Consultant, People and Organisational Development
95
After being seconded in April 2005 from the State Services Authority on a three month, fixed term contract, I started with the Department of Infrastructure as the Indigenous Liaison Officer. In this role I was required to develop and implement a range of Indigenous employment programs for the department. This was a challenging project, as prior to this, the department had no Indigenous specific programs and no profile throughout the Indigenous community.
Within three months, a range of short- and long-term programs had been developed and implemented including: Indigenous cultural awareness sessions, a tertiary scholarship program, unique branding for programs, promotion in the Koori Mail and a work experience program. Happily my contract was extended and I was able to build on the success of the programs.
While it was a difficult environment in which to implement Indigenous programs, I received great support from several divisions. These divisions recognised that even though the department did not provide services to the Indigenous community it could provide opportunities to help level the ‘playing field.’
The role of Diversity Coordinator was a fantastic opportunity for me to broaden my skills and knowledge and to play a key role in developing and implementing initiatives to build a more inclusive workplace. The diversity portfolio is wide ranging and includes: the Disability Action Plan, women, youth, people from a non-English speaking background and Indigenous programs.
My objective is to streamline the current process and reduce the amount of separate action plans required for each area, incorporating all needs into an overarching Equity, Diversity and Inclusion Plan. This will allow for the focus to shift from one specific group, to a broader and all encompassing way of thinking about diversity.
One of the highlights of my career at DOT so far is our partnering with RMIT to provide an annual Indigenous art exhibition during NAIDOC Week. This has been hugely successful.
I have organised many special events during my time at the department for weeks of significance such as Cultural Diversity Week, International Women’s Day, Reconciliation Week and NAIDOC week. Particular highlights have been: King Marong and the African drummers and dancers, Waleed Aly from the Islamic Council of Australia, Indigenous activist Gary Foley, and Tito Tut Pal, a Sudanese refugee.
I work full-time and am studying a graduate diploma in Human Resources part-time. I also have a two-year-old, Belle. I like to keep busy. I love working as part of my team, particularly as I get a lot of opportunities and the freedom to put up an idea or proposal and run with it.
I believe the department provides fantastic benefits and inspirational leadership. I look forward to see how things will change and improve in the future.

96 Department of Transport Annual Report 2007-08
97
Office of the Chief Investigator
98 Department of Transport Annual Report 2007-08
The Chief Investigator, Transport and Marine Safety Investigations is a statutory position established on 1 August 2006 under Part V of the Transport Act 1983.
The principle function of the Office of Chief Investigator is to improve public transport and marine safety by independently investigating transport and marine safety issues and reporting all results to the Minister for Public Transport and/or the Minister for Roads and Ports.
The primary focus of the investigations is not to apportion blame but to determine causes and identify issues for review, monitoring or further consideration.
The Chief Investigator is not subject to the direction or control of the Minister(s) in performing or exercising his functions or powers, however, the Minister(s) may direct the Chief Investigator to investigate a public transport safety matter or a marine safety matter.
An investigation conducted by the Chief Investigator does not replace the powers of regulatory bodies to conduct their own investigations into the same incident.
The office’s seven staff include the Chief Investigator, two rail and two marine investigators, one engineer and an office manager.
For more information please visit www.transport.vic.gov.au/chiefinvestigator
Office of the Chief Investigator
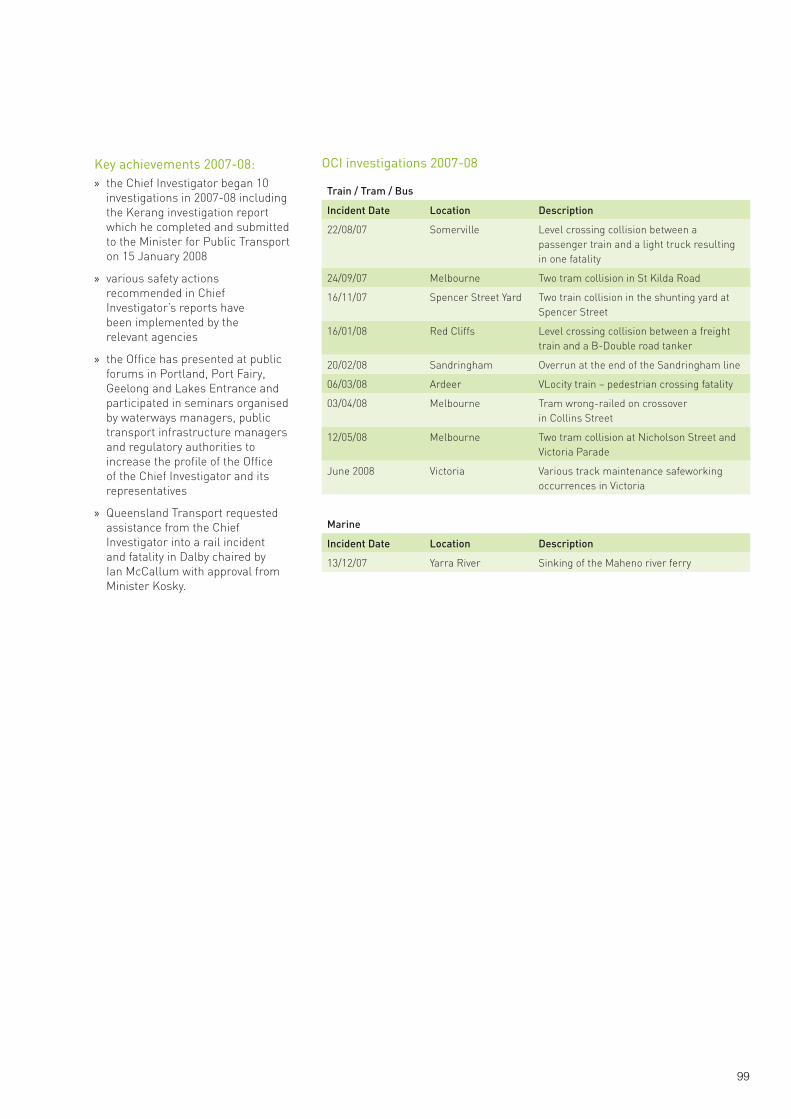
99
Key achievements 2007-08:the Chief Investigator began 10 »investigations in 2007-08 including the Kerang investigation report which he completed and submitted to the Minister for Public Transport on 15 January 2008
various safety actions »recommended in Chief Investigator’s reports have been implemented by the relevant agencies
the Office has presented at public »forums in Portland, Port Fairy, Geelong and Lakes Entrance and participated in seminars organised by waterways managers, public transport infrastructure managers and regulatory authorities to increase the profile of the Office of the Chief Investigator and its representatives
Queensland Transport requested »assistance from the Chief Investigator into a rail incident and fatality in Dalby chaired by Ian McCallum with approval from Minister Kosky.
OCI investigations 2007-08
Train / Tram / Bus
Incident Date Location Description
22/08/07 Somerville Level crossing collision between a passenger train and a light truck resulting in one fatality
24/09/07 Melbourne Two tram collision in St Kilda Road
16/11/07 Spencer Street Yard Two train collision in the shunting yard at Spencer Street
16/01/08 Red Cliffs Level crossing collision between a freight train and a B-Double road tanker
20/02/08 Sandringham Overrun at the end of the Sandringham line
06/03/08 Ardeer VLocity train – pedestrian crossing fatality
03/04/08 Melbourne Tram wrong-railed on crossover in Collins Street
12/05/08 Melbourne Two tram collision at Nicholson Street and Victoria Parade
June 2008 Victoria Various track maintenance safeworking occurrences in Victoria
Marine
Incident Date Location Description
13/12/07 Yarra River Sinking of the Maheno river ferry
100 Department of Transport Annual Report 2007-08
These financial statements for the year ended 30 June 2008 cover the Department of Transport (formerly Department of Infrastructure), the Director of Public Transport, ‘The Director’, the Secretary to the Department of Transport as a body corporate, the Statutory Offices of ‘The Director’ (Public Transport Safety and the Chief Investigator, Transport and Marine Safety Investigations).
The Department of Transport is a government department of the State of Victoria.
A description of the nature of the department’s operations and its principal activities is included in the Report of Operations.
For queries in relation to our financial statements please call 9655 6666, or visit our web site www.transport.vic.gov.au
101
Contents
Financial statements
102 Accountable Officer’s and Chief Finance Officer’s Declaration
103 Victorian Auditor-General’s Report
104 Operating statement
105 Balance sheet
106 Statement of changes in equity
107 Cash flow statement
108 Notes to the financial statements
102 Department of Transport Annual Report 2007-08
Accountable Officer’s and Chief Finance Officer’s Declaration
Department of Transport
Accountable Officer’s and Chief Finance Officer’s Declaration
We certify that the attached financial report for the Department of Transport have been prepared in accordance with Standing Direction 4.2 of the Financial Management Act 1994, applicable Financial Reporting Directions, Australian accounting standards and other mandatory professional reporting requirements.
We further state that, in our opinion, the information set out in the operating statement, balance sheet, statement of changes in equity, cash flow statement and notes to and forming part of the financial statements, presents fairly the financial transactions during the year ended 30 June 2008 and financial position of the Department of Transport as at 30 June 2008.
We are not aware of any circumstance which would render any particulars included in the financial report to be misleading or inaccurate.
We authorise the attached financial report for issue on 27 August 2008.
Robert Oliphant Jim Betts
Chief Finance Officer Secretary and Accountable Officer
Department of Transport Department of Transport
Melbourne Melbourne
Dated: Dated:
103
Victorian Auditor-General’s Report
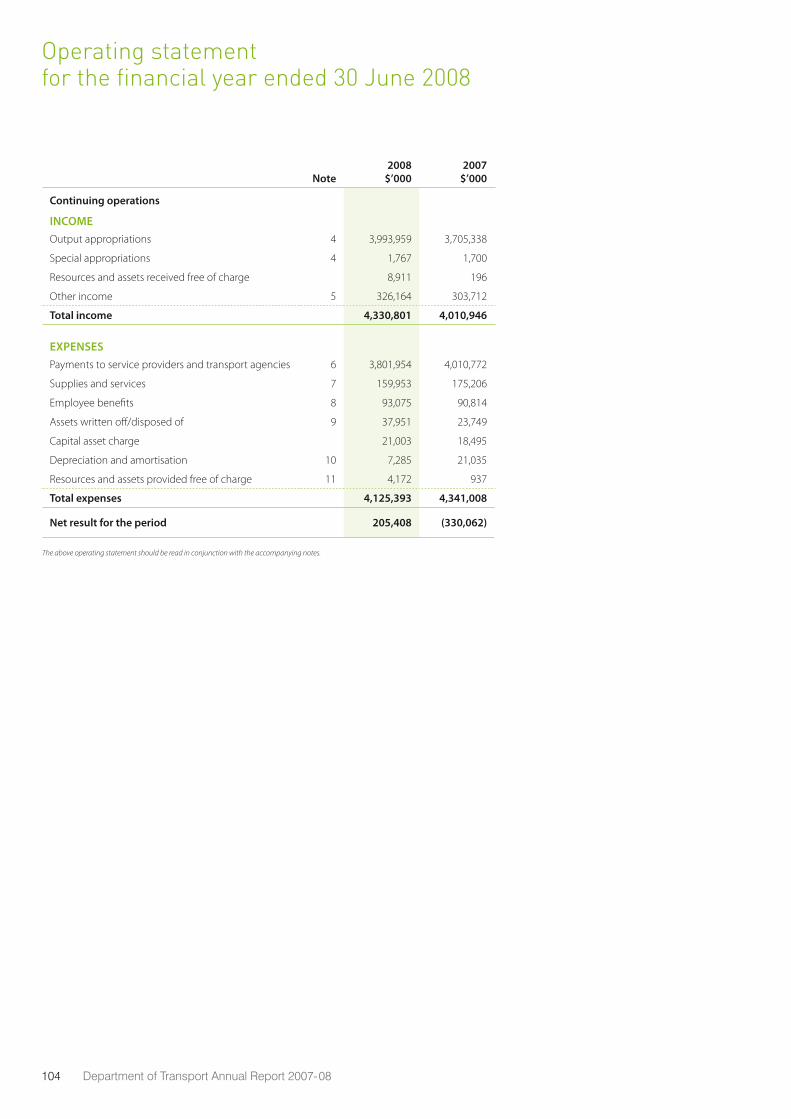
104 Department of Transport Annual Report 2007-08
Operating statement for the financial year ended 30 June 2008
Note2008
$’0002007
$’000
Continuing operations
INCOMEOutput appropriations 4 3,993,959 3,705,338
Special appropriations 4 1,767 1,700
Resources and assets received free of charge 8,911 196
Other income 5 326,164 303,712
Total income 4,330,801 4,010,946
EXPENSES Payments to service providers and transport agencies 6 3,801,954 4,010,772
Supplies and services 7 159,953 175,206
Employee benefits 8 93,075 90,814
Assets written off/disposed of 9 37,951 23,749
Capital asset charge 21,003 18,495
Depreciation and amortisation 10 7,285 21,035
Resources and assets provided free of charge 11 4,172 937
Total expenses 4,125,393 4,341,008
Net result for the period 205,408 (330,062)
The above operating statement should be read in conjunction with the accompanying notes.
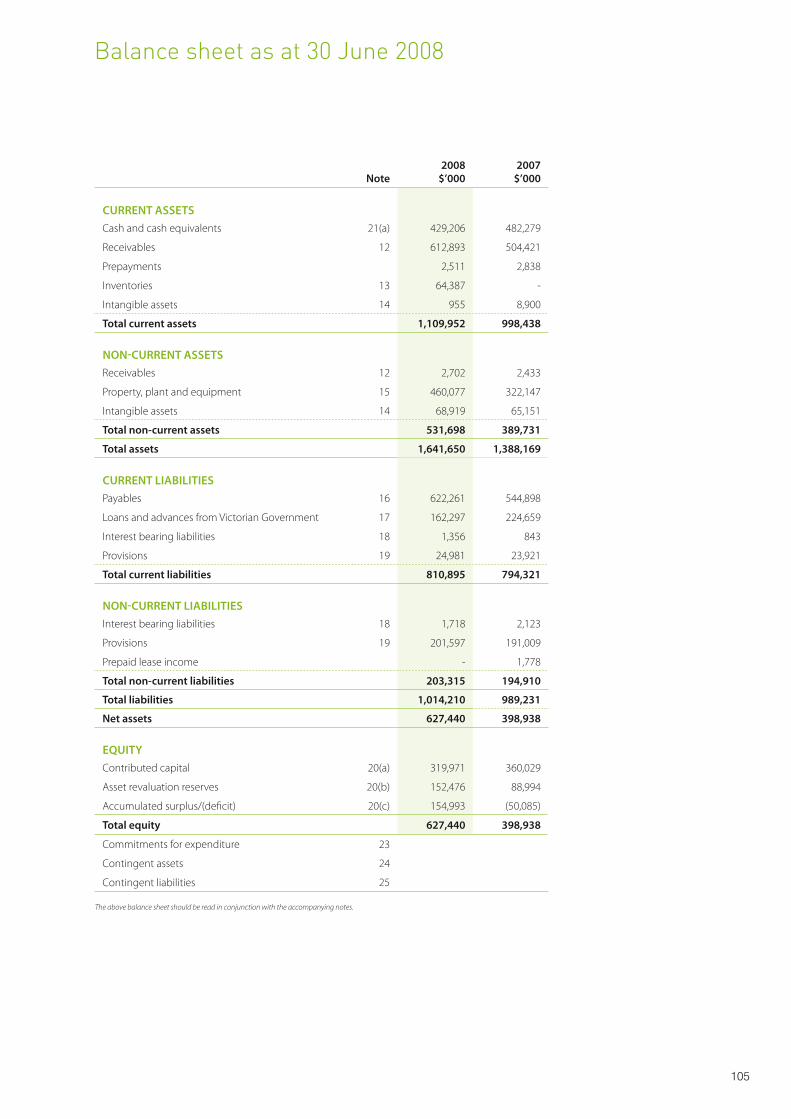
105
Balance sheet as at 30 June 2008
Note2008
$’0002007
$’000
CURRENT ASSETSCash and cash equivalents 21(a) 429,206 482,279
Receivables 12 612,893 504,421
Prepayments 2,511 2,838
Inventories 13 64,387 -
Intangible assets 14 955 8,900
Total current assets 1,109,952 998,438
NON-CURRENT ASSETSReceivables 12 2,702 2,433
Property, plant and equipment 15 460,077 322,147
Intangible assets 14 68,919 65,151
Total non-current assets 531,698 389,731
Total assets 1,641,650 1,388,169
CURRENT LIABILITIESPayables 16 622,261 544,898
Loans and advances from Victorian Government 17 162,297 224,659
Interest bearing liabilities 18 1,356 843
Provisions 19 24,981 23,921
Total current liabilities 810,895 794,321
NON-CURRENT LIABILITIESInterest bearing liabilities 18 1,718 2,123
Provisions 19 201,597 191,009
Prepaid lease income - 1,778
Total non-current liabilities 203,315 194,910
Total liabilities 1,014,210 989,231
Net assets 627,440 398,938
EQUITYContributed capital 20(a) 319,971 360,029
Asset revaluation reserves 20(b) 152,476 88,994
Accumulated surplus/(deficit) 20(c) 154,993 (50,085)
Total equity 627,440 398,938
Commitments for expenditure 23
Contingent assets 24
Contingent liabilities 25
The above balance sheet should be read in conjunction with the accompanying notes.
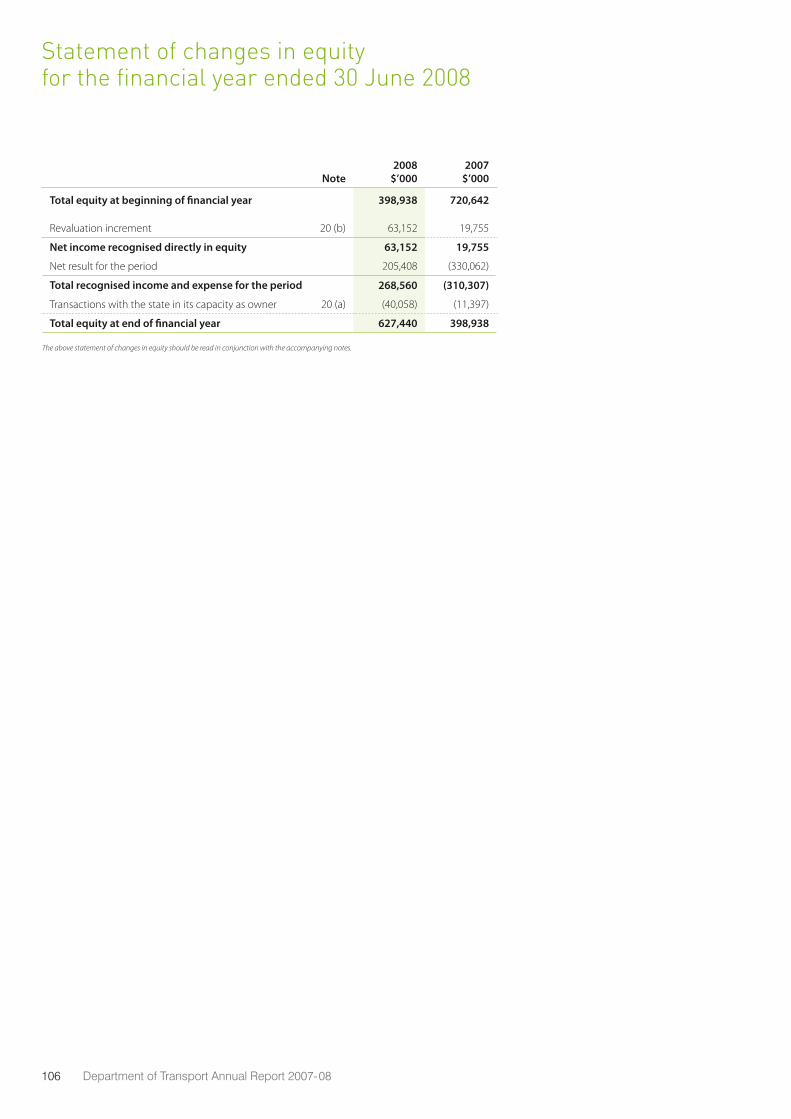
106 Department of Transport Annual Report 2007-08
Statement of changes in equity for the financial year ended 30 June 2008
Note2008
$’0002007
$’000
Total equity at beginning of financial year 398,938 720,642
Revaluation increment 20 (b) 63,152 19,755
Net income recognised directly in equity 63,152 19,755
Net result for the period 205,408 (330,062)
Total recognised income and expense for the period 268,560 (310,307)
Transactions with the state in its capacity as owner 20 (a) (40,058) (11,397)
Total equity at end of financial year 627,440 398,938
The above statement of changes in equity should be read in conjunction with the accompanying notes.
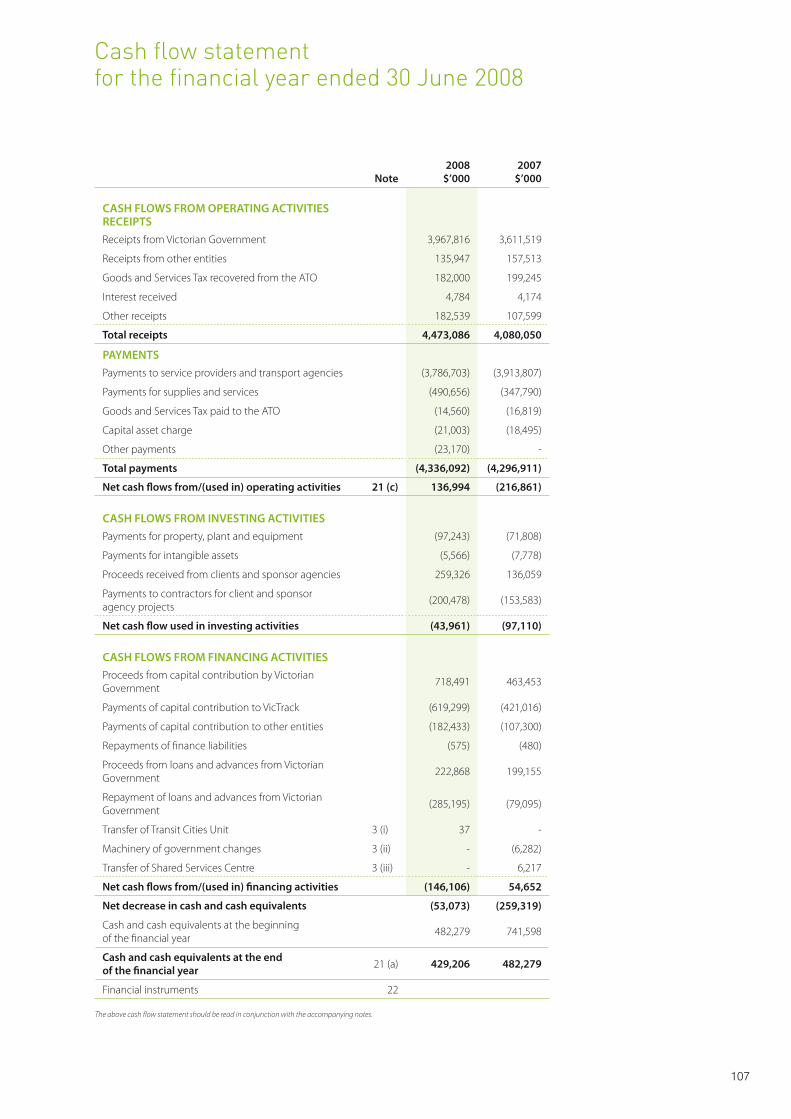
107
Cash flow statement for the financial year ended 30 June 2008
Note2008
$’0002007
$’000
CASH FLOWS FROM OPERATING ACTIVITIESRECEIPTSReceipts from Victorian Government 3,967,816 3,611,519
Receipts from other entities 135,947 157,513
Goods and Services Tax recovered from the ATO 182,000 199,245
Interest received 4,784 4,174
Other receipts 182,539 107,599
Total receipts 4,473,086 4,080,050
PAYMENTSPayments to service providers and transport agencies (3,786,703) (3,913,807)
Payments for supplies and services (490,656) (347,790)
Goods and Services Tax paid to the ATO (14,560) (16,819)
Capital asset charge (21,003) (18,495)
Other payments (23,170) -
Total payments (4,336,092) (4,296,911)
Net cash flows from/(used in) operating activities 21 (c) 136,994 (216,861)
CASH FLOWS FROM INVESTING ACTIVITIESPayments for property, plant and equipment (97,243) (71,808)
Payments for intangible assets (5,566) (7,778)
Proceeds received from clients and sponsor agencies 259,326 136,059
Payments to contractors for client and sponsor agency projects
(200,478) (153,583)
Net cash flow used in investing activities (43,961) (97,110)
CASH FLOWS FROM FINANCING ACTIVITIESProceeds from capital contribution by Victorian Government
718,491 463,453
Payments of capital contribution to VicTrack (619,299) (421,016)
Payments of capital contribution to other entities (182,433) (107,300)
Repayments of finance liabilities (575) (480)
Proceeds from loans and advances from Victorian Government
222,868 199,155
Repayment of loans and advances from Victorian Government
(285,195) (79,095)
Transfer of Transit Cities Unit 3 (i) 37 -
Machinery of government changes 3 (ii) - (6,282)
Transfer of Shared Services Centre 3 (iii) - 6,217
Net cash flows from/(used in) financing activities (146,106) 54,652
Net decrease in cash and cash equivalents (53,073) (259,319)
Cash and cash equivalents at the beginning of the financial year
482,279 741,598
Cash and cash equivalents at the end of the financial year 21 (a) 429,206 482,279
Financial instruments 22
The above cash flow statement should be read in conjunction with the accompanying notes.
108 Department of Transport Annual Report 2007-08
Notes to the financial statements
NOTE PAGE
1 Summary of significant accounting policies 109
2 Departmental outputs 118
3 Restructuring of administrative arrangements 124
4 Summary of compliance with annual parliamentary and special appropriations 130
5 Other income 132
6 Payments to service providers and transport agencies 132
7 Supplies and services 133
8 Employee benefits 133
9 Assets written off/disposed of 134
10 Depreciation and amortisation 134
11 Resources and assets provided free of charge 135
12 Receivables 136
13 Inventories 136
14 Intangible assets 137
15 Property, plant and equipment 138
16 Payables 142
17 Loans and advances from Victorian Government 142
18 Interest bearing liabilities 143
19 Provisions 144
20 Equity and movements in equity 146
21 Cash flow information 147
22 Financial instruments 149
23 Commitments for expenditure 154
24 Contingent assets 156
25 Contingent liabilities 157
26 Superannuation 158
27 Major Projects Victoria 159
28 Administered items 160
29 Annotated receipts agreements 165
30 Trust account balances 165
31 Responsible persons 166
32 Remuneration of executives 167
33 Remuneration of auditors 168
34 Significant events 169
109
Note 1. Summary of significant accounting policies
(a) Statement of compliance
The financial report is a general purpose financial report which has been prepared on an accrual basis in accordance with the Financial Management Act 1994, applicable Australian accounting standards (AAS), which includes the Australian accounting standards issued by the Australian Accounting Standards Board (AASB), AAS 29 Financial reporting by government departments, interpretations and other mandatory professional requirements.
The financial report also complies with relevant Financial Reporting Directions (FRDs) issued by the Department of Treasury and Finance, and relevant Standing Directions (SD) authorised by the Minister for Finance.
(b) Basis of preparation
The financial report has been prepared based on a historical cost basis, except for the revaluation of certain non-current assets and financial instruments. Cost is based on the fair value of the consideration given in exchange for the asset.
In the application of AASB Standards, management is required to make judgments, estimates and assumptions about the carrying values of assets and liabilities that are not readily apparent from other sources. The estimates and associated assumptions are based on historical experience and other factors that are believed to be reasonable under the circumstance. Actual results may differ from these estimates.
The estimates and underlying assumptions are reviewed on an ongoing basis. Revisions to accounting estimates are recognised in the period in which the estimate is revised if the revision affects only that period or in the period of the revision and future periods if the revision affects both current and future periods.
Accounting policies are selected and applied in a manner which ensures that the resulting financial information satisfies the concepts of relevance and reliability, thereby reflecting the substance of the underlying transactions or other events reported.
The accounting policies set out below have been applied in preparing the financial report for the year ended 30 June 2008 and the comparative information for the year ended 30 June 2007.
(c) Reporting entity
The financial report covers the Department of Transport as an individual reporting entity. The department is a government department of the State of Victoria, established pursuant to an order made by the Premier under the Administrative Arrangements Act 1983. Its principal address is :
Department of Transport
121 Exhibition Street Melbourne VIC 3000
The department is an administrative agency acting on behalf of the Crown.
The financial report includes all the controlled activities of the Department of Transport.
Director of Public Transport
The Director of Public Transport (‘the Director’) is an office established by section 8 of the Transport Act 1983 (‘the Act’). The Director’s powers and functions are set out in section 9 of the Act and include responsibility for the general administration of the tram and train service contracts provided by private operators under partnership arrangements. The Director is part of the department.
Secretary to the Department of Transport as a body corporate
In accordance with approval received under the Financial Management Act 1994, the department’s annual financial report incorporates the ‘Secretary to the Department of Transport’ as a body corporate created under the Project Development and Construction Management Act 1994. The body corporate activities include the functions performed by Major Projects Victoria. All activities are reflected as controlled transactions except project development and construction management activities for sponsor agencies, and where sales and subsequent proceeds are received, in which case they are reflected as administered transactions (refer Note 28).
Director, Public Transport Safety Victoria
The office of the Director, Public Transport Safety Victoria (PTSV), was established by an amendment to section 9T of the Transport Act 1983 and commenced operating on 1 August 2006. The director has a range of functions to enable regulation of the public transport system. PTSV is responsible for the safety accreditation of rail and bus organisations throughout Victoria. The Director reports to the Minister for Public Transport.
Chief Investigator, Transport and Marine Safety Investigations
The Chief Investigator, Transport and Marine Safety Investigations is a statutory office established on 1 August 2006 under part V of the Transport Act 1983. The principal objective and function of the office is to improve public transport and marine safety by independently investigating public transport and marine safety matters and to report the results of investigations to the relevant Ministers.
110 Department of Transport Annual Report 2007-08
Administered items
The department administers but does not control certain resources on behalf of the Crown. It is accountable for the transactions involving those administered resources, but does not have the discretion to deploy the resources for achievement of the department’s objectives. For these resources, the department acts only on behalf of the Crown. Administered resources are accounted for using the accrual basis of accounting.
Transactions and balances relating to these administered resources are not recognised as departmental revenues, expenses, assets or liabilities within the body of the financial statements, but are disclosed in Note 28. Except as otherwise disclosed, administered items are accounted for on the same basis and using the same accounting policies as for departmental items.
Specific financial disclosures related to administered items can be found in Note 28.
Other administered activities on behalf of parties external to the Victorian Government
The department has responsibility for transactions and balances relating to administered funds on behalf of third parties external to the Victorian Government. Revenues, other income, expenses, assets and liabilities administered on behalf of third parties are not recognised in these financial statements as they are administered on a fiduciary and custodial basis, and therefore not controlled by the department. These transactions and balances are reported in Note 28.
(d) Objectives and funding
The department’s objectives include safety, efficient transport, and infrastructure as they are fundamental to the state’s economic wellbeing. The department must deliver high-value infrastructure and services to stimulate economic growth and Victoria’s competitiveness in accordance with the government’s triple-bottom-line objectives. The department is predominantly funded by accrual-based parliamentary appropriations for the provision of outputs.
(e) Outputs of the department
Information about the department’s output activities, and the expenses, income, assets and liabilities which are reliably attributable to those output activities, is set out in the output activities schedule (refer Note 2). Information about expenses, income, assets and liabilities administered by the department are provided in the schedule of administered expenses and income and the schedule of administered assets and liabilities (refer Note 28).
(f) Events after reporting date
Assets, liabilities, income or expenses arise from past transactions or other past events. Where the transactions result from an agreement between the department and other parties, the transactions are only recognised when the agreement is irrevocable at or before balance date. Adjustments are made to amounts recognised in the financial statements for events which occur after the reporting date and before the date the statements are authorised for issue, where those events provide information about conditions which existed at the reporting date. Note disclosure is made about events which occur between the balance date and the date the statements are authorised for issue, where the events relate
to conditions which arose after the reporting date and may have a material impact on the results of subsequent years.
(g) Goods and Services Tax (GST)
Income, expenses and assets are recognised net of the amount of GST, unless the amount of GST is not recoverable from the taxation authority.
Receivables and payables are stated inclusive of the amount of GST receivable or payable. The net amount of GST recoverable from, or payable to, the taxation authority is included with other receivables or payables in the balance sheet. Where the GST is not recoverable from the taxation authority, it is recognised as part of the cost of acquisition of the asset or as part of the expense.
Cash flows are presented on a gross basis. The GST components of cash flows arising from investing or financing activities which are recoverable from, or payable to the taxation authority, are presented as operating cash flow.
(h) Income recognition
Income received by the department is generally required to be paid into the consolidated fund.
Income becomes controlled and is recognised by the department when it is appropriated from the consolidated fund by the Victorian Parliament and applied to the purposes defined under the relevant Appropriations Act. Additionally, the department is permitted under section 29 of the Financial Management Act 1994 to have certain revenue annotated to the annual appropriation. The revenue which forms part of a section 29 agreement is recognised by the department and the receipts paid into the consolidated fund are disclosed as an administered item
Note 1. Summary of significant accounting policies (continued)
111
(refer Note 29). At the point of revenue recognition, section 29 provides for an equivalent amount to be added to the annual appropriation. Examples of receipts which can form part of a section 29 agreement are receipts from Commonwealth specific purpose grants.
Output appropriations
Revenue from the outputs the department provides to government is recognised when those outputs have been delivered and the relevant Minister has certified the delivery of those outputs in accordance with specified performance criteria.
Special appropriations
Under section 213A(4) of the Transport Act 1983, revenue related to administrative costs associated with ticket infringements is recognised when the amount is appropriated for that purpose is due and payable by the department.
Assets and resources received free of charge or for nominal consideration
Contributions of resources received free of charge or for nominal consideration are recognised at their fair value when the transferee obtains control over them, irrespective of whether restrictions or conditions are imposed over the use of the contributions, unless received from another government department or agency as a consequence of a restructuring of administrative arrangements. In which case, such transfer will be recognised at carrying value. Contributions in the form of services are only recognised when a fair value can be reliably determined and the services would have been purchased if not donated.
Other revenue
Amounts disclosed as revenue are, where applicable, net of returns, allowances and duties and taxes. All amounts of revenue over which the department does not have control are disclosed as administered income in the schedule of administered income and expenses (refer Note 28). Revenue is recognised for each of the department’s major activities as follows:
Revenue from the provision of services
Revenue from the provision of services is recognised by reference to the stage of completion of the contract. The revenue is recognised when:
the amount of the revenue, stage of »completion and transaction costs incurred can be reliably measured
it is probable that the economic »benefits associated with the transaction will flow to the department.
The stage of completion is measured by reference to labour hours incurred to date as a percentage of estimated total labour hours for each contract.
Rental revenue
Rental income from the leasing of investment properties is recognised on a straight-line basis over the lease term.
Interest revenue
Interest revenue includes interest received on bank term deposits, interest from investments and other interest received. Interest revenue is recognised on a time proportionate basis that takes into account the effective yield on a financial asset.
Administered Income
Commonwealth grants
Grants payable by the Commonwealth Government are recognised as income when the department gains control of the underlying assets. Where such grants are payable into the consolidated fund, they are reported as administered income. For reciprocal grants, the department is deemed to have assumed control when the performance has occurred under the grant. For non-reciprocal grants, the department is deemed to have assumed control when the grant is received or receivable. Conditional grants may be reciprocal or non-reciprocal depending on the terms of the grant. Commonwealth grants are disclosed as income in the schedule of administered items (refer Note 28).
Fines and fees
The department collects fines and fees on behalf of the Crown and does not gain control over assets arising from these items. Consequently, the amounts of fines and fees are not recognised but disclosed as revenues in the schedule of administered revenues and expenses (refer Note 28).
(i) Expenses
Grants and other payments
Grants and other payments to third parties are recognised as an expense in the reporting period in which they are paid or payable. They include transactions such as grants, subsidies and other transfer payments to other agencies, for example, VicRoads.
Employee benefits
Employee benefits expenses include all costs related to employment including wages and salaries, leave entitlements, redundancy payments and superannuation contributions. These are recognised when incurred, except for contributions in respect of defined benefit plans.
112 Department of Transport Annual Report 2007-08
Superannuation
The amount charged to the operating statement in respect of defined benefit superannuation plans represent the contributions made by the department to the superannuation plan in respect to the current services of existing staff of the department. Superannuation contributions are made to the plans based on the relevant rules of each plan.
The Department of Treasury and Finance centrally recognises the defined benefit liability or surplus of most Victorian government employees in such funds.
The amount charged to the operating statement in respect of defined benefit superannuation plans represents the accrual of benefits during the reporting period. Note 26 provides further details.
Depreciation
Depreciation is provided on property, plant and equipment, including freehold buildings but excluding land. Depreciation is generally calculated on a straight-line basis so as to write off the net cost or other revalued amount of each asset over its expected useful life to its estimated residual value. Leasehold improvements are depreciated over the period of the lease or estimated useful life, whichever is the shorter, using the straight-line method. The estimated useful lives, residual values and depreciation methods are reviewed at the end of each reporting period. Note 15 provides details on the estimated useful lives that are used in the calculation of depreciation on property, plant and equipment.
Amortisation
Intangible assets with finite useful lives are amortised on a systematic (typically straight-line) basis over the asset’s useful life. Amortisation begins when the asset is available
for use, that is, when it is in the location and condition necessary for it to be capable of operating in the manner intended by management. The amortisation method and period for an intangible asset with a finite useful life are reviewed at least at the end of each annual reporting period. In addition, an assessment is made at each reporting date to determine whether there are indicators that an intangible asset is impaired. If so, the assets are tested as to whether their carrying value exceeds their recoverable amount.
Intangible assets with indefinite useful lives are not amortised, but are tested for impairment annually or whenever there is an indication that the asset may be impaired. The useful lives of intangible assets that are not being amortised are reviewed each period to determine whether events and circumstances continue to support an indefinite useful life assessment for that asset.
Resources provided free of charge or for nominal consideration
Resources provided free of charge or for nominal consideration are recognised at their fair value.
Capital asset charge
Capital asset charge represents the opportunity cost of capital invested in the non-current physical assets used in the provision of outputs. In accordance with the policy of the Department of Treasury and Finance, the charge is calculated on the budgeted carrying amount of non-current physical assets.
Finance costs
Finance costs are recognised as expenses in the period in which they are incurred and include finance lease charges.
Impairment of assets
Goodwill and intangible assets with indefinite useful lives and intangible assets not yet available for use are tested annually for impairment. All other assets are assessed annually for indications of impairment, except for cash and cash equivalents, receivables, inventories and investment properties.
Where there is an indication of impairment, the assets concerned are tested as to whether their carrying value exceeds their possible recoverable amount. Where an asset’s carrying value exceeds its recoverable amount, the difference is written off by a charge to the operating statement except to the extent that the write-down can be debited to an asset revaluation reserve amount applicable to that class of asset.
It is deemed that, in the event of the loss of an asset, the future economic benefits arising from the use of the asset will be replaced unless a specific decision to the contrary has been made. The recoverable amount for most assets is measured at the higher of depreciated replacement cost and fair value less costs to sell.
Supplies and services
Supplies and services generally represent cost of goods sold and the day-to-day running costs, including maintenance costs, incurred in the normal operations of the department. These items are recognised as an expense in the reporting period in which they are incurred. The carrying amount of any inventories held for distribution is expensed when distributed.
(j) Assets
All assets, including Crown land, controlled by the department are reported in the balance sheet and comprise of the following:
Note 1. Summary of significant accounting policies (continued)
113
Cash and cash equivalents
Cash and cash equivalents comprise cash on hand and cash at bank, deposits at call and highly liquid investments with an original maturity of three months or less, which are readily convertible to known amounts of cash and are subject to insignificant risk of changes in value.
Receivables
Receivables consist predominantly of debtors in relation to goods and services, accrued investment income and input tax credits that are recoverable from the Goods and Services Tax.
Receivables are recognised initially at fair value and subsequently measured at amortised cost, using the effective interest rate method, less any accumulated impairment.
Settlement of receivables is required within 30 days from invoice date.
A provision for doubtful receivables is made when there is objective evidence that the debts will not be collected. Bad debts are written off when identified.
Inventories
Inventories include goods and other property held either for sale or for distribution at no or nominal cost in the ordinary course of business operations. It includes land held for sale and excludes depreciable assets.
Inventories held for distribution are measured at the lower of cost and current replacement cost.
Cost is adjusted for any loss of service potential. The basis used in assessing loss of service potential for inventories held for distribution include current replacement cost and technical or functional obsolescence. Technical obsolescence occurs when an item still functions for some or all of the tasks it was originally
acquired to do, but no longer matches existing technologies. Functional obsolescence occurs when an item no longer functions the way it did when it was first acquired. All other inventories, including land held for sale, are measured at the lower of cost and net realisable value.
Cost is assigned to land for sale (undeveloped, under development and developed) and to other high value, low volume inventory items on a specific identification of cost basis.
Cost for all other inventory is measured on the basis of weighted average cost.
Inventories acquired for no cost or nominal considerations are measured at current replacement cost at the date of acquisition.
Investment properties
Investment properties represent properties held to earn rentals or for capital appreciation or both. Investment properties exclude properties held to meet service delivery objectives of the State of Victoria.
Investment properties are initially recognised at cost. Costs incurred subsequent to initial acquisition are capitalised when it is probable that future economic benefits in excess of the originally assessed performance of the asset will flow to the department. Subsequent to initial recognition at cost, investment properties are revalued to fair value with changes in the fair value recognised as income or expense in the period that they arise. The properties are not depreciated.
Rental income from the leasing of investment properties is recognised in the operating statement on a straight-line basis over the lease term.
Intangible assets
Intangible assets represent identifiable non-monetary assets without physical substance.
Intangible assets are initially recognised at cost. Subsequently, intangible assets with finite useful lives are carried at cost less accumulated amortisation and accumulated impairment losses. Costs incurred subsequent to initial acquisition are capitalised when it is expected that additional future economic benefits will flow to the department.
Research and development costs
Expenditure on research activities is recognised as an expense in the period in which it is incurred. An internally-generated intangible asset arising from development (or from the development phase of an internal project) is recognised where all of the following are demonstrated:
the technical feasibility of »completing the intangible asset so that it will be available for use or sale
an intention to complete the »intangible asset and use or sell it
the ability to use or sell the »intangible asset
the intangible asset will generate »probable future economic benefits
the availability of adequate »technical, financial and other resources to complete the development and to use or sell the intangible asset
the ability to measure reliably »the expenditure attributable to the intangible asset during its development.
Where no internally-generated intangible asset can be recognised, development expenditure is recognised as an expense in the period as incurred.
114 Department of Transport Annual Report 2007-08
Intangible assets are measured at cost less accumulated amortisation and impairment, and are amortised on a straight-line basis over their useful lives of three to five years for capitalised software development costs.
Property, plant and equipment
Land and infrastructure assets are measured initially at cost, then subsequently at fair value less accumulated depreciation and impairment.
Plant, equipment and vehicles are measured at cost less accumulated depreciation and impairment.
Revaluations of non-current physical assets
Non-current physical assets measured at fair value are revalued in accordance with Financial Reporting Direction 103C ‘Non-Current Physical Asset’. This revaluation process normally occurs every five years, based on the asset’s government purpose classification and prescribed timeframe. Revaluation increments or decrements arise from differences between carrying value and fair value.
Revaluation increments are credited directly to equity in the revaluation reserve, except that, to the extent that an increment reverses a revaluation decrement in respect of that class of asset previously recognised as an expense in the net result, the increment is recognised as income in determining the net result.
Revaluation decrements are recognised as expenses in the net result, except, to the extent that a credit balance exists in the revaluation reserve in respect of the same class of assets, they are debited to the revaluation reserve.
Revaluation increases and decreases relating to individual assets are offset against one another within that class but are not offset in respect of assets in different classes.
Revaluation reserves are normally transferred to accumulated surplus on de-recognition of the relevant asset.
Leases
Leases of property, plant and equipment are classified as finance leases whenever the terms of the lease transfer substantially all the risks and rewards of ownership to the lessee. All other leases are classified as operating leases.
Department as lessee
Finance leases are recognised as assets and liabilities at amounts equal to the fair value of the lease property or, if lower, the present value of the minimum lease payment, each determined at the inception of the lease. The lease asset is depreciated over the shorter of the estimated useful life of the asset or the term of the lease. Minimum lease payments are allocated between the principal component of the lease liability, and the interest expense calculated using the interest rate implicit in the lease, and charged directly to the operating statement.
Operating lease payments, including any contingent rentals, are recognised as an expense in the operating statement on a straight-line basis over the lease term, except where another systematic basis is more representative of the time pattern of the benefits derived from the use of the leased asset.
Lease incentives
All incentives for the agreement of a new or renewed operating lease shall be recognised as an integral part of the net consideration agreed for the use of the leased asset, irrespective of the incentive’s nature or form or the timing of payments.
In the event that lease incentives are received to enter into operating leases, such incentives are recognised as a liability. The aggregate benefits of incentives are recognised as a
reduction of rental expense on a straight-line basis, except where another systematic basis is more representative of the time pattern in which economic benefits from the leased asset are consumed.
The cost of leasehold improvements is capitalised as an asset and depreciated over the remaining term of the lease or the estimated useful life of the improvements, whichever is the shorter. Leasehold improvements of office assets are amortised over 10 years.
(k) Liabilities
Payables
Payables consist predominantly of creditors and other sundry liabilities.
Payables are initially recognised at fair value and subsequently carried at amortised cost. Payables represent liabilities for goods and services provided to the department prior to the end of the financial year that are unpaid, and arise when the department becomes obliged to make future payments in respect of the purchase of these goods and services.
Provisions
Provisions are recognised when the department has a present obligation, the future sacrifice of economic benefits is probable, and the amount of the provision can be measured reliably.
The amount recognised as a provision is the best estimate of the consideration required to settle the present obligation at reporting date, taking into account the risks and uncertainties surrounding the obligation. Where a provision is measured using the cash flows estimated to settle the present obligation, its carrying amount is the present value of those cash flows.
Note 1. Summary of significant accounting policies (continued)
115
Where some or all of the economic benefits required to settle a provision are expected to be recognised from a third party, the receivable is recognised as an asset when it is virtually certain that recovery will be received and the amount of the receivable can be measured reliably.
Employee benefits
(i) Annual leave
Liabilities for annual leave expected to be settled within 12 months of the reporting date are recognised in the provision for employee benefits in respect of employee services up to the reporting date. They are measured at their nominal values and are classified as current liabilities.
Liabilities that are not expected to be settled within 12 months and are recognised in the provision for employee benefits as current liabilities are measured at present value of the amounts expected to be paid when the liabilities are settled using the remuneration rate expected to apply at the time of settlement.
(ii) Long service leave (LSL)
Current liability – unconditional LSL
Liability for unconditional LSL is recognised for employees who have been in seven or more years of continuous service. This is disclosed as a current liability irrespective of whether the department is expected to settle the liability within 12 months because it will not have the unconditional right to defer the settlement of the entitlement should an employee take leave within 12 months.
The component of the current LSL liability that is:
not expected to be settled within »12 months is measured at present value
expected to be settled within 12 »months is measured at nominal value.
Non-current liability – conditional LSL
Liability for conditional LSL is recognised for employees who have been in less than seven years of continuous service. This is measured at present value and disclosed as a non-current liability as it represents an unconditional right to defer the settlement of the entitlement until the employee has completed the requisite years of service.
(iii) Employee benefits on-costs
Employee benefits on-costs include payroll tax, workers compensation, superannuation, annual leave and LSL accrued while on LSL taken in service are recognised and included with LSL employee benefits.
(iv) Termination benefits
Termination benefits are payable when employment is terminated before the normal retirement date, or when an employee accepts voluntary redundancy in exchange for these benefits. The department recognises termination benefits when it is demonstrably committed to either terminating the employment of current employees according to a detailed formal plan without the possibility of withdrawal or providing termination benefits as a result of an offer made to encourage voluntary redundancy. Benefits falling due more than 12 months after reporting date are discounted to present value.
Onerous contracts
An onerous contract is considered to exist where the department has a contract under which the unavoidable cost of meeting the contractual obligations exceeds the economic benefits estimated to be received. Present obligations arising under onerous contracts are recognised as a provision to the extent that the present obligation exceeds the economic benefits estimated to be received.
(l) Commitments
Commitments include operating, capital and other outsourcing commitments arising from non-cancellable contractual or statutory sources and are disclosed at their nominal value (refer Note 23).
(m) Contingent assets and cotingent liabilities
Contingent assets and contingent liabilities are not recognised in the balance sheet, but are disclosed by way of a note to and where quantifiable, are measured at nominal value (refer Notes 24 and 25).
(n) Equity
Additions to net assets which have been designated as contribution by owners are recognised as contributed capital. Transfers that are in the nature of contributions or distributions have also been designated and transfers of net assets arising from administrative restructurings are treated as distributions to or contributions by owners (refer Note 20).
(o) Functional and presentation currency
The functional currency of the government is the Australian dollar, which has also been identified as the presentation currency of this department.
(p) Rounding of amounts
Amounts in the financial report have been rounded to the nearest thousand dollars, unless otherwise stated.
116 Department of Transport Annual Report 2007-08
Standard / Interpretation Summary
Applicable for annual reporting periods beginning or ending on:
Impact on departmental financial statements
Interpretation 12 Service Concession Arrangements
AASB approved an Australian Interpretation 12, equivalent to IFRIC 12, applying to private sector operators, but explicitly excludes accounting for public sector grantors.
Beginning 1 July 2008 The impact of any changes that may be required cannot be reliably estimated and is not disclosed in the financial report.
AASB 2007–two amendments to Australian Accounting Standards arising from AASB Interpretation 12
Amendments arise from the release in February 2007 of Interpretation 12 Service Concession Arrangements.
Beginning 1 July 2008 As above.
Revised AASB 1004 Contributions
AASB decided to relocate requirements on contributions from AAS 27, AAS 29 and AAS 31, substantively unamended, into AASB 1004 as part of its short-term review of AAS 27, AAS 29, and AAS 31.
Beginning 1 July 2008 Impact expected to be insignificant.
AASB 1050 Administered Items
As part of the short-term review of AAS 27, AAS 29, and AAS 31, AASB decided to relocate the requirements for the disclosure of administered items from AAS 29, substantively unamended (with some exception as noted in Appendix A) into a new topic-based standard AASB 1050.
Beginning 1July 2008 Impact expected to be insignificant.
AASB 1051 Land Under Roads
The new pronouncement AASB 1051 Land Under Roads provides the option to recognise or not recognise land under roads acquired before the end of the first reporting period ending on or after 31 December 2007. Land under roads acquired after 31 December 2007 should be accounted for following requirements of AASB 116 Property, Plant and Equipment. The state is yet to decide whether to change its policy. Until a conclusion is reached, the current default position is that land under roads will not be recognised.
Beginning 1 July 2008 Impact is being evaluated.
AASB 1052 Disaggregated Disclosures
AASB decided to relocate requirements relating to reporting of disaggregated information from AAS 27 and AAS 29 into AASB 1052, a new topic-based standard, as part of its short-term review of AAS 27, AAS 29 and AAS31.
Beginning 1 July 2008 Impact expected to be insignificant.
(q) New accounting standards and interpretations
The following standards and interpretations have been issued and are to be adopted for future financial years where indicated:
Note 1. Summary of significant accounting policies (continued)
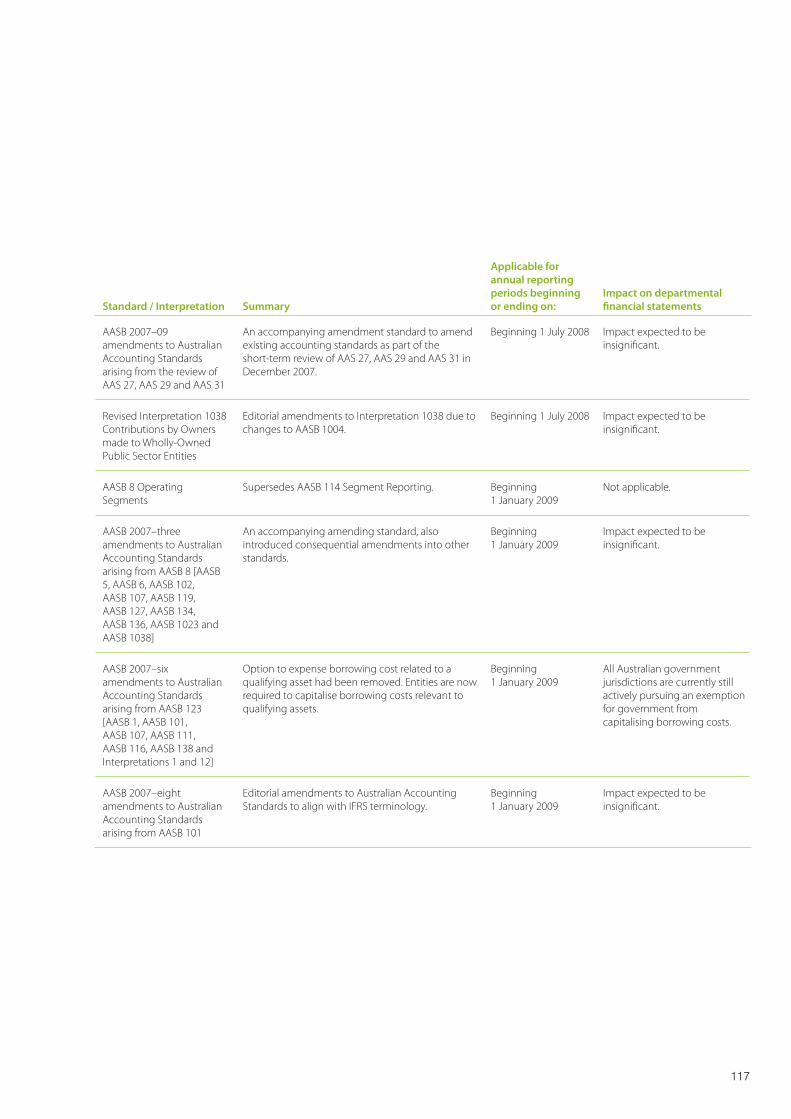
117
Standard / Interpretation Summary
Applicable for annual reporting periods beginning or ending on:
Impact on departmental financial statements
AASB 2007–09 amendments to Australian Accounting Standards arising from the review of AAS 27, AAS 29 and AAS 31
An accompanying amendment standard to amend existing accounting standards as part of the short-term review of AAS 27, AAS 29 and AAS 31 in December 2007.
Beginning 1 July 2008 Impact expected to be insignificant.
Revised Interpretation 1038 Contributions by Owners made to Wholly-Owned Public Sector Entities
Editorial amendments to Interpretation 1038 due to changes to AASB 1004.
Beginning 1 July 2008 Impact expected to be insignificant.
AASB 8 Operating Segments
Supersedes AASB 114 Segment Reporting. Beginning 1 January 2009
Not applicable.
AASB 2007–three amendments to Australian Accounting Standards arising from AASB 8 [AASB 5, AASB 6, AASB 102, AASB 107, AASB 119, AASB 127, AASB 134, AASB 136, AASB 1023 and AASB 1038]
An accompanying amending standard, also introduced consequential amendments into other standards.
Beginning 1 January 2009
Impact expected to be insignificant.
AASB 2007–six amendments to Australian Accounting Standards arising from AASB 123 [AASB 1, AASB 101, AASB 107, AASB 111, AASB 116, AASB 138 and Interpretations 1 and 12]
Option to expense borrowing cost related to a qualifying asset had been removed. Entities are now required to capitalise borrowing costs relevant to qualifying assets.
Beginning 1 January 2009
All Australian government jurisdictions are currently still actively pursuing an exemption for government from capitalising borrowing costs.
AASB 2007–eight amendments to Australian Accounting Standards arising from AASB 101
Editorial amendments to Australian Accounting Standards to align with IFRS terminology.
Beginning 1 January 2009
Impact expected to be insignificant.
118 Department of Transport Annual Report 2007-08
Note 2. Departmental outputs
Output groups
Public Safety and Security
These outputs contribute to the achievement of the key government outcome of building friendly, confident and safe communities.
This is done by delivering initiatives and regulatory activities that improve safety in the public transport, road and marine sectors and reduce the frequency, severity and cost of accidents and incidents. It also covers activities aimed at maintaining the security of critical infrastructure and the preparedness to respond to emergencies involving this infrastructure.
Reducing the state’s road toll is a high priority for the government. A key measure of success will be a 20 per cent reduction in serious injuries and deaths related to road crashes. Key departmental activities to achieve this outcome include continuing to implement “arrive alive!” road safety initiatives to change road user behaviour, and improving the safety of road infrastructure through initiatives such as the Safer Road Infrastructure Program.
Similar regulatory frameworks and initiatives are in place to improve safety on public transport, and on the state’s waterways relating to both commercial and private recreational vessels. The independent Office of the Chief Investigator Transport and Marine Safety Investigations, will enhance the safety programs already in place. Security of critical infrastructure is also a high priority.
Public Transport Services
These outputs contribute to the achievement of the following key government outcomes:
growing and linking all of Victoria »
sound financial management. »
This is done by overseeing the delivery of quality, sustainable and cost effective passenger train, tram and bus services to metropolitan Melbourne and rural and regional Victoria, in partnership with operators and in accordance with contractual arrangements.
These outputs aim to continue improvement in the delivery of, and access to, public transport services and to increase the overall mobility of Victorians. The outputs help to protect the environment by increasing public transport patronage, thereby reducing the reliance on private motor vehicles. The government works in partnership with operators to achieve these output aims. Contracts with operators are managed to ensure that the services provided meet contractually agreed standards and that the committed investment levels for rolling stock and buses are delivered.
These outputs also include the provision of school bus services and managing the Multi Purpose Taxi Program, which provides subsidised taxi services for people unable to use other forms of public transport.
Infrastructure Planning, Delivery and Management
These outputs make a significant contribution to the achievement of the following key government outcomes:
growing and linking all of Victoria »
sound financial management »
more quality jobs and thriving, »innovative industries across Victoria
greater public participation and »more accountable government.
These outputs do this by providing the government with strategic policy and development guidance in relation to integrated transport planning, implementing targeted industry and community programs and delivering cost-effective, long-term investment in, and management of, public infrastructure and major government projects in Victoria. Implementation of the government’s Meeting Our Transport Challenges: Connecting Victorian Communities is reflected in many of the projects and milestones reported in these outputs.
The government is committed to building better, more accessible transport links for the state. This includes improving the integration, across government, of transport and land-use planning, increasing the use of public transport and strengthening the connections between our ports, industry and agricultural centres. These outputs deliver a combination of strategic road and rail infrastructure improvements to manage congestion and improve the movement of people and goods
119
throughout Victoria. They also encompass infrastructure projects that will extend and increase capacity on the metropolitan train network; improve control and communications across the metropolitan train network; reopen country passenger rail services; improve strategic arterial road links; and establish a major tollway linking the city’s south-eastern suburbs.
Within the Public Construction and Land Development output, the department assesses the feasibility of infrastructure development options and coordinates the delivery of a variety of infrastructure projects. These are in addition to a large number of major construction projects that are funded through other government departments and which are delivered by Major Projects Victoria as a service to the host departments and agencies. The latter projects are not reported in the department’s output statements.
Departmental outcomes
1. Safety and security
2. Integrated policy, planning and communication
3. Accessible, reliable and connected transport services and traffic management
4. Rural and regional transport and development
5. Project development, delivery and asset management
6. A more productive state
7. Organisational capability
Governmental goals
1. Growing and linking all of Victoria
2. Sound financial management
3. More quality jobs and thriving, innovative industries across Victoria
4. Protecting the environment for future generations
5. Efficient use of natural resources
6. Building friendly, confident and safe communities
7. A fairer society that reduces disadvantage and respects diversity
8. High-quality education and training for lifelong learning
9. High-quality, accessible health and community services
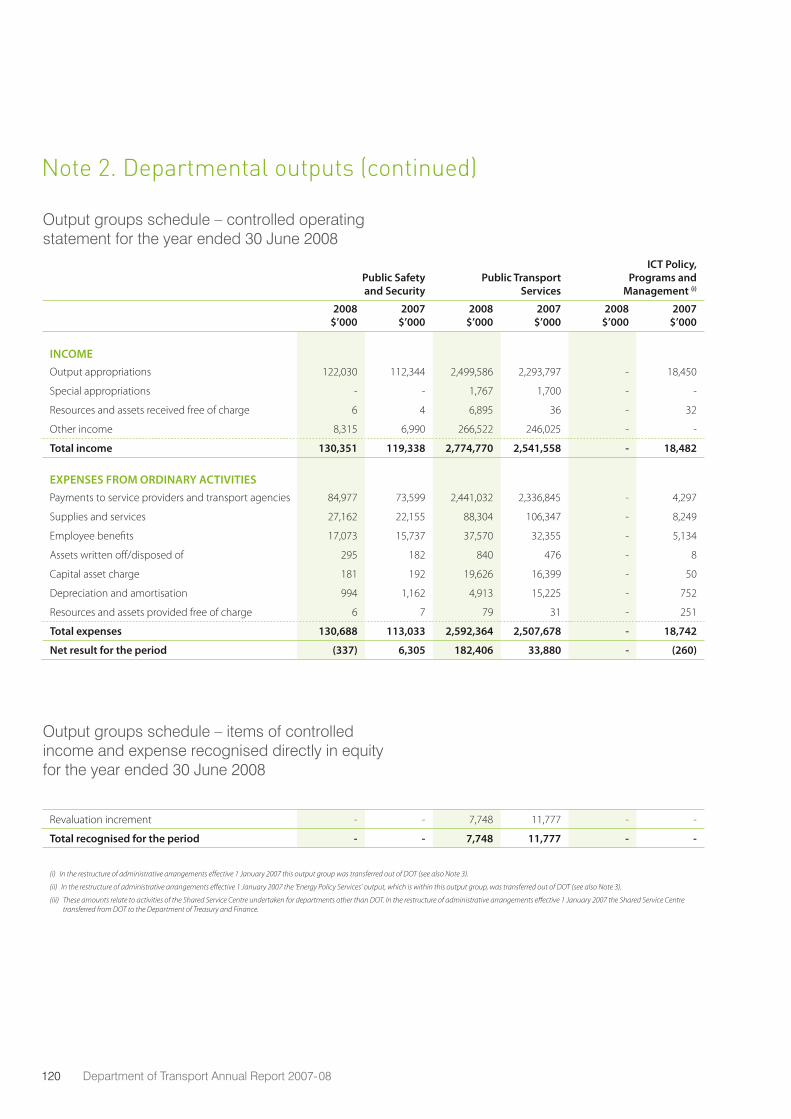
120 Department of Transport Annual Report 2007-08
Output groups schedule – controlled operating statement for the year ended 30 June 2008
Public Safety and Security
Public Transport Services
ICT Policy, Programs and
Management (i)
Infrastructure, Planning, Delivery
and Management (ii)Total Output
GroupsOther – Non-
Attributable (iii) Total DOT
2008$’000
2007$’000
2008$’000
2007$’000
2008$’000
2007$’000
2008$’000
2007$’000
2008$’000
2007$’000
2008$’000
2007$’000
2008$’000
2007$’000
INCOMEOutput appropriations 122,030 112,344 2,499,586 2,293,797 - 18,450 1,372,343 1,280,747 3,993,959 3,705,338 - - 3,993,959 3,705,338
Special appropriations - - 1,767 1,700 - - - - 1,767 1,700 - - 1,767 1,700
Resources and assets received free of charge 6 4 6,895 36 - 32 2,010 124 8,911 196 - - 8,911 196
Other income 8,315 6,990 266,522 246,025 - - 51,327 31,617 326,164 284,632 - 19,080 326,164 303,712
Total income 130,351 119,338 2,774,770 2,541,558 - 18,482 1,425,680 1,312,488 4,330,801 3,991,866 - 19,080 4,330,801 4,010,946
EXPENSES FROM ORDINARY ACTIVITIESPayments to service providers and transport agencies 84,977 73,599 2,441,032 2,336,845 - 4,297 1,275,945 1,582,948 3,801,954 3,997,689 - 13,083 3,801,954 4,010,772
Supplies and services 27,162 22,155 88,304 106,347 - 8,249 44,487 38,455 159,953 175,206 - - 159,953 175,206
Employee benefits 17,073 15,737 37,570 32,355 - 5,134 38,432 35,253 93,075 88,479 - 2,335 93,075 90,814
Assets written off/disposed of 295 182 840 476 - 8 36,816 22,923 37,951 23,589 - 160 37,951 23,749
Capital asset charge 181 192 19,626 16,399 - 50 1,196 1,658 21,003 18,299 - 196 21,003 18,495
Depreciation and amortisation 994 1,162 4,913 15,225 - 752 1,378 1,755 7,285 18,894 - 2,141 7,285 21,035
Resources and assets provided free of charge 6 7 79 31 - 251 4,087 648 4,172 937 - - 4,172 937
Total expenses 130,688 113,033 2,592,364 2,507,678 - 18,742 1,402,341 1,683,641 4,125,393 4,323,093 - 17,916 4,125,393 4,341,008
Net result for the period (337) 6,305 182,406 33,880 - (260) 23,339 (371,153) 205,408 (331,227) - 1,164 205,408 (330,062)
Output groups schedule – items of controlled income and expense recognised directly in equity for the year ended 30 June 2008
Revaluation increment - - 7,748 11,777 - - 55,404 7,978 63,152 19,755 - - 63,152 19,755
Total recognised for the period - - 7,748 11,777 - - 55,404 7,978 63,152 19,755 - - 63,152 19,755
(i) In the restructure of administrative arrangements effective 1 January 2007 this output group was transferred out of DOT (see also Note 3).
(ii) In the restructure of administrative arrangements effective 1 January 2007 the ‘Energy Policy Services’ output, which is within this output group, was transferred out of DOT (see also Note 3).
(iii) These amounts relate to activities of the Shared Service Centre undertaken for departments other than DOT. In the restructure of administrative arrangements effective 1 January 2007 the Shared Service Centre transferred from DOT to the Department of Treasury and Finance.
Note 2. Departmental outputs (continued)
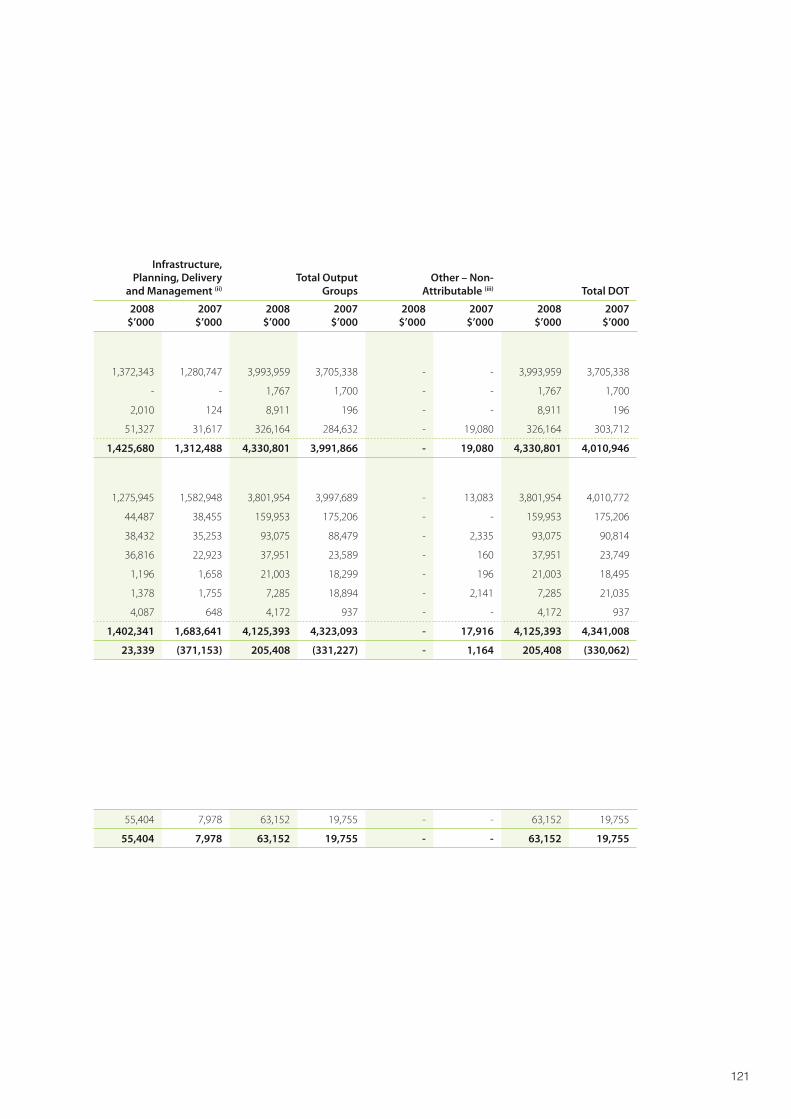
121
Output groups schedule – controlled operating statement for the year ended 30 June 2008
Public Safety and Security
Public Transport Services
ICT Policy, Programs and
Management (i)
Infrastructure, Planning, Delivery
and Management (ii)Total Output
GroupsOther – Non-
Attributable (iii) Total DOT
2008$’000
2007$’000
2008$’000
2007$’000
2008$’000
2007$’000
2008$’000
2007$’000
2008$’000
2007$’000
2008$’000
2007$’000
2008$’000
2007$’000
INCOMEOutput appropriations 122,030 112,344 2,499,586 2,293,797 - 18,450 1,372,343 1,280,747 3,993,959 3,705,338 - - 3,993,959 3,705,338
Special appropriations - - 1,767 1,700 - - - - 1,767 1,700 - - 1,767 1,700
Resources and assets received free of charge 6 4 6,895 36 - 32 2,010 124 8,911 196 - - 8,911 196
Other income 8,315 6,990 266,522 246,025 - - 51,327 31,617 326,164 284,632 - 19,080 326,164 303,712
Total income 130,351 119,338 2,774,770 2,541,558 - 18,482 1,425,680 1,312,488 4,330,801 3,991,866 - 19,080 4,330,801 4,010,946
EXPENSES FROM ORDINARY ACTIVITIESPayments to service providers and transport agencies 84,977 73,599 2,441,032 2,336,845 - 4,297 1,275,945 1,582,948 3,801,954 3,997,689 - 13,083 3,801,954 4,010,772
Supplies and services 27,162 22,155 88,304 106,347 - 8,249 44,487 38,455 159,953 175,206 - - 159,953 175,206
Employee benefits 17,073 15,737 37,570 32,355 - 5,134 38,432 35,253 93,075 88,479 - 2,335 93,075 90,814
Assets written off/disposed of 295 182 840 476 - 8 36,816 22,923 37,951 23,589 - 160 37,951 23,749
Capital asset charge 181 192 19,626 16,399 - 50 1,196 1,658 21,003 18,299 - 196 21,003 18,495
Depreciation and amortisation 994 1,162 4,913 15,225 - 752 1,378 1,755 7,285 18,894 - 2,141 7,285 21,035
Resources and assets provided free of charge 6 7 79 31 - 251 4,087 648 4,172 937 - - 4,172 937
Total expenses 130,688 113,033 2,592,364 2,507,678 - 18,742 1,402,341 1,683,641 4,125,393 4,323,093 - 17,916 4,125,393 4,341,008
Net result for the period (337) 6,305 182,406 33,880 - (260) 23,339 (371,153) 205,408 (331,227) - 1,164 205,408 (330,062)
Output groups schedule – items of controlled income and expense recognised directly in equity for the year ended 30 June 2008
Revaluation increment - - 7,748 11,777 - - 55,404 7,978 63,152 19,755 - - 63,152 19,755
Total recognised for the period - - 7,748 11,777 - - 55,404 7,978 63,152 19,755 - - 63,152 19,755
(i) In the restructure of administrative arrangements effective 1 January 2007 this output group was transferred out of DOT (see also Note 3).
(ii) In the restructure of administrative arrangements effective 1 January 2007 the ‘Energy Policy Services’ output, which is within this output group, was transferred out of DOT (see also Note 3).
(iii) These amounts relate to activities of the Shared Service Centre undertaken for departments other than DOT. In the restructure of administrative arrangements effective 1 January 2007 the Shared Service Centre transferred from DOT to the Department of Treasury and Finance.

122 Department of Transport Annual Report 2007-08
Output groups schedule – controlled balance sheet for the year ended 30 June 2008
Public Safety and Security
Public Transport Services
ICT Policy, Programs and
Management (i)
Infrastructure, Planning, Delivery
and Management (ii)Total Output
GroupsOther – Non-
Attributable (iii) Total DOT
2008$’000
2007$’000
2008$’000
2007$’000
2008$’000
2007$’000
2008$’000
2007$’000
2008$’000
2007$’000
2008$’000
2007$’000
2008$’000
2007$’000
CURRENT ASSETSCash and cash equivalents 61 368 317,323 321,517 - - 111,822 160,394 429,206 482,279 - - 429,206 482,279
Receivables 18,664 15,667 435,746 357,478 - - 158,483 131,276 612,893 504,421 - - 612,893 504,421
Prepayments 150 160 1,618 2,069 - - 743 609 2,511 2,838 - - 2,511 2,838
Inventories - - - - - - 64,387 - 64,387 - - - 64,387 -
Intangible assets - - - - - - 955 8,900 955 8,900 - - 955 8,900
Total current assets 18,875 16,195 754,687 681,064 - - 336,390 301,179 1,109,952 998,438 - - 1,109,952 998,438
NON-CURRENT ASSETSReceivables 407 371 1,166 963 - - 1,129 1,099 2,702 2,433 - - 2,702 2,433
Property, plant and equipment 7,709 3,866 172,781 107,300 - - 279,587 210,981 460,077 322,147 - - 460,077 322,147
Intangible assets 7,241 5,659 11,888 11,186 - - 49,790 48,306 68,919 65,151 - - 68,919 65,151
Total non-current assets 15,357 9,896 185,835 119,449 - - 330,506 260,386 531,698 389,731 - - 531,698 389,731
Total assets 34,232 26,091 940,522 800,513 - - 666,896 561,565 1,641,650 1,388,169 - - 1,641,650 1,388,169
CURRENT LIABILITIESPayables 8,682 8,904 338,686 241,754 - - 274,893 294,240 622,261 544,898 - - 622,261 544,898
Loans and advances from Victorian Government 430 522 8,382 109,376 - - 153,485 114,761 162,297 224,659 - - 162,297 224,659
Interest bearing liabilities 493 277 516 401 - - 347 165 1,356 843 - - 1,356 843
Provisions 3,081 2,854 15,644 14,796 - - 6,256 6,271 24,981 23,921 - - 24,981 23,921
Total current liabilities 12,686 12,557 363,228 366,327 - - 434,981 415,437 810,895 794,321 - - 810,895 794,321
NON-CURRENT LIABILITIESInterest bearing liabilities 492 781 835 967 - - 391 375 1,718 2,123 - - 1,718 2,123
Provisions 437 406 199,944 189,397 - - 1,216 1,206 201,597 191,009 - - 201,597 191,009
Prepaid lease income - - - - - - - 1,778 - 1,778 - - - 1,778
Total non-current liabilities 929 1,187 200,779 190,364 - - 1,607 3,359 203,315 194,910 - - 203,315 194,910
Total liabilities 13,615 13,744 564,007 556,691 - - 436,588 418,796 1,014,210 989,231 - - 1,014,210 989,231
Net assets 20,617 12,347 376,515 243,822 - - 230,308 142,769 627,440 398,938 - - 627,440 398,938
(i) In the restructure of administrative arrangements effective 1 January 2007 this output group was transferred out of DOT (see also Note 3).
(ii) In the restructure of administrative arrangements effective 1 January 2007 the ‘Energy Policy Services’ output, which is within this output group, was transferred out of DOT (see also Note 3).
(iii) These amounts relate to activities of the Shared Service Centre undertaken for departments other than DOT. In the restructure of administrative arrangements effective 1 January 2007 the Shared Service Centre transferred from DOT to the Department of Treasury and Finance.
Note 2. Departmental outputs (continued)
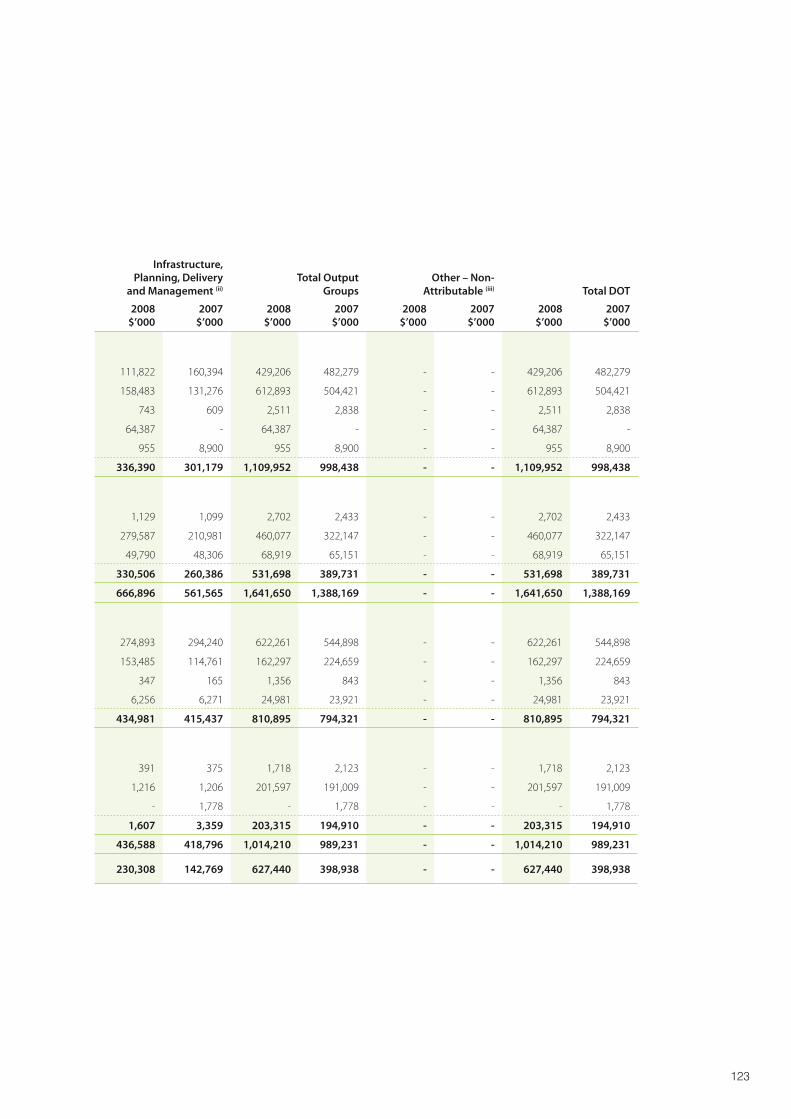
123
Output groups schedule – controlled balance sheet for the year ended 30 June 2008
Public Safety and Security
Public Transport Services
ICT Policy, Programs and
Management (i)
Infrastructure, Planning, Delivery
and Management (ii)Total Output
GroupsOther – Non-
Attributable (iii) Total DOT
2008$’000
2007$’000
2008$’000
2007$’000
2008$’000
2007$’000
2008$’000
2007$’000
2008$’000
2007$’000
2008$’000
2007$’000
2008$’000
2007$’000
CURRENT ASSETSCash and cash equivalents 61 368 317,323 321,517 - - 111,822 160,394 429,206 482,279 - - 429,206 482,279
Receivables 18,664 15,667 435,746 357,478 - - 158,483 131,276 612,893 504,421 - - 612,893 504,421
Prepayments 150 160 1,618 2,069 - - 743 609 2,511 2,838 - - 2,511 2,838
Inventories - - - - - - 64,387 - 64,387 - - - 64,387 -
Intangible assets - - - - - - 955 8,900 955 8,900 - - 955 8,900
Total current assets 18,875 16,195 754,687 681,064 - - 336,390 301,179 1,109,952 998,438 - - 1,109,952 998,438
NON-CURRENT ASSETSReceivables 407 371 1,166 963 - - 1,129 1,099 2,702 2,433 - - 2,702 2,433
Property, plant and equipment 7,709 3,866 172,781 107,300 - - 279,587 210,981 460,077 322,147 - - 460,077 322,147
Intangible assets 7,241 5,659 11,888 11,186 - - 49,790 48,306 68,919 65,151 - - 68,919 65,151
Total non-current assets 15,357 9,896 185,835 119,449 - - 330,506 260,386 531,698 389,731 - - 531,698 389,731
Total assets 34,232 26,091 940,522 800,513 - - 666,896 561,565 1,641,650 1,388,169 - - 1,641,650 1,388,169
CURRENT LIABILITIESPayables 8,682 8,904 338,686 241,754 - - 274,893 294,240 622,261 544,898 - - 622,261 544,898
Loans and advances from Victorian Government 430 522 8,382 109,376 - - 153,485 114,761 162,297 224,659 - - 162,297 224,659
Interest bearing liabilities 493 277 516 401 - - 347 165 1,356 843 - - 1,356 843
Provisions 3,081 2,854 15,644 14,796 - - 6,256 6,271 24,981 23,921 - - 24,981 23,921
Total current liabilities 12,686 12,557 363,228 366,327 - - 434,981 415,437 810,895 794,321 - - 810,895 794,321
NON-CURRENT LIABILITIESInterest bearing liabilities 492 781 835 967 - - 391 375 1,718 2,123 - - 1,718 2,123
Provisions 437 406 199,944 189,397 - - 1,216 1,206 201,597 191,009 - - 201,597 191,009
Prepaid lease income - - - - - - - 1,778 - 1,778 - - - 1,778
Total non-current liabilities 929 1,187 200,779 190,364 - - 1,607 3,359 203,315 194,910 - - 203,315 194,910
Total liabilities 13,615 13,744 564,007 556,691 - - 436,588 418,796 1,014,210 989,231 - - 1,014,210 989,231
Net assets 20,617 12,347 376,515 243,822 - - 230,308 142,769 627,440 398,938 - - 627,440 398,938
(i) In the restructure of administrative arrangements effective 1 January 2007 this output group was transferred out of DOT (see also Note 3).
(ii) In the restructure of administrative arrangements effective 1 January 2007 the ‘Energy Policy Services’ output, which is within this output group, was transferred out of DOT (see also Note 3).
(iii) These amounts relate to activities of the Shared Service Centre undertaken for departments other than DOT. In the restructure of administrative arrangements effective 1 January 2007 the Shared Service Centre transferred from DOT to the Department of Treasury and Finance.
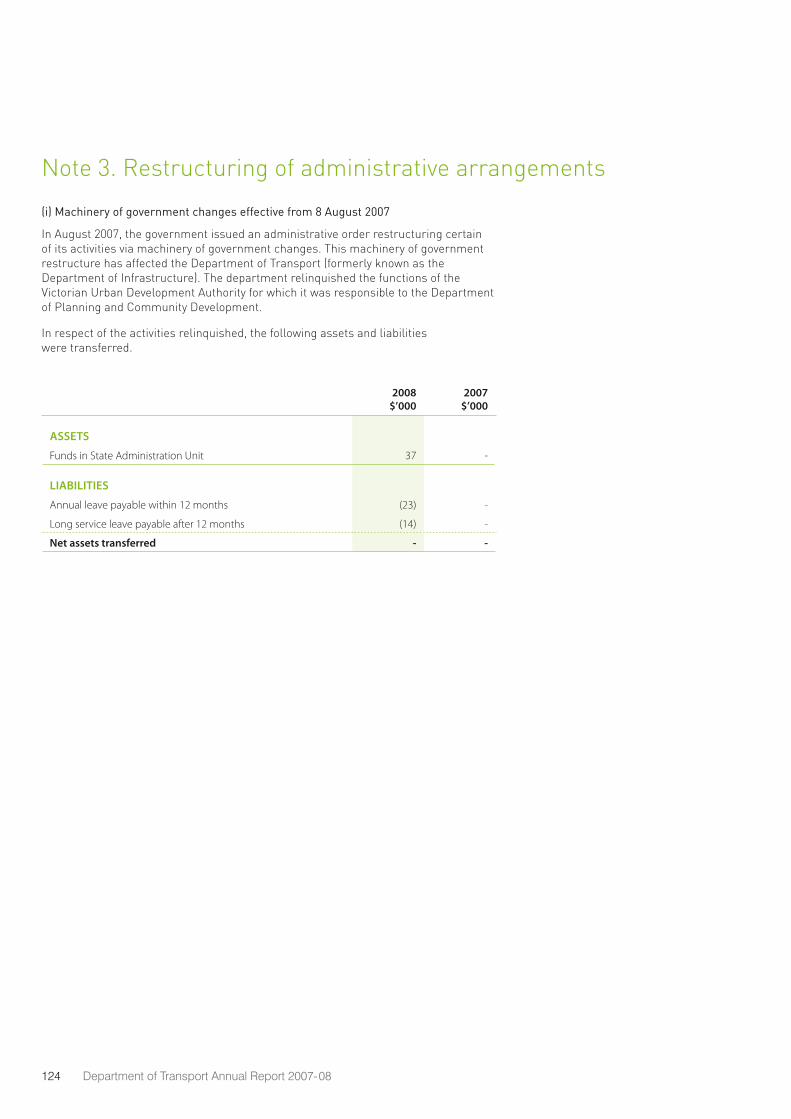
124 Department of Transport Annual Report 2007-08
Note 3. Restructuring of administrative arrangements
(i) Machinery of government changes effective from 8 August 2007
In August 2007, the government issued an administrative order restructuring certain of its activities via machinery of government changes. This machinery of government restructure has affected the Department of Transport (formerly known as the Department of Infrastructure). The department relinquished the functions of the Victorian Urban Development Authority for which it was responsible to the Department of Planning and Community Development.
In respect of the activities relinquished, the following assets and liabilities were transferred.
2008$’000
2007$’000
ASSETS
Funds in State Administration Unit 37 -
LIABILITIES
Annual leave payable within 12 months (23) -
Long service leave payable after 12 months (14) -
Net assets transferred - -
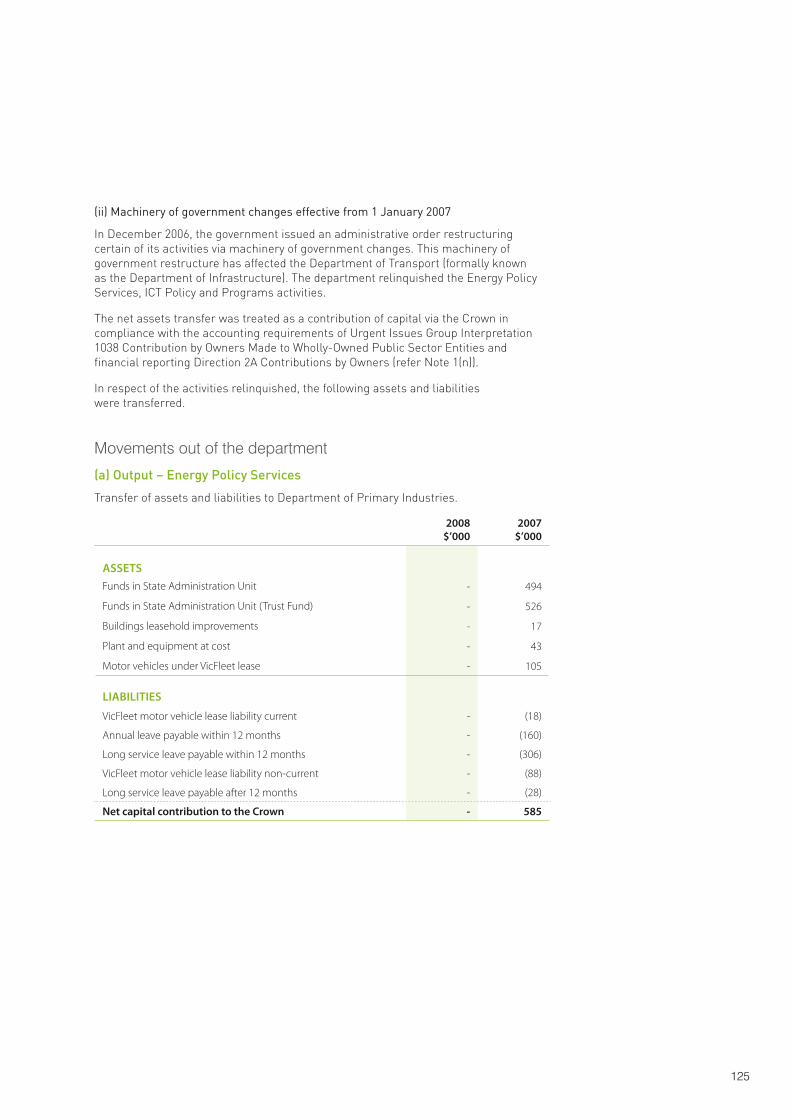
125
(ii) Machinery of government changes effective from 1 January 2007
In December 2006, the government issued an administrative order restructuring certain of its activities via machinery of government changes. This machinery of government restructure has affected the Department of Transport (formally known as the Department of Infrastructure). The department relinquished the Energy Policy Services, ICT Policy and Programs activities.
The net assets transfer was treated as a contribution of capital via the Crown in compliance with the accounting requirements of Urgent Issues Group Interpretation 1038 Contribution by Owners Made to Wholly-Owned Public Sector Entities and financial reporting Direction 2A Contributions by Owners (refer Note 1(n)).
In respect of the activities relinquished, the following assets and liabilities were transferred.
Movements out of the department
(a) Output – Energy Policy Services
Transfer of assets and liabilities to Department of Primary Industries.
2008$’000
2007$’000
ASSETSFunds in State Administration Unit - 494
Funds in State Administration Unit (Trust Fund) - 526
Buildings leasehold improvements - 17
Plant and equipment at cost - 43
Motor vehicles under VicFleet lease - 105
LIABILITIES
VicFleet motor vehicle lease liability current - (18)
Annual leave payable within 12 months - (160)
Long service leave payable within 12 months - (306)
VicFleet motor vehicle lease liability non-current - (88)
Long service leave payable after 12 months - (28)
Net capital contribution to the Crown - 585
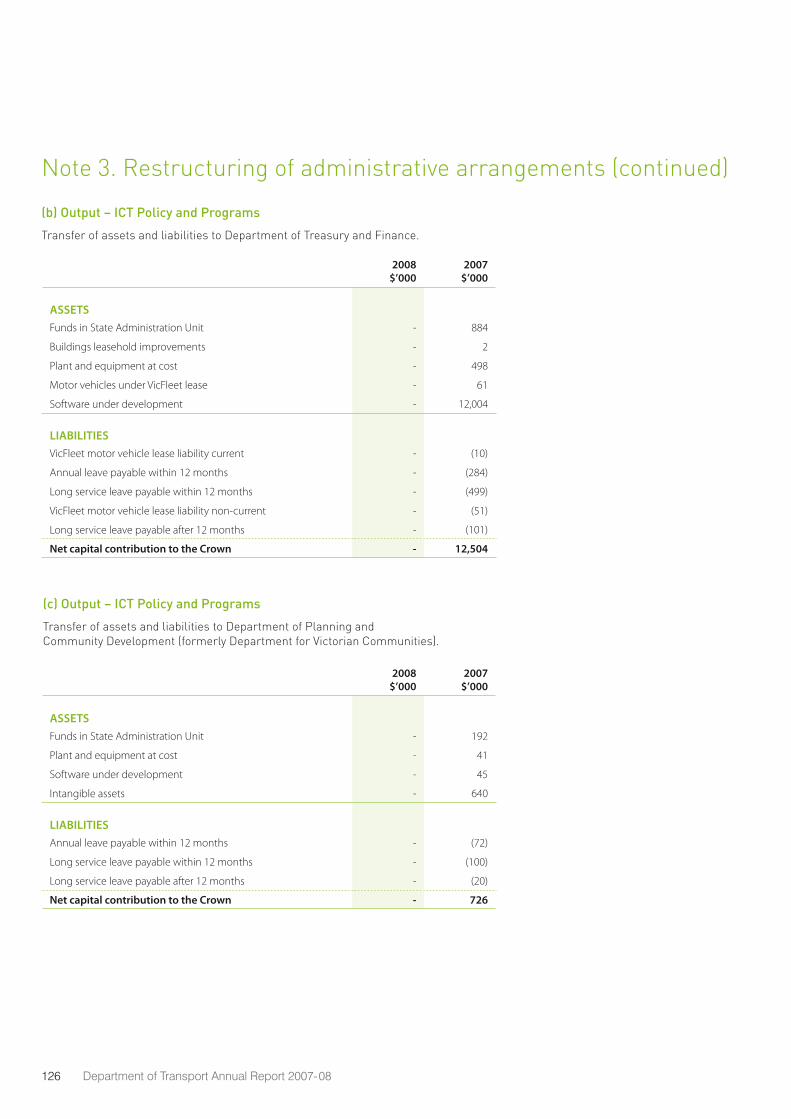
126 Department of Transport Annual Report 2007-08
(b) Output – ICT Policy and Programs
Transfer of assets and liabilities to Department of Treasury and Finance.
2008$’000
2007$’000
ASSETSFunds in State Administration Unit - 884
Buildings leasehold improvements - 2
Plant and equipment at cost - 498
Motor vehicles under VicFleet lease - 61
Software under development - 12,004
LIABILITIESVicFleet motor vehicle lease liability current - (10)
Annual leave payable within 12 months - (284)
Long service leave payable within 12 months - (499)
VicFleet motor vehicle lease liability non-current - (51)
Long service leave payable after 12 months - (101)
Net capital contribution to the Crown - 12,504
(c) Output – ICT Policy and Programs
Transfer of assets and liabilities to Department of Planning and Community Development (formerly Department for Victorian Communities).
2008$’000
2007$’000
ASSETSFunds in State Administration Unit - 192
Plant and equipment at cost - 41
Software under development - 45
Intangible assets - 640
LIABILITIESAnnual leave payable within 12 months - (72)
Long service leave payable within 12 months - (100)
Long service leave payable after 12 months - (20)
Net capital contribution to the Crown - 726
Note 3. Restructuring of administrative arrangements (continued)
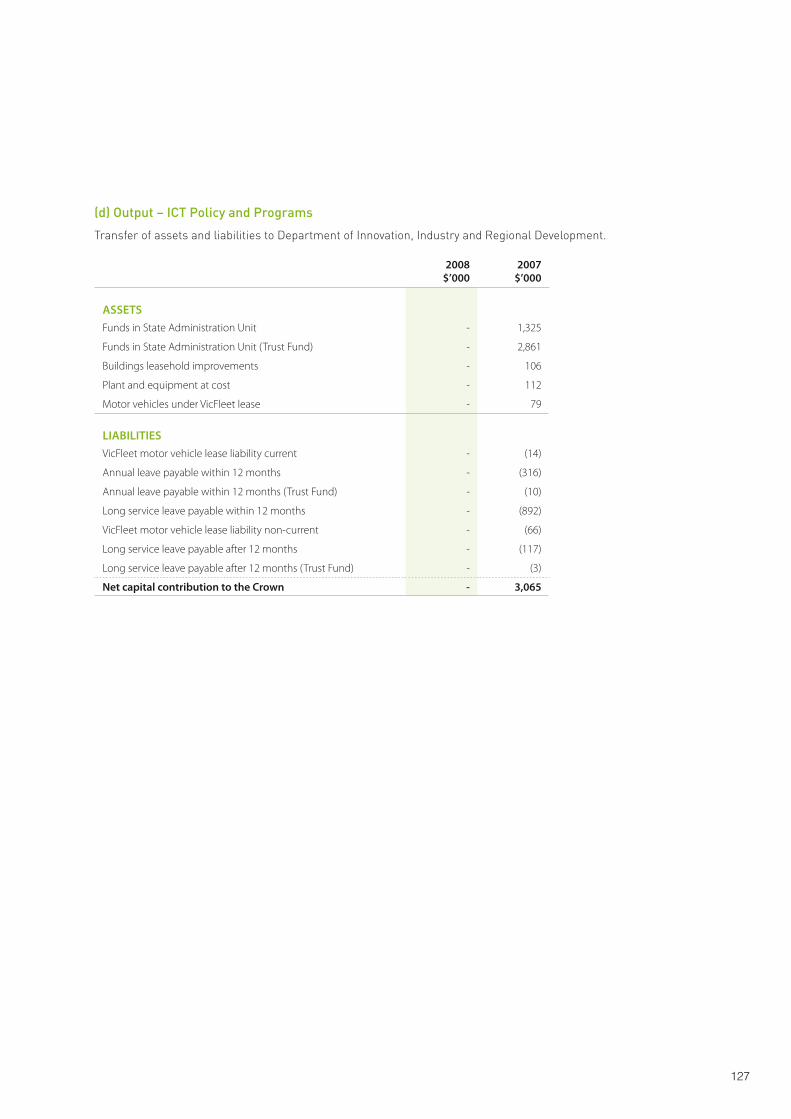
127
(d) Output – ICT Policy and Programs
Transfer of assets and liabilities to Department of Innovation, Industry and Regional Development.
2008$’000
2007$’000
ASSETSFunds in State Administration Unit - 1,325
Funds in State Administration Unit (Trust Fund) - 2,861
Buildings leasehold improvements - 106
Plant and equipment at cost - 112
Motor vehicles under VicFleet lease - 79
LIABILITIESVicFleet motor vehicle lease liability current - (14)
Annual leave payable within 12 months - (316)
Annual leave payable within 12 months (Trust Fund) - (10)
Long service leave payable within 12 months - (892)
VicFleet motor vehicle lease liability non-current - (66)
Long service leave payable after 12 months - (117)
Long service leave payable after 12 months (Trust Fund) - (3)
Net capital contribution to the Crown - 3,065
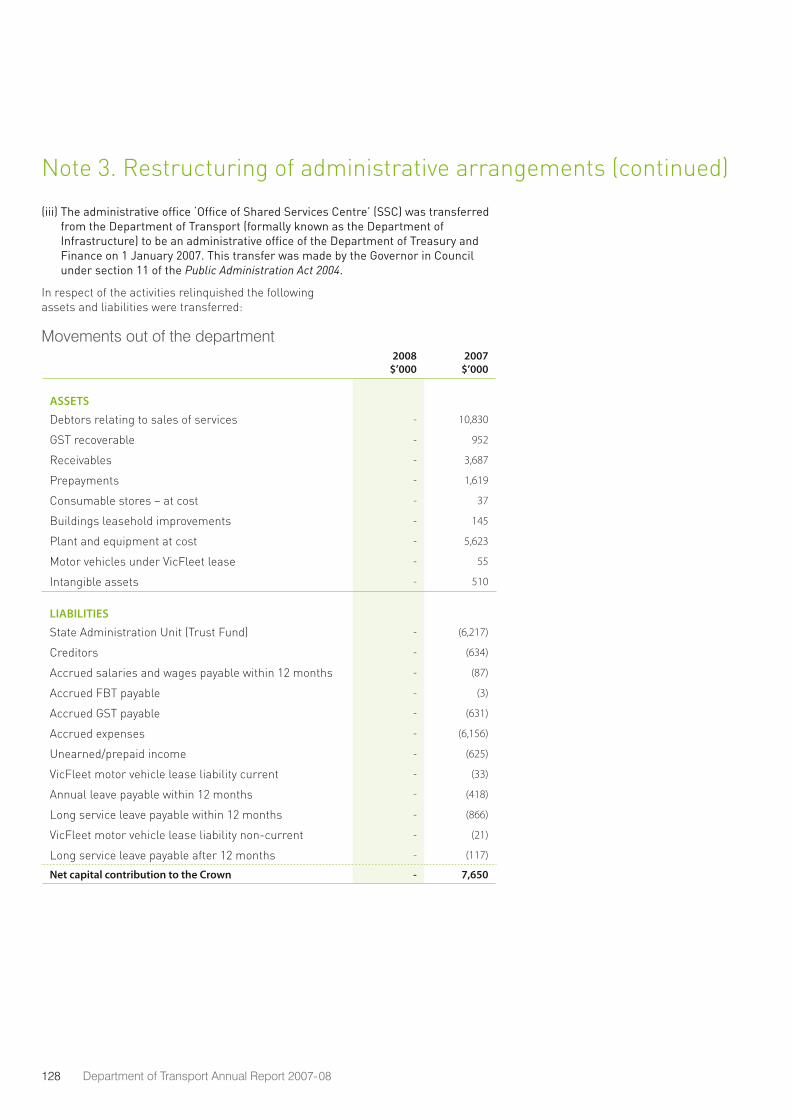
128 Department of Transport Annual Report 2007-08
(iii) The administrative office ‘Office of Shared Services Centre’ (SSC) was transferred from the Department of Transport (formally known as the Department of Infrastructure) to be an administrative office of the Department of Treasury and Finance on 1 January 2007. This transfer was made by the Governor in Council under section 11 of the Public Administration Act 2004.
In respect of the activities relinquished the following assets and liabilities were transferred:
Movements out of the department2008
$’0002007
$’000
ASSETS
Debtors relating to sales of services - 10,830
GST recoverable - 952
Receivables - 3,687
Prepayments - 1,619
Consumable stores – at cost - 37
Buildings leasehold improvements - 145
Plant and equipment at cost - 5,623
Motor vehicles under VicFleet lease - 55
Intangible assets - 510
LIABILITIES
State Administration Unit (Trust Fund) - (6,217)
Creditors - (634)
Accrued salaries and wages payable within 12 months - (87)
Accrued FBT payable - (3)
Accrued GST payable - (631)
Accrued expenses - (6,156)
Unearned/prepaid income - (625)
VicFleet motor vehicle lease liability current - (33)
Annual leave payable within 12 months - (418)
Long service leave payable within 12 months - (866)
VicFleet motor vehicle lease liability non-current - (21)
Long service leave payable after 12 months - (117)
Net capital contribution to the Crown - 7,650
Note 3. Restructuring of administrative arrangements (continued)
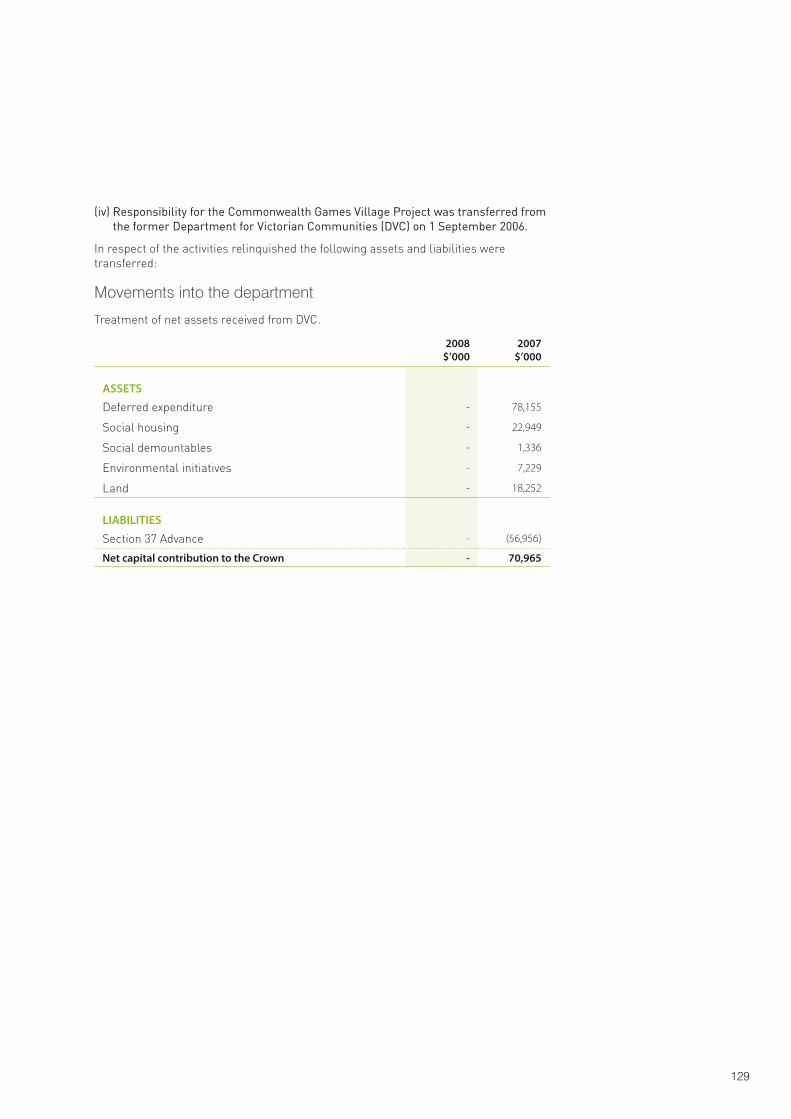
129
(iv) Responsibility for the Commonwealth Games Village Project was transferred from the former Department for Victorian Communities (DVC) on 1 September 2006.
In respect of the activities relinquished the following assets and liabilities were transferred:
Movements into the department
Treatment of net assets received from DVC.
2008$’000
2007$’000
ASSETS
Deferred expenditure - 78,155
Social housing - 22,949
Social demountables - 1,336
Environmental initiatives - 7,229
Land - 18,252
LIABILITIES
Section 37 Advance - (56,956)
Net capital contribution to the Crown - 70,965
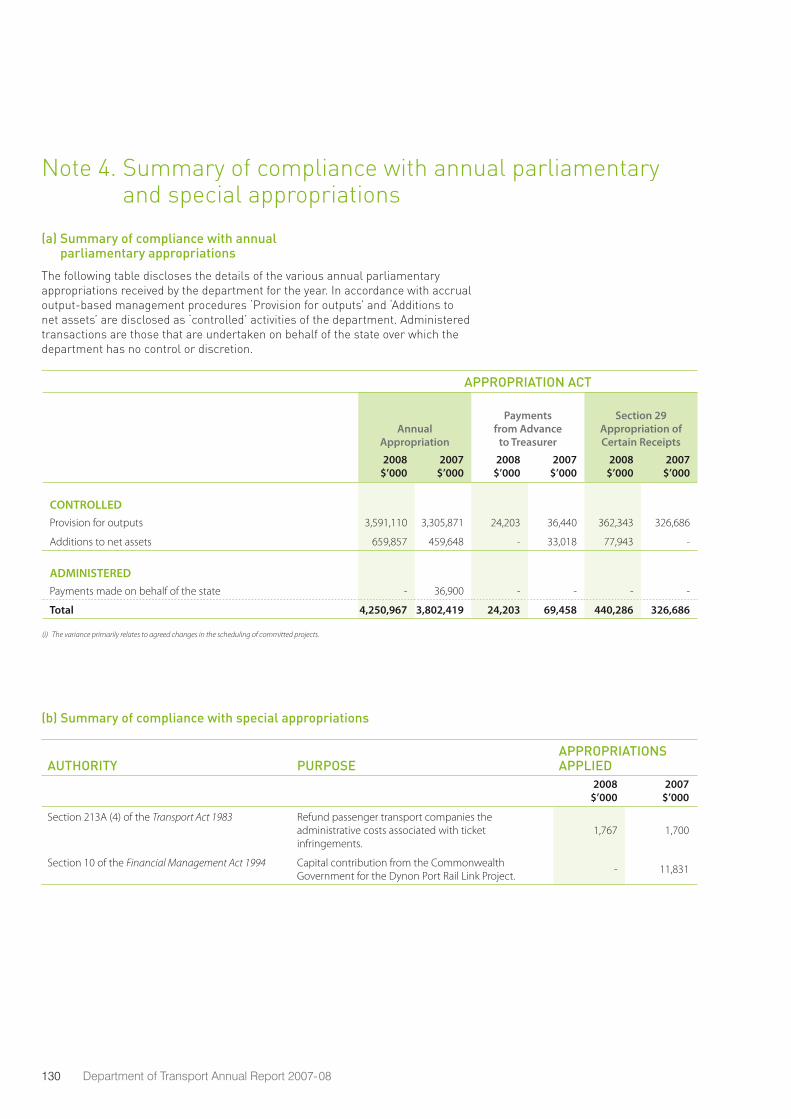
130 Department of Transport Annual Report 2007-08
APPROPRIATION ACT FINANCIAL MANAGEMENT ACT
Annual Appropriation
Payments from Advance
to Treasurer
Section 29 Appropriation of Certain Receipts
Section 30 Transfer Between
Appropriations
Section 32 Unused
Appropriations (from prior years)
Section 35 Temporary Advances
Total Parliamentary Authority
Appropriations Applied Variance (i)
2008$’000
2007$’000
2008$’000
2007$’000
2008$’000
2007$’000
2008$’000
2007$’000
2008$’000
2007$’000
2008$’000
2007$’000
2008$’000
2007$’000
2008$’000
2007$’000
2008$’000
2007$’000
CONTROLLEDProvision for outputs 3,591,110 3,305,871 24,203 36,440 362,343 326,686 3,443 29,385 115,616 146,086 - - 4,096,715 3,844,468 3,993,959 3,705,338 102,756 139,130
Additions to net assets 659,857 459,648 - 33,018 77,943 - (3,443) (29,385) 180,249 179,564 21,099 25,927 935,705 668,772 724,353 469,729 211,352 199,043
ADMINISTEREDPayments made on behalf of the state - 36,900 - - - - - - - - - - - 36,900 - 18,500 - 18,400
Total 4,250,967 3,802,419 24,203 69,458 440,286 326,686 - - 295,865 325,650 21,099 25,927 5,032,420 4,550,140 4,718,312 4,193,567 314,108 356,573
(i) The variance primarily relates to agreed changes in the scheduling of committed projects.
Note 4. Summary of compliance with annual parliamentary and special appropriations
(a) Summary of compliance with annual parliamentary appropriations
The following table discloses the details of the various annual parliamentary appropriations received by the department for the year. In accordance with accrual output-based management procedures ‘Provision for outputs’ and ‘Additions to net assets’ are disclosed as ‘controlled’ activities of the department. Administered transactions are those that are undertaken on behalf of the state over which the department has no control or discretion.
(b) Summary of compliance with special appropriations
AUTHORITY PURPOSEAPPROPRIATIONS APPLIED
2008
$’0002007
$’000
Section 213A (4) of the Transport Act 1983 Refund passenger transport companies the administrative costs associated with ticket infringements.
1,767 1,700
Section 10 of the Financial Management Act 1994 Capital contribution from the Commonwealth Government for the Dynon Port Rail Link Project.
- 11,831
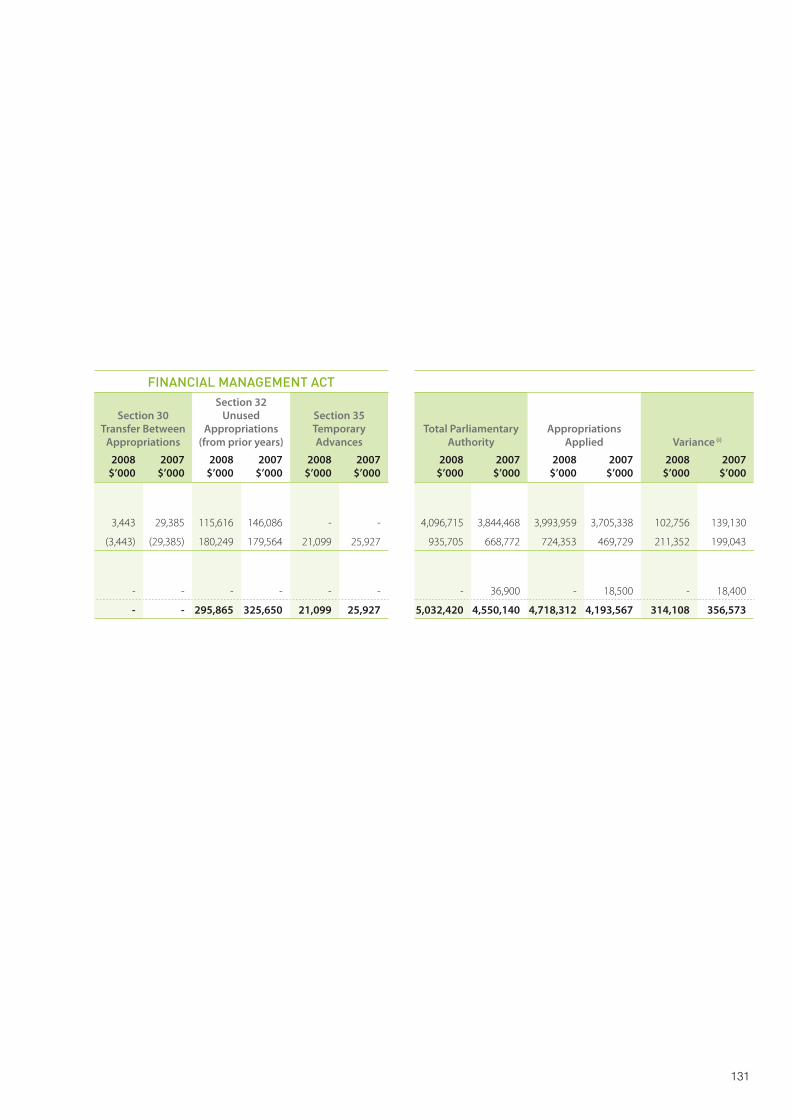
131
APPROPRIATION ACT FINANCIAL MANAGEMENT ACT
Annual Appropriation
Payments from Advance
to Treasurer
Section 29 Appropriation of Certain Receipts
Section 30 Transfer Between
Appropriations
Section 32 Unused
Appropriations (from prior years)
Section 35 Temporary Advances
Total Parliamentary Authority
Appropriations Applied Variance (i)
2008$’000
2007$’000
2008$’000
2007$’000
2008$’000
2007$’000
2008$’000
2007$’000
2008$’000
2007$’000
2008$’000
2007$’000
2008$’000
2007$’000
2008$’000
2007$’000
2008$’000
2007$’000
CONTROLLEDProvision for outputs 3,591,110 3,305,871 24,203 36,440 362,343 326,686 3,443 29,385 115,616 146,086 - - 4,096,715 3,844,468 3,993,959 3,705,338 102,756 139,130
Additions to net assets 659,857 459,648 - 33,018 77,943 - (3,443) (29,385) 180,249 179,564 21,099 25,927 935,705 668,772 724,353 469,729 211,352 199,043
ADMINISTEREDPayments made on behalf of the state - 36,900 - - - - - - - - - - - 36,900 - 18,500 - 18,400
Total 4,250,967 3,802,419 24,203 69,458 440,286 326,686 - - 295,865 325,650 21,099 25,927 5,032,420 4,550,140 4,718,312 4,193,567 314,108 356,573
(i) The variance primarily relates to agreed changes in the scheduling of committed projects.
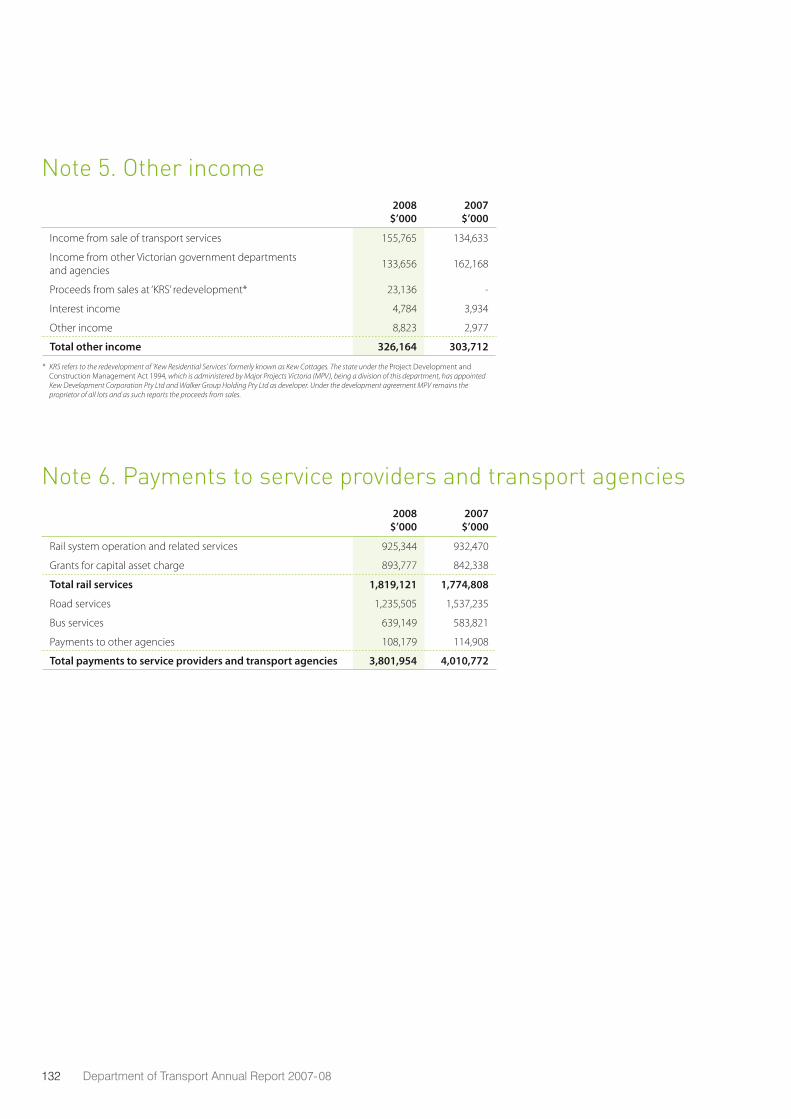
132 Department of Transport Annual Report 2007-08
Note 5. Other income2008
$’0002007
$’000
Income from sale of transport services 155,765 134,633
Income from other Victorian government departments and agencies
133,656 162,168
Proceeds from sales at ‘KRS’ redevelopment* 23,136 -
Interest income 4,784 3,934
Other income 8,823 2,977
Total other income 326,164 303,712
* KRS refers to the redevelopment of ‘Kew Residential Services’ formerly known as Kew Cottages. The state under the Project Development and Construction Management Act 1994, which is administered by Major Projects Victoria (MPV), being a division of this department, has appointed Kew Development Corporation Pty Ltd and Walker Group Holding Pty Ltd as developer. Under the development agreement MPV remains the proprietor of all lots and as such reports the proceeds from sales.
Note 6. Payments to service providers and transport agencies2008
$’0002007
$’000
Rail system operation and related services 925,344 932,470
Grants for capital asset charge 893,777 842,338
Total rail services 1,819,121 1,774,808
Road services 1,235,505 1,537,235
Bus services 639,149 583,821
Payments to other agencies 108,179 114,908
Total payments to service providers and transport agencies 3,801,954 4,010,772
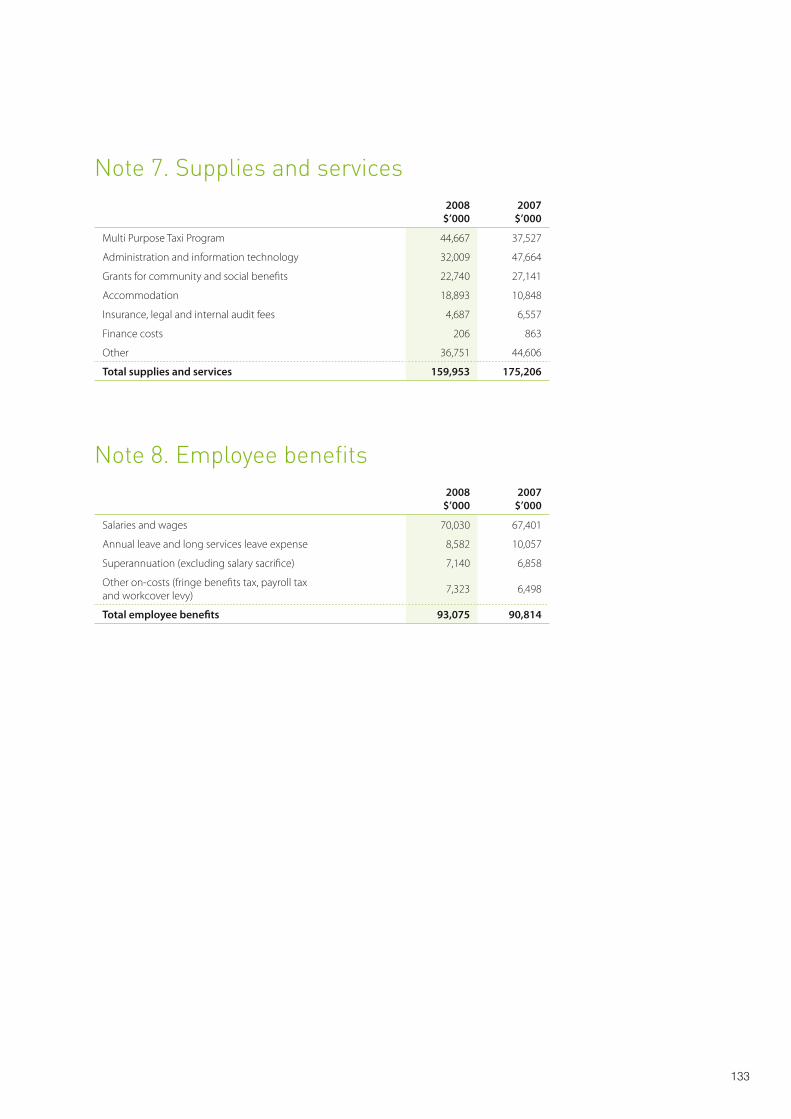
133
Note 7. Supplies and services2008
$’0002007
$’000
Multi Purpose Taxi Program 44,667 37,527
Administration and information technology 32,009 47,664
Grants for community and social benefits 22,740 27,141
Accommodation 18,893 10,848
Insurance, legal and internal audit fees 4,687 6,557
Finance costs 206 863
Other 36,751 44,606
Total supplies and services 159,953 175,206
Note 8. Employee benefits2008
$’0002007
$’000
Salaries and wages 70,030 67,401
Annual leave and long services leave expense 8,582 10,057
Superannuation (excluding salary sacrifice) 7,140 6,858
Other on-costs (fringe benefits tax, payroll tax and workcover levy)
7,323 6,498
Total employee benefits 93,075 90,814
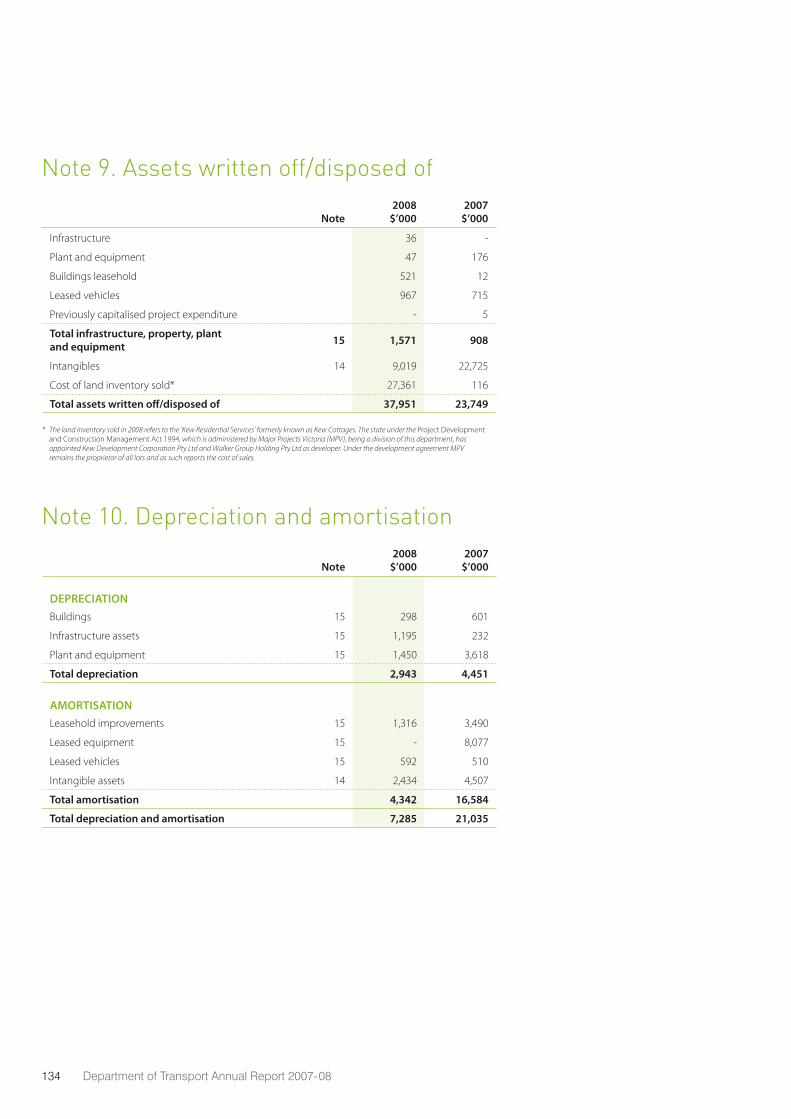
134 Department of Transport Annual Report 2007-08
Note 10. Depreciation and amortisation
Note2008
$’0002007
$’000
DEPRECIATIONBuildings 15 298 601
Infrastructure assets 15 1,195 232
Plant and equipment 15 1,450 3,618
Total depreciation 2,943 4,451
AMORTISATIONLeasehold improvements 15 1,316 3,490
Leased equipment 15 - 8,077
Leased vehicles 15 592 510
Intangible assets 14 2,434 4,507
Total amortisation 4,342 16,584
Total depreciation and amortisation 7,285 21,035
Note 9. Assets written off/disposed of
Note2008
$’0002007
$’000
Infrastructure 36 -
Plant and equipment 47 176
Buildings leasehold 521 12
Leased vehicles 967 715
Previously capitalised project expenditure - 5
Total infrastructure, property, plant and equipment 15 1,571 908
Intangibles 14 9,019 22,725
Cost of land inventory sold* 27,361 116
Total assets written off/disposed of 37,951 23,749
* The land inventory sold in 2008 refers to the ‘Kew Residential Services’ formerly known as Kew Cottages. The state under the Project Development and Construction Management Act 1994, which is administered by Major Projects Victoria (MPV), being a division of this department, has appointed Kew Development Corporation Pty Ltd and Walker Group Holding Pty Ltd as developer. Under the development agreement MPV remains the proprietor of all lots and as such reports the cost of sales.
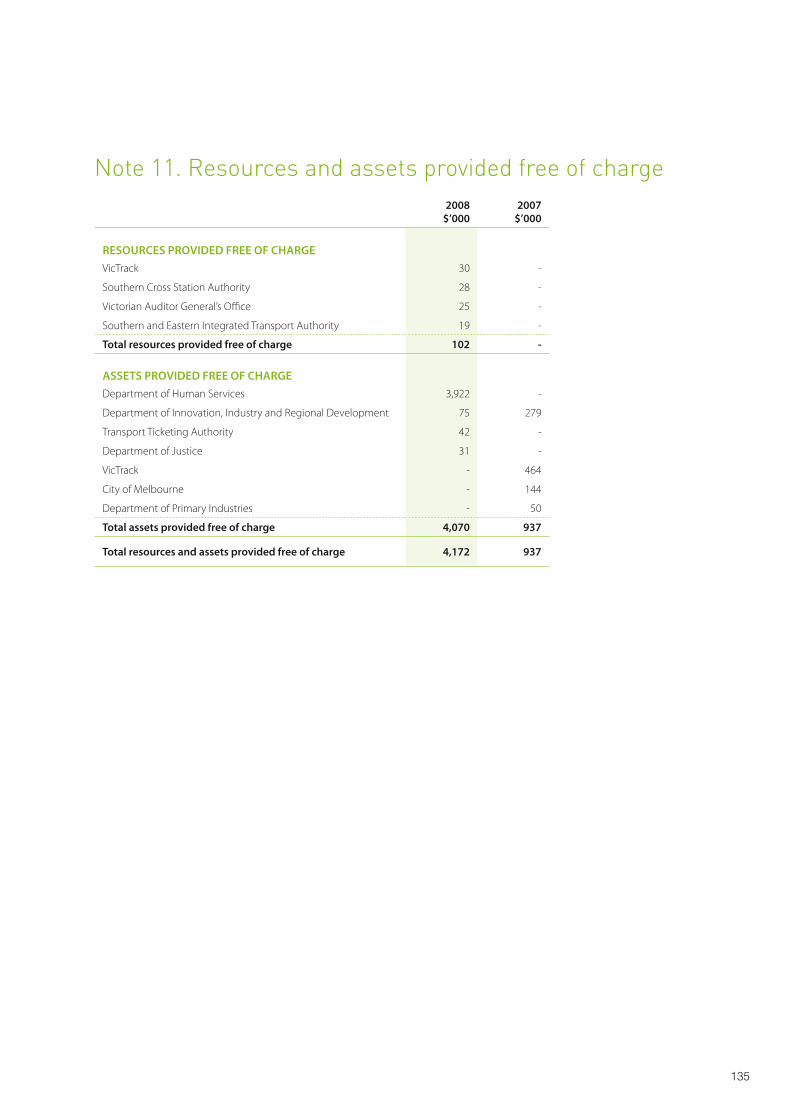
135
Note 11. Resources and assets provided free of charge2008
$’0002007
$’000
RESOURCES PROVIDED FREE OF CHARGEVicTrack 30 -
Southern Cross Station Authority 28 -
Victorian Auditor General’s Office 25 -
Southern and Eastern Integrated Transport Authority 19 -
Total resources provided free of charge 102 -
ASSETS PROVIDED FREE OF CHARGEDepartment of Human Services 3,922 -
Department of Innovation, Industry and Regional Development 75 279
Transport Ticketing Authority 42 -
Department of Justice 31 -
VicTrack - 464
City of Melbourne - 144
Department of Primary Industries - 50
Total assets provided free of charge 4,070 937
Total resources and assets provided free of charge 4,172 937
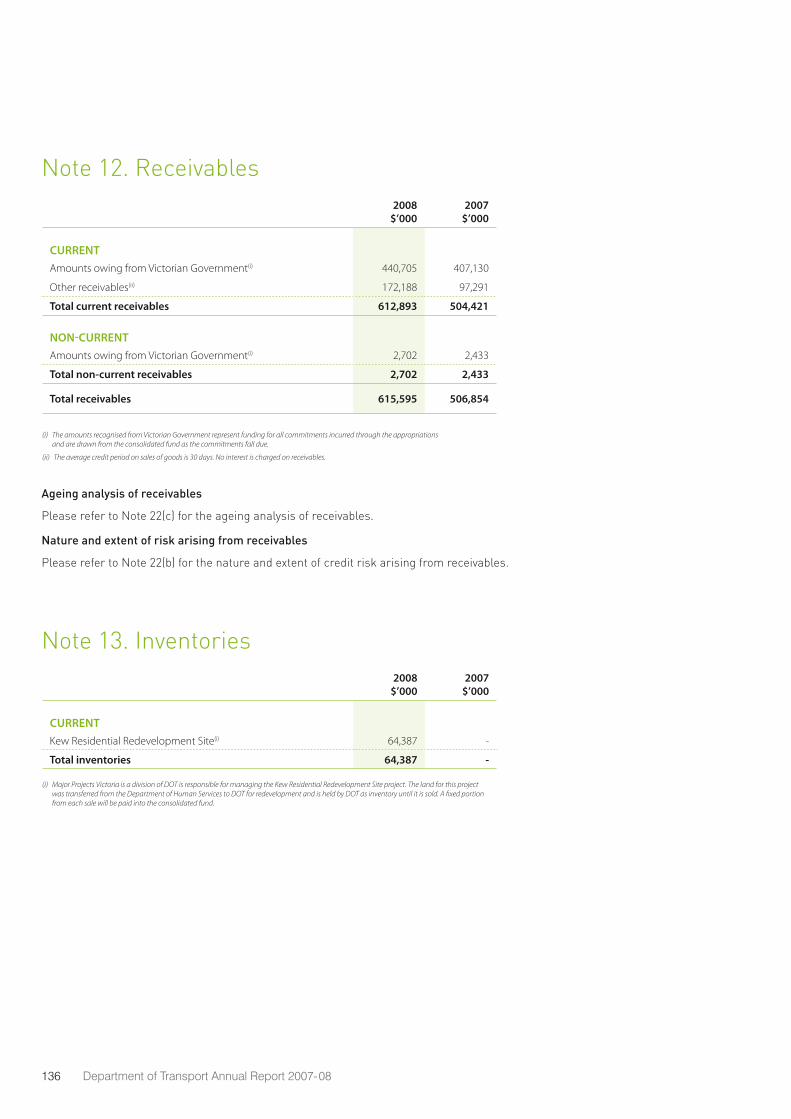
136 Department of Transport Annual Report 2007-08
Note 13. Inventories2008
$’000 2007
$’000
CURRENTKew Residential Redevelopment Site(i) 64,387 -
Total inventories 64,387 -
(i) Major Projects Victoria is a division of DOT is responsible for managing the Kew Residential Redevelopment Site project. The land for this project was transferred from the Department of Human Services to DOT for redevelopment and is held by DOT as inventory until it is sold. A fixed portion from each sale will be paid into the consolidated fund.
Note 12. Receivables2008
$’0002007
$’000
CURRENTAmounts owing from Victorian Government(i) 440,705 407,130
Other receivables(ii) 172,188 97,291
Total current receivables 612,893 504,421
NON-CURRENTAmounts owing from Victorian Government(i) 2,702 2,433
Total non-current receivables 2,702 2,433
Total receivables 615,595 506,854
(i) The amounts recognised from Victorian Government represent funding for all commitments incurred through the appropriations and are drawn from the consolidated fund as the commitments fall due.
(ii) The average credit period on sales of goods is 30 days. No interest is charged on receivables.
Ageing analysis of receivables
Please refer to Note 22(c) for the ageing analysis of receivables.
Nature and extent of risk arising from receivables
Please refer to Note 22(b) for the nature and extent of credit risk arising from receivables.
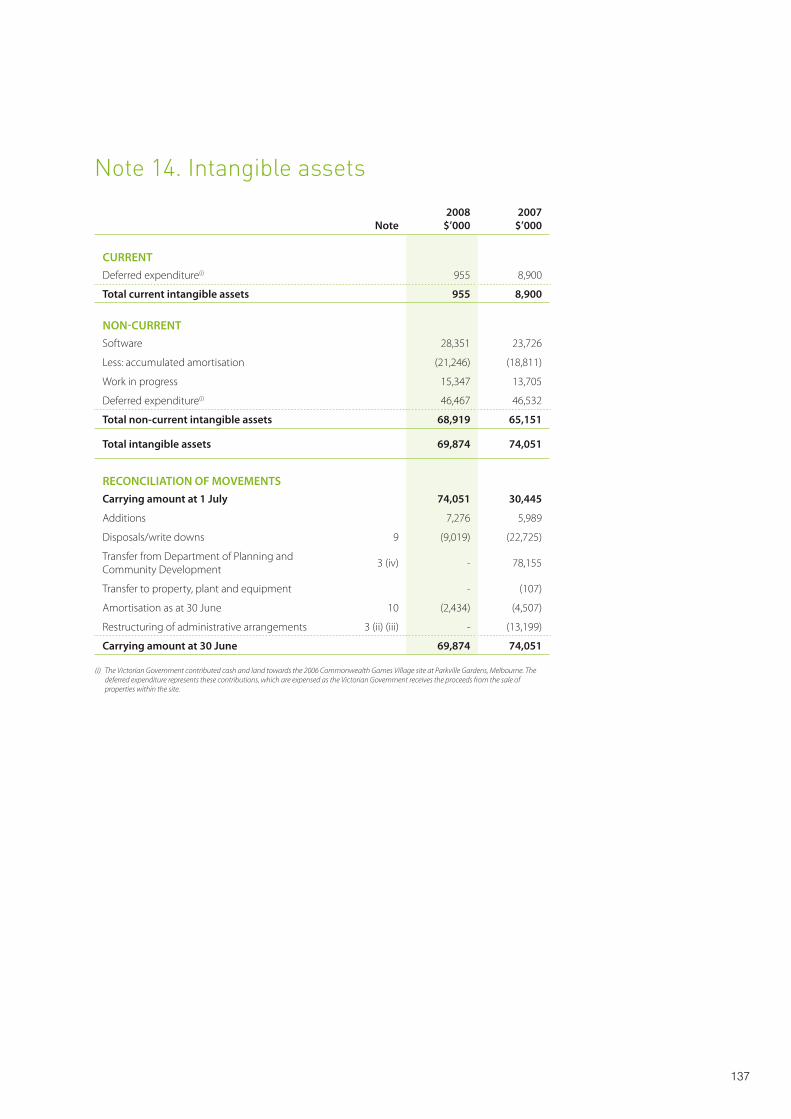
137
Note 14. Intangible assets
Note2008
$’000 2007
$’000
CURRENTDeferred expenditure(i) 955 8,900
Total current intangible assets 955 8,900
NON-CURRENTSoftware 28,351 23,726
Less: accumulated amortisation (21,246) (18,811)
Work in progress 15,347 13,705
Deferred expenditure(i) 46,467 46,532
Total non-current intangible assets 68,919 65,151
Total intangible assets 69,874 74,051
RECONCILIATION OF MOVEMENTSCarrying amount at 1 July 74,051 30,445
Additions 7,276 5,989
Disposals/write downs 9 (9,019) (22,725)
Transfer from Department of Planning and Community Development
3 (iv) - 78,155
Transfer to property, plant and equipment - (107)
Amortisation as at 30 June 10 (2,434) (4,507)
Restructuring of administrative arrangements 3 (ii) (iii) - (13,199)
Carrying amount at 30 June 69,874 74,051
(i) The Victorian Government contributed cash and land towards the 2006 Commonwealth Games Village site at Parkville Gardens, Melbourne. The deferred expenditure represents these contributions, which are expensed as the Victorian Government receives the proceeds from the sale of properties within the site.
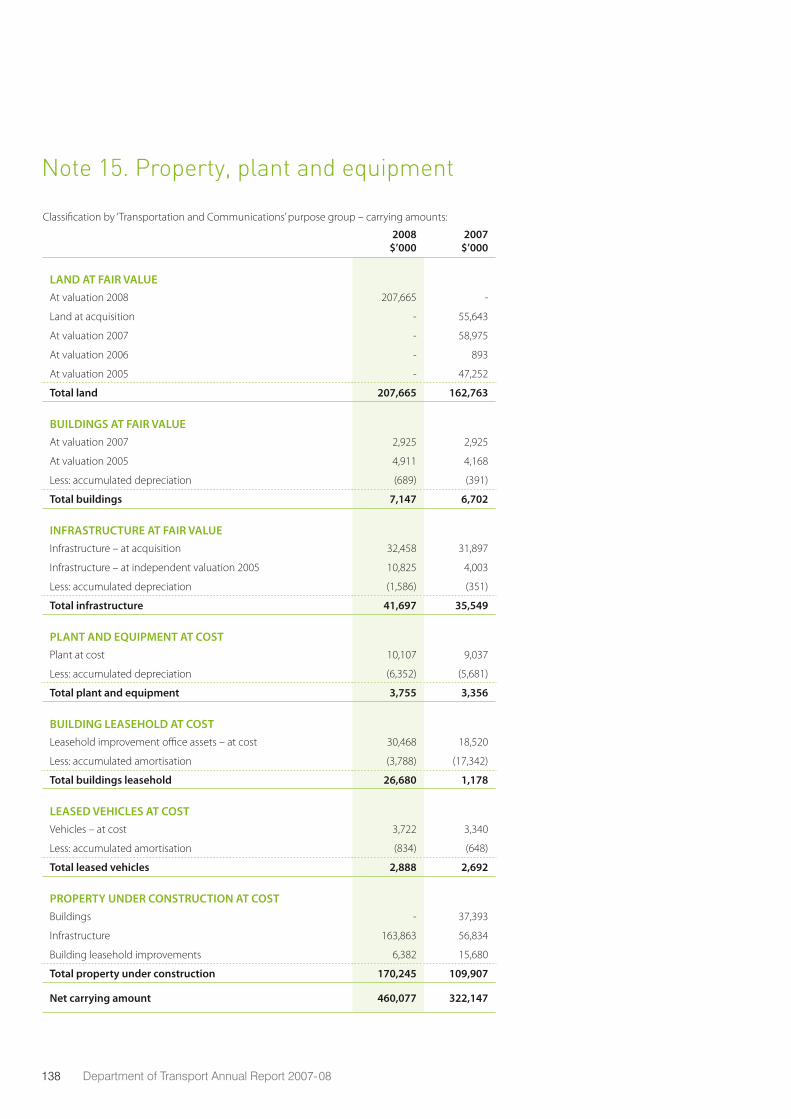
138 Department of Transport Annual Report 2007-08
Note 15. Property, plant and equipment
Classification by ‘Transportation and Communications’ purpose group – carrying amounts:
2008 $’000
2007 $’000
LAND AT FAIR VALUEAt valuation 2008 207,665 -
Land at acquisition - 55,643
At valuation 2007 - 58,975
At valuation 2006 - 893
At valuation 2005 - 47,252
Total land 207,665 162,763
BUILDINGS AT FAIR VALUEAt valuation 2007 2,925 2,925
At valuation 2005 4,911 4,168
Less: accumulated depreciation (689) (391)
Total buildings 7,147 6,702
INFRASTRUCTURE AT FAIR VALUEInfrastructure – at acquisition 32,458 31,897
Infrastructure – at independent valuation 2005 10,825 4,003
Less: accumulated depreciation (1,586) (351)
Total infrastructure 41,697 35,549
PLANT AND EQUIPMENT AT COSTPlant at cost 10,107 9,037
Less: accumulated depreciation (6,352) (5,681)
Total plant and equipment 3,755 3,356
BUILDING LEASEHOLD AT COSTLeasehold improvement office assets – at cost 30,468 18,520
Less: accumulated amortisation (3,788) (17,342)
Total buildings leasehold 26,680 1,178
LEASED VEHICLES AT COSTVehicles – at cost 3,722 3,340
Less: accumulated amortisation (834) (648)
Total leased vehicles 2,888 2,692
PROPERTY UNDER CONSTRUCTION AT COSTBuildings - 37,393
Infrastructure 163,863 56,834
Building leasehold improvements 6,382 15,680
Total property under construction 170,245 109,907
Net carrying amount 460,077 322,147
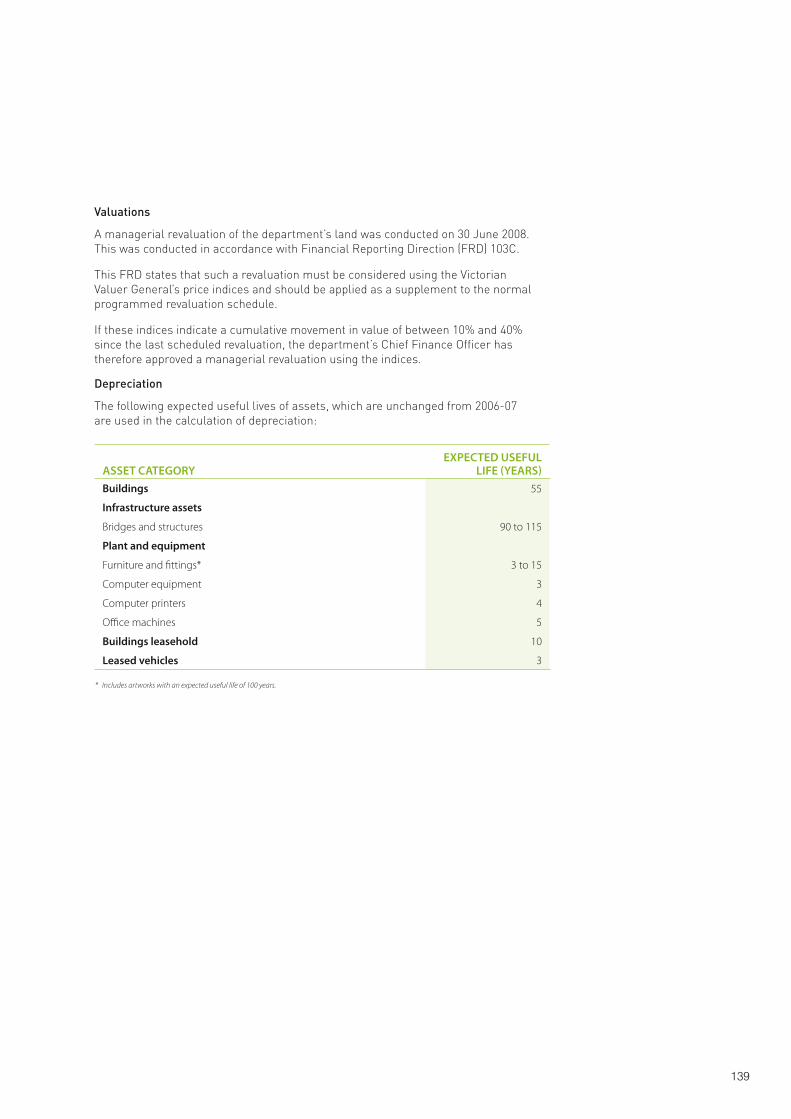
139
Valuations
A managerial revaluation of the department’s land was conducted on 30 June 2008. This was conducted in accordance with Financial Reporting Direction (FRD) 103C.
This FRD states that such a revaluation must be considered using the Victorian Valuer General’s price indices and should be applied as a supplement to the normal programmed revaluation schedule.
If these indices indicate a cumulative movement in value of between 10% and 40% since the last scheduled revaluation, the department’s Chief Finance Officer has therefore approved a managerial revaluation using the indices.
Depreciation
The following expected useful lives of assets, which are unchanged from 2006-07 are used in the calculation of depreciation:
ASSET CATEGORYEXPECTED USEFUL
LIFE (YEARS)Buildings 55
Infrastructure assets
Bridges and structures 90 to 115
Plant and equipment
Furniture and fittings* 3 to 15
Computer equipment 3
Computer printers 4
Office machines 5
Buildings leasehold 10
Leased vehicles 3
* Includes artworks with an expected useful life of 100 years.
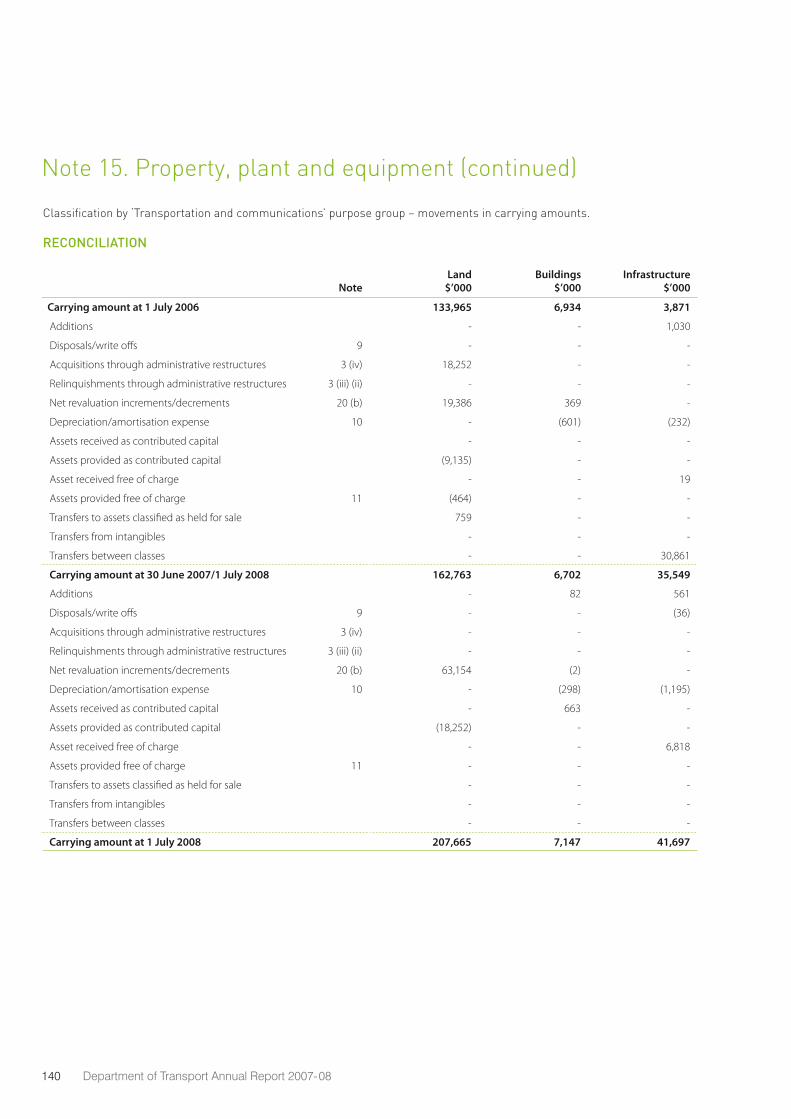
140 Department of Transport Annual Report 2007-08
Classification by ‘Transportation and communications’ purpose group – movements in carrying amounts.
RECONCILIATION
NoteLand
$’000Buildings
$’000Infrastructure
$’000
Plant and equipment
$’000
Building leasehold
$’000
Leased equipment
$’000
Leased vehicles
$’000
Property under construction
$’000Total
$’000
Carrying amount at 1 July 2006 133,965 6,934 3,871 9,982 4,091 8,076 2,782 49,511 219,212
Additions - - 1,030 3,554 902 1 1,463 49,902 56,852
Disposals/write offs 9 - - - (176) (12) - (715) (5) (908)
Acquisitions through administrative restructures 3 (iv) 18,252 - - - - - - 31,514 49,766
Relinquishments through administrative restructures 3 (iii) (ii) - - - (6,317) (270) - (300) - (6,887)
Net revaluation increments/decrements 20 (b) 19,386 369 - - - - - - 19,755
Depreciation/amortisation expense 10 - (601) (232) (3,618) (3,490) (8,077) (510) - (16,528)
Assets received as contributed capital - - - - - - - 9,990 9,990
Assets provided as contributed capital (9,135) - - - - - - - (9,135)
Asset received free of charge - - 19 - - - 82 - 101
Assets provided free of charge 11 (464) - - (219) - - (110) (144) (937)
Transfers to assets classified as held for sale 759 - - - - - - - 759
Transfers from intangibles - - - 107 - - - - 107
Transfers between classes - - 30,861 43 (43) - - (30,861) -
Carrying amount at 30 June 2007/1 July 2008 162,763 6,702 35,549 3,356 1,178 - 2,692 109,907 322,147
Additions - 82 561 1,896 1,746 - 1,803 124,392 130,480
Disposals/write offs 9 - - (36) (47) (521) - (967) - (1,571)
Acquisitions through administrative restructures 3 (iv) - - - - - - - - -
Relinquishments through administrative restructures 3 (iii) (ii) - - - - - - - - -
Net revaluation increments/decrements 20 (b) 63,154 (2) - - - - - - 63,152
Depreciation/amortisation expense 10 - (298) (1,195) (1,450) (1,316) - (592) - (4,851)
Assets received as contributed capital - 663 - - - - - - 663
Assets provided as contributed capital (18,252) - - - - - - (38,461) (56,713)
Asset received free of charge - - 6,818 - - - 100 - 6,918
Assets provided free of charge 11 - - - - - - (148) - (148)
Transfers to assets classified as held for sale - - - - - - - - -
Transfers from intangibles - - - - - - - - -
Transfers between classes - - - - 25,593 - - (25,593) -
Carrying amount at 1 July 2008 207,665 7,147 41,697 3,755 26,680 - 2,888 170,245 460,077
Note 15. Property, plant and equipment (continued)
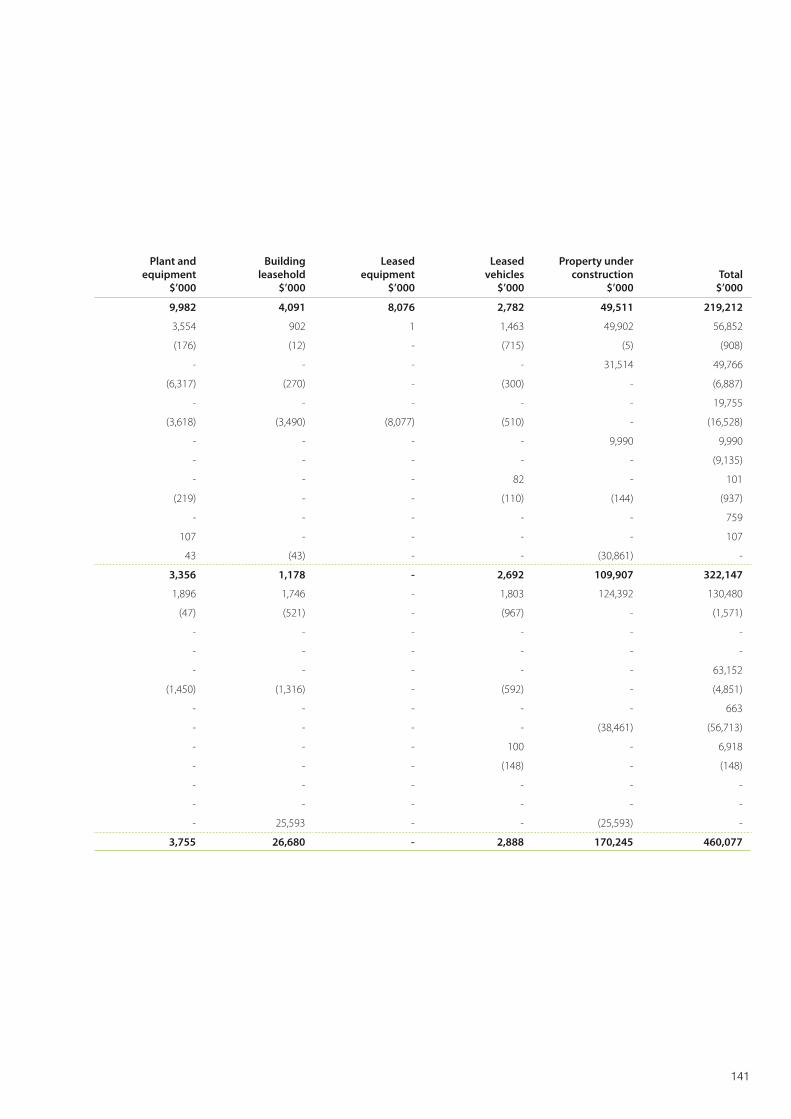
141
Classification by ‘Transportation and communications’ purpose group – movements in carrying amounts.
RECONCILIATION
NoteLand
$’000Buildings
$’000Infrastructure
$’000
Plant and equipment
$’000
Building leasehold
$’000
Leased equipment
$’000
Leased vehicles
$’000
Property under construction
$’000Total
$’000
Carrying amount at 1 July 2006 133,965 6,934 3,871 9,982 4,091 8,076 2,782 49,511 219,212
Additions - - 1,030 3,554 902 1 1,463 49,902 56,852
Disposals/write offs 9 - - - (176) (12) - (715) (5) (908)
Acquisitions through administrative restructures 3 (iv) 18,252 - - - - - - 31,514 49,766
Relinquishments through administrative restructures 3 (iii) (ii) - - - (6,317) (270) - (300) - (6,887)
Net revaluation increments/decrements 20 (b) 19,386 369 - - - - - - 19,755
Depreciation/amortisation expense 10 - (601) (232) (3,618) (3,490) (8,077) (510) - (16,528)
Assets received as contributed capital - - - - - - - 9,990 9,990
Assets provided as contributed capital (9,135) - - - - - - - (9,135)
Asset received free of charge - - 19 - - - 82 - 101
Assets provided free of charge 11 (464) - - (219) - - (110) (144) (937)
Transfers to assets classified as held for sale 759 - - - - - - - 759
Transfers from intangibles - - - 107 - - - - 107
Transfers between classes - - 30,861 43 (43) - - (30,861) -
Carrying amount at 30 June 2007/1 July 2008 162,763 6,702 35,549 3,356 1,178 - 2,692 109,907 322,147
Additions - 82 561 1,896 1,746 - 1,803 124,392 130,480
Disposals/write offs 9 - - (36) (47) (521) - (967) - (1,571)
Acquisitions through administrative restructures 3 (iv) - - - - - - - - -
Relinquishments through administrative restructures 3 (iii) (ii) - - - - - - - - -
Net revaluation increments/decrements 20 (b) 63,154 (2) - - - - - - 63,152
Depreciation/amortisation expense 10 - (298) (1,195) (1,450) (1,316) - (592) - (4,851)
Assets received as contributed capital - 663 - - - - - - 663
Assets provided as contributed capital (18,252) - - - - - - (38,461) (56,713)
Asset received free of charge - - 6,818 - - - 100 - 6,918
Assets provided free of charge 11 - - - - - - (148) - (148)
Transfers to assets classified as held for sale - - - - - - - - -
Transfers from intangibles - - - - - - - - -
Transfers between classes - - - - 25,593 - - (25,593) -
Carrying amount at 1 July 2008 207,665 7,147 41,697 3,755 26,680 - 2,888 170,245 460,077
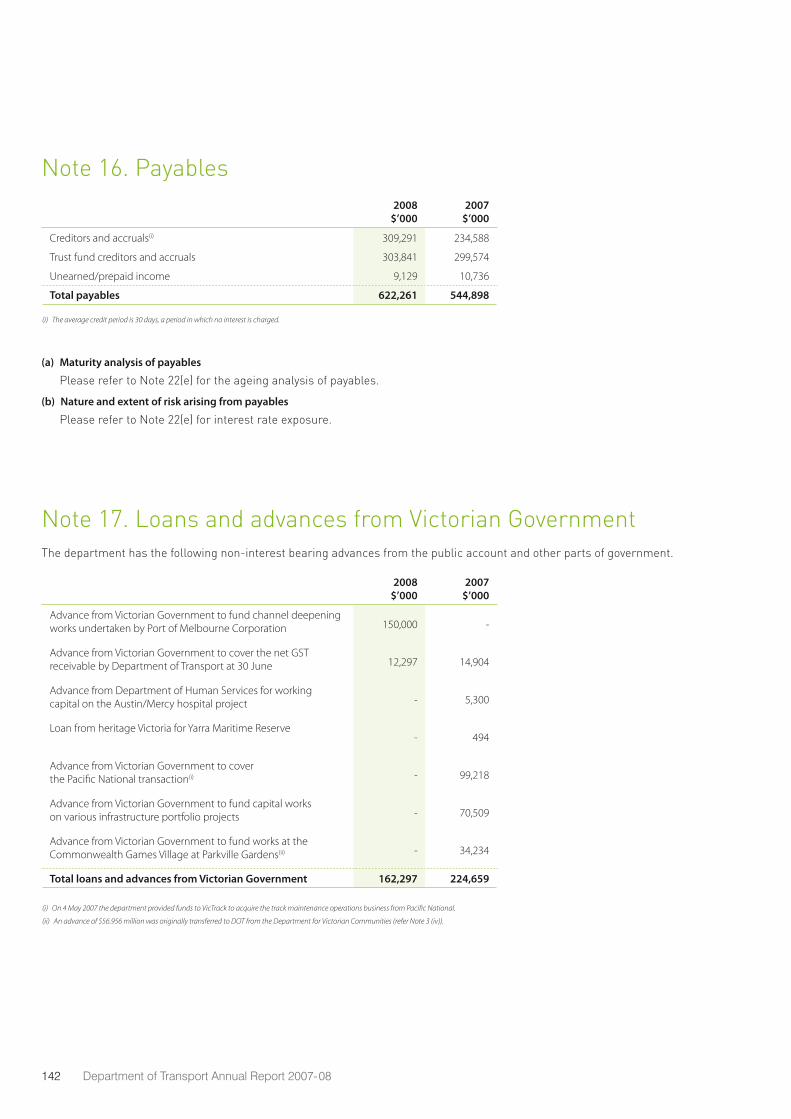
142 Department of Transport Annual Report 2007-08
Note 16. Payables 2008
$’0002007
$’000
Creditors and accruals(i) 309,291 234,588
Trust fund creditors and accruals 303,841 299,574
Unearned/prepaid income 9,129 10,736
Total payables 622,261 544,898
(i) The average credit period is 30 days, a period in which no interest is charged.
(a) Maturity analysis of payables
Please refer to Note 22(e) for the ageing analysis of payables.
(b) Nature and extent of risk arising from payables
Please refer to Note 22(e) for interest rate exposure.
Note 17. Loans and advances from Victorian Government
2008$’000
2007$’000
Advance from Victorian Government to fund channel deepening works undertaken by Port of Melbourne Corporation 150,000 -
Advance from Victorian Government to cover the net GST receivable by Department of Transport at 30 June 12,297 14,904
Advance from Department of Human Services for working capital on the Austin/Mercy hospital project - 5,300
Loan from heritage Victoria for Yarra Maritime Reserve - 494
Advance from Victorian Government to cover the Pacific National transaction(i) - 99,218
Advance from Victorian Government to fund capital works on various infrastructure portfolio projects - 70,509
Advance from Victorian Government to fund works at the Commonwealth Games Village at Parkville Gardens(ii) - 34,234
Total loans and advances from Victorian Government 162,297 224,659
(i) On 4 May 2007 the department provided funds to VicTrack to acquire the track maintenance operations business from Pacific National.
(ii) An advance of $56.956 million was originally transferred to DOT from the Department for Victorian Communities (refer Note 3 (iv)).
The department has the following non-interest bearing advances from the public account and other parts of government.
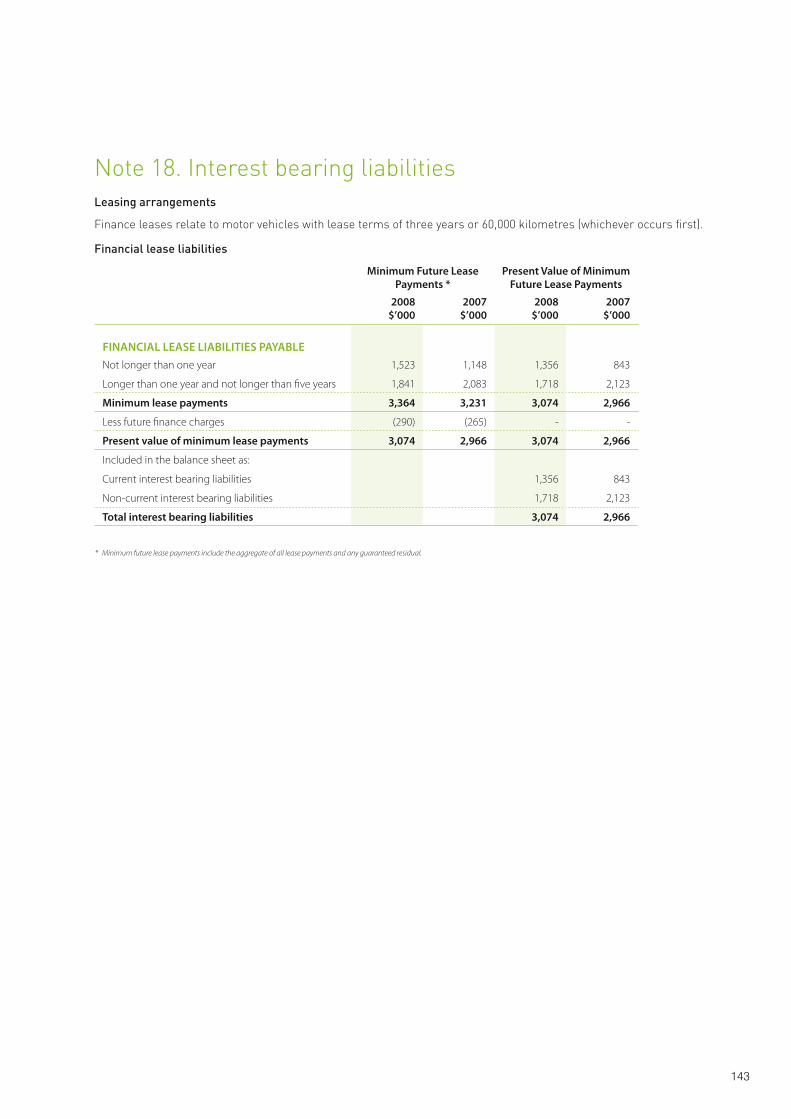
143
Note 18. Interest bearing liabilities
Minimum Future Lease Payments *
Present Value of Minimum Future Lease Payments
2008$’000
2007$’000
2008$’000
2007$’000
FINANCIAL LEASE LIABILITIES PAYABLENot longer than one year 1,523 1,148 1,356 843
Longer than one year and not longer than five years 1,841 2,083 1,718 2,123
Minimum lease payments 3,364 3,231 3,074 2,966
Less future finance charges (290) (265) - -
Present value of minimum lease payments 3,074 2,966 3,074 2,966
Included in the balance sheet as:
Current interest bearing liabilities 1,356 843
Non-current interest bearing liabilities 1,718 2,123
Total interest bearing liabilities 3,074 2,966
* Minimum future lease payments include the aggregate of all lease payments and any guaranteed residual.
Leasing arrangements
Finance leases relate to motor vehicles with lease terms of three years or 60,000 kilometres (whichever occurs first).
Financial lease liabilities
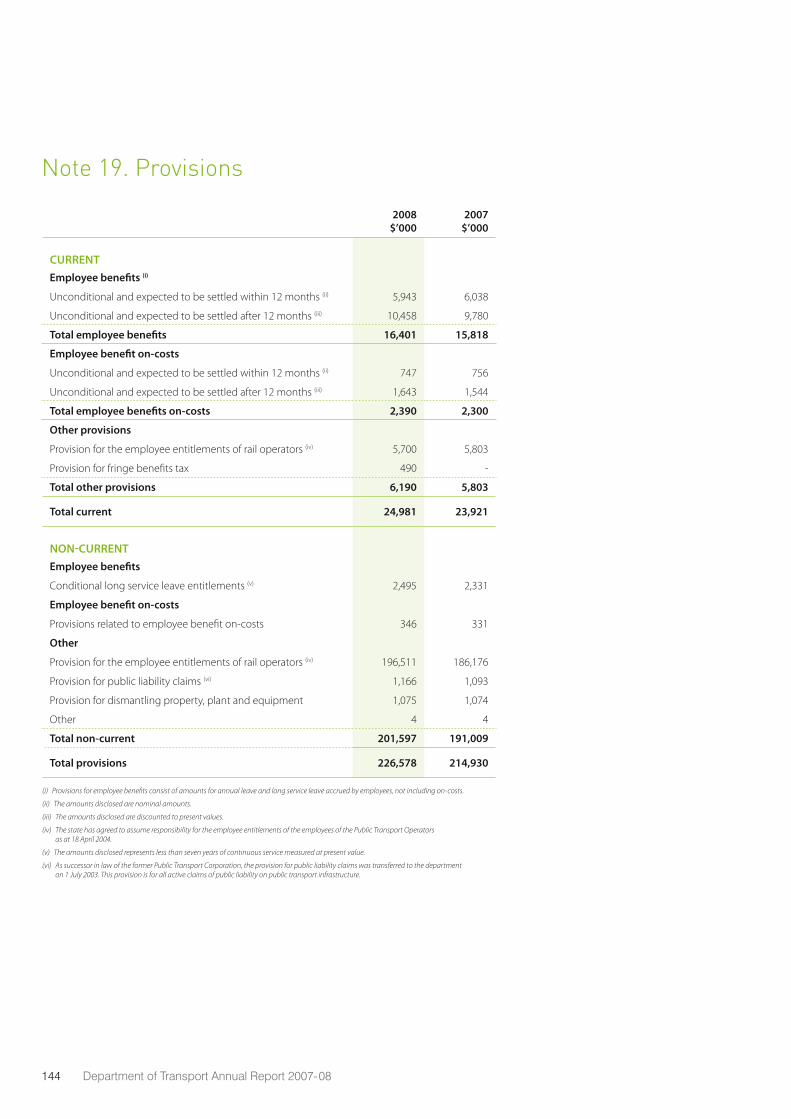
144 Department of Transport Annual Report 2007-08
Note 19. Provisions
2008$’000
2007$’000
CURRENTEmployee benefits (i)
Unconditional and expected to be settled within 12 months (ii) 5,943 6,038
Unconditional and expected to be settled after 12 months (iii) 10,458 9,780
Total employee benefits 16,401 15,818
Employee benefit on-costs
Unconditional and expected to be settled within 12 months (ii) 747 756
Unconditional and expected to be settled after 12 months (iii) 1,643 1,544
Total employee benefits on-costs 2,390 2,300
Other provisions
Provision for the employee entitlements of rail operators (iv) 5,700 5,803
Provision for fringe benefits tax 490 -
Total other provisions 6,190 5,803
Total current 24,981 23,921
NON-CURRENTEmployee benefits
Conditional long service leave entitlements (v) 2,495 2,331
Employee benefit on-costs
Provisions related to employee benefit on-costs 346 331
Other
Provision for the employee entitlements of rail operators (iv) 196,511 186,176
Provision for public liability claims (vi) 1,166 1,093
Provision for dismantling property, plant and equipment 1,075 1,074
Other 4 4
Total non-current 201,597 191,009
Total provisions 226,578 214,930
(i) Provisions for employee benefits consist of amounts for annual leave and long service leave accrued by employees, not including on-costs.
(ii) The amounts disclosed are nominal amounts.
(iii) The amounts disclosed are discounted to present values.
(iv) The state has agreed to assume responsibility for the employee entitlements of the employees of the Public Transport Operators as at 18 April 2004.
(v) The amounts disclosed represents less than seven years of continuous service measured at present value.
(vi) As successor in law of the former Public Transport Corporation, the provision for public liability claims was transferred to the department on 1 July 2003. This provision is for all active claims of public liability on public transport infrastructure.
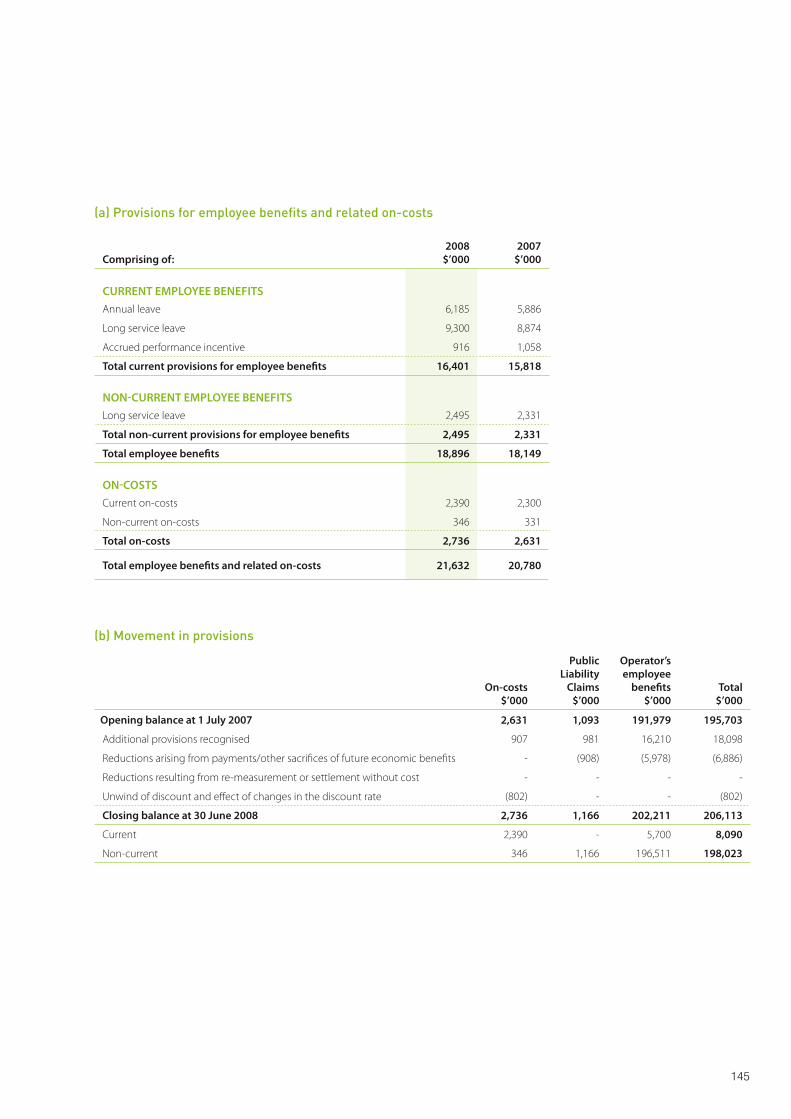
145
Comprising of:2008
$’0002007
$’000
CURRENT EMPLOYEE BENEFITSAnnual leave 6,185 5,886
Long service leave 9,300 8,874
Accrued performance incentive 916 1,058
Total current provisions for employee benefits 16,401 15,818
NON-CURRENT EMPLOYEE BENEFITSLong service leave 2,495 2,331
Total non-current provisions for employee benefits 2,495 2,331
Total employee benefits 18,896 18,149
ON-COSTSCurrent on-costs 2,390 2,300
Non-current on-costs 346 331
Total on-costs 2,736 2,631
Total employee benefits and related on-costs 21,632 20,780
(a) Provisions for employee benefits and related on-costs
On-costs$’000
Public Liability
Claims$’000
Operator’s employee
benefits$’000
Total$’000
Opening balance at 1 July 2007 2,631 1,093 191,979 195,703
Additional provisions recognised 907 981 16,210 18,098
Reductions arising from payments/other sacrifices of future economic benefits - (908) (5,978) (6,886)
Reductions resulting from re-measurement or settlement without cost - - - -
Unwind of discount and effect of changes in the discount rate (802) - - (802)
Closing balance at 30 June 2008 2,736 1,166 202,211 206,113
Current 2,390 - 5,700 8,090
Non-current 346 1,166 196,511 198,023
(b) Movement in provisions
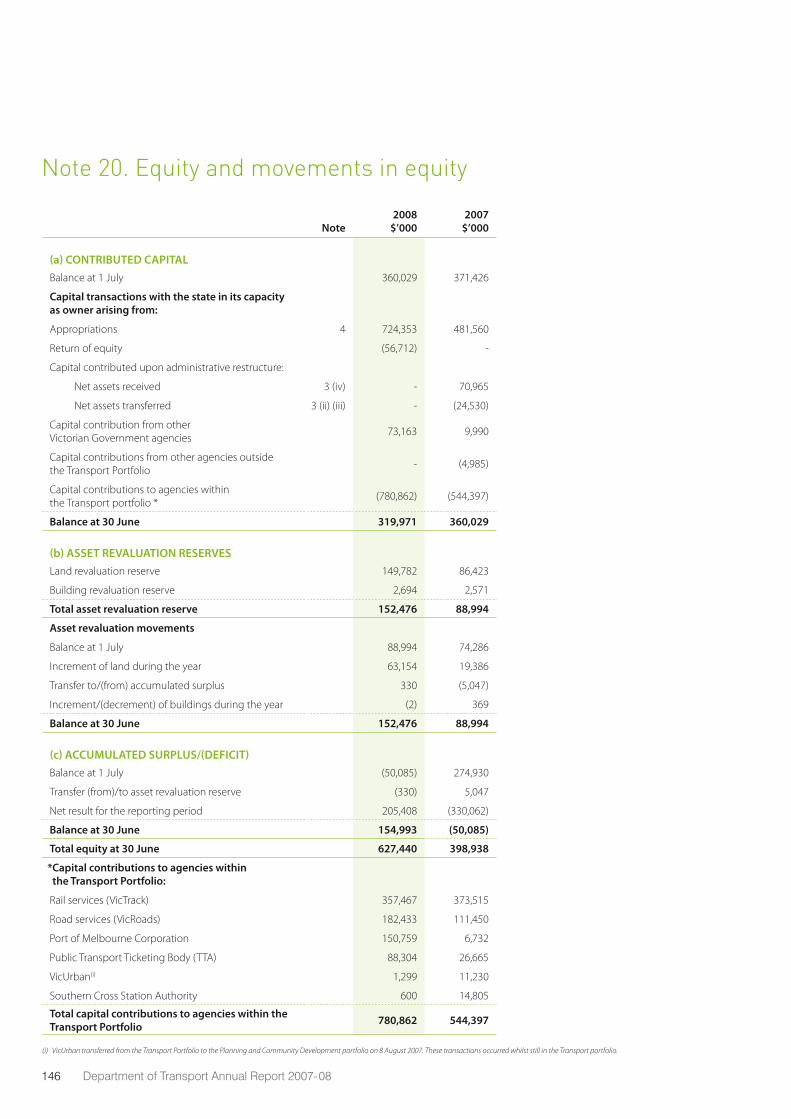
146 Department of Transport Annual Report 2007-08
Note 20. Equity and movements in equity
Note2008
$’0002007
$’000
(a) CONTRIBUTED CAPITALBalance at 1 July 360,029 371,426
Capital transactions with the state in its capacity as owner arising from:
Appropriations 4 724,353 481,560
Return of equity (56,712) -
Capital contributed upon administrative restructure:
Net assets received 3 (iv) - 70,965
Net assets transferred 3 (ii) (iii) - (24,530)
Capital contribution from other Victorian Government agencies
73,163 9,990
Capital contributions from other agencies outside the Transport Portfolio
- (4,985)
Capital contributions to agencies within the Transport portfolio *
(780,862) (544,397)
Balance at 30 June 319,971 360,029
(b) ASSET REVALUATION RESERVESLand revaluation reserve 149,782 86,423
Building revaluation reserve 2,694 2,571
Total asset revaluation reserve 152,476 88,994
Asset revaluation movements
Balance at 1 July 88,994 74,286
Increment of land during the year 63,154 19,386
Transfer to/(from) accumulated surplus 330 (5,047)
Increment/(decrement) of buildings during the year (2) 369
Balance at 30 June 152,476 88,994
(c) ACCUMULATED SURPLUS/(DEFICIT)Balance at 1 July (50,085) 274,930
Transfer (from)/to asset revaluation reserve (330) 5,047
Net result for the reporting period 205,408 (330,062)
Balance at 30 June 154,993 (50,085)
Total equity at 30 June 627,440 398,938
* Capital contributions to agencies within the Transport Portfolio:
Rail services (VicTrack) 357,467 373,515
Road services (VicRoads) 182,433 111,450
Port of Melbourne Corporation 150,759 6,732
Public Transport Ticketing Body (TTA) 88,304 26,665
VicUrban(i) 1,299 11,230
Southern Cross Station Authority 600 14,805
Total capital contributions to agencies within the Transport Portfolio 780,862 544,397
(i) VicUrban transferred from the Transport Portfolio to the Planning and Community Development portfolio on 8 August 2007. These transactions occurred whilst still in the Transport portfolio.
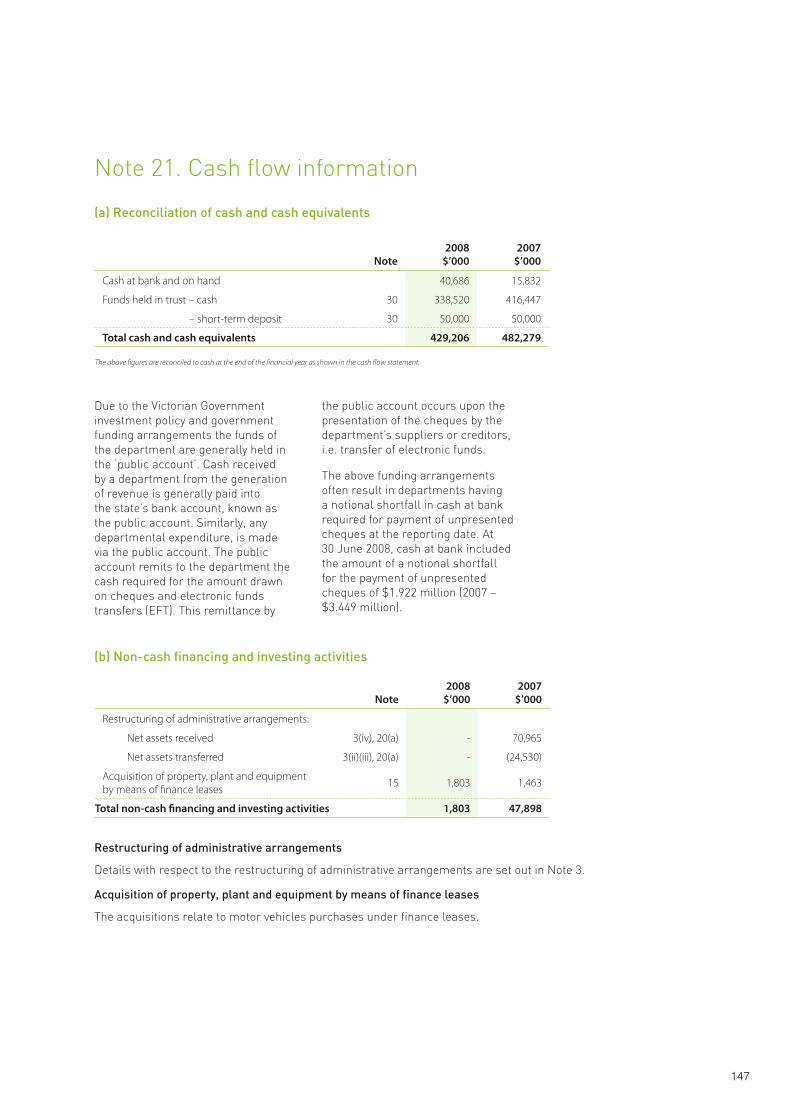
147
Note 21. Cash flow information
Due to the Victorian Government investment policy and government funding arrangements the funds of the department are generally held in the ‘public account’. Cash received by a department from the generation of revenue is generally paid into the state’s bank account, known as the public account. Similarly, any departmental expenditure, is made via the public account. The public account remits to the department the cash required for the amount drawn on cheques and electronic funds transfers (EFT). This remittance by
the public account occurs upon the presentation of the cheques by the department’s suppliers or creditors, i.e. transfer of electronic funds.
The above funding arrangements often result in departments having a notional shortfall in cash at bank required for payment of unpresented cheques at the reporting date. At 30 June 2008, cash at bank included the amount of a notional shortfall for the payment of unpresented cheques of $1.922 million (2007 – $3.449 million).
(a) Reconciliation of cash and cash equivalents
Note2008
$’000 2007
$’000
Cash at bank and on hand 40,686 15,832
Funds held in trust – cash 30 338,520 416,447
– short-term deposit 30 50,000 50,000
Total cash and cash equivalents 429,206 482,279
The above figures are reconciled to cash at the end of the financial year as shown in the cash flow statement.
Note2008
$’000 2007
$’000
Restructuring of administrative arrangements:
Net assets received 3(iv), 20(a) - 70,965
Net assets transferred 3(ii)(iii), 20(a) - (24,530)
Acquisition of property, plant and equipment by means of finance leases
15 1,803 1,463
Total non-cash financing and investing activities 1,803 47,898
Restructuring of administrative arrangements
Details with respect to the restructuring of administrative arrangements are set out in Note 3.
Acquisition of property, plant and equipment by means of finance leases
The acquisitions relate to motor vehicles purchases under finance leases.
(b) Non-cash financing and investing activities
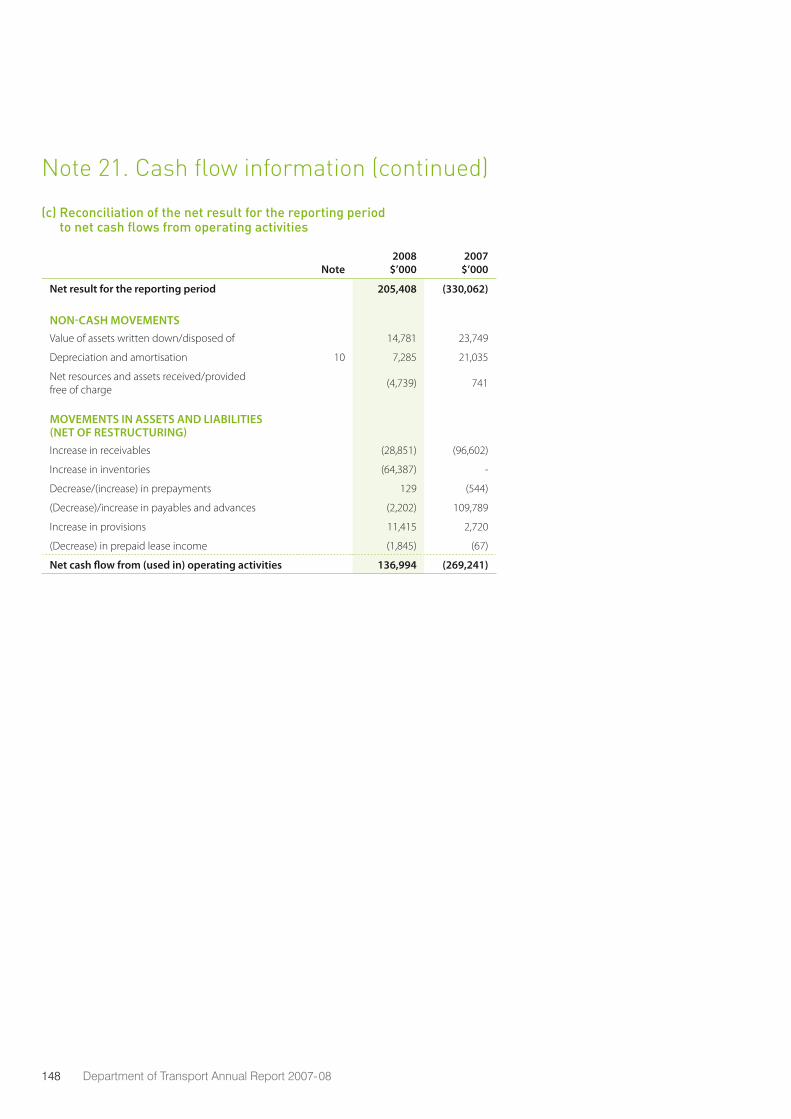
148 Department of Transport Annual Report 2007-08
Note2008
$’000 2007
$’000
Net result for the reporting period 205,408 (330,062)
NON-CASH MOVEMENTSValue of assets written down/disposed of 14,781 23,749
Depreciation and amortisation 10 7,285 21,035
Net resources and assets received/provided free of charge
(4,739) 741
MOVEMENTS IN ASSETS AND LIABILITIES (NET OF RESTRUCTURING)Increase in receivables (28,851) (96,602)
Increase in inventories (64,387) -
Decrease/(increase) in prepayments 129 (544)
(Decrease)/increase in payables and advances (2,202) 109,789
Increase in provisions 11,415 2,720
(Decrease) in prepaid lease income (1,845) (67)
Net cash flow from (used in) operating activities 136,994 (269,241)
(c) Reconciliation of the net result for the reporting period to net cash flows from operating activities
Note 21. Cash flow information (continued)
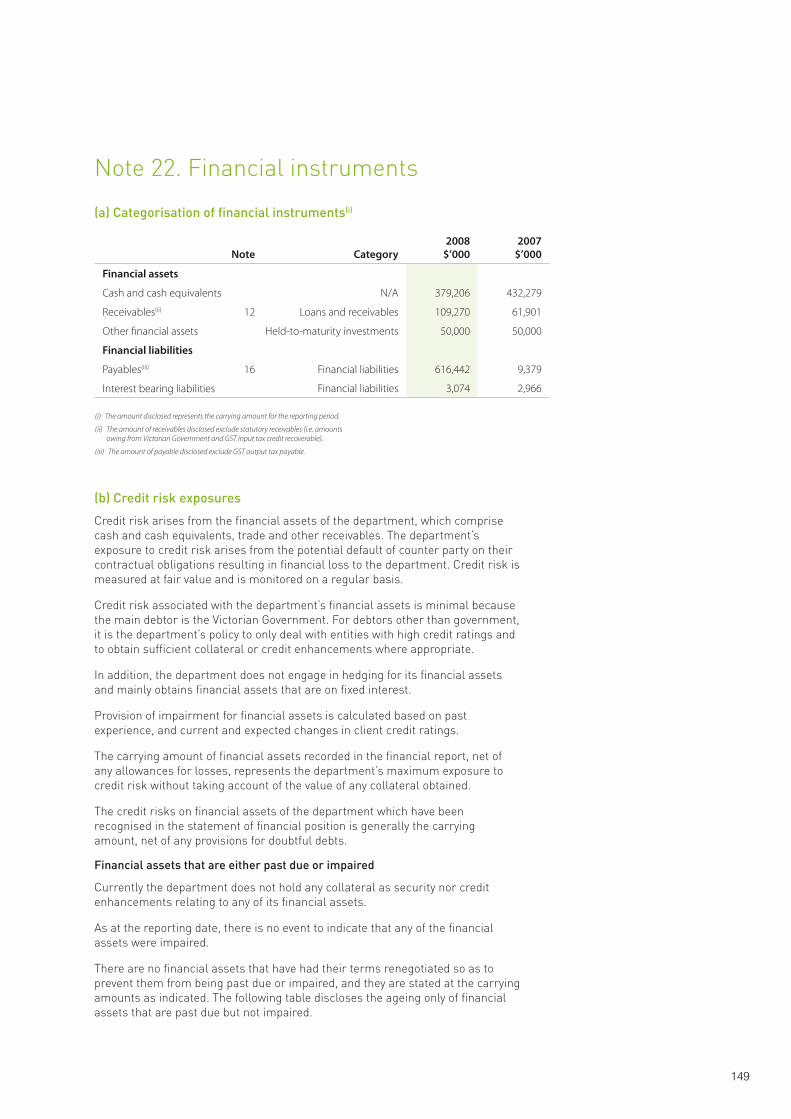
149
Note 22. Financial instruments
Note Category2008
$’0002007
$’000
Financial assets
Cash and cash equivalents N/A 379,206 432,279
Receivables(ii) 12 Loans and receivables 109,270 61,901
Other financial assets Held-to-maturity investments 50,000 50,000
Financial liabilities
Payables(iii) 16 Financial liabilities 616,442 9,379
Interest bearing liabilities Financial liabilities 3,074 2,966
(i) The amount disclosed represents the carrying amount for the reporting period.
(ii) The amount of receivables disclosed exclude statutory receivables (i.e. amounts owing from Victorian Government and GST input tax credit recoverable).
(iii) The amount of payable disclosed exclude GST output tax payable.
(a) Categorisation of financial instruments(i)
(b) Credit risk exposures
Credit risk arises from the financial assets of the department, which comprise cash and cash equivalents, trade and other receivables. The department’s exposure to credit risk arises from the potential default of counter party on their contractual obligations resulting in financial loss to the department. Credit risk is measured at fair value and is monitored on a regular basis.
Credit risk associated with the department’s financial assets is minimal because the main debtor is the Victorian Government. For debtors other than government, it is the department’s policy to only deal with entities with high credit ratings and to obtain sufficient collateral or credit enhancements where appropriate.
In addition, the department does not engage in hedging for its financial assets and mainly obtains financial assets that are on fixed interest.
Provision of impairment for financial assets is calculated based on past experience, and current and expected changes in client credit ratings.
The carrying amount of financial assets recorded in the financial report, net of any allowances for losses, represents the department’s maximum exposure to credit risk without taking account of the value of any collateral obtained.
The credit risks on financial assets of the department which have been recognised in the statement of financial position is generally the carrying amount, net of any provisions for doubtful debts.
Financial assets that are either past due or impaired
Currently the department does not hold any collateral as security nor credit enhancements relating to any of its financial assets.
As at the reporting date, there is no event to indicate that any of the financial assets were impaired.
There are no financial assets that have had their terms renegotiated so as to prevent them from being past due or impaired, and they are stated at the carrying amounts as indicated. The following table discloses the ageing only of financial assets that are past due but not impaired.
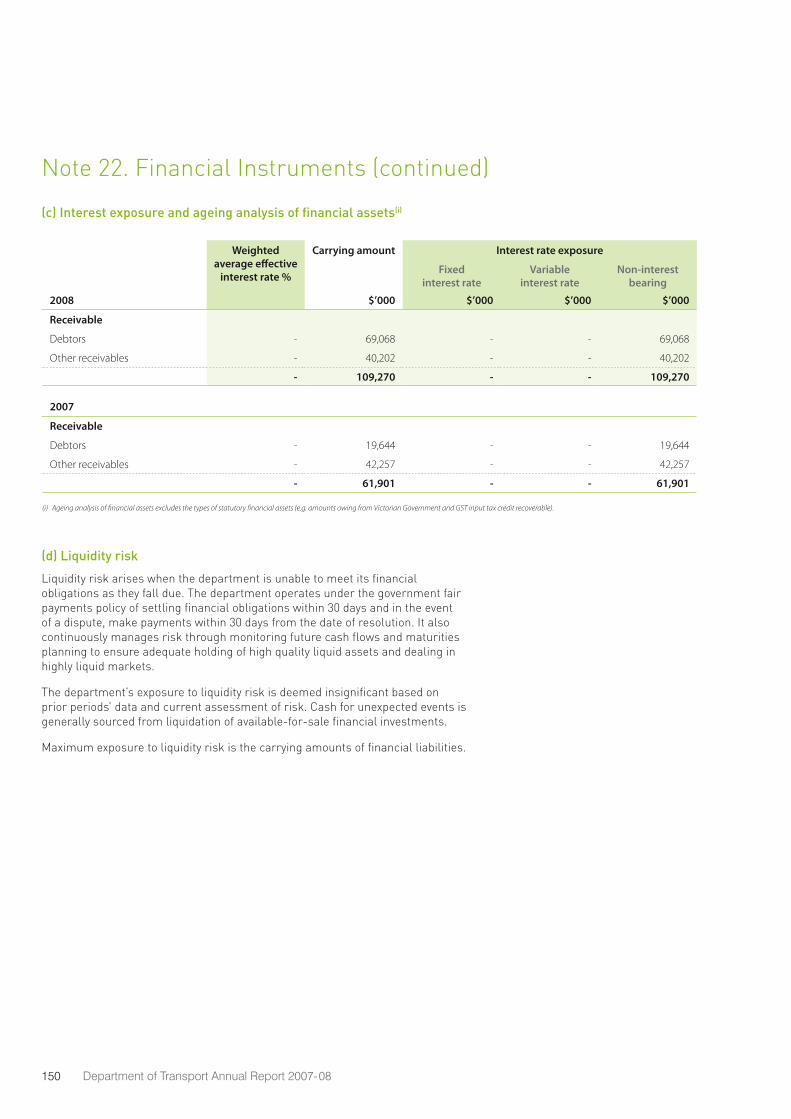
150 Department of Transport Annual Report 2007-08
Weighted average effective
interest rate %
Carrying amount Interest rate exposure
Not past due and not impaired
Past due but not impaired
Impaired financial assets
Fixed interest rate
Variable interest rate
Non-interest bearing Less than 1
month 1 - 3 months 3 months - 1 year 1 - 5 years2008 $’000 $’000 $’000 $’000 $’000
Receivable
Debtors - 69,068 - - 69,068 52,104 1,032 6,389 9,177 366 -
Other receivables - 40,202 - - 40,202 40,202 - - - - -
- 109,270 - - 109,270 92,306 1,032 6,389 9,177 366 -
2007
Receivable
Debtors - 19,644 - - 19,644 18,599 355 293 391 6 -
Other receivables - 42,257 - - 42,257 42,257 - - - - -
- 61,901 - - 61,901 60,856 355 293 391 6 -
(i) Ageing analysis of financial assets excludes the types of statutory financial assets (e.g. amounts owing from Victorian Government and GST input tax credit recoverable).
(c) Interest exposure and ageing analysis of financial assets(i)
(d) Liquidity risk
Liquidity risk arises when the department is unable to meet its financial obligations as they fall due. The department operates under the government fair payments policy of settling financial obligations within 30 days and in the event of a dispute, make payments within 30 days from the date of resolution. It also continuously manages risk through monitoring future cash flows and maturities planning to ensure adequate holding of high quality liquid assets and dealing in highly liquid markets.
The department’s exposure to liquidity risk is deemed insignificant based on prior periods’ data and current assessment of risk. Cash for unexpected events is generally sourced from liquidation of available-for-sale financial investments.
Maximum exposure to liquidity risk is the carrying amounts of financial liabilities.
Note 22. Financial Instruments (continued)

151
Weighted average effective
interest rate %
Carrying amount Interest rate exposure
Not past due and not impaired
Past due but not impaired
Impaired financial assets
Fixed interest rate
Variable interest rate
Non-interest bearing Less than 1
month 1 - 3 months 3 months - 1 year 1 - 5 years2008 $’000 $’000 $’000 $’000 $’000
Receivable
Debtors - 69,068 - - 69,068 52,104 1,032 6,389 9,177 366 -
Other receivables - 40,202 - - 40,202 40,202 - - - - -
- 109,270 - - 109,270 92,306 1,032 6,389 9,177 366 -
2007
Receivable
Debtors - 19,644 - - 19,644 18,599 355 293 391 6 -
Other receivables - 42,257 - - 42,257 42,257 - - - - -
- 61,901 - - 61,901 60,856 355 293 391 6 -
(i) Ageing analysis of financial assets excludes the types of statutory financial assets (e.g. amounts owing from Victorian Government and GST input tax credit recoverable).
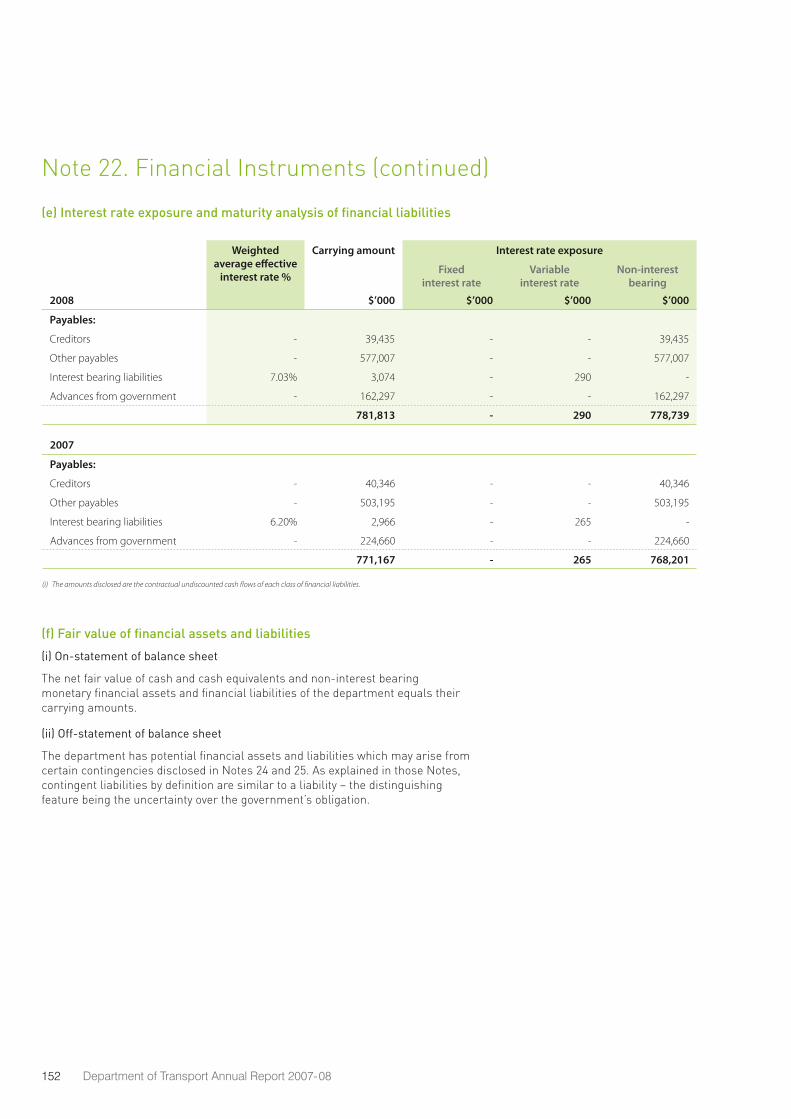
152 Department of Transport Annual Report 2007-08
Weighted average effective
interest rate %
Carrying amount Interest rate exposure Maturity dates(i)
Fixed interest rate
Variable interest rate
Non-interest bearing Nominal amount
$’000Less than 1
month 1 - 3 months 3 months - 1 year 1 - 5 years2008 $’000 $’000 $’000 $’000
Payables:
Creditors - 39,435 - - 39,435 39,435 36,721 11 2,676 27
Other payables - 577,007 - - 577,007 577,007 577,007 - - -
Interest bearing liabilities 7.03% 3,074 - 290 - 3,364 403 150 994 1,817
Advances from government - 162,297 - - 162,297 162,297 162,297 - - -
781,813 - 290 778,739 782,103 776,428 161 3,670 1,844
2007
Payables:
Creditors - 40,346 - - 40,346 40,346 40,323 25 - (2)
Other payables - 503,195 - - 503,195 503,195 503,195 - - -
Interest bearing liabilities 6.20% 2,966 - 265 - 3,231 405 112 695 2,019
Advances from government - 224,660 - - 224,660 224,660 - - 62,363 162,297
771,167 - 265 768,201 771,432 543,923 137 63,058 164,313
(i) The amounts disclosed are the contractual undiscounted cash flows of each class of financial liabilities.
(e) Interest rate exposure and maturity analysis of financial liabilities
(f) Fair value of financial assets and liabilities
(i) On-statement of balance sheet
The net fair value of cash and cash equivalents and non-interest bearing monetary financial assets and financial liabilities of the department equals their carrying amounts.
(ii) Off-statement of balance sheet
The department has potential financial assets and liabilities which may arise from certain contingencies disclosed in Notes 24 and 25. As explained in those Notes, contingent liabilities by definition are similar to a liability – the distinguishing feature being the uncertainty over the government’s obligation.
Note 22. Financial Instruments (continued)
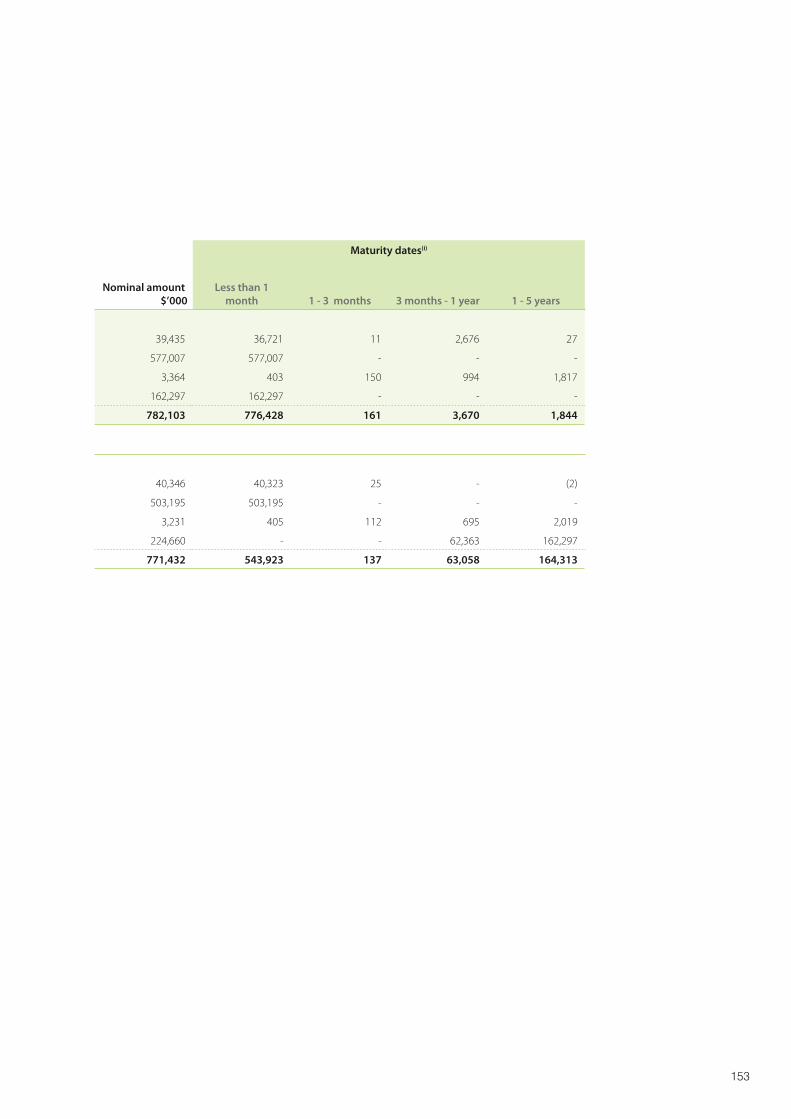
153
Weighted average effective
interest rate %
Carrying amount Interest rate exposure Maturity dates(i)
Fixed interest rate
Variable interest rate
Non-interest bearing Nominal amount
$’000Less than 1
month 1 - 3 months 3 months - 1 year 1 - 5 years2008 $’000 $’000 $’000 $’000
Payables:
Creditors - 39,435 - - 39,435 39,435 36,721 11 2,676 27
Other payables - 577,007 - - 577,007 577,007 577,007 - - -
Interest bearing liabilities 7.03% 3,074 - 290 - 3,364 403 150 994 1,817
Advances from government - 162,297 - - 162,297 162,297 162,297 - - -
781,813 - 290 778,739 782,103 776,428 161 3,670 1,844
2007
Payables:
Creditors - 40,346 - - 40,346 40,346 40,323 25 - (2)
Other payables - 503,195 - - 503,195 503,195 503,195 - - -
Interest bearing liabilities 6.20% 2,966 - 265 - 3,231 405 112 695 2,019
Advances from government - 224,660 - - 224,660 224,660 - - 62,363 162,297
771,167 - 265 768,201 771,432 543,923 137 63,058 164,313
(i) The amounts disclosed are the contractual undiscounted cash flows of each class of financial liabilities.
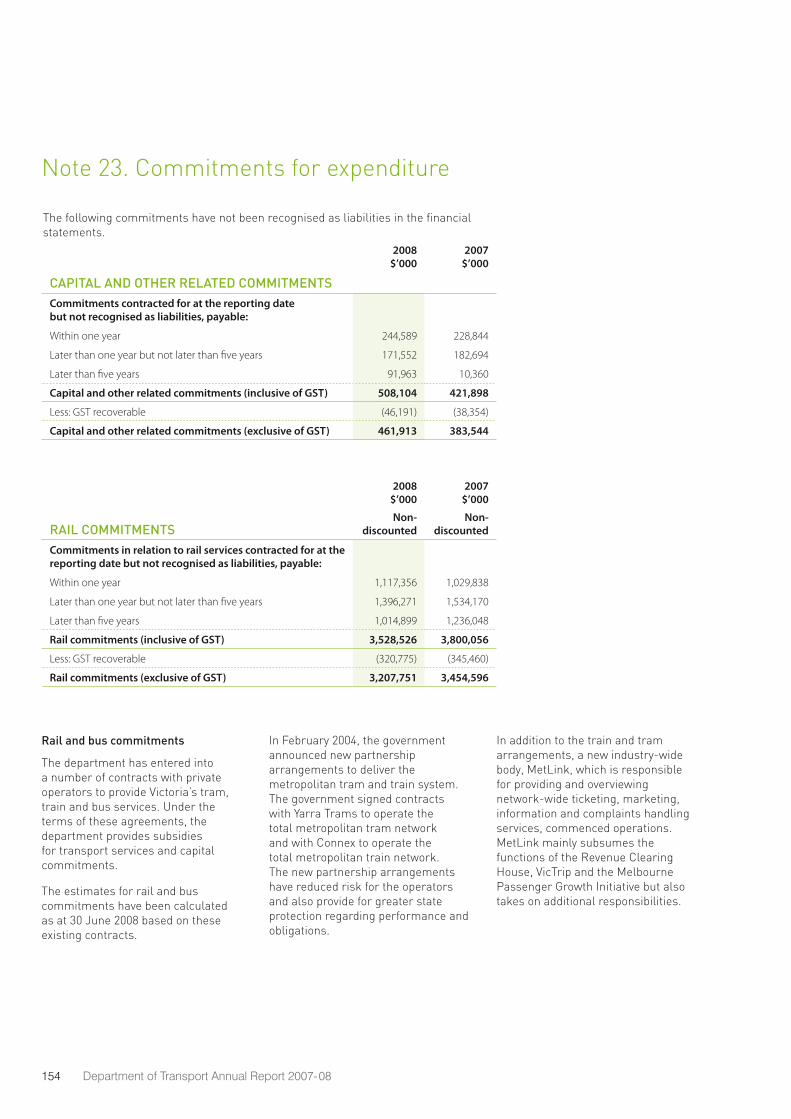
154 Department of Transport Annual Report 2007-08
The following commitments have not been recognised as liabilities in the financial statements.
2008$’000
2007$’000
CAPITAL AND OTHER RELATED COMMITMENTSCommitments contracted for at the reporting date but not recognised as liabilities, payable:
Within one year 244,589 228,844
Later than one year but not later than five years 171,552 182,694
Later than five years 91,963 10,360
Capital and other related commitments (inclusive of GST) 508,104 421,898
Less: GST recoverable (46,191) (38,354)
Capital and other related commitments (exclusive of GST) 461,913 383,544
2008$’000
2007$’000
RAIL COMMITMENTSNon-
discountedNon-
discounted
Commitments in relation to rail services contracted for at the reporting date but not recognised as liabilities, payable:
Within one year 1,117,356 1,029,838
Later than one year but not later than five years 1,396,271 1,534,170
Later than five years 1,014,899 1,236,048
Rail commitments (inclusive of GST) 3,528,526 3,800,056
Less: GST recoverable (320,775) (345,460)
Rail commitments (exclusive of GST) 3,207,751 3,454,596
Note 23. Commitments for expenditure
Rail and bus commitments
The department has entered into a number of contracts with private operators to provide Victoria’s tram, train and bus services. Under the terms of these agreements, the department provides subsidies for transport services and capital commitments.
The estimates for rail and bus commitments have been calculated as at 30 June 2008 based on these existing contracts.
In February 2004, the government announced new partnership arrangements to deliver the metropolitan tram and train system. The government signed contracts with Yarra Trams to operate the total metropolitan tram network and with Connex to operate the total metropolitan train network. The new partnership arrangements have reduced risk for the operators and also provide for greater state protection regarding performance and obligations.
In addition to the train and tram arrangements, a new industry-wide body, MetLink, which is responsible for providing and overviewing network-wide ticketing, marketing, information and complaints handling services, commenced operations. MetLink mainly subsumes the functions of the Revenue Clearing House, VicTrip and the Melbourne Passenger Growth Initiative but also takes on additional responsibilities.
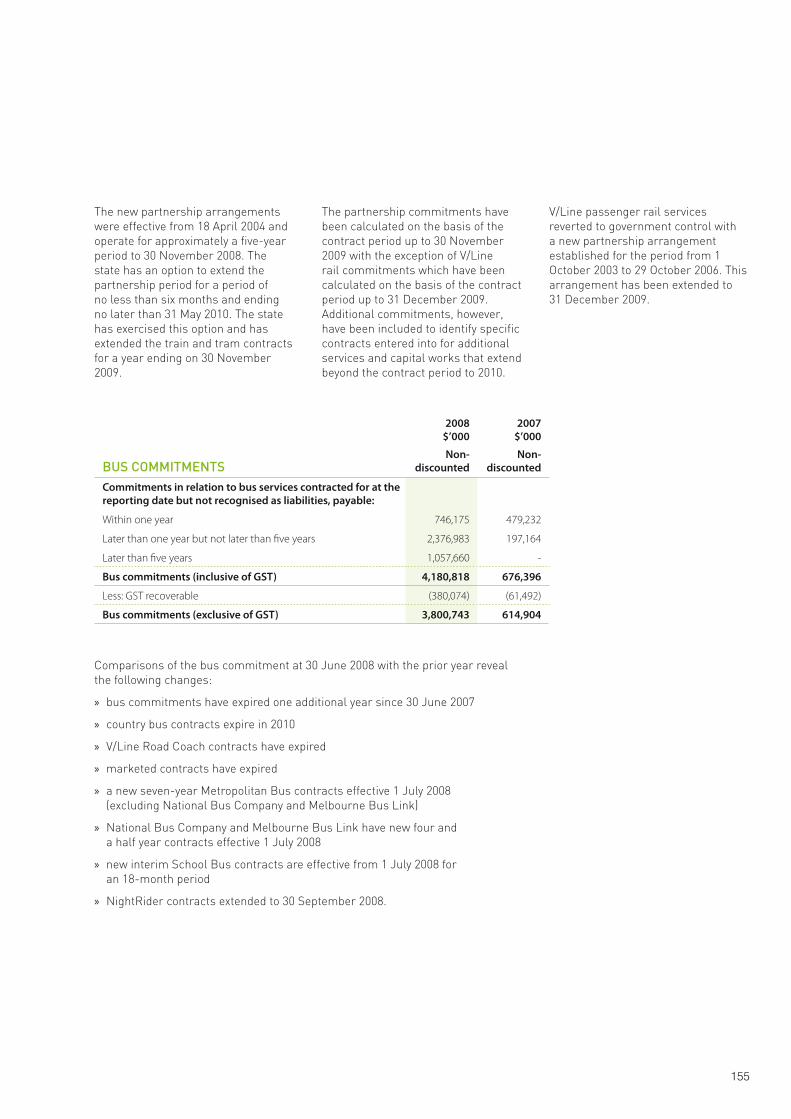
155
2008$’000
2007$’000
BUS COMMITMENTSNon-
discountedNon-
discounted
Commitments in relation to bus services contracted for at the reporting date but not recognised as liabilities, payable:
Within one year 746,175 479,232
Later than one year but not later than five years 2,376,983 197,164
Later than five years 1,057,660 -
Bus commitments (inclusive of GST) 4,180,818 676,396
Less: GST recoverable (380,074) (61,492)
Bus commitments (exclusive of GST) 3,800,743 614,904
Comparisons of the bus commitment at 30 June 2008 with the prior year reveal the following changes:
bus commitments have expired one additional year since 30 June 2007 »
country bus contracts expire in 2010 »
V/Line Road Coach contracts have expired »
marketed contracts have expired »
a new seven-year Metropolitan Bus contracts effective 1 July 2008 »(excluding National Bus Company and Melbourne Bus Link)
National Bus Company and Melbourne Bus Link have new four and »a half year contracts effective 1 July 2008
new interim School Bus contracts are effective from 1 July 2008 for »an 18-month period
NightRider contracts extended to 30 September 2008. »
The new partnership arrangements were effective from 18 April 2004 and operate for approximately a five-year period to 30 November 2008. The state has an option to extend the partnership period for a period of no less than six months and ending no later than 31 May 2010. The state has exercised this option and has extended the train and tram contracts for a year ending on 30 November 2009.
The partnership commitments have been calculated on the basis of the contract period up to 30 November 2009 with the exception of V/Line rail commitments which have been calculated on the basis of the contract period up to 31 December 2009. Additional commitments, however, have been included to identify specific contracts entered into for additional services and capital works that extend beyond the contract period to 2010.
V/Line passenger rail services reverted to government control with a new partnership arrangement established for the period from 1 October 2003 to 29 October 2006. This arrangement has been extended to 31 December 2009.
156 Department of Transport Annual Report 2007-08
LEASES2008
$’0002007
$’000
Commitments for minimum lease payments in relation to non-cancellable leases are payable as follows:
Within one year 17,786 20,669
Later than one year but not later than five years 69,326 70,264
Later than five years 165,540 180,657
Leases commitments (inclusive of GST) 252,652 271,590
Less: GST recoverable (22,968) (24,690)
Leases commitments (exclusive of GST) 229,684 246,900
Future minimum lease payments expected to be received in relation to non-cancellable sub-leases of operating leases
- -
Financial lease liabilities are disclosed in Note 19 to the financial statements.
OUTSOURCING COMMITMENTS2008
$’0002007
$’000
Commitments under outsourcing contracts at the reporting date but not recognised as liabilities, payable:
Within one year - 523
Later than one year but not later than five years - -
Later than five years - -
Outstanding commitments (inclusive of GST) - 523
Less: GST recoverable (48)
Outstanding commitments (exclusive of GST) - 475
Note 24. Contingent assets
Contingent assets arise from guarantees, indemnities and other forms of support provided to government departments and from legal disputes and other claims by government departments arising from a past event. Contingent assets by definition are similar to an asset – the distinguishing feature being the uncertainty over the government’s entitlement.
Contingent assets arising from litigation
The department has initiated proceedings to recover clean-up costs associated with marine pollution incidents from various entities.
Note 23. Commitments for expenditure (continued)
157
Note 25. Contingent liabilities
Contingent liabilities arise from guarantees, indemnities and other forms of support provided by the government and from legal disputes and other claims against the government arising from a past event. Contingent liabilities by definition are similar to a liability – the distinguishing feature being the uncertainty over the government’s obligation.
Public transport rail partnership agreements
The Director of Public Transport, on behalf of the Crown, entered into new contractual arrangements to operate rail transport services in the state operative from 18 April 2004. The following summarises the major contingent liabilities arising from those arrangements.
Contingent liabilities on early termination or expiry of partnership agreement
Partnership assets
To maintain continuity of services, the Director, at early termination or expiry of the partnership arrangements, will for partnership assets – either purchase the assets or have the assets transferred to the successor.
Unfunded superannuation
At the early termination or expiry of the contract, the Director will assume any unfunded superannuation amounts (apart from contributions the operator is required to pay over the contract term) to the extent that the state becomes the successor operator.
Contingent liabilities arising from National Express receivership
In December 2002, the government appointed receivers and managers to the National Express train and tram partnerships, in order to protect government interest, ensure continuation of services up to the
commencement of new partnership arrangements and deal with any subsequent termination issues.
The Treasurer, under the Receivership Deed of Indemnity, has agreed to indemnify the receivers for debts properly incurred by them in the course of receivership. The Treasurer has also agreed to remunerate the receivers in accordance with the rates set out in the deed.
On 1 October 2003, V/Line Passenger Pty Ltd, a company under a Deed of Company Arrangement, was purchased by V/Line Passenger Corporation, a statutory authority and has reverted to government ownership.
Contingent liabilities arising from GST
The department’s eligibility to claim input tax credits for payment of certain transport related subsidies is currently under review by the Australian Tax Office (ATO). This may result in a liability to the ATO which, as at 30 June 2008, is unquantifiable.
Contingent liabilities arising from litigation
The department is defending, on behalf of the state, a claim for damages relating to the development and management of an intermodal freight terminal in Gippsland. To date the claim is unquantifiable.
Details and estimates of other contingent liabilities are as follows:
QUANTIFIED2008
$’0002007
$’000
Legal disputes 100 503
Personal injury 1,759 700
1,859 1,203
158 Department of Transport Annual Report 2007-08
Note 26. Superannuation
Government employees’ superannuation schemes
No liability is recognised in the balance sheet for the department’s share of the state’s unfunded superannuation liability. The state’s unfunded superannuation liability has been reflected in the financial statements of the Department of Treasury and Finance.
However, superannuation contributions for the reporting period are included as part of employee benefits in the operating statement of the department.
The name and details of the major employee superannuation funds and contributions (including salary sacrifice contributions) made by the department are as follows:
SCHEME
Contribution for the Year
2008$’000
2007$’000
DEFINED BENEFIT SCHEMEState Superannuation Scheme – revised and new 1,348 2,511
Victorian Water Superannuation Fund 35 57
Transport Superannuation Fund 252 428
Total defined benefit plans 1,636 2,997
DEFINED CONTRIBUTION SCHEMEVictorian Superannuation Fund 10,370 8,582
Various other 4,001 2,642
Total defined contribution scheme 14,371 11,224
Total superannuation scheme 16,007 14,221
The above amounts were measured as at 30 June of each year, or in the case of employer contributions they relate to, payments made for years ended 30 June.
All employees of the department who are members of government superannuation funds are entitled to benefits on retirement, disability or death. These funds provide defined lump sum benefits based on years of service and final average salary. The above benefits are provided via either defined benefit schemes or accumulated fund schemes.
There were no loans made by the superannuation funds to the department during the year.
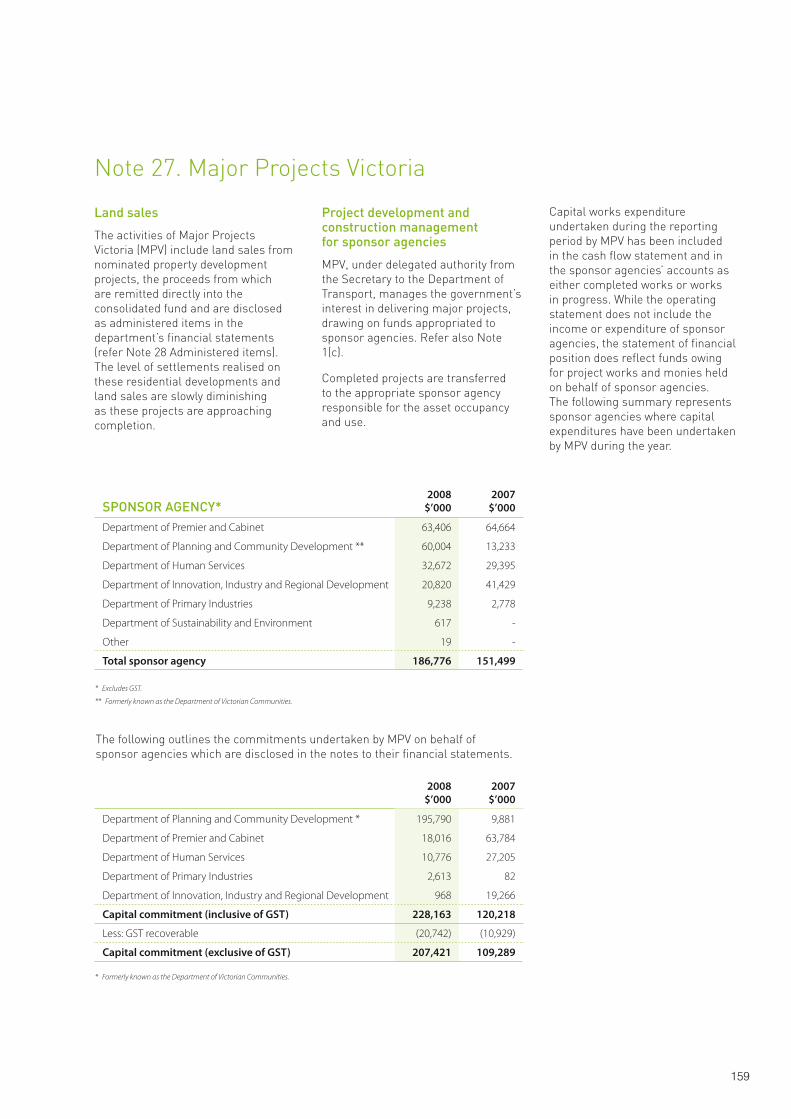
159
Note 27. Major Projects Victoria
SPONSOR AGENCY*2008
$’0002007
$’000
Department of Premier and Cabinet 63,406 64,664
Department of Planning and Community Development ** 60,004 13,233
Department of Human Services 32,672 29,395
Department of Innovation, Industry and Regional Development 20,820 41,429
Department of Primary Industries 9,238 2,778
Department of Sustainability and Environment 617 -
Other 19 -
Total sponsor agency 186,776 151,499
* Excludes GST.
** Formerly known as the Department of Victorian Communities.
The following outlines the commitments undertaken by MPV on behalf of sponsor agencies which are disclosed in the notes to their financial statements.
2008
$’0002007
$’000
Department of Planning and Community Development * 195,790 9,881
Department of Premier and Cabinet 18,016 63,784
Department of Human Services 10,776 27,205
Department of Primary Industries 2,613 82
Department of Innovation, Industry and Regional Development 968 19,266
Capital commitment (inclusive of GST) 228,163 120,218
Less: GST recoverable (20,742) (10,929)
Capital commitment (exclusive of GST) 207,421 109,289
* Formerly known as the Department of Victorian Communities.
Land sales
The activities of Major Projects Victoria (MPV) include land sales from nominated property development projects, the proceeds from which are remitted directly into the consolidated fund and are disclosed as administered items in the department’s financial statements (refer Note 28 Administered items). The level of settlements realised on these residential developments and land sales are slowly diminishing as these projects are approaching completion.
Project development and construction management for sponsor agencies
MPV, under delegated authority from the Secretary to the Department of Transport, manages the government’s interest in delivering major projects, drawing on funds appropriated to sponsor agencies. Refer also Note 1(c).
Completed projects are transferred to the appropriate sponsor agency responsible for the asset occupancy and use.
Capital works expenditure undertaken during the reporting period by MPV has been included in the cash flow statement and in the sponsor agencies’ accounts as either completed works or works in progress. While the operating statement does not include the income or expenditure of sponsor agencies, the statement of financial position does reflect funds owing for project works and monies held on behalf of sponsor agencies. The following summary represents sponsor agencies where capital expenditures have been undertaken by MPV during the year.
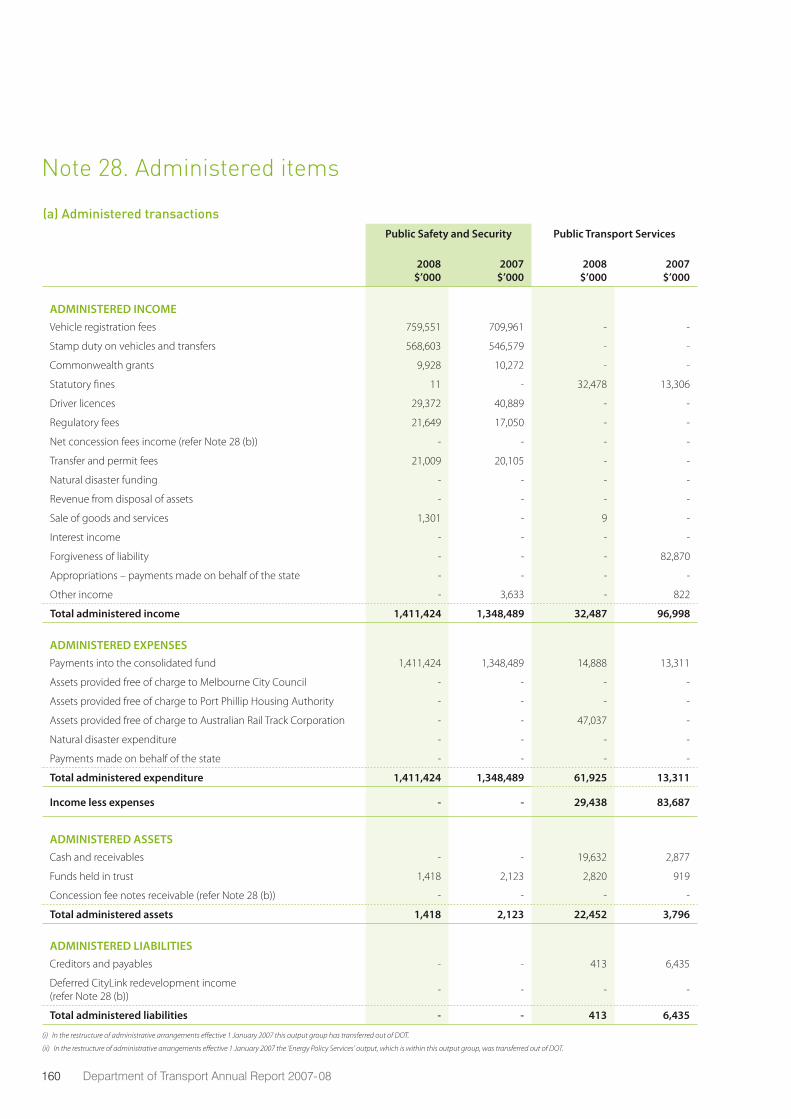
160 Department of Transport Annual Report 2007-08
Note 28. Administered items
(a) Administered transactionsPublic Safety and Security Public Transport Services ICT Policy, Programs and
Infrastructure (i)Infrastructure Planning,
Delivery and Management (ii)TOTAL
2008$’000
2007$’000
2008$’000
2007$’000
2008$’000
2007$’000
2008$’000
2007$’000
2008$’000
2007$’000
ADMINISTERED INCOMEVehicle registration fees 759,551 709,961 - - - - - - 759,551 709,961
Stamp duty on vehicles and transfers 568,603 546,579 - - - - - - 568,603 546,579
Commonwealth grants 9,928 10,272 - - - - 429,555 329,568 439,483 339,840
Statutory fines 11 - 32,478 13,306 - - - - 32,489 13,306
Driver licences 29,372 40,889 - - - - - - 29,372 40,889
Regulatory fees 21,649 17,050 - - - - - - 21,649 17,050
Net concession fees income (refer Note 28 (b)) - - - - - - 21,566 43,195 21,566 43,195
Transfer and permit fees 21,009 20,105 - - - - - - 21,009 20,105
Natural disaster funding - - - - - - 16,370 5,200 16,370 5,200
Revenue from disposal of assets - - - - - - 11,483 28,631 11,483 28,631
Sale of goods and services 1,301 - 9 - - - 66 863 1,376 863
Interest income - - - - - - 105 520 105 520
Forgiveness of liability - - - 82,870 - - - - - 82,870
Appropriations – payments made on behalf of the state - - - - - - - 18,500 - 18,500
Other income - 3,633 - 822 - - 6,233 4,167 6,233 8,622
Total administered income 1,411,424 1,348,489 32,487 96,998 - - 485,378 430,644 1,929,289 1,876,131
ADMINISTERED EXPENSESPayments into the consolidated fund 1,411,424 1,348,489 14,888 13,311 - - 848,866 370,737 2,275,178 1,732,537
Assets provided free of charge to Melbourne City Council - - - - - - 170,394 - 170,394 -
Assets provided free of charge to Port Phillip Housing Authority - - - - - - 56,712 - 56,712 -
Assets provided free of charge to Australian Rail Track Corporation - - 47,037 - - - - - 47,037 -
Natural disaster expenditure - - - - - - 16,370 5,200 16,370 5,200
Payments made on behalf of the state - - - - - - - 18,500 - 18,500
Total administered expenditure 1,411,424 1,348,489 61,925 13,311 - - 1,092,342 394,437 2,565,691 1,756,237
Income less expenses - - 29,438 83,687 - - (606,964) 36,207 (636,402) 119,894
ADMINISTERED ASSETSCash and receivables - - 19,632 2,877 - - - - 19,632 2,877
Funds held in trust 1,418 2,123 2,820 919 - - 844 4,801 5,082 7,843
Concession fee notes receivable (refer Note 28 (b)) - - - - - - 193,854 572,652 193,854 572,652
Total administered assets 1,418 2,123 22,452 3,796 - - 194,698 577,453 218,568 583,372
ADMINISTERED LIABILITIESCreditors and payables - - 413 6,435 - - 3,946 4,257 4,359 10,692
Deferred CityLink redevelopment income (refer Note 28 (b))
- - - - - - 320,256 316,468 320,256 316,468
Total administered liabilities - - 413 6,435 - - 324,202 320,725 324,615 327,160
(i) In the restructure of administrative arrangements effective 1 January 2007 this output group has transferred out of DOT.
(ii) In the restructure of administrative arrangements effective 1 January 2007 the ‘Energy Policy Services’ output, which is within this output group, was transferred out of DOT.
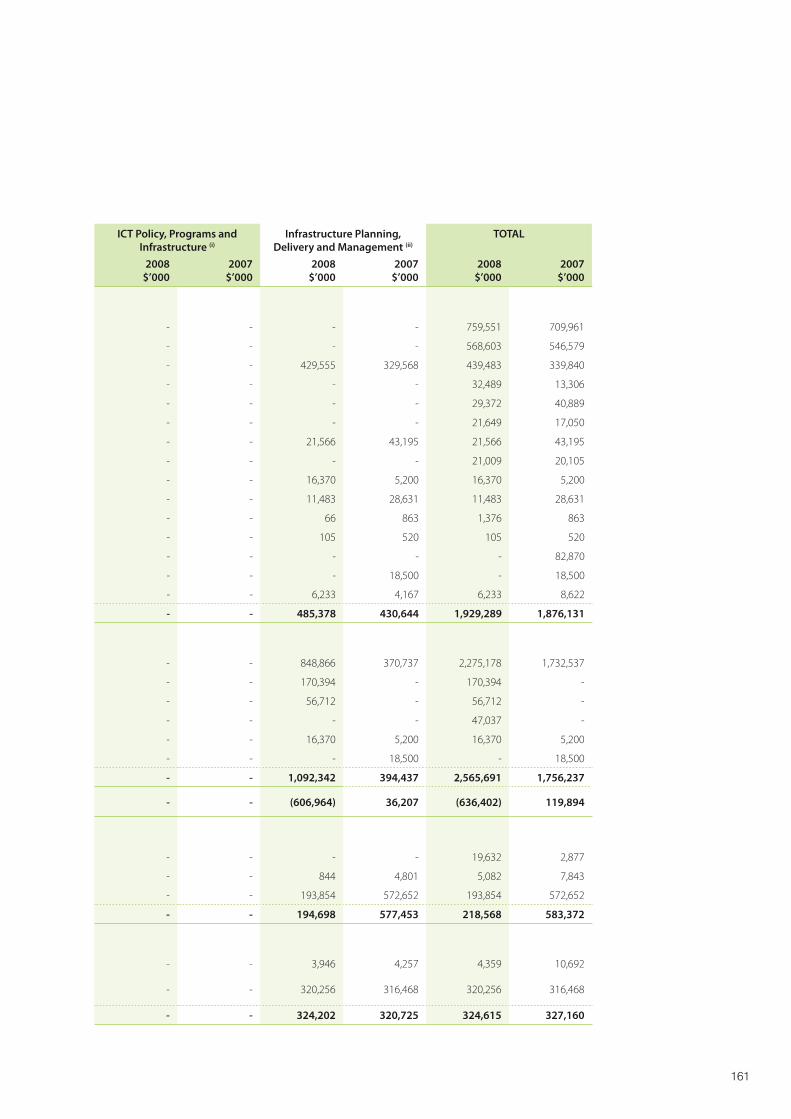
161
(a) Administered transactionsPublic Safety and Security Public Transport Services ICT Policy, Programs and
Infrastructure (i)Infrastructure Planning,
Delivery and Management (ii)TOTAL
2008$’000
2007$’000
2008$’000
2007$’000
2008$’000
2007$’000
2008$’000
2007$’000
2008$’000
2007$’000
ADMINISTERED INCOMEVehicle registration fees 759,551 709,961 - - - - - - 759,551 709,961
Stamp duty on vehicles and transfers 568,603 546,579 - - - - - - 568,603 546,579
Commonwealth grants 9,928 10,272 - - - - 429,555 329,568 439,483 339,840
Statutory fines 11 - 32,478 13,306 - - - - 32,489 13,306
Driver licences 29,372 40,889 - - - - - - 29,372 40,889
Regulatory fees 21,649 17,050 - - - - - - 21,649 17,050
Net concession fees income (refer Note 28 (b)) - - - - - - 21,566 43,195 21,566 43,195
Transfer and permit fees 21,009 20,105 - - - - - - 21,009 20,105
Natural disaster funding - - - - - - 16,370 5,200 16,370 5,200
Revenue from disposal of assets - - - - - - 11,483 28,631 11,483 28,631
Sale of goods and services 1,301 - 9 - - - 66 863 1,376 863
Interest income - - - - - - 105 520 105 520
Forgiveness of liability - - - 82,870 - - - - - 82,870
Appropriations – payments made on behalf of the state - - - - - - - 18,500 - 18,500
Other income - 3,633 - 822 - - 6,233 4,167 6,233 8,622
Total administered income 1,411,424 1,348,489 32,487 96,998 - - 485,378 430,644 1,929,289 1,876,131
ADMINISTERED EXPENSESPayments into the consolidated fund 1,411,424 1,348,489 14,888 13,311 - - 848,866 370,737 2,275,178 1,732,537
Assets provided free of charge to Melbourne City Council - - - - - - 170,394 - 170,394 -
Assets provided free of charge to Port Phillip Housing Authority - - - - - - 56,712 - 56,712 -
Assets provided free of charge to Australian Rail Track Corporation - - 47,037 - - - - - 47,037 -
Natural disaster expenditure - - - - - - 16,370 5,200 16,370 5,200
Payments made on behalf of the state - - - - - - - 18,500 - 18,500
Total administered expenditure 1,411,424 1,348,489 61,925 13,311 - - 1,092,342 394,437 2,565,691 1,756,237
Income less expenses - - 29,438 83,687 - - (606,964) 36,207 (636,402) 119,894
ADMINISTERED ASSETSCash and receivables - - 19,632 2,877 - - - - 19,632 2,877
Funds held in trust 1,418 2,123 2,820 919 - - 844 4,801 5,082 7,843
Concession fee notes receivable (refer Note 28 (b)) - - - - - - 193,854 572,652 193,854 572,652
Total administered assets 1,418 2,123 22,452 3,796 - - 194,698 577,453 218,568 583,372
ADMINISTERED LIABILITIESCreditors and payables - - 413 6,435 - - 3,946 4,257 4,359 10,692
Deferred CityLink redevelopment income (refer Note 28 (b))
- - - - - - 320,256 316,468 320,256 316,468
Total administered liabilities - - 413 6,435 - - 324,202 320,725 324,615 327,160
(i) In the restructure of administrative arrangements effective 1 January 2007 this output group has transferred out of DOT.
(ii) In the restructure of administrative arrangements effective 1 January 2007 the ‘Energy Policy Services’ output, which is within this output group, was transferred out of DOT.
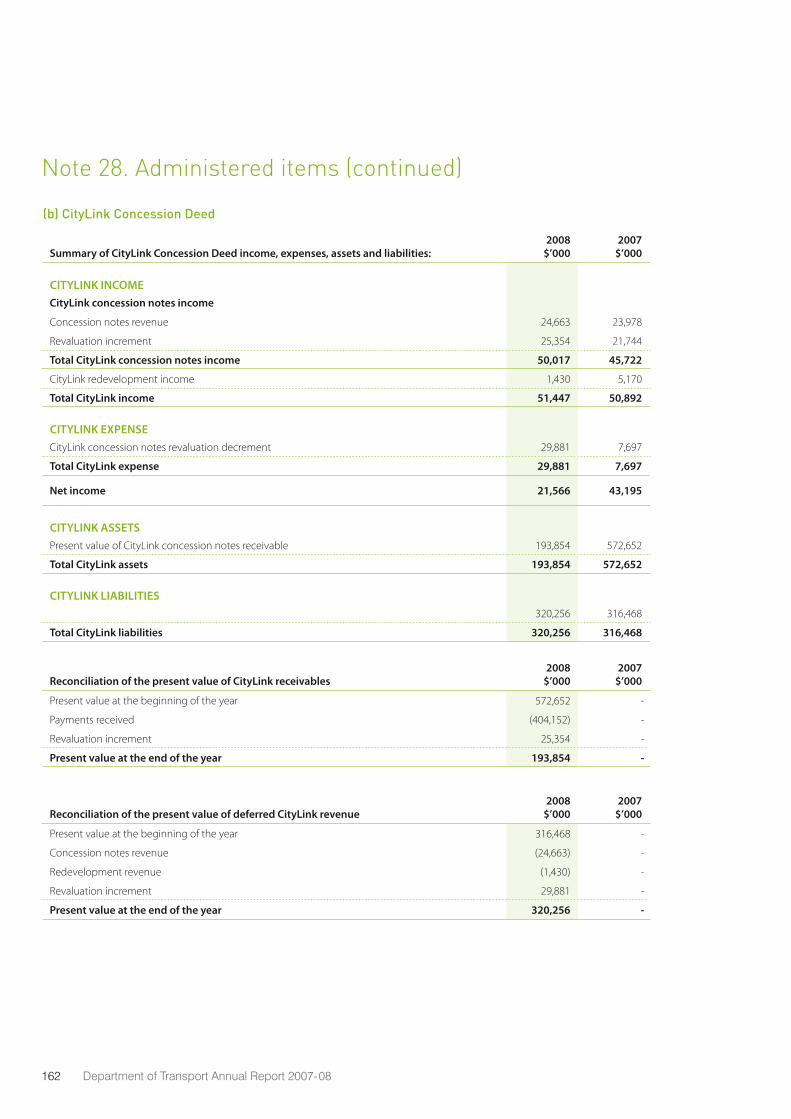
162 Department of Transport Annual Report 2007-08
(b) CityLink Concession Deed
Summary of CityLink Concession Deed income, expenses, assets and liabilities:2008
$’0002007
$’000
CITYLINK INCOMECityLink concession notes income
Concession notes revenue 24,663 23,978
Revaluation increment 25,354 21,744
Total CityLink concession notes income 50,017 45,722
CityLink redevelopment income 1,430 5,170
Total CityLink income 51,447 50,892
CITYLINK EXPENSECityLink concession notes revaluation decrement 29,881 7,697
Total CityLink expense 29,881 7,697
Net income 21,566 43,195
CITYLINK ASSETSPresent value of CityLink concession notes receivable 193,854 572,652
Total CityLink assets 193,854 572,652
CITYLINK LIABILITIES 320,256 316,468
Total CityLink liabilities 320,256 316,468
Reconciliation of the present value of CityLink receivables2008
$’0002007
$’000
Present value at the beginning of the year 572,652 -
Payments received (404,152) -
Revaluation increment 25,354 -
Present value at the end of the year 193,854 -
Reconciliation of the present value of deferred CityLink revenue2008
$’0002007
$’000
Present value at the beginning of the year 316,468 -
Concession notes revenue (24,663) -
Redevelopment revenue (1,430) -
Revaluation increment 29,881 -
Present value at the end of the year 320,256 -
Note 28. Administered items (continued)
163
The present value of CityLink receivables is the value of future payments to be received by the Victorian Government in accordance with the M1 Corridor Deed of Assignment.
The present value of deferred CityLink income is the value of concession notes revenue due to be received by the Victorian Government in future period in accordance with the Melbourne CityLink Concession Deed.
CityLink contingent asset
Compensable enhancement claims
The Melbourne CityLink Concession Deed contains compensable enhancement provisions that enable the Victorian Government to claim 50 percent of additional revenue derived by CityLink Melbourne Limited (CityLink) as a result of certain events that particularly benefit CityLink including changes to the adjoining road network.
On 20 May 2005, the Victorian Government lodged a compensable enhancement claim relating to works to improve the traffic flow on the West Gate Freeway between Lorimer and Montague Streets. The claim remains outstanding at the certification date of the financial report.
On 29 September 2006, the Victorian Government lodged a compensable enhancement claim relating to works to improve the traffic flow in the vicinity of the intersection of the Bulla Road and the Tullamarine Freeway. The claim remains outstanding at the certification date of the financial report.
Revenue sharing from the Tullamarine-Calder freeway interchange upgrade
On 9 June 2005, CityLink and the Victorian Government entered into the Tullamarine-Calder Freeway Redevelopment Deed. Under the terms of this deed:
the Victorian Government will »upgrade the Tullamarine-Calder Freeway Interchange
CityLink paid $11 million to the »Victorian Government as an upfront revenue sharing consideration on 1 July 2005
CityLink and the Victorian »Government agreed on a method of calculating the additional CityLink revenue generated by the upgrade based on comparing the actual traffic data against agreed trends. Where this calculation method produces an amount in excess of the revenue sharing consideration already paid to the Victorian Government, half of the excess amount will be payable to the government in addition to the $11 million payment made on 1 July 2005
the actual calculation of the »additional CityLink revenue will take place 30 months after completion of the upgrade.
Revenue sharing from the Monash-CityLink-West Gate upgrade
On 25 July 2006, CityLink, TransUrban Infrastructure Management Limited and the Victorian Government entered into the M1 Corridor Redevelopment Deed. Under the terms of this deed:
the Victorian Government will »upgrade the Monash and West Gate Freeways
CityLink will upgrade the southern »link part of CityLink
the Victorian Government is entitled »to 50 percent of the additional revenue for CityLink created by the Monash-CityLink-West Gate Upgrade after CityLink recovers its construction and additional operating costs relating to the southern link works
the method of calculating the »additional CityLink revenue generated by the upgrade is to be based on comparing the actual CityLink revenue against agreed trend
the actual calculation of the »additional CityLink revenue will take place three full financial years after completion of the upgrade.
CityLink contingent liability
An outstanding claim exists from CityLink pursuant to the Melbourne CityLink Concession Deed, relating to an alleged material adverse effect in respect of the widening of certain sections of the West Gate Freeway and certain other roads in the Docklands area. In accordance with the Concession Deed, the claim was referred to an independent expert who has determined in favour of the Victorian Government. CityLink has now referred the claim to arbitration.
This claim is being defended by VicRoads on behalf of the Victorian Government and is unable to assess the likelihood of the success of the claim at the certification date of this financial report.
164 Department of Transport Annual Report 2007-08
Goods and Service Tax
CityLink and the Victorian Government have approached the Australian Taxation Office seeking clarification as to the applicability of Goods and Services Tax legislation in respect of service and supplies provided under the Melbourne CityLink Concession Deed. Discussions with the Australian Taxation Office are continuing at the certification date of the financial report.
Management of Melbourne CityLink functions and powers
On behalf of the state, VicRoads manages the statutory functions and powers of the Melbourne CityLink Act 1995 on behalf of the Victorian Government in accordance with the Transport Legislation [Miscellaneous Amendment] Act 2004. These functions and powers include the administration of revenue and assets arising from the Melbourne CityLink Act 1995.
In accordance with the Melbourne CityLink Act 1995, the Victorian Government and CityLink Melbourne Limited (CityLink) entered into the Melbourne CityLink Concession Deed on 30 October 1995. Under the terms of the Concession Deed, CityLink is responsible for the construction, financing and operation of the CityLink road network. CityLink has a right to operate the road network for 33.5 years after completion of construction (up until 14 January 2034).
The Concession Deed requires CityLink to pay to the Victorian Government specified concession fees at six monthly intervals during the concession period. In accordance with the Concession Deed, CityLink has exercised an option to meet its obligations to pay concession fees by way of issuing concession notes. These notes are non-interest bearing promissory notes payable by CityLink at the end of the concession period (14 January 2034) or earlier in the event of CityLink achieving certain financial profitability levels and cash flows.
The Victorian Government, CityLink and Transurban Infrastructure Management Limited (TIML) entered into the M1 Corridor Deed of Assignment on 25 July 2006. Under the terms of the Deed of Assignment, all concession notes held by, and due to be issued to the Victorian Government in accordance with the Concession Deed have been assigned to TIML for a defined payment stream totalling $614.254 million in nominal terms, over a four-year period.
The concession notes and related revenues are not recognised as departmental or VicRoads revenue and assets. Details of the concession notes and related revenues are disclosed above in this Note.
The value of concession notes due to be received by the Victorian Government in accordance with the Concession Deed, has been disclosed at the present value of concession notes to be issued in future periods by CityLink. The present value of the
concession notes has been calculated based on an interest rate implied in the estimated concession note redemption profile included in the M1 Corridor Deed of Assignment. The value of future payments to be received by the Victorian Government in accordance with the M1 Corridor Deed of Assignment has been disclosed at the present value of the payment using a discount interest rate equivalent to the three year Commonwealth Bond rate.
The Concession Deed provides for CityLink to lease certain land and road infrastructure from the Victorian Government during this concession period. At the end of this period these assets are to be returned, together with the transfer of the CityLink road network, to the government.
The accounting treatment to recognise the right of the Victorian Government to receive the CityLink road network is currently being considered by the accounting profession and a cross-jurisdictional government working party. This right has not been recognised as an administered asset in the financial report.
Note 28. Administered items (continued)
165
Note 29. Annotated receipts agreements
The following is a listing of Section 29 Annotated Receipt Agreements approved by the Treasurer.
Note2008
$’0002007
$’000
USER CHARGES, OR SALES OF GOODS AND SERVICESReplacement of registration label charge 803 784
COMMONWEALTH SPECIFIC PURPOSE PAYMENTSAusLink road project grants 346,997 301,860
AusLink rail and road project grants 77,943 -
Interstate road transport registration charges 14,543 13,770
Blackspot program road project grants - 10,272
Total annotated receipts agreements 4 440,286 326,686
Note 30. Trust account balances
The following is a listing of trust account balances relating to trust accounts controlled and administered by the department.
Cash and investments as at 30 June Note2008
$’0002007
$’000
CONTROLLED TRUSTSPublic Transport Fund 316,192 316,972
Better Roads Victoria Trust Account 69,716 139,508
Treasury Trust Fund 2,612 9,967
Total controlled trusts 21 (a) 388,520 466,447
ADMINISTERED TRUSTSTreasury Trust Fund 5,398 8,119
Public Service Commuter Club Trust (316) (276)
Total administered trusts 5,082 7,843
Total trust account balances 393,603 474,290
166 Department of Transport Annual Report 2007-08
Note 31. Responsible personsIn accordance with the Directions of the Minister for Finance under the Financial Management Act 1994, the following disclosures are made regarding responsible persons for the reporting period.
Names
The persons who held the positions of Ministers and Accountable Officers in the department are as follows:
Remuneration
Total remuneration received or receivable by the Accountable Officer, excluding Acting Accountable Officers whose remuneration is included in ‘Remuneration of Executives’ (refer to Note 32) in connection with the management of the department during the reporting period was in the range:
Remuneration amounts relating to Ministers are reported in the financial statements of the Department of Premier and Cabinet.
Other transactions
Other related transactions and loans requiring disclosure under the Directions of the Minister for Finance have been considered and there are no matters to report.
Minister for Public Transport Lynne Kosky MP 1 July 2007 to 30 June 2008
Minister for Roads and Ports Tim Pallas MP 1 July 2007 to 30 June 2008
Minister for Major Projects Theo Theophanous MP 1 July 2007 to 30 June 2008
Secretary, Department of Transport Jim Betts 14 May 2008 to 30 June 2008
Secretary, Department of Transport Howard Ronaldson 1 July 2007 to 13 May 2008
No.2008
Income Band No.2007
Income Band
1 Less than $100,000 - -
1 $300,000–$309,000 1 $360,000–$369,999
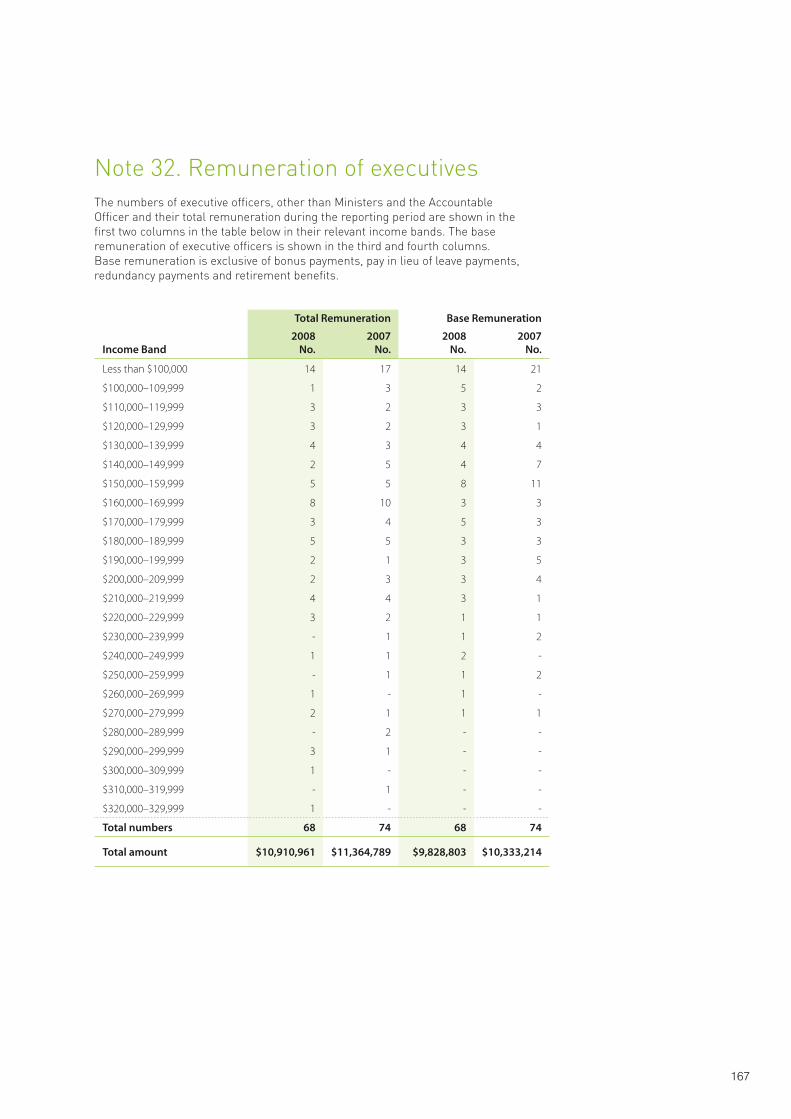
167
Note 32. Remuneration of executivesThe numbers of executive officers, other than Ministers and the Accountable Officer and their total remuneration during the reporting period are shown in the first two columns in the table below in their relevant income bands. The base remuneration of executive officers is shown in the third and fourth columns. Base remuneration is exclusive of bonus payments, pay in lieu of leave payments, redundancy payments and retirement benefits.
Income Band
Total Remuneration Base Remuneration
2008No.
2007No.
2008No.
2007No.
Less than $100,000 14 17 14 21
$100,000–109,999 1 3 5 2
$110,000–119,999 3 2 3 3
$120,000–129,999 3 2 3 1
$130,000–139,999 4 3 4 4
$140,000–149,999 2 5 4 7
$150,000–159,999 5 5 8 11
$160,000–169,999 8 10 3 3
$170,000–179,999 3 4 5 3
$180,000–189,999 5 5 3 3
$190,000–199,999 2 1 3 5
$200,000–209,999 2 3 3 4
$210,000–219,999 4 4 3 1
$220,000–229,999 3 2 1 1
$230,000–239,999 - 1 1 2
$240,000–249,999 1 1 2 -
$250,000–259,999 - 1 1 2
$260,000–269,999 1 - 1 -
$270,000–279,999 2 1 1 1
$280,000–289,999 - 2 - -
$290,000–299,999 3 1 - -
$300,000–309,999 1 - - -
$310,000–319,999 - 1 - -
$320,000–329,999 1 - - -
Total numbers 68 74 68 74
Total amount $10,910,961 $11,364,789 $9,828,803 $10,333,214
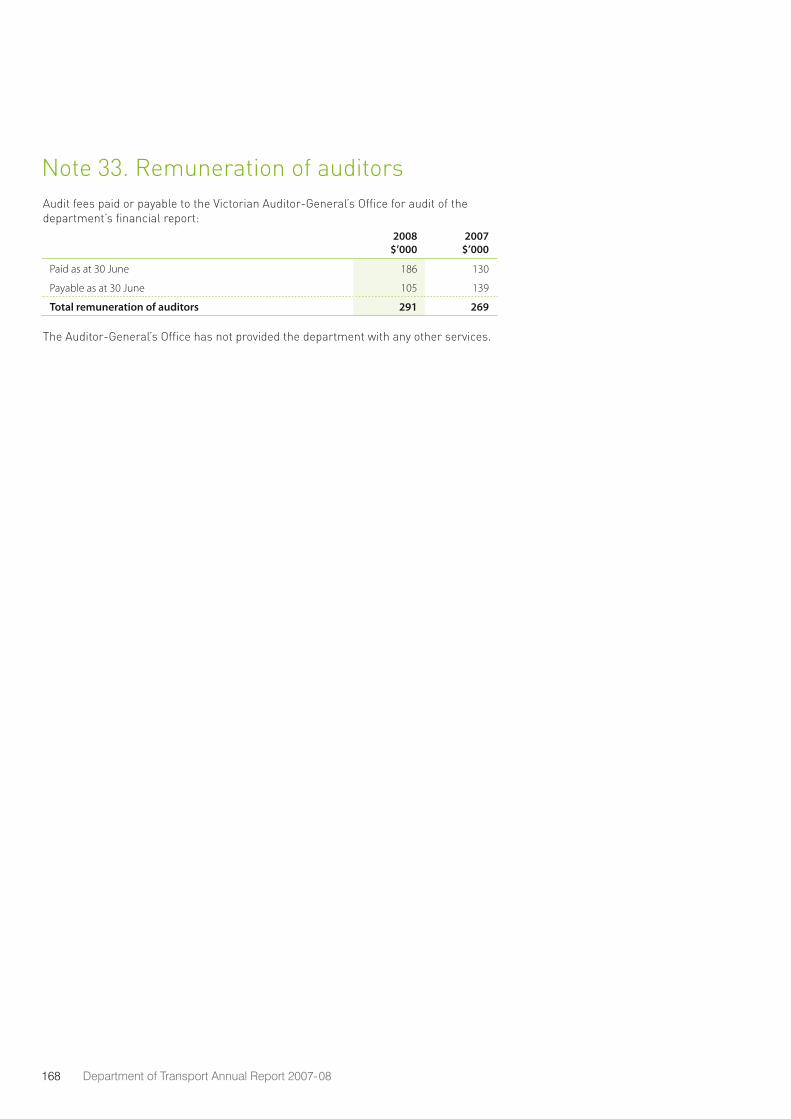
168 Department of Transport Annual Report 2007-08
Note 33. Remuneration of auditorsAudit fees paid or payable to the Victorian Auditor-General’s Office for audit of the department’s financial report:
2008$’000
2007$’000
Paid as at 30 June 186 130
Payable as at 30 June 105 139
Total remuneration of auditors 291 269
The Auditor-General’s Office has not provided the department with any other services.
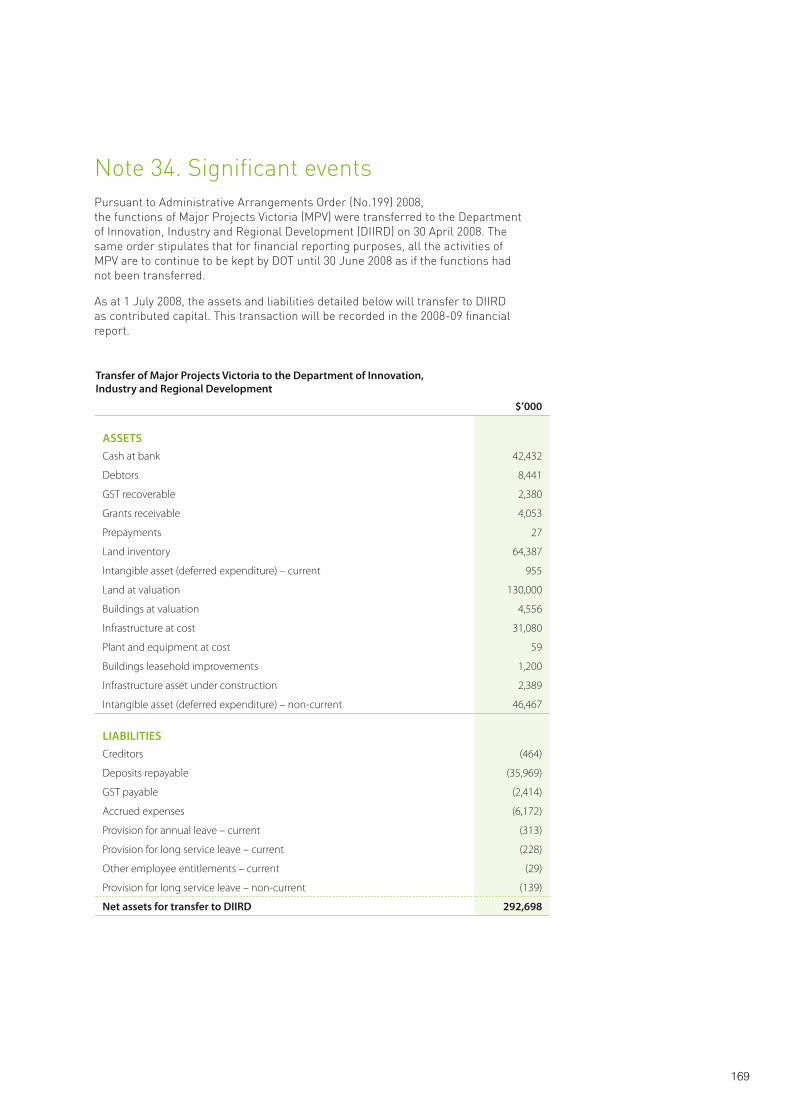
169
Note 34. Significant eventsPursuant to Administrative Arrangements Order (No.199) 2008, the functions of Major Projects Victoria (MPV) were transferred to the Department of Innovation, Industry and Regional Development (DIIRD) on 30 April 2008. The same order stipulates that for financial reporting purposes, all the activities of MPV are to continue to be kept by DOT until 30 June 2008 as if the functions had not been transferred.
As at 1 July 2008, the assets and liabilities detailed below will transfer to DIIRD as contributed capital. This transaction will be recorded in the 2008-09 financial report.
Transfer of Major Projects Victoria to the Department of Innovation, Industry and Regional Development
$’000
ASSETSCash at bank 42,432
Debtors 8,441
GST recoverable 2,380
Grants receivable 4,053
Prepayments 27
Land inventory 64,387
Intangible asset (deferred expenditure) – current 955
Land at valuation 130,000
Buildings at valuation 4,556
Infrastructure at cost 31,080
Plant and equipment at cost 59
Buildings leasehold improvements 1,200
Infrastructure asset under construction 2,389
Intangible asset (deferred expenditure) – non-current 46,467
LIABILITIESCreditors (464)
Deposits repayable (35,969)
GST payable (2,414)
Accrued expenses (6,172)
Provision for annual leave – current (313)
Provision for long service leave – current (228)
Other employee entitlements – current (29)
Provision for long service leave – non-current (139)
Net assets for transfer to DIIRD 292,698

170 Department of Transport Annual Report 2007-08
171
Contents
Appendices
172 Statutory Authorities 174 Statutory Authorities’ Executive Numbers175 DOT People Profile176 Employee Relations179 DOT Audit Committee180 Budget Portfolio Outcomes188 Output Performance Measures209 Better Roads Victoria Trust Account210 Environmental Performance Report216 Whole of Government Reporting –
Multicultural Affairs220 Whole of Government Reporting –
Women’s Affairs221 Legislation (administrated as at 30 June 2008)224 Whistle Blowers Protection Act 2001224 Freedom of Information Act 1982225 Victorian Industry Participation Policy226 National Competition Policy Compliance227 Secretary’s Attestation of Risk Management227 Building Act Compliance228 Disclosure of Major Contracts Compliance228 Consultant Engagements228 Major Publications229 Other available information229 DOT contact information230 Disclosure Index
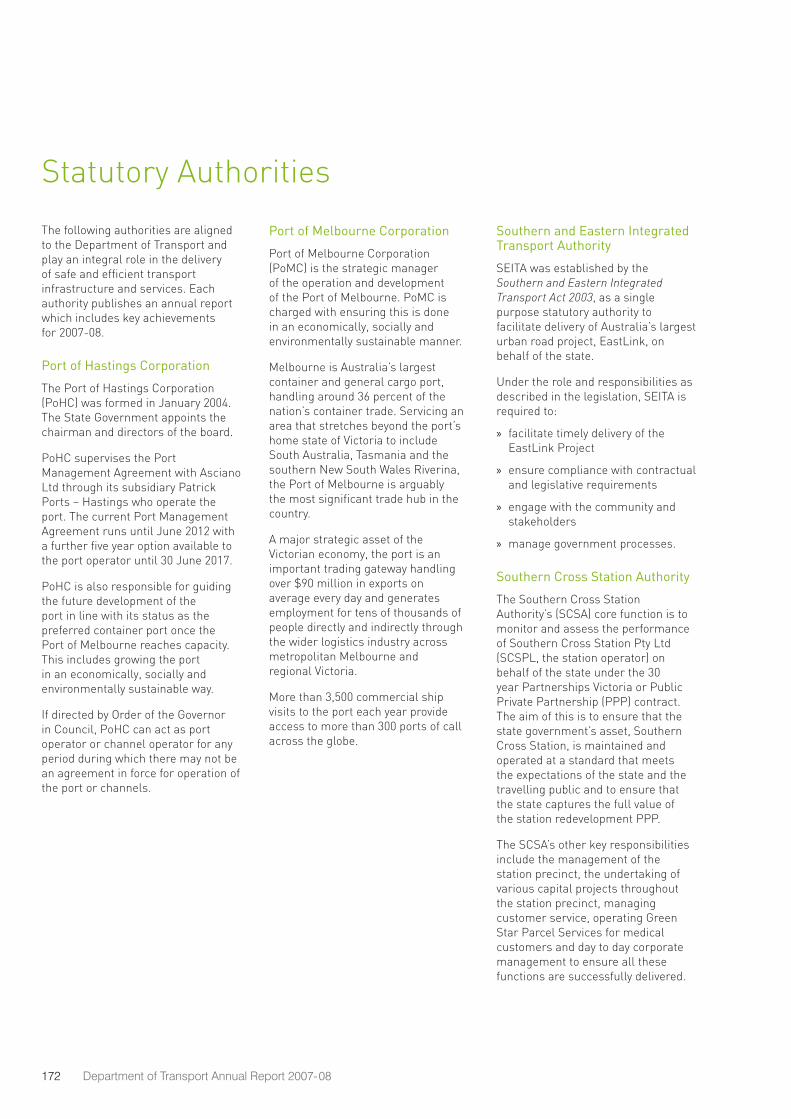
172 Department of Transport Annual Report 2007-08
The following authorities are aligned to the Department of Transport and play an integral role in the delivery of safe and efficient transport infrastructure and services. Each authority publishes an annual report which includes key achievements for 2007-08.
Port of Hastings Corporation
The Port of Hastings Corporation (PoHC) was formed in January 2004. The State Government appoints the chairman and directors of the board.
PoHC supervises the Port Management Agreement with Asciano Ltd through its subsidiary Patrick Ports – Hastings who operate the port. The current Port Management Agreement runs until June 2012 with a further five year option available to the port operator until 30 June 2017.
PoHC is also responsible for guiding the future development of the port in line with its status as the preferred container port once the Port of Melbourne reaches capacity. This includes growing the port in an economically, socially and environmentally sustainable way.
If directed by Order of the Governor in Council, PoHC can act as port operator or channel operator for any period during which there may not be an agreement in force for operation of the port or channels.
Southern and Eastern Integrated Transport Authority
SEITA was established by the Southern and Eastern Integrated Transport Act 2003, as a single purpose statutory authority to facilitate delivery of Australia’s largest urban road project, EastLink, on behalf of the state.
Under the role and responsibilities as described in the legislation, SEITA is required to:
facilitate timely delivery of the »EastLink Project
ensure compliance with contractual »and legislative requirements
engage with the community and »stakeholders
manage government processes. »
Southern Cross Station Authority
The Southern Cross Station Authority’s (SCSA) core function is to monitor and assess the performance of Southern Cross Station Pty Ltd (SCSPL, the station operator) on behalf of the state under the 30 year Partnerships Victoria or Public Private Partnership (PPP) contract. The aim of this is to ensure that the state government’s asset, Southern Cross Station, is maintained and operated at a standard that meets the expectations of the state and the travelling public and to ensure that the state captures the full value of the station redevelopment PPP.
The SCSA’s other key responsibilities include the management of the station precinct, the undertaking of various capital projects throughout the station precinct, managing customer service, operating Green Star Parcel Services for medical customers and day to day corporate management to ensure all these functions are successfully delivered.
Port of Melbourne Corporation
Port of Melbourne Corporation (PoMC) is the strategic manager of the operation and development of the Port of Melbourne. PoMC is charged with ensuring this is done in an economically, socially and environmentally sustainable manner.
Melbourne is Australia’s largest container and general cargo port, handling around 36 percent of the nation’s container trade. Servicing an area that stretches beyond the port’s home state of Victoria to include South Australia, Tasmania and the southern New South Wales Riverina, the Port of Melbourne is arguably the most significant trade hub in the country.
A major strategic asset of the Victorian economy, the port is an important trading gateway handling over $90 million in exports on average every day and generates employment for tens of thousands of people directly and indirectly through the wider logistics industry across metropolitan Melbourne and regional Victoria.
More than 3,500 commercial ship visits to the port each year provide access to more than 300 ports of call across the globe.
Statutory Authorities
173
Transport Ticketing Authority
The TTA manages all aspects of the state’s involvement in the existing public transport ticketing system. TTA is also responsible for procuring and overseeing the delivery and operation of the New Ticketing System (NTS), referred to as myki.
VicRoads
VicRoads’ role is to deliver social, economic and environmental benefits to communities throughout Victoria by managing Victoria’s road system and its use as an integral part of the overall transport network.
VicTrack
VicTrack, on behalf of the state, owns the majority of Victoria’s rail infrastructure, land and passenger rolling stock. A large proportion of these assets are leased to the Director of Public Transport. In turn, the Director of Public Transport sub-leases the infrastructure/rolling stock to various transport operators and track access providers. VicTrack has no direct involvement in the provision of passenger or freight transport services.
VicTrack also owns significant telecommunications assets, including metropolitan and regional optical fibre and copper networks as well as a wireless network in country Victoria.
VicTrack has two broad categories of activity:
custodial – fulfilling the »organisation’s obligations as an owner of infrastructure and rolling stock
commercial – seeking to add value »to its assets and generate returns to enable greater investment in, and improvements to, Victoria’s public transport system and other government services.
Victorian Regional Channels Authority (VRCA)
The VRCA manages the commercial navigation of the waters within the Geelong Port and manages channel licences for the ports of Hastings and Portland.
V/Line
V/Line Passenger Corporation, a statutory authority incorporated under the Rail Corporations Act, is the owner and sole shareholder of V/Line Passenger Pty Ltd.
V/Line Passenger Pty Ltd operates under a franchise agreement with to the Director of Public Transport.
V/Line is the largest provider of passenger rail and coach services to regional Victoria. It is responsible for the operation of passenger transport services, the staffing of stations and the sale of tickets through its own staff and agents. Some coach services are provided under contract with private coach operators.
V/Line is also responsible for the operation and maintenance of 4,100 kilometres of rail track across Victoria and into New South Wales. This includes track used by V/Line’s own passenger rail services, as well as an extensive freight network.
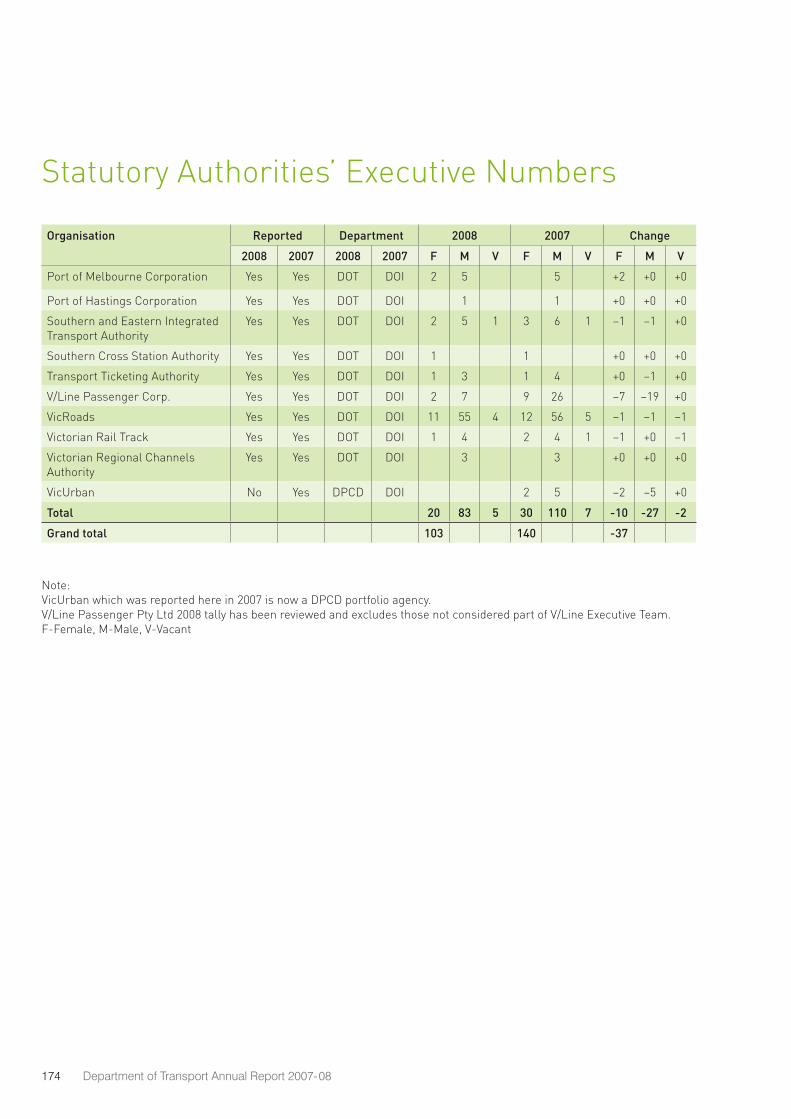
174 Department of Transport Annual Report 2007-08
Statutory Authorities’ Executive Numbers
Organisation Reported Department 2008 2007 Change
2008 2007 2008 2007 F M V F M V F M V
Port of Melbourne Corporation Yes Yes DOT DOI 2 5 5 +2 +0 +0
Port of Hastings Corporation Yes Yes DOT DOI 1 1 +0 +0 +0
Southern and Eastern Integrated Transport Authority
Yes Yes DOT DOI 2 5 1 3 6 1 –1 –1 +0
Southern Cross Station Authority Yes Yes DOT DOI 1 1 +0 +0 +0
Transport Ticketing Authority Yes Yes DOT DOI 1 3 1 4 +0 –1 +0
V/Line Passenger Corp. Yes Yes DOT DOI 2 7 9 26 –7 –19 +0
VicRoads Yes Yes DOT DOI 11 55 4 12 56 5 –1 –1 –1
Victorian Rail Track Yes Yes DOT DOI 1 4 2 4 1 –1 +0 –1
Victorian Regional Channels Authority
Yes Yes DOT DOI 3 3 +0 +0 +0
VicUrban No Yes DPCD DOI 2 5 –2 –5 +0
Total 20 83 5 30 110 7 -10 -27 -2
Grand total 103 140 -37
Note: VicUrban which was reported here in 2007 is now a DPCD portfolio agency. V/Line Passenger Pty Ltd 2008 tally has been reviewed and excludes those not considered part of V/Line Executive Team. F-Female, M-Male, V-Vacant
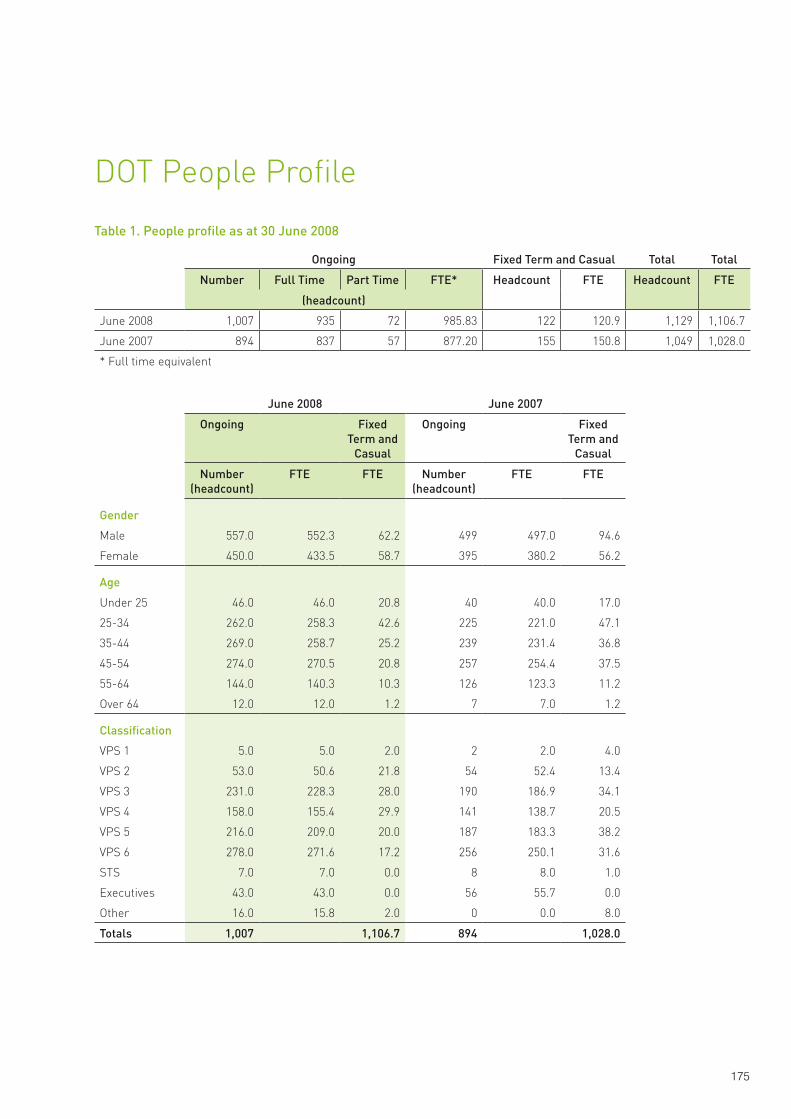
175
DOT People Profile
Table 1. People profile as at 30 June 2008
Ongoing Fixed Term and Casual Total Total
Number Full Time Part Time FTE* Headcount FTE Headcount FTE
(headcount)
June 2008 1,007 935 72 985.83 122 120.9 1,129 1,106.7
June 2007 894 837 57 877.20 155 150.8 1,049 1,028.0
* Full time equivalent
June 2008 June 2007
Ongoing Fixed Term and
Casual
Ongoing Fixed Term and
Casual
Number (headcount)
FTE FTE Number (headcount)
FTE FTE
Gender
Male 557.0 552.3 62.2 499 497.0 94.6
Female 450.0 433.5 58.7 395 380.2 56.2
Age
Under 25 46.0 46.0 20.8 40 40.0 17.0
25-34 262.0 258.3 42.6 225 221.0 47.1
35-44 269.0 258.7 25.2 239 231.4 36.8
45-54 274.0 270.5 20.8 257 254.4 37.5
55-64 144.0 140.3 10.3 126 123.3 11.2
Over 64 12.0 12.0 1.2 7 7.0 1.2
Classification
VPS 1 5.0 5.0 2.0 2 2.0 4.0
VPS 2 53.0 50.6 21.8 54 52.4 13.4
VPS 3 231.0 228.3 28.0 190 186.9 34.1
VPS 4 158.0 155.4 29.9 141 138.7 20.5
VPS 5 216.0 209.0 20.0 187 183.3 38.2
VPS 6 278.0 271.6 17.2 256 250.1 31.6
STS 7.0 7.0 0.0 8 8.0 1.0
Executives 43.0 43.0 0.0 56 55.7 0.0
Other 16.0 15.8 2.0 0 0.0 8.0
Totals 1,007 1,106.7 894 1,028.0
176 Department of Transport Annual Report 2007-08
Employee Relations
OH&S
DOT has developed a cooperative, consultative relationship with all our people to achieve the highest standards of occupational health and safety.
As part of our psychological health program, we have delivered two initiatives. “Demystifying Psychological Health” is an awareness program for managers about responding to distressed employees and dealing with psychological ill-health in the workplace, and “Building Resilience and Resolution Skills” provides additional resources for staff.
A set of online tools and information was published on DOT’s intranet. This includes general information on psychological health, early warning signs and symptoms. There is also an online manager’s tool kit available that outlines action to take if an employee is distressed, and practical advice on simple ways to identify and reduce psychological risk in the workplace. It includes information on a manager’s hotline, offering specialist advice by an external provider.
A pilot of the Managing Psychological Risks workshops was conducted for Public Transport Safety Victoria (due to the nature of work, a pre-identified high risk area for psychological injury) in September 2007. The workshops included practical guidance on carrying out an organisational risk assessment and developing action plans for managing psychological risks in the workplace.
A set of contractors’ guidelines was developed for DOT contract and purchasing managers. The guidelines include practical information and advice on how to manage contractors’
OH&S and ensure that DOT is meeting its requirements under section 23 of the Occupational Health and Safety Act 2004. The management of contractor OH&S issues includes the requirement to report incidents to the department in certain time frames, to include safety management plans with tender bids, and regular scheduled audits of contractors’ safety management plans.
The DOT Occupational Health and Safety Committee continues to meet quarterly and act as a formal mechanism for consultation and participative resolution of department-wide matters. Managers, in consultation with health and safety representatives, continue to conduct regular physical workplace audits to ensure there are no unnecessary risks to DOT people and visitors.
The online reporting system used to report workplace incidents and identify hazards has been upgraded to ensure appropriate measures are put in place to provide the highest level of protection against risks.
The number of standard claims lodged with the WorkCover insurer for 2007-08 was nine and although this is an increase from the previous year, the total ‘time lost’ claims remained stable at three. The overall payments that were made on those claims are significantly less than the previous year – a 21.58 percent reduction. This indicates better return to work and case management of those claims.
The move into our new premises at 121 Exhibition Street posed some health and safety challenges. These issues have been dealt with in a consultative way.
Diesel fumes were emanating from the cranes on the adjacent construction site. Investigation discovered the fumes were entering through the air intake in the plant room. Negotiations with Brookfield Multiplex resulted in an agreement that cranes responsible for the fumes are now operated when the fumes cannot affect DOT.
The glare from windows caused problems for people located on the Exhibition and Bourke Street sides of the building. DOT, in consultation with staff, provided a double blind for the affected areas to alleviate this problem.
Manual handling training has been provided to the Corporate Centre to combat risks associated with room set up, which involves rearranging tables, securing tables into place, allocating seating, setting up of media equipment and utilising a wall dividing system.
Workstation ergonomic training was provided to health and safety representatives to refresh their knowledge and enable them to perform workstation assessments inhouse.
Various activities have been provided throughout Occupational Health and Safety Week to increase self-awareness revolving around health checks.
Employee health and wellbeing
DOT’s employee health and wellbeing initiatives continue to deliver benefits to all employees.
DOT identified a need to support parents in the organisation and engage with those currently on
177
parental leave. As a result, a luncheon and presentation on “Helpful Strategies for Busy Parents” and “Sleeping Soundly” was delivered.
To increase awareness of the availability of flexible work options and family friendly work practices, a guide to “Working Flexibly” was launched. The Flex Ability publication outlines the benefits of increased productivity and heightened motivation for DOT people who may enter an alternative working arrangement with their manager.
As part of DOT’s commitment to achieving a motivated organisation, a gymnasium subsidy continues to be offered to all ongoing and fixed term employees.
DOT, in conjunction with Camp Australia, conducts a subsidised work-based school holiday program during the school holidays.
Selecting on merit
DOT’s recruitment policies and guidelines ensure that all employment decisions and workplace practices are fair, equitable, based on merit and comply with government policy and legislation.
Managing and valuing diversity
DOT’s core values include valuing employees’ diversity and respecting each other’s knowledge, skills and abilities. This is reflected in the Diversity, Equality and Inclusion Plan, incorporating the Disability Action Plan.
Implementation of the Diversity, Equality and Inclusion Plan continued during 2007-08 with a focus on the Disability Action Plan and building relationships with Indigenous communities.
Reviewing personal grievances
DOT’s Grievance and Review of Actions policies ensure DOT people have an avenue for redress against treatment they see as unfair or unreasonable. The People and Organisational Development Division continues to work proactively across DOT to resolve workplace issues before or as they arise without the need for formal grievance action.
Upholding ethical conduct
DOT’s Ethics at Work and Managing Diversity policies together with the updated Code of Conduct for Victorian Public Sector Employees are integral to the way DOT people conduct business.
People management practices
All DOT people policies are regularly reviewed and are available online to all of DOT and new starters as part of the induction process. The People and Organisational Division provides advice and consults with all line areas to ensure policies are adhered to and taken into account as part of normal business practice.
Performance management and development
The DOT People Capability Framework was updated as part of DOT’s performance management and development system. The system is an essential tool for ensuring organisational performance is aligned to individual, team and organisational outcomes. The system has identified the need to increase capability which has placed an even greater emphasis on performance management and development.
Review work is currently being undertaken to make sure the department’s suite of learning and development programs are aligned with the behavioral and technical capabilities required within DOT now and into the future.
Indigenous programs for whole of government reporting
DOT Indigenous Scholarship Program
This scholarship program was introduced in 2006 to support an Indigenous student at tertiary or TAFE level study. The 2006 scholarship student successfully obtained ongoing employment within the department.
In 2007, the scholarship was awarded to two postgraduate students completing their Master of Business Management. In 2008, two scholarships were awarded to students studying Commerce/Law and Commerce.
Cultural awareness sessions
These sessions continue to help develop a greater awareness among DOT people about the issues facing our Indigenous employees. These are joint awareness sessions with VicRoads and include a guided bus tour around Melbourne’s Indigenous sites.
Sessions are offered to DOT people each month.
178 Department of Transport Annual Report 2007-08
NAIDOC Week activities
DOT hosted the third annual art exhibition showcasing work by students from the Indigenous Art Unit, School of Art, RMIT University. All DOT people were also invited to attend a presentation by a member of the ‘Stolen Generation’.
Advertisement for DOT positions in Koori Mail
DOT continues to advertise positions in the Koori Mail newspaper to help raise the profile of DOT in Indigenous communities and encourage Indigenous applicants.
DOT funded Shepparton VicRoads traineeship
In 2007, DOT and VicRoads jointly created an Indigenous traineeship position within the VicRoads Shepparton office. The traineeship was created to support regional Indigenous employment, this was based on the model used in Bairnsdale in 2006.
DOT/VicRoads Indigenous employee conference
The first joint DOT/VicRoads Indigenous employee conference was held in December 2006 with 12 attendees. The conference aim was to create a support network between the Indigenous employees at DOT and VicRoads. As the network has grown, two conferences were held in 2007 and another in 2008. In total, four conferences have been held, both regionally and metropolitan-based.
Scholarships
The Women in Science, Engineering, Technology or Construction Scholarship was developed in 2006. As women are under-represented in these fields, these scholarships were introduced to support women currently working in or aspiring to work in these fields.
In 2008, DOT offered three $10,000 scholarships to female, full time or part time students starting or completing postgraduate studies in science, engineering, technology or construction related fields.
The Women in Freight, Logistics and Marine Management Scholarship, which continued to promote the recruitment and advancement of women in management positions within the freight, marine and logistics industry, was awarded in 2007. The $10,000 scholarship is offered to female, full or part time students starting or completing a Masters, Ph.D. or postgraduate degree in relevant fields.
Multicultural affairs
DOT developed a Diversity Calendar for 2007 and 2008. This calendar reflects and celebrates the diversity and multiculturalism of DOT and the Victorian community. The calendar contains major religious festivals including days of strict religious observance and other days of cultural or Indigenous significance for Australia.
Youth
DOT continues to build and maintain a successful Youth Employment Scheme which provides traineeships to disadvantaged young Victorians to enable them to enter the workforce and build sustainable and meaningful careers.
Women’s affairs
DOT provides funds to support the Office of Women’s Policy’s Women’s Community Leadership Grants program which specifically supports Indigenous women in the development of community leadership skills.
179
DOT Audit Committee
The Audit Committee was established to assist the Secretary in the governance and oversight responsibilities of the department’s financial performance and reporting, the internal control environment, the risk management framework and the department’s compliance with legislation and regulations.
The Audit Committee provides independent, risk-based and objective assurance and recommendations to the Secretary. It is supported in this task by a secretariat, led by the Director Audit and Assurance, who reports to the Secretary, and also through an outsourced internal audit provider.
The appointment of an Audit Committee and the maintenance of an internal audit function is a requirement of the department’s governance arrangements under the Financial Management Act 1994 and the Standing Directions of the Minister for Finance.
The roles and responsibilities of the Audit Committee include:
overseeing the department’s »financial performance and reporting and providing advice on any unusual or significant transactions or policies
overseeing the work, performance »and independence of the department’s outsourced internal audit provider
overseeing the development and »implementation of internal audit plans
monitoring management’s »implementation of internal audit recommendations and advising the Secretary on significant issues identified in audit reports
overseeing the department’s risk »management practices, including evaluating whether management has in place a comprehensive risk and fraud management framework
overseeing the department’s »compliance and control environment.
180 Department of Transport Annual Report 2007-08
The Budget Portfolio Outcomes statements provide a comparison of the actual financial results for all entities within the Transport budget portfolio with the 2007-08 adjusted estimates published in Budget Paper No. 4 – 2008-09 Budget Estimates. The 2007-08 adjusted estimates reflect the original 2007-08 Budget adjusted for machinery of government changes.
The statements are prepared on a consolidated basis. Entities are consolidated within a budget portfolio when 50 percent or more of their funding is received through appropriations and they are directly accountable through Ministers to Parliament. The entities included in the statements are:
Department of Transport »
VicRoads »
Southern and Eastern Integrated »Transport Authority.
Budget Portfolio Outcomes
Financial transactions and balances are classified into either controlled or administered in accordance with AAS 29 Financial Reporting by Government Departments and as agreed with the Treasurer for the purposes of Budget Paper No. 4.
Budget Portfolio Outcomes statements are not prepared on the same basis as the department’s financial report and are not subject to audit by the Victorian Auditor-General’s Office.
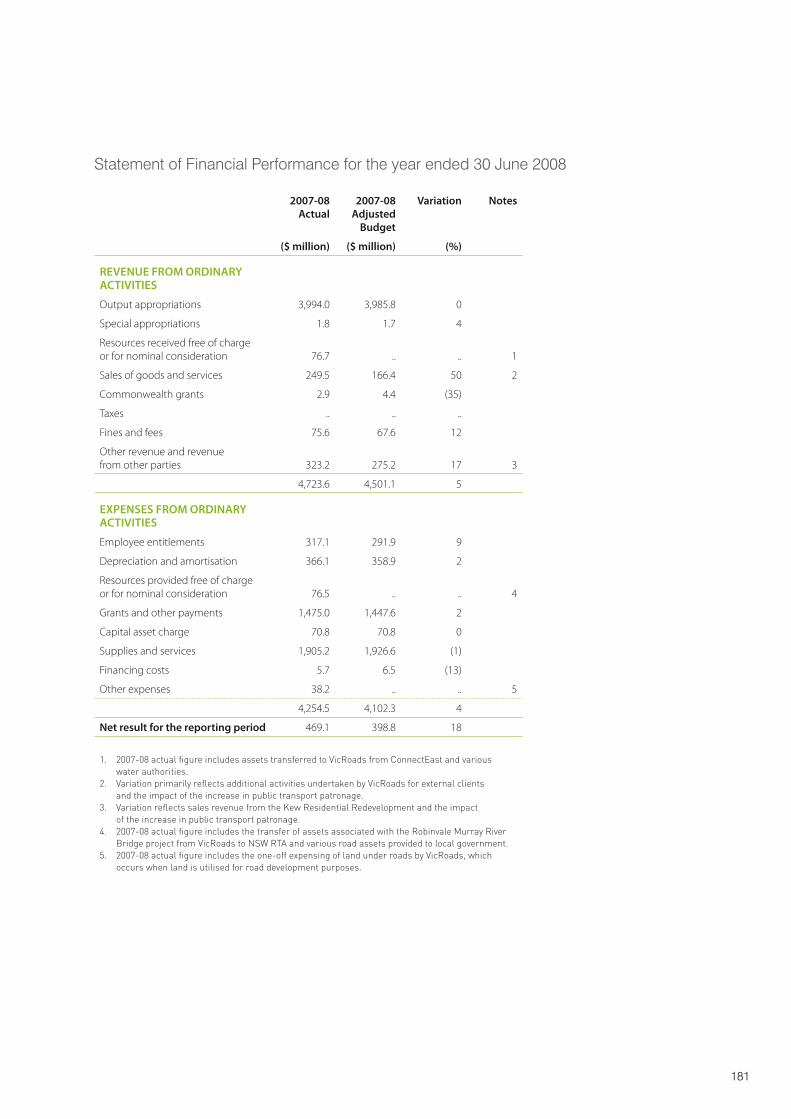
181
2007-08 Actual
2007-08 Adjusted
Budget
Variation Notes
($ million) ($ million) (%)
REVENUE FROM ORDINARY ACTIVITIES
Output appropriations 3,994.0 3,985.8 0
Special appropriations 1.8 1.7 4
Resources received free of charge or for nominal consideration 76.7 .. .. 1
Sales of goods and services 249.5 166.4 50 2
Commonwealth grants 2.9 4.4 (35)
Taxes .. .. ..
Fines and fees 75.6 67.6 12
Other revenue and revenue from other parties 323.2 275.2 17 3
4,723.6 4,501.1 5
EXPENSES FROM ORDINARY ACTIVITIES
Employee entitlements 317.1 291.9 9
Depreciation and amortisation 366.1 358.9 2
Resources provided free of charge or for nominal consideration 76.5 .. .. 4
Grants and other payments 1,475.0 1,447.6 2
Capital asset charge 70.8 70.8 0
Supplies and services 1,905.2 1,926.6 (1)
Financing costs 5.7 6.5 (13)
Other expenses 38.2 .. .. 5
4,254.5 4,102.3 4
Net result for the reporting period 469.1 398.8 18
1. 2007-08 actual figure includes assets transferred to VicRoads from ConnectEast and various water authorities.
2. Variation primarily reflects additional activities undertaken by VicRoads for external clients and the impact of the increase in public transport patronage.
3. Variation reflects sales revenue from the Kew Residential Redevelopment and the impact of the increase in public transport patronage.
4. 2007-08 actual figure includes the transfer of assets associated with the Robinvale Murray River Bridge project from VicRoads to NSW RTA and various road assets provided to local government.
5. 2007-08 actual figure includes the one-off expensing of land under roads by VicRoads, which occurs when land is utilised for road development purposes.
Statement of Financial Performance for the year ended 30 June 2008
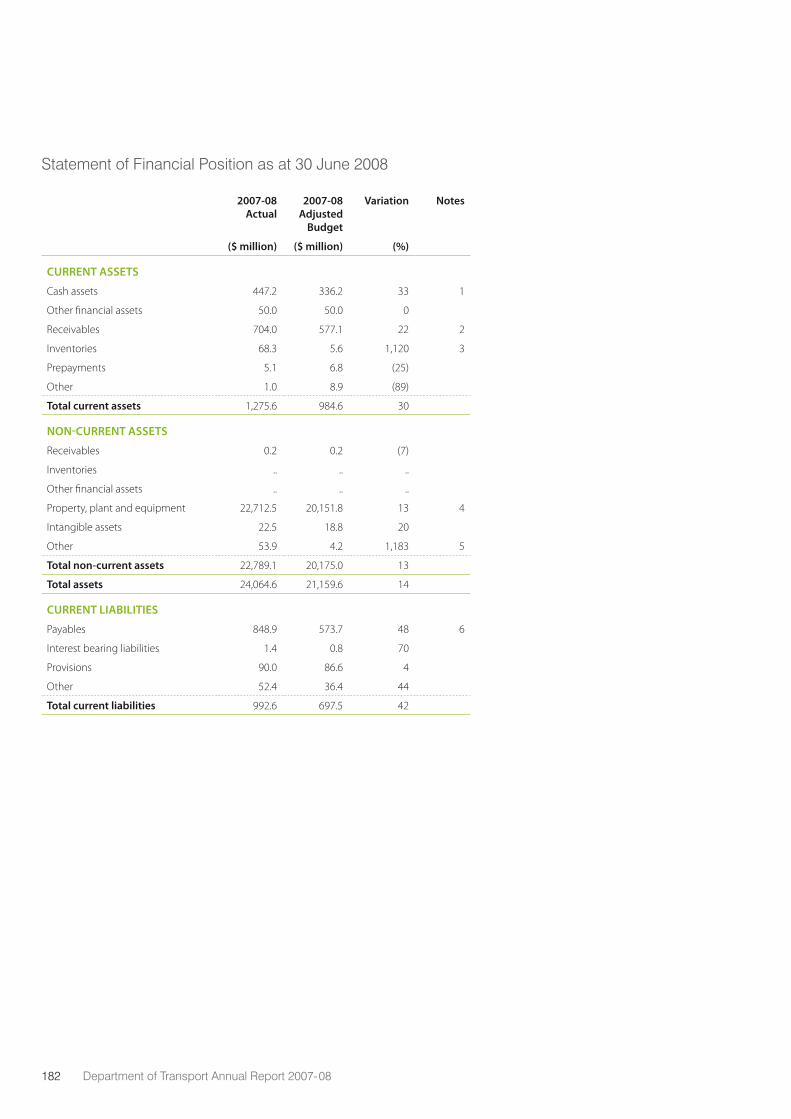
182 Department of Transport Annual Report 2007-08
Statement of Financial Position as at 30 June 2008
2007-08 Actual
2007-08 Adjusted
Budget
Variation Notes
($ million) ($ million) (%)
CURRENT ASSETS
Cash assets 447.2 336.2 33 1
Other financial assets 50.0 50.0 0
Receivables 704.0 577.1 22 2
Inventories 68.3 5.6 1,120 3
Prepayments 5.1 6.8 (25)
Other 1.0 8.9 (89)
Total current assets 1,275.6 984.6 30
NON-CURRENT ASSETS
Receivables 0.2 0.2 (7)
Inventories .. .. ..
Other financial assets .. .. ..
Property, plant and equipment 22,712.5 20,151.8 13 4
Intangible assets 22.5 18.8 20
Other 53.9 4.2 1,183 5
Total non-current assets 22,789.1 20,175.0 13
Total assets 24,064.6 21,159.6 14
CURRENT LIABILITIES
Payables 848.9 573.7 48 6
Interest bearing liabilities 1.4 0.8 70
Provisions 90.0 86.6 4
Other 52.4 36.4 44
Total current liabilities 992.6 697.5 42
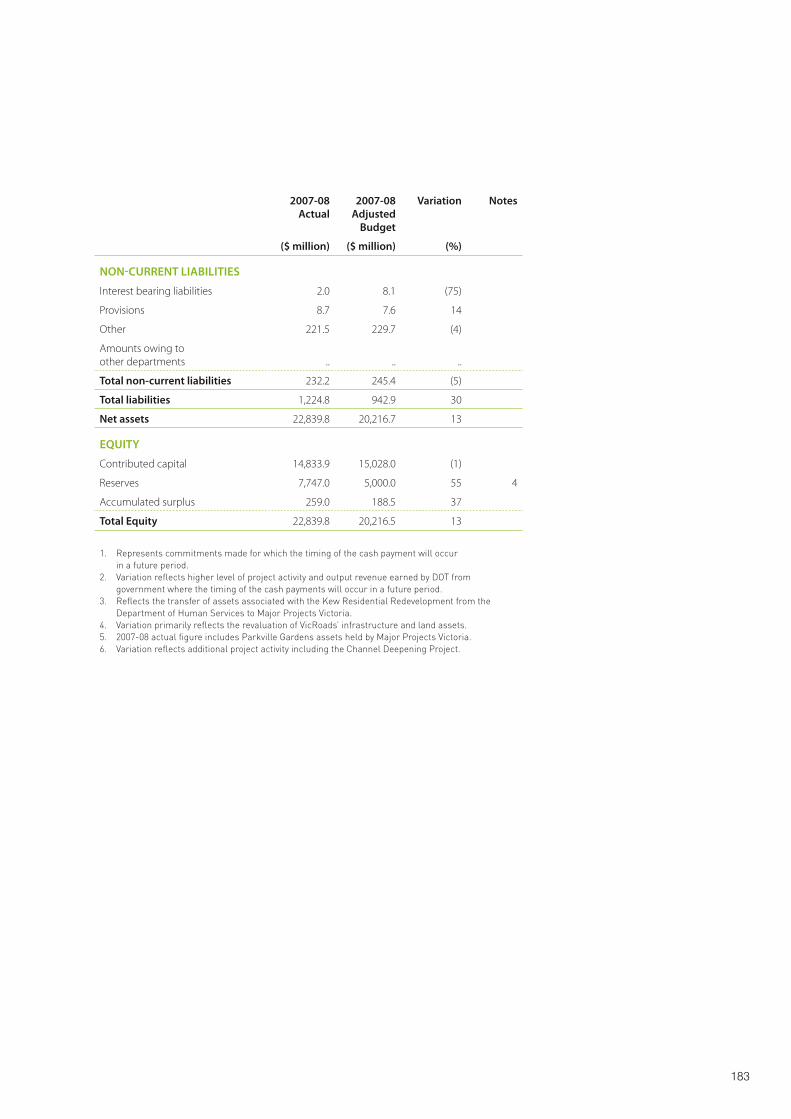
183
2007-08 Actual
2007-08 Adjusted
Budget
Variation Notes
($ million) ($ million) (%)
NON-CURRENT LIABILITIES
Interest bearing liabilities 2.0 8.1 (75)
Provisions 8.7 7.6 14
Other 221.5 229.7 (4)
Amounts owing to other departments .. .. ..
Total non-current liabilities 232.2 245.4 (5)
Total liabilities 1,224.8 942.9 30
Net assets 22,839.8 20,216.7 13
EQUITY
Contributed capital 14,833.9 15,028.0 (1)
Reserves 7,747.0 5,000.0 55 4
Accumulated surplus 259.0 188.5 37
Total Equity 22,839.8 20,216.5 13
1. Represents commitments made for which the timing of the cash payment will occur in a future period.
2. Variation reflects higher level of project activity and output revenue earned by DOT from government where the timing of the cash payments will occur in a future period.
3. Reflects the transfer of assets associated with the Kew Residential Redevelopment from the Department of Human Services to Major Projects Victoria.
4. Variation primarily reflects the revaluation of VicRoads’ infrastructure and land assets.5. 2007-08 actual figure includes Parkville Gardens assets held by Major Projects Victoria.6. Variation reflects additional project activity including the Channel Deepening Project.
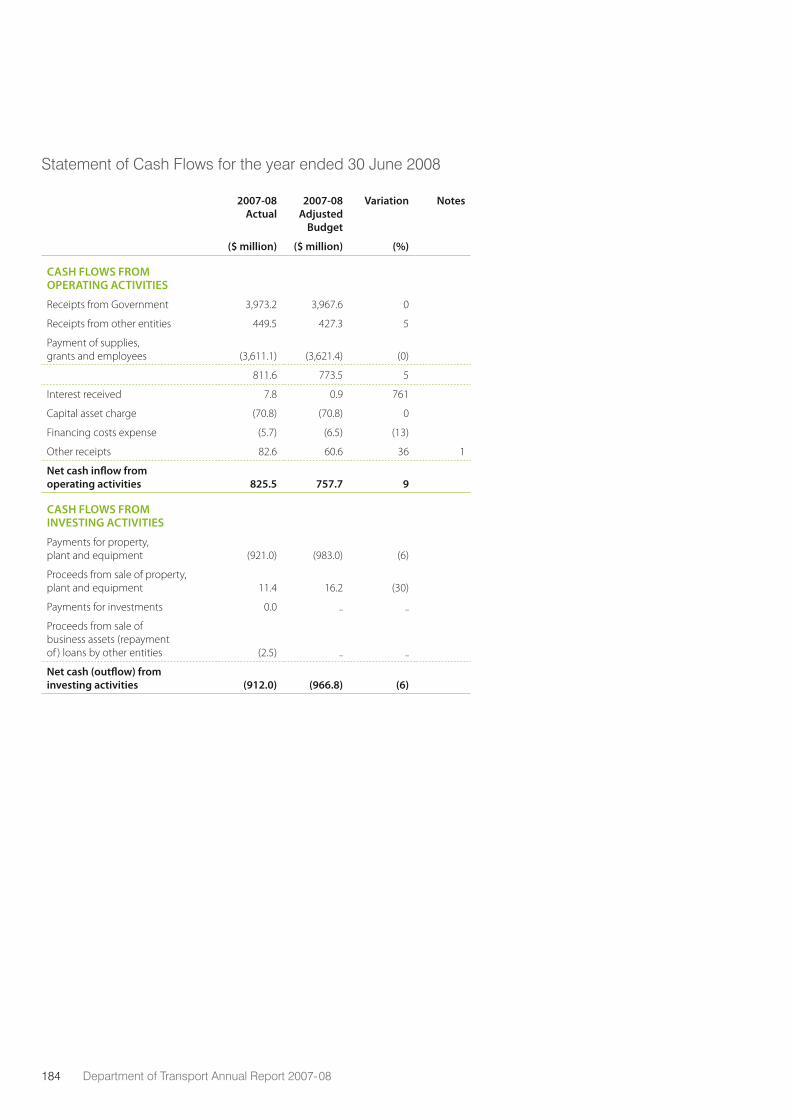
184 Department of Transport Annual Report 2007-08
Statement of Cash Flows for the year ended 30 June 2008
2007-08 Actual
2007-08 Adjusted
Budget
Variation Notes
($ million) ($ million) (%)
CASH FLOWS FROM OPERATING ACTIVITIES
Receipts from Government 3,973.2 3,967.6 0
Receipts from other entities 449.5 427.3 5
Payment of supplies, grants and employees (3,611.1) (3,621.4) (0)
811.6 773.5 5
Interest received 7.8 0.9 761
Capital asset charge (70.8) (70.8) 0
Financing costs expense (5.7) (6.5) (13)
Other receipts 82.6 60.6 36 1
Net cash inflow from operating activities 825.5 757.7 9
CASH FLOWS FROM INVESTING ACTIVITIES
Payments for property, plant and equipment (921.0) (983.0) (6)
Proceeds from sale of property, plant and equipment 11.4 16.2 (30)
Payments for investments 0.0 .. ..
Proceeds from sale of business assets (repayment of ) loans by other entities (2.5) .. ..
Net cash (outflow) from investing activities (912.0) (966.8) (6)
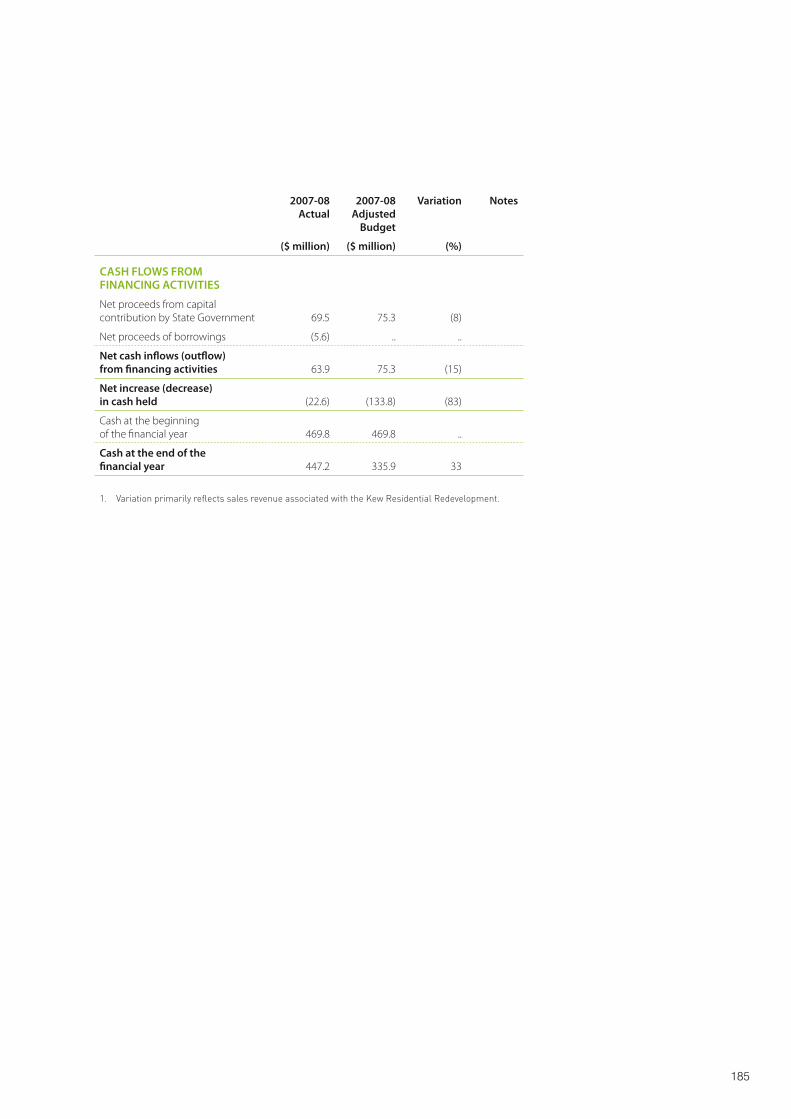
185
2007-08 Actual
2007-08 Adjusted
Budget
Variation Notes
($ million) ($ million) (%)
CASH FLOWS FROM FINANCING ACTIVITIES
Net proceeds from capital contribution by State Government 69.5 75.3 (8)
Net proceeds of borrowings (5.6) .. ..
Net cash inflows (outflow) from financing activities 63.9 75.3 (15)
Net increase (decrease) in cash held (22.6) (133.8) (83)
Cash at the beginning of the financial year 469.8 469.8 ..
Cash at the end of the financial year 447.2 335.9 33
1. Variation primarily reflects sales revenue associated with the Kew Residential Redevelopment.
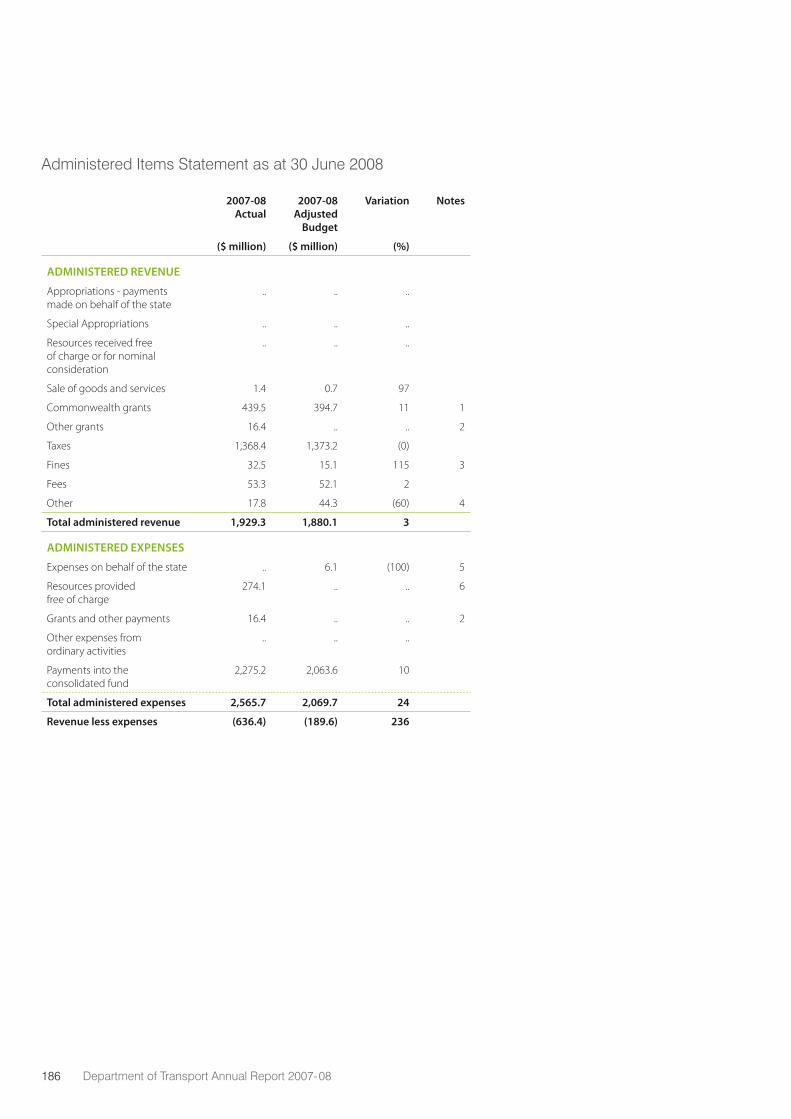
186 Department of Transport Annual Report 2007-08
Administered Items Statement as at 30 June 2008
2007-08 Actual
2007-08 Adjusted
Budget
Variation Notes
($ million) ($ million) (%)
ADMINISTERED REVENUE
Appropriations - payments made on behalf of the state
.. .. ..
Special Appropriations .. .. ..
Resources received free of charge or for nominal consideration
.. .. ..
Sale of goods and services 1.4 0.7 97
Commonwealth grants 439.5 394.7 11 1
Other grants 16.4 .. .. 2
Taxes 1,368.4 1,373.2 (0)
Fines 32.5 15.1 115 3
Fees 53.3 52.1 2
Other 17.8 44.3 (60) 4
Total administered revenue 1,929.3 1,880.1 3
ADMINISTERED EXPENSES
Expenses on behalf of the state .. 6.1 (100) 5
Resources provided free of charge
274.1 .. .. 6
Grants and other payments 16.4 .. .. 2
Other expenses from ordinary activities
.. .. ..
Payments into the consolidated fund
2,275.2 2,063.6 10
Total administered expenses 2,565.7 2,069.7 24
Revenue less expenses (636.4) (189.6) 236
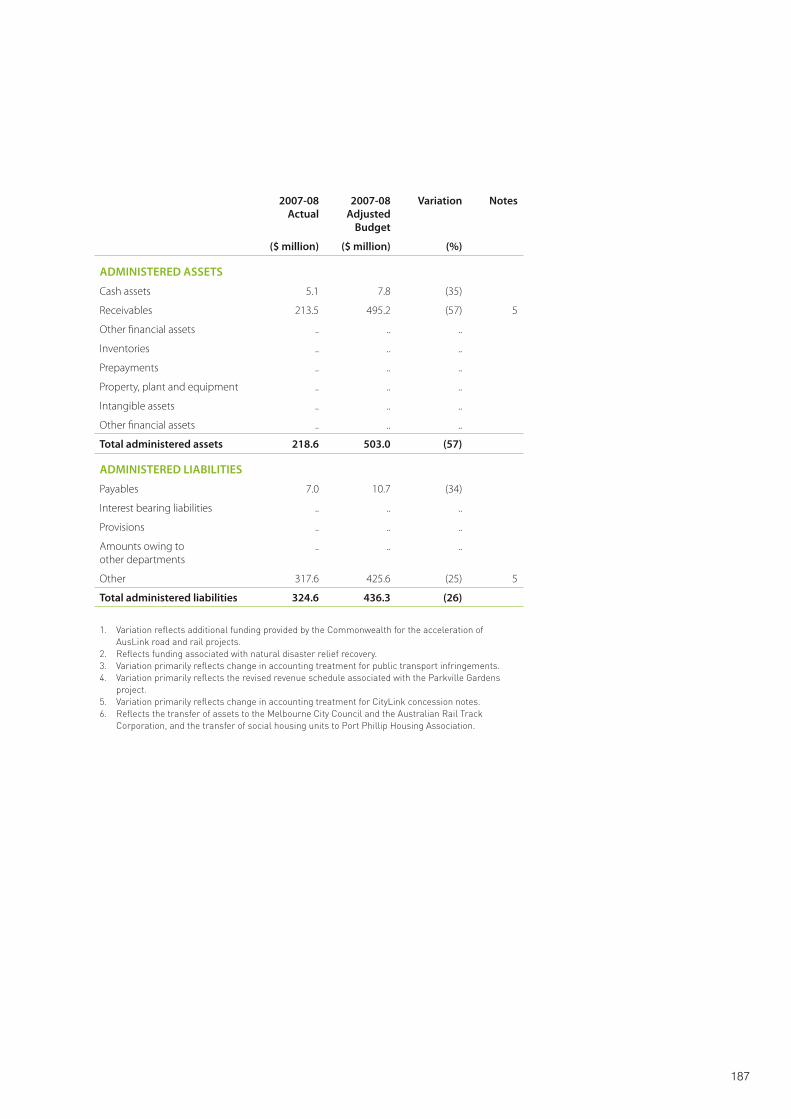
187
2007-08 Actual
2007-08 Adjusted
Budget
Variation Notes
($ million) ($ million) (%)
ADMINISTERED ASSETS
Cash assets 5.1 7.8 (35)
Receivables 213.5 495.2 (57) 5
Other financial assets .. .. ..
Inventories .. .. ..
Prepayments .. .. ..
Property, plant and equipment .. .. ..
Intangible assets .. .. ..
Other financial assets .. .. ..
Total administered assets 218.6 503.0 (57)
ADMINISTERED LIABILITIES
Payables 7.0 10.7 (34)
Interest bearing liabilities .. .. ..
Provisions .. .. ..
Amounts owing to other departments
.. .. ..
Other 317.6 425.6 (25) 5
Total administered liabilities 324.6 436.3 (26)
1. Variation reflects additional funding provided by the Commonwealth for the acceleration of AusLink road and rail projects.
2. Reflects funding associated with natural disaster relief recovery.3. Variation primarily reflects change in accounting treatment for public transport infringements.4. Variation primarily reflects the revised revenue schedule associated with the Parkville Gardens
project.5. Variation primarily reflects change in accounting treatment for CityLink concession notes.6. Reflects the transfer of assets to the Melbourne City Council and the Australian Rail Track
Corporation, and the transfer of social housing units to Port Phillip Housing Association.
188 Department of Transport Annual Report 2007-08
The following section provides details of the outputs provided to government during 2007-08, including performance measures and costs for each output.
Machinery of government changes to the department’s output structure in 2007-08, which were effective 8 August 2007, resulted in the following departmental performance measures being transferred:
Public Construction and Land Development
Transit Cities projects underway
Transit Cities projects progressed in accordance with agreed plans
Delivery of Transit Cities projects complies with agreed plans
Transit Cities projects progressed in accordance with agreed timeframes
These performance measures are reported in the 2007-08 Annual Report of the Department of Planning and Community Development.
Revenues and expenses associated with activities transferred out of DOT have been recorded in the financial report for the period 1 July 2007 to 31 August 2007.
Output costs for 2007-08 have been prepared on an Australian equivalents to International Financial Reporting Standards basis.
Notes are provided to explain elements of measurements and major variations in performance against 2007-08 targets.
Abbreviations used in tables
na not applicable nm new measure .. zero or rounded to zero
Output Performance Measures
189
Public safety and security
These outputs contribute to the achievement of the key government outcome of building friendly, confident and safe communities.
This is done by delivering initiatives and regulatory activities that improve safety in the public transport, road, and marine sectors and reduce the frequency, severity and cost of accidents and incidents. It also covers activities aimed at maintaining the security of critical infrastructure and the preparedness to respond to emergencies involving this infrastructure.
Reducing the state’s road toll is a high priority for the government. A key measure of success will be the reduction of serious injuries and deaths related to road crashes. Key departmental activities to achieve this outcome include continuing to implement arrive alive! road safety initiatives to change road user behaviour, and improving the safety of road infrastructure through initiatives such as the Safer Road Infrastructure Program.
Similar regulatory frameworks and initiatives are in place to improve safety on public transport, and on the state’s waterways relating to both commercial and private recreational vessels. The independent Office of the Chief Investigator Transport and Marine Safety Investigations, will enhance the safety programs already in place. Security of critical infrastructure is also a high priority.
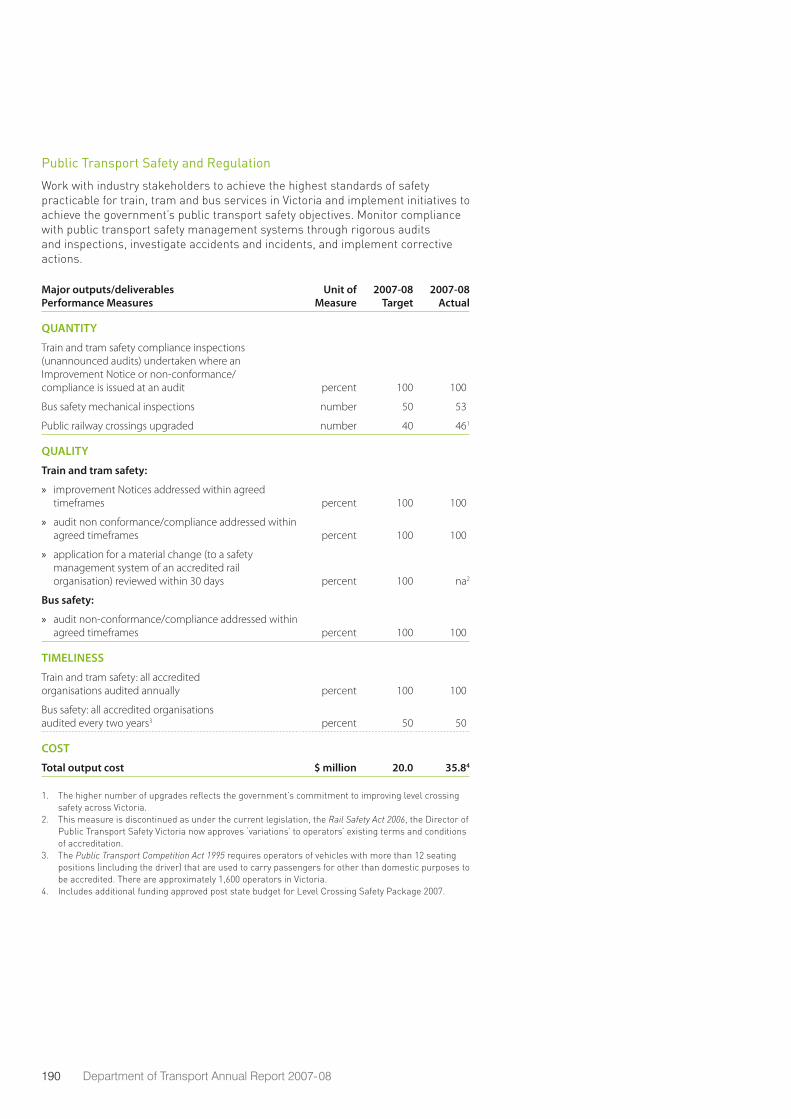
190 Department of Transport Annual Report 2007-08
Public Transport Safety and Regulation
Work with industry stakeholders to achieve the highest standards of safety practicable for train, tram and bus services in Victoria and implement initiatives to achieve the government’s public transport safety objectives. Monitor compliance with public transport safety management systems through rigorous audits and inspections, investigate accidents and incidents, and implement corrective actions.
Major outputs/deliverables Performance Measures
Unit of Measure
2007-08 Target
2007-08 Actual
QUANTITY
Train and tram safety compliance inspections (unannounced audits) undertaken where an Improvement Notice or non-conformance/compliance is issued at an audit percent 100 1001
Bus safety mechanical inspections number 50 531
Public railway crossings upgraded number 40 461
QUALITY
Train and tram safety:
improvement Notices addressed within agreed »timeframes percent 100 1001
audit non conformance/compliance addressed within »agreed timeframes percent 100 1001
application for a material change (to a safety »management system of an accredited rail organisation) reviewed within 30 days percent 100 na2
Bus safety:
audit non-conformance/compliance addressed within »agreed timeframes percent 100 1001
TIMELINESS
Train and tram safety: all accredited organisations audited annually percent 100 1001
Bus safety: all accredited organisations audited every two years3 percent 50 501
COST
Total output cost $ million 20.0 35.84
1. The higher number of upgrades reflects the government’s commitment to improving level crossing safety across Victoria.
2. This measure is discontinued as under the current legislation, the Rail Safety Act 2006, the Director of Public Transport Safety Victoria now approves ‘variations’ to operators’ existing terms and conditions of accreditation.
3. The Public Transport Competition Act 1995 requires operators of vehicles with more than 12 seating positions (including the driver) that are used to carry passengers for other than domestic purposes to be accredited. There are approximately 1,600 operators in Victoria.
4. Includes additional funding approved post state budget for Level Crossing Safety Package 2007.

191
Road Safety and Regulation
Provide a road safety program that incorporates the ‘Safe System’ approach. This approach is based on the key components of safer vehicles, safer road infrastructure and safer speeds. Essential supporting elements of the ‘Safe System’ include controlling admittance to the system, understanding crashes and risk, education and information to support road users, and legislation and enforcement of road rules.
Major outputs/deliverables Performance Measures
Unit of Measure
2007-08 Target
2007-08 Actual
QUANTITY
Road Safety Projects/Initiatives:
safe roads » number 120 1515
safe vehicles » 6 number 1 11
safe road users » number 34 317
QUALITY
Projects completed within agreed scope and standards percent 100 1008
TIMELINESS
Programmed works completed within agreed timeframes percent 100 1008
COST
Total output cost $ million 84.9 135.18
5. Works have been accelerated under the Safer Road Infrastructure Program.6. Safe Vehicles typically involves recurrent activities rather than projects. 7. Remaining projects are well progressed with completion expected in early 2008-09.8. Variation primarily reflects reclassification of activities between operating and capital.
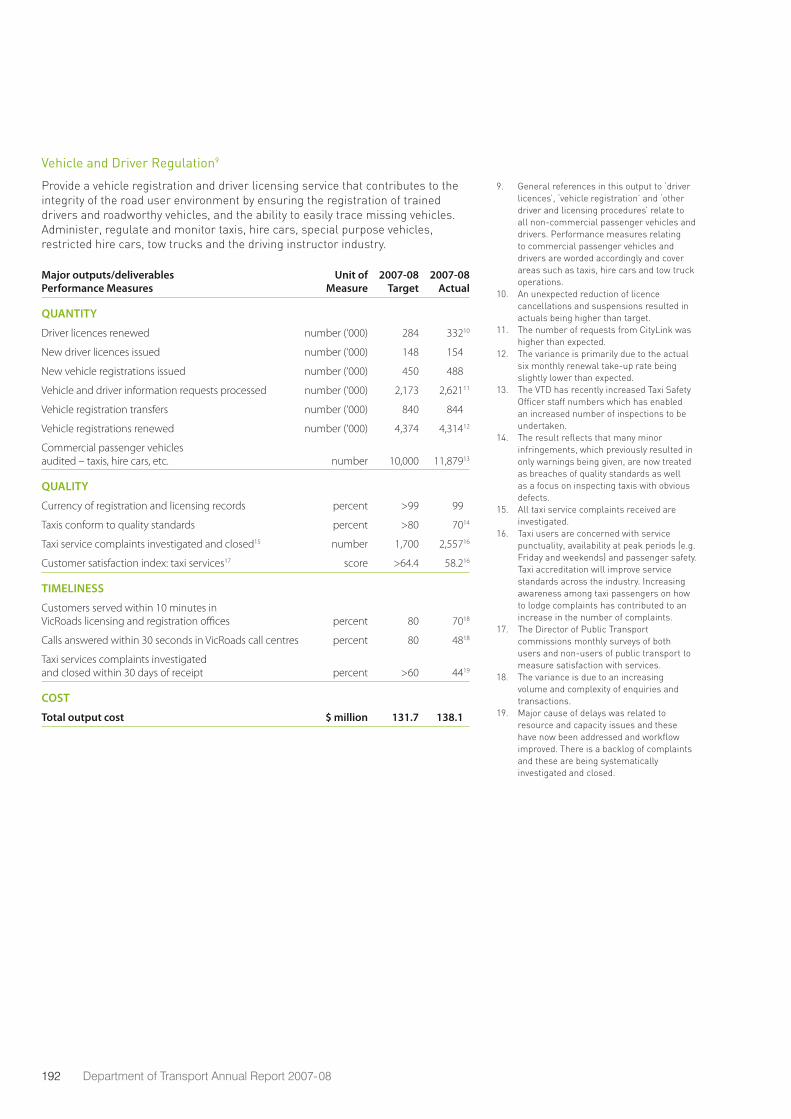
192 Department of Transport Annual Report 2007-08
Vehicle and Driver Regulation9
Provide a vehicle registration and driver licensing service that contributes to the integrity of the road user environment by ensuring the registration of trained drivers and roadworthy vehicles, and the ability to easily trace missing vehicles. Administer, regulate and monitor taxis, hire cars, special purpose vehicles, restricted hire cars, tow trucks and the driving instructor industry.
Major outputs/deliverables Performance Measures
Unit of Measure
2007-08 Target
2007-08 Actual
QUANTITY
Driver licences renewed number (‘000) 284 33210
New driver licences issued number (‘000) 148 15410
New vehicle registrations issued number (‘000) 450 48810
Vehicle and driver information requests processed number (‘000) 2,173 2,62111
Vehicle registration transfers number (‘000) 840 84410
Vehicle registrations renewed number (‘000) 4,374 4,31412
Commercial passenger vehicles audited – taxis, hire cars, etc. number 10,000 11,87913
QUALITY
Currency of registration and licensing records percent >99 9910
Taxis conform to quality standards percent >80 7014
Taxi service complaints investigated and closed15 number 1,700 2,55716
Customer satisfaction index: taxi services17 score >64.4 58.216
TIMELINESS
Customers served within 10 minutes in VicRoads licensing and registration offices percent 80 7018
Calls answered within 30 seconds in VicRoads call centres percent 80 4818
Taxi services complaints investigated and closed within 30 days of receipt percent >60 4419
COST
Total output cost $ million 131.7 138.110
9. General references in this output to ‘driver licences’, ‘vehicle registration’ and ‘other driver and licensing procedures’ relate to all non-commercial passenger vehicles and drivers. Performance measures relating to commercial passenger vehicles and drivers are worded accordingly and cover areas such as taxis, hire cars and tow truck operations.
10. An unexpected reduction of licence cancellations and suspensions resulted in actuals being higher than target.
11. The number of requests from CityLink was higher than expected.
12. The variance is primarily due to the actual six monthly renewal take-up rate being slightly lower than expected.
13. The VTD has recently increased Taxi Safety Officer staff numbers which has enabled an increased number of inspections to be undertaken.
14. The result reflects that many minor infringements, which previously resulted in only warnings being given, are now treated as breaches of quality standards as well as a focus on inspecting taxis with obvious defects.
15. All taxi service complaints received are investigated.
16. Taxi users are concerned with service punctuality, availability at peak periods (e.g. Friday and weekends) and passenger safety. Taxi accreditation will improve service standards across the industry. Increasing awareness among taxi passengers on how to lodge complaints has contributed to an increase in the number of complaints.
17. The Director of Public Transport commissions monthly surveys of both users and non-users of public transport to measure satisfaction with services.
18. The variance is due to an increasing volume and complexity of enquiries and transactions.
19. Major cause of delays was related to resource and capacity issues and these have now been addressed and workflow improved. There is a backlog of complaints and these are being systematically investigated and closed.
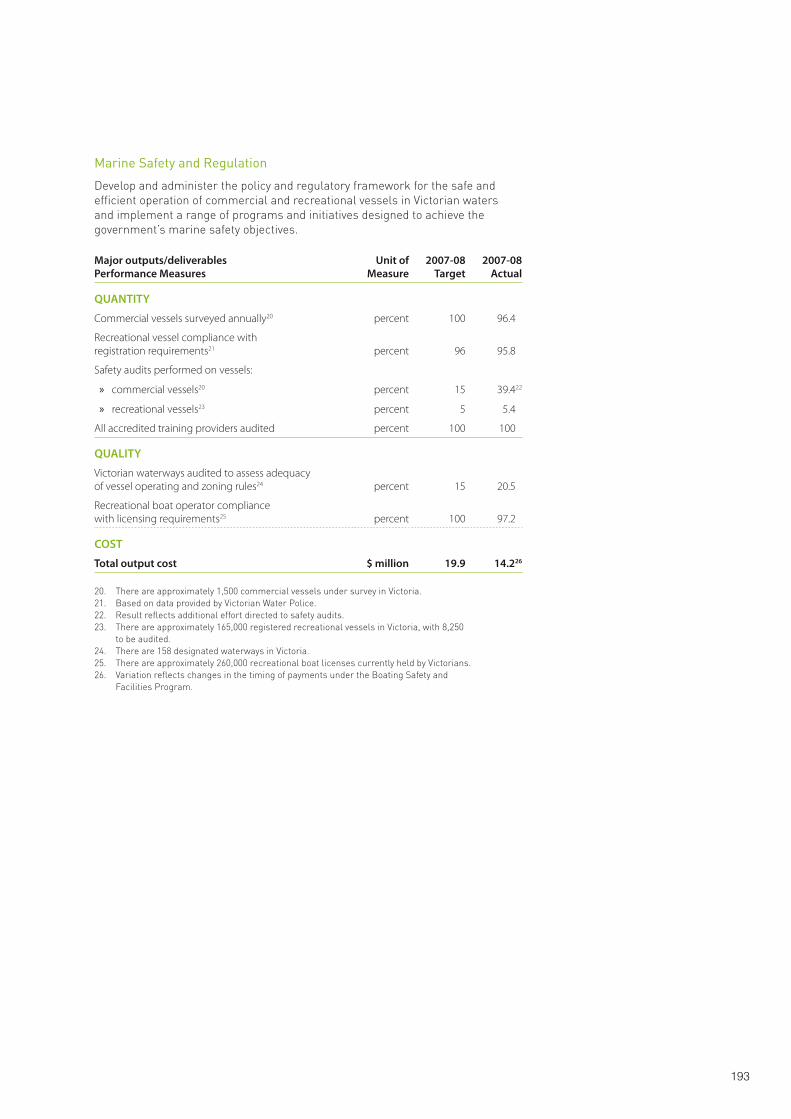
193
Marine Safety and Regulation
Develop and administer the policy and regulatory framework for the safe and efficient operation of commercial and recreational vessels in Victorian waters and implement a range of programs and initiatives designed to achieve the government’s marine safety objectives.
Major outputs/deliverables Performance Measures
Unit of Measure
2007-08 Target
2007-08 Actual
QUANTITY
Commercial vessels surveyed annually20 percent 100 96.410
Recreational vessel compliance with registration requirements21 percent 96 95.810
Safety audits performed on vessels:
» commercial vessels20 percent 15 39.422
» recreational vessels23 percent 5 5.410
All accredited training providers audited percent 100 10010
QUALITY
Victorian waterways audited to assess adequacy of vessel operating and zoning rules24 percent 15 20.510
Recreational boat operator compliance with licensing requirements25 percent 100 97.210
COST
Total output cost $ million 19.9 14.226
20. There are approximately 1,500 commercial vessels under survey in Victoria.21. Based on data provided by Victorian Water Police.22. Result reflects additional effort directed to safety audits.23. There are approximately 165,000 registered recreational vessels in Victoria, with 8,250
to be audited.24. There are 158 designated waterways in Victoria.25. There are approximately 260,000 recreational boat licenses currently held by Victorians.26. Variation reflects changes in the timing of payments under the Boating Safety and
Facilities Program.
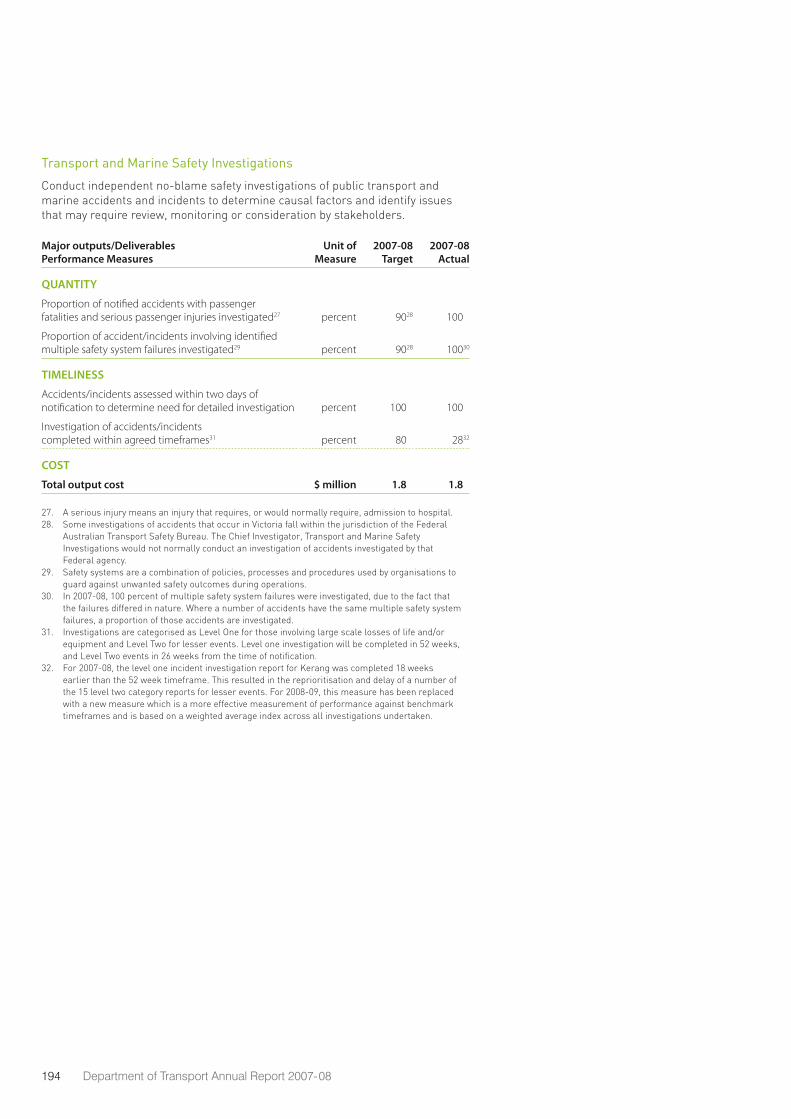
194 Department of Transport Annual Report 2007-08
Transport and Marine Safety Investigations
Conduct independent no-blame safety investigations of public transport and marine accidents and incidents to determine causal factors and identify issues that may require review, monitoring or consideration by stakeholders.
Major outputs/Deliverables Performance Measures
Unit of Measure
2007-08 Target
2007-08 Actual
QUANTITY
Proportion of notified accidents with passenger fatalities and serious passenger injuries investigated27 percent 9028 10010
Proportion of accident/incidents involving identified multiple safety system failures investigated29 percent 9028 10030
TIMELINESS
Accidents/incidents assessed within two days of notification to determine need for detailed investigation percent 10010 10010
Investigation of accidents/incidents completed within agreed timeframes31 percent 8010 2832
COST
Total output cost $ million 1.810 1.810
27. A serious injury means an injury that requires, or would normally require, admission to hospital.28. Some investigations of accidents that occur in Victoria fall within the jurisdiction of the Federal
Australian Transport Safety Bureau. The Chief Investigator, Transport and Marine Safety Investigations would not normally conduct an investigation of accidents investigated by that Federal agency.
29. Safety systems are a combination of policies, processes and procedures used by organisations to guard against unwanted safety outcomes during operations.
30. In 2007-08, 100 percent of multiple safety system failures were investigated, due to the fact that the failures differed in nature. Where a number of accidents have the same multiple safety system failures, a proportion of those accidents are investigated.
31. Investigations are categorised as Level One for those involving large scale losses of life and/or equipment and Level Two for lesser events. Level one investigation will be completed in 52 weeks, and Level Two events in 26 weeks from the time of notification.
32. For 2007-08, the level one incident investigation report for Kerang was completed 18 weeks earlier than the 52 week timeframe. This resulted in the reprioritisation and delay of a number of the 15 level two category reports for lesser events. For 2008-09, this measure has been replaced with a new measure which is a more effective measurement of performance against benchmark timeframes and is based on a weighted average index across all investigations undertaken.
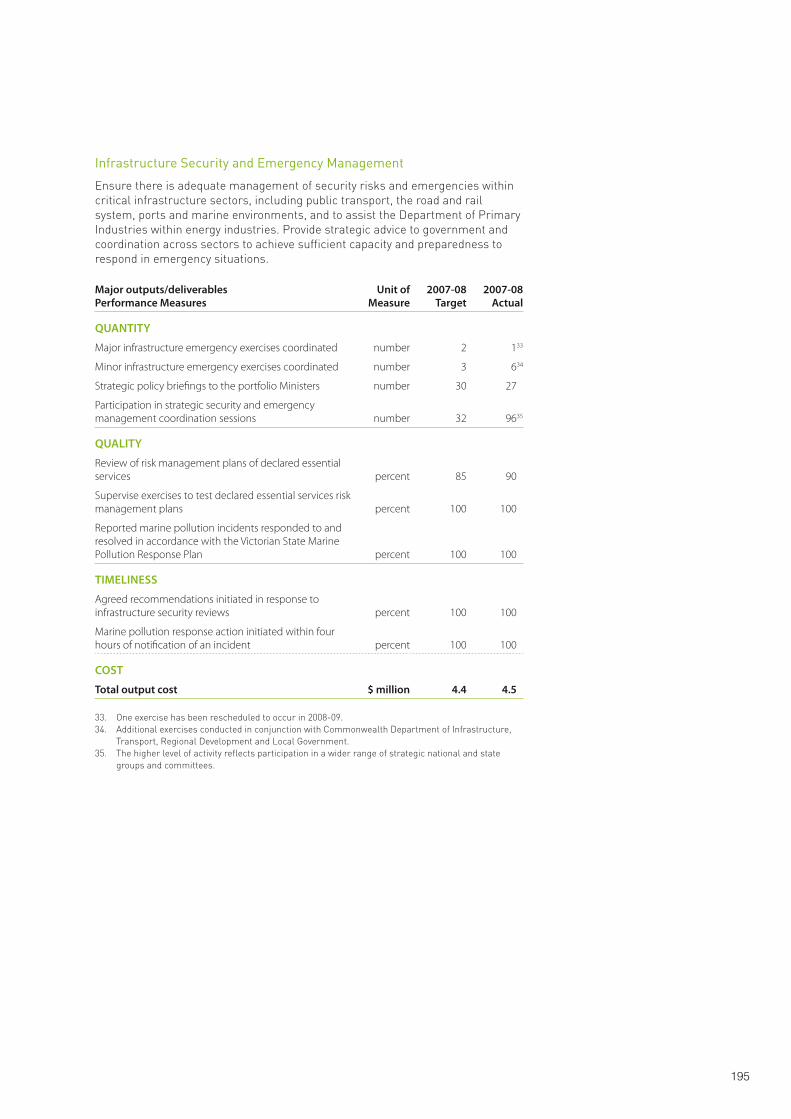
195
Infrastructure Security and Emergency Management
Ensure there is adequate management of security risks and emergencies within critical infrastructure sectors, including public transport, the road and rail system, ports and marine environments, and to assist the Department of Primary Industries within energy industries. Provide strategic advice to government and coordination across sectors to achieve sufficient capacity and preparedness to respond in emergency situations.
Major outputs/deliverables Performance Measures
Unit of Measure
2007-08 Target
2007-08 Actual
QUANTITY
Major infrastructure emergency exercises coordinated number 2 133
Minor infrastructure emergency exercises coordinated number 3 634
Strategic policy briefings to the portfolio Ministers number 30 2710
Participation in strategic security and emergency management coordination sessions number 32 9635
QUALITY
Review of risk management plans of declared essential services percent 85 9010
Supervise exercises to test declared essential services risk management plans percent 100 10010
Reported marine pollution incidents responded to and resolved in accordance with the Victorian State Marine Pollution Response Plan percent 100 10010
TIMELINESS
Agreed recommendations initiated in response to infrastructure security reviews percent 100 10010
Marine pollution response action initiated within four hours of notification of an incident percent 100 10010
COST
Total output cost $ million 4.4 4.510
33. One exercise has been rescheduled to occur in 2008-09.34. Additional exercises conducted in conjunction with Commonwealth Department of Infrastructure,
Transport, Regional Development and Local Government.35. The higher level of activity reflects participation in a wider range of strategic national and state
groups and committees.
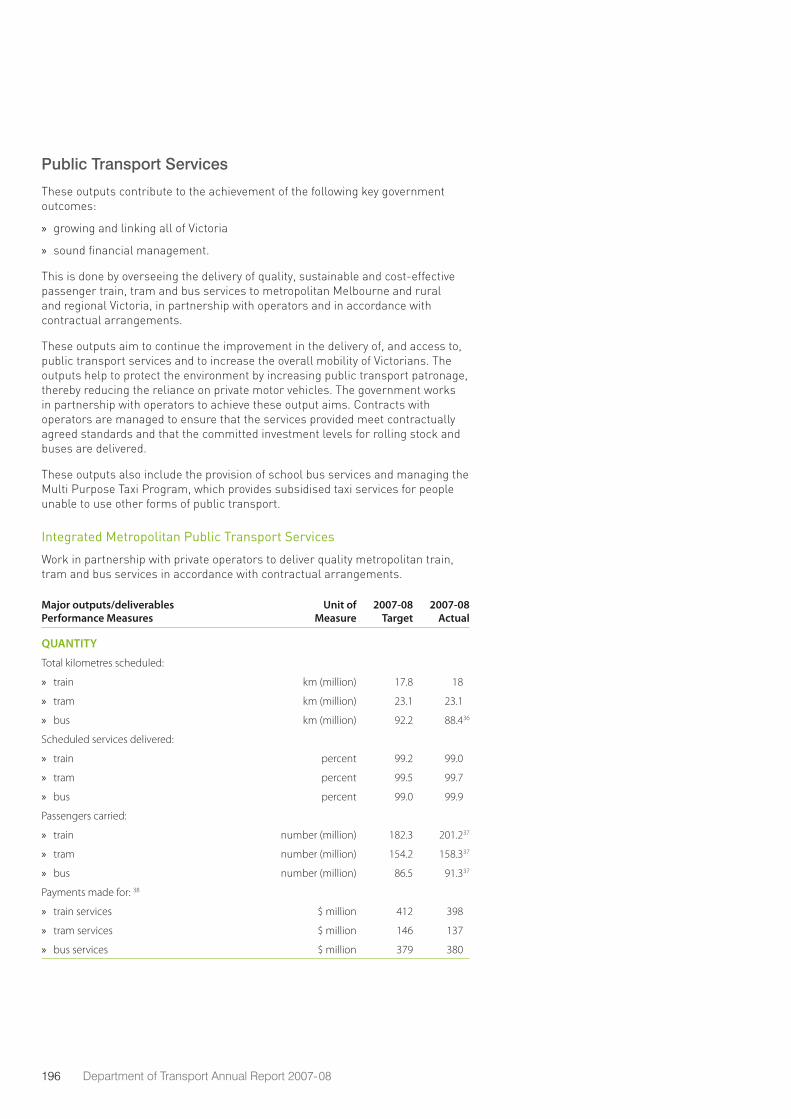
196 Department of Transport Annual Report 2007-08
Public Transport Services
These outputs contribute to the achievement of the following key government outcomes:
» growing and linking all of Victoria
» sound financial management.
This is done by overseeing the delivery of quality, sustainable and cost-effective passenger train, tram and bus services to metropolitan Melbourne and rural and regional Victoria, in partnership with operators and in accordance with contractual arrangements.
These outputs aim to continue the improvement in the delivery of, and access to, public transport services and to increase the overall mobility of Victorians. The outputs help to protect the environment by increasing public transport patronage, thereby reducing the reliance on private motor vehicles. The government works in partnership with operators to achieve these output aims. Contracts with operators are managed to ensure that the services provided meet contractually agreed standards and that the committed investment levels for rolling stock and buses are delivered.
These outputs also include the provision of school bus services and managing the Multi Purpose Taxi Program, which provides subsidised taxi services for people unable to use other forms of public transport.
Integrated Metropolitan Public Transport Services
Work in partnership with private operators to deliver quality metropolitan train, tram and bus services in accordance with contractual arrangements.
Major outputs/deliverables Performance Measures
Unit of Measure
2007-08 Target
2007-08 Actual
QUANTITY
Total kilometres scheduled:
train » km (million) 17.8 1810
tram » km (million) 23.1 23.110
bus » km (million) 92.2 88.436
Scheduled services delivered:
train » percent 99.2 99.010
tram » percent 99.5 99.710
bus » percent 99.0 99.910
Passengers carried:
train » number (million) 182.3 201.237
tram » number (million) 154.2 158.337
bus » number (million) 86.5 91.337
Payments made for: 38
train services » $ million 412 39810
tram services » $ million 146 13710
bus services » $ million 379 38010
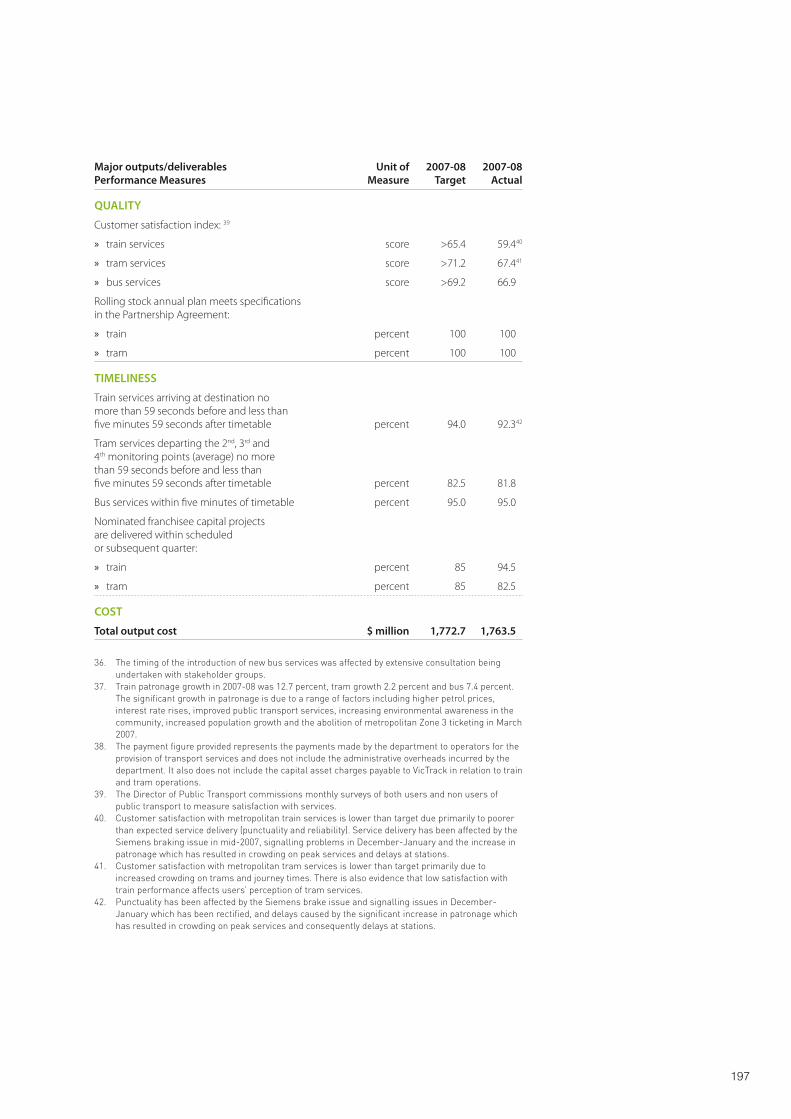
197
Major outputs/deliverables Performance Measures
Unit of Measure
2007-08 Target
2007-08 Actual
QUALITY
Customer satisfaction index: 39
train services » score >65.4 59.440
tram services » score >71.2 67.441
bus services » score >69.2 66.910
Rolling stock annual plan meets specifications in the Partnership Agreement:
train » percent 100 10010
tram » percent 100 10010
TIMELINESS
Train services arriving at destination no more than 59 seconds before and less than five minutes 59 seconds after timetable percent 94.0 92.342
Tram services departing the 2nd, 3rd and 4th monitoring points (average) no more than 59 seconds before and less than five minutes 59 seconds after timetable percent 82.5 81.810
Bus services within five minutes of timetable percent 95.0 95.010
Nominated franchisee capital projects are delivered within scheduled or subsequent quarter:
train » percent 85 94.510
tram » percent 85 82.510
COST
Total output cost $ million 1,772.7 1,763.510
36. The timing of the introduction of new bus services was affected by extensive consultation being undertaken with stakeholder groups.
37. Train patronage growth in 2007-08 was 12.7 percent, tram growth 2.2 percent and bus 7.4 percent. The significant growth in patronage is due to a range of factors including higher petrol prices, interest rate rises, improved public transport services, increasing environmental awareness in the community, increased population growth and the abolition of metropolitan Zone 3 ticketing in March 2007.
38. The payment figure provided represents the payments made by the department to operators for the provision of transport services and does not include the administrative overheads incurred by the department. It also does not include the capital asset charges payable to VicTrack in relation to train and tram operations.
39. The Director of Public Transport commissions monthly surveys of both users and non users of public transport to measure satisfaction with services.
40. Customer satisfaction with metropolitan train services is lower than target due primarily to poorer than expected service delivery (punctuality and reliability). Service delivery has been affected by the Siemens braking issue in mid-2007, signalling problems in December-January and the increase in patronage which has resulted in crowding on peak services and delays at stations.
41. Customer satisfaction with metropolitan tram services is lower than target primarily due to increased crowding on trams and journey times. There is also evidence that low satisfaction with train performance affects users’ perception of tram services.
42. Punctuality has been affected by the Siemens brake issue and signalling issues in December-January which has been rectified, and delays caused by the significant increase in patronage which has resulted in crowding on peak services and consequently delays at stations.
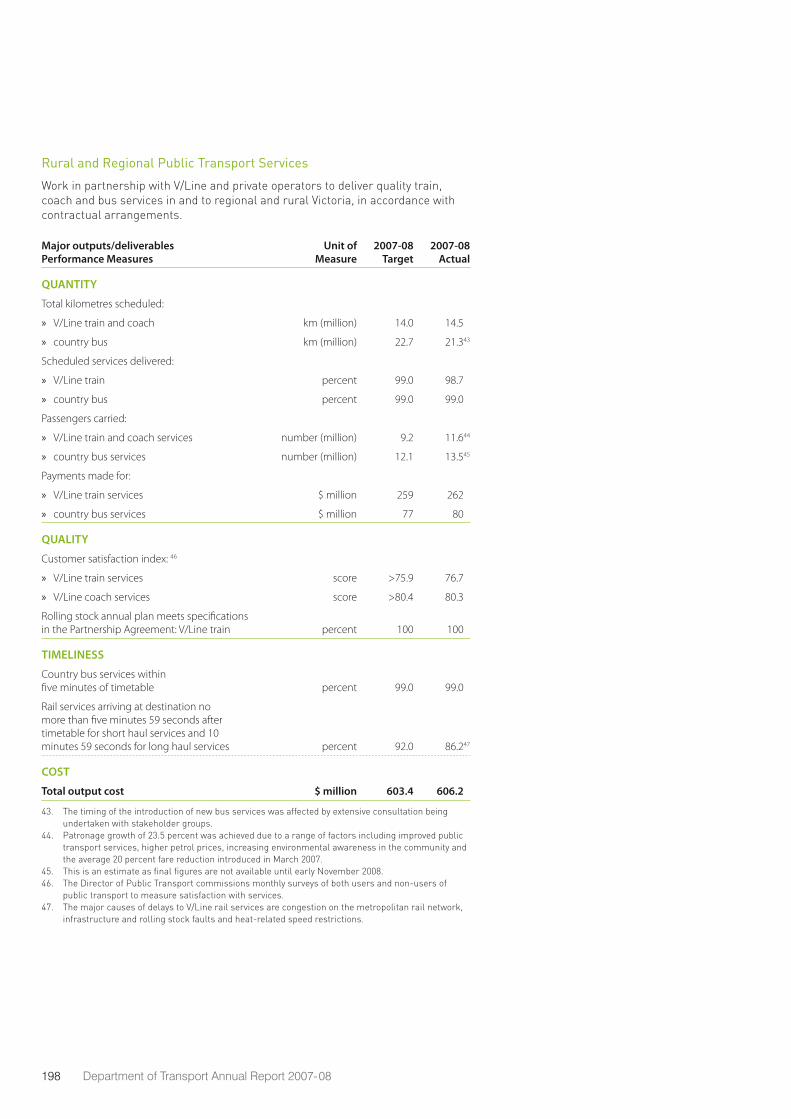
198 Department of Transport Annual Report 2007-08
Rural and Regional Public Transport Services
Work in partnership with V/Line and private operators to deliver quality train, coach and bus services in and to regional and rural Victoria, in accordance with contractual arrangements.
Major outputs/deliverables Performance Measures
Unit of Measure
2007-08 Target
2007-08 Actual
QUANTITY
Total kilometres scheduled:
V/Line train and coach » km (million) 14.0 14.510
country bus » km (million) 22.7 21.343
Scheduled services delivered:
V/Line train » percent 99.0 98.710
country bus » percent 99.0 99.010
Passengers carried:
V/Line train and coach services » number (million) 9.2 11.644
country bus services » number (million) 12.1 13.545
Payments made for:
V/Line train services » $ million 259 26210
country bus services » $ million 77 8010
QUALITY
Customer satisfaction index: 46
V/Line train services » score >75.9 76.710
V/Line coach services » score >80.4 80.310
Rolling stock annual plan meets specifications in the Partnership Agreement: V/Line train percent 100 10010
TIMELINESS
Country bus services within five minutes of timetable percent 99.0 99.010
Rail services arriving at destination no more than five minutes 59 seconds after timetable for short haul services and 10 minutes 59 seconds for long haul services percent 92.0 86.247
COST
Total output cost $ million 603.4 606.210
43. The timing of the introduction of new bus services was affected by extensive consultation being undertaken with stakeholder groups.
44. Patronage growth of 23.5 percent was achieved due to a range of factors including improved public transport services, higher petrol prices, increasing environmental awareness in the community and the average 20 percent fare reduction introduced in March 2007.
45. This is an estimate as final figures are not available until early November 2008.46. The Director of Public Transport commissions monthly surveys of both users and non-users of
public transport to measure satisfaction with services.47. The major causes of delays to V/Line rail services are congestion on the metropolitan rail network,
infrastructure and rolling stock faults and heat-related speed restrictions.
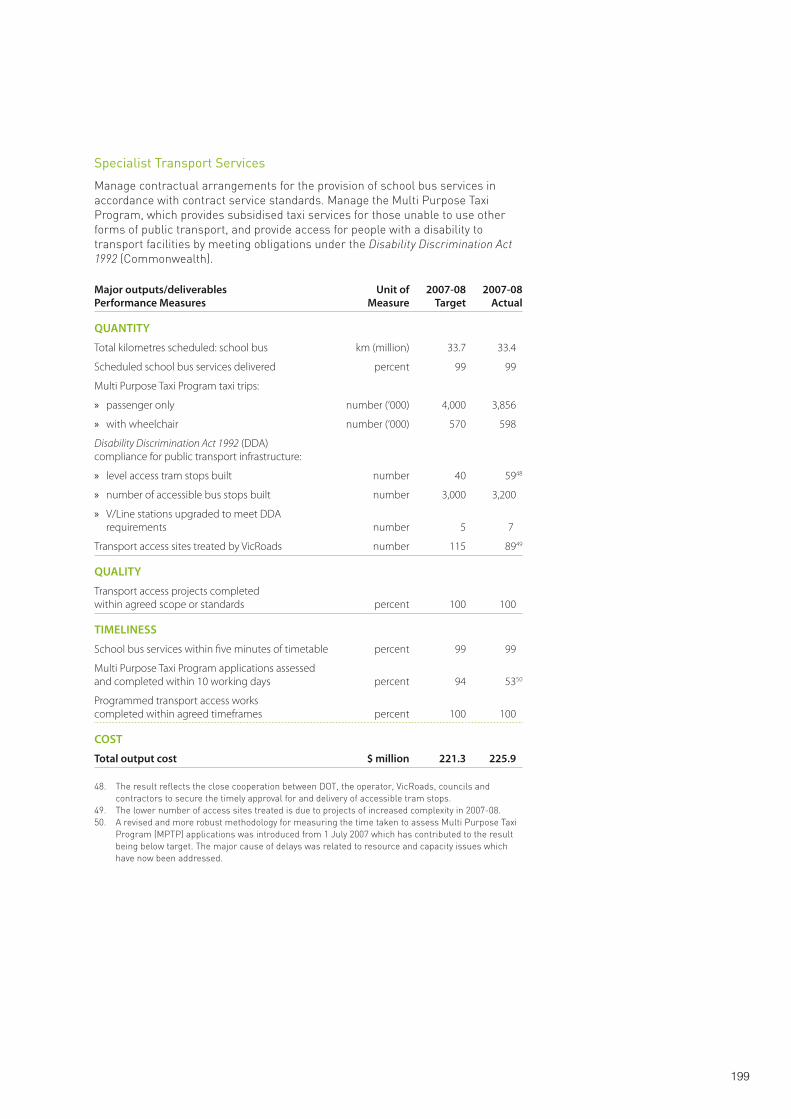
199
Specialist Transport Services
Manage contractual arrangements for the provision of school bus services in accordance with contract service standards. Manage the Multi Purpose Taxi Program, which provides subsidised taxi services for those unable to use other forms of public transport, and provide access for people with a disability to transport facilities by meeting obligations under the Disability Discrimination Act 1992 (Commonwealth).
Major outputs/deliverables Performance Measures
Unit of Measure
2007-08 Target
2007-08 Actual
QUANTITY
Total kilometres scheduled: school bus km (million) 33.7 33.410
Scheduled school bus services delivered percent 99 9910
Multi Purpose Taxi Program taxi trips:
passenger only » number (‘000) 4,000 3,85610
with wheelchair » number (‘000) 570 59810
Disability Discrimination Act 1992 (DDA) compliance for public transport infrastructure:
level access tram stops built » number 40 5948
number of accessible bus stops built » number 3,000 3,20010
V/Line stations upgraded to meet DDA »requirements number 5 7 10
Transport access sites treated by VicRoads number 115 8949
QUALITY
Transport access projects completed within agreed scope or standards percent 100 10010
TIMELINESS
School bus services within five minutes of timetable percent 99 9910
Multi Purpose Taxi Program applications assessed and completed within 10 working days percent 94 5350
Programmed transport access works completed within agreed timeframes percent 100 10010
COST
Total output cost $ million 221.3 225.910
48. The result reflects the close cooperation between DOT, the operator, VicRoads, councils and contractors to secure the timely approval for and delivery of accessible tram stops.
49. The lower number of access sites treated is due to projects of increased complexity in 2007-08. 50. A revised and more robust methodology for measuring the time taken to assess Multi Purpose Taxi
Program (MPTP) applications was introduced from 1 July 2007 which has contributed to the result being below target. The major cause of delays was related to resource and capacity issues which have now been addressed.
200 Department of Transport Annual Report 2007-08
These outputs make a significant contribution to the achievement of the following key government outcomes:
growing and linking all of Victoria »
sound financial management »
more quality jobs and thriving, »innovative industries across Victoria
greater public participation and »more accountable government.
These outputs do this by providing the government with strategic policy and development guidance in relation to integrated transport planning, implementing targeted industry and community programs, and delivering cost-effective, long-term investment in, and management of, public infrastructure and major government projects in Victoria. Implementation of the government’s Meeting Our Transport Challenges: Connecting Victorian Communities 10-year action plan is reflected in many of the projects and milestones reported in these outputs.
The government is committed to building better, more accessible transport links for the state. This includes improving the integration, across government, of transport and land-use planning, increasing the use of public transport and strengthening the connections between our ports, industry and agricultural centres. These outputs deliver a combination of strategic road and rail infrastructure improvements to manage congestion and improve the movement of people and goods throughout Victoria. They also encompass infrastructure projects that will extend and increase capacity on the metropolitan train network; improve control and communications across the metropolitan train network; reopen country passenger rail services; improve strategic arterial road links; and establish a major tollway linking the city’s south-eastern suburbs.
Within the Public Construction and Land Development output, the department assesses the feasibility of infrastructure development options and coordinates the delivery of a variety of infrastructure projects. These are in addition to a number of major construction projects that are funded through other government departments and which are delivered by Major Projects Victoria as a service to the host departments and agencies. The latter projects are not reported in the department’s output statements.
Infrastructure Planning, Delivery and Management
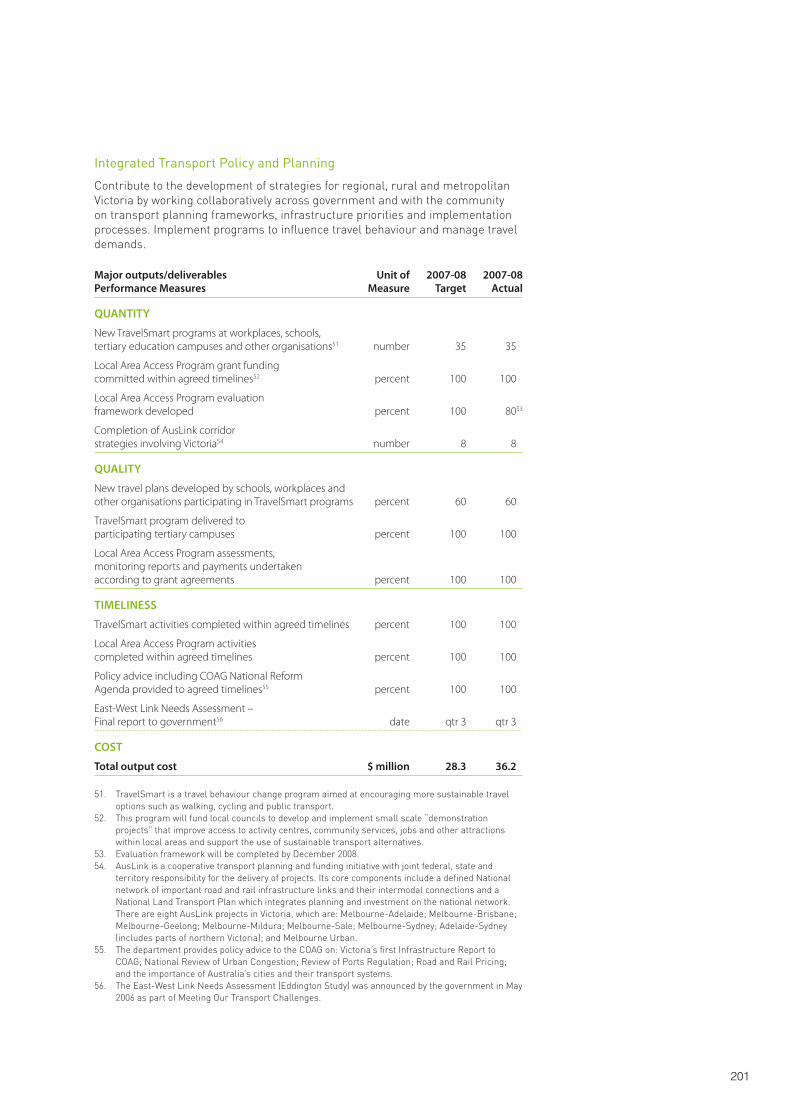
201
Integrated Transport Policy and Planning
Contribute to the development of strategies for regional, rural and metropolitan Victoria by working collaboratively across government and with the community on transport planning frameworks, infrastructure priorities and implementation processes. Implement programs to influence travel behaviour and manage travel demands.
Major outputs/deliverables Performance Measures
Unit of Measure
2007-08 Target
2007-08 Actual
QUANTITY
New TravelSmart programs at workplaces, schools, tertiary education campuses and other organisations51 number 35 3510
Local Area Access Program grant funding committed within agreed timelines52 percent 100 10010
Local Area Access Program evaluation framework developed percent 100 8053
Completion of AusLink corridor strategies involving Victoria54 number 8 810
QUALITY
New travel plans developed by schools, workplaces and other organisations participating in TravelSmart programs percent 60 6010
TravelSmart program delivered to participating tertiary campuses percent 100 10010
Local Area Access Program assessments, monitoring reports and payments undertaken according to grant agreements percent 100 10010
TIMELINESS
TravelSmart activities completed within agreed timelines percent 100 10010
Local Area Access Program activities completed within agreed timelines percent 100 10010
Policy advice including COAG National Reform Agenda provided to agreed timelines55 percent 100 10010
East-West Link Needs Assessment – Final report to government56 date qtr 3 qtr 310
COST
Total output cost $ million 28.3 36.210
51. TravelSmart is a travel behaviour change program aimed at encouraging more sustainable travel options such as walking, cycling and public transport.
52. This program will fund local councils to develop and implement small scale “demonstration projects” that improve access to activity centres, community services, jobs and other attractions within local areas and support the use of sustainable transport alternatives.
53. Evaluation framework will be completed by December 2008.54. AusLink is a cooperative transport planning and funding initiative with joint federal, state and
territory responsibility for the delivery of projects. Its core components include a defined National network of important road and rail infrastructure links and their intermodal connections and a National Land Transport Plan which integrates planning and investment on the national network. There are eight AusLink projects in Victoria, which are: Melbourne-Adelaide; Melbourne-Brisbane; Melbourne-Geelong; Melbourne-Mildura; Melbourne-Sale; Melbourne-Sydney; Adelaide-Sydney (includes parts of northern Victoria); and Melbourne Urban.
55. The department provides policy advice to the COAG on: Victoria’s first Infrastructure Report to COAG; National Review of Urban Congestion; Review of Ports Regulation; Road and Rail Pricing; and the importance of Australia’s cities and their transport systems.
56. The East-West Link Needs Assessment (Eddington Study) was announced by the government in May 2006 as part of Meeting Our Transport Challenges.
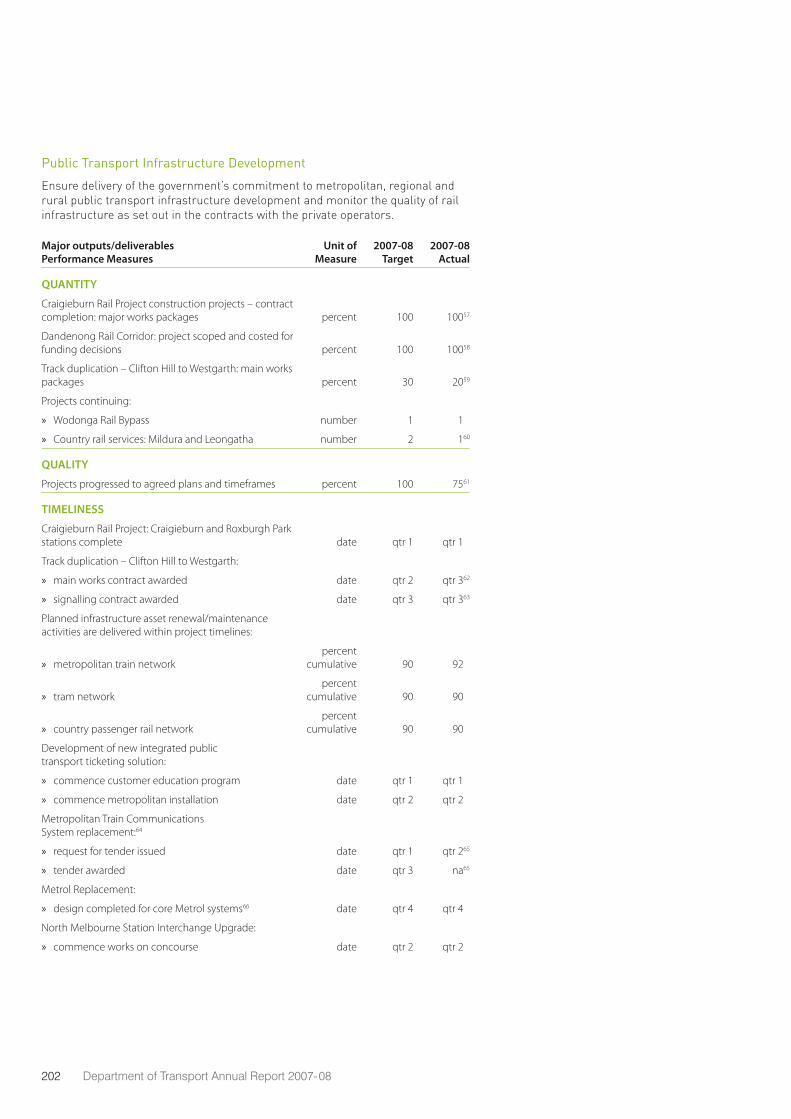
202 Department of Transport Annual Report 2007-08
Public Transport Infrastructure Development
Ensure delivery of the government’s commitment to metropolitan, regional and rural public transport infrastructure development and monitor the quality of rail infrastructure as set out in the contracts with the private operators.
Major outputs/deliverables Performance Measures
Unit of Measure
2007-08 Target
2007-08 Actual
QUANTITY
Craigieburn Rail Project construction projects – contract completion: major works packages percent 100 10057
Dandenong Rail Corridor: project scoped and costed for funding decisions percent 100 10058
Track duplication – Clifton Hill to Westgarth: main works packages percent 30 2059
Projects continuing:
Wodonga Rail Bypass » number 1 110
Country rail services: Mildura and Leongatha » number 2 160
QUALITY
Projects progressed to agreed plans and timeframes percent 100 7561
TIMELINESS
Craigieburn Rail Project: Craigieburn and Roxburgh Park stations complete date qtr 1 qtr 110
Track duplication – Clifton Hill to Westgarth:
main works contract awarded » date qtr 2 qtr 362
signalling contract awarded » date qtr 3 qtr 363
Planned infrastructure asset renewal/maintenance activities are delivered within project timelines:
metropolitan train network »percent
cumulative 90 9210
tram network »percent
cumulative 90 9010
country passenger rail network »percent
cumulative 90 9010
Development of new integrated public transport ticketing solution:
commence customer education program » date qtr 1 qtr 110
commence metropolitan installation » date qtr 2 qtr 210
Metropolitan Train Communications System replacement:64
request for tender issued » date qtr 1 qtr 265
tender awarded » date qtr 3 na65
Metrol Replacement:
design completed for core Metrol systems » 66 date qtr 4 qtr 410
North Melbourne Station Interchange Upgrade:
commence works on concourse » date qtr 2 qtr 210
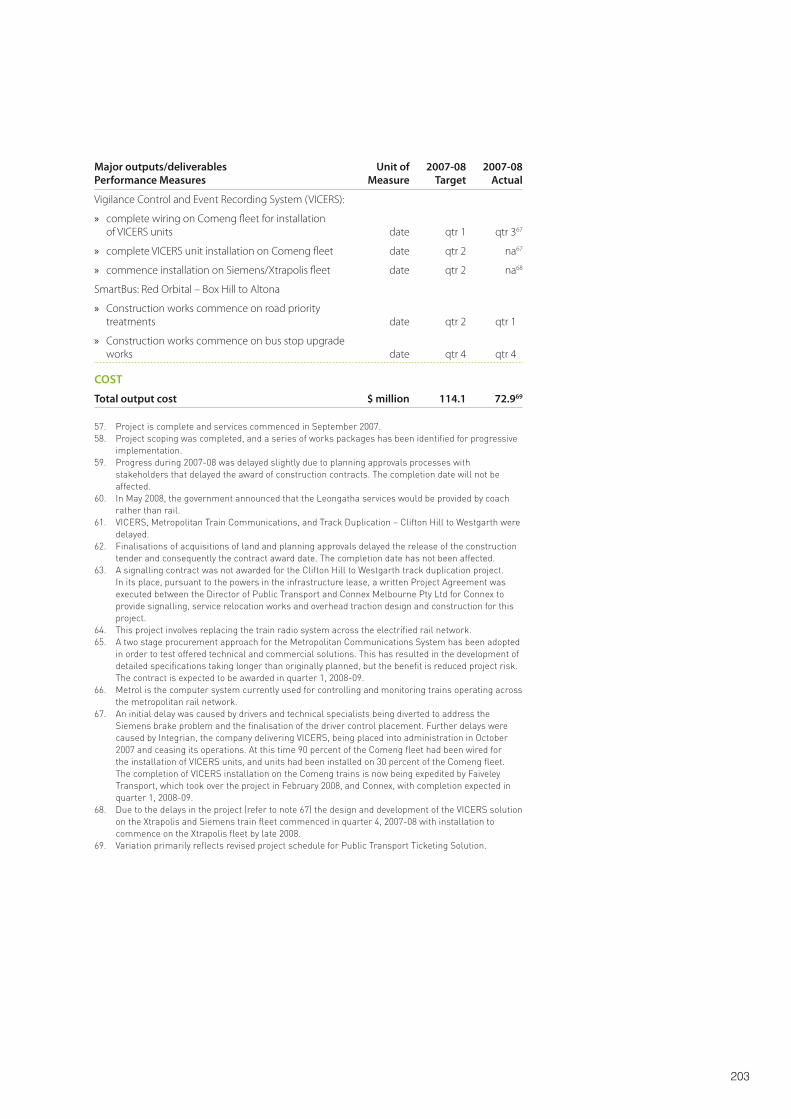
203
Major outputs/deliverables Performance Measures
Unit of Measure
2007-08 Target
2007-08 Actual
Vigilance Control and Event Recording System (VICERS):
complete wiring on Comeng fleet for installation »of VICERS units date qtr 1 qtr 367
complete VICERS unit installation on Comeng fleet » date qtr 2 na67
commence installation on Siemens/Xtrapolis fleet » date qtr 2 na68
SmartBus: Red Orbital – Box Hill to Altona
Construction works commence on road priority »treatments date qtr 2 qtr 110
Construction works commence on bus stop upgrade »works date qtr 4 qtr 410
COST
Total output cost $ million 114.1 72.969
57. Project is complete and services commenced in September 2007.58. Project scoping was completed, and a series of works packages has been identified for progressive
implementation. 59. Progress during 2007-08 was delayed slightly due to planning approvals processes with
stakeholders that delayed the award of construction contracts. The completion date will not be affected.
60. In May 2008, the government announced that the Leongatha services would be provided by coach rather than rail.
61. VICERS, Metropolitan Train Communications, and Track Duplication – Clifton Hill to Westgarth were delayed.
62. Finalisations of acquisitions of land and planning approvals delayed the release of the construction tender and consequently the contract award date. The completion date has not been affected.
63. A signalling contract was not awarded for the Clifton Hill to Westgarth track duplication project. In its place, pursuant to the powers in the infrastructure lease, a written Project Agreement was executed between the Director of Public Transport and Connex Melbourne Pty Ltd for Connex to provide signalling, service relocation works and overhead traction design and construction for this project.
64. This project involves replacing the train radio system across the electrified rail network. 65. A two stage procurement approach for the Metropolitan Communications System has been adopted
in order to test offered technical and commercial solutions. This has resulted in the development of detailed specifications taking longer than originally planned, but the benefit is reduced project risk. The contract is expected to be awarded in quarter 1, 2008-09.
66. Metrol is the computer system currently used for controlling and monitoring trains operating across the metropolitan rail network.
67. An initial delay was caused by drivers and technical specialists being diverted to address the Siemens brake problem and the finalisation of the driver control placement. Further delays were caused by Integrian, the company delivering VICERS, being placed into administration in October 2007 and ceasing its operations. At this time 90 percent of the Comeng fleet had been wired for the installation of VICERS units, and units had been installed on 30 percent of the Comeng fleet. The completion of VICERS installation on the Comeng trains is now being expedited by Faiveley Transport, which took over the project in February 2008, and Connex, with completion expected in quarter 1, 2008-09.
68. Due to the delays in the project (refer to note 67) the design and development of the VICERS solution on the Xtrapolis and Siemens train fleet commenced in quarter 4, 2007-08 with installation to commence on the Xtrapolis fleet by late 2008.
69. Variation primarily reflects revised project schedule for Public Transport Ticketing Solution.
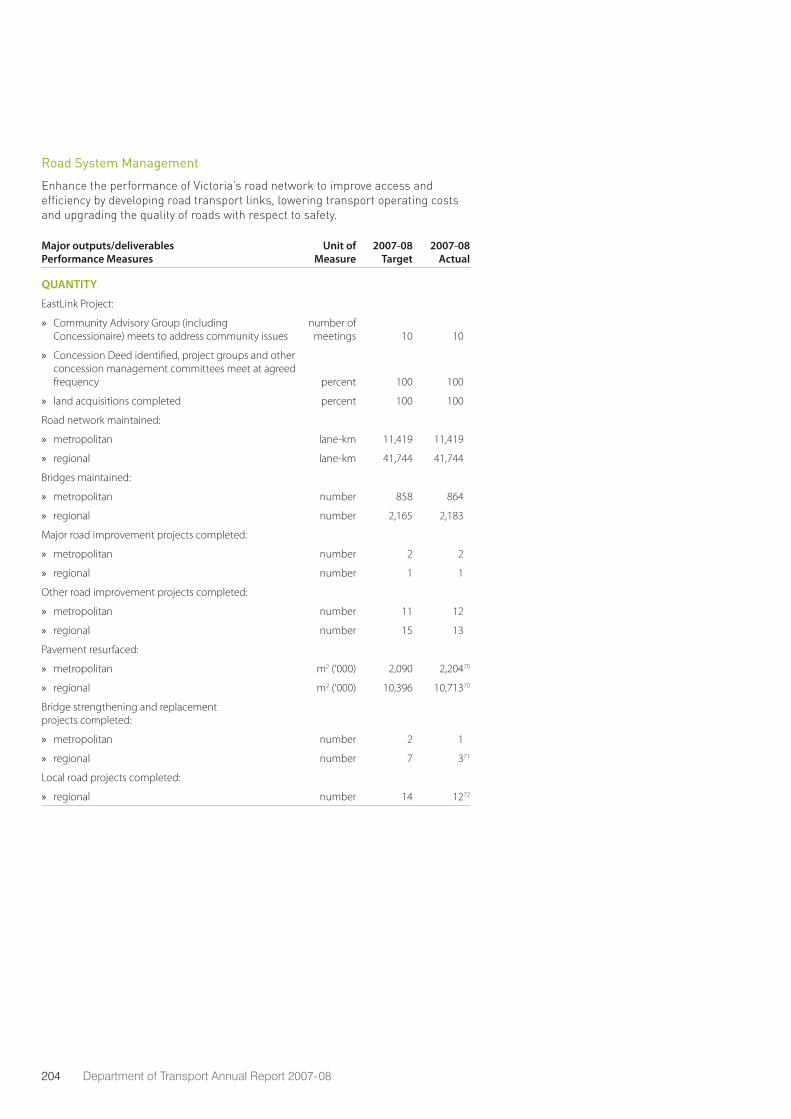
204 Department of Transport Annual Report 2007-08
Road System Management
Enhance the performance of Victoria’s road network to improve access and efficiency by developing road transport links, lowering transport operating costs and upgrading the quality of roads with respect to safety.
Major outputs/deliverables Performance Measures
Unit of Measure
2007-08 Target
2007-08 Actual
QUANTITY
EastLink Project:
Community Advisory Group (including »Concessionaire) meets to address community issues
number of meetings 10 1010
Concession Deed identified, project groups and other »concession management committees meet at agreed frequency percent 100 10010
land acquisitions completed » percent 100 10010
Road network maintained:
metropolitan » lane-km 11,419 11,41910
regional » lane-km 41,744 41,74410
Bridges maintained:
metropolitan » number 858 86410
regional » number 2,165 2,18310
Major road improvement projects completed:
metropolitan » number 2 210
regional » number 1 110
Other road improvement projects completed:
metropolitan » number 11 1210
regional » number 15 1310
Pavement resurfaced:
metropolitan » m2 (‘000) 2,090 2,20470
regional » m2 (‘000) 10,396 10,71370
Bridge strengthening and replacement projects completed:
metropolitan » number 2 110
regional » number 7 371
Local road projects completed:
regional » number 14 1272
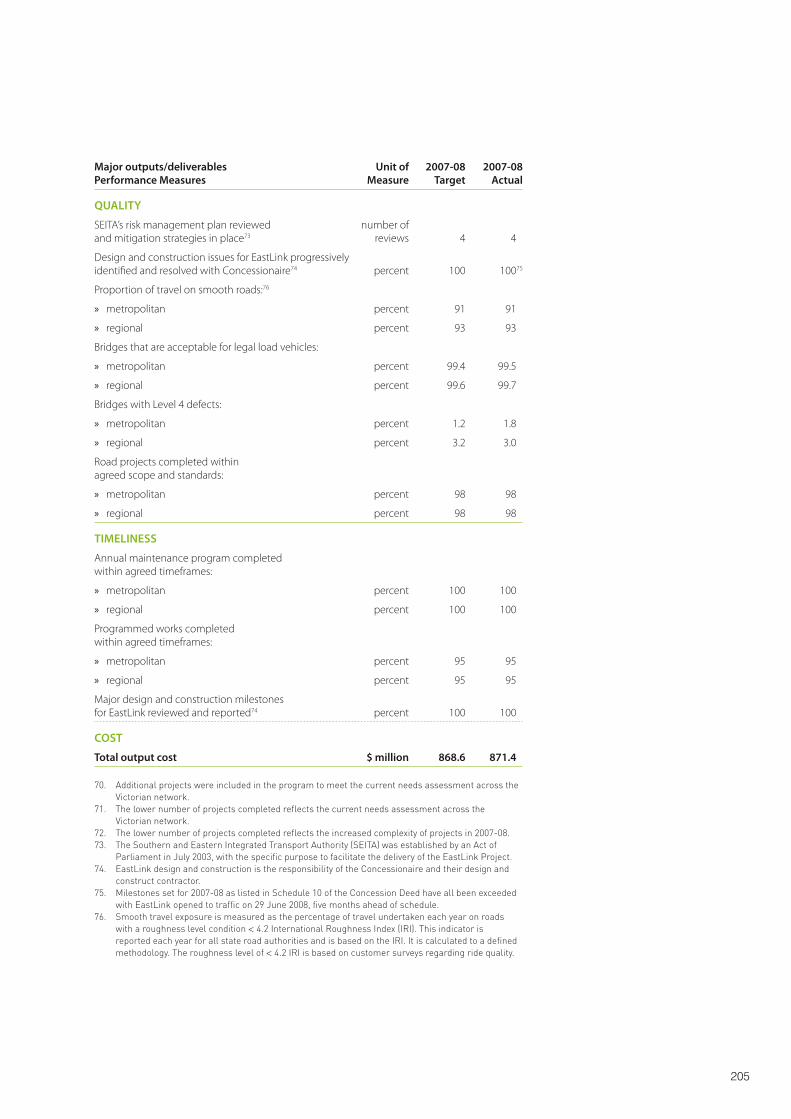
205
Major outputs/deliverables Performance Measures
Unit of Measure
2007-08 Target
2007-08 Actual
QUALITY
SEITA’s risk management plan reviewed and mitigation strategies in place73
number of reviews 4 410
Design and construction issues for EastLink progressively identified and resolved with Concessionaire74 percent 100 10075
Proportion of travel on smooth roads:76
metropolitan » percent 91 9110
regional » percent 93 9310
Bridges that are acceptable for legal load vehicles:
metropolitan » percent 99.4 99.510
regional » percent 99.6 99.710
Bridges with Level 4 defects:
metropolitan » percent 1.2 1.810
regional » percent 3.2 3.010
Road projects completed within agreed scope and standards:
metropolitan » percent 98 9810
regional » percent 98 9810
TIMELINESS
Annual maintenance program completed within agreed timeframes:
metropolitan » percent 100 10010
regional » percent 100 10010
Programmed works completed within agreed timeframes:
metropolitan » percent 95 9510
regional » percent 95 9510
Major design and construction milestones for EastLink reviewed and reported74 percent 100 10010
COST
Total output cost $ million 868.6 871.410
70. Additional projects were included in the program to meet the current needs assessment across the Victorian network.
71. The lower number of projects completed reflects the current needs assessment across the Victorian network.
72. The lower number of projects completed reflects the increased complexity of projects in 2007-08. 73. The Southern and Eastern Integrated Transport Authority (SEITA) was established by an Act of
Parliament in July 2003, with the specific purpose to facilitate the delivery of the EastLink Project.74. EastLink design and construction is the responsibility of the Concessionaire and their design and
construct contractor. 75. Milestones set for 2007-08 as listed in Schedule 10 of the Concession Deed have all been exceeded
with EastLink opened to traffic on 29 June 2008, five months ahead of schedule.76. Smooth travel exposure is measured as the percentage of travel undertaken each year on roads
with a roughness level condition < 4.2 International Roughness Index (IRI). This indicator is reported each year for all state road authorities and is based on the IRI. It is calculated to a defined methodology. The roughness level of < 4.2 IRI is based on customer surveys regarding ride quality.
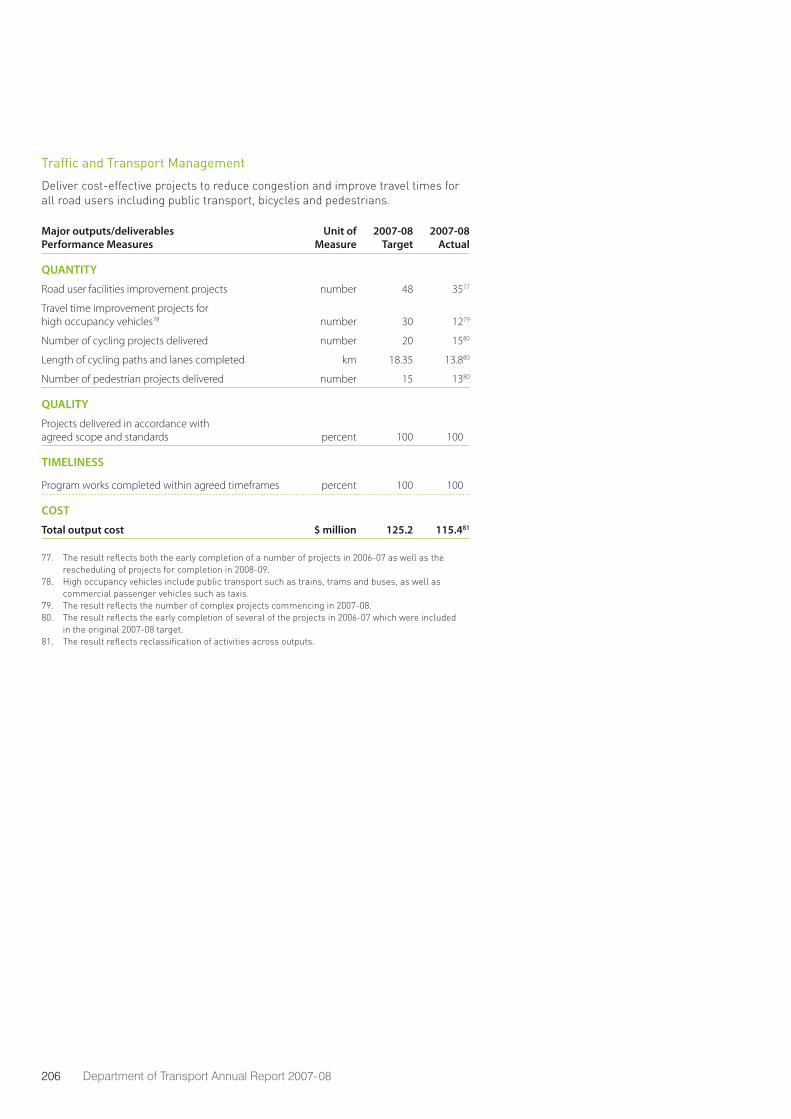
206 Department of Transport Annual Report 2007-08
Traffic and Transport Management
Deliver cost-effective projects to reduce congestion and improve travel times for all road users including public transport, bicycles and pedestrians.
Major outputs/deliverables Performance Measures
Unit of Measure
2007-08 Target
2007-08 Actual
QUANTITY
Road user facilities improvement projects number 48 3577
Travel time improvement projects for high occupancy vehicles78 number 30 1279
Number of cycling projects delivered number 20 1580
Length of cycling paths and lanes completed km 18.35 13.880
Number of pedestrian projects delivered number 15 1380
QUALITY
Projects delivered in accordance with agreed scope and standards percent 100 10080
TIMELINESS
Program works completed within agreed timeframes percent 100 10080
COST
Total output cost $ million 125.2 115.481
77. The result reflects both the early completion of a number of projects in 2006-07 as well as the rescheduling of projects for completion in 2008-09.
78. High occupancy vehicles include public transport such as trains, trams and buses, as well as commercial passenger vehicles such as taxis.
79. The result reflects the number of complex projects commencing in 2007-08.80. The result reflects the early completion of several of the projects in 2006-07 which were included
in the original 2007-08 target.81. The result reflects reclassification of activities across outputs.
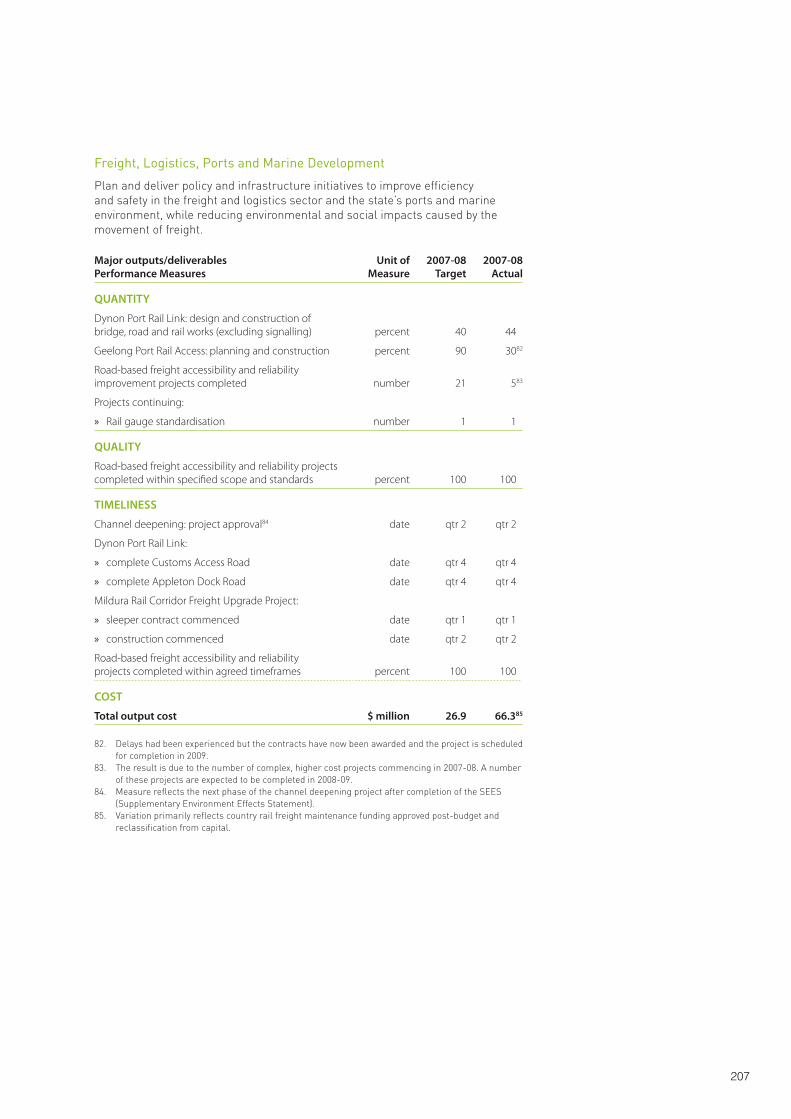
207
Freight, Logistics, Ports and Marine Development
Plan and deliver policy and infrastructure initiatives to improve efficiency and safety in the freight and logistics sector and the state’s ports and marine environment, while reducing environmental and social impacts caused by the movement of freight.
Major outputs/deliverables Performance Measures
Unit of Measure
2007-08 Target
2007-08 Actual
QUANTITY
Dynon Port Rail Link: design and construction of bridge, road and rail works (excluding signalling) percent 40 4482
Geelong Port Rail Access: planning and construction percent 90 3082
Road-based freight accessibility and reliability improvement projects completed number 21 583
Projects continuing:
Rail gauge standardisation » number 1 182
QUALITY
Road-based freight accessibility and reliability projects completed within specified scope and standards percent 100 10082
TIMELINESS
Channel deepening: project approval84 date qtr 2 qtr 282
Dynon Port Rail Link:
complete Customs Access Road » date qtr 4 qtr 482
complete Appleton Dock Road » date qtr 4 qtr 482
Mildura Rail Corridor Freight Upgrade Project:
sleeper contract commenced » date qtr 1 qtr 182
construction commenced » date qtr 2 qtr 282
Road-based freight accessibility and reliability projects completed within agreed timeframes percent 100 10082
COST
Total output cost $ million 26.9 66.385
82. Delays had been experienced but the contracts have now been awarded and the project is scheduled for completion in 2009.
83. The result is due to the number of complex, higher cost projects commencing in 2007-08. A number of these projects are expected to be completed in 2008-09.
84. Measure reflects the next phase of the channel deepening project after completion of the SEES (Supplementary Environment Effects Statement).
85. Variation primarily reflects country rail freight maintenance funding approved post-budget and reclassification from capital.
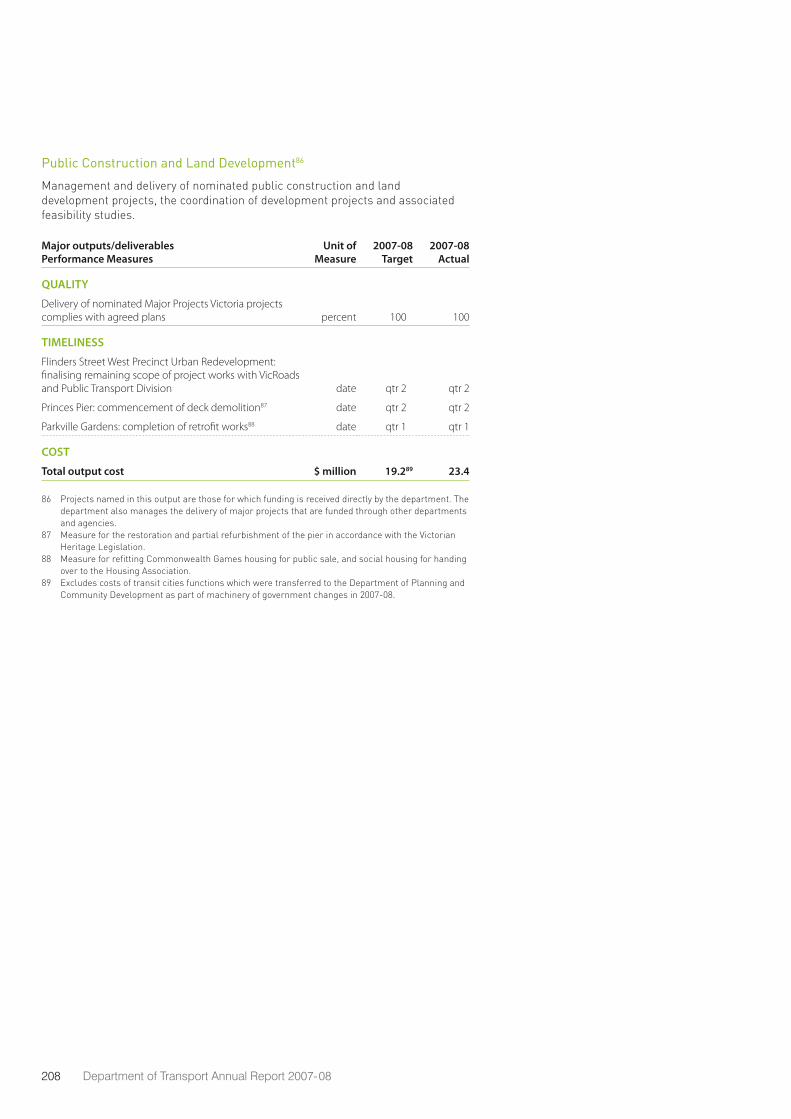
208 Department of Transport Annual Report 2007-08
Public Construction and Land Development86
Management and delivery of nominated public construction and land development projects, the coordination of development projects and associated feasibility studies.
Major outputs/deliverables Performance Measures
Unit of Measure
2007-08 Target
2007-08 Actual
QUALITY
Delivery of nominated Major Projects Victoria projects complies with agreed plans percent 10082 100
TIMELINESS
Flinders Street West Precinct Urban Redevelopment: finalising remaining scope of project works with VicRoads and Public Transport Division date qtr 282 qtr 2
Princes Pier: commencement of deck demolition87 date qtr 282 qtr 2
Parkville Gardens: completion of retrofit works88 date qtr 182 qtr 1
COST
Total output cost $ million 19.289 23.4
86 Projects named in this output are those for which funding is received directly by the department. The department also manages the delivery of major projects that are funded through other departments and agencies.
87 Measure for the restoration and partial refurbishment of the pier in accordance with the Victorian Heritage Legislation.
88 Measure for refitting Commonwealth Games housing for public sale, and social housing for handing over to the Housing Association.
89 Excludes costs of transit cities functions which were transferred to the Department of Planning and Community Development as part of machinery of government changes in 2007-08.
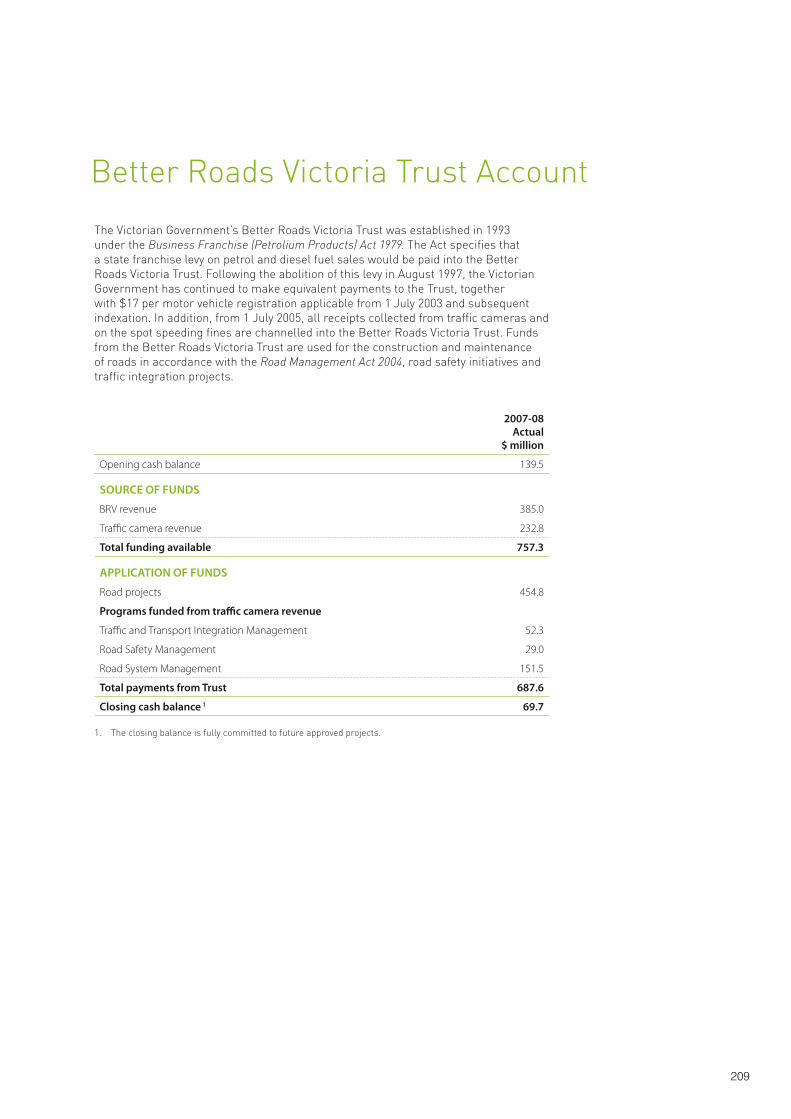
209
Better Roads Victoria Trust Account
The Victorian Government’s Better Roads Victoria Trust was established in 1993 under the Business Franchise (Petrolium Products) Act 1979. The Act specifies that a state franchise levy on petrol and diesel fuel sales would be paid into the Better Roads Victoria Trust. Following the abolition of this levy in August 1997, the Victorian Government has continued to make equivalent payments to the Trust, together with $17 per motor vehicle registration applicable from 1 July 2003 and subsequent indexation. In addition, from 1 July 2005, all receipts collected from traffic cameras and on the spot speeding fines are channelled into the Better Roads Victoria Trust. Funds from the Better Roads Victoria Trust are used for the construction and maintenance of roads in accordance with the Road Management Act 2004, road safety initiatives and traffic integration projects.
2007-08Actual
$ million
Opening cash balance 139.5
SOURCE OF FUNDS
BRV revenue 385.0
Traffic camera revenue 232.8
Total funding available 757.3
APPLICATION OF FUNDS
Road projects 454.8
Programs funded from traffic camera revenue
Traffic and Transport Integration Management 52.3
Road Safety Management 29.0
Road System Management 151.5
Total payments from Trust 687.6
Closing cash balance 1 69.7
1. The closing balance is fully committed to future approved projects.
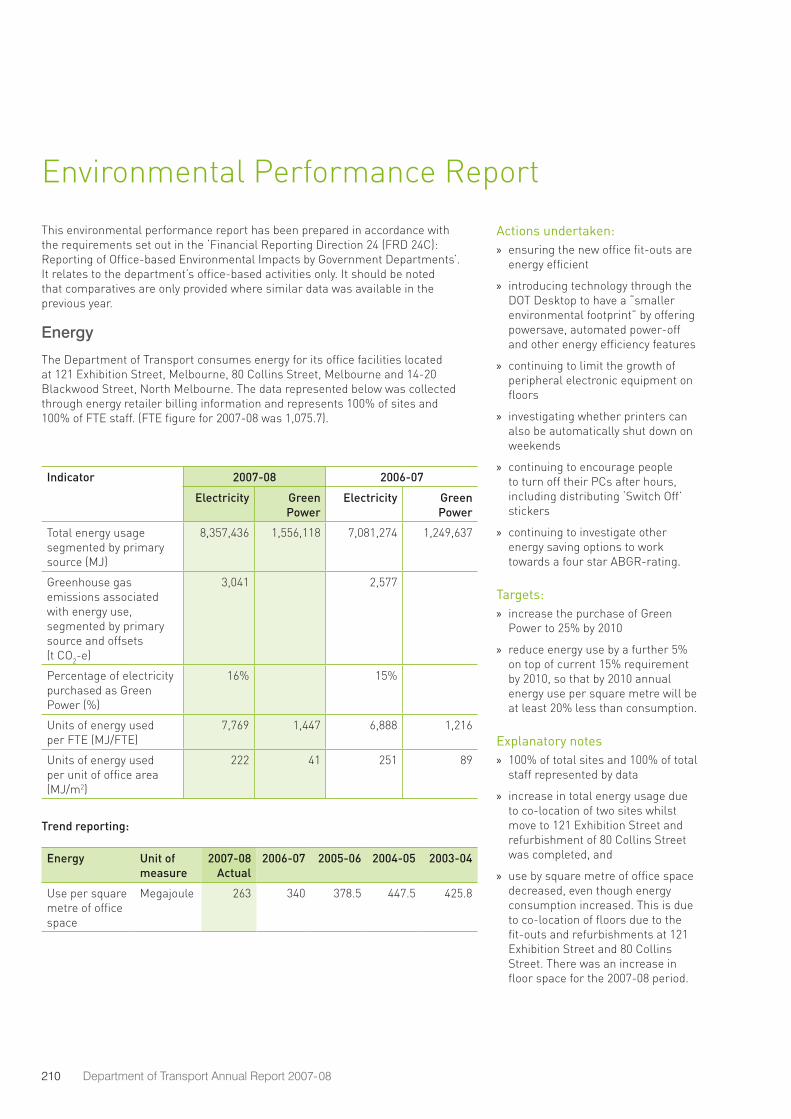
210 Department of Transport Annual Report 2007-08
Environmental Performance Report
This environmental performance report has been prepared in accordance with the requirements set out in the ‘Financial Reporting Direction 24 (FRD 24C): Reporting of Office-based Environmental Impacts by Government Departments’. It relates to the department’s office-based activities only. It should be noted that comparatives are only provided where similar data was available in the previous year.
Energy
The Department of Transport consumes energy for its office facilities located at 121 Exhibition Street, Melbourne, 80 Collins Street, Melbourne and 14-20 Blackwood Street, North Melbourne. The data represented below was collected through energy retailer billing information and represents 100% of sites and 100% of FTE staff. (FTE figure for 2007-08 was 1,075.7).
Indicator 2007-08 2006-07
Electricity Green Power
Electricity Green Power
Total energy usage segmented by primary source (MJ)
8,357,436 1,556,118 7,081,274 1,249,637
Greenhouse gas emissions associated with energy use, segmented by primary source and offsets (t CO2-e)
3,041 2,577
Percentage of electricity purchased as Green Power (%)
16% 15%
Units of energy used per FTE (MJ/FTE)
7,769 1,447 6,888 1,216
Units of energy used per unit of office area (MJ/m2)
222 41 251 89
Trend reporting:
Energy Unit of measure
2007-08 Actual
2006-07 2005-06 2004-05 2003-04
Use per square metre of office space
Megajoule 263 340 378.5 447.5 425.8
Actions undertaken:ensuring the new office fit-outs are »energy efficient
introducing technology through the »DOT Desktop to have a “smaller environmental footprint” by offering powersave, automated power-off and other energy efficiency features
continuing to limit the growth of »peripheral electronic equipment on floors
investigating whether printers can »also be automatically shut down on weekends
continuing to encourage people »to turn off their PCs after hours, including distributing ‘Switch Off’ stickers
continuing to investigate other »energy saving options to work towards a four star ABGR-rating.
Targets:increase the purchase of Green »Power to 25% by 2010
reduce energy use by a further 5% »on top of current 15% requirement by 2010, so that by 2010 annual energy use per square metre will be at least 20% less than consumption.
Explanatory notes100% of total sites and 100% of total »staff represented by data
increase in total energy usage due »to co-location of two sites whilst move to 121 Exhibition Street and refurbishment of 80 Collins Street was completed, and
use by square metre of office space »decreased, even though energy consumption increased. This is due to co-location of floors due to the fit-outs and refurbishments at 121 Exhibition Street and 80 Collins Street. There was an increase in floor space for the 2007-08 period.
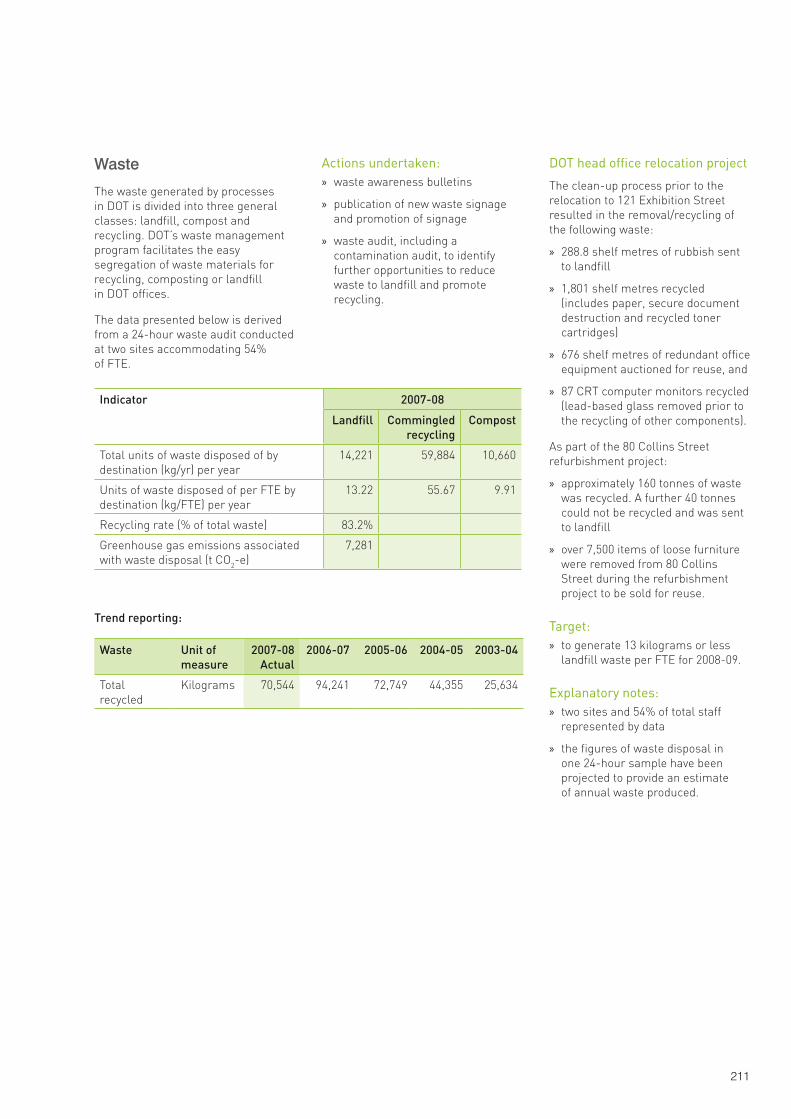
211
Waste
The waste generated by processes in DOT is divided into three general classes: landfill, compost and recycling. DOT’s waste management program facilitates the easy segregation of waste materials for recycling, composting or landfill in DOT offices.
The data presented below is derived from a 24-hour waste audit conducted at two sites accommodating 54% of FTE.
Actions undertaken:waste awareness bulletins »
publication of new waste signage »and promotion of signage
waste audit, including a »contamination audit, to identify further opportunities to reduce waste to landfill and promote recycling.
Indicator 2007-08
Landfill Commingled recycling
Compost
Total units of waste disposed of by destination (kg/yr) per year
14,221 59,884 10,660
Units of waste disposed of per FTE by destination (kg/FTE) per year
13.22 55.67 9.91
Recycling rate (% of total waste) 83.2%
Greenhouse gas emissions associated with waste disposal (t CO2-e)
7,281
Trend reporting:
Waste Unit of measure
2007-08 Actual
2006-07 2005-06 2004-05 2003-04
Total recycled
Kilograms 70,544 94,241 72,749 44,355 25,634
DOT head office relocation project
The clean-up process prior to the relocation to 121 Exhibition Street resulted in the removal/recycling of the following waste:
288.8 shelf metres of rubbish sent »to landfill
1,801 shelf metres recycled »(includes paper, secure document destruction and recycled toner cartridges)
676 shelf metres of redundant office »equipment auctioned for reuse, and
87 CRT computer monitors recycled »(lead-based glass removed prior to the recycling of other components).
As part of the 80 Collins Street refurbishment project:
approximately 160 tonnes of waste »was recycled. A further 40 tonnes could not be recycled and was sent to landfill
over 7,500 items of loose furniture »were removed from 80 Collins Street during the refurbishment project to be sold for reuse.
Target:to generate 13 kilograms or less »landfill waste per FTE for 2008-09.
Explanatory notes:two sites and 54% of total staff »represented by data
the figures of waste disposal in »one 24-hour sample have been projected to provide an estimate of annual waste produced.
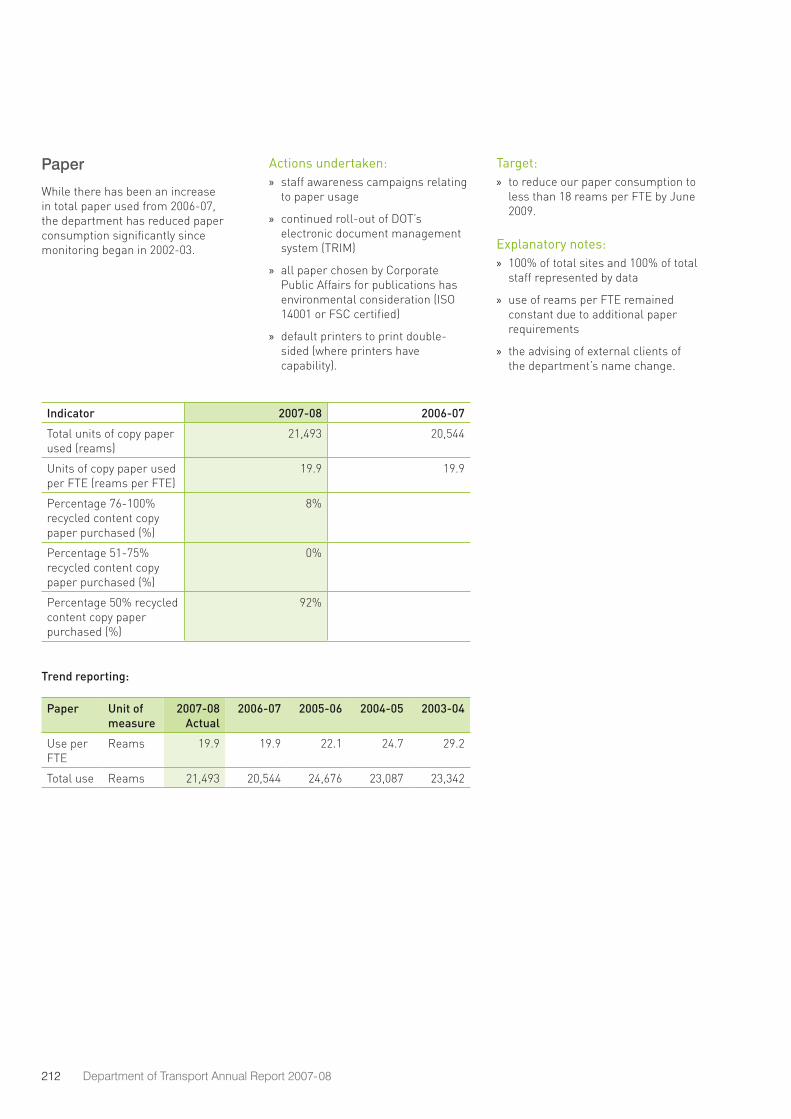
212 Department of Transport Annual Report 2007-08
Paper
While there has been an increase in total paper used from 2006-07, the department has reduced paper consumption significantly since monitoring began in 2002-03.
Actions undertaken:staff awareness campaigns relating »to paper usage
continued roll-out of DOT’s »electronic document management system (TRIM)
all paper chosen by Corporate »Public Affairs for publications has environmental consideration (ISO 14001 or FSC certified)
default printers to print double- »sided (where printers have capability).
Indicator 2007-08 2006-07
Total units of copy paper used (reams)
21,493 20,544
Units of copy paper used per FTE (reams per FTE)
19.9 19.9
Percentage 76-100% recycled content copy paper purchased (%)
8%
Percentage 51-75% recycled content copy paper purchased (%)
0%
Percentage 50% recycled content copy paper purchased (%)
92%
Trend reporting:
Paper Unit of measure
2007-08 Actual
2006-07 2005-06 2004-05 2003-04
Use per FTE
Reams 19.9 19.9 22.1 24.7 29.2
Total use Reams 21,493 20,544 24,676 23,087 23,342
Target:to reduce our paper consumption to »less than 18 reams per FTE by June 2009.
Explanatory notes:100% of total sites and 100% of total »staff represented by data
use of reams per FTE remained »constant due to additional paper requirements
the advising of external clients of »the department’s name change.
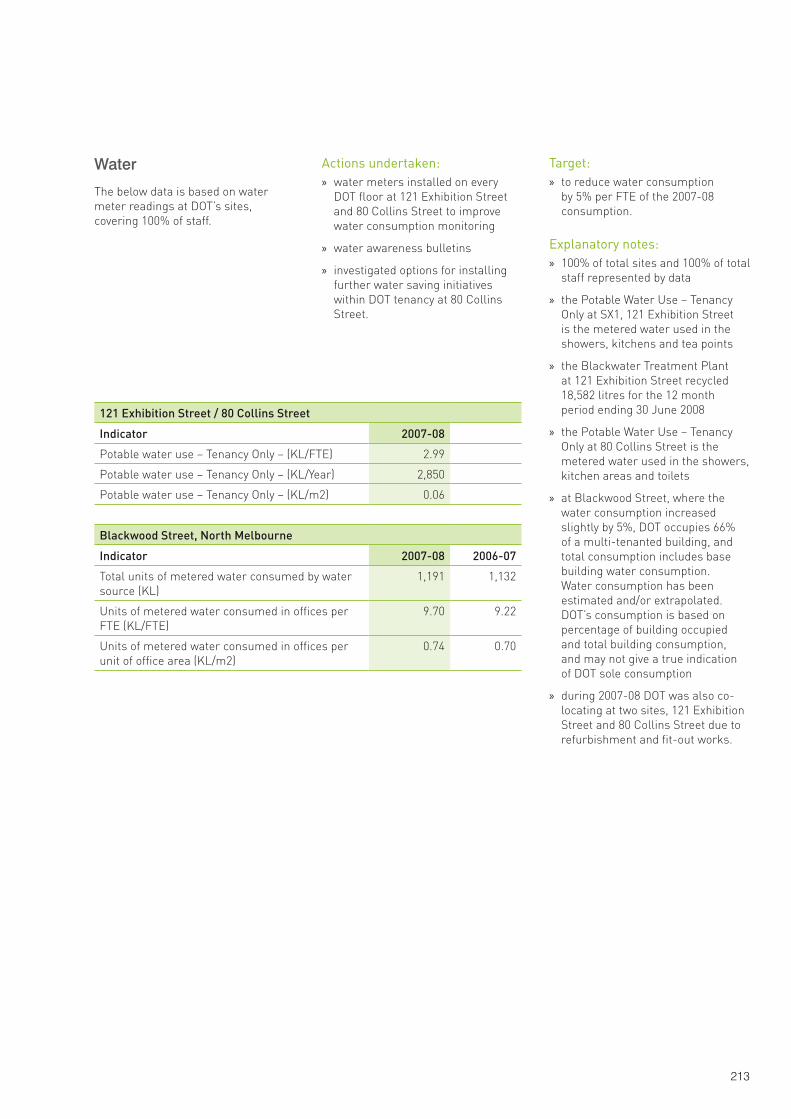
213
Water
The below data is based on water meter readings at DOT’s sites, covering 100% of staff.
Actions undertaken:water meters installed on every »DOT floor at 121 Exhibition Street and 80 Collins Street to improve water consumption monitoring
water awareness bulletins »
investigated options for installing »further water saving initiatives within DOT tenancy at 80 Collins Street.
Target:to reduce water consumption »by 5% per FTE of the 2007-08 consumption.
Explanatory notes:100% of total sites and 100% of total »staff represented by data
the Potable Water Use – Tenancy »Only at SX1, 121 Exhibition Street is the metered water used in the showers, kitchens and tea points
the Blackwater Treatment Plant »at 121 Exhibition Street recycled 18,582 litres for the 12 month period ending 30 June 2008
the Potable Water Use – Tenancy »Only at 80 Collins Street is the metered water used in the showers, kitchen areas and toilets
at Blackwood Street, where the »water consumption increased slightly by 5%, DOT occupies 66% of a multi-tenanted building, and total consumption includes base building water consumption. Water consumption has been estimated and/or extrapolated. DOT’s consumption is based on percentage of building occupied and total building consumption, and may not give a true indication of DOT sole consumption
during 2007-08 DOT was also co- »locating at two sites, 121 Exhibition Street and 80 Collins Street due to refurbishment and fit-out works.
121 Exhibition Street / 80 Collins Street
Indicator 2007-08
Potable water use – Tenancy Only – (KL/FTE) 2.99
Potable water use – Tenancy Only – (KL/Year) 2,850
Potable water use – Tenancy Only – (KL/m2) 0.06
Blackwood Street, North Melbourne
Indicator 2007-08 2006-07
Total units of metered water consumed by water source (KL)
1,191 1,132
Units of metered water consumed in offices per FTE (KL/FTE)
9.70 9.22
Units of metered water consumed in offices per unit of office area (KL/m2)
0.74 0.70
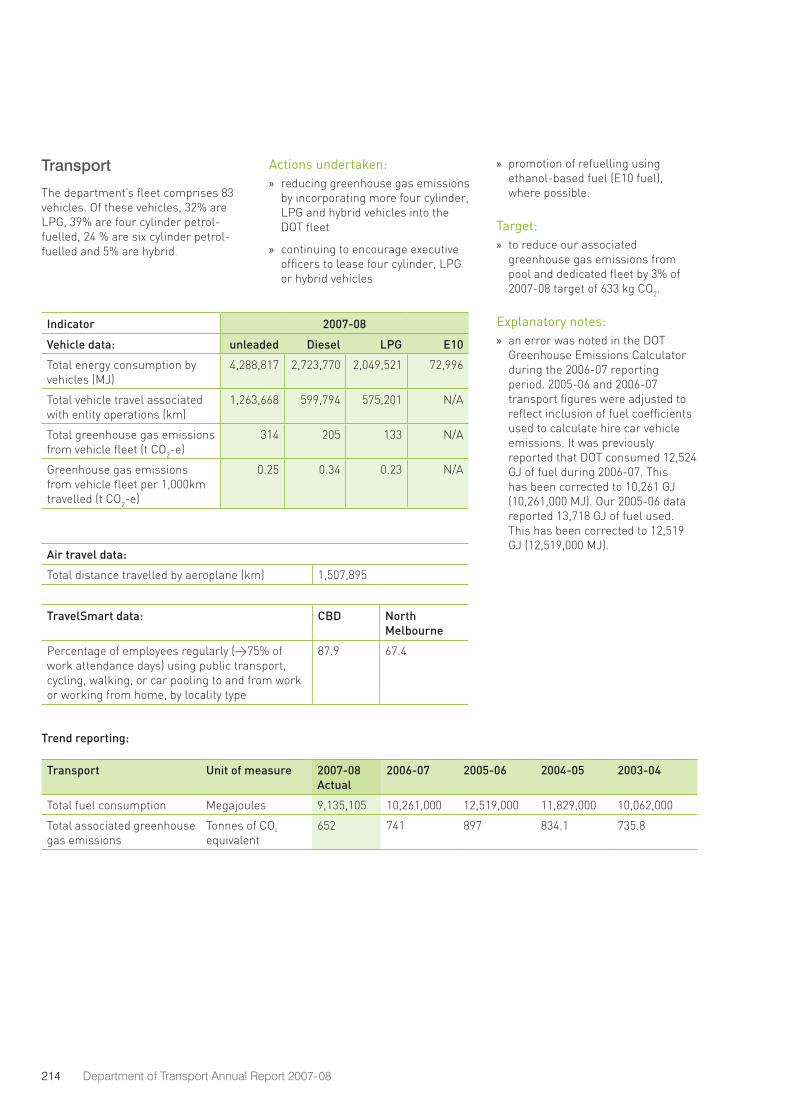
214 Department of Transport Annual Report 2007-08
Transport
The department’s fleet comprises 83 vehicles. Of these vehicles, 32% are LPG, 39% are four cylinder petrol-fuelled, 24 % are six cylinder petrol-fuelled and 5% are hybrid.
Actions undertaken:reducing greenhouse gas emissions »by incorporating more four cylinder, LPG and hybrid vehicles into the DOT fleet
continuing to encourage executive »officers to lease four cylinder, LPG or hybrid vehicles
promotion of refuelling using »ethanol-based fuel (E10 fuel), where possible.
Target:to reduce our associated »greenhouse gas emissions from pool and dedicated fleet by 3% of 2007-08 target of 633 kg CO2.
Explanatory notes:an error was noted in the DOT »Greenhouse Emissions Calculator during the 2006-07 reporting period. 2005-06 and 2006-07 transport figures were adjusted to reflect inclusion of fuel coefficients used to calculate hire car vehicle emissions. It was previously reported that DOT consumed 12,524 GJ of fuel during 2006-07. This has been corrected to 10,261 GJ (10,261,000 MJ). Our 2005-06 data reported 13,718 GJ of fuel used. This has been corrected to 12,519 GJ (12,519,000 MJ).
Indicator 2007-08
Vehicle data: unleaded Diesel LPG E10
Total energy consumption by vehicles (MJ)
4,288,817 2,723,770 2,049,521 72,996
Total vehicle travel associated with entity operations (km)
1,263,668 599,794 575,201 N/A
Total greenhouse gas emissions from vehicle fleet (t CO2-e)
314 205 133 N/A
Greenhouse gas emissions from vehicle fleet per 1,000km travelled (t CO2-e)
0.25 0.34 0.23 N/A
Air travel data:
Total distance travelled by aeroplane (km) 1,507,895
TravelSmart data: CBD North Melbourne
Percentage of employees regularly (>75% of work attendance days) using public transport, cycling, walking, or car pooling to and from work or working from home, by locality type
87.9 67.4
Trend reporting:
Transport Unit of measure 2007-08 Actual
2006-07 2005-06 2004-05 2003-04
Total fuel consumption Megajoules 9,135,105 10,261,000 12,519,000 11,829,000 10,062,000
Total associated greenhouse gas emissions
Tonnes of CO² equivalent
652 741 897 834.1 735.8
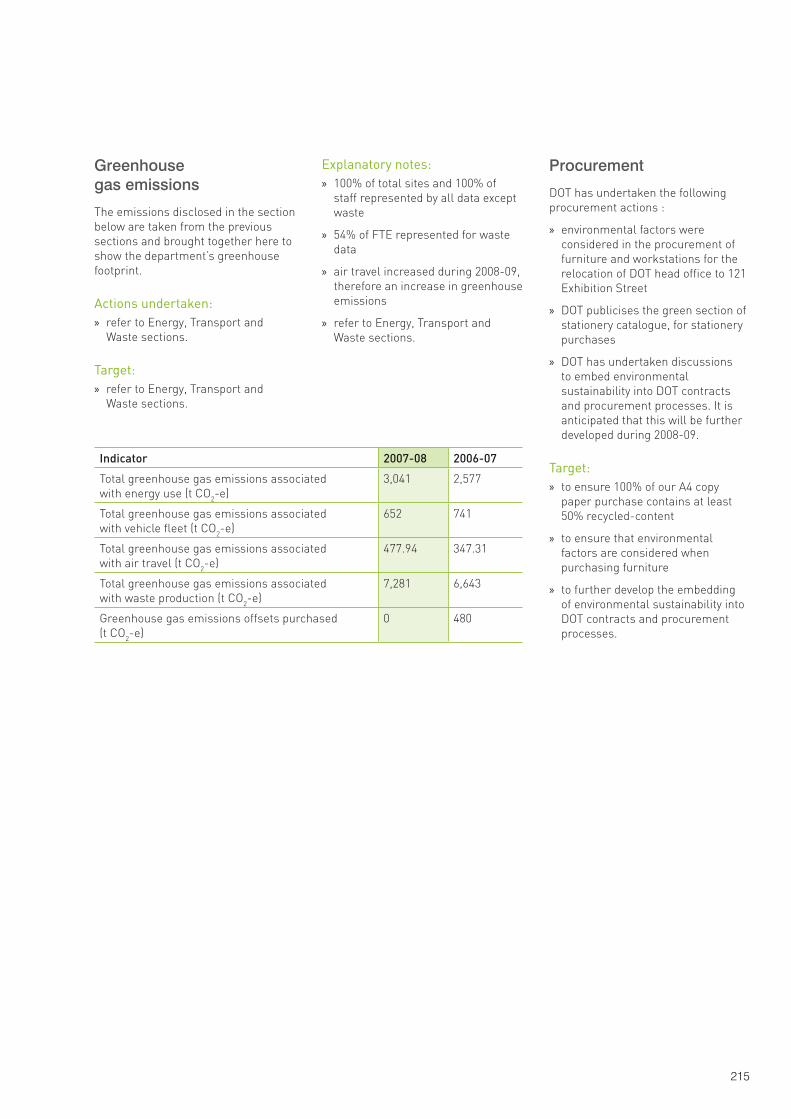
215
Greenhouse gas emissions
The emissions disclosed in the section below are taken from the previous sections and brought together here to show the department’s greenhouse footprint.
Actions undertaken:refer to Energy, Transport and »Waste sections.
Target:refer to Energy, Transport and »Waste sections.
Procurement
DOT has undertaken the following procurement actions :
environmental factors were »considered in the procurement of furniture and workstations for the relocation of DOT head office to 121 Exhibition Street
DOT publicises the green section of »stationery catalogue, for stationery purchases
DOT has undertaken discussions »to embed environmental sustainability into DOT contracts and procurement processes. It is anticipated that this will be further developed during 2008-09.
Target:to ensure 100% of our A4 copy »paper purchase contains at least 50% recycled-content
to ensure that environmental »factors are considered when purchasing furniture
to further develop the embedding »of environmental sustainability into DOT contracts and procurement processes.
Explanatory notes:100% of total sites and 100% of »staff represented by all data except waste
54% of FTE represented for waste »data
air travel increased during 2008-09, »therefore an increase in greenhouse emissions
refer to Energy, Transport and »Waste sections.
Indicator 2007-08 2006-07
Total greenhouse gas emissions associated with energy use (t CO2-e)
3,041 2,577
Total greenhouse gas emissions associated with vehicle fleet (t CO2-e)
652 741
Total greenhouse gas emissions associated with air travel (t CO2-e)
477.94 347.31
Total greenhouse gas emissions associated with waste production (t CO2-e)
7,281 6,643
Greenhouse gas emissions offsets purchased (t CO2-e)
0 480
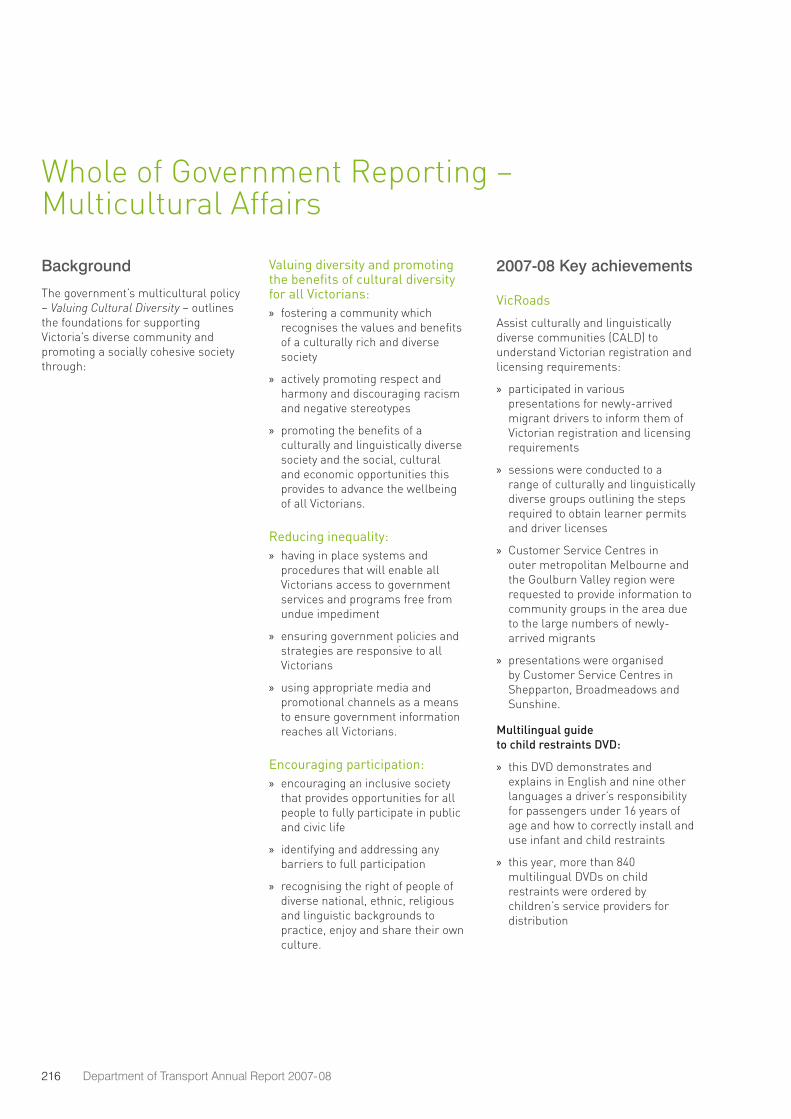
216 Department of Transport Annual Report 2007-08
Whole of Government Reporting – Multicultural Affairs
Background
The government’s multicultural policy – Valuing Cultural Diversity – outlines the foundations for supporting Victoria’s diverse community and promoting a socially cohesive society through:
Valuing diversity and promoting the benefits of cultural diversity for all Victorians:
fostering a community which »recognises the values and benefits of a culturally rich and diverse society
actively promoting respect and »harmony and discouraging racism and negative stereotypes
promoting the benefits of a »culturally and linguistically diverse society and the social, cultural and economic opportunities this provides to advance the wellbeing of all Victorians.
Reducing inequality:having in place systems and »procedures that will enable all Victorians access to government services and programs free from undue impediment
ensuring government policies and »strategies are responsive to all Victorians
using appropriate media and »promotional channels as a means to ensure government information reaches all Victorians.
Encouraging participation:encouraging an inclusive society »that provides opportunities for all people to fully participate in public and civic life
identifying and addressing any »barriers to full participation
recognising the right of people of »diverse national, ethnic, religious and linguistic backgrounds to practice, enjoy and share their own culture.
2007-08 Key achievements
VicRoads
Assist culturally and linguistically diverse communities (CALD) to understand Victorian registration and licensing requirements:
participated in various »presentations for newly-arrived migrant drivers to inform them of Victorian registration and licensing requirements
sessions were conducted to a »range of culturally and linguistically diverse groups outlining the steps required to obtain learner permits and driver licenses
Customer Service Centres in »outer metropolitan Melbourne and the Goulburn Valley region were requested to provide information to community groups in the area due to the large numbers of newly-arrived migrants
presentations were organised »by Customer Service Centres in Shepparton, Broadmeadows and Sunshine.
Multilingual guide to child restraints DVD:
this DVD demonstrates and »explains in English and nine other languages a driver’s responsibility for passengers under 16 years of age and how to correctly install and use infant and child restraints
this year, more than 840 »multilingual DVDs on child restraints were ordered by children’s service providers for distribution
217
the DVD is in English, Bosnian, »Chinese, Arabic, Vietnamese, Somali, Dinka, Swahili, Karen and Turkish
the DVD is provided free of charge »to Maternal and Child Health services, Migrant Resource Centres and other services providing support for CALD communities. Agencies are encouraged to make DVDs available for borrowing by individuals who may like other family members to access the information.
Starting Out Safely Early Childhood Road Safety Education Program:
this program aims to assist parents »and carers of young children to supervise and train their children in safe road use practices as young as possible
this information is available in »Arabic, Chinese, Somali, Turkish, and Vietnamese
more than 100 early childhood »education centres ordered multicultural child/parent materials in 2007-08
more than 6,000 brochures were »ordered by children’s service providers for distribution
all children’s services are »encouraged to make the information available to relevant families.
Graduated probationary licensing system:
a new graduated licensing for »probationary drivers came into force on 1 July 2008. Print and radio advertising was used to explain the new laws
more than 1,300 information kits »in 17 languages were distributed to culturally linguistically diverse groups and organisations.
Interpreter-assisted telephone customer service:
VicRoads Call Centre provides »services in languages other than English through the use of Victorian Interpreter and Translating Services
demand for this service continues »to increase each year.
Interpreter-assisted learner permit and driver licence tests:
people from non-English speaking »backgrounds can apply for a learner permit or licence through interpreter-assisted tests
in 2007-08 more than 5,440 tests »were conducted with the assistance of interpreters. This figure is an increase from about 4,000 the year before.
Novice driver publications available in languages other than English;
VicRoads provides the Road to Solo »Driving and the Learner Kit in four languages as well as English.
Learner permit and licence tests in languages other than English:
VicRoads provides learner permit »and licence tests in 20 different languages
statistics are kept for all language »and interpreter-assisted tests and these statistics are reviewed regularly.
Boat operator tests in languages other than English
VicRoads provides boat operator »licence tests in eight languages other than English. These tests are conducted on behalf of Marine Safety Victoria.
Licences recognised from other countries
in line with other Australian states »and territories, VicRoads recognises other countries that have similar licence-testing requirements for the purposes of gaining a Victorian driver licence
VicRoads recognises 26 other »countries with similar licence-testing requirements.
218 Department of Transport Annual Report 2007-08
Department of Transport
Celebrations during Celebrate our Cultural Diversity Week (COCDW):
COCDW aims to celebrate cultural »diversity, promote greater racial and religious harmony and greater cultural understanding
DOT celebrations included a joint »display and cultural performance in the foyer of 121 Exhibition Street with the Department of Justice and the Department of Innovation, Industry and Regional Development
a speaker from the “Lost boys »of Sudan” gave a presentation to department people about his experiences as a Sudanese refugee. A lunch was provided by the Asylum-Seekers Resource Centre
all divisions were encouraged to »mark the week in their own ways.
Cultural sensitivity training:
cultural sensitivity training aims »to increase the awareness of DOT people who have direct public interface with people from culturally and linguistically diverse backgrounds. It explains different communication methods of different cultures and ways to appreciate and overcome these differences
the training was introduced as part »of the Cultural Diversity Plan in response to A Fairer Victoria
the training program was »comprehensive and the outcomes are good.
DOT communications are available in alternative formats upon request:
a process and procedure guide »has been developed including timeframes and key contact people within DOT.
Diversity recruitment statement:
a diversity statement is now »included on all position descriptions as well as on the DOT employment web page
this statement directs people who »require additional assistance or have special needs, to contact the Diversity Coordinator for support and information.
Metlink
Welcome to Victoria kit:
the Welcome to Victoria kit »was developed by the Victorian Multicultural Commission and provided to migrant and refugee children who entered the education system through English-language schools in 2007
it aims to encourage children and »their families to take part in sport and other community activities. It contains information about services for new arrivals, help with transport and free passes to Melbourne attractions
Metlink contributed an English- »language copy of the Family Guide to Using Public Transport to each kit
the kit was provided to »approximately 6,000 children.
Peer Education Program:
the Peer Education Program is »coordinated by the Western Young People’s Independent Network (WYPIN) and is designed to teach new arrivals about Melbourne’s public transport services and make the transition to their new country easier
the kit consists of several visual »aids, including flash cards, maps and games which cover a range of topics on how to use public transport including the types of public transport, zones, buying Metcards, travelling safely and acting responsibly on public transport
the sessions are tailored to meet »the unique needs of culturally and linguistically diverse young people in terms of delivery, language and material
ten programs have been delivered »so far to 144 students
the visual resource kit is the »product of three years’ collaboration between Metlink, Western Young People’s Independent Network, Yarra Trams and Connex.
Ethnic media advertising:
Metlink published newspaper »advertisements to support the introduction of new public transport fares
the advertisements were published »in nine multicultural newspapers, in 11 languages other than English. These were African, Arabic, Chinese, Croation, Greek, Italian, Macedonian, Spanish, Sudanese, Turkish and Vietnamese.
219
Public transport brochures:
Metlink publishes four key »public transport brochures in 10 languages other than English: Fares and Travel Guide, Travelling with a Concession Metcard, Travelling with Metcards your rights and responsibilities, and Powers of Public Transport Authorised Officers
the languages are Arabic, »Chinese, Croatian, Greek, Italian, Macedonian, Somali, Spanish, Turkish and Vietnamese
1,000 copies of each of these »brochures were printed in 2007–08.
Public transport information:
Metlink offers a telephone »translation service for state-wide public transport enquiries in 13 languages other than English. These are: Arabic, Cantonese, Croatian, Dinka, Greek, Italian, Macedonian, Mandarin, Somali, Spanish, Sudanese, Turkish and Vietnamese
the Metlink call centre received »283 calls needing interpreters in 2007-08.
Provision of telephone translation services for major rail infrastructure projects:
DOT’s Infrastructure Projects »Division delivers major rail infrastructure projects for Victorians. In recognition of the importance of providing information to all Victorians about rail projects, the Metlink call centre was utilised to respond to community enquiries. The call centre provides interpreter services when required
the 1800 rail enquiries phone »number was used on all rail project fact sheets as part of the online material on www.transport.vic.gov.au
220 Department of Transport Annual Report 2007-08
Whole of Government Reporting – Women’s Affairs
Background
The Victorian Government is committed to working toward a better quality of life for all Victorian women and their families. The key themes are:
Representation and equityensure women are well- »represented in leadership and decision-making.
Education, work and economic independence
support employers and employees »to better balance work and family commitments and increase women’s participation in the workforce and ensure women are provided with choices in education and training.
Health, wellbeing and community strengthening
improve the health and wellbeing »of Victorian women.
Justice and safetyreduce the fear of violence »for women.
2007-08 Key achievements
VicRoads
Leadership Training for Women
Senior women working at VicRoads were supported to attend training programs designed to enhance their skills and assist them to operate effectively in a male-dominated industry:
the program increased the skills »and confidence of women who participated.
Department of Transport
Women in Science, Engineering, Technology and Construction Scholarship
This is an initiative to provide three scholarships for women in science, engineering and technology, and construction fields:
the scholarships aim to support »women currently working or aspiring to work in these fields
women are under-represented »in the construction industry and the science, engineering and technology sector
three scholarships were awarded »in 2008.
Women in Freight, Logistics and Marine Management Scholarship
DOT offers an annual $10,000 scholarship to a female, full-time or part-time student starting or completing a Masters, PhD, or postgraduate degree in the freight, logistics or marine-related fields. The winner is also provided with the opportunity to participate in part-time work at the department during the year:
a report by the Transport and »Logistics Industry Skills Council found that women represented 27 percent of the transport and logistics workforce compared with the average across all industries of 44 percent
in addition, industry reports show »that only 12 percent of management positions are held by women
the scholarship aims to help »promote women in management positions in the freight, logistics and marine industry to help the industry reap the benefits of a diverse and balanced workforce
through the scholarship, the state »government actively encourages women to consider transport and logistic industries as viable and rewarding management career options
this was the fifth year that the »scholarship had been offered
the 2008 winner is currently »studying a Masters course in Marketing, focussing on supply chain logistics. She intends to use her studies to gain a deeper grasp of the complexities and opportunities that supply chain logistics offer to improve business performance.
221
Legislation (administered as at 30 June 2008)
As at 30 June 2008, the following legislation was administered by the Minister for Public Transport and the Minister for Roads and Ports.
Rail Safety Act 2006
The main purpose of this Act is to provide for safe rail operations in Victoria, including the accreditation of rail operators and the imposition of safety duties on key industry participants.
The Act also establishes the Director, Public Transport Safety.
Transport Act 1983Part II Division 1, Subdivisions »2, 3 and 4
Section 32 (only in so far as it does »not relate to the Roads Corporation, which is administered by the Minister for Roads and Ports)
Part VI, Division 10 »
Part VII, Divisions 4, 4AA, 4A, 4B »
This Act is otherwise jointly administered with the Minister for Roads and Ports (except Part II, Division 3; sections 21, 22, 23, 24, 25, 26, 27, 28, 29, 30, 31 and 35; Part IV and Part VI, Division 8, which are administered by the Minister for Roads and Ports).
This Act establishes and sets out the functions and powers of the Department of Transport in relation to transport matters, and those of the Roads Corporation as well as establishing a number of statutory offices. The Act also provides for the licensing of commercial vehicles and for various offences as well as enforcement powers and sanctions relating to rail and tram safety.
Very Fast Train (Route Investigation) Act 1989
The purpose of this Act is to facilitate the investigation of a route for a very fast train linking Melbourne with other centres within or outside the state.
Acts administered by the Minister for Public Transport
Border Railways Act 1922
This Act ratifies an agreement between the states of Victoria and NSW as to the construction, maintenance and operation of railway lines and the construction and maintenance of bridges across the Murray River.
National Rail Corporation (Victoria) Act 1991
This Act approves and gives effect to an agreement made between the Commonwealth and the states of Victoria, New South Wales, Queensland, and Western Australia relating to the establishment and operation of the National Rail Corporation Limited.
Public Transport Competition Act 1995
This Act provides for the accreditation of passenger bus operators and implements a system of service contracts for route service operations.
Rail Corporations Act 1996
The main purpose of this Act is to establish VicTrack, the Southern Cross Station Authority and V/Line Passenger Corporation. It also provides a rail access regime, and confers certain powers on rail and tram operators.
222 Department of Transport Annual Report 2007-08
EastLink Project Act 2004
The Act provides for the facilitation of the design, construction, operation, maintenance and management of the EastLink Freeway as well as the collection and enforcement of tolls relating to use of the Freeway.
Land Act 1958
In so far as it relates to the exercise of power relating to the leases and licences under Subdivisions 1 and 2 of Division 9 of Part 1 in respect of the land described as Allotment 18 of Section 12, City of Port Melbourne, Parish of Melbourne South, being the land in Certified Plan No. 119746 lodged in the Central Plan Office of DSE, known as Station Pier.
This Act is otherwise administered by the Minister for Planning, the Attorney-General, the Minister for Finance, WorkCover and the Transport Accident Commission, the Minister for Health, and the Minister for Corrections.
Local Government Act 1989
Clauses 4 and 9(3) of Schedule 11 and section 123, in so far as it relates to the revocation of local laws made pursuant to the powers conferred by those clauses by reason of section 207 of the Act.
This Act is otherwise administered by the Minister for Local Government and the Attorney-General.
This Act provides generally for matters to do with local government in Victoria. The provisions administered by the Minister for Roads and Ports relate to traffic control.
Marine Act 1988
This Act establishes the Director of Marine Safety and provides for the objects, powers, and functions of the Director. In particular, the Director regulates marine safety through the exercise of its powers and functions. The Act also provides for registration of vessels, regulation of the operation of vessels, offences involving alcohol, prevention of pollution of state waters, the adoption of certain international conventions, enforcement of various offences through the issue of marine infringement notices, and for other matters.
Melbourne City Link Act 1995
This Act relates to the construction and operation of the Melbourne City Link, and provides for the fixing, charging and collection of tolls in relation to the use of vehicles in toll zones.
Pollution of Waters by Oil and Noxious Substances Act 1986
All sections except for sections 30 and 47, which are jointly administered with the Minister for Water, Environment and Climate Change, and sections 8, 9, 10, 11, 12, 13, 18, 19, 20, 21, 22, 23, 23B, 23D, 23E, 23G, 23J, 23K, 23L and 24E, which are administered by the Minister for Water, Environment and Climate Change.
This Act provides for the protection of the sea and other waters from pollution by oil and other noxious substances.
Acts administered by the Minister for Roads and Ports
Accident Towing Services Act 2007*
This Act aims to promote the safe, efficient and timely provision of accident towing services through licensing the operation of tow trucks, and the accreditation of tow truck drivers and operators and managers of accident towing services.
* This Act is due to commence on 1 January 2009
Chattel Securities Act 1987
Part 3
This Act is otherwise administered by the Minister for Consumer Affairs.
This Act makes provision for security interests in motor vehicles, trailers, and vessels, including registration of interests. Part 3 provides the registration requirements for security interests.
Crown Land (Reserves) Act 1978
Only in so far as it relates to the land shown as Crown Allotment 18, section 12, City of Port Melbourne, Parish of Melbourne South, as shown on Original Plan No. 119746-A lodged in the Central Plan Office – (LA/32/0012) known as Station Pier.
The remaining provisions are administered by the Minister for Finance, WorkCover and the Transport Accident Commission, the Minister for Major Projects, the Minister for Planning and the Minister for Sport, Recreation and Youth Affairs.
223
Port Services Act 1995
All sections and schedules except sections 160, 171 and 173, which are administered by the Treasurer, and sections 63AA-63J (inclusive), which are administered by the Minister for Finance, WorkCover and the Transport Accident Commission.
This Act establishes the Port of Melbourne Corporation, Port of Hastings Corporation, and the Victorian Regional Channels Authority. The Act also provides for charges and licensing for port use.
Road Management Act 2004
The Act establishes a statutory framework for the management of the road network, facilitating the coordination of various uses of road reserves for roadways, pathways, infrastructure, and similar purposes.
Road Safety Act 1986
This Act provides for the registration of motor vehicles, licensing of drivers, offences involving alcohol or other drugs and other provisions regulating the operation and use of motor vehicles.
Southern and Eastern Integrated Transport Authority Act 2003
The purposes of this Act are to establish Southern and Eastern Integrated Transport Authority and to facilitate the Southern and Eastern Integrated Transport Project.
Acts passed during 2007–08
Minister for Public TransportTransport Legislation Amendment »Act 2007
Minister for Roads and Ports Port Services Amendment Act 2007 »
Road Legislation Further »Amendment Act 2007
Transport Act 1983Part II, Division 3 »
Part II, Division 4 (section 32 only »in so far as it relates to the Roads Corporation with the balance of that section being administered by the Minister for Public Transport)
Section 35 »
Part IV »
Part VI, Division 8 »
This Act is otherwise jointly administered with the Minister for Public Transport (except Part II, Division 1, Subdivisions 2, 3 and 4; Part VI, Division 10 and Part VII, Divisions 4, 4AA, 4A and 4B, which are administered by the Minister for Public Transport).
This Act establishes and sets out the functions and powers of the Department of Transport in relation to transport matters, and those of the Roads Corporation as well as establishing a number of statutory offices. The Act also provides for the licensing of commercial vehicles and for various offences as well as enforcement powers relating to railway and tram safety.
Westernport (Crib Point Terminal) Act 1963
This Act assists the development and operation of a petroleum terminal at Crib Point by providing for certain existing and new easements, and clarifying the status of existing agreements relating to the pipeline running from the terminal site to Dandenong.
224 Department of Transport Annual Report 2007-08
the number and types of disclosed »matters referred by DOT to the Ombudsman to investigate: nil
the number and types of disclosed »matters taken over by the Ombudsman from DOT: nil
the number of requests by »complainants to have their disclosed matters investigated by the Ombudsman due to their dissatisfaction with the way DOT is investigating the matter (the circumstances are set out in section 74 of the Act): nil
the number and types of disclosed »matters that DOT declined to investigate: nil.
Access to documents (as defined in section 5 of the Act) may be obtained only through written request as detailed in section 17 of the Freedom of Information Act 1982. Requests may be submitted in writing, addressed to:
Freedom of Information Manager Department of Transport PO Box 2797 Melbourne, Victoria 3001
Telephone: (03) 9655 6380 Email: [email protected]
Alternatively, requests may be submitted online through Freedom of Information Online, located at www.foi.vic.gov.au
Report pursuant to section 104 of the Act for the year 1 July 2007 to 30 June 2008:
DOT has publicly accessible »procedures for managing disclosures
the number and types of »disclosures made to DOT: nil
the number of disclosures referred »by DOT to the Ombudsman to determine whether they are public interest disclosures: nil
the number and types of disclosed »matters referred to DOT by the Ombudsman: nil
The Freedom of Information Act 1982 gives the public a right of access to documents held by government departments.
For the period 2007–08, DOT received 301 applications. Of these requests, 85 were from Members of Parliament, 52 from the media and the remainder were from the general public. During the reporting period, the department received 13 requests for internal review, with two subsequently progressing to the appeal stage at the Victorian Civil and Administrative Tribunal (VCAT). A further six requests went directly to appeal at VCAT.
Whistleblowers Protection Act 2001
Freedom of Information Act 1982
225
Victorian Industry Participation Policy
In October 2003, the Victorian Parliament passed the Victorian Industry Participation Policy Act 2003 which requires public bodies and departments to report on the implementation of the Victorian Industry Participation Policy (VIPP). Departments and public bodies are required to apply VIPP in all tenders over $3 million in metropolitan Melbourne and $1 million in regional Victoria.
New Projects
During 2007-08, DOT commenced 20 contracts to which the VIPP applied. Their total value was $646.6 million.
The VIPP commitments by contractors under these contracts included:
an overall level of local content of »approximately 86.5%
396 full time equivalent jobs. »
In addition, the following benefits to the Victorian economy in terms of skills and technology transfer were provided by contractors under these contracts:
incorporation of value engineering »as part of the proposed works and this will create an opportunity to increase the skills of locally based staff by incorporating new technology from Europe
development of highly robust and »reliable tachometry, data recording and analysis systems for transport applications, having strong export potential
training to users and support staff »in rail operations management software
technology transfer for new »innovation such as enhanced fabrication techniques, solar power technology, water-saving techniques, real-time information displays and innovative display techniques
training of staff in the use of leading »rail geometry systems
“On the job” training where all »employees have the opportunity to increase skills through implementation of project
experience provided to graduates »coming from and working in a number of remote locations across the nation
involvement with an alliance »delivery model and exposure to “relationship” based contracting will provide an excellent opportunity to develop positive new skills and behaviours which will be invaluable for the delivery of future complex rail infrastructure projects within Victoria
local staff will gain training and use »of a specialised computer software package currently not used within Australia.
Completed Projects
There were six projects completed in this period to which the VIPP applied. Their total value was $50.9 million.
The contractors under these contracts achieved the following:
an overall level of local content of »approximately 96.7%
approximately 90 full time »equivalent jobs.
In addition, the following benefits to the Victorian economy in terms of skills and technology transfer were provided by contractors under these contracts:
skills expansion and experience of »working in rail system
training of staff on rail track safety »awareness
training of staff in quality »awareness.
226 Department of Transport Annual Report 2007-08
National Competition Policy Compliance
National Reform Agenda
Infrastructure Australia
The Australian Government created a new statutory authority, Infrastructure Australia, in April 2008. Infrastructure Australia will coordinate the planning and deliver of infrastructure projects across portfolios, including transport, water, energy and telecommunications.
The first task of the new body will be to conduct a national audit of infrastructure.
The Victorian Government submitted its audit of the state’s transport, water and telecommunications audit on 30 June 2008. The Department of Transport was involved in preparing the transport component of the audit submission.
The Victorian submission identified gaps, deficiencies and bottlenecks in the state’s entire infrastructure network.
The main gaps in transport infrastructure were identified as:
creating extra capacity in »Melbourne’s east-west freight and passenger corridor
meeting the demand for new »transport infrastructure in outer metropolitan growth suburbs and regional cities/towns
providing additional orbital road »links in the metropolitan transport network
increasing the capacity of the »inner core of the metropolitan rail network
managing growth and changing »supply chain patterns in commodity and processing industries in regional Victoria
improving the performance of »the interstate rail network and increasing the amount of freight carried
expanding trade capacity of the Port »of Melbourne and Port of Hastings by enhancing their landside infrastructure, transport access and intermodal links.
Infrastructure Australia is due to complete a national priority list of infrastructure projects by March 2009.
AusLink 2
National Transport Links – Growing Victoria’s Economy, Victoria’s submission for funding under AusLink 2 was released on 3 July 2007.
Through AusLink 2, the Victorian Government has negotiated with the Australian Government funding for 25 projects across the road, rail and intermodal sectors.
National Transport Plan
The Commonwealth Government announced on 29 February 2008 that it would work with state governments to create a national transport plan.
It was agreed that Victoria would put a number of initiatives forward to the Council of Australian Governments in October 2008, including a National Road Safety Council and a framework for national heavy vehicle regulation. In addition, Victoria is working to improve national harmonisation in rail and marine safety.
The Victorian Government has been given the responsibility for developing two key elements of the national transport plan:
policy initiatives to address urban »congestion
better ways to plan and invest in »infrastructure.
However, the Victorian Government also provided input into other sections of the national transport plan.
227
Secretary’s Attestation of Risk Management
In accordance with Ministerial Direction 5.4.4 under the Financial Management Act 2004 and the Victorian Government Risk Management Framework – and following a management review of the department’s risk management practices – the Secretary makes the following attestation:
“I, Jim Betts, certify that as at 30 June 2008, the Department of Transport has risk management processes in place broadly consistent with the Australian/New Zealand Risk Management Standard 4360 and an internal control system is in place that enables the executive to understand, manage and satisfactorily control risk exposures in significant respects. The Audit Committee verifies this assurance and that the risk profile of the Department of Transport has been critically reviewed within the last 12 months.”
Building Act Compliance
The Directions of the Minister for Finance require this Annual Report to include a statement on the extent of compliance with the building and maintenance provisions of the Building Act 1993, for publicly-owned buildings controlled by DOT.
DOT does comply with the building and maintenance provisions of the Building Act 1993.
228 Department of Transport Annual Report 2007-08
Major Publications
Disclosure of Major Contracts Compliance
Consultant Engagements
TransportVictorian Fares and Ticketing »Manual 2008
Track Record – issues 32,33,34 »
2007 Seniors Travel Guide »
National Transport Links »(Growing Victoria’s Economy)
Maintaining Mobility »(The transition from driver to non-driver)
Victorian Taxi Directorate »Strategic Plan
Victorian Rail Freight »Network Review
DOT has disclosed all contracts greater than $10 million in value which it entered into in 2007-08.
The disclosed contracts can be viewed at www.contracts.vic.gov.au
There were no consultant engagements in 2007-08 where the cost of the engagement was $100,000 or greater.
In addition, a further six consultancies where the total fee payable to the consultant was less than $100,000 were engaged during the financial year at a total approved project fee of $200,488 and an expenditure of $161,977.
Marine SafetyBoating Safety & Infrastructure »Program 2007-08
CorporateDepartment of Infrastructure »Annual Report 2006-07
229
Other available information
The Directions of the Minister for Finance, pursuant to the Financial Management Act 1994 require a range of information to be prepared in relation to the financial year.
This material is itemised below and, where not published in this report, is retained by the accountable officer and can be made available to Ministers, Members of Parliament and the public on request, subject to the limitations of the Freedom of Information Act 1982:
declarations of pecuniary interests »completed by all relevant DOT officers for the year ended 30 June 2008
details of shares held by senior »DOT officers as nominees or held beneficially in a statutory authority or subsidiary
details of publications produced »by DOT and where the publications can be obtained
details of changes in prices, fees, »charges, rates and levies charged by DOT
details of major external reviews »carried out on DOT
details of major research and »development activities undertaken by DOT
details of overseas visits »undertaken by DOT, including a summary of the objectives and outcomes of each visit
details of major promotional, public »relations and marketing activities undertaken by DOT to develop community awareness of DOT and the services it provides
details of assessments and »measures undertaken to improve the occupational health and safety of DOT employees
a general statement on industrial »relations within DOT and details of time lost through industrial accidents and disputes
a list of major committees »sponsored by DOT, the purpose of each committee and the extent to which the purpose has been achieved.
Requests for information should be directed to:
James Lavery Executive Director DOT Legal Department of Transport Level 14, 121 Exhibition Street Melbourne, Victoria, Australia 3000
DOT contact information
Department of Transport
121 Exhibition Street Melbourne Victoria Australia 3000
Telephone: (03) 9655 6666 International: +61 3 9655 6666
Facsimile: (03) 9095 4096 International: +61 3 99095 4096
Internet: www.transport.vic.gov.au
Postal address
PO Box 2797 Melbourne Victoria Australia 3001
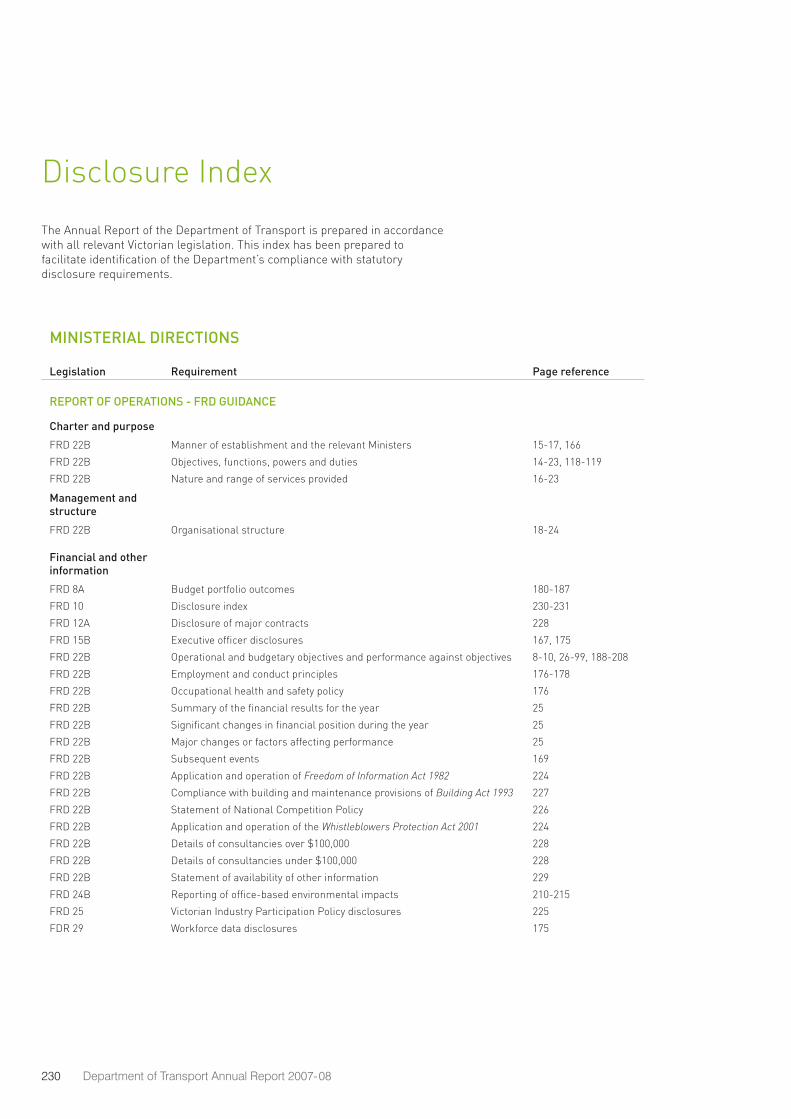
230 Department of Transport Annual Report 2007-08
Disclosure Index
MINISTERIAL DIRECTIONS ILegislation Requirement Page reference
REPORT OF OPERATIONS - FRD GUIDANCE
Charter and purpose
FRD 22B Manner of establishment and the relevant Ministers 15-17, 166
FRD 22B Objectives, functions, powers and duties 14-23, 118-119
FRD 22B Nature and range of services provided 16-23
Management and structure
FRD 22B Organisational structure 18-24
Financial and other information
FRD 8A Budget portfolio outcomes 180-187
FRD 10 Disclosure index 230-231
FRD 12A Disclosure of major contracts 228
FRD 15B Executive officer disclosures 167, 175
FRD 22B Operational and budgetary objectives and performance against objectives 8-10, 26-99, 188-208
FRD 22B Employment and conduct principles 176-178
FRD 22B Occupational health and safety policy 176
FRD 22B Summary of the financial results for the year 25
FRD 22B Significant changes in financial position during the year 25
FRD 22B Major changes or factors affecting performance 25
FRD 22B Subsequent events 169
FRD 22B Application and operation of Freedom of Information Act 1982 224
FRD 22B Compliance with building and maintenance provisions of Building Act 1993 227
FRD 22B Statement of National Competition Policy 226
FRD 22B Application and operation of the Whistleblowers Protection Act 2001 224
FRD 22B Details of consultancies over $100,000 228
FRD 22B Details of consultancies under $100,000 228
FRD 22B Statement of availability of other information 229
FRD 24B Reporting of office-based environmental impacts 210-215
FRD 25 Victorian Industry Participation Policy disclosures 225
FDR 29 Workforce data disclosures 175
The Annual Report of the Department of Transport is prepared in accordance with all relevant Victorian legislation. This index has been prepared to facilitate identification of the Department’s compliance with statutory disclosure requirements.
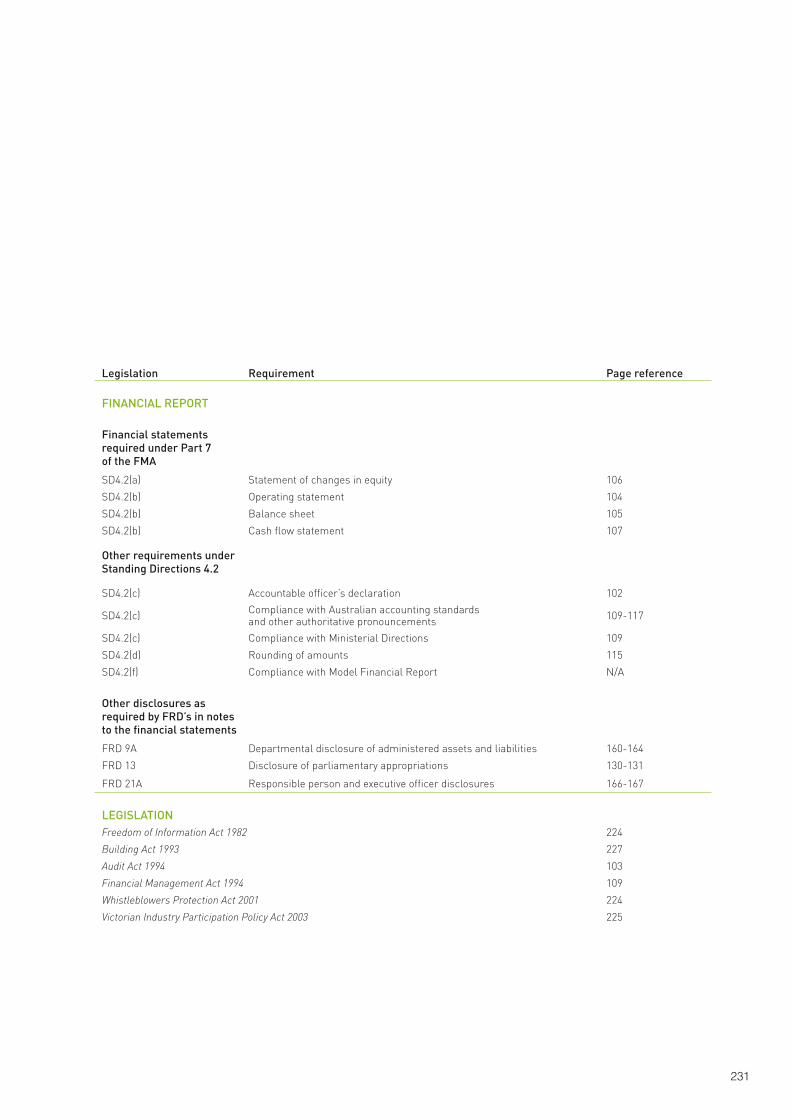
231
Legislation Requirement Page reference
FINANCIAL REPORT
Financial statements required under Part 7 of the FMA
SD4.2(a) Statement of changes in equity 106
SD4.2(b) Operating statement 104
SD4.2(b) Balance sheet 105
SD4.2(b) Cash flow statement 107
Other requirements under Standing Directions 4.2
SD4.2(c) Accountable officer’s declaration 102
SD4.2(c) Compliance with Australian accounting standards and other authoritative pronouncements 109-117
SD4.2(c) Compliance with Ministerial Directions 109
SD4.2(d) Rounding of amounts 115
SD4.2(f) Compliance with Model Financial Report N/A
Other disclosures as required by FRD’s in notes to the financial statements
FRD 9A Departmental disclosure of administered assets and liabilities 160-164
FRD 13 Disclosure of parliamentary appropriations 130-131
FRD 21A Responsible person and executive officer disclosures 166-167
LEGISLATIONFreedom of Information Act 1982 224
Building Act 1993 227
Audit Act 1994 103
Financial Management Act 1994 109
Whistleblowers Protection Act 2001 224
Victorian Industry Participation Policy Act 2003 225 5