DEPARTMENT OF THE INTERIOR U.S. Geological … OF THE INTERIOR U.S. Geological Survey Petroleum...
125
DEPARTMENT OF THE INTERIOR U.S. Geological Survey Petroleum geology and the distribution of conventional crude oil, natural gas, and natural gas liquids, East Texas basin by R.Q. Foote, L.M. Massingill, and R.H. Wells Open-File Report 88-450K This report is preliminary and has not been reviewed for conformity with U.S. Geological Survey editorial standards or stratigraphic nomenclature. 1988
Transcript of DEPARTMENT OF THE INTERIOR U.S. Geological … OF THE INTERIOR U.S. Geological Survey Petroleum...

DEPARTMENT OF THE INTERIOR
U.S. Geological Survey
Petroleum geology and the distribution of conventional crude oil, natural gas, and natural gas liquids, East Texas basin
by
R.Q. Foote, L.M. Massingill, and R.H. Wells
Open-File Report 88-450K
This report is preliminary and has not been reviewed for conformity with U.S. Geological Survey editorial standards or stratigraphic nomenclature.
1988

CONTENTSPage
Abst ract 1Int roduct ion 3Basin type, location and size 3Structural setting 3Stratigraphy 9
Pre-Triassic geologic history 9Triassic Period 14Jurassic Period 14Cretaceous Period 22Tertiary Period:Paleocene-Eocene Series 48Tertiary PeriodrOligocene Series 59
Petroleum source rocks 59Hydrocarbon generation 60
Burial history 60Thermal maturity 63Timing and migration 63
Hydrocarbon occurrence 64Stratigraphic and structural habitat of petroleum 64Basis for play definition 68Other prospective areas and intervals 71
Principal plays 71Ove rview 71N.E. Texas basement structure play 71Mexia/Talco fault system play 79N.E. Texas salt anticline play 83Tyler basin structural play 86Tyler basin Woodbine-Eagle Ford play 89West Tyler basin Cotton Valley play 92Sabine uplift gas play 95Sabine uplift oil play 97East Texas-Kurten Fields 100
References 103Appendix 114

ILLUSTRATIONSPage
Figure 1. Tectonic map of the northern Gulf of Mexico region 42. Chart showing stratigraphic section, Mesozoic and
Cenozoic strata, East Texas basin 53. Map of eastern Texas, southern Arkansas and western
Louisiana showing major structural features, updip limitof Louann Salt, and oil and gas resource appraisal area 6
4. Generalized cross section of northern Gulf of Mexicomargin 8
5. Map of east Texas salt-diapir and salt-pillow provincesbased on borehole and gravity data 10
6. Structural cross sections across the East Texas basin 117. Map of structure on top of Louann Salt or on top of
pre-Louann surface, showing four salt provinces in East Texas basin 12
8. Pre-Jurassic subcrop map, western interior Gulf coastalplain 13
9. Map showing late Smackover paleogeography, facies, andlocations of selected oil and gas fields producing from Smackover Formation reservoirs, East Texas basin 16
10. Generalized north-south cross section of pre-Jurassic andJurassic sequences in northeast Texas 17
11. Map showing generalized lithologies of Buckner Formation,northeast Texas 18
12. Map showing Haynesville Formation paleogeography, facies, and locations of selected oil and gas fields producing from Haynesville Formation reservoirs, East Texas basin 20
13. Map showing general distribution of facies and locations of selected oil and gas fields producing from Cotton Valley Group reservoirs, East Texas basin 21
14. Map showing paleogeography, facies, and locations of selected oil and gas fields producing from Cotton Valley Group strata, East Texas basin 23
15. Generalized columnar sections of Lower Cretaceoussediments, northeast Texas 25
16. Map showing depositional environments, facies, andlocations of selected oil and gas fields producing fromearly Hosston-Pettet Formation reservoirs,East Texas basin 26
17. Map showing depositional environments, facies, andlocations of selected oil and gas fields producingfrom middle Hosston-Pettet Formation reservoirs,East Texas basin 27
18. Map showing depositional environments, facies, andlocations of selected oil and gas fields producingfrom late Hosston-Pettet Formation reservoirs,East Texas basin 28
19. Structure map of top of Pettet Formation and topof Hosston Formation (Hunt County only), northeast Texas 29
ii

ILLUSTRATIONS (cont inued)Page
20-25. Map showing depositional environments, facies, andlocations of selected oil and gas fields producing from
20. middle Pine Island Formation reservoirs,East Texas basin 30
21. early James Formation reservoir,East Texas basin 31
22. late James Formation reservoirs,East Texas basin 32
23. middle Bexar Formation reservoirs,East Texas basin 33
24. middle Rodessa Formation reservoirs,East Texas basin 34
25. middle Ferry Lake Anhydrite,East Texas basin 36
26. Map showing distribution and facies of Paluxy Formationand related stratigraphic units, northeast Texas 38
27. Map showing sandstone isolith of the Paluxy and upperpart of Antlers Formations, northeast Texas 39
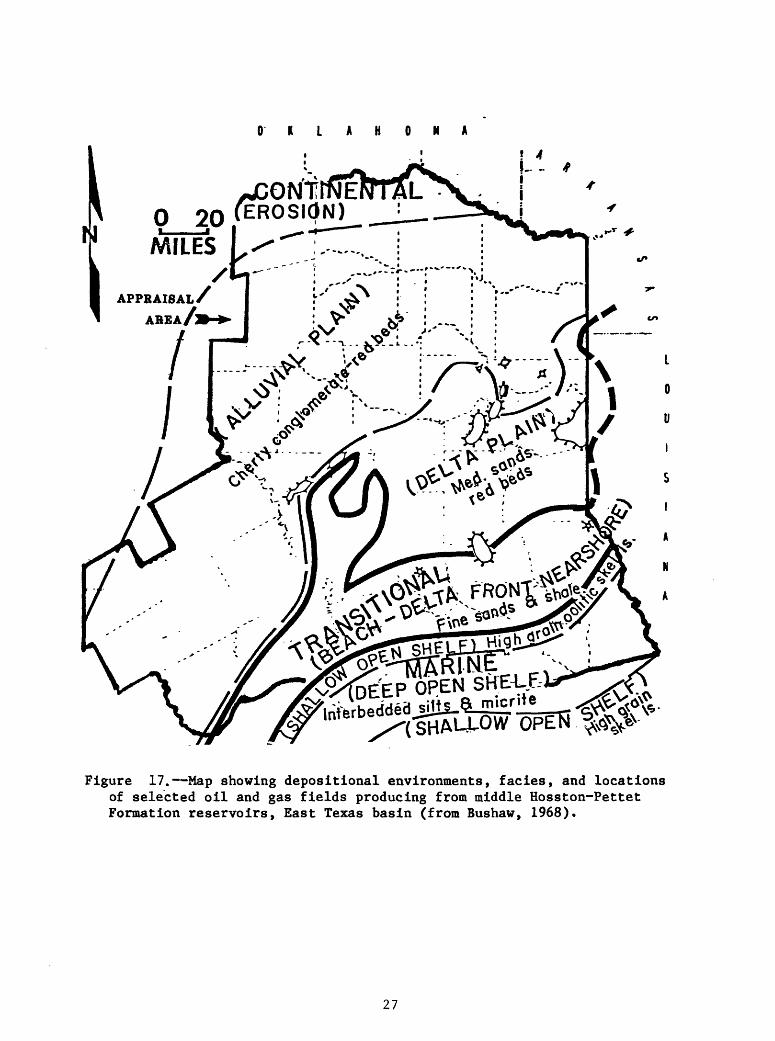
28. Map showing ground water, oil and gas resources ofPaluxy Formation, northeast Texas 40
29. Contour map showing major structural features on top of Georgetown Formation, northeast Texas northeast Texas 41
30. Paleogeographical map of northeast Texas showingWoodbine Formation depositional systems, northeast Texas 43
31. Regional index map showing locations of oil and gas fields producing from shallow and deep Woodbine Formation strata and shallow and deep Tuscaloosa Formation strata, Gulf Coastal Plain 44
32. Map showing total thickness of sandstone inWoodbine-Eagle Ford Formations, east Texas 46
33. Seismic profile across south part of Kurten Field, Brazos County, and across lola, Hill and Martins Prairie Fields, Grimes County, Texas 46
34. Paleogeographical map showing east Texas prior todeposition of Austin Group 47
35. Map showing depositional environments and lithofaciesof Austin Chalk, East Texas basin 47
36. Map showing depositional environments and sedimentdistribution, Nacatoch Formation, northeast Texas 49
37. Map showing net-sand thickness, outcrops, and surfacesample locations, Nacatoch Formation, East Texas basin 50
38. Map showing oil and gas fields producing from NacatochFormation and Upper Navarro Marl, East Texas basin 51
39. Structure contour map of base of Upper Navarro Marl,northeast Texas - 52
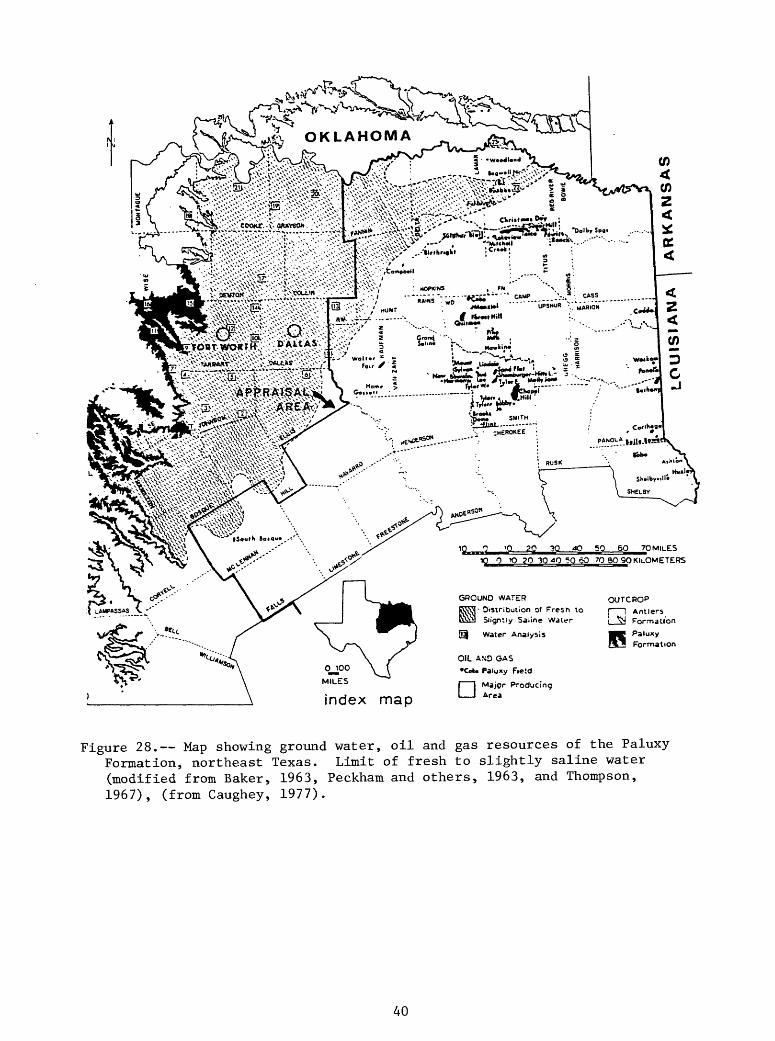
40. Paleogeographical map of Gulf Coastal Plain atbeginning of Tertiary 53
41. Comparisons of selected Tertiary and Holocene depositionalsystems of Texas Gulf Coast basin 55
42. Map showing depositional environments, Queen CityFormation, East Texas basin 56
iii

ILLUSTRATIONS (continued)Page
43. Map showing outcrop, sandstone isoliths, and selectedoil and gas fields producing from Queen City Formation,East Texas basin 57
44. Map of Brazos and Burleson Counties showing sampledwater wells and oil and gas production wells 58
45. Stratigraphic column of East Texas basin with dot patterns designating producing Cretaceous intervals that yielded oil studied in Conti, 1982 61
46. Diagram showing age and geothermal gradient ranges forEast Texas basin 61
47. Graph and contours showing composite statistical trend ofAPI gravity vs. depth of Cretaceous oils with dot pattern indicating trends representing highest density of data 62
48. Graph and contours showing composite statistical trend ofAPI gravity vs. temperature as determined by data-density analysis of all Cretaceous oils plotted together 62
49. Graph showing number of oil fields and years fromfirst to last discovery, East Texas basin plays 72
50. Graph showing number of gas fields and years fromfirst to last discovery, East Texas basin 73
51. Graph showing number of producing fields classified as neither oil nor gas fields and years from first to last discovery, East Texas basin 74
52-60. Map showing oil and gas fields within the52. N.E. Texas basement structure play,
East Texas basin 7553. Mexia/Talco fault system play, East Texas basin 8054. N.E. Texas salt anticline play, East Texas basin 8455. Tyler basin structural play, East Texas basin 8756. Woodbine-Eagle Ford play, East Texas basin 9057. West Tyler basin Cotton Valley play, East Texas
basin 9358. Sabine uplift gas play, East Texas basin 9659. Sabine uplift oil play, East Texas basin 9860. Map showing East Texas-Kurten Fields,
East Texas basin 101
IV

TABLESPage
Table 1. Known recoverable quantities of crude oil, natural gas, andnatural gas liquids by geologic age, East Texas basin 65
2. Ultimate recoverable quantities of crude oil, natural gas, and natural gas liquids by types of traps and reservoir rocks, East Texas basin 67
3. Resource appraisal plays, number of oil and gas fields, producing formations, thicknesses of pay zones, porosities, permeabilities, and liquid hydrocarbon gravities, East Texas basin plays 69
4. Known recoverable quantities, cumulative production,remaining proven reserves, and percent of proven reserves remaining to be produced for crude oil, natural gas, and natural gas liquids in resource appraisal plays, East Texas basin 70
5. East Texas basin oil and gas fields 76-77

APPENDIXPage
A-l. Generalized stratigraphic chart showing regional correlations of Coahuilan and Comanchean Series strata, southern United States 115
A-2. Generalized cross section showing stratigraphicrelationships among Antlers, Twin Mountains, Glen Rose,Paluxy, Walnut, and Goodland Formations, northeast Texas 116
A-3. Map showing outcrop of Claiborne Group of sedimentaryrocks, Texas Coastal Plain 117
A-4. Diagrammatic cross section of Claiborne Group incentral Texas 117
A-5. Generalized cross section showing relationships oflower Tertiary depositional systems from south Texasto west Louisiana 118
vi

ABSTRACT
A national assessment of undiscovered recoverable crude oil and natural gas resources of the United States was recently conducted by the U.S. Geological Survey. This report presents the petroleum geology, oil and gas plays, and other information used in the appraisal of the East Texas basin province as part of the national assessment.
The appraisal involves analysis of 294 oil and gas fields discovered between 1895 and 1985. Each of these fields has known recoverable quantities of crude oil and natural gas liquids of more than 1 million barrels or more than 6 billion cubic feet of natural gas. The known recoverable quantities of the 294 fields are 8.908 billion barrels of crude oil, 28.582 trillion cubic feet of gas, and 1.587 billion barrels of natural gas liquids.
The East Texas basin is divided into eight oil and gas plays which share similar geological characteristics of petroleum source beds, reservoir rocks, and hydrocarbon trapping mechanisms. These eight plays are: (1) N. E. Texas basement structure play; (2) Mexia/Talco fault system play; (3) N. E. Texas salt anticline play; (4) Tyler basin structural play; (5) Tyler basin Woodbine-Eagle Ford play; (6) West Tyler basin Cotton Valley play; (7) Sabine Uplift gas play; and, (8) Sabine Uplift oil play. The East Texas and Kurten Fields are not included in any play because each of these two fields has unusual characteristics which are unlikely to be duplicated elsewhere in the basin.
The reservoir rocks range in age from Upper Jurassic (Smackover Formation) to Eocene (Claiborne Group). The Gulfian Series, Late Cretaceous, is the principal source of crude oil; large quantities of natural gas are in the Coahuilan, and Upper Jurassic strata. Limited quantities of crude oil and natural gas are found in Eocene strata.
The trapping mechanisms are structural, stratigraphic and combination traps. The largest percentage of crude oil is in stratigraphic traps. Combination traps account for the largest concentrations of natural gas and natural gas liquids.
Crude oil is found predominantly in sandstone reservoir rocks, whereas limestone reservoir rocks are natural gas prone. Other reservoir rocks are dolomites and, to a lesser degree, chalks and anhydrite.
Petroleum source beds appear to be distributed widely over the basin and throughout the stratigraphic column from Upper Jurassic to Late Cretaceous. The oldest, most widely recognized petroleum source beds are in the lower Smackover Formation. Hydrocarbons were also generated in younger strata of Upper Jurassic and Early Cretaceous. Significant quantities of hydrocarbons were generated in the chalks and marine shales of Woodbine and Eagle Ford Groups, with lesser amounts probably generated from the younger, Late Cretaceous strata. Prolific petroleum source beds are: laminated, organic-rich carbonate mudstones; mudstone-rich and matrix supported carbonates; dense, dark-brown micrinitic limestones; dark-colored organically rich, marine shales; and, chalks.
The thermal history of the East Texas basin appears favorable for generation of hydrocarbons. The maturation trend appears to actually begin at a depth of about 3,000 ft (914 m), which places the onset of oil generation at a younger geologic age than expected. The vitrinite values from studies of the older producing strata suggest that the peak oil generation has been exceeded, the gas/oil ratio has increased, wet gas generation has begun, and dry gas generation has begun in deeper parts of the basin. The massive Ferry Lake Anhydrite appears to have formed a barrier which separated two

generation/maturation systems, one above and one below the massive anhydrite strata.
Timing of migration in the East Texas basin seems to have had a significant influence on hydrocarbon accumulation. Hydrocarbons began to migrate into Upper Jurassic reservoirs after early cementation, but before the later, deeper subsurface cements were precipitated. Migration of hydrocarbons into Woodbine Formation traps appears to have taken place during Late Cretaceous. Migration of crude oil into the uppermost Late Cretaceous and Tertiary Period strata occurred as late as the development of reservoir seals over Wilcox Group and Carrizo Formation reservoirs.
The East Texas basin is a maturely developed petroleum province. The potential for undiscovered recoverable crude oil and natural gas resources appears to be in currently productive areas, in extensions to currently productive trends, particularly into the deeper parts of the basin, and in the Norphlet Formation and Weraer Formation, Middle and Lower Jurassic. Hydrocarbons may be present also in Triassic (Eagle Mills Formation) and Paleozoic sedimentary strata.

INTRODUCTION
The U.S. Geological Survey (USGS) periodically conducts national assessments of undiscovered recoverable crude oil and natural gas resources. Resource assessments were published in USGS Circular 625 (hereafter referred to as Circular 625) by Hendricks (1965), Circular 650 (Theobald and others, 1972), and U.S. Geological Survey News Release (1974). The results of subsequent national resource assessments are contained in Circular 725 (Miller and others, 1975) and Circular 860 (Dolton and others, 1981). A national assessment has been completed recently and a Working Paper has been released (USGS-MMS, 1988) describing the methodologies, assumptions and data used in the study, and indications of the petroleum potential of the United States.
In the 1988 national assessment, the United States is divided into nine onshore regions comprising 80 geologic provinces and four offshore regions comprising 35 geologic provinces. One of the nine onshore regions is Region 6, Gulf of Mexico, which is comprised of the Western Gulf basin, the Louisiana-Mississippi salt basins, and the East Texas basin (fig. 1). The purpose of this report is to discuss the geologic framework, petroleum geology, resource assessment, oil and gas plays, and other information used in the appraisal of the East Texas basin province as part of the 1988 assessment. The geologic framework and petroleum geology provide background information on the province and are based upon a synthesis of published literature.
BASIN TYPE, LOCATION AND SIZE
The Gulf of Mexico is a relatively small ocean basin covering an area of more than 579,000 mi (1.5 million km ) (Martin, 1984). The northern Gulf of Mexico basin (hereafter called Gulf basin) is a passive margin basin formed on the southern edge of the North American continent. During and following the Triassic Period (fig. 2), the African and South American continents began to drift southeasterly relative to North America (Walper and Miller, 1985). The Gulf basin gained its present form from a combination of rifting and intrabasin sedimentary-tectonic processes during and after the Mesozoic Era (Murray and others, 1985). The northern rim of the Gulf basin is bound by the Ouachita tectonic belt extending across central and northeast Texas, southern Arkansas, and northern Mississippi.
The East Texas basin is one of three Mesozoic basins flanking the northern rim of the Gulf Coastal Plain. Initial subsidence due to rifting and crustal attenuation has combined with subsequent sediment loading to cause maximum subsidence of more than 23,000 ft (7,010 m) in the center of the basin (Jackson and Seni, 1984). «The area of«the basin to be appraised for oil and gas resources is 30,577 mi (79,190 km ) (fig. 3). The volume of sedimentary rock prospective for,,the accumulation of hydrocarbons (down to Paleozoic strata) is 68,043 mi (283,603 km ) (Dolton and others, 1981). Paleozoic strata are generally considered to be "basement rocks" in the East Texas basin and have not been shown to be sufficiently prospective to be considered for resource appraisal in this study.
STRUCTURAL SETTING
The deep water region of the Gulf of Mexico is underlain by dense basaltic-type oceanic basement rocks (Ewing and others, 1960, 1962; Menard, 1967; Martin and Case, 1975). Thinned, moderately dense basement rocks underlie the continental slopes and large parts of the continental shelf areas

*k«To K L*
*A H'O lipIwSi
"'^>Ax^rS^
' -4-
* l*'VJ^f-T^*1
^'.. '*
*£; -^**>*i-
^jk-^^%*,^^^ >
f_
_--r
-;
j*i
T>^-
(y^.,;^->-^v
/"VS--
' :/
-M
-./*
*.-v
-
.;> \ A,
^^H^^
100*
1 234 56
7 8
9
10
11
12
13
Figu
re 1. Tectonic m
ap of
th
e northern Gu
lf of
Me
xico
re
gion
. Compiled fr
o* Fl
awn,
an
d others (1
961)
, Bryant and
others (1
969)
, Hi
ckey
and
others (1
972)
, Braunstein a
nd ot
hers (1
973)
, Be
bout
an
d Loucks (1
974)
, Ki
ng and
Belk
man
(197
4),
King
(1
975)
, an
d Th
omas
(1
976)
, and
In
addition,
unpu
blis
hed
U.S. Geological Survey da
ta.
Expl
anat
ion
of patterns and
symbols: 1) Normal fa
ult
with
hachures on d
ownthrown
side
; 2) re
vers
e fa
ult,
sawteeth o
n overthrust plate; 3) fault
of undetermined mo
veme
nt and
exte
nt;
4) broad
anticline
or arch,
of regional
exta
nt;
3) sa
lt di
apir
s and ma
ssif
s outlining
relative sh
ape
and
size;
6) salt anticlines an
d swells (nondiapiric)
show
ing
gene
ral
trend;
7) shale
domes
and
anti
clin
es sh
owin
g ge
nera
l size an
d tr
end;
8)
plutonic and
volcanic rocks
of M
esoz
oic
age
excl
usiv
e of
basement
comp
lexe
s an
d Tr
iaas
lc di
abas
e sills; 9)
updip
limi
ts of
Lo
uann
Salt;
10)
down
dlp
limi
ts of deep w
ells
reaching rocks
of Ou
achi
ta tectonic
belt
; 11)
upli
fts
of ex
pose
d Paleozoic
strata and
crys
tall
ine
basement ro
cks;
12)
tren
d of
Lower
Cretaceous sh
elf-
marg
in reef sy
stem
; 13)
lone
r margin of
Cretaceous and
Tert
iary
Co
asta
l Pl
ain
deposits.
Scale
1* latitude equals 110 km
(f
rom Ma
rtin
, 19
84).

£R»- THEM
CENOZOIC
MESOZOIC
JO I"1
STSIEU
TERTIARY
CRETACEOUS
JURASSIC
SERIES
EOCENE
PALEOCENE
UPPER CRETACEOUS
LOWER CRETACEOUS
UP>ER URASSIC
-3
3iss»unr3TCOIN
-AtfvweJcwr rmtc
GROUP
CLAIBORNE
WILCOX
MIDWAY
NAVARRO
TAYLOR
AUSTIN
EAGLE FORD
WOODBINE
WASHITA
FREDERICKS^
TRINITY
COTTON VALLEY
LOUARK
LOUANN
1
^
FORMATION/MEMBER
YECUA FK.
COOK MOUNTAIN FmSPARTA Fm
UNOIFFERENTIATEO
UNOIFFERENTIATEO
UPPER NAVARRO CLAY
UPPER NAVARRO MARL
LOWER NAVARRO Fm
UPPER TAYLDR Fm
PECAN GAP CHALK 5 W
^^1
--SggfSEi
_^_AUSTIN CHALK
S^^SE= - " FORO
' Fm
| LMilvlll* Mbr
| Outer Sand Mbr
MAN ESS SHALE ~^W/,BUOA LIMESTONEGRAYSON SHALE
MAIN STREET LIMESTONEWENO-PW PAW LIMESTONE
OENTON SHALEFORT WORTH LIMESTONE
DUCK CREEK SHALEDUCK CREEK LIMESTONE
KIAMICHI SHALEGOOOLANO LIMESTONE
PALUXY Fm
UPPER GLEN ROSE
Fm
MASSIVE ANHYDRITE* " RodMM M*mtar
^ Pm Hlond Shott MiiiiDii
y Ptn«l Bi^o) MOTiBjt
TRAVIS PEAK (HOSSTON)
Fm
SCHULER
OSSIER Fm
GILWER LIMESTONE COTTON VALLEY LIMESTONE)
SMACKOVER fm
NORPHLET Fm
LOUANN SALT
WERNCR F">
EAGLE MILLS Fm
OUACHITA
Figure 2. Chart showing stratigraphic section, Mesozoic and Cenozoic strata, East Texas basin (modified from Nichols and others, 1968; Kreitler and others, 1980) (from McGowen and Lopez, 1983).

34*
N
AP
PR
AIS
AL
AR
EA
32*N 30
*N
96*W
96*
W94
* W
92
' W
Th
rust
fa
ult
n
Nor
mal
fa
ult
/
Hin
ge
line
I U
pdip
lim
it
of
Loua
nn
Sal
t
Figure 3. Map of
eastern Texas, southern Arkansas an
d western Louisiana
showing major structural fe
atur
es,
updip li
mit
of Louann Salt,
and
oil
and
gas
resource appraisal area (modified from Ja
ckso
n, 19
82).

(fig. 4). These basement rocks represent a crustal transition to thick granitic-type basement rocks under the emergent margins and the remaining parts of the continental shelves (Hales and others, 1970; Worzel and Watkins, 1973; Martin and Case, 1975).
During the early stage of continental separation in the Triassic Period, complex systems of rift basins or rhomb grabens were formed on thinned continental crust in south Texas, east Texas, north Louisiana, central Mississippi-southwest Alabama, and the Florida Panhandle. These rift basins developed into the Rio Grande embayment, East Texas basin, north Louisiana basin, Mississippi interior basin, and the Apalachicola embayment, respectively (fig. 1). Structurally positive elements, which separate the rift basins, are the San Marcos arch, the Sabine arch, the Monroe arch, and the northeast extension of the Wiggins arch (Martin, 1984). The Sabine arch has formed the eastern boundary of the East Texas basin since at least the Early Jurassic Period (Granata, 1962; Halbouty and Halbouty, 1982, Rodgers, 1984). Granata (1962) suggests that the Sabine arch has remained a relatively stable platform surrounded by subsiding basins.
Major fault systems bound the northern rim of the basin and the initial movement of these faults probably represents gravity sliding of the Louann Salt toward the basin (Bishop, 1973). These fault systems, shown in Figure 1, are the Mexia-Talco, south Arkansas, and Pickens-Gilbertown-Pollard fault systems (Murray, 1961). These fault systems are the updip limits of thick Louann Salt deposits; a relatively thin section of Louann Salt-Late Jurassic sedimentary rocks extends landward of the fault systems. The Mexia-Talco fault system forms the northern and western boundaries of the East Texas basin. Movement along the Mexia-Talco fault system started in Late Triassic or Early Jurassic Period and continued sporadically through the Eocene Series (Jackson, 1982).
The Angelina-Caldwell flexure (fig. 3) separates the East Texas basin from the Tertiary depocenters of the Gulf basin. The Elkhart and Mount Enterprise fault systems, situated to the north of the Angelina-Caldwell flexure, have had significant effects on the development of the East Texas basin. The Mount Enterprise fault zone, a series of normal faults, overlies a series of Louann Salt pillows, and may be genetically related to them. Movement on the fault zone started in Late Jurassic Period and ended during the Tertiary Period (Jackson, 1982). The Elkhart fault zone is composed of normal faults with downthrown sides to the north. The Elkhart fault zone may have resulted from basinal subsidence to the north and subsequent northward movement of the sediments over the Louann Salt (Rodgers, 1984; Jackson, 1982).
On a regional basis, the continental margin of the northern Gulf basin is a relatively stable area in which Mesozoic and Cenozoic strata have been deformed by uplift, folding, and faulting associated with plastic flowage of Jurassic salt deposits (Martin, 1984) and tilting gulfward (fig. 4). Since late Mesozoic, the tectonic nature of the northern interior rim of the Gulf basin has been influenced significantly by regional subsidence. Local structural deformation of Mesozoic-Cenozoic strata has resulted mainly from sediment loading on Louann Salt and gravity failure. As Mesozoic and Cenozoic sediment loading intensified within the rift basins, flowage of Louann Salt deposits resulted in widespread fields of salt domes and diapir fields (Halbouty, 1979). These diapiric structures form an inner belt, consisting of east Texas, southern Arkansas, northern Louisiana, central Mississippi, and southwestern Alabama (fig. 1), across the northern rim of the Gulf basin.
The East Texas basin contains 18 salt domes, 12 large salt pillows (a number of smaller salt pillows are also present, particularly in the southeast

00
Figure 4. Generalized cross
section
of no
rthe
rn Gu
lf of Mexico m
argin
modified from Le
hner
, 1969,
Dorman et al., 1972
, Antoine
et al
., 19
74,
Martin and
Case
, 1975 (from Martin,
1978).

part of the basin), and at least 16 turtle structure anticlines (fig. 5). Jackson and Seni (1984) have defined salt diapirs, or domes, as consisting of a core of intrusive salt surrounded in most instances by an aureole of domed sediments (fig. 6). Salt pillows are broad, plano-convex domes of salt that represent a less mature, more primitive stage of salt dome growth. Turtle structures have a generally planar base and an archlike crest (that is, laccolith shaped) and are caused by the drape of clastic sedimentary rocks over a salt core. Diapiric salt structures in the East Texas basin can be divided into three groups, based upon the geologic time that salt pierced the overlying strata (Jackson and Seni, 1984). The oldest group of diapirs pierced Early Cretaceous horizons as a result of differential loading by deltas of the Shuler Formation and Hosston Formation. The second group became diapiric in mid-Cretaceous during maximum sedimentation in the center of the basin; as sediment loading continued, salt movement gradually migrated northward along the basin axis. The youngest group pierced the overburden in Late Cretaceous.
Jackson and Seni (1984) have delineated four salt provinces on the northwest and west sides of the East Texas basin which have had a significant effect on the development of hydrocarbon-trapping structures. These salt provinces are: (a) salt wedges; (b) low-amplitude salt pillows; (c) intermediate-amplitude salt pillows; and, (d) salt diapirs (fig. 7).
STRATIGRAPHY
The nomenclature of stratigraphic units in the East Texas basin has been standardized recently in the Gulf Coast COSUNA (Correlation of Stratigraphic Units of North America) Chart (AAPG, 1988). In this report, the stratigraphic units will be as reported in the literature and used in the NRG (NRG Associates, 1985, The Field/Reservoir Clusters of the United States) data files; the stratigraphic units will be correlated with corresponding units on the Gulf Coast COSUNA Chart when possible. The use of local formation names is advisable because the number of producing formations is so large and the oil and gas fields are so widely distributed over the basin that complete standardization or conversion to equivalent units on the COSUNA Chart is beyond the scope of this report. The stratigraphic chart, shown in Figure 2, was developed by McGowen and Lopez (1983) and it lists many of the formation names used by the petroleum industry and in the NRG data files; references will be made to it throughout this report.
The depositional environments of significant stratigraphic units are discussed in some detail. These discussions are intended to show that depositional environments control or strongly influence which clastic and carbonate rocks serve as petroleum source beds and reservoir rocks. Knowledge of depositional environments is, therefore, necessary to help predict where additional oil and gas fields may be found.
Pre-Triassic geologic history
The region along and to the north of the northern rim of the Gulf basin was a landmass, Llanoria-Appalachia, during Cambrian-Ordovician Periods (fig. 8). The landmass remained passive and carbonate deposition occurred (Rainwater, 1967). He reports that clay and fine-grained sand were derived from Llanoria-Appalachia during the Mississippian Period and more coarser sediments were derived during early Pennsylvanian Period. Sparse records exist of depositional environments during Middle or Late Pennsylvanian and

BED BlVtl
Appraisal area *
COLL*
HURT
DELTA
..X
BO*IE
Nnorms
i i
TITUS
I
FMNKUR
/"""' ~s£*~ ""^L /
f Mitt*' i /& ^J& \!
» » »
r ViCASS
Ci«P <IOK«I* I
. I
m^rn*m \
\
\ X.30km
20 miRDBCRTSOU
/ y -^>*^;
'cr/' r> \ X* S*\ V*^^ »
'"I /vjitx7' -/^ Outer limit of |
\ salt pillowi r* ,
EXPLANATION
9 Salt diopiri
^ Salt pillows
^^ Turtle structures
Figure 5. Kap of east Texas salt-diapir and salt-pillow provinces based on borehole and gravity data. Adapted from Wood, 1981 (modified from Jackson, 1982).
10

Y (SW)
EARL LEE \ \ TURTLE-STRUCTURE
ANTICLINE \ \
C (NW)
EXPLANATION
^1 CAP ROCK
EH ROCK SALT
A FAULT
/ CORRCLATION
L0CATKM OF LIMtS OF SECTION
OrO
4000
2OOO
2SOO
QOOO 3000
I2XXX>3900
f~"*x TURTLE >^?S":j'/ i v ' Akirin nf'.' /'"STRUCTUREVjSr ANTIOJje /ANTKXINE T^ f ' x ' xX ,x
Figure 6. Structural cross sections across the East Texas basin. After Wood and Guevara, 1981 (from Jackson, 1982).
11

EXPLANATION
I
<A oo> 2 <J
1 3
Salt wedge
Low-amplitude salt pillow
Intermediate-amplitude salt pillow
Salt diapir
£_ Fault
Cross-section line
Seismic reflection line
Contours in thousonds af feet on top of Louonn Sail or on top af FYe-Louann basement where salt is absent. Contour interval variable around domes.
0 5
JO
MtSylvan pi Brooks Dome ISSjiJ Dome
Boggy CreekDome Slocu m
_. DomeFleetoDome
IQOOO-
15,000-4000
SOOO Salt wedge
Low-amplitude,/^ 7000 Intermediate-amplitude Salt diapir'
salt pillow
Salt evacuated 1 HPI
Jilflftt*^..^..:.
Salt diapir Intermediate-amplitude salt pillows
Figure 7. Map of structure on top of the Louatm Salt or on top of thepre-Louann surface, showing the four salt provinces in the East Texas basin. Seismic control and line of cross section A-A f (below) are also indicated (from Seni and Jackson, 1984).
12

OJ
TR
IASS
1C.
POST
-OR
OG
ENIC
GR
ABEN
FI
LL
C
LA
STIC
S.
TR
IASS
IC.
DIA
BA
SE
INTR
USI
VE
(PL
UG
S?)
.
PER
MIA
N.
NO
N-M
AR
INE.
PEN
NSY
LVA
NIA
!!.
MA
RIN
E SH
ELF
FAC
IF.S
.
PALE
OZO
IC.
LOW
ER
PEN
N.
1 O
LDER
GF.
OSY
NCL
INA
L SE
DIM
ENTS
O
F M
ARA
ThO
N-O
UA
CHIT
A-A
PFA
LACH
IAN
TC
CtO
MIC
U
LT
. LO
W
C*A
DI
MET
AH
ORP
N1C
S IN
FA
RT.
LOW
ER
FALE
OZO
IC.
MA
INLY
VE
RY
THIC
K
SHEL
F CA
RBO
NA
TES
OF
CAM
BRIA
M-O
RDO
VIC
IAM
A
CE.
(E
U.E
NB
UR
CER
- A
JtBU
OCL
E-BE
EKM
AN
TOW
N).
0
80
160
KM
BOUN
DARY
OF
REGI
ON
6
Figure 8. Pre-Jurassic subcrop
map, western interior Gu
lf coastal plain (f
rom Vernon, 1970)

Permian Periods. However, it appears that substantial erosion took place along the northern rim of the Gulf basin between the Pennsylvanian and Triassic Periods.
Triassic Period
Eagle Mills Formation. During the Triassic Period, the region that was to become the Gulf of Mexico and its coastal plain was composed of rifted and stretched pseudo-continental crust (Walper and Miller, 1985). The sedimentological history of the East Texas basin since then has been one of seaward progradation, beginning when sand, gravel, and red shale were derived from adjacent uplifted blocks and were deposited as the Eagle Mills Formation on a generally planar surface of Paleozoic and Precambrian sedimentary, igneous, and metamorphic rocks. A continental environment probably prevailed under tropical or subtropical conditions with ample, but unevenly distributed, rainfall (Nichols, 1964). Igneous activity occurred during this period and diabase sills and dikes are known to be present in some of the Triassic grabens along the northern rim of the Gulf basin (Rainwater, 1968).
Jurassic Period
Louann (Louisiana) Group. The first marine incursion during Late Triassic and Early Jurassic Periods came from the Pacific and entered west-central Mexico (Walper and Miller, 1985). By Middle Jurassic Period, the initial transgression of highly saline waters had entered the East Texas basin and evaporite sequences were deposited. The basal unit, the Werner Formation, onlaps Eagle Mills, Paleozoic, or Precambrian rocks and consists of sandstones, shales, conglomerates, and salt.
Marine waters continued to flow into the rift basin and over parts of the low-lying interbasin areas in the partially opened ancestral Gulf of Mexico. Rapid evaporation of highly saline waters under arid conditions precipitated salt from the continuous supply of ocean waters fed through various channels into the subsiding region (Rainwater, 1968). Great thicknesses of Louann Salt were deposited, providing the source layer from which all salt domes in the East Texas basin grew (fig. 5). The original thickness of salt was as much as 5,000 ft (1,524 m) to 7,000 ft (2,134 m) (Jackson and Seni, 1984). Some terrigenous clastic sediments from land areas were deposited contemporaneously with salt precipitation in subsiding areas which were not connected to the sea. These clastic sediments were swept, probably by wind, into the margins of the salt basins. The Louann Salt, consisting of silty, sandy massive halite with interbedded anhydrite, can overlie the Werner Formation, Eagle Mills Formation, Paleozoic or Precambrian rocks (Rainwater, 1968).
Louark Group. A brief regression signified the end of evaporite precipitation. The unconformity at the top of the Louann Salt is considered by Nichols (1964) to represent only marginal uplift and erosion. The beginning of the Upper Jurassic Period is represented by gravel, red beds, sandstones, siltstones, and shales of the Norphlet Formation, with grading from coarse to finer grained sediments in a southward direction toward the ancestral Gulf (The Gulf Coast COSUNA Chart places the Norphlet Formation as the basal unit in Upper Jurassic, whereas many authors list it as the upper unit in Middle Jurassic (fig. 2)). The depositional environments of the Norphlet Formation range from uplands to fluvial-floodplain origins, generally
14

supplied by northern source area (Newkirk, 1971). The gravels onlap former land areas. The sandstones are generally of reservoir quality; however, these strata appear to be too thin and to lack the organic constituents to be petroleum source beds around the periphery of the basin. It is inferred that the area of the Angelina-Caldwell flexure was occupied by a carbonate bank during this regression (Nichols, 1964). The main structural elements affecting Norphlet Formation deposition were the Ouachita foldbelt, Triassic/Jurassic grabens developed on the basinward flank of the foldbelt, and local paleohighs (Ryan and others, 1987).
An influx of marine waters into a widespread, shallow but subsiding, Gulf basin initiated the deposition of marine sedimentary rocks of the Smackover Formation. The Smackover Formation marks the first widespread marine transgression of the northern Gulf Coast overlying the evaporite deposits (Walper and Miller, 1985). However, sands and shales continued to be deposited in some areas and anhydrites accumulated under conditions of restricted sea circulation (Rainwater, 1967). The Smackover Formation was deposited during two separate sedimentological sea-level regimes. The lower Smackover basin was filled with mudstone-rich and matrix-supported carbonates during a rapid transgressive phase. These basinal facies are potential petroleum source rocks of organically rich and clay-rich beds (Presley and Reed, 1984). This transgressive phase grades upward into a sea-level standstill during deposition of the upper Smackover Formation in which a regional shoaling occurred around the western and northern parts of the basin. Non-deposition occurred upslope on the basin margin areas affected by the rapid movement of a high-energy shoreline during transgression (Moore, 1984). Sea-level was maintained, or dropped slightly, for a relatively long period as equilibrium persisted between subsidence and sedimentation. The upper Smackover Formation (fig. 9) along the shoal areas consists of packstones and grainstones (reservoir rocks); dolomite beds are laterally persistent and contain porosity for hydrocarbon reservoirs (Presley and Reed, 1984). Thick deposits of high energy carbonate sands were deposited in some areas. These high energy deposits form a wedge of sediments that thicken basinward and reach the maximum thicknesses along the margin of the salt basin. Incipient basin-margin faulting was initiated by salt movement on the flanks of the basin (Moore, 1984). Beyond the shelf margin, limestones were deposited in basinal environments. These deposits are part of massive limestones facies which are designated as Gilmer-Smackover Undifferentiated (fig. 10) (McGillis, 1984) and the Jurassic Limestones (AAPG, 1988). Toward the end of this transgressive stage, paralic lagoons were formed adjacent to the land area, probably by oolite bars developed along the seaward perimeter of calcarenite facies as water depth and current action were in balance. The present development of porosity in the upper 50 ft-75 ft (15m-23 m) of the Smackover Formation is probably the result of migration of the oolite bars and their redistribution by wave action (Nichols, 1964). The Reynolds Formation and Reynolds Limestone are two exploration targets within the Smackover Formation in northeast Texas (Collins, 1980).
The Buckner Formation (fig. 11) is considered by Presley and Reed (1984) and AAPG (1988) to be the age equivalent of uppermost Smackover Formation on the west side of the basin. The lower part of the Buckner Formation is an evaporitic sequence of nodular and bedded anhydrite, anhydritic mudstone, with mixtures of dolomite, limestone, salt, and terrigenous elastics. The upper Buckner Formation is nodular anhydritic red mudstone, dolomite, limestone, gray mudstone, and lesser amounts of anhydrite (Stewart, 1984). Where the Buckner Anhydrite is present, hydrocarbon production is from the Smackover
15

91
OP H » c(D n nM »- (D » (D CD O
rt O* <D» a GOH. o iD H. ± »- F o
(tt> 3 08 6. a 3* » o a OQ £ rt jtt H« (D CD 3a. OQ Ml Hi J-u^ (t 8 '-' - Ban
n oO T3 M H M O
2m O
OO CO
cH2en
m0r- m
F r- en
MIDDLE JURASSIC
LOUANN GP.
m3)Zm3J
tnO
Z
Zo3
PHLET
c
UPPER JURASSIC (. f
LOUARK GP.
</) 1 o
? 8 0 1 ^3C 1 Z5 1 ni o U, m x z >
o_i c°?22a s m=2 5 3
<:^ Fm
COTTON V. GP.
§\ §8\ 2
1 Vsl \|\ \
< a> o m7i
»IL1LQU

B BOW
IE C
O.-
f C
AS
S C
O.
23
45
6
MA
RIO
N
CO.
78
HA
RR
ISO
N C
O.
10
B'
PA
NO
LA C
O. h
-SH
ELB
Y C
O.
11
12
13
14
TOP
OF
LOW
ER
sGIL
ME
R-S
MA
CK
OV
ER
l "
UN
DIF
FE
RE
NT
IAT
ED
"S
SM
AC
KO
VE
R F
OR
MA
TIO
N =
BO
SS
IER 50
0
FT
KM
20
Figu
re 10. Generalized no
rth-
sout
h cross
sect
ion
of pr
e-Ju
rass
ic and
Jurassic se
quen
ces
in n
orth
east
Te
xas.
Ba
seme
nt structure
inte
rpre
ted
from
well
data
and
seis
mics
(f
rom
McGi
llis
, 19
84).

OKLA HO*A
* 40
Figure 11. Map showing generalized lithologies of the Buckner Formation, northeast Texas (modified from Mitchell-Tapping, 1984).
18

Formation. Where the anhydrite is missing, hydrocarbon production is from the massive Gilmer-Smackover carbonates (Moore, 1984). The Buckner Formation overlies the lower Smackover Formation and underlies the Haynesville Formation or the Gilmer Limestone (Presley and Reed, 1984; AAPG, 1988). Stewart (1984), McGillis (1984), and Hancharik (1984) place the lower and upper Buckner units in the basal part of the Haynesville Formation.
In this report, the Haynesville Formation and the Gilmer Limestone will be considered to be age-equivalent units (AAPG, 1988). The Haynesville Formation was deposited on the Buckner Formation and the Gilmer Limestone was deposited on either the Buckner or Smackover Formation, or Jurassic Limestone, as sea level maintained a slow but steady rise. Faulting and incised subsidence associated with the beginning of salt movement caused a shelf margin and platform to develop around the subsiding basin. On the shelf on the west side of the basin, a carbonate shelf trend (Haynesville Limestone, also called the Cotton Valley Limestone) developed (fig. 12). Collins (1980) depicts the lower Cotton Valley Limestone trend as extending along the western edge of the basin and around the western flank of the Sabine uplift (fig. 13). Landward, to the west, shallow lagoonal facies (reservoir rocks) were deposited that grade into evaporites and terrestrial red beds. In the eastern part of the basin, Haynesville Formation reservoir rocks were deposited in shoaling conditions on the westward, seaward edge of the stable platform and just basinward on incipient salt supported structures (Presley and Reed, 1984) (fig. 12). Basin margin relief resulted in localized carbonate deposition and a Gilmer carbonate barrier was formed (Moore, 1984). The Gilmer Limestone (reservoir rock) becomes quite massive, is oolitic, and comprises a thick carbonate unit along the basin margin. The Gilmer carbonate barriers were maintained and the influx of terrigenous clastic sediments ultimately filled the lagoons with clastic sediments of the upper Haynesville Formation. The upper Haynesville Formation consists of red shales to massive conglomerates and sandstones which were deposited in an elongate depocenter parallel to the Gilmer carbonate shelf-edge barriers as sea level dropped. Basinal Gilmer shales were deposited across the area currently occupied by the Sabine uplift and extend eastward into Louisiana (McGillis, 1984). Clastic sediment influx waned, subsidence increased, and the Gilmer Limestone extended landward as far as the Mexia-Talco fault zone (Moore, 1984).
During the subsequent rise in sea level, dark-colored shales (petroleum source beds) of the Bossier Formation, were deposited in deep marine environments, onlapped the Jurassic Limestone and the Gilmer Limestone surfaces and extended northward and westward almost to the Mexia-Talco fault zone (Moore, 1984). These shales are the lower unit of the Bossier Formation and are recognized as the boundary between Jurassic and Lower Cretaceous sedimentary units by AAPG (1988).
Cotton Valley Group. A major shift occurred from carbonates of the Haynesville Formation to clastic sedimentation of the Bossier Formation as sand, shale, and gravel were derived from uplifted lands bordering the basin to the north. The climate became more humid and streams became the major agent of transport, rather than wind (Rainwater, 1967). Salt movement became more intensive and was triggered by the uneven loading of fluvial-deltaic sediments, beginning with the Cotton Valley Group and continuing into deposition of the Bosston Formation. The locations of the active salt masses were controlled by the Smackover-Gilmer carbonate platform. This platform caused fan-delta sediments of the Cotton Valley Group to spread laterally across the shelf rather than stacking vertically. Sediment depocenters were
19

1W.
SA
BlN
b
' 'I -
1 i
1 PLA
TFO
RM
L-T
Lag
oon
rbeu
n
A D
C &
I
i
. ,
/ /^.-WESTERN SHELF
Figu
re 12. Map showing
Haynesvill
e Formation
paleogeography,
facies,
and
locations
of se
lect
ed oi
l an
d ga
s fi
elds
pr
oduc
ing
from H
ayne
svil
le Formation
reservoirs,
East Te
xas
basin
(fro
m Pr
esle
y an
d Re
ed,
198A).

PR
OD
UC
TIO
NC
ITY
o
f D
AL
LA
S
AR
K-L
A-T
EX
AR
EA
DIS
TR
IBU
TIO
Nof
fCOTTON VALLEY
RESERVOIRS
Figure 13. Map showing
general
dist
ribu
tion
of fa
cies
an
d lo
cati
ons
of se
lect
ed oil
and
gas
fiel
ds producing
from Co
tton
Va
lley
Group
rese
rvoi
rs,
East
Te
xas
basin
(fro
m Co
llin
s, 19
80)

formed basinward of the platform (where the basin subsided the fastest), resulting in the migration of the underlying salt into ridges that fronted the prograded sediment wedge. As salt was depleted from these depocenters, subsidence slowed until sedimentation exceeded subsidence, the fan deltas overrode the salt ridges and sedimentation gradually prograded southward (McGowen and Harris, 1984). The upper unit of the Bossier Formation consists of interfingering sandstones (reservoir rocks), siltstones, and shales, with minor amounts of limestone in a basinward direction (Stewart, 1984; Presley and Reed, 1984). In the central and southern part of the basin, marine shales and limestones of the upper Bossier Formation grade northward into the Cotton Valley Sandstone. The Cotton Valley Sandstone (reservoir rocks) was deposited in deltaic and shoreline systems as broadly regressive sequences (Presley and Reed, 1984). Over the Sabine uplift, the Cotton Valley Sandstone is a thick unit with generally low porosity and permeability (fig. 14). The sandstones are interbedded with black shales which may serve by themselves or with Bossier shales, as petroleum source beds. The Taylor Sandstone is a frequent exploration target in the lower part of the Cotton Valley Sandstone sequences in the eastern part of the basin (Presley and Reed, 1984).
The Shuler Formation and its time equivalent deposits are composed of sandstones, siltstones, and shales deposited in terrigenous, deltaic, and nearshore marine environments (Dickinson, 1969). Deposits of the Schuler Formation unconformably overlie the Haynesville and underlie the Hosston Formation. The Schuler Formation grades laterally into the Bossier Formation or Cotton Valley Sandstone.
The seas advanced over large parts of the basin and the Knowles Limestone was deposited. The Knowles Limestone is present from southern Arkansas-northern Louisiana area, around the Sabine uplift, and to the southwestern edge of the East Texas basin. The Knowles Limestone is the upper part of Cotton Valley Group. It conformably overlies the Bossier Formation and Cotton Valley or age-equivalent deposits and it unconformably underlies the Hosston Formation (AAPG, 1988). The Knowles Limestone consists of arenaceous shales, dolomitic limestones, grainy limestones, and algal boundstones with stromatoporoids and corals (Cregg and Ahr, 1983). The boundstones represent elongate, wave resistant, encrusted skeletal patch reefs which may have developed on subtle salt-generated topographic features. The sedimentary sequences and depositional environments appear to range from a marine lagoonal limestone and shale formed behind the western extent of a sand barrier island in north Louisiana to a more open marine limestone on the western extent of a sand barrier island in north Louisiana to a more open marine limestone on the western flank of the East Texas basin. Cregg and Ahr (1983) report that reef core boundstones and reef talus were consistently present downdip, and lagoonal to tidal flat facies were common updip throughout Knowles deposition. The reef organisms eventually became overwhelmed with terrigenous sediments transported downdip as the tidal flat environment prograded over the lagoonal, reef talus and reef core facies at the end of Knowles deposition. The tidal flat and lagoonal facies have local porous zones which were created by early dolomitization and which serve as reservoir rocks. The reefs are cemented by sparry calcite and are not generally considered to be potential reservoir facies.
Cretaceous Period
Coahuilan Series. As the East Texas basin was downwarped, silicate clastic sediments from the uplifted Ouachita tectonic belt to the north were
22


deposited in alluvial plain, delta plain, transitional (beach-nearshore) and marine (shallow, open-shelf and deep open-shelf) environments (Bushaw, 1968) as the Hosston Formation/Travis Peak Formation (figs. 15, 16, 17, 18). Basinward, progradation of the deltaic systems produced younger depocenters toward the interior of the basin. Salt migration and the differentat ion of salt ridges continued, producing the present complex array of salt domes and anticlines (MeGowen and Harris, 1984). Subsidence of the coastal plain and the marine areas to the south was rapid, but sedimentation kept pace. On the landward side of the basin, the Hosston (Travis Peak) Formation consists, from north to south, of cherty conglomerates (reservoir rocks)-red beds on the alluvial plain, red beds and sandstones (reservoir rocks) on the delta plain, sandstones (reservoir rocks) and shale in the beach-nearshore environments (Bushaw, 1968). The Pittsburg Formation is a hydrocarbon-bearing wedge of sandstone that is transitional to the upper Hosston Formation and the lower Pettet Formation in the central part of the basin (Galloway and others, 1983). Basinward, the Hosston (Travis Peak) Formation grades into interbedded shales and carbonates (some of which are reservoir rocks). Basin subsidence continued, the supply of land-derived sediments diminished, the shoreline advanced, resulting in facies of the Pettet Formation (Sligo Formation) grading into the Hosston Formation. Calcarenites, lime muds, limestone reefs, and shell mounds of the Pettet Formation were deposited during periods of low sediment influx from land (Bushaw, 1968).
Figure 19 is a structure map on the top of the Pettet Formation and the top of the Hosston Formation, which shows the configuration of the northwestern part of the East Texas basin. Figure A-l is a generalized stratigraphic chart showing regional correlations of Coahuilan and Comanchean Series strata across the southern United States (Forgotson, 1956).
Trinity Group. During this period, the bordering uplands were slightly uplifted (Rainwater, 1970) and the Pine Island Shale was spread periodically and widely over the carbonates of northeast Texas (fig. 20). Then, as sea level transgressed and regressed slightly, interbedded shales and continental shelf limestones of the James Formation were accumulated in shallow neritic and continental shelf depositional environments, respectively, on the south-southeast side of the basin (figs. 21, 22) (Bushaw, 1968; Rainwater, 1970). On the north-northwest side of the basin, alluvial plain (cherty conglomerates-red beds), delta plain (red beds and sandstones), and transitional sediments (sandstones, skeletal limestones and oolitic limestones) were deposited, grading south-southeastward into deep open-shelf sediments (limestones and shales). Sandstones and limestones in beach-nearshore and shallow open-shelf depositional environments are reservoir quality deposits (Bushaw, 1968).
During deposition of the Bexar Formation, eustatic sea-level was nearly stationary and depositional environments and their associated facies began to regress. Alluvial plain and delta plain deposits of cherty conglomerates, red beds, and sandstones characterize the northwest parts of the basin. Southeastward, sedimentary rocks of reservoir quality sandstones, oolitic limestones and skeletal limestones, were deposited in beach-nearshore and shallow open-shelf environments (fig. 23). The south-southeast part of the basin is covered by basinal shales and limestones deposited in deep open shelf and deep basin environments (Bushaw, 1968).
As the uplands to the west, north, and east, were uplifted, influxes of sand and clay exceeded subsidence and depocenters of the Rodessa Formation covered the basin (fig. 24). Maximum deposition occurred during regressive
24

NORTHEAST TEXAS
NORTHEAST TEXAS OUTCROP EAST TEXAS BASIN
O-i
1000-
2000-
3000-
4000-
5000-
6000-
I CONGLOMERATE
SANDSTONE
TI_] SHALE
_T1_1 MARL
LIMESTONE
ANHYDRITE
COHON VALLEY GROUP
Figure 15. Generalized columnar sections of Lower Cretaceous sediments, northeast Texas (from Rainwater, 1970).
25

OKLAHOMA
*'1-^-, .- /!
T.4,
MARJNE ___..OPEN SK _erbedcffed-silts 8 micrite
Figure 16. ^Map showing depositional environments, facies, and locations of selected oil and gas fields producing from early Hosston-Pettet Formation reservoirs, East Texas basin (from Bushaw, 1968).
26
I A H 0 N A
/jCON'TItfjE 0 20 CEROSI0N)
MILESWILES L /
APPRAISAL/
AREA/]
Figure 17. Map showing depositional environments, facies, and locations of selected oil and gas fields producing from middle Hosston-Pettet Formation reservoirs, East Texas basin (from Bushaw, 1968).
27

0 R L A 0 N A
(JDELT A/PLAIN)APPRAISAL AREA
0 20
^ 9!
Figure 18. Map showing depositional environments, facies, and locations of selected oil and gas fields producing from late Hosston-Pettet Formation reservoirs, East Texas basin (from Bushaw, 1968).
28

-IExplanation
HUNT
u
Sail dome
Fault
* 5K»---Top of Hosston
V*~ -6200 ^Top of Pettet
Well sample
*Contours by O.W. Mams, CMeyers, / * t ' O.TS.mmon, ' , //
/ /APPRAISAL AREA 9-»»
ROCKWALL
i
- 4KAUFMAN /
-N-
Figure 19^. Structure map of the top of the Pettet Formation and the top of the Hosston Formation (Hunt County only), northeast Texas (from McGowen and Harris, 1984).
29

VALAnVNA
APPRAISAL AREA
CONTINENTAL(EROSION)
MARINEOPEN
Shale - MicHJ-6SHELF)
Figure 20. Map showing depositional environments, facies, and locations of selected oil and gas fields producing from middle Pine Island Formation reservoirs, East Texas basin (from Bushaw, 1968).
30

OKLAHOMA
APPRAISAL AREA
Figure 21. ^Map showing depositional environments, facies, and location of a gas field producing from early James Formation reservoir, East Texas basin (from Bushaw, 1968).
31

OKLAHOMA
? A
(DELTA PLAIN)APPRAISAL AREA
0 20
OPEN SHELF)
(BASIN) Micrite
Figure 22. Map showing depositional environments, facies, and selected oil and gas fields producing from late James Formation reservoirs, East Texas basin (from Bushaw, 1968).
32

0 « I - A U D N A
! A
(DELTA'PLAIN)
APPRAISAL AREA
Figure 23. Map showing depositional environments, facies, and selected oil and gas fields producing from middle Bexar Formation reservoirs, East Texas basin (from Bushaw, 1968).
33

A H 0 M A
j^fcsfc
Mierite
Figure 24. Map showing depositional environments, facies, and selected oil and gas fields producing from middle Rodessa Formation reservoirs, East Texas basin (from Bushaw, 1968).
34

periods when sediment influx exceeded subsidence. Sandstones were formed on deltas and delta flanks; organically rich lagoonal, tidal-flat clays and restricted shallow nearshore-marine lime muds were deposited adjacent to and over the sandstones. In carbonate subenvironments around the basin and farther seaward, calcarenites, dolomites, limestone reefs, and shell mounds were deposited. During intervals of regression, clay and silt spread widely over the province, smothering the carbonate deposits (Rainwater, 1970). Reservoir quality strata of sandstones, skeletal and oolitic limestones, and local coral patch reefs were deposited in beach-nearshore, shallow open-shelf and deep open-shelf environments in a northeast-southwest trend across the central part of the basin (Bushaw, 1968). The Bacon Limestone, the uppermost unit of the Rodessa Formation, produces hydrocarbons in the central part of the East Texas basin (Galloway and others, 1983). On the Sabine uplift, the Rodessa deposits are subdivided into, from the oldest to the youngest, the Young, Dees, Mitchell, Gloyd, and Hill Formations (Shreveport Geological Society, 1980). The Gloyd Formation, a limestone, and the Mitchell and Hill Formations, predominantly sandstones but with some porous limestone, produce hydrocarbons. The Hill Formation reservoir rocks are sealed by the Ferry Lake Anhydrite. In the southern part of the basin, the Rodessa Formation is composed of a sequence of fossiliferous, chalky to coarse crystalline limestones which are commonly quite coquinoidal and porous. This reef-like facies extends vertically through the Rodessa Formation, replaces the entire overlying evaporite section of the Ferry Lake Anhydrite, and a large part of the carbonate section in the downdip Rusk Formation.
When a barrier (possibly formed by a deeply buried limestone reef) restricted ocean circulation and the influx terrigenous sediments waned, the Ferry Lake Anhydrite was deposited in a broad belt across the East Texas basin (fig. 25). Unequal subsidence of the evaporitic areas created slight topographic irregularities. Anhydrite was formed in the protected and more depressed areas; dolomite was deposited on positive areas in the intertidal zones. The sites of carbonate and evaporite deposition shifted constantly as the restricted shallow sea levels varied (Rainwater, 1970). This interval closed with the deposition of a massive layer, the Ferry Lake Anhydrite. Around the perimeter of the embayment, a relatively rapid subsiding shelf developed on which interbedded shallow-marine shale, argillaceous limestone, and thin strandline sandstones were deposited. Segments of the Ferry Lake Anhydrite reef continued to grow during deposition of the Rusk Formation, with organically rich clay (petroleum source beds) being deposited adjacent to the reef and, during more regressive periods, covered the reefal areas (Rainwater, 1970). Reservoir quality rocks are high grain skeletal limestones deposited in shallow open-shelf environments during middle Ferry Lake in the southwest part of the basin (Bushaw, 1968).
The Rusk Formation/Glen Rose Formation of East Texas reflects a major withdrawal of the seas which reached a regressive climax during deposition of the overlying Paluxy Formation (Nichols, 1964). Moderate to strong positive growth occurred on all structural features in the basin during deposition of the Rusk Formation. The Mexia/Talco fault system experienced general movement and probable movement occurred on the eastern part of the Mt. Enterprise fault zone. The axis of the Sabine uplift shifted about 30 mi (48 km) to the west, accompanied by a definite eastward tilting. Typically, the basinal facies of the Rusk Formation consists of a basal anhydrite member which was deposited in a mildly regressive environment. This anhydrite member does not completely lose its identity in the updip sandstone facies to the north. In the upper part of the Rusk Formation, the basinal facies are limestones (reservoir
35

0 I I * H 0 II »
(IELTA PLAIN)
APPRAISAL AREA
"^<w>\ Jt . f /irfcSfo
Figure 25. Map showing depositional environments, facies, and selected oil and gas fields producing from middle Ferry Lake Anhydrite, East Texas basin
(from Bushaw, 1968).
36

rocks) which grade northward into updip sandstone facies and which were deposited in a moderately transgressive cycle. The updip sandstone facies across the Sabine uplift mark the southernmost extension of the near-shore environment centered around north Louisiana. The depositional environment during the latter part of Rusk Formation was marked by a moderately regressive stage of deposition (Eaton, 1956). The Rusk/Glen Rose Formation in East Texas is composed of interbedded shales and limestones (reservoir rocks) deposited in shallow marine environments, and some thin strandline sandstones. The shelf subsided relatively rapidly where sedimentation was equal to subsidence (Rainwater, 1970).
The close of Trinity division of Lower Cretaceous in northeast Texas was marked by a regional tilting of the area which started during deposition of the upper part of the underlying Rusk Formation. The highlands to the north were rejuvenated and a major regression of the sea occurred. Sands and clays were transported to marginal marine and oxidizing coastal plain environments and deposited as the Paluxy Formation (figs. 26, 27) (Caughey, 1977). Large deltas prograded long distances into shallow seas and organically rich petroleum source beds were deposited adjacent to porous deltaic sandstones (reservoir rocks). As the deltas prograded southward, sandstone and shale facies grade seaward into interbedded shales and carbonates over a large part of the East Texas basin (Rainwater, 1970). These sandstones are excellent reservoir rocks in a number of fields (fig. 28) (Eaton, 1956; Caughey, 1977). The southern boundary of the Paluxy Formation is transitional with shale and limestone grading into marl and limestone of the Walnut Formation (fig. A-2). On the north and west sides of the basin, the Paluxy Formation grades into undifferentiated sandstones and shales of the Antlers Formation (Caughey, 1977).
Fredericksburg Group. Following deposition of the Paluxy Formation, the seas advanced over northeast Texas and the Goodland Formation (fig. A-2) was deposited in a shallow-marine environment during a period of little sediment influx. The lowermost Goodland Limestone sequence exhibits an extensive porous facies in the extreme northeast corner of the basin (Eaton, 1956). A porous zone in a Fredericksburg limestone is productive on the Sabine uplift in east Texas and this sequence may be age-equivalent to the Goodland Limestone. Then, Kiamichi Shale, consisting of fine grained terrigenous sediments, was spread widely over the basin in shallow seas (Rainwater, 1970).
Washita Group. During deposition of the Washita Group, shallow-marine seas covered the East Texas basin and a carbonate depositional environment prevailed over the area of the Angelina-Caldwell flexure. During periods of little or no sediment influx, limestones were deposited on the shelf at the north end of the basin and in deeper waters to the south. These carbonate formations are, from the oldest to the youngest, the Duck Creek Limestone, Fort Worth Limestone, Weno-Paw Paw Limestone, Main Street Limestone, and Buda Limestone (fig. 2). In the intervening periods, fine-grained terrigenous sediments were spread widely over the basin as the Duck Creek Shale, the Denton Shale, the Grayson Shale, and the Maness Shale (Rainwater, 1970). The interval from the Duck Creek Limestone through the Main Street Limestone is considered to be equivalent to or part of the Georgetown Formation (fig. 2). The uppermost sequence of the Washita Group is the Maness Shale which is restricted to the subsurface. The Washita sequence demonstrates porous facies in the lowermost beds in the extreme southern portion of the basin (Eaton, 1956). Figure 29 is a map of northeast Texas showing the major
37

;oOKLAHOMA
''
tARRANffo ^Tr
Figure 26. Map showing distribution and facies of Paluxy Formation and related stratigraphic units, northeast Texas (from Caughey, 1977).
38

IOQ ' Sandstone isolith contour (contour interval 50 feet)
Figure 27. Map showing sandstone isolith of the Paluxy and upper part of the Antlers Formations, northeast Texas (from Caughey, 1977).
39
10 a '0 2O 3O 4Q 50 60 7Q MILES
X3 Q iQ 20 3O 40 50 5O 7Q 8Q 9Q KILOMETERS
MILES
index map
GROUND WATER
Distribution of Fresh to Siigntiy Saline Water
Water Analysis
OIL AND GAS
C«*o Faluxy FieSd
D Major Producing Area
OUTCROP
[ I Antlers i ^i Formation
E Paluxy Formation
Figure 28. Map showing ground water, oil and gas resources of the Paluxy Formation, northeast Texas. Limit of fresh to slightly saline water (modified from Baker, 1963, Peckham and others, 1963, and Thompson, 1967), (from Caughey, 1977).
40

OKLAHOMA
APPRAISAL AREA
CONTOUR INTERVAL 1000 METERS
FAULTS
0 1234567 Smiles
Q j 2 3 4 5 6 7 8 9 IP kilometersN
Figure 29. Contour map showing major structural features on the top of Georgetown Formation, northeast Texas (modified from Sellards and Hendricks, 1946) (after Caughey, 1977).
41

structural features as depicted by structure contours on top of the Georgetown Formation and Ellenburger Group (Caughey, 1977).
Woodbine Group. A shallow epicontinental sea advanced farthest inland during this time than any of the Early Cretaceous seas. At the beginning of this major transgression, terrigenous clastic rocks were derived largely from Paleozoic and mildly metamorphosed sedimentary rocks exposed in the Ouachita Mountains of southern Oklahoma and Arkansas. These sediments were transported southward and deposited as large deltas in a subsiding East Texas basin for a short period of time (Rainwater, 1968). Complex nearshore environments developed along the margins of the broadly subsiding basin in northeast Texas. Four principal depositional environments occurred: a fluvial system (the Dexter fluvial system); a highly destructive delta system (the Freestone delta system); a prodelta-shelf system (the Pepper member); and, a strandplain-embayment (the Lewisville system) (fig. 30); (Oliver, 1971; Foss, 1979; Hobday and Perkins, 1980). Massive sandstone and gravel deposits of the Dexter Member prevail in the north and northeast part of the basin. To the south and southwest, the Freestone delta system is represented by sandstones and shales in the progradational distributary-mouth bar facies. The Woodbine Formation is predominantly non-marine in the northern and central part of the basin, becoming more marine downdip to the south, and completely marine to the southwest. Prodelta mud facies of the Pepper member cover the deeper parts of the basin (Oliver, 1970). The Lewisville Formation is the youngest of the four genetic systems in the East Texas basin recognized by Oliver (1971). The broad Lewisville embayment developed in northeast Texas as a result of reduced influx of clastic sediments, but some reservoir-quality sandstones are present. Strike-oriented strandplain sandstones are separated by finer grained shelf and backbarrier sediments (Hobday and Perkins, 1980).
A major rise of the Sabine uplift occurred after deposition of the Buda Limestone and before the Woodbine Group was deposited. As a result of this uplift, severe erosion of Early Cretaceous strata occurred and the Woodbine Group was deposited on the eroded surface and over the present crestal and flank areas of the Sabine uplift (Halbouty and Halbouty, 1982). High-quality reservoir rocks in the Woodbine Group and the time-equivalent Tuscaloosa Group are widely distributed over the East Texas basin, south of the Lower Cretaceous Shelf Margin and across eastern Louisiana-southwestern Mississippi (fig. 31) (Smith, 1985). In the East Texas basin, the reservoir rocks are sandstones, which are most frequently identified as the Woodbine Formation or Woodbine Sandstone. Some reservoir rocks are called Dexter Formation (or Sandstone), or Lewisville Formation (or Sandstone). The thicknesses of the Woodbine Group suggests rapid deposition within an active basin, continuous movement of the Mexia/Talco fault system, and growth on all major structures. Thickening of the Woodbine Group intervals in peripheral synclines suggests movement of salt masses (Eaton, 1956).
Eagle Ford Group. Toward the end of deposition of the Lewisville Formation, northeast Texas was subjected to a third period of major uplift. The Sabine uplift began to rise, or to subside less rapidly than the East Texas basin, causing a shift in its structural axis westward during deposition of Eagle Ford sediments. A flood of recycled, coarse grained Woodbine sediments were eroded and were incorporated into a giant seaward (southwesterly) prograding delta system, the Harris delta system, that developed on the west flank of the uplift. The resulting depositional unit, the Harris Formation, progrades from sandstone and shale sequences of a
42

34°-
33°-
32°-
Woodbine outcrop ^>>::>::>>>>>>>::>:::::
Depositional Systems'
Dexter fluvial
Ipllll Freestone deltaic
E::-;-;-3 Pepper prodelta-shelf
S52: Lewisville strandplain-embaymenti 96° 95" i 94"
Figure 30. Paleogeographical map of northeast Texas showing the Woodbine Formation depositional systems, northeast Texas. Time- equivalent, prodeltaic-shelf deposits of the Pepper member ac cumulated further downdip to the south. Modified from Oliver, 1971 (from Hobday and Perkins, 1980).
43

ARKANSAS
Eagle Ford Volcanism
GULF OF MEXICO
GEORGIA
ALABAMA
MISSISSIPPI
Updip limit of Tuscaloosa
-Tuscaloosa. Outcrop
m
% 7 ** i Shallow ^Tuscaloosa «
FLORIDA
Area of above map
°e// £.
n Miles & 9 100I h " I 1 ~0 200
Kilometers
Tuscaloosa and Woodbine Fields
Figure 31. Regional index map showing locations of oil and gas fields producing from shallow and deep Woodbine Formation and shallow and deep Tuscaloosa Formation strata, Gulf Coastal Plain (from Smith, 1985).
44

braided-distributary-channel network with marsh areas on the north end to a marine environment in the southwest. Deltaic sandstones rest on previously deposited inner neritic Woodbine Formation sandstones and clays (Nichols, 1964). The marine areas of the delta are represented by sandstones (reservoir rocks, which may be designated as Eagle Ford Undifferentiated) and shales influenced by good water circulation conditions, and includes turbiditic sandstones (reservoir rocks) to the southwest (Turner and Conger, 1981).
In the southwestern corner of the appraisal area, lenticular sandstones that represent shelf deposits of the Harris delta system are productive in stratigraphic traps. Berg and Leethman (1985) have noted that these stratigraphic traps (fig. 32) apparently are not detectable on conventional seismic profiles (fig. 33).
The East Texas basin continued to subside, but sediment influx was greatly reduced (Oliver, 1970). A regional transgression of the sea inundated all of the basin, except over part of the Sabine uplift, and strata of the Coker and Sub-Clarksvilie Formations were deposited. The Sub-Clarksville Formation was deposited in a shallow-water environment, with currents of decreasing energy levels and the sediments were then distributed by storm-generated bottom currents (Barton, 1982). Sandstone reservoir rocks are present in the Coker (and its age equivalent, the Blaloek Formation) and Sub-Clarksville Formations.
Austin Group. The eastern half of northeast Texas was emergent briefly before deposition of the Austin Group (fig. 34) (Nichols, 1964). Then, widespread inundation advanced the seas northeastward, onlapping the Monroe uplift and the south Arkansas highland complex. Sediments were transported into this sea from northeastern source areas (fig. 35). Deposition of marine sediments in the Austin Group was accompanied by structural movement within the basin. Movement of the Sabine uplift was moderate, and relatively small amounts of movement apparently occurred along the Mexia/Talco and Mt. Enterprise fault systems. The basal unit of the Austin Group is the Ector Chalk Member which is a limestone tongue in the deeper parts of the East Texas basin (fig. 2). Austin Chalk overlies the Ector Chalk Member and it was formed on a gently sloping, stable ramp tilted toward the Gulf of Mexico (Grabowski, 1981). The Austin Chalk thickens basinward and unconformably overlies strata of the Woodbine Group and the Eagle Ford Group around the perimeter of the basin (fig. 6). The middle of the Austin Group contains terrigenous clastic sediments in medial portion of the basin. This section ranges upward from the Bonham Clay, Blossom Sand and to the Brownstown Formation. McGowen and Lopez (1983) correlate the Tokio Formation, which is present on the east side of the basin, with the Austin Group sequences from the base of the Austin Chalk member to the top of the Brownstown Formation (fig. 2). The uppermost units of the Austin Group are a strata of chalk that are identified as the Gober Chalk in the western part of the basin and as the Ozan Chalk on the east side of the basin (Guevara and Giles, 1979). McGowen and Lopez (1983) place the Ozan Chalk in the lowermost part of the Taylor Group. Reservoir quality strata in the Austin Group are fracture porosities in chalk strata and isolated sandstones of the Blossom/Tokio Formation in the Sabine uplift area (Eaton, 1956).
Taylor Group. The basal unit of the Taylor Group in the western part of the basin is the Lower Taylor Formation (fig. 2), a considerable thickness of clay. The Lower Taylor Formation is overlain by the Wolfe City Sandstone which is calcareous and serves as a reservoir rock in spite of its somewhat
45

Figu
re
32. Map showing
total
thickness
of sandstone
in th
e Woodbine-Eagle Fo
rd
Formations,
east Te
xas.
Th
icke
r sandstones
east
of
Kurten field
(coarse
dots)
have
been ca
lled
th
e Ha
rris
de
lta
(Nichols,
1964
).
Areas
of oi
l producti
on (f
ine
dots
) are
largely
from
lenticular sand
ston
es th
at represent
shelf
depo
sits
. Ma
p ad
apte
d fr
om Turner and
Conger,
1981
(f
rom
Berg
an
d Le
ethm
an,
1985
).
Figure
33. Seismic pr
ofil
e ac
ross
th
e so
uth
part
of
Ku
rten
fi
eld,
Brazos
Coun
ty,
and
acro
ss lo
la,
Hill
an
d Ma
rtin
s Pr
airi
e fi
elds
, Gr
imes
Co
unty
, Te
xas.
Up
lift
of
th
is sa
lt mass caused er
osio
n at
the
top
of th
e Woodbine-Eagle Ford
interval on
the
sout
heas
t ma
rgin
of
Kurten field
(fro
m Berg and
Leet
hman
, 1985).

Figure 34. Paleogeographical map showing east Texas prior to deposition of the Austin Group (from Nichols, 1964).
Figure 35. Map showing depositional environments and lithofacies of Austin Chalk, East Texas basin (from Nichols, 1964).
47

erratic characteristics (Sellards and others, 1932; Eaton, 1956). The Pecan Gap Chalk overlies the Wolfe City Sandstone unconformably and underlies the Marlbrook Marl, the youngest Taylor Group strata of the basin. Sandstones within the upper Taylor unit are reservoir rocks in the Mexia/Talco fault ,system area. The Ozan Formation, on the east side of the basin, is the approximate time-equivalent strata to the Lower Taylor Marl Member. This sequence is overlain by the Annona Chalk/Pecan Gap Formations. The Marlbrook Marl is also the youngest Taylor Group strata on the east side of the basin (AAPG, 1988).
Navarro Group. The Navarro Group in the subsurface of the East Texas basin is divided, from the oldest to the youngest, into Neylandville Marl, Nacatoch Formation, and Kemp Clay (AAPG, 1988). These stratigraphic units are equivalent to the Lower Navarro Clay, Nacatoch Formation, Upper Navarro Marl, and Upper Navarro Clay of Guevara and Giles (1979). The Nacatoch Formation consists of sandstones and mudstones derived largely from source areas to the northwest, north, and northeast of the East Texas basin (fig. 36) (McGowen and Lopez, 1983). The sediments were delivered to the basin by a major dispersal system originating in southeastern Oklahoma and southwestern Arkansas and the thickest intervals of sandstones (reservoir rocks) are predominantly along the northern flank of the basin (fig. 37). The lithologies in the southern part of the basin and over the Sabine uplift are mudstones and thin discontinuous sandstones. The upper Navarro Marl (reservoir rocks, fig. 38), overlying the Nacatoch Formation, ranges in lithology around the basin from mudstones to very fine grained sandstones and siltstones, and to chalk in some areas. Calcareous mudstones are prevalent in the deeper parts of the basin. The widespread occurrence of the Upper Navarro Marl suggests that the sequence was accumulated as transgressive deposits and as subsequent shelf deposits when the influx of terrigenous elastics was sharply reduced following deposition of the Nacatoch Formation. The regional structural dip on the Upper Navarro Marl is east-southeast toward the axis of the East Texas basin (fig. 39) (McGowen and Lopez, 1983). The youngest unit is the Upper Navarro Clay which is unconformably overlain by the Midway Group (Holcomb, 1971). At the close of Cretaceous, deep waters covered the East Texas basin, resulting in deposition of clear-water chalks, marls, and Late Cretaceous reefs (Lofton and Adams, 1971).
Tertiary Period: Paleocene-Eocene Series
Midway Group. A major unconformity separates the close of Upper Cretaceous and the beginning of the Cenozoic Era. The Mid-Continent began to rise in the early stages of the Laramide orogeny, shorelines began to recede, and the environments of the basin changed to shallower water deposits (fig. 40) (Rainwater, 1960). Deposition proceeded under gentle to moderate structural uplift around the basin. Clays and silts were eroded from recently uplifted Cretaceous marine formations and from deeply weathered peneplaned lowlands adjacent to the seas, and were transported into the basin by sluggish river systems. These fine-grained sediments of the basal Midway Group (Kincaid Formation) were spread widely over the basin which dipped gently southward (Rainwater, 1967). This first major regression of the ancestral Gulf of Mexico continued through Paleocene-Eocene, but with some widespread transgressions. The Wills Point Formation (Porter Creek Formation) was deposited over the Kincaid Formation as the uplift of northern and western areas quickened and more and coarser sediments were brought to the basin
48

0 10 20 miI '. '! i"0 O 20 30 km
APPRAISAL AREA
Deltoic 2. Prodelto muddy sand
1 Inner shelf
Outer shelf mudBowie -Cass County net sandhigh, connective seawayNacatoch Formation-outcrop
Tidal-flat deposit
Shoreface deposit 9l Inner shelf - greensond
10. Tidal -inlet deposit
Figure 36. Map showing depositional environments and sediment distribution, Nacatoch Formation, northeast Texas (from McGowen and Lopez, 1983).
49

Figure 37. Map showing net-sand thickness, outcrops, and surface sample locations, Nacatoch Formation, East Texas basin (from McGowen and Lopez, 1983).
50

NACATOCH OUTCROPi I
( 1
Wortham _0Tate
'Wortham N Mexia
9 Mexia S
(yAGroesbedV^Groesbeck.W
\Coit / \
*Harold 0. Orr
A Upper Novarro Marl production
Figure 38. Map showing oil and gas fields producing from Nacatoch Fonration and Upper Navarro Marl, East Texas basin (from McGowen and Lopez, 1983).
51

EXPLANATION
Salt dome Well control
Dotum. Seo level Contour inti
Figure 39. Structure contour map of base of Upper Navarro Marl. LateCretaceous subbasins, defined by Agagu and others, 1980, are included (Kreitler and others, 1980) (from McGowen and Lopez, 1983).
52
Pos
sibl
e fo
rmer
ext
ent
of
earl
y T
ert
iary
dep
osits
Ear
ly T
erti
ary
Sho
relin
e
"^
....%
OV
ft
{»
UW
V -
-
' %»
»>^
~*.
~
, -^
^
<r
..^
Sw
^l-
X-r
' S
HA
LL
OW
S
EA
^T
^tS
^
- . *
^-
_L. '_
_ H
Marl
and
sha
le Z
I ^
-s
.
*^
Pre
sent
lim
its o
f eo
rly
Ter
tiar
y -
<r~
>~xr
-"
Figu
re 40
. Pa
leog
eogr
aphi
cal
map
of th
e Gulf Co
asta
l Plain
at the be
ginn
ing
of
the
Tert
iary
(f
rom
Rain
wate
r, 19
60).

margin. A marked increase in the thickness of strata in the southern part of the basin suggests considerable downwarp (Eaton, 1956). Large segments of the restricted seas were filled and a broad coastal plain was formed for the first time since the early part of Late Cretaceous (Rainwater, 1967). The Gulf Coast COSUNA Chart (AAPG, 1988) also subdivides the Midway Group into the Kincaid and Wills Point Formations, however, McGowen and Lopez (1983) leave the group undifferentiated (fig. 2).
Wilcox Group. During late Paleocene and into early Eocene Series, the uplands to the north and west apparently were uplifted strongly and large volumes of clastic sediment were transported into the basin as the Mt. Pleasant fluvial system of the Wilcox Group (Fisher and McGowen, 1967). The Mt. Pleasant fluvial system extends eastward and southwest from the outcrop along the Mexia-Talco fault system to over the Sabine uplift and southward past the Lower Cretaceous Shelf Margin. The facies of the fluvial system are alternating sandstones, siltstones, and shale which were deposited in alluvial, transitional, and shallow marine environments (fig. 41) (Ricoy and Brown, 1977) . The shoreline moved constantly in response to changes in the rate of subsidence, to the supply of sediment, and to the direction of sediment influx. The Rockdale delta system, located on the south side of the basin, was the ultimate site of most sediments transported through the Mt. Pleasant fluvial system. Down depositional slope and down structural dip from the fluvial system, the Wilcox Group consists of sandstones (reservoir rocks), siltstones and shales (reservoir seals) of delta front and interdeltaic deposits (Fisher and McGowen, 1967).
Claiborne Group. Between deposition of the Wilcox and Claiborne Groups, a regional unconformity occurred, which is recognized across the East Texas basin (AAPG, 1988). Three important marine transgressions took place in the East Texas basin during Eocene when the sediment supply was small and subsidence continued (Rainwater, 1967). Figure A-3 shows the outcrop of the Claiborne Group across the Texas Coastal Plain and Figure A-4 is a diagrammatic cross section of the Claiborne Group in south-central Texas (Davis and Etheridge, 1971). Deposition of the Claiborne Group was initiated by a relatively minor transgression in east Texas during which the Carrizo and Reklaw Formations were deposited. The continent was elevated to the west and northwest of Texas and eroded sediments of sands and shales were deposited as the Queen City Formation. Figure A-5 shows the relationship between the formal stratigraphic nomenclature and facies of the Queen City depositional systems in south Texas, central Texas, east Texas and west Louisiana (Guevara and Garcia, 1972). The Queen City high-constructive delta system (fig. 42) of alternating sandstones (reservoir rocks) and shales (reservoir seals) prevailed in the southern part of the East Texas basin (Hobday and others, 1979). Net sandstone intervals vary from 200 ft to 0 ft on the southern edge of the appraisal area (fig. 43) (Guevara and Garcia, 1972). This regression was followed by invasion of the seas in which the shales of the Weches Formation were deposited. During the remaining period of Claiborne Group deposition, cyclic regressive-transgressive-regressive movements of the seas formed sandstones of the Sparta Formation, shales of the Cook Mountain Formation, and sandstones of the Yegua/Cockfield Formation (Lofton and Adams, 1971) (figs. 6, 41). The Sparta Formation, which outcrops across the southern part of the appraisal area, has been studied by Grossman and others (1986) (fig. 44). Although reservoir quality sandstones are present in a basinward direction, other factors (reservoir seals, source beds, etc.) are detrimental
54

Jockson Depositiono! Systems (Eocene.Texos) YeguaDepositiono! Systems (Eocene.Texos)
Lower WilcoxDepositionol Systems (Eocene.Texos) NW Gulf of Mexico Deoositional Systems! Hoiocene)
Queen City Depositionol Systems (Eocene.Texos) Sparta Depositional Systems (Eocene. Texas)
Fluvial
Delta
DEPOSITIONAL SYSTEMS
Strondplam- Barrier Bar
Prodelto
L: .::':jfy Marginal Emboyment
Boy-Lagoon
C-r-CH Shelf
Figure 41. Comparisons of selected Tertiary and "Holocene depositional systems of the Texas Gulf Coast basin. After Fisher and McGowen, 1967; Fisher, 1969; Fisher and others, 1970; Guevara, 1972; and Garcia, 1972 (from Ricoy and Brown, 1977).
55

Figure 42. Map showing depositional environments, Queen City Formation, East Texas basin (from Hobday and others, 1979).
56

lnd" Map Southwest edge of appraisal area
. \ \ f MADISON / LEE / BURLESON ^ BRAZOS
Figure A3. Map showing outcrop, sandstone isoliths, and selected oil and gas fields producing from the Queen City Formation, East Texas basin (from Guevara and Garcia, 1972).
57

Figure 44. Map of Brazos and Burleson Counties showing sampled water wells and oil and gas and production wells (from Grossman and others, 1986).
58

to the generation and trapping of hydrocarbons in the Sparta Formation in the resource appraisal area.
Tertiary Period: Oligocene Series
Jackson Group, The last significant deposition of Tertiary strata in the basin occurred as sandstones, siltstones, and shales of the Jackson Group. These sediments were derived from uplands to the north and northwest and transported into the southern end of the basin where they were deposited in fluvial and deltaic environments (fig. 41). The major part of Jackson Group sediments, and particularly the potential reservoir rocks, were deposited basinward of the appraisal area (south of the Lower Cretaceous Shelf Margin).
PETROLEUM SOURCE ROCKS
Potential petroleum source beds from Late Jurassic age rocks are fairly well defined in the East Texas basin. Throughout most of the basin, the wedge of the Smackover/Haynesville Formation limestones most likely lies directly on the Norphlet Formation, Louann Salt, Werner Anhydrite, continental clastic rock of the Eagle Mills Formation, Triassic or Paleozoic volcanic rocks, or metamorphosed Paleozoic rocks. However, the Smackover Formation limestones may, in a few areas, lie directly on undeformed Paleozoic marine sedimentary sequences which could be petroleum source beds (Moore, 1984). The Norphlet Formation is considered to be too thin and coarse to be a reasonable petroleum source bed. However, the Norphlet Formation may be a source of hydrocarbons where the strata thicken into the basin. The most likely petroleum source of Late Jurassic age are the thick, dark limestones of the lower Smackover Formation which occur within and around the basin margins and which extend partly across the continental shelf in an updip direction. Hancharik (1984) and Presley and Reed (1984) suggest that laminated, organic-rich carbonate mudstones in the lower Smackover Formation and mudstone-rich and matrix-supported carbonates of the Smackover Formation are favorable petroleum source beds. Toward the southeastern part of the basin, dense, dark-brown micritic limestones of the Smackover Formation and the overlying Haynesville Formation, or Buckner Formation equivalent, become progressively richer in black shale. These strata are hydrocarbon source beds (Presley and Reed, 1984). Dark-colored organically rich shales of youngest Late Jurassic sedimentary rocks, such as Bossier shales and marine shales of the Cotton Valley Group, which were deposited toward the center of the interior subbasins, are likely petroleum source beds (Collins, 1980). These shales onlap the Smackover/Haynesville Formations along the basin margins and part way across the shelf (Moore, 1984). Thin sandstones or siltstone beds of a submarine fan system, which contain hydrocarbons under relatively high pressure, separate intervals of Bossier Shale that accumulated along the margins of the Bossier marine basin. These shales are probably petroleum source beds (Presley and Reed, 1984).
Early Cretaceous rocks are the most widespread and have the greatest volume of any Gulf Coast stratigraphic division. Depositional environments of Early Cretaceous strata were favorable for the accumulation and preservation of vast amounts of hydrocarbon source material (Rainwater, 1970). During the first part of Early Cretaceous in east Texas, transgressive and regressive seas deposited deltaic sandstones and shales of the Travis Peak/Hosston Formation which grade basinward into organically rich shales and carbonates. These organically rich clays, shales, and lime mudstones are potential
59

petroleum source beds for oil and gas produced from major stratigraphic units of deltaic sandstones and porous carbonates in Early Cretaceous strata (Rainwater, 1970). Dutton and others (1987) report that downdip marine shales of the Travis Peak (Hosston Formation) shales are probably hydrocarbon source rocks. Organically rich clays of the Rodessa Formation-Ferry Lake Anhydrite, and Paluxy Formation are potential petroleum source beds.
The deposition of large deltas in east Texas continued into Late Cretaceous. Source beds for many of the Late Cretaceous oil and gas reservoirs were formed from thick intervals of either organically rich clays deposited around and over porous carbonates or marine shales deposited has inward of delta complexes (Rainwater, 1968). Dutton and others (1987) identify shales of the Eagle Ford Group as petroleum source beds. In a study over the central Texas region immediately southwest of the appraisal area, Grabowski (1981) discovered that the lower portion of the Austin Chalk contains 0.5 percent to 3.5 percent organic matter with more localized zones containing 20 percent organic matter. The organic-rich chalks occur principally in basinward (deeper than 5,000 ft or 1,524 m) deposits and organic-poor chalk occur in shallower depositional environments. He noted also that the organic matter in the chalk is similar to, but not as organically rich, as the underlying shales of the Eagle Ford Formation, Because of the close proximity of the Grabowski study area to this resource appraisal area and the similarities in depositional environments, the Austin chalk and shales of the Eagle Ford Formation appear to be favorable petroleum source beds.
During early Cenozoic, deltaic systems spread over the East Texas basin. Prodelta muds seaward of the deltas grade northward into interbedded sands and shales of delta-front facies. Within a progradational sequence, the prodelta fades stratigraphically underlie delta-front facies. The prodelta muds are the thickest and volumetrieally the largest facies of the deltaic system, and are potential petroleum source beds in areas of adequate depth of burial and thermal history, which is most likely south of the resource appraisal area.
HYDROCARBON GENERATION Burial History
In a study of hydrocarbons in the East Texas basin, Conti (1982) measured the effects of continuous burial on hydrocarbon maturation as reflected by statistical trends of changing crude oil gravities with depth, temperature, and rate of burial. The crude oils tested in that study were produced from Cretaceous reservoirs ranging in age from the Travis Peak (Hosston) Formation to Sub-Clarksvilie Formation (fig. 45). The results of his study on the age and geothermal gradient ranges suggest, assuming primary migration, that crude oil generation should begin at about 5,500 ft (1,676 m) for the youngest sediments with the lowest thermal gradient (fig. 46). Crude oil generation should begin at about 4,000 ft (1,219 m) for the youngest sediments with the highest thermal gradients. The maturation trend of the composite plots for all intervals in this study actually begins at a depth of about 3,000 ft (914 m) (fig. 47), which places the onset of oil generation at a younger geologic age than expected. The results of the study indicate that the gravity of crude oil increases at different rates with increasing depth (fig. 48). The gravities of crude oils from the youngest formation, the Sub-Clarksvilie Formation, show, at first, a rapid increase with increasing depth, then a slower increase occurs as the organic fluids are subjected to increasing temperature and pressure. Crude oils from Woodbine Group and
60

19
O 0>B M
f« Q- (DH- O rr H. H1 M tt> CDn
ooto ft D C
H- OQ
rr H C 2T (B 1 (ft X <D
I
O (D rr CL 3*0> H. ^ 3CO- O
O
oo
H- rr
00
O cr* f^. toC co IO H- WH- 3 ft3 »1
OQ t, toH* rr
O ft H- i yoQ o> i-t
. to to o *oO ft 3*n> H-o »o oc toCQ rr o
rt OH- 0> M3 n Crr 3 9ft) en 3
<- o- O to o> MI M co en H- M
OQ to rt 3 co 3T to rt to rt rt H-
3OQ
LOWER CRETACEOUS | UPPER CRETACFOUS
a
3OUN ROSE
H
zi ni !g
<ko
c.
CO
Moopi
Ul
1
IHYDRrTE]
r
M
X
aoERICKSBU
a
Ul
«O8i
m
B
1$:§
A
KSVLLE j
i
ii|O
-n
^
o
OQOQ C i-J »-«to a>
e H- ->fD ^
O 3 O rt I3 Irt r^ ^^H» to H«
» 3 toOQ OQ
i 0> flvo co to oo p
^ O CQ
o3- H.(D 3
OQ
to toCO OQ
Siogi
a z m 5
H to a> 3 X a. toCO OQ
a> cr oto rt CO 3*

60 50
I30
1
120j
10
CO
MP
OS
ITE
DA
TA
-DE
NS
ITY
TRE
ND
CO
NTO
UR
WT
fffM
U.
10 D
ATA
PO
INT
S/
INC
RE
ME
NTA
L A
RE
A
5000
DEPTH (FE
ET)
10,000
Figu
re 47. Graph and
cont
ours
showing
statistical
tren
d of
AP
I gr
avit
y vs
. de
pth
of Cr
etac
eous
oi
ls with the
dot
patt
ern
indi
cati
ng tr
ends
re
pres
enti
ng
the
highest
density
of da
ta (from
Conti, 19
02).
m
CO
MP
OS
ITE
D
ATA
-DE
NS
ITY
50
1 20 10 0
TREND
CO
NTO
UR
IN
TER
VA
L* 1
0 D
ATA
PO
INT
S/IN
CR
EM
EN
TA
L
AR
EA
05
0
RA
TE
OF
BU
RIA
L (F
EE
T/M
Y)
100
Figu
re 48. Graph and
cont
ours
sh
owin
g composite
statistical
trend
of API
grav
ity
vs.
temperature
as determined
by data-density analysis of al
l Cretaceous
oils pl
otte
d together.
Incr
emen
tal
samp
ling
ar
ea's
di
mens
ions
ar
e 10
° API
by 25
°F.
Dot
pattern
indicates
statistical
trend
dete
rmin
ed by
tracing
"rid
geli
ne"
that
re
pres
ents
hi
ghes
t density
of data
(fro
m Co
nti,
1982).

Paluxy Formation reservoirs show characteristics of the shallower Sub-Clarksvilie Formation reservoirs and the deeper producing strata. In the older producing reservoirs tested, the Glen Rose (Rusk) Formation, Rodessa Formation, Pettet Formation and Travis Peak (Hosston) Formation, the crude oils show a low gradient of increasing gravities with increasing depth, rate of burial, and temperature. Conti (1982) concludes that the Ferry Lake Anhydrite formed a barrier which separated two generation/maturation systems, one above and one below the massive anhydrite strata.
Thermal Maturity
The average geothermal gradient is about 1.4 F/100 ft (2.6 C/100 m) for the northwestern Gulf of Mexico basin (Curtis, 1988). The ranges of temperatures/depths for oil-generation in Cretaceous sediments in the Gulf basin are about 165° F (74° C)/7,000 ft (2,134 m) to 220° F (104° 0/11,000 ft (3,353 m) (Dow, 1978). The thermal-gas generation by conversion of crude oil extends from the latter temperature/depth to 245° F (118° C)/12,500 ft (3,810 m). Although hydrocarbon generation occurs at about 2,000 ft (610 m) of burial, the peak zone of petroleum formation is between 6,000 ft and 8,000 ft (1,829 m to 2,438 m). Nunn (1984) states that the geothermal gradient during Middle to Late Jurassic was higher than it is today. Therefore, Late Jurassic rocks have been exposed to temperatures within the oil generation window (Moore and Druckman, 1981) and, based upon bottom hole temperatures to be discussed in latter parts of this report, are in the window of thermal conversion of crude oil to natural gas.
In the study discussed above, Conti (1982) noted that almost all Cretaceous age crude oil-maturation trends fall within a temperature range of 110° F to 250° F (43° C to 121° C) and that hydrocarbon generation should begin at a depth between 4,000 ft and 6,000 ft (1,219 m to 1,829 m) for the age and geothermal gradient ranges of the East Texas basin. However, the composite maturation trends begin at about 3,000 ft (914 m), suggesting that the crude oils may have been generated at shallower depths than those predicted by current theory.
Button and others (1987) postulate that the crude oil from Travis Peak (Hosston) reservoirs is from shales of the Bossier Formation or carbonates of the Smackover Formation, or both* The vitrinite values generally range from 1.0 percent to 1.2 percent, but values of 1.8 percent were obtained from shales in the deeper, downdip part of the formation. The authors suggest that the Ro values indicate the peak oil generation (values of about 0.8 percent to 1.0 percent) has been generally exceeded, the gas/oil ratio has increased, wet gas generation has begun, and dry gas generation has begun in the parts of the formation with Ro values more than 1.2 percent.
Timing and Migration
Timing of migration in the East Texas basin seems to have had a significant influence on hydrocarbon accumulation because of regional structural movement. Mobilization of piercement salt domes (but not salt pillow and turtle structures) in the central part of the basin began too late to trap migrating hydrocarbons in Upper Jurassic age strata.
Hydrocarbons migrated into Upper Jurassic reservoirs in east Texas after an early cementation event, but before the later, deeper subsurface cements were precipitated (Moore, 1984). He suggests that the north Louisiana-south
63
Arkansas Upper Jurassic source rocks reached thermal maturity, and the subsequent migration, later than those in east Texas.
Russell (1951) cites evidence of the early migration of oil in the Van, East Texas, Opelika, and Kelsey Fields in east Texas. The Van and East Texas traps were formed before or by deposition of the Austin Group, but the Kelsey anticline did not start to form until deposition of Wilcox Group in Eocene Series. Prolific oil production occurs in the East Texas and Van Fields from the Woodbine Formation, but all Cretaceous reservoir rocks appear to be non-productive in the Kelsey Field. Folding took place on the Opelika anticline during Early Cretaceous, and about 80 ft (24 m) of structural closure was present on the Woodbine Formation when Austin Group deposition took place. The Opelika anticline produces oil and gas from Early Cretaceous strata, but the Woodbine Formation contains salt water. Therefore, migration of the oil in Woodbine Formation traps appears to have taken place during Late Cretaceous, or variations occur in the distribution of petroleum source beds.
Structural movement aided the accumulation of oil and gas in some Upper Gulfian traps, such as migration into the Woodbine Group traps. In other cases, such as in the Hainesville Dome, a reversal of the original dip occurred after flank collapse, allowing hydrocarbon accumulations to migrate away from the salt dome back into the relatively higher interdomal areas (McGowen and Lopez, 1983).
Crude oil in the Nacatoch Formation in the Van Field is reported by McGowen and Lopez (1983) to have originated in the Woodbine Formation and migrated upward along fault planes. This possible migration could be secondary and could have occurred in Tertiary Period. Migration of crude oil into Slocum Dome and Trinity Fields occurred after the seals were developed over Wilcox Undifferentiated sandstones and Carrizo Formation reservoirs.
Gaseous hydrocarbons occur in high concentrations in the Sparta Formation in east-southeast Texas (fig. 44). Grossman and others (1986) determined that these gaseous hydrocarbons are derived predominantly from biogenic sources. However, the isotopic enrichment of the gas relative to gas from the Yegua Formation suggests that significant amounts of thermogenic gases may be leaking into the Sparta Formation from deep-seated hydrocarbon deposits. Therefore, migration has occurred in relatively late geologic times in part of the basin.
HYDROCARBON OCCURRENCE
Stratigraphic and structural habitat of petroleum
Sedimentary rocks of all geologic periods, epochs, and groups from the Smackover Formation through the Claiborne Group produce oil or gas in one or more fields in the East Texas basin. The relative distribution of the ultimate recoverable quantities of crude oil in 32 major east Texas reservoirs, which accounts for approximately 70 percent of the recorded oil production, was reported by Galloway and others (1983). The Woodbine Group has been recognized as the most prolific producing Stratigraphic unit for decades because it includes the East Texas Field. However, the Paluxy and Rodessa Formations are excellent sources of crude oil.
Table 1 is a summary of known recoverable hydrocarbons by geologic ages in the basin. The Gulfian Series is the principal source of crude oil, accounting for about 86 percent. The recoverable quantities of natural gas are predominantly in Coahulian Series and Upper Jurassic, with quantities of 45 percent and 25 percent, respectively. Natural gas liquids (NGL) are spread
64

Table 1. Table showing
know
n re
cove
rabl
es of
crude
oil, natural
gas,
an
d natural
gas
liquids
by geologic
age, Ea
st Te
xas
basin
Ln
APPRAISAL
AREA
EAST
TEXAS
BASI
N
EAST
TEXAS
BASI
N EXCLUDING
EAST
TEXAS
AND
KURTEN
FIELDS
GEOLOGIC
AGES
UPPE
R JURASSIC
CRETACEOUS-COAHU 1 LAN
CRETACEOUS-COMANCHEAN
CRETACEOUS-GULF 1 AN
TERTIARY-EOCENE TOTALS
UPPER
JURASSIC
CRETACEOUS-COAHU ILAN
CRETACEOUS-COMANCHEAN
CRETACEOUS-GULF IAN
TERTIARY-EOCENE TOTALS
CRUDE OI
L
KNOWN RECOVERABLE
(MILLIONS OF
BARRELS)
50.130
193.
000
1004.518
7640.453
19.9
80
8908
.081
50.130
193.000
1004.518
2158.453
19.9
80
3426
.081
PERCENT 1 2 1
1 86 0
100 1 6 29
63 1
Too
NATU
RAL
GAS
KNOWN RECOVERABLE
(BILLIONS OF
CUBIC
FEET
)
7014.515
12882.590
4215
.479
44
68.0
97
1.55
6
28582.237
7014.515
12882.590
4215
.479
2914.097
1 .556
27028.237
PERCENT
25 45
15
15 0
100 26 46
16
10 0
100
NATU
RAL
GAS
LIQUIDS
KNOW
N RECOVERABLE
(MILLIONS
OF BARRELS)
337.048
305.199
174.
079
770.304
0.000
1586
.63
337.048
305.199
174.
079
204.984
0.000
1021.310
PERCENT
21
19
11
49 0
100 33 30
17
20 0
100
Sour
ce:
NRG
Asso
ciat
es,
1985
rather evenly among reservoirs in Upper Jurassic and Coahuilan Series, and with the highest percentage (49 percent) in the Gulfian Series. The amounts of NGL's in Upper Jurassic and Coahuilan Series reservoirs are somewhat smaller relative to the quantities of natural gas, suggesting an advanced stage of thermal cracking into dry gas as a result of higher subsurface temperatures, and deeper and longer burial histories. The greater concentration of NGL's in deeper and older horizons is consistent with the results of studies by Conti (1982) and Button and others (1987) described earlier.
Structures that entrap oil and gas in the East Texas basin are: anticlines over shallow, intermediate, and deep salt domes, salt pillows, turtle structures, basement paleohighs, horst blocks, and on the upthrown and downthrown sides of normal faults; closures against the upthrown and downthrown sides of normal faults and fault blocks on the flanks of salt domes; and anticlinal noses. Stratigraphic traps forming oil and gas fields are: angular unconformities; reservoirs truncated by unconformities; and reservoirs formed by loss of porosity due to facies change from porous to impermeable layers (sandstone into impervious shale), ooid shoal and shoreline conditions updip into sabkha environment, and concentration of ooids over the axis of structural growth with lower energy sandstones (pellets and oncolites) deposited on the flanks.
Table 2 is a summary of the known recoverable quantities of crude oil, natural gas and NGL for fields in the East Texas basin by type of trap and reservoir rock (NRG Associates, 1985). For the total basin, the types of traps which account for the largest percentages of hydrocarbon accumulations are: crude oil - Stratigraphic trap (62 percent); natural gas-combination trap (83 percent); and NGL-combination trap (50 percent). When the known recoverable hydrocarbons of the East Texas and Rurten Fields are excluded from consideration, the highest percentages of all hydrocarbon types are in combination traps: crude oil-95 percent; natural gas-87 percent; and NGL-73 percent.
Table 2 also reveals that crude oil is found predominantly in sandstone reservoirs; excluding the East Texas and Rurten Fields, the distribution of crude oil in sandstones changes from 94 percent to 85 percent. Limestone reservoirs are gas prone. The distribution of known recoverable quantities of natural gas between sandstone and limestone reservoirs changes only slightly by excluding these two fields: sandstone values are 47 percent and 44 percent, respectively; and, limestone values are 51 percent and 54 percent, respectively. Because of the significant quantities of NGL associated with the East Texas Field relative to the total basin, the changes in percentages for including/excluding the two fields are quite noticeable: the known recoverable quantities of NGL in sandstones are 60 percent and 36 percent, respectively, and limestones are 38 percent and 61 percent, respectively.
Dolomite lithology is a favorable reservoir rock type in the basin, but the occurrences are too limited in geologic ages and geographic areas to provide a substantial portion of the ultimate recoverable hydrocarbons. Chalk reservoirs account for significant amounts of ultimate recoverable hydrocarbons across the Texas Coastal Plain (Austin Chalk trend) and in northern Louisiana (Monroe Field). In both these areas, the large quantities of recoverable hydrocarbons are associated with natural fractures in the reservoir rocks. Extensive, natural fracturing of chalks has not been reported in the East Texas basin.
66

Tab
le 2. T
able
sh
ow
ing
know
n re
co
vera
ble
quanti
ties
of
crude
oil
, natu
ral
gas
, an
d n
atu
ral
gas
li
quid
s by
ty
pes
of
traps
and
rese
rvoir
ro
ck
s,
Eas
t T
exas
basi
n
APPRAISAL
TRAP/RESERVOIR
AREA
TYPES
EAST TEXAS
BASIN
EAST TEXAS
BASIN
EXCLUDING
EAST TEXAS
AND KURTEN
FIELDS
TYPE OF
TRAP
STRUCTURAL
STRATIGRAPHIC
COMBINATION
TOTALS jj
TYPE OF
RESERVOIR RO
CK
SANDSTONE
LIMESTONE
DOLOMITE
CHALK
ANHYDRITE
TOTALS j
j
TYPE OF
TRAP
STRUCTURAL
STRATIGRAPHIC
COMBINATION
TOTALS _
a|
TYPE OF
RESERVOIR ROCK
SANDSTONE
L IMESTONE
DOLOMITE
CHALK
ANHYDRITE
TOTALS _
a|
CRUDE OI
L
KNOWN RECOVERABLE
(MILLIONS OF BARRELS)
92.269
5544.970
3250.366
8887.605
8369.942
512.073
5.892
2.789
3.160
8913.856
92.269
62.970
3250.366
3405.605
2907.942
512.073
5.892
2.789
3.160
3431.856
PERCENT
1 62
37 100 94 6 0 0 0
100 3 2 95 100 85
15 0 0 0
100
NATURAL GA
S
KNOWN RECOVERABLE
(BILL IONS OF CUBIC
FEET)
2245.005
2595.930
22840.649
27681.584
13368.391
14670.017
664.278
2.550
0.600
28705.836
2245.005
1041.930
22840.649
26127.584
1 18
14.3
91
14670.017
664.278
2.550
0.600
2715
1 .836
PERCENT
8 9 83 100 47
51 2 0 0
100 9 4 87 100 44
54 2 0 0
100
NATURAL GAS
LIQUIDS
KNOWN RECOVERABLE
(MILLIONS OF
BARRELS)
166.287
645.047
795.116
1606.450
954.017
615.634
33.930
0.000
0.000
'160
3.58
1
166.287
115.730
759.
1 16
1041.133
361 .7
17
615.634
33.930
0.000
0.000
1011.281
PERCENT 10
40
50 100 60
38 2 0 0
100 16
1 1
73 100 36
61 3 0 0
100
_§j
To
tals
do
not
ag
ree
b
eca
use
a
nu
mb
er
of
sm
alle
r field
s
have
not
be
en
cla
ssifie
d
by
tra
p
typ
e
Sourc
et
NRG
A
sso
cia
tes,
1985
Basis for play definition
A play is an assemblage of hydrocarbon-bearing reservoirs exhibiting similar source, reservoir, and trap characteristics (White, 1980). The plays considered in the appraisal of the East Texas basin were selected using these criteria, and on the basis of ready identification as an exploration or production target and on the likelihood of undiscovered recoverable quantities of crude oil, natural gas, and NGL (natural gas liquids) of more than 1 MMBO (million barrels of crude oil), 6 BCF (billion cubic feet of natural gas) or 1 MMBL (million barrels of natural gas liquids) being present in a field. The relative importance of the selection criteria are, from the more important to less important, similar settings of trapping mechanisms (structural, stratigraphic, or combination), and similar reservoir types, stratigraphic intervals, source rock types, commodity types (crude oil, natural gas, NGL), depositional environments of the reservoirs, and identification of petroleum exploration objectives.
The atlas developed by Galloway and others (1983) was a valuable source of information in the selection of plays and in the subsequent resource appraisal. However, the plays in the resource appraisal differ somewhat from the atlas because study objectives and approaches were different. In the atlas, the 32 major reservoirs in east Texas were assigned to 8 plays, primarily according to the original depositional settings of the reservoir, or less commonly, to their relation to regional erosional surfaces or diagenetic facies. Trapping mechanisms were also used to further subdivide the reservoirs. The objectives of the study were to define and describe the oil plays and to outline their regional settings and geologic characteristics. Then, the available published and field data, geologic, engineering and volumetric parameters were summarized into an atlas for each entire play and for each reservoir contained within the play. The atlas is a catalog of past discoveries and production and, as a systematic analysis of the major reservoirs, it is designed to enlarge knowledge of existing reservoirs and thus aid enhanced recovery efforts, with less emphasis on undiscovered recoverable resources.
Eight plays were also selected in this study (Table 3). These plays are: N. E. Texas basement structure play; Mexia/Talco fault system play; N. E. Texas salt anticline play; Tyler basin structural play; Tyler basin Woodbine-Eagle Ford play; West Tyler basin-Cotton Valley play; Sabine uplift gas play; and Sabine uplift oil play. Another area, the East Texas-Kurten Fields, is discussed in this report because of the super-giant size of the East Texas Field and the unusual trapping mechanism (diagenetic trap) of the large Kurten Field. The East Texas-Kurten Fields were excluded from the appraisal of other oil and gas plays in the basin because the chances are slight to nil of two other fields occurring with both large quantities of recoverable hydrocarbons and identical or similar trapping mechanisms.
Table 4 is a summary of known recoverable, cumulative production, remaining proven reserves, and percent of proven reserves remaining for crude oil, natural gas, and NGL in the 8 plays. The known recoverable quantities of crude oil are 8.9 BBO compared to 6.9 BBO reported by Galloway and others (1983) for 7 plays in east Texas (crude oil reserves for the Miscellaneous Play were not reported). The cumulative production is 8.0 BBO (Table 4) compared to 7.2 BBO for the 7 plays reported by Galloway and others (1983). The differences between the quantities of known recoverable and production figures are attributed to the fact that more fields are contained in the NRG Associates (1985) data files.
68

Table
3. Table showing
reso
urce
appraisal
plays, nu
mber
thicknesses
of pa
y zo
nes,
porosities,
perm
eabi
liti
es,
basin
play
s
of oil
and
gas
fiel
ds,
producing
formations,
and
liqu
id hydrocarbon gr
avit
ies,
East Texas
PLAT/NUMBER Or
PRODUCING FIELDS
1 N.
E. TEXAS BASEMENT STRUCTURES PLAY/6
3 N.
E. TEXAS SALT ANTICLINES PLAY/29
4 TVlER BAJiN STRUCTURAL PLAT/129
J YLE
B SI
OOOBINE EA6LE FORD PLAY/0
8 KE5T T
VLER BA
SIN
COTTON VALLEY PL
AY/5
5
PRODUCING FORMATION
SMACKOVER FORMATION
NACATOCH FORMATION
SMACKOVER FORMATION
PITTSBUR6 FORMATION
ROOESSA FORMATION
HILL
FORMATION
BACON FORMATION
GLENRDSE FORMATION
SUB-CLARKSVILLE FORMATION
B LA
LOCK FORMATION
XILCOX UNDIFFERENTIATEO
CARRIZO FORMATION
OEXTER FORMATION
HAYNESVILLE FORMATION
BOSSIER FORMATION
BOSSIER FORMATION
COTTON VALLEY FORMATION-
TAYLOR SANDSTONE
MITCHELL FORMATION
GLOYD FORMATION
HILL FORMATION
PALUXY FORMATION
FREDERICKSBURG UNO IFFERENT 1 ATED
BLOSSOM FORMATION
NACATOCH FORMATION
NUMBER OF
1
1 2 3 1 2 5 '
DEPTH TO TOP
OF RESERVO R
(FEET)
8580
10660
9879
4900
492
2500
599
600
94
7089
1062
7990
816
6419
1079
9866
1096
6100
1003
7286
818
7866
986
9670
789
2682
921
9786
609
9930
444
1986
200
9992
840
(0342
1(8}
11820
301
9222
638
1198
6 201
7894
166
9636
171
039
6497
694
4600
604
9698
653
6038
697
3366
749
2987
997
1870
190
990
110
i; 1 1 1 1 1 1 : i 3 1479
938
623
130 73 "T8
30
47
16
9!
69
33
48
31
78
80
62
63
22
96
00
34
93 1 1
42 30 9«
35
74 00
10
63 74 ?£ i
03
89
96
36
91
05
63
08
79
264
883
096
045
THICKNESS OF
PAY ZONE
(FEETI
15
66
47
1 1 i t 2 2 4 2 1 3 J
80
40
73
38
88
4
J53 88
I5U
(61
37
22
107
23
128
7 293
4
1 21
1
84
4 133
3
3 183
4
3
8 70
2
123
61
30
23
38
13
6
55
JJ40
31
1020
163
IK
38
15
1 10
80
196
435
77
13
» 7
10
8
88
73
28
15
14
12
12
10
86
38
10
9
42
40
28
12
1 84
60
RESERVOIR
POROSITV
(PERCENT)
14.0
21.0
16.
22.0
31.5
26.
* 30
. "
Z2
.
6.6
13.0
(I.
12.0
14.0
12.
5.3
16.5
14.
II. 0
13,0
13.
16.
13.7
18.9
16.
8,0
20.0
14.
10;
18.0
29.0
24.
"27.
"20.
18.0
30.1
23
. NO
NO
N 29.0
28.0
26.
31.0
32.0
32.
23.0
27.4
26.
"
17.
5.9
Jfl.fl
9.10.
1 1 1.
0 10
. 4.2
13.0
7.10
.6
16.0
14.
NO
NO
N 7.0
14.0
9.
8.0
16.3
13.
10.
1*.
12.
" '
II .
17.
13.
12.6
20.0
16.
II. 0
28.0
19.
NO
ND
N
NO
NO
NND
ND
N
18
.
RESERVOIR
PERMEABILITY
IMILLIDARCIES)
0.5
423.0
133,6
bit
SJioIft
SSlft
1044.0
3410.0
1834.
"
600.
946.
o.f
153.6
}.
3.0
33.6
33.
O.I
123.0
112.
0.
1 1000.0
45.
i >
390.
50.0
379.0
213.
1.3
232.0
132.
NO
ND
N 39.0
3900.0
109«.
"
2000.
"
20.
10.0
804.0
408.
ND
ND
N 103.0
900.0
468.
1330.0
2230.0
1790
. 1000.0
1400.0
1200.
5.1
5.0
1.
ND
ND
0.
I.I
12.0
2.
"2.
2..
O.I
33.0
*.
0.2
113.0
27.
ND
ND
N
6.
1 1!
123.
16
6.
NO
NO
30.
10,0
1100. 0
338.
ND
NO
N ND
ND
N
ND
ND
N 34.0
180.0
117.
API
GRAVITY OF LIQUID
HYDROCARBONS
(DEGREES)
49,0
62.0
33,3
23.0
43.0
33.4
36.0
37.0
ND
NO
24
57.7
66 «
56. «
39.0
60
3 47
.1
9.0
61
6 40.6
31.0
64
0 3.
3 48.0
32 0
9.3
2.0
39.0
61
3 O.
I 42.2
30 2
6.1
8.0
16.0
63.0
7.4
23.0
44.0
18.0
65.0
34.3
21.0
16.0
43.0
27.0
23.4
40.0
32.7
IH IH H4-
5J.6
40.6
Jj.r
39.0
36.0
53. B
J«.D
93.9
ND
NO
ND
36,0
62.0
34.3
46.0
54.0
31.0
49.0
41.0
64.2
46.8
33.0
66.0
31.6
51.2
«
42.0
61.0
63.5
62. «
37.0
44.0
41.0
34.0
47.5
45.0
63.2
34.1
45
.1
49.0
46.0
54.0
69.0
61.5
42.0
ND
NO
ND
36.3
17.0

Table 4. Table showing
known
recoverable
quantities,
cumulative production,
rema
inin
g proven re
serv
es,
and
percent
of pr
oven
re
serv
es remaining
to be
produced for
crude
oil,
natural gas, and natural ga
s liquids
in re
sour
ce appraisal
plays, East Te
xas
basin
PLAY
NAME
N.E. TEXAS BASEMENT
STRUCTURE
PLAY
MEXIA/TALCO-S.W.
ARKANSAS PLAY
N.E. TEXAS SA
LT
ANTICLINE
PLAY
TYLER BASIN STRUCTURAL
PLAY
TYLER BASIN WOODBINE-
EAGLE FO
RD PLAY
WEST TYLER BASIN COTTON
VALL
EY PLAY
SABINE UPLIFT GAS
PLAY
SABINE UPL IF
T OIL
PLAY
EAST TEXAS-KURTEN FIELDS
TOTALS
CRUDE OI
L
KNOWN
CUMULATIVE
REMAINING
PERCENT
RECOVERABLE
PRODUCTION
RESERVES
RESERVES
(MMBO)
(MMB
O)
(MMB
O)
REMAINING
12.5
15
10.6
05
1.910
15
743.800
700.691
39.41D
3
2.175
2.09
7 0.079
4
2471.679
2218.197
253.482
10
22.232
20.881
1.45
1 6
3.000
2.926
0.074
2
41.969
33.769
8.200
20
167.756
148.389
19.6
37
12
3478.024
4899.239
578.781
11
8943.150
8036.794
903.024
NATU
RAL
GAS
KNOWN
CUMULATIVE
REMAINING
PERCENT
RECOVERABLE
PRODUCTION
RESERVES
RESERVES
(BCF
G)
(BCF
G)
(BCF
G)
REMAINING
322.560
113.
411
209.149
65
472.808
408.146
64.539
14
1111.523
694.296
417.227
38
7011.090
5341.921
1699.169
24
7.737
7.488
0.249
3
1169.992
488.445
681.547
58
6116.734
3478.405
2638.329
43
10226.810
9685.421
541.389
5
1500.000
1328.013
171.985
11
27939.234
21545.548
6423.383
NATURAL GAS LIQUIDS
KNOWN
CUMULATIVE
REMAINING
PERCENT
RECOVERABLE
PRODUCTION
RESERVES
RESERVES
(MMB
L)
(MMB
L)
(MMB
L)
REMAINING
82.410
67.703
14.7
05
18
10.167
8.555
1.63
2 16
147.369
104.790
42.379
29
334.861
283.664
51.197
15
0.000
0.000
0.000
0
5.604
2.933
2.669
48
98.214
59.194
39.020
40
263.273
258.410
6.863
3
620.000
487.633
132.367
21
1563.918
1272.886
291.032
Sour
cei
NRG
Associates, 19
85

Figures 49, 50, and 51 are charts showing the number of crude oil, natural gas, and "neither" oil nor gas fields, respectively, and the number of years from the first to the last discovery in the East Texas basin. Neither fields are those fields in NRG (1985) that are too small to qualify as an oil field or as a gas field, but with more than 1 MMBO equivalent. These figures provide an overview of the exploration history of the basin; the exploration status of each play will be discussed later.
Other prospective areas and intervals
The East Texas basin is a maturely developed petroleum province. The probability is poor for discoveries of major hydrocarbon accumulations (similar to the existing larger fields and plays) in new prospective areas and different stratigraphic intervals because of the large number of exploratory and development wells that have been drilled in the basin. However, Jurassic sandstones of the Norphlet Formation and Werner Formation are a possible prospective target, primarily for natural gas and NGL, in northeast Texas. The potential for undiscovered recoverable oil and gas resources seems more likely to be: in the currently productive stratigraphic intervals, particularly in the deeper parts of the basin; in currently productive areas; and, in extensions to currently productive trends. Hydrocarbons may be present also in Eagle Mills Formation (Triassic) and Paleozoic sedimentary strata. These prospective areas and intervals will be addressed in the discussion of the principal plays.
PRINCIPAL PLAYS
Overview
Table 3 contains a list of plays in the East Texas basin, the number of producing fields, the producing formations, the number of reservoirs from which these formations produce, selected information on the reservoirs (depth, porosity, and permeability), and API gravity of liquid hydrocarbons for each play (NRG Associates, 1985). Reference will be made to this table in the discussions of the individual plays, particularly to highlight significant items relative to the resource appraisal. The average field size in each play has not been calculated for this report because: (1) most of the plays are comprised of oil, gas, and neither fields; (2) the oil fields may contain little or considerable associated gas; (3) the gas fields may contain both wet and dry gas; and, (4) one or more giant fields are present in some plays. These factors, both individually and collectively, can distort the mathematical and economic significance of the average size of the fields.
N. E. Texas basement structure play.
Play description and type. This play is elongate in shape, having a width of about 25 miles (40 km) in Bowie County, Texas, and extending into the north side of Cass County; the length is about 35 miles (56 km) (fig. 52). The play continues eastward about 20 mi (32 km) into Little Rivers and Miller Counties, Arkansas; the eastern area is appraised as part of the Louisiana-Mississippi salt basins. Generally, the reservoirs are prone to produce natural gas and condensate (Table 4; Collins. 1980). The API gravities of the liquid hydrocarbons range from 49.0 to 62.0 , averaging 55.3° (Table 3).
71

100
80-
en O
M 60-
g 40
20_
2-429
18
4
F71
4O
1
1990
-1970
-1950
1930
U 1910
1890D E F
PLAY CODE
I/ NUMBER FIELDS IN PLAY"
27YEARS FROM FIRST TO LAST DISCOVERY
A - N.E. Texas basement structures playB - Mexla/Talco fault system playC - N.E. Texas salt anticlines playD - Tyler basin structural playE - Tyler basin Woodbine-Eagle Ford playF - West Tyler basin Cotton Valley playG - Sablne uplift gas playH - Sablne uplift gas playI - East Texas-Kurten Fields play
I/ Number of fields with totalone million barrels of oil
(Source: NRG Associates, 1985)
recoverable hydrocarbons of
Figure 49. Graph showing number of oil fields and years from first to last discovery, East Texas basin plays.
72

A B C D E F G H
100
80-
en Ow
p*.cPi W PQ
60^
40-,
20 J
51 42 60
\
18
57
|V .X
31
53
PT
y
4-6
2000
-1980
-1960
-1940
-1920
-1900
I/NUMBER FIELDS IN PLAY-
0 E F
PLAY CODE
27£\] YEARS FROM FIRST TO
LAST DISCOVERY
N.E. Texas basement structures playMexla/Talco fault system playN.E. Texas salt anticlines playTyler basin structural playWest Tyler basin Cotton Valley playSabIne up I I ft gas pI aySabIne up I I ft oil pI ayTyler basin Woodbine-Eagle Ford play
^/Number of fields with total recoverable hydrocarbons of six billion cubic feet of gas or more.
(Source: NRG Associates,- 1985)
Figure 50. Graph showing number of gas fields and years from first to last discovery, East Texas basin.
73

100
80-^
o hJ60-
g 40 H
20-
3720
27
3
¥2
25
^
4
(771
22
V
2000
-1980
-1960
COea <
-1920
1900
PLAY CODE
£23 NUMBER OF FIELDS IN PLAY-727
YEARS FROM FIRST TO LAST DISCOVERY
A - Mexla/Talco fault system playB - N.E. Texas salt anticlines playC - Tyler basin structural playD - Tyler basin Woodbine-Eagle Ford playE - West Tyler basin Cotton Valley playF - Sablne uplift gas playG - SabIne up I I ft olI pI ay
I/Number of fields with known recoverable hydrocarbons of one million barrels of liquids or six billion cubic feet of gas or more. N.E. Texas basement structures play has no fields with this classification.
Figure 51.--Graph showing number of producing fields classified as neither oil nor gas fields and years from first to last discovery, East Texas basin.
74

Oil field
Gas field
Figure 52. Map showing oil and gas fields within the N.E. Texas basement structure play, East Texas basin. (Refer to Table 5 for field names).
75

Tabl
e 5. East Texas
basin
oil
and
gas
fiel
ds
UNIQUE
NUMBER
FIELD NAME
UNIQUE
NUMBER
FIELD NAME
UNIQUE
NUMBER
FIELD NAME
0009
BRYA
NS MI
LL0010
HAUD
0012
KILDARE
0014
FROST
0015
CARBONDALE &
NORTH
0018
GROESBECK
0021
CORSICANA
0022
MEXIA
0024
POWELL
0025
RICHLAND
0026
WORTHAM
0027
NEGRO CREEK
0028
TALCO
0029
SULPHUR BL
UFF
0030
FLAG LAKE
0031
WIELAND
0032
CALVERT
0033
WALTER FAIR
0034
PEWITT RANCH
0035
REITER
0036
TRIX-LIZ
0037
HAM
GOSSETT, SOUTHEAST
0044
MYRTLE SP
RING
S0045
GINGER
0046
BOX
CHURCH
0047
FRUITVALE, EAST&SOUTHEAST
0048
YANT
IS,
WEST
0049
YANT
IS,
SOUTHWEST
0050
EDGEWOOD
0051
EDGE
WOOD
, UORTHEAST
0052
CANTON
0053
TEAS
0054
CARTER-BLOXOM
0055
CHEROKEE TRACE
0056
EUSTACE
0057
NEAL
0058
AKER
0060
FRUITVALE
0064
DUNBAR
0073
PITTSBURG
0075
NEW
HOPE
0076
YANTIS
0077
COMO
0079
ALBA
0084
REILLY SP
RING
S: SMKV
0085
W.A.
HONCRIEF
0086
CHITSEY
0088
BUFFALO, SOUTH
0089
BUFFALO
0090
RED LAKE
0091
GRAPELAND
0092
OPELIKA AR
EA0093
GRIHES
0094
ELKHART
0095
NAVARRO CROSSING
0096
CHAPEL HILL
0097
OAKWOOD
0098
TRI-CITIES
0099
LARISSA: RODESSA
0100
WINNSBORO
0101
LINDALE
0102
SOUTHERN PINE
0103
RED
SPRINGS
0105
PRAIRIE LAKE & SOUTHWEST
0107
OAKW
OOD,
SOUTHWEST
0108
STEWARDS MILL,
NORTHEAST
0109
HT.
SELMAN
0110
HCBEE
0111
TECULA
0112
BETH
EL0113
NAN-SU-GAIL
0114
CHAPEL HI
LL,
SOUTH
0115
OLETHA £ SOUTHWEST
0117
RED OAK
0118
RISCHERS STORE
0119
RUNNING DUKE
0120
JEWETT
0121
DE
CKER
SWITCH
0122
SAND FLAT,
NORTH
0123
WHITE OA
K CREEK
0124
COON CREEK
0125
SUPRON
0126
HARTINS HILL
0127
DONIE
0128
TRINIDAD,
SOUTH
0129
PERCY
WHEELER
0130
FRANKSTON
0132
NEVIS
0133
TENNESSEE CO
LONY
, SW
0134
DRISKELL LAKE
0135
BOGG
Y CREEK
0136
VAN
0137
LONG LAKE
0138
CAYUGA
0139
CAMP HILL
0140
HAWKINS
0141
CONCORD DOME
0142
COKE
0143
QUITMAN
0144
MANZIEL
0145
SAND FLAT-SHAMBURGER LAKE
0146
TYLER
0147
PICKTON
0148
MERIGALE-PAUL
0149
LA RUE
0150
MT.
SYLV
AN01
51
WILLIAM WISE
0152
HAM
GOSSETT &
EAST
0153
NOLAN ED
WARD
0154
PINE MILLS
0155
TENNESSEE COLONY
0156
FOREST HILL
0157
JACK
SONV
ILLE
, NO
RTH
0158
MIDWAY LAKE
0159
SHIRLEY-BARBARA
0160
MCCR
ARY
0161
KERE
NS,
SOUTH
0162
CAYU
GA,
NORTHWEST
0163
WRIGHT MOUNTAIN
0164
NECHES
0165
NEWSOME
0166
GOOD OHEN
0167
MALAKOFF,
SOUTH
0168
SLOCUM DOME
0169
BARKLEY
0170
SALMON
0171
OAKWOOD DOME
0172
FAIRWAY
0173
LAKE MA
RY0174
GRAND SA
LINE
0175
TYLE
R, WEST
0176
PEARSON CH
APEL
0177
MOLLY-JANE
0178
PURT
, WEST
0179
BELLWOOD LAKE
0180
ANN
MCKNIGHT
0181
SU
NSHI
NE:
RODE
SSA
0182
INGRAM TR
INIT
Y0186
EAST TE
XAS
0187
LONE STAR
0188
MAPLETON
0191
PLEASANT GROVE
0193
NEW DI
ANA
0195
LEONA
0197
BEN-GENE
0198
GOOD SPRINGS, WEST
0204
STEWARDS MI
LL0205
REED
0206
TEAGUE
0207
FREESTONE

Tabl
e 5. East Te
xas
basin
oil
and
gas
fields (c
onti
nued
)
UNIQUE
NUMBER
FIELD
NAME
UNIQ
UE
NUMBER
FIELD
NAME
UNIQUE
NUMBER
FIELD
NAME
0208
TEAG
UE,
WEST
0209
BURL
ESON
HILL
0210
PE
RSON
VILL
E, NO
RTH-
POKE
Y02
11
FARR
AR02
12
TEAGUE TOWNSITE
0213
ROUN
DHOU
SE02
14
OENNY
0215
OAKS
0216
BALD
PR
AIRI
E02
17
SIMS
BORO
, NORTH
0218
BE
AR GR
ASS
0219
RE
ED,
NORTH
0220
MINU
S CREEK
0221
THOMAS LA
KE02
22
TEAG
UE,
SOUTH
0223
MCSW
ANE
0224
BR
ANTO
N0225
CHEN
EYBO
RO,
SOUT
HWES
T02
26
REKA
0227
CHENEYBORO
0229
BETH
ANY
AREA
0232
WASK
OM0237
CART
HAGE
AR
EA02
41
WILL
OW SP
RING
S0243
HENDERSON
0250
WHEL
AN02
51
WOODLAWN
0253
HENDERSON, SO
UTH
0255
LASSATER
0259
GARRISON AR
EA0260
TRAW
ICK
0261
LANS
ING,
NORTH
0263
DOUGLASS
0264
HA
LLSV
ILLE
, SO
UTH
0267
BL
OCKE
R02
68
niND
EN02
71
ALLE
NTOW
N02
72
SCOTTSVILLE, NO
RTH
0274
RE
KLAW
0278
OA
K HILL
0279
HEND
ERSO
N, NO
RTH
0281
SCOTTSVILLE, NO
RTHW
EST
0285
J.G.
S.
0287
PENN
-GRI
FFIT
H02
88
CYRI
L02
89
WOODLAWN,
NORTH
0293
EXCELSIOR
0294
GI
LMER
0297
CEDAR
SPRI
NGS
0298
DO
UGLA
SS,
WEST
0300
GILMER,
SOUT
H03
01
WOODLAWN,
SOUT
HWES
T0304
SCOO
BER
CREE
K0306
TRAW
ICK,
NORTHEAST
0307
OVER
TON
0309
DOUGLASS,
SOUT
HWES
T03
10
BECKVILLE
0313
L.
C.G.
0314
GOOC
H0315
RUFU
S0316
PAXT
ON0317
ROSEWOOD
0318
BECKVILLE, WEST
0320
OAK
HILL,
SOUT
H0321
DIRG
IN0323
BECK
VILL
E, NO
RTH
0324
NACO
NICH
E CR
EEK
& EA
ST03
25
OAK
HILL
, NO
RTHW
EST
0326
SABINE,
SOUT
HEAS
T03
27
TATU
M, NO
RTH
0328
DELR
OSE
0330
GL
ADEW
ATER
&
SOUT
H03
32
PINEHILL,
SOUT
HEAS
T03
33
BETTY
JO0334
GLENWOOD:
COTT
ON VA
LLEY
0335
MINDEN,
WEST
0336
EZ
IM0338
SHEA
0339
MEI
0344
STOCKMAN
0346
LANEVILLE, NO
RTHE
AST
0347
MI
NGS
CHAPEL
0348
ITEX
0349
HARLETON,
NORT
HEAS
T03
50
TOOL
AN0364
HAYN
ES0367
VICKI
LYNN
0368
TATU
M0369
NEUH
OFF
0370
HA
LLSV
ILLE
, NORTHEAST
0372
LA
KE FERRELL
0374
PONE
0375
DANVILLE
0376
FRIENDSHIP
0377
LINDEN,
EAST
0378
SHILOH
0379
GREE
N FOX
0380
RO
DESS
A, NO
RTHW
EST
0381
RO
DESS
A, EA
ST:
MITC
HELL
0382
OV
ERTO
N, NO
RTHE
AST
0384
HO
SEY-
DRIS
KELL
0385
TA
LIAF
ERRO
0386
CU
RRIE
0387
QUIN
LAN
0388
NE
LTA
0390
JOHN
W
0395
MITCHELL CREEK
0397
BIRT
HRIG
HT03
98
BRAN
TLEY
JA
CKSO
N0399
TAWA
KONI
0400
BRANTLEY JACKSON, WE
ST0528
HUXL
EY0650
TRIN
ITY
1700
BLOO
MBUR
G4003
DUNB
AR,
SOUT
HEAS
T4004
GING
ER,
SOUTHEAST
4005
WADE
4006
AL
ABAM
A FERRY
4008
GREENWOOD-WASKOM
4011
EV
ANS
LAKE
, WE
ST40
12
GREE
N AC
RES
4013
GR
ESHA
M4015
JECAN
4016
MI
CHAE
L BR
CH-P
RAIR
IE LK
, S
4017
MO
ORE
STAT
ION
4018
NETT
LE40
19
PRAIRIE
LAKE
, SOUTHEAST
4020
LA
URA
LA VELLE, SO
UTH
4021
BE
ST40
22
BUTLER:
COTT
ON VA
LLEY
4023
FARRAR,
NORT
H40
24
TEAG
UE,
SOUTHWEST
4025
WI
NKLE
R, SO
UTH
4026
DE
BERR
Y4027
G.A.
S.4028
CARTHAGE,
NORT
HWES
T40
29
JOAO
UIN,
WE
ST40
30
MCKA
Y40
31
NACO
NICH
E CR
EEK,
WEST
4032
PEAT
OWN
4033
RO
SBOR
OUGH
SPRING,
EAST
4034
WASKOM,
NORT
H4035
HEMP
HILL
4504
BETH
ANY-
LONG
STRE
ET

Reservoirs. The reservoirs are in three upward coarsening sequences of the Upper Smackover Formation which were formed in shoal-water environments and which culminate in ooid grainstones across the area (Fresley and Reed, 1984; Harwood and Fontana, 1984). Leaching by meteoric fluids began shortly after deposition, resulting in the development of oomoldic porosity in many of the ooid grainstones; other carbonate facies were slightly affected. Dolomitization enhanced permeability during early diagenesis by preserving existing porosities and by generating effective intercrystalline porosity. Then, during burial, brittle compaction was further increased by interconnecting oomoids (Hardwood and Fontana, 1984). The reservoirs are Smackover Formation, Smackover Limestone, Reynolds Formation, and Reynolds Limestone. The lithologics and number of primary reservoirs are: limestones-5; and, dolomite-1. The lithologies and numbers of secondary reservoirs are: dolomites-2; and, limestone-1. The thicknesses of the pay zones range from 15 ft (5 m) to 68 ft (21 m) and average 47 ft (14 m). Porosities and permeabilities are favorable, ranging from 14.0 percent to 21.0 percent (average is 16.9 percent) and from 0.5 md (millidarcies) to 425.0 md (average is 136 md), respectively (Table 3).
Structures and seals. The Late Jurassic topography in northeast Texas consisted of horst blocks, Paleozoic cuestas, and erosional remnants that modified the depositional environments during transgressions of the seas, resulting in local high-energy conditions over the structures (Moore, 1984). With subsequent sediment loading, differential compaction over discrete basement structures formed anticlinal closures which are the hydrocarbon traps. Little or no Louann Salt covered the crest of the basement structures. As sediment loading continued, basement faulting further enhanced subtle basement-related traps. Hydrocarbon production from such traps is generally limited and is closely associated with major graben trends (Moore, 1984). Presley and Reed (1984) state that the structural trends are complex, with numerous fault sub-blocks, and abrupt and seemingly unpredictable changes in structural attitude along strike. Thus, there is potential for structures not previously mapped. Hydrocarbon production depends upon a combination of structural, stratigraphic, and diagenetic factors. The grainstones may continue across the crest of the structures; production is also from dolomitized areas. Therefore, diagenesis may control the reservoir and the reservoir seal.
Source rocks and geochemistry. Well-defined geologic constraints limit the number of source beds for Smackover oil and gas. As previously discussed, throughout most of northeast Texas, the wedge of Smackover rocks lies directly on the Norphlet Formation, Louann Salt, Werner Formation, coarse continental elastics of the Eagle Mills Formation or Paleozoic rocks. With the possible exception of a few isolated areas where Smackover strata may directly overlie undeformed Paleozoic marine sedimentary sequences, shales of the Smackover sequence must be considered as hydrocarbon source rocks. The most logical petroleum source rocks within this sequence are the dark limestones of the lower Smackover Formation, which occur within and around the basin margins and which extend partly across the shelf in an updip direction.
Paleotemperature estimates indicate that Jurassic-age sediments have been close to their current temperatures from 194° F (90° C) to 338° F (170 C) for the last 100 million years. Evidence from subsurface studies suggest that Jurassic temperature gradients have, in the past, been more than
78
twice the present value of 0.9° F/100 ft (Nunn, 1984). The thermal history is conducive to generating hydrocarbons.
Timing and migration. Moore and Druckman (1981) have documented that hydrocarbons migrated into upper Smackover reservoirs of south Arkansas after the precipitation of calcite cements at 194 F (90 C). In east Texas, the hydrocarbons migrated into the upper Smackover reservoirs much earlier, and probably the migration was after an early, precompaction cementation, but before the later, deeper subsurface cements were precipitated (Moore, 1984). He interprets these findings to mean that petroleum source rocks in east Texas reached thermal maturity earlier than those in Louisiana. The Smackover strata occur as wedges that thin rapidly to the north. Thus, regional fluid migration from the basin margin across the shelf is important in accumulation of hydrocarbons.
Depth of occurrence. The average depths to the top of the shallowest and deepest reservoirs are 8,580 ft (2,615 m) (Maud Field) and 10,660 ft (3,249 m) (Bryan's Mill Field), respectively. The average depth to the top of all reservoirs in the play is 9,875 ft (3,010 m) (Table 3).
Exploration status. The initial discovery in the play was the Kildare Field (1942), followed by the Bloomburg Field (1958), Bryans Mill Field (1960) (fig. 9), Frost Field (1964), Carbondale and Carbondale North Fields (1966), and the Maud Field (1967) (fig. 9). The play consists of 3 oil fields and 3 gas fields with known recoverable quantities for the play of 28.900 MMBO, 322.560 BCFG, and 82.410 MMBL (figs. 49, 50; Table 4). The largest oil and gas fields are Kildare Field (16.0 MMBO) and Bryan's Mill Field (252.0 BCFG), respectively. The fields are of relatively small known recoverable quantities of liquid hydrocarbons, with the exception of Bryan's Mill field which is expected to yield 0.8 MMBO, 252.0 BCFG and 55.0 MMBL.
Aubrey (1984) reported that two discovery wells (in the Frazier and Colville Fields, which have insufficient reserves to be included in the NRG data files) in Cass County established production in a sandstone of the Norphlet Formation. He states, however, that other explorationists have identified this zone as sandy facies in the Smackover Formation, as a Jurassic sandstone of the Norphlet Formation or Werner Formation, or as a Triassic sandstone of the Eagle Mills Formation. The sandstone appears to be a windblown deposit mixed with a marine fill sequence. Seismic data suggest that the sandstone was deposited on paleo features on the boundary of a mini-basin (Aubrey, 1984).
Mexia/Talco fault system play
Play description and type. The play is an arcuate band that extends about 90 mi (145 km) westward across the basin from Morris and Bowie Counties on the northeast to Hunt County on the northwest side and southwestward about 180 mi (290 km) to Milam and Robertson Counties (fig. 53). The width of the play ranges from about 20 mi (32 km) to 45 mi (72 km). The reservoirs are classified as both oil and gas reservoirs. API gravities of the liquid hydrocarbons vary from 17.0 to 68.0 and average 37.4 (Table 3), with the lighter gravity liquid hydrocarbons being present in the Smackover Formation.
Reservoirs. The reservoirs range in rock types and ages from limestones and dolomites of Late Jurassic (Smackover Formation) to sandstones of Nacatoch
79

Oil field Gas field
t» «c «o 100
Figure 53. Map showing oil arid gas fields within the Mexia/Talco fault system play, East Texas basin. (Refer to Table 5 for field names).
80

Formation (Table 3). Collins (1980) notes that most Smackover Formation reservoirs have either marginal or no production at shallower closures and both limestones and dolomites produce predominantly gas. The Smackover Formation reservoirs are usually narrow and are usually restricted to one location in width along the first up-to-the-basin fault closure. The fields may extend several miles along the fault, however. Porosities and permeabilities of the Smackover reservoir rocks are favorable, ranging from about 8.1 percent to 31.5 percent (average equals 17.6 percent) and from 0.1 md to 3200.0 md (average equals 33.0 md), respectively. The thicknesses of the Smackover reservoirs range from 20 ft (6 m) £0 108 ft (33 m) and average 42 ft (13 m). The API gravities of the liquid hydrocarbons in the Smackover Formation have generally higher values than the shallower, younger producing horizons, which are above the massive Ferry Lake Anhydrite (Table 3).
The most productive reservoirs in the Paluxy Formation are from sandstones which were deposited as thick channel-fill fluvial sequences along the northern parts of the Talco fault zone. Approximately 50 percent (257.4 MMBO) of the cumulative production (to 1982) in the Talco Field is from the Paluxy Sandstone (Galloway and others, 1983). Other fields produce from sandstones deposited as fluvial meander facies of the Paluxy Formation. Porosities and permeabilities of Paluxy reservoir rocks range from 15.0 percent to 39.0 percent (average porosity equals 28.5 percent) and from 24.0 md to 4,000.0 md (average permeability equals 1,944.8 md), respectively (Table 3). The thicknesses of the pay zones range from 18 ft (5 m) to 80 ft (24 m) and average 40 ft (12 m).
Production from the Woodbine Sandstone is mainly from sandstones which are interbedded with mudstones. These sandstones are located in the distal part of the delta trend and are composed largely of coastal-barrier sand facies deposited by wave-dominated deltas (Oliver, 1971). Porosities and permeabilities of the Woodbine reservoir rocks range from 22.0 percent to 31.5 percent (average equals 26.1 percent) and from 1,044.8 md to more than 3,410.0 md (average is 1,854.8 md), respectively. The reservoir pay thicknesses range from 3 ft (1 m) to 75 ft (23 m), averaging 38 ft (12 m) (Table 3).
Sandstones in the Navarro Undifferentiated (possibly Wolfe City Sandstone), Upper Taylor and Nacatoch Formations produce in shallow oil and gas reservoirs along the Mexia-Talco fault system on the west side of the East Texas basin. The Nacatoch Formation reservoirs consist of shelf sandstones which exhibit favorable facies characteristics. The sandstones are clean and well sorted, generally have good porosity and grade laterally and vertically into shelf muds that restrict migration of hydrocarbons (MeGowen and Lopez, 1983). Field average porosities and permeabilities of these reservoir rocks are 22.5 percent to 31.5 percent (average equals 26.1 percent) and 600.0 md to 946.0 md (average equals 773.0 md), respectively. The thicknesses of Taylor and Navarro Group reservoirs range from 3 ft (1 m) to 90 ft (27 m), averaging about 49 ft (15 m).
The lithologies and the numbers of primary reservoirs for the play are: limestones-5; sandstones-21; and dolomites-4. The lithologies and the numbers of secondary reservoirs are: limestones-2; shales-2; and, dolomites-1.
Structures and seals. The Mexia-Talco fault system represents the updip limit for significant size fields in this play (small fields exist to the west and north of the fault zone) and of the Louann Salt. The structure types are primarily closures against faults, faulted anticlines and faulted structural arches. Facies changes influence the entrapment of hydrocarbons in some
81

reservoirs. The fault zone is a series of en echelon normal faults and grabens that displace Mesozoic to Eocene strata (Locklin, 1984; McGowen and Lopez, 1983). The faults and grabens appear to have been formed as pull-apart structures resulting from the slow basinward gliding of the sedimentary overburden over the highly mobile Louann Salt, which provided a weak decollement layer (Galloway and others, 1983). The hydrocarbon traps are limited to closures against both the upthrown and downthrown sides of faults along a narrow band around the basins. The producing fields, in spite of being narrow in width, can extend for several miles.
Several key factors exist concerning why apparent Upper Jurassic reservoir rocks have not entrapped hydrocarbons more frequently. First, large faults have created excessive fracturing and have broken mineralized seals along the fault plane which allowed hydrocarbon leakage from Upper Jurassic reservoirs (Locklin, 1984). Large faults also have, in some cases, resulted in reservoir rocks being displaced opposite a porous, permeable strata which allowed leakage across the fault plane. Locklin (1984) also noted that the main faults of a graben may have encountered each other at or above the Smackover Formation, which would have allowed communication across the graben within the reservoir rock.
The reservoir-seals relationships are: Smackover Formation-Buckner Anhydrite; Woodbine Sandstone - Eagle Ford shales and Austin chalk; and the Wolfe City, Upper Taylor and Nacatoch Formations - shales, chalks and marls of the Lower Taylor, the overlying Pecan Gap, or the Upper Taylor Formation.
Source beds and geochemistry. Oil and gas were probably generated and expelled from dark limestones and mudstones of the Smackover Formation which occur within and around the basin margins and extend partly across the shelf in an updip direction, as described previously.
As discussed earlier, Early Cretaceous sedimentary rocks are spread over the basin and petroleum source rocks in the area covered by this play are organically rich clay, shales, and lime mudstones in the Travis Peak/Hosston and Rodessa Formations, Ferry Lake Anhydrite, and possibly some interspersed formations.
The Trinity Group ended with a major regression in which Paluxy sandstones and clays were deposited in marginal marine and oxidizing coastal plain environments. Large deltas prograded far into the shallow sea, and organically rich shales were deposited close to porous deltaic sands, thus providing close proximity of source beds and reservoir rocks.
In the Late Cretaceous, petroleum source rocks are prevalent in the Woodbine, Eagle Ford, and Austin Group and consist of organically rich clays and chalks, and marine shales. Source beds for at least part of the hydrocarbons produced from the Nacatoch Sandstones are probably from the Woodbine Group, with the oil and gas having migrated up fault planes (Caughey, 1977).
Timing and migration. The timing and migration of hydrocarbons in the Smackover and Paluxy Formations of this play appear to be consistent with what occurred in the basin and in the N. E. Texas basement structure play discussed earlier. Timing of migration seems to have had a significant influence on hydrocarbon accumulation in Upper Cretaceous sediments because of regional structural movement. Structural movement aided the accumulation of oil and gas in some Upper Gulfian traps, as noted in the crude oil migration from the Woodbine Group. In other cases, such as in the Hainesville Dome,
82

regional tilting of the strata allowed accumulated oil and gas to escape updip, as described earlier.
Depth of occurrence. The average depths to the top of the shallowest and deepest reservoirs are the Nacatoch Formation at 600 ft (183 m) in the Groesbeck Field and the Smackover Formation at 9,692 ft (2,954 m) in the Tawakoni Field, respectively (Table 3). The average depth to the top of all reservoirs in the play is 4,879 ft (1,487 m).
Exploration status. The first significant Gulf Coast oil field, the Corsicana Field, was discovered along the Mexia fault system in October 1895 (fig. 53). After a short lapse in time, major oil fields in the Mexia-Talco fault system play were discovered in 1912 (Mexia Field), 1923 (Powell Field, fig. 9), and 1924 (Wortham Field). The last significant field, West Brantley Jackson Field, was discovered in 1969, bringing the total number to 24 oil fields (fig. 49). The play contains 4 gas fields, ranging in years of discovery from 1913 (Groesbeck Field) to 1967 (Nelta Field) (fig. 50). The John W. Field (fig. 9), discovered in 1979, is classified as neither oil nor gas field (fig. 51). The known recoverable hydrocarbons in the play are 743.800 MMBO, 472.808 BCFG and 10.187 MMBL (Table 4). The largest oil and gas fields are the Talco Field (293.000 MMBO) and the Currie Field (225.000 BCFG), respectively.
The API gravities of the liquid hydrocarbons varies from an average of 24.0 in the Nacatoch Formation to 51.0 in the Smackover Formation. The most prolific producer, the Paluxy Formation, has heavier liquid hydrocarbons, as an average, than the younger Woodbine Formation, Navarro Undifferentiated and Upper Taylor Formation.
N.E. Texas salt anticline play
Play description and type. This play consists of two areas of salt anticlines; one area extends east-west generally parallel to and downdip from the Talco fault system. The length is about 90 mi (145 km) long and as much as 35 mi (56 km) wide, with salt anticlines distributed from Camp and Upshur Counties to Van Zandt County. Another cluster of salt anticlines is aligned in a northeast-southwest trend basinward of the Mexia fault system. The second cluster of salt anticlines is centered around Limestone, Freestone, and Navarro Counties, with one salt anticline located in Henderson County (fig. 54). The reservoirs are gas prone, but crude oil is present. The API gravities of the liquid hydrocarbons varies from 37.7 to 68.8 , with an average value of 56.6° (Table 3).
Reservoirs. Smackover Formation carbonate and associated facies, the reservoir rocks in this trend, were deposited in shallow water environments. Incipient salt structures were important in localizing reservoir-grade facies and controlling ground-water and fluid flow conditions that affected diagenesis (Presley and Reed, 1984). Excellent sucrosic and oomoldic dolomitic reservoir rocks generally extend basinward as far as the Buckner Anhydrite was deposited. High quality Smackover Formation reservoir rocks may grade into dense crystalline limestones in relatively short distances (less than 2,500 ft or 762 m) toward the basin center. In the basinward part of this trend, the salt has intruded the entire Smackover Formation. These structures generally have excellent porosity on the flanks of the closures (Collins, 1980). The rock types and number of primary reservoirs are:
83

*m*A****
APPRAISAL AREA
Oil field
C7 Gas field
Figure 54. Map showing oil and gas fields within the N.E. Texassalt anticline play, East Texas basin. (Refer to Table 5 for field
names).
84

1linestones-24; and dolomites-5. Dolomites form 6 secondary reservoirs. The thicknesses of the producing horizons range from 10 ft (3 m) to 292 ft (89 m) and average 88 ft (27 m) for the entire play (Table 3). Porosities range from 7.1 percent to 18.0 percent with an average porosity of 12.6 percent. Permeabilities range from 1.1 md to 86.8 md, with an average of 14.4 md (Table 3).
Structures and seals. Downdip of the Mexia-Talco fault system, the Louann Salt and Smackover Formation thickens toward the axis of the basin. Subtle, low-amplitude salt anticlines were formed in response to sediment loading of the overlying Smackover and Haynesville Formations, from increased density during compaction, and from bas inward tilt through time (Moore, 1984). The salt structures in the northern and northeastern part of the basin are low-relief anticlines over which Upper Jurassic carbonates are draped. The central part of the trend has salt structures that are faulted, but the salt layer does not pierce the overlying sedimentary rock. The southern part of the trend contains more complex anticlines in which salt has commonly broken through the overlying Upper Jurassic carbonates and the reservoir rocks are generally complexly faulted (Presley and Reed, 1984).
The Buckner anhydrite, where present, acts as an effective seal. In other areas, shales of the Haynesville and Bossier Formations are the reservoir seals (Collins, 1980; Moore, 1984).
Source rocks and geochemistry. With the possible exception of a few isolated areas where Smackover limestones may directly overlie undeformed Paleozoic marine sedimentary sequences, as previously discussed, the Norphlet shales and the Smackover-Haynesville sequences must be considered as hydrocarbon source rocks. The most logical source rocks within this sequence are the dark limestones of the lower Smackover Formation, which occur within and around the basin margins and extend partly across the shelf in an updip direction, attaining thicknesses in excess of 500 ft (152 m). Basinward, the dark-colored organic-rich Bossier Shale in Texas and Louisiana onlaps the Smackover/Haynesville Formations along the basin margin and partway across the shelf and may be petroleum source rocks (Moore, 1984).
Timing and migration. The timing and migration of hydrocarbons in the N. E. Texas salt anticline play is expected to be generally consistent with the timing and migration in the N. E. Texas basement structures play and the Smackover Formation reservoirs in the Mexia/Talco fault system play. The salt anticlines may have formed slightly later than the traps in the other two plays, as noted earlier, but the structures would still have been available to trap and retain the migrating hydrocarbons.
Depth of occurrence. The average depths to the top of the Smackover Formation are 10,800 ft (3,292 m) in the Box Church Field and 13,230 ft 7(4,033 m) in the Chitsey Field. The average depth to the top of the productive Smackover Formation interval throughout the play is 12,278 ft (3,742 m) (Table 3).
Exploration status. Although this play is natural gas-condensate prone, 8 oil fields have been discovered between 1943 (New Hope Field) and 1969 (Chitsey Field) (fig. 49). Eighteen gas fields were discovered between 1944 (Myrtle Springs Field) and 1982 (Southeast Ginger Field) (fig. 50). Three fields (Fruitvale, Dunbar, and Tate Fields), classified as neither oil nor gas
85

fields, were discovered in 1944, 1964, and 1971, respectively (fig. 51). Known recoverable hydrocarbons in the 29 fields are 2.175 MMBO, 1,111.523 BCFG, and 147.369 MMBL (Table 4). All the producing strata are deep (more than 10,000 ft (3,048 m) and contain hydrogen sulfide gas (Collins, 1980).
Tyler basin structural play
Play description and type. The Tyler basin structural play is a large, elongate area covering the central part of the East Texas basin (fig. 55). It lies south and east of the Mexia-Talco fault system play, northeast of the Tyler basin Cotton Valley play, west of the Tyler basin Woodbine-Eagle Ford play, and west of the Sabine uplift oil and gas plays. This play has large numbers of both oil and gas fields, but oil fields are more prevalent. The API gravities of the liquid hydrocarbons vary from 18.0 to 64.0 , averaging about 44 for the play. As noted in other plays, the lighter weight gravities of fluids are in the older, deeper, and higher temperature reservoirs. The dividing line between the lighter and heavier hydrocarbons is the Glen Rose (Rusk) Formation.
Reservoirs. The stratigraphic intervals of the reservoirs are: Early Cretaceous-Trinity Group (Travis Peak, Pittsburg, Pettet, Bacon, Hill, Rodessa, and Paluxy Formations); Late Cretaceous-Woodbine Group (Woodbine Formation and the Dexter Sandstone Member), Eagle Ford Group (Harris Sandstone, Coker Sandstone-Blalock Formation; Sub-Clarksville Member, and Eagle Ford Formation); and Eocene Series (Carrizo Formation) (Table 3). Clastic sedimentary rocks account for 115 primary sandstone reservoirs, 4 secondary sandstone and 2 secondary shale reservoirs. The sandstone reservoirs are in the Coahuilan (Travis Peak and Pittsburg Formations), Comanchean (Rodessa and Paluxy Formations) and the Gulfian Series (Woodbine Group, including the Dexter Member, the Eagle Ford, Harris, Coker, and Sub-Clarksville Member and the Blalock Formation). The shallowest sandstone reservoirs are in the Carrizo Formation, Eocene Series. Limestones form 65 primary and 12 secondary reservoir rocks, with dolomites forming 2 primary and 2 secondary reservoir rocks. Limestone reservoirs are in the uppermost Coahuilan (Pettet Formation) and the Comanchean Series (James, Rodessa, Bacon, Hill, Undifferentiated Trinity limestones, upper Glen Rose and Edwards Formations). No productive limestones have been found in Cenozoic sedimentary rocks.
The thicknesses of the producing zones range from 2 ft (1m) in the Woodbine and Rodessa Formations to 1,314 ft (401 m) in the Travis Peak (Rusk) Formation. The average thicknesses (161 ft or 49 m) of the Travis Peak Formation are significantly higher than that of the James Formation (72 ft or 22 m) and other producing intervals in the play (Table 3).
Porosities of the reservoirs range from a low of 5.5 percent in the Pettet Formation to a high of 32.0 percent in the Wilcox Undifferentiated productive zone. The permeabilities range from a minimum field average of 0.1 md to a maximum of 5,900.0 md (Table 3).
Structures and seals. Of the 24 salt domes in the play area, 18 salt domes are productive. Anticlinal structures over salt pillows and turtle structures are also productive. The sedimentary strata overlying the salt pillow generally are concordant with the top of the salt. Turtle structures, as previously noted, have anticlinal closures that result from salt withdrawal on all four sides, thereby causing subsidence on the periphery of the
86
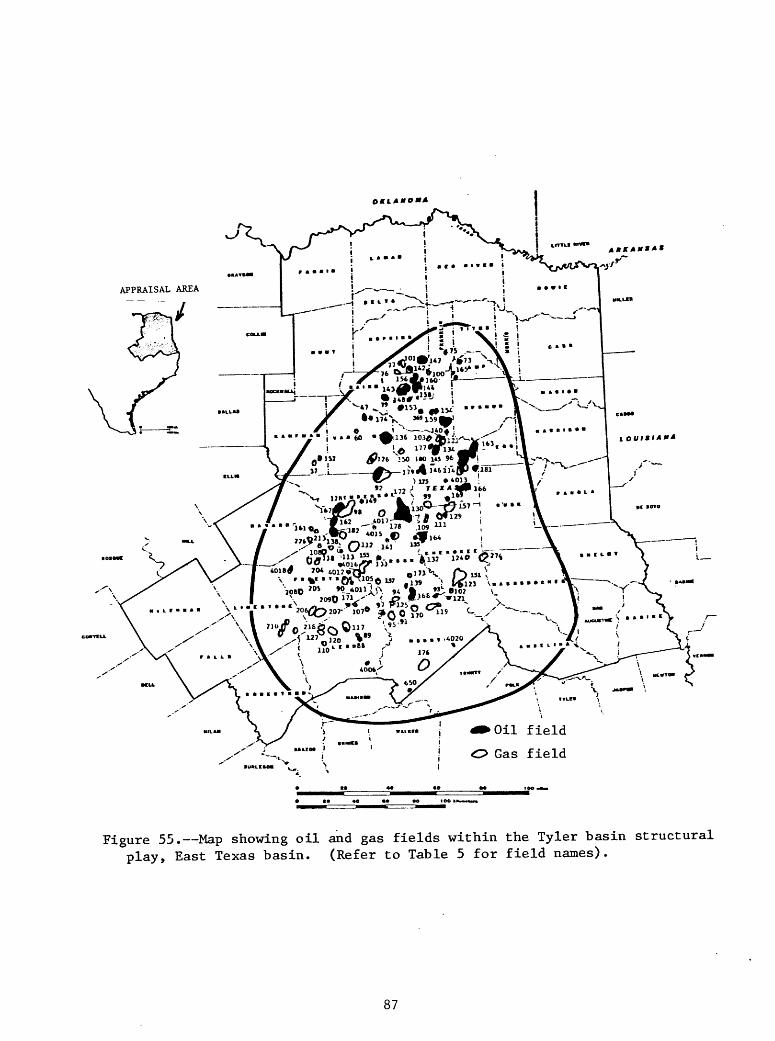
APPRAISAL AREA
,7
field
O Gas field
Figure 55. Map showing oil and gas fields within the Tyler basin structural play, East Texas basin. (Refer to Table 5 for field names).
87

structure (Jackson and Seni, 1984). Additional productive traps are anticlines, faulted anticlines, and complex graben-fault traps associated with salt tectonics deeper within the basin.
After the Louann Salt deposition, Late Jurassic, Cretaceous, and Early Cenozoic sediments filled the basin, prograding toward the basin center from the west, north, and east. These sediments formed large deltas and associated depositional environments in which dense limestones, anhydrites, and shales act as seals to the underlying sandstones and limestones-dolomite reservoirs.
Source rocks and geochemistry. The most logical petroleum source rocks in the deeper strata are dark limestones of the lower Smackover Formation, Cotton Valley shales, and the dark-colored organic-rich Bossier shales (Presley and Reed, 1984; Moore, 1984). During deposition of Early Cretaceous sediments, the shoreline was constantly shifting. When the bordering land had been peneplaned and subsidence continued in the basin, the sea advanced and clays, marls, and carbonates were deposited over the regressive sands. In periods of basinal downwarp, large deltaic depocenters developed and sand and shale graded basinward into shale and carbonates. These habitats, occur in the Travis Peak/Rusk Formation, Rodessa Formation, Ferry Lake Anhydrite, and Paluxy Formation and are suitable for the formation and preservation of petroleum.
At the start of the Gulfian Series, the basin received siliciclastic sediments of the Woodbine Group. Basinal shales in these series of sediments serve as petroleum source rocks for reservoir rocks from Woodbine (Lewisville and Dexter Sandstones) up to the Nacatoch Sandstone. Additional petroleum source beds are marine shales, chalks, and marls of the Eagle Ford, Austin, Taylor, and Navarro Groups.
As noted in the discussions of the N. E. Texas basement structures, the Mexia/Talco fault system, and the N. E. Texas salt anticlines plays, the thermal history of Upper Jurassic strata in the East Texas basin is conducive to generating crude oil, with subsequent thermal conversion to natural gas.
The ranges of temperatures/depths for oil-generation, of the thermal-gas generation by conversion of crude oil, and the depth to the peak zone of petroleum formation of Cretaceous sedimentary rocks has been discussed in an earlier section of this report. Significantly higher values in the geothermal gradient are encountered in Eocene strata in the vicinity of salt domes in the East Texas basin and these high temperature gradients extend downward. Subsurface fluid temperatures of 300 F (149 C) or more are common at depths of 13,000 ft (3,962 m).
Timing and migration. The timing of salt movement seems to have played a significant role in trapping oil and gas in the Tyler basin and probably had a profound influence on both the timing and migration pathways of the hydrocarbons. Three groups of salt domes have been recognized, as discussed previously, based on the time that the diapirs first pierced their overburden. Each group of salt domes pierced the overburden either in Early Cretaceous, mid-Cretaceous, or Late Cretaceous. Therefore, the movement of salt, beginning with the formation of salt swells and anticlines in Late Jurassic, has caused tilting, fracturing and bending of strata over a relatively long period of geologic time (that is, well into the Tertiary Period). Because of the large number of salt structures, the cumulative effect of this bending, fracturing and tilting on the timing and migration of hydrocarbons is difficult to assess. However, a significant effect can be surmised based upon
88

the number of productive salt structures, the number of reservoirs in these structures and the wide span of geologic ages of the reservoirs.
The presence of dead oil in the voids of some reservoir rocks suggests that oil migration occurred prior to the existence of the trap, but after there was effective porosity. Hydrocarbons arrived in reservoirs after an early, pre-compaction cementation event, but before the later, deeper subsurface cements were precipitated. The presence of commercial quantities of natural gas also suggests a second stage of hydrocarbon migration involved thermal gas generated by conversion of oil in deeper horizons or age-equivalent sediments downdip. Structural movement aided the accumulation of oil and gas in Upper Gulfian, such as crude oil migration from the Woodbine Group traps. In other cases, such as in the Hainesville Salt Dome, regional tilting of the strata allowed accumulated oil and gas to escape updip.
Depth of occurrence. The average depths to the top of the shallowest and deepest reservoirs in the play are 420 ft (128 m) for the Carrizo Formation in Camp Hill Field and 10,624 ft (3,238 m) for the Travis Peak (Hosston) Formation in the LaRue Field, respectively. The average depth to the top of all reservoirs in the play is 7,108 ft (2,167 m).
Exploration status. The initial oil field discovery in the play was in 1927 (Boggy Creek Field), followed by the giant (and scientifically interesting) Van Field in 1929; the latest discovery was the Alabama Ferry Field (1983) (fig. 49). The first gas field discovery was in 1933 (South Buffalo Field), with the latest field being found in 1985 (Green Acres Field) (fig. 50). The first field classified as neither oil nor gas was found in 1944 (Fruitvale Field) and the latest field of this type was discovered in 1982 (Driskell Lake Field) (fig. 51). The play consists of 62 oil fields, 57 gas fields, and 5 fields classified as neither oil nor gas. The largest oil and gas fields and their known recoverable hydrocarbons are the Hawkins Field (825 MMBO) and the Opelika Field (870 BCFG), respectively. The known recoverable hydrocarbons in the play are 2,471.679 MMBO, 7,011.090 BCFG, and 334.861 MMBL (Table 4).
Tyler basin Woodbine - Eagle Ford play
Play description and type. The Tyler basin Woodbine-Eagle Ford play is an elongate area extending from Marion and Upshur Counties on the west flank of the Sabine uplift southwestward to Brazos and Grimes Counties (fig. 56). The play is about 190 mi (306 km) in length and varies in width from about 25 mi (40 km) on the north end to about 40 mi (64 km) on the south side. The reservoirs in this play are predominantly oil prone; small amounts of natural gas are associated with the crude oil, but NGL's are not present. The API gravities of the liquid hydrocarbons vary from 36.0 to 40.0 and average 37.2 (Table 3). The reservoirs are predominantly oil prone, but 2 fields (Lone Star and Leona) have approximately 2.5 BCFG each. The East Texas and Kurten Fields have been excluded from this play, as noted earlier; these two fields will be addressed later in this report.
Reservoirs. The reservoir rocks in this play are sandstones (9 primary reservoirs) of the Woodbine and Eagle Ford Groups. One secondary reservoir is a productive shale zone. The producing strata are the Woodbine Sandstone and the Lewisville and Dexter Sandstone Members. Natural gas is produced from fine-grain sandstones in the Sub-Clarksville Formation. The reservoir rocks
89

OKLAHOMA
Oil field
Gas field10 40
Figure 56. Map showing oil and gas fields within the Woodbine-Eagle Ford play, East Texas basin. (Refer to Table 5 for field names).
90

were deposited as part of the four principal deposition environments of the Woodbine Group described earlier (Oliver, 1970). In the north end of the play, the new Diana and Pleasant Grove Fields produce from the Dexter Sandstone which was deposited in a deltaic environment. To the south, the sedimentary rocks were deposited in marine environment and become younger in age, ranging from Lewisville Formation up to Sub-Clarksville Formation. The thicknesses of the pay zone ranges from 5 ft (2m) to 38 ft (12 m) and averages 14 ft (4 m). The porosities of the reservoirs are excellent, ranging from 25.0 percent to 27.4 percent (average porosity equals 26.0 percent), except the fine-grained sandstone of the Sub-Clarksville Formation which has average reservoir porosities of 17.6 percent. Permeabilities of the Woodbine and Dexter Formations vary from 15.0 md to 1,500.0 md and average 570.1 md.
Traps and seals. The New Diana Field is a stratigraphic trap in which the truncated Dexter Sandstone, the reservoir rock, is overlain by the Austin Chalk or Eagle Ford Shale. The Austin Chalk, or Eagle Ford Shale forms, on a local basis, the reservoir seal (Galloway and others, 1983). The other fields in this play are structural-stratigraphic traps sealed by Austin Chalk-Eagle Ford Shales.
Source rocks and geochemistry. At the start of the Gulfian Series, the East Texas basin received siliciclastic sediments of the Woodbine Group from a large delta system located on the northeast end of the East Texas basin. The Woodbine Group consists of alternating sandstones and shales, which grade basinward into marine shales that are potential petroleum source beds. Following deposition of the Woodbine Group, the remainder of the Gulfian Series rocks alternated between sandstones (reservoir rocks), time-equivalent marine shales (petroleum source beds), and chalks-marls (petroleum source beds and seals). Producing units in the Eagle Ford Group are sandstones with interbedded shales (seals); the hydrocarbons may be generated in and migrated from the overlying Austin Chalk.
The ranges of temperatures/depths for oil-generation in Cretaceous sediments in this part of the basin are about 165° (74° C)/7,000 ft (2,134 m) to 220° F (104° C)/ll,000 ft (3,353 m). The thermal-gas generation by conversion of crude oil extends from the latter temperature/depth to 245 F (118° C)/12,500 ft (3,810 m). Although hydrocarbon generation can begin at about 2,000 ft (610 m) of burial, the peak zone of petroleum formation is between 6,000 ft and 8,000 ft (1,829 m to 2,438 m). However, as noted by Conti (1982), the crude oils may have generated at shallower depths than those predicted by current theory.
Timing and migration. The timing of hydrocarbon migration into some East Texas fields is not completely certain. Early migration of hydrocarbon is suggested because three major fields (East Texas, Van, and Opelika) were in place by Austin Chalk. The Kelsey anticline, a trap in the same region that is dry in the Woodbine Sandstone, did not start to form until Wilcox/Eocene (Russell, 1951), presumably after the hydrocarbon migration. Because of the significant quantities of hydrocarbons in the East Texas Field, substantial migration from petroleum source beds in the basinal areas must have occurred.
Depth of occurrence. The average depths to top of the shallowest and deepest producing zones are 3,672 ft (1,119 m) (West Good Springs Field), and 8,404 ft (2,562 m) Mapleton Field, respectively (Table 3). The average depth to the top of the producing zones in the play is 4,878 ft (1,487 m).
91

Exploration status. The first field (Lone Star Field) was found in 1938; it is classified as neither oil nor gas, as is the Mapleton Field found in 1964. The first oil field, the Pleasant Grove Field, was found in 1941; the last (and fifth) oil field (West Good Springs) was found in 1970). One gas field (West Douglas Field) was discovered in 1967). There are 5 oil fields and 1 gas field in the play; 2 fields (Lone Star and Mapleton Fields) are classified as neither oil nor gas (figs. 49, 50, 51). Known recoverable hydrocarbons in the play are 22.232 MMBO, 7.737 BCFG, and no NGL's. The largest field is the New Diana Field, with known recoverable hydrocarbons in the play of 11.9 MMBO and 1.05 BCFG. Some non-associated gas is produced from the Sub-Clarksvilie Formation in the south end of the play.
West Tyler basin Cotton Valley play
Play description and type. The West Tyler basin Cotton Valley play is an elongate area on the southwest flank of the East Texas basin (fig. 57). The play is about 100 mi (161 km) long, extending from Van Zandt County southwestward to Robertson County, and about 40 mi (64 km) wide in the Limestone-Leon Counties area. The reservoirs are predominantly gas prone; dry gas is present in some reservoirs which are deep and which have high reservoir temperatures. The API gravities of the liquid hydrocarbons vary from 36.0 to 62.0 and average 54.4 for the play.
Reservoirs. The reservoir rocks are oolitic limestones, generally of lagoonal bar beds and grainstone lens types, and sandstones. The lithologies and the number of primary reservoirs are: limestones: 25 and sandstones: 9. Sandstones form 6 secondary reservoirs and limestone forms 1 secondary reservoir.
On the western edge of the basin, a narrow carbonate shelf trend consists of Cotton Valley age shallow lagoonal facies that grade into evaporites and red beds to the west. Reservoirs along the shelf edge, which are grainstones or boundstones (Presley and Reed, 1984), have high porosities (18 percent to 27 percent) and high subsurface pressures. Permeabilities are from 1.1 md to 12.0 md and average 2.5 md (Table 3).
Just shoreward of the Cotton Valley age shelf edge, there is a narrow trend of fractured wackestone reservoirs associated with the hingeline and caused by basinal subsidence. The reservoirs in this trend have primary porosities of 8% or less, with much of the porosities occurring in fractures associated with the structures (Presley and Reed, 1984).
Well developed grainstone facies in the Haynesville Formation were deposited with interbedded anhydrite and supratidal muds in elongate strike-trending belts several miles long along upper shoreface of the Haynesville shelf. These grainstones are often associated with deeper salt and basement structures and have reservoir porosities ranging from 3.0 percent to 20.0 percent and averaging 9.0 percent (Table 3). Reservoir porosities vary from 0.1 md to 3.0 md and average 1.6 md (Table 3).
Thin sandstone or siltstone beds are present in thick intervals of Bossier Shale. The sandstones of the Bossier Formation are thought to be coarse-grained facies of a submarine fan system that was deposited along the margins of the Bossier marine basin. The sediment supply was from fluvial-deltaic and/or barrier systems and submarine fans developed on the prodelta face of the Cotton Valley (Shuler) shoreline (Presley and Reed, 1984). The Bossier Sandstone appears to be deposited in structural troughs between Smackover and Haynesville structurally high areas, with the
92

APPRAISAL AREA
Oil field
Gas field
ie_______go
t> w «o «o
Figure 57. Map showing oil and gas fields within the West Tyler basinCotton Valley play, East Texas basin. (Refer to Table 5 for field names).
93

paleobathymetry following the structure. The average porosities and permeabilities tend to be small values, ranging in the 10.1 percent to 11.0 percent (average equals 10.6 percent) and 0.01 to 0.02 md (NRG Associates, 1985), respectively. The drive mechanisms are pressure depletion and, to a lesser degree, gas expansion (Denny and others, 1984).
Trapping mechanisms and seals. The nature of the traps are structural (easily recognizable and subtle anticlines), combination traps (porosity pinchouts on structural noses and on the crests of anticlines), and stratigraphic traps in which the reservoirs (oolite shoals) are enclosed by mudstones. Porosity variations in the reservoir rocks are the most critical elements in most fields of this play.
The reservoir seals are densely compacted, highly impermeable limestones and mudstones. In some fields, the mudstone completely encloses the reservoir rocks (Denny and others, 1984).
Source rocks and geochemistry. Potential petroleum source rocks for hydrocarbons in this play are shales and mudstones that underlie, overlie, or enclose the Cotton Valley reservoirs (Presley and Reed, 1984). Other potential source beds are limestones and shales of older sedimentary rocks, such as the Smackover Formation and, less likely, the Norphlet Formation.
Bottom hole temperatures in wells penetrating Cotton Valley Group sedimentary rocks encounter high temperatures. Representative temperatures in Cotton Valley Formations range from 250° F to 350° F (121° C to 178°) at 14,300 ft (4,359 m) (Denny and others, 1984). These high temperatures are consistent with the fluid pore pressure gradients that range from 0.43 to 0.59 psi/ft (the mean is 0.50 psi/ft) in the basin. High subsurface temperatures and deep burial for long periods of time favor the thermal alteration of crude oil into natural gas, and into the dry gas stage.
Depth of occurrence
The depths to the top of the shallowest and deepest producing horizons are 9,222 ft (2,811 m) (Cotton Valley Formation, Denny Field) and 16,380 ft (4,993 m) (Cotton Valley Formation, Butler Field), respectively. The average depth to the top of all producing zones in the play is 11,580 ft (3,530 m).
Exploration status
The first gas field discovered in this play was the Steward Mill Field in 1943; the last gas field discovery (Branton Field) was in 1981 (fig. 50). Two oil fields, Reka Field and Cheneyboro Field, were found in 1953 and 1978, respectively (fig. 49); one field, Southwest Cheneyboro Field, which is classified as neither oil nor gas, was discovered in 1979 (fig. 51). The Southwest Cheneyboro Field has known recoverable hydrocarbons of 5.40 BCFG and 0.230 MMBL. The West Tyler basin Cotton Valley play has 31 gas fields, ranging in sizes of recoverable hydrocarbons from 240.0 BCF (North Personville Field) to 6.9 BCF (Denny Field). The known recoverable quantities of hydrocarbons in the play are 3.00 MMBO, 1,169.992 BCFG, and 5.604 MMBL (Table 4).
94

Sabine uplift gas play
Play description and type. The Sabine uplift gas play lies over the Texas part of the Sabine uplift (fig. 58). The play extends about 180 mi (290 km) in an east-west direction from eastern edge of the synclinal axis of the East Texas basin to Louisiana state line and about 110 mi (177 km) in a north-south direction from the south flank of the Sabine uplift to the synclinal area south of the Talco fault zone. The play is predominantly gas prone, but 4 oil fields have been found. With the exception of some crude oil produced from the Travis Peak Formation, the API gravities of liquid hydrocarbons, which are principally NGL, are high values (from 41.0 to 66.0°), averaging 49.6° for the play (Table 3).
Reservoirs. Limestone reservoir rocks are in the Haynesville and Cotton Valley Formations. Sandstones reservoir rocks are in the Bossier, Haynesville, Taylor (Cotton Valley), and Hosston (Travis Peak) Formations. Limestone and sandstone are the lithologics of 12 and 62 primary reservoirs, respectively. Secondary reservoir rocks are limestones (2), dolomite (1), and sandstone (1).
Reservoirs in the Haynesville Formation, which occur on the western and southwestern flank of the Sabine uplift, are oolite grainstones with typical porosities of 10 percent and permeabilities of about 0.3 md. The porosities developed from leaching, range from about 8 percent to 16 percent (Presley and Reed, 1984).
Sandstones of the Cotton Valley Formation on the Sabine platform are of generally low porosities and permeabilities and are interbedded with gray to black shales. Presley and Reed (1984) state that gas-bearing Cotton Valley Sandstones can be found over most of the Sabine platform, but commercial quantities of hydrocarbons are generally dependent on multiple sandstone horizons with adequate porosities. Westcott (1984), Clawson (1984), and Hall and others (1984) have noted that porosity has been reduced by carbonate cementation, quartz overgrowth, and authigenic clay development; porosity has been enhanced by dissolution of feldspar and rock fragments.
Sandstones of the Bossier Formation are thin strata or siltstone beds in thick intervals of Bossier Shale. Horizontal and vertical facies change to dense shales, forming stratigraphic traps which commonly produce gas under high pressure (Presley and Reed, 1984).
The Cotton Valley Limestone, also known as the Haynesville, Massive Cotton Valley, and the Gilmer Limestone is a massive finely crystalline, oolitic limestone that underlies the Bossier Shale and overlies the Buckner-Smackover facies (Ahr, 1981). The Cotton Valley Limestone is an important gas reservoir rock that forms an arc surrounding the western and southern Sabine uplift. The oolitic limestone reservoir beds are erratically developed in the top 300 ft of the lower Cotton Valley limestone sequence, have hairline fractures that contribute significantly to increased productivity, and have unpredictable porosity because of the variability of calcite in the pore spaces (Collins, 1980).
Trapping mechanisms and seals. The trapping mechanisms are structural, stratigraphic, and combination traps. The structures on the western crest and west flank of the Sabine uplift are broad and gently sloping. Low relief closures provided structural traps for some hydrocarbon accumulations. Stratigraphic traps are found in carbonates of low porosity and low permeability sandstones which are interbedded with shales that serve as seals.
95

Oil field
O Gas field
t» « M «e
Figure 58. Map showing oil and gas fields within the Sabine uplift gas play, East Texas basin. (Refer to Table 5 for field names).
96

Combination traps are more numerous and result from facies changes across structural noses. Typical trapping mechanisms are found in: South Hallsville Field - lenticular sandstone pinchout across a structural nose; North Henderson Field - broad structural high with low permeability sandstone reservoir rocks; Oak Hill Field - closure on structural nose; and, Overton Field - stratigraphic trap on structural nose (Denny and others, 1984).
Source rocks and geochemistry. The deepest petroleum source rocks for the reservoir in this play are the dark limestones of the lower Smackover Formation, which occur within and around the basin margins. The dark-colored organic-rich Bossier Shale in Texas and Louisiana onlaps the Smackover/ Haynesville Formations along the basin margin and partway across the shelf and may be a source rock (Moore, 1984). Shales and mudstones that surround, underlie, or overlie the Cotton Valley Sandstones are local petroleum source beds and are considered the most likely source of the hydrocarbons (Presley and Reed, 1984).
Depth of occurrence. The average depths to the top of the shallowest and deepest reservoirs are 5,836 ft (1,779 m) (Bethany Area Field) and 12,012 ft (3,661 m) (Overton Field). The average depth to the top of all reservoirs in the play is 8,528 ft (2599 m).
Exploration status. The first oil field (East Linden Field) in the play was discovered in 1959 (fig. 49). The first and last gas discoveries were the Bethany Area Field (1916) and the West Minden Field (1981) (fig. 50). The Bethany Field is also the largest gas field in the play with known recoverable quantities of 43.910 MMBO, 1,740.000 BCFG, and 25.050 MMBL. Four fields, classified as neither oil nor gas, were found in 1964 (East Henderson Field), 1976 (Stockman Field) 1976, 1981 (Mings Chapel) and 1984 (Lotta Field) (fig. 51). There are 4 oil fields, 53 gas fields, and 4 fields considered as neither oil nor gas in the play (NRG Associates, 1985). The known recoverable hydrocarbons in the play are 41.969 MMBO, 6,116.734 BCFG, and 98.214 MMBL (Table 4).
Sabine uplift oil play
Play description and type. The Sabine uplift oil play covers the western crest and west flank of the Sabine uplift (fig. 59). The oil play extends a greater distance down the southwest and south flank of the Sabine uplift than the Sabine uplift gas play. The play is considered as an oil play, but the largest gas field in east Texas (Carthage Field with known recoverable quantities of 17.70 MMBO, 7,500.00 BCFG, and 221.00 MMBL) is included. The Carthage Field and other gas fields are grouped with the oil fields because the stratigraphic intervals of the producing reservoirs are more consistent with those of oil production than with the producing intervals in the gas play. With the exceptions of production from the Saratoga and Nacatoch Formations, the liquid hydrocarbons are of relatively high API gravities, ranging from 36.3 to 69.0 (average is 49.2°) (Table 3).
Reservoirs. The reservoir rocks in the play are mostly carbonates and, to a lesser degree, sandstones. The lithologies and the numbers of primary reservoirs are: limestones-70; sandstones-20; anhydrite-1; and, chalk-1. The lithologies and the numbers of secondary reservoirs are: limestones-5; sandstones-7; and, shales-2. The ages and the numbers of reservoirs are:
97

APPRAISAL AREA
«0il field
OGas field
> *o i oe i
Figure 59. Map showing oil and gas fields within the Sabine uplift oil play, East Texas basin. (Refer to Table 5 for field names).
98

Trinity Group: 88; Fredericksburg Group: 1; Austin Group (Blossom Formation): 1; and, Navarro Group: 2.
The Early Cretaceous reservoir rocks from the Pettet Formation to the Rodessa Formation consist of shallow open shelf deposits of oolitic and skeletal limestones, and sandstones of delta plain and transitional environments. Reservoir porosities and permeabilities range from 5.6 percent to 25.0 percent and 0.3 md to 40.90 md, respectively. Pay zone thicknesses for these reservoirs range from 7 ft (2 m) to 91 ft (28 m).
The Rodessa Formation and the age-equivalent Mitchell, Gloyd, and Hill Formations are carbonate and clastic strata deposited in shallow open shelf environments. High grain skeletal carbonates of the shelf margin-shallow open shelf trend are very porous and permeable because of extensive leaching (Bushaw, 1968). Porosities and permeabilities range from 12.0 percent to 21.8 percent and from 4.4 md to 20.00 md, respectively.
Shallower production is obtained from 10 reservoirs in Glen Rose, Paluxy, Fredericksburg, Undifferentiated, Blossom, Saratoga, and Nacatoch Formations. These reservoirs are carbonate and clastic lithologies and are scattered about the play area. Information about the reservoir characteristics is sparse, but thicknesses of the pay zones are above average.
Trapping mechanisms and seals. The trap types are primarily combination traps, with structural components (closure against faults, anticlines, faulted anticlines, and faulted structural arches), and facies changes influencing the entrapment of hydrocarbons in most reservoirs. The structures are broad and gently sloping, with dips on the strata of less than a few degrees from horizontal. The broad platform area contains several structural terraces with the terraces underlying the regions covered by the large oil and gas fields (Presley and Reed, 1984). The sandstones reservoirs grade laterally and vertically in dense shales which serve as seals.
Source beds and geochemistry. Oil and gas were probably generated for this play from petroleum source beds ranging in age from Upper Jurassic to Late Cretaceous. These strata include: dark limestones, mudstones and shales of the Upper Jurassic; organically rich clays, shales and lime mudstones of Early Cretaceous; and organically rich shales, clays, and chalks of Late Cretaceous.
Depth of occurrence. The average depths to the top of the shallowest and deepest reservoirs are 990 ft (302 m) (Nacatoch Formation, Bethany Area Field) and 9,083 ft (2,768 m) (upper Pettet Formation, Southwest Douglass Field). The average depth to the top of all reservoirs in the play is 6,287 ft (1,916 m).
Exploration status. The first discovery in the play was the Carthage Field in 1936; the most recent gas field discovery was in 1984 (East Rosborough Springs Field). The first oil field was found in 1942 (Kildare Field, fig. 12) and the most recently discovered oil field is the Taliaferro Field in 1982. The Kildare Field is the largest oil field with known recoverable quantities of 16.0 MMBO, 58.8 BCFG, and 2.06 MMBL.
The play consists of 16 oil fields, 46 gas fields and 6 fields are classified as neither oil nor gas fields (figs. 49, 50, 51). The known recoverable hydrocarbons in the play are 167.756 MMBO, 10,226.810 BCF, and 620.000 MMBL (Table 4). The hydrocarbons are in an advanced stage of depletion (assuming no additional enhanced recovery techniques are applied)
99

with proven reserves remaining to be produced: crude oil - 11 percent; natural gas - 11 percent; and, NGL - 3 percent.
East Texas - Kurten Fields
Description and type. The East Texas and Kurten Fields are located on the west flank of the Sabine uplift and on the downdip (southwest) side of the Woodbine Group depositional systems (Oliver, 1970), respectively (fig, 60), The outline of the area between these two fields is essentially the same as the Tyler basin Woodbine-Eagle Ford play (fig. 56); the Kurten Field lies outside the appraisal area of the East Texas basin. The Kurten and East Texas Fields are treated separately in the resource appraisal because of their unique trapping mechanisms and sizes of known recoverable hydrocarbons. In the case of the East Texas Field, the known recoverable hydrocarbons are so large that they distort the statistical averages of the other fields. The East Texas Field is most noted as an oil field, however, it also yields significant quantities of natural gas and NGL. The Kurten Field yields only crude oil and, to date, no natural gas or NGL has been produced.
Reservoirs. The East Texas Field is composed of truncated deltaic Dexter Sandstone unconformably overlain by the Austin Chalk and locally by Eagle Ford shale. The production is largely from strike-oriented sandstones. The reservoir is a westward-dipping and thickening sandstone wedge in which net-sandstone thickness increases to the west. The thickness of the oil sandstone averaged 38 ft (12 m) and range from 0 ft (0 m) to 115 ft (35 m). Porosities and permeabilities average about 25 percent and 1,300 md, respectively. Permeability is greater in the north end of the field than in the south end (Galloway and others, 1983).
The reservoir rocks in the Kurten Field appear to be thinly bedded, clayey mudstones of the Woodbine-Eagle Ford Formations. These sandstones are offshore bars which have been formed by a combination of river mouth by-passing, storm-surge turbidity flows, and longshore currents. The porosity is largely diagenetic and occurs in the clayey beds as a result of fresh-waters leaching along an erosional unconformity overlain by the Austin Chalk. The average reservoir thicknesses for the Woodbine and Buda Formations are 38 ft (12 m) and 33 ft (10 m), respectively. The reservoir rocks are characterized by low porosity, low permeability, and high clay control. Porosities range from about 6 percent to 14 percent, and average about 9.3 percent. Permeabilities range from less than 0.01 md to 2.6 md (Turner and Conger, 1981).
Trapping mechanisms and seals. The East Texas Field is a classical stratigraphic trap in which the Woodbine reservoir rock has been truncated and then unconformably sealed by the overlying Austin Chalk. The trap and seal of this field have been discussed in the literature for many years and will not be addressed here. These two subjects are addressed in detail in articles and publications by Galloway and others (1983), Halbouty and Halbouty (1982), Hudnall (1951), Oliver (1970, 1971), and Russell (1951).
The Kurten Field is a stratigraphic-diagenetic trap in which the reservoir rocks become impermeable below and away from the overlying unconformity. The updip limits of the field are at the permeability barrier formed at the limit of fresh-water leaching of the sandstones that enhanced the porosity (Turner and Conger, 1981).
100

OKLAHOMA
AKKAKtA*
( » i j r \ i w
11 field
CPGas field
0 10 100 I
Figure 60. Map showing East Texas-Kurten Fields, East Texas basin. (Refer to Table 5 for field names).
101
Source rock and geochemistry. From the axis of the East Texas basin in an eastward direction, the Eagle Ford Shale overlies the Woodbine Sandstones until it disappears because of truncation. In an easterly direction across the field, the Woodbine Sandstones are progressively eroded from top to bottom so that only the basal sands occur on the east side of the field. The Eagle Ford Shale is considered by many to be the petroleum source rock for the East Texas Field and other Woodbine Formation reservoirs in the area (Halbouty and Halbouty, 1982). Because of the organically rich basinal shales in the Eagle Ford Formation and the large areas available for drainage, unusually large quantities of hydrocarbons must have been generated and migrated eastward out of the basin.
Timing and migration. As noted in the studies by Russell (1951) and Halbouty and Halbouty (1982), the hydrocarbons migrated after the Austin Chalk seal was in place over the East Texas and Kurten Fields. Long distance migration probably accounted for at least part of the hydrocarbons in the East Texas Field. However, migration of a more local nature probably occurred in the Kurten Field.
Depth of occurrence. The average depth to the top of the reservoir rocks in the East Texas Field is 3,592 ft (1,095 m). The average depth to the top of the Woodbine and Buda reservoirs in the Kurten Field are 8,204 ft (2,501 m) and 8,870 ft (2,704 m) respectively.
Exploration status. The East Texas Field was discovered on October 3, 1930 and this event set off drilling activity which has not since been equalled. Drilling activities continue to this date, but for many years, the drill holes have been mostly in downdip parts of the reservoir and have been focused on enhanced recovery. The known recoverable hydrocarbons are 5,450.000 MMBO, 1,500.000 BCFG, and 620.000 MMBL.
The Kurten Field was discovered in 1976 and the producing area now covers almost 100 sq mi (259 sq km). The known quantities of recoverable hydrocarbons reported by NRG Associates (1985) are 32.000 MMBO; 54.000 BCFG, and 2.320 MMBL. These quantities of recoverable hydrocarbons are substantially less than the reserve figures of up to 100 MMBO reported by Turner and Conger (1981).
102

REFERENCES
Agagu, 0, K., and others, 1980, Regional structures and sedimentation in the East Texas salt dome area: Geological Society of America Abstracts with Programs, v. 12, no. 1, p. 1.
Ahr, W, M,, 1981, The Gilmer Limestone: Oolite tidal bars on the SabineUplift: Gulf Coast Association of Geological Societies Transactions, v. 31, p. 1-6.
AAPG, 1988, COSUNA - Gulf Coast Regional Correlation Chart: AmericanAssociation Petroleum Geologists, Jules Braunstein, Paul Huddleston, and Ralph Biel, regional coordinators, 1 chart,
Antoine, J. W., and others, 1974, Continental margins of the Gulf of Mexico, in Burk, C. A,, and Drake, C. L., eds., The geology of continental margins: New York, Springer, Verlag, p. 683-693.
Aubrey, J. C., 1984, Recent Jurassic discoveries in southeastern Cass County, Texas: Gulf Coast Association of Geological Societies Transactions, v. 34, p. 445-452.
Baker, E. T., Jr., 1963, Ground water geology of Grayson County, Texas: U.S. Geological Survey Water Supply Paper 1646, 61 P.
Barton, R. A., 1982, Contrasting depositional processes of Sub-Clarksville and Woodbine Reservoir Sandstones: Gulf Coast Association of Geological Societies Transactions, v. 32, p. 121-136, 15 figs.
Bebout, D. G., and Loucks, R. G., 1974, Stuart City trend, Lower Cretaceous,South Texas: a carbonate shelf-margin model for hydrocarbon exploration: Bureau of Economic Geology, University of Texas, Austin, Report of Investigation No. 78, 80 p.
Bebout, D. G., and others, 1981, Depositional and diagenetic history of the Sligo and Hosston formations (Lower Cretaceous) in South Texas: Bureau of Economic Geology, The University of Texas at Austin, Report of Investigation No. 109, 70 p.
Berg, R. R., 1970, Claiborne outcrops in the Brazos Valley, southeast Texas: Geological Society of America South Central Section fieldguide, Texas A&M University, 79 p.
Berg, R. R., and Leethman, J. T., 1985, Origin of Woodbine-Eagle Ford reservoir facies, Kurten Field, Brazos County, Texas: Gulf Coast Association of Geological Societies Transactions, v. 35, p. 11-18, 12 figs.
Bishop, W. F., 1973, Late Jurassic contemporaneous faults in north Louisiana and south Arkansas: American Association of Petroleum Geologists Bulletin, v. 57, p. 858-877.
103
Braunstein J., Hartman, J. A., Kane, B. L., Van Amringe, J. H., 1973, Offshore Louisiana oil and gas fields: New Orleans and Lafayette Geological Societies, 124 p.
Bryant, W. R., and others, 1969, Escarpments, reef trends, and diapiricstructures, eastern Gulf of Mexico: American Association of Petroleum Geologists Bulletin, v. 53, p. 2506-2542.
Budd, D. A., and Loucks, R. G., 1981, Smackover and lower Buckner formations, south Texas: Depositional systems on a Jurassic carbonate ramp: The University of Texas at Austin, Bureau of Economic Geology, Report of Investigation No. 112, 38 p., 26 figs., 3 tables.
Bushaw, D. J., 1968, Environmental synthesis of the East Texas LowerCretaceous: Gulf Coast Association of Geological Societies Transactions, v. 18, p. 416-438, 14 figs.
Caughey, C. A., 1977, Depositional systems in the Paluxy Formation (Lower Cretaceous), Northwest Texas - Oil, Gas, and Groundwater Resources: Bureau of Economic Geology, The University of Texas at Austin, Geological Circular 77-8, 59 p., 27 figs., 4 tables.
Clawson, C., 1984, Henderson North Field, Cotton Valley Sandstone, in Presley, M. W. (ed.) The Jurassic of East Texas: East Texas Geological Society and East Texas Jurassic Exploration Conference, Tyler, Texas, March 27- 28, 1984, p. 264-265.
Collins, S. E., 1980, Jurassic Cotton Valley and Smackover Reservoir Trends, East Texas, North Louisiana, and South Arkansas: American Association of Petroleum Geologists Bulletin, v. 64, no. 7, p. 1004-1013, 3 figs.
Conti, R., 1982, Stratigraphic distribution of hydrocarbon with differing API gravities in the East Texas basin: Gulf Coast Association of Geological Societies Transactions, v. 32, p. 199-204, 9 figs.
Cregg, A. K., and Ahr, W. M., 1983, Depositional framework and reservoir potential of an Upper Cotton Valley (Knowles Limestone) Patch Reef, Milam County, Texas: Gulf Coast Association of Geological Societies Transactions, v. 33, p. 55-68, 12 figs.
Curtis, D. M., 1988, Petroleum geology of the northern Gulf of Mexico basin in Taylor, R. B., Rice, T. D., and Gluskoter, M. K. (eds.), Economic Geology; U.S.: Geological Society of America, Geology of North America, v. P2.
Davis, D. K., and Ethridge, F. G., 1971, Claiborne Group of central Texas: A record of middle Eocene marine and coastal plain deposition: Gulf Coast Association of Geological Societies Transactions, v. 21, p. 115-124, 10 figs.
Denney, J. H., Jr., and others, 1984, Field Reports, _in_ Presley, M. W. (ed.), The Jurassic of East Texas: East Texas Geological Society, East Texas Jurassic Exploration Conference, Tyler, Texas, March 27-28, 1984, p. 240-291.
104
Dickinson, K. A., 1969, Upper Jurassic carbonate rocks in northeastern Texasand adjoining parts of Arkansas and Louisiana: Gulf Coast Association of Geological Societies Transactions, v. 19, p. 175-187, 8 figs., 2 tables.
Dolton, G. L., and others, 1981, Estimates of undiscovered recoverable conventional resources of oil and gas in the United States: U.S. Geological Survey Geological Circular 860, 87 p.
Dorman, J., and others, 1972, Crustal section from seismic refractionmeasurements near Victoria, Texas: Geophysics, v. 37, no. 2, p. 325-336.
Dow, W. G., 1978, Petroleum source beds on continental slopes and rises:American Association of Petroleum Geologists Bulletin, v. 62, P. 1584- 1606.
Button, S. P., Finley, R. J., and Herrington, K. L., 1987, Organicgeochemistry of the Lover Cretaceous Travis Peak Formation, East Texas basin: Gulf Coast Association of Geological Societies Transactions, v. 37, p. 65-74, 4 figs., 2 tables.
Eaton, R. W., 1956, Resume of subsurface geology of northeast Texas with emphasis on salt structures: Gulf Coast Association of Geological Societies Transactions, v. 6, p. 79-84.
Eving, J., and others, 1960, Geophysical measurements in the western Caribbean Sea and in the Gulf of Mexico: Journal of Geophysical Research, v. 65, no. 12, p. 4087-4126.
Ewing, J., and others, 1962, Sediments and oceanic structural history of the Gulf of Mexico: Journal of Geophysical Research, v. 67, no. 6, p. 2509- 2527.
Fisher, W. L., and McGowen, J. H., 1967, Depositional systems in the WilcoxGroup of Texas and their relationship to occurrence of oil and gas: Gulf Coast Association of Geological Societies Transactions, v. 16, p. 105- 125, 10 figs.
Fisher, W. L., 1969, Facies characterization of Gulf Coast Basin deltasystems, with some Holocene analogues: Gulf Coast Association Geological Societies Transactions, v. 19, p. 239-261.
Fisher, W. L., and others, 1970, Depositional systems in the Jackson Group of Texas Their relationship to oil, gas, and uranium: Gulf Coast Association Geological Societies Transactions, v. 20, p. 234-261.
Flawn, P. T. and others, 1961, The Ouachita system: Texas University Publication 6120, 401 p.
Forgotson, J. M., Jr., 1956, Stratigraphy of Comanchean Cretaceous TrinityGroup: American Association of Petroleum Geologists, v. 41, no. 10, p. 2328-2363, 9 figs.
105

Foss, D. C., 1979, Depositional environments of Woodbine Sandstones, Polk County, Texas: Gulf Coast Association of Geological Societies Transactions, v. 29, p. 83-94, 19 figs.
Galloway, W. E,, and others, 1983, Atlas of major Texas oil reservoirs: The University of Texas at Austin, Bureau of Economic Geology, 139 p., 426 figs.
Garcia, Roberto, 1972, Depositional systems in the Queen City Formation(Eocene), Central and South Texas Texas: University of Texas, Austin, Master's thesis, 108 p.
Grabowski, G. J., Jr., 1981, Source-rock potential of the Austin Chalk, Upper Cretaceous, southeastern Texas: Gulf Coast Association of Geological Societies Transactions, v. 31, p. 105-113.
Granata, W. H., 1962, Cretaceous structural development of the Sabine Uplift area: Gulf Coast Association of Geological Societies Transactions, v. 12, p. 117-119.
Grossman, E. L., and others, 1986, Origin of gaseous hydrocarbons in the Sparta aquifer in Brazos and Burleson Counties, Texas: Gulf Coast Association of Geological Societies Transactions, v. 36, p. 457-470, 9 figs.
Guevara, E. H., 1972, Depositional systems in the Queen City Formation(Eocene), Central and East Texas: University of Texas, Austin, Master's thesis, 79 p.
Guevara, E. H., and Garcia, R., 1972, Depositional systems and oil-gasreservoirs in the Queen City Formation (Eocene), Texas: Gulf Coast Association of Geological Societies Transactions, v. 22, p. 1-22, 15 figs., 2 tables.
Guevara, E. H., and Giles, A. B., 1979, Upper Cretaceous-lower Eocene strata, Hainesville, Keechi, and Oakwood salt domes, East Texas: Gulf Coast Association of Geological Societies Transactions, v. 29, p. 112-120, 13 figs.
Halbouty, M. T., 1979, Salt domes, Gulf region, United States and Mexico: Second edition, Gulf Publishing Company, Houston, Texas, 561 p.
Halbouty, M. T., and Halbouty, J. J., 1982, Relationships between East Texas Field region and Sabine Uplift in Texas: American Association of Petroleum Geologists Bulletin, v. 66, p. 1042-1054.
Hales, A. L., and others, 1970, Crustal structure study of Gulf Coast ofTexas: American Association of Petroleum Geologists Bulletin, v. 54, no. 11, p. 2040-2057.
Hall, C. D., and others, 1984, Sedimentology and diagenesis of the CottonValley Sandstone in the Amoco No. 1 Cullers Well, Rusk County, Texas, in Presley, M. W. (ed.). The Jurassic of East Texas: East Texas Geological
106

Society and East Texas Jurassic Exploration Conference, Tyler, Texas, March 27-28, 1984., p. 127-140.
Hancharik, J. M., 1984, Facies analysis and petroleum potential of theJurassic Smackover Formation, western and northern areas, East Texas Basin, j.n_ Presley, M. W. (ed.), The Jurassic of East Texas: East Texas Geological Society, East Texas Jurassic Exploration Conference, p. 67- 78, 7 figs.
Harvood, G., and Fontana, C., 1984, Smackover deposition and diagenesis and structural history of the Bryan Mills Area, Cass and Bowie Counties, Texas: in Ventress, W. P. S., and others, The Jurassic of the Gulf Rim: Proceedings of the Third Annual Research Conference, Gulf Coast Section, Society of Economic Paleontologists and Mineralogists Foundation, p. 135-147, 9 figs.
Hendricks, T. A., 1965, Resources of oil, gas, and natural gas liquids in the United States and the world: U.S. Geological Survey Circular 572, 20 p.
Hickey, H. N., and others, 1972, Tectonic map of the Gulf coast region,U.S.A.: Gulf Coast Association of Geological Societies and American Association of Petroleum Geologists, scale 1:1,000,000.
Hobday, D. K., Morton, R. A., and Collins, E. W., 1979, The Queen City Formation in the East Texas embayment: A depositional record of riverine, tidal, and wave interaction: Gulf Coast Association of Geological Societies Transactions, v. 29, p. 136-146, 11 figs.
Hobday, D. K., and Perkins, B. F., 1980, Paleoenvironments and trace fossilsof a large aggrading delta margin embayment: Upper Woodbine Formation of northeast Texas: Gulf Coast Association of Geological Societies Transactions, v. 30, p. 131-142, 14 figs.
Holcomb, C. W., 1971, Hydrocarbon potential of Gulf Series of western Gulf basin, .in. Cram, I. H. (ed.), Future petroleum provinces of the United State their geology and potential: American Association of Petroleum Geologists Memoir 15, v. 2, p. 887-900.
Hudnall, J. S., 1951, East Texas field, .in. Herald, F. A. (ed.), Occurrence of oil and gas in northeast Texas: Bureau of Economic Geology, The University of Texas at Austin Publication No. 5116, p. 113-118.
Jackson, M. P. A., 1982, Fault tectonics of the East Texas Basin: TheUniversity of Texas at Austin, Bureau of Economic Geology, Geological Circular 82-4, 31 p.
Jackson, M. P. A., and Seni, S. J., 1984, Atlas of salt domes in the East Texas basin: Bureau of Economic Geology, The University of Texas at Austin Report of Investigation No. 140, 102 p., 79 figs.
King, P. B., 1975, The Ouachita and Appalachian orogenic belts: jLn_ A. E. M.Nairn and F. G. Stehli (eds.), The Ocean Basins and Margins, v. Ill, The Gulf of Mexico and the Caribbean: Plenum Press, New York, p. 201-242.
107

King, P. B., and Beikman, H. M., 1974, Geologic map of the United States, exclusive of Alaska and Hawaii: U.S. Geological Survey, scale 1:2,500,000.
Kreitler, C. W., and others, 1980, Geology and geohydrology of the East Texas basin: C. W. Kreitler (ed.), University of Texas Bureau of Economic Geology, Austin, 112 p.
Lehner, P. 1969, Salt tectonics and Pleistocene stratigraphy on continental slope of northern Gulf of Mexico: American Association of Petroleum Geologists Bulletin, p. 2431-2479.
Locklin, A. C., 1984, Currie Field (Smackover), East Texas basin, with a brief history of the exploration of the Mexia-Talco fault system, in Presley, M. W., The Jurassic of East Texas: East Texas Geological Society, East Texas Jurassic Exploration Conference, Tyler, Texas, March 27-28, 1984, p. 32-42, 6 figs.
Lofton, C. L., and Adams, W. M., 1971, Possible future petroleum potential of Eocene and Paleocene, western Gulf basin, in Cram, I. H., Future petroleum provinces of the United States-their geology and potential: American Association of Petroleum Geologists Memoir 15, p. 855-886.
McGillis, K. A., 1984, Upper Jurassic stratigraphy and carbonate facies,northeastern East Texas Basin, _in_ Presley, M. E., The Jurassic of East Texas: East Texas Geological Society, East Texas Jurassic Exploration Conference, Tyler, Texas, March 27-28, 1984, p. 63-66, 4 figs.
MeGowen, M. K., and Lopez, L. M., 1983, Depositional systems in the NacatochFormation (Upper Cretaceous) northeast Texas and southwest Arkansas: The University of Texas at Austin, Bureau of Economic Geology Report of Investigations No. 137, 59 p., 55 figs.
McGowen, M. K., and Harris, D. W., 1984, Cotton Valley (Upper Jurassic) and Hosston (Lower Cretaceous) depositional systems and their influence on salt tectonics in the East Texas basin, j.n_ Vent res s, W. P. S., and others, The Jurassic of the Gulf Rim: Proceedings of the Third Research Conference, Gulf Coast Section, Society of Economic Paleontologists and Mineralogists Foundation, p. 213-253, 24 figs.
McGraw, M. M., 1984, Carbonate facies of the Upper Smackover Formation(Jurassic), Paup-Spur-Mandiville Fields, Miller County, Arkansas: in Ventress, W. P. S., and others, The Jurassic of the Gulf Rim: Proceedings of the Third Annual Research Conference, Gulf Coast Section, Society of Paleontologists and Mineralogists Foundation, p. 255-273. 16 figs.
Marchand, P., and Burke, M., 1984, Bloomburg Field, .in_ Presley, M. W. (ed.), The Jurassic of East Texas: East Texas Geological Society, East Texas Jurassic Exploration Conference, Tyler, Texas, March 27-28, 1984, p. 249.
Martin, R. G., 1978, Northern and eastern Gulf of Mexico continental margin: Stratigraphic and structural framework in Bouma, A. H., Moore, G. T.,
108

and Coleman, J. M. (eds.), Framework, facies and oil-trapping characteristics of the upper continental margin: American Association of Petroleum Geologists Studies in Geology No. 7, p. 21-42.
Martin, R. G., 1984, Regional geologic framework: central and western Gulf of Mexico DCS regions, jLn_ Foote, Richard Q. (ed.), Summary report on the regional geology, petroleum potential environmental considerations for development, and estimates of undiscovered recoverable oil and gas resources of the United States Gulf of Mexico Continental Margin in the area of proposed Oil and Gas Lease Sales 81 and 84: U.S. Geological Survey Open-File Report 84-339, Chapter 1, P. 1-1 to 1-51.
Martin, R. G., and Case, J. E., 1975, Geophysical studies in the Gulf ofMexico, jLn_ Nairn, A.E.M., and Stehle, F. G. (eds.), The ocean basins and margins, v. 3, The Gulf of Mexico and the Caribbean: New York, Plenum Press, p. 65-106.
Menard, H. W., 1967, Transitional types of crust under small ocean basins: Journal of Geophysical Research, v. 72, p. 3061-3073.
Miller, B. M., and others, 1975, Geological estimates of undiscoveredrecoverable oil and gas resources in the United States: U.S. Geological Survey Geological Circular 725, 78 p. 38 figs., 7 tables.
Mitchell-Tapping, H. J., 1981, Petrophysical properties of the Sligo formation of northern Louisiana and Arkansas: Gulf Coast Association of Geological Societies Transactions, v. 31, p. 155-166.
Mitchell-Tapping, H. J., 1984, Depositional environments of the updipSmackover areas of East Texas, in Presley, M. W. (ed.), The Jurassic of East Texas: East Texas Geological Society, East Texas Jurassic Exploration Conference, Tyler, Texas, March 27-28, 1984, p. 79-86, 12 figs.
Moore, C. H., and Druckman, Y., 1981, Burial diagenesis and porosityevolution, Upper Jurassic Smackover, Arkansas and Louisiana: American Association of Petroleum Geologists Bulletin, v. 65, no. 4, p. 597-628, 13 figs.
Moore, C. H., 1984, The Upper Smackover of the Gulf Rim: Depositional Systems, Diagenesis, Porosity Evolution and Hydrocarbon Production: in Ventress, W. P. S. and others (eds.), The Jurassic of the Gulf Rim: Proceedings, Third Annual Research Conference, Gulf Coast Section, Society of Economic Paleontologists and Mineralogists Foundation, p. 283-307, 20 figs.
Murray, G. E., 1961, Geology of the Atlantic and Gulf coastal province of North America: Harper Bros., New York, 692 p.
Murray, G. E., and others, 1985, Introduction to the habitat of petroleum, northern Gulf (of Mexico) coastal province, .in_ Perk ins, B. F., and Martin, G. B., Habitat of oil and gas in the Gulf Coast: Proceedings, Fourth Annual Research Conference, Gulf Coast Section, Society of Economic Paleontologists and Mineralogists Foundation, p. 1-24.
109

Newkirk, T, F,, 1971, Possible future petroleum potential of Jurassic, western Gulf basin, jja_ Cram, I.E. (ed.), Future petroleum provinces of the United States-their geology and potential: American Association of Petroleum Geologists Memoir 15, p. 927-953.
Nicho Is, P. H., 1964, The remaining frontiers for exploration in northeastTexas: Gulf Coast Association of Geological Societies Transactions, v. 14, p. 7-22, 18 figs.
Nichols, P. H., Peterson, G. E., and Wuester, C. E., 1968, Summary ofsubsurface geology of northeast Texas, in Natural gases of North America: American Association of Petroleum Geologists Memoir 9, v. 1, p. 982-1004.
NRG Associates, Inc., 1985, Significant oil and gas fields of the UnitedStates: The field/reservoir clusters of the United States, Gulf coast data tape, first edition, 1985, Colorado Springs, Colorado.
Nunn, J. A., 1984, Subsidence and temperature histories for Jurassic sediments in the northern Gulf Coast: a thermal-mechanical model, in Ventress, W. P. S. and others, The Jurassic of the Gulf Rim: Proceedings of the Third Annual Research Conference, Gulf Coast Section, Society of Economic Paleontologists and Mineralogists Foundation, p. 309-322.
Oliver, W. B., 1970, Depositional systems in Woodbine Formation (Upper Cretaceous), northeast Texas: American Association of Petroleum Geologists Bulletin, v. 54, no. 9, p. 1788.
Oliver, W. B., 1971, Depositional systems in the Woodbine Formation (UpperCretaceous), northeast Texas: The University of Texas at Austin, Bureau of Economic Geology Report of Investigations No. 73, 28 p.
Peckham, Richard C., and others, 1963, Reconnaissance investigation of the ground water resources of the Trinity River basin, Texas: Texas Water Commission, Bulletin 6309, 110 p.
Presley, M. W., and Reed, C. H., 1984, Jurassic Exploration Trends of EastTexas: _in_ Presley, M. W. (ed.). The Jurassic of East Texas: East Texas Geological Society and East Texas Jurassic Exploration Conference, Tyler, Texas, March 27-28, 1984., p. 11-21.
Rainwater, E. H., 1960, Stratigraphy and its role in the future explorationfor oil and gas in the Gulf Coast: Gulf Coast Association of Geological Societies Transactions, v. 10, p. 33-75, 33 figs.
Rainwater, E. H., 1967, Resume of Jurassic to recent sedimentation history of the Gulf of Mexico basin: Gulf Coast Association of Geological Societies Transactions, v. 16, p. 179-210, 24 figs.
Rainwater, E. H., 1968, Geological history of oil and gas potential of the central Gulf Coast: Gulf Coast Association of Geological Societies Transactions, v. 18, p. 124-165, 31 figs.
110

Rainwater, E. H., 1970, Regional stratigraphy and petroleum potential of the Gulf Coast Lower Cretaceous: Gulf Coast Association of Geological Societies Transactions, v. XX, p. 145-157, 7 figs.
Rainwater, E. H., 1971, Possible future petroleum of Lower Cretaceous, western Gulf basin: .in. Cram, I. H. (ed.), Future petroleum provinces of the United States, their geology and potential: American Association of Petroleum Geologists Memoir 15, v. 2, p. 901-926.
Ricoy, J. U., and Brown, L. F., Jr., 1977, Depositional systems in the Sparta Formation (Eocene), Gulf Coast Basin of Texas: Gulf Coast Association of Geological Societies Transactions, v. 27, p. 139-154.
Rodgers, D. A., 1984, Mexia and Talco fault zones, East Texas: Comparison of origins predicted by two tectonic models .in_ Presley, M. W., (ed.), The Jurassic of East Texas: East Texas Geological Society, East Texas Jurassic Exploration Conference, p. 23-31, 7 figs.
Russell, W. L., 1951, Principles of petroleum geology: McGraw-Hill Book Company, New York, 508 p.
Ryan, W. P., and others, 1987, Provenance of the Norphlet Sandstone, northern Gulf Coast: Gulf Coast Association of Geological Societies Transactions, v. 37, p. 457-468, 7 figs.
Scott, R. J., 1977, The Austin Chalk-Buda trend of south Texas: Gulf Coast Association of Geological Societies Transactions, v. 27, p. 164-168.
Sellards, E. H., and others, 1932, The geology of Texas: the University of Texas Bulletin No. 3232, v. 1, 1007 p.
Sellards, E. H., and Hendricks, Leo, 1946, Structural map of Texas (3rd ed., revised): University of Texas, Austin Bureau of Economic Geology, scale 1:500,000.
Seni, S. J., and Jackson, M. P. A., 1984, Sedimentary record of Cretaceous and Tertiary salt movement, East Texas Basin: times, rates, and volumes of salt flow and their implications for nuclear waste isolation and petroleum exploration: The University of Texas at Austin, Bureau of Economic Geology Report of Investigations No. 139, 89 p.
Shreveport Geological Society, 1980, South Arkansas and north Louisianageologic column: Report on selected oil and gas fields, north Louisiana and south Arkansas, reference v. VI, 160 p.
Smith, G. W., 1985, Geology of the Deep Tuscaloosa (Upper Cretaceous) GasTrend in Louisiana, .in. Perkins, B. F., and Martin, G. B., Habitat of Oil and Gas in the Gulf Coast: Proceedings of the Fourth Annual Research Conference, Gulf Coast Section, Society of Economic Paleontologists and Mineralogists Foundation, p. 153-190.
Stapp, W. L., 1977, The geology of the fractured Austin and Buda formations in the subsurface of south Texas: Gulf Coast Association of Geological Societies Transactions, v. 27, p. 208-229.
Ill

Stewart, S. K., 1984, Smackover and Haynesville facies relationships in north- central Texas jm Presley, M. W. (ed.), The Jurassic of East Texas: East Texas Geological Society, East Texas Jurassic Exploration Conference, Tyler, Texas, March 27-28, 1984, p. 56-62, 11 figs.
Theobald, P. K., and others, 1972, Energy resources of the United States: U.S. Geological Survey Geological Circular 650, 27 p.
Thomas, W. A., 1976, Evolution of Ouachita-Appalachian continental margin: Journal of Geology, v. 84, p. 323-342.
Thompson, Gerald L., 1967, Ground water resources of Ellis County, Texas: Texas Water Development Board, Report 62, 115 p.
Turner, J. R., and Conger, S. J., 1981, Environment of deposition andreservoir properties of the Woodbine Sandstone and at Kurten Field, Brazos County, Texas: Gulf Coast Association of Geological Societies Transactions, v. 31, p. 213-232.
Tyler, N., Ewing, T. E., Fisher, W. L., and Galloway, W. E., 1985, Oilexploration and production plays in the Texas Gulf Coast basin, in Perkins, B. F., and Martin, G. B. (eds.), Habitat of oil and gas in the Gulf Coast: Proceedings of the Fourth Annual Research Conference, Gulf Coast Section, Society of Economic Paleontologists and Mineralogists, p. 81-99; 14 figs.
U.S. Geological Survey News Release, March 26, 1974. Includes water depth to 200 m (656 ft).
USGS-MMS, 1988, Working Paper, National assessment of undiscoveredconventional oil and gas resources: U.S. Geological Survey and Minerals Management Service Open-File Report 88-373, 511 p.
Vernon, R. C., 1970, Possible future petroleum provinces of the United States Western Gulf Basin: Gulf Coast Association of Geological Societies Transactions, v. 20, p. 177-180, 3 figs.
Walper, J. L., and Miller, R. E., 1985, Tectonic evolution of Gulf Coastbasins jln_ Perkins, B. F., and Martin, G. B., Habitat of oil and gas in the Gulf Coast: Proceedings of the Fourth Annual Research Conference, Gulf Coast Section, Society of Economic Paleontologists and Mineralogists Foundation, p. 25-42.
Wescott, W. A., 1984, Diagenesis of a tight gas formation: The Jurassic Cotton Valley Sandstone, East Texas Basin, jln_ Presley, M. W. (ed.). The Jurassic of East Texas: East Texas Geological Society and East Texas Jurassic Exploration Conference, Tyler, Texas, March 27-28, 1984., p. 118-126.
White, D. A., 1980, Assessing oil and gas plays in facies-cycle wedges:American Association of Petroleum Geologists Bulletin, v. 64, no. 8, p. 1158-1178.
112

Wood, D. H., 1981, Structural effects of salt movement in the East TexasBasin, in_Kreitler, C. W., and others, Geology and geohydrology of the East Texas Basin: a report on the progress of nuclear waste isolation feasibility studies (1980): The University of Texas at Austin, Bureau of Economic Geology Geological Circular 81-7, p. 21-27.
Wood, D. H., and Guevara, E. H., 1981, Regional structural cross sections andgeneral stratigraphy, East Texas Basin: The University of Texas atAustin, Bureau of Economic Geology Geology Cross Sections.
Worzel, J. L., and Watkins, J. S., 1973, Evolution of the northern Gulf Coast deduced from geophysical data: Gulf Coast Association of Geological Societies Transactions, v. 23, p. 84-91.
113

APPENDIX
114

Figu
re A.
-1*
Generalized st
rati
grap
hic
char
t sh
owin
g re
gion
al correlations
of Coahulian
and
Comanchean Se
ries
st
rata
, so
uthe
rn Un
ited States (f
rom
Forgotson, 1956).

NO
RTH
SOU
TH
GO
OD
LA
ND
F
OR
MA
TIO
N
AN
TLE
RS
F
M?
"-
PA
LU
XY
F
OR
MA
TIO
N>W
ALN
UT
F
M.
TW
INM
TNS.
FM:
GLE
N
RO
SE
F
OR
MA
TIO
N
10
0ft
.
01O
mi.
Figu
re A-
2. Generalized cr
oss
section
showing
stra
tigr
aphi
c relationships
among
the
Antl
ers,
Twin M
ount
ains
, Glen Ro
se,
Palu
xy,
Walnut,
and
Goodland
Formations,
northeast
Texa
s (f
rom
Caug
hey,
19
77).

AB
RY
AN
/\C
OL
LE
GE
ST
AT
IOh
Figure A-3. Map sh
owin
g outcrop
of Claiborne
Group
of sedimentary
rock
s, Texa
s Coastal
Plain
(from
Davis
and
Ethr
idge
, 1971).
NW
SE
JA
CK
SO
N G
RO
UP
CL
AIB
OR
NE
GR
OU
P
ST
ON
EIS
PA
RT
A
J's&^^
aiaff&
liffai-
i'SP
lCA
RR
IZO
-»i^
j»;^
^
j^
ri'iin
^T
fff^
J I I W
ILC
OX
GR
OU
P/ / / /
// /// I I I I
I I I I I I
i-o
Figu
re A-4. Diagrammatic cross
sect
ion
of th
e Claiborne
Group
in central
Texas
(aft
er Berg,
1970,
p. 12
) (f
rom Da
vis
and
Ethr
idge
, 1971).

00
swS
OU
TH
TEX
AS
CE
NTR
AL
TEX
AS
EA
ST
TEX
AS
_____N
E
WES
T LO
UISI
ANA
SP
AR
TA
De
ltaic
WE
CH
ES
CLA
Y
Laa-o
on
Prod
elta
Shel
f
CIT
Y
De
ltaic
Str
andpla
in
REKL
AW
Deltaic
Prodelta
Shelf
CA
RR
IZO
-WIL
CO
XF
luvi
al -
del
taic
Figu
re A-
5. Generalized cross
sect
ion
show
ing
rela
tion
ship
s of
lo
wer
Tertiary
depo
siti
onal
systems
from
sou
th T
exas to
west
Loui
sian
a (f
rom
Guev
ara
and
Garcia,
1972
).