DEPARTMENT OF THE AIR FORCE AIR UNIVERSITY … OF THE AIR FORCE AIR UNIVERSITY AIR FORCE INSTITUTE...
125
THE PREDICTIVE VALIDITY OF THE AFIT GRADUATE MANAGEMENT PROGRAM ADMISSION REQUIREMENTS: A REASSESSMENT AND EXTENSION THESIS Sarah E. Woods, Captain, USAF AFIT/GAQ/ENV/04M-03 DEPARTMENT OF THE AIR FORCE AIR UNIVERSITY AIR FORCE INSTITUTE OF TECHNOLOGY Wright-Patterson Air Force Base, Ohio APPROVED FOR PUBLIC RELEASE; DISTRIBUTION UNLIMITED
-
Upload
nguyentruc -
Category
Documents
-
view
224 -
download
1
Transcript of DEPARTMENT OF THE AIR FORCE AIR UNIVERSITY … OF THE AIR FORCE AIR UNIVERSITY AIR FORCE INSTITUTE...

THE PREDICTIVE VALIDITY OF THE AFIT GRADUATE MANAGEMENT
PROGRAM ADMISSION REQUIREMENTS: A REASSESSMENT AND
EXTENSION
THESIS
Sarah E. Woods, Captain, USAF
AFIT/GAQ/ENV/04M-03
DEPARTMENT OF THE AIR FORCE AIR UNIVERSITY
AIR FORCE INSTITUTE OF TECHNOLOGY Wright-Patterson Air Force Base, Ohio
APPROVED FOR PUBLIC RELEASE; DISTRIBUTION UNLIMITED

The views expressed in this thesis are those of the author and do not reflect the official policy or position of the United States Air Force, Department of Defense, or the U. S. Government.

AFIT/GAQ/ENV/04M-03
THE PREDICTIVE VALIDITY OF THE AFIT GRADUATE MANAGEMENT
PROGRAM ADMISSION REQUIREMENTS: A REASSESSMENT AND
EXTENSION
THESIS
Presented to the Faculty
Department of Systems and Engineering Management
Graduate School of Engineering and Management
Air Force Institute of Technology
Air University
Air Education and Training Command
In Partial Fulfillment of the Requirements for the
Degree of Master of Science in Acquisition Management
Sarah E. Woods, BS
Captain, USAF
March 2004
APPROVED FOR PUBLIC RELEASE; DISTRIBUTION UNLIMITED

AFIT/GAQ/ENV/04M-03
THE PREDICTIVE VALIDITY OF THE AFIT GRADUATE MANAGEMENT
PROGRAM ADMISSION REQUIREMENTS: A REASSESSMENT AND
EXTENSION
Sarah E. Woods, B.S. Captain, USAF
Approved: _____//signed//______________________________ __29 March 2004__ Michael A. Greiner, Major (Chairman) date _____//signed//______________________________ __29 March 2004__ Stephen M. Swartz, Lieutenant Colonel (Member) date ____//signed//_______________________________ __29 March 2004__ Bryan J. Hudgens, Major (Member) date

iv
AFIT/GAQ/ENV/04M-03
Abstract
This research is based on the Air Force and AFIT balancing mission requirements
of personnel needed for duty and training airmen in advanced studies. Currently, over
50% of AFIT students do not meet AFIT entrance requirements. The purpose of this
research was to examine criteria to determine its predictability of graduate success, as
measured by graduate GPA, as well as determine whether performance is different for
students who require criteria to be waived.
Current AFIT eligibility criteria include undergraduate GPA, GRE test scores, or
GMAT test scores. Other variables examined in this study include: GRE-Analytical test
scores; rank/grade; prior enlistment; AFSC; gender; and number of members in
household.
This research found GMAT scores were a better predictor of success than GRE
scores for management students. GRE-Q scores were good predictors for all students,
while GRE-V scores were moderately good predictors for management students only.
GRE-A scores should be added as a requirement with an appropriate standard.
Undergraduate GPAs should be used as a guideline, not eligibility criteria into AFIT.
Waivers should not be given for multiple deficiencies when possible, though there
was little difference in the performance of students who met the criteria and those who
did not. There was also little difference in the performance of students depending upon
the type of waiver given.

v
Table of Contents Page
Abstract………………………………………………………………………….………..iv
List of Figures……………………………………………………………………..……..vii
List of Tables……………………………………………………………………………viii
I. Introduction……………………………………………………………..…………1
Background…………………………………………………………………..……1 AFIT Entrance Requirements………………………………………………..……3 Selection Process…………………………………………………………….…....4 Importance of Selection……………………………………………………….…..6 Problem Statement and Objective…………………………………………….…...8 Investigative Questions…………………………………………………………....9 Summary…………………………………………………………………………..9 II. Literature Review……………………………………………………………...…11 Chapter Overview………………………………………………………………..11 Success Criteria…………………………………………………………………..11 Factors of Predictability………………………………………………………….15 AFIT Specific Research………………………………………………………….25 Summary…………………………………………………………………………32 III. Methodology………………………………………………………………..……33 Chapter Overview…………………………………………………………..……33 Data Collection……………………………………………………………….….33 Research Design……………………………………………………………….…34 Predictor Variables…………………………………………………………….…37 Research and Analysis Methods…………………………………………………42 Model Validity……………………………………………………………….…..47 Restrictions and Limitations………………………………………………….….48 Summary…………………………………………………………………………49 IV. Analysis and Results…………………………………………………….……….50 Chapter Overview……………………………………………………….……….50 Multiple Regression Modeling………………………………………….……….50 Investigative Question 1…………………………………………………………57 Investigative Question 2…………………………………………………………61 Investigative Question 3……………………………………………………..…..64

vi
Page Investigative Question 4…………………………………………………………66 Summary………………………………………………………………..………..68 V. Conclusion………………………………………………………………….……70 Chapter Overview……………………………………………….……………….70 Conclusion of Research Objectives………………………………….…………..70 Limitations……………………………………………………………………….76 Suggestions for Future Research………………………………………………...77 Summary…………………………………………………………………………78 Appendix A. Program and AFSC Codes………………………………………………..80 Appendix B. Full Model GRE-V/GRE-Q for Scientists and Engineers………………...81 Appendix C. Full Model GRE-V/GRE-Q for Managers………………………………..84 Appendix D. Full Model GMAT for Managers…………………………………………87 Appendix E. Reduced Model GRE-V/GRE-Q for Scientists and Engineers……...…….90 Appendix F. Reduced Model GRE-V/GRE-Q for Managers………………………...…93 Appendix G. Reduced Model GMAT for Managers…………………………………....96 Appendix H. Validation of Reduced Model GRE for Scientists and Engineers……..…99 Appendix I. Validation of Reduced Model GRE for Managers……………………….102 Appendix J. Validation of Reduced Model GMAT for Managers…………………….105 Appendix K. Scientist and Engineering Variable p-values……………………………108 Appendix L. Management Variable p-values………………………………………….109 Bibliography……………………………………………………………………………110
vii
List of Figures
Page
Figure 1. Distribution of Thesis Grades…………………………………………………36
Figure 2. Graduate GPA Distribution Histogram……………………………………….51
Figure 3. Bivariate Fit of GGPA by GRE-Q…………………………………………….59
Figure 4. Bivariate Fit of GGPA by GRE-V…………………………………………….59
Figure 5. Bivariate fit of GGPA by GRE-A…………………………………………….60
Figure 6. Bivariate fit of GGPA by GMAT……………………………………………..61
Figure 7. Bivariate Fit of UGPA by GGPA……………………………………………..63

viii
List of Tables
Page
Table 1. AFIT Grade and Points System………………………………………………..37
Table 2. Graduate GPA Goodness-of-Fit Test: Shapiro-Wilk W Test………………….51
Table 3. Parameter Estimates: Full Model GRE for Scientists & Engineers……………52
Table 4. Parameter Estimates: Reduced Model GRE for Scientists/Engineers…………53
Table 5. Parameter Estimates: Full Model GRE for Managers…………………………54
Table 6. Parameter Estimates: Reduced Model GRE for Managers…………………….54
Table 7. Parameter Estimates: Full Model GMAT for Managers………………………55
Table 8. Parameter Estimates: Reduced Model GMAT for Managers………………….56
Table 9. Entrance Exams of Pre-Validation Sample……………………………………58
Table 10. # of Students Who Required a Waive of Admission Criteria ………………..64
Table 11. Mean and Standard Deviation for our Random Samples (N=109)…………...65
Table 12. Results of 4 Sub-tests of Hypothesis…………………………………………67
Table 13. Mean and Standard Deviations of Waiver Samples………………………….68

1
THE PREDICTIVE VALIDITY OF THE AFIT GRADUATE MANAGEMENT
PROGRAM ADMISSION REQUIREMENTS: A REASSESSMENT AND
EXTENSION
I. Introduction
Background
The United States Air Force is the world leader in aerospace power. Air Force
personnel are trained and equipped with the most modern and technologically advanced
tools. “They demonstrate the maturity of our ability to plan and execute an array of
complex, integrated, and simultaneous coalition operations designed to support objectives
across the spectrum of conflict from global strike to humanitarian relief” (Roche, 2003).
Yet despite our achievements and dominance, Air Force leaders are continuously seeking
new solutions to organize, train, and equip forces to meet the demands of our current and
future national security environment. The Air Force needs highly qualified personnel
with not only broad knowledge of the Air Force, but also expertise within specific career
fields.
The Air Force Institute of Technology (AFIT) provides one option for airmen to
advance their educations and gain depth in their career field. The AFIT Graduate School
of Engineering and Management offers master and doctoral degrees in engineering,
science, and management disciplines tailored to Air Force and Department of Defense
needs. The mission of AFIT is “to produce graduates and engage in research activities

2
that enable the Air Force to maintain its scientific and technological dominance” (AFIT
Catalog, 2002: 3). Currently, 500 students graduate from the AFIT in-residence program
with a master’s degree. Due to a new initiative from the Secretary of the Air Force,
James G. Roche, AFIT will increase graduation quotas to 2,500 during the next six years
(“AFIT Raises Graduation Quotas,” 2003). When speaking about the initiative to
increase education of airmen, Dr. Roche stated,
“I’m proud or our new initiatives to increase AFIT attendance over the next several years and to make advanced academic education available to those senior enlisted members who qualify for our graduate degree programs. You should know, I view this effort as an important investment in those who must maintain and operate the complex systems our Air Force employs, not as hollow philanthropy.” (Roche, 2002)
While the quotas for AFIT graduates are increasing, the demand for airmen to
serve over seas on contingencies and operations is also increasing. As of November
2003, from a total force of 370,898 active duty personnel, 18,242 were deployed on
contingencies to Operation Iraqi Freedom, Enduring Freedom, Noble Eagle, Joint
Guardian, and Joint Forge to name a few (AFPCa, 2003; AFPCb, 2003; Lingle, 2003).
The mission of the Air Force comes first and senior leaders as well as the Air Force
assignment teams must balance meeting today’s need with future needs. AFIT’s
objective of the school is to produce graduates for the Air Force in preparation for future
needs. The quality of personnel the Air Force needs to maintain the world’s most
respected force places AFIT in a precarious situation, finding available career officers
with the skills and desire for continued education. Presumably, some officers do not wish
to go back to school or had difficulty in undergraduate college and don’t feel they are
ready for more school and although they were capable of attaining a bachelor’s degree,

3
might not have sufficient skills to finish a rigorous master’s program. Not all officers are
in the position or are available (due to continued contingencies) to attend and succeed at
AFIT. Therefore, entrance requirements to AFIT must be continuously reviewed for their
ability to predict a student’s ability to graduate while maintaining the dignity of AFIT
programs.
AFIT Entrance Requirements
Currently, the criteria for admissions into AFIT include completion of a
bachelor’s degree at a regionally accredited college or university with a 3.0 grade point
average (GPA) on a 4.0 scale, and “satisfactory scores” on standardized tests such as the
Graduate Record Examination (GRE) and/or Graduate Management Admissions Test
(GMAT.) The recommended minimum test scores for any graduate program at AFIT are
500 on the GRE verbal exam and 600 on the GRE quantitative exam, or a total score of
550 on the GMAT exam (AFIT Admissions Criteria, 2003). However, the director of
each academic program can waive admission requirements on a case-by-case basis (AFIT
Catalog, 2002: 9).
Studies relating admissions criteria to academic success are common in the
academic community, mainly because no universal model has been identified which
applies to all graduate (or undergraduate) institutions (Spangler, 1989:8). Some studies
on the predictability of admission criteria for AFIT found little or no correlation between
test scores, undergraduate GPA, and AFIT success (graduate degree receipt) and
therefore “indicate that the ability measures used by AFIT are appropriate but not
sufficient for predicting success” (Keith, 1977:36-37; Garwood, 2002:89).

4
This study will focus on general admission criteria for AFIT and their predictive
capabilities within each department of AFIT: Aeronautics and Astronautics (ENY);
Electrical and Computer Engineering (ENG); Engineering Physics (ENP); Mathematics
and Statistics (ENC); Operational Sciences (ENS); and Systems and Engineering
Management (ENV) (AFIT Catalog, 2002). Although doctorate programs are offered,
this study will focus on the master students and program entrance requirements for a
master’s degree: ENY offers five master’s programs; ENG offers three; ENP, six; ENC,
one; ENS, three; and ENV offers four master’s degree programs (AFIT Catalog, 2002).
Eligibility requirements differ slightly based upon the program. However, for the
purpose of this study, we are seeking the predictive capability of the “general” admission
requirements mentioned above, which are standard across the programs.
Selection Process
The traditional, objective application and selection process to AFIT is different
for military members and other applicants. Government and non-government civilians
and members of foreign militaries are also eligible to attend AFIT. However, in an effort
to standardize the population for this study, we will examine active duty U.S. military
members seeking full-time, 18-month resident AFIT assignment. To be eligible,
applicants must currently not be in permanent change of station (PCS) status, technical
training, or PCS professional military education assignment. Prospective students can
apply to AFIT with a formal application, including undergraduate transcripts and official
GRE or GMAT scores. Students will be assessed on academic background, Air Force
Specialty Code, and forecasted requirements for officers with the desired field of study.

5
All AFIT degrees are matched to specialty codes in coordination with the Air Force
Personnel Center (AFPC) assignment teams (Baker, 2004; AFIT Catalog, 2002: 9-10;
AFIT Admissions Criteria, 2003).
Once a student submits the required paperwork and specifies a desired academic
program, the registrar will assess the student’s academic eligibility against the stated
admissions requirements. Students meeting all eligibility criteria receive a letter of
eligibility which advises the assignment officers at AFPC that the student is academically
qualified to attend AFIT. Students not meeting eligibility criteria have their records
referred to the director of their preferred academic program for waiver determination.
Students receiving a waiver of their deficiencies also receive letters of eligibility. The
assignment officers have an allocated number of positions to fill at AFIT and will match
the appropriate students from the pool of eligible candidates with the positions at AFIT.
If more students apply than positions available, the assignments officer will select
students to attend AFIT, consulting with the AFIT program director as needed (Baker,
2004; Monson, 2004).
The non-traditional and subjective portion of admission to AFIT happens when
the program director waives substandard undergraduate GPA, GRE, and/or GMAT scores
for a prospective student. Directors have discretion when deciding which students to
waive requirements for and which not to, though each should review the applicant’s
academic record thoroughly. Directors may request an interview with prospective
students to determine their potential for successful completion of the graduate program.
Others might review undergraduate transcripts, and any graduate transcripts, to determine
the difficulty or applicability of the courses to ascertain successful completion. Still other

6
directors might do both or automatically grant a waiver based on the need to fill the
program’s allotted slots (Baker, 2004) but keep in mind the student’s difficulties to better
work with them throughout the program.
Whether a prospective student gains an assignment to AFIT by meeting the
objective criteria or through the waiver process is the focus of this study. Garwood’s
study (2002) of eligibility criteria used to predict success of the Cost Analysis program at
AFIT found 70% of the lowest GPAs and 80% of the ten highest GPAs were earned by
students who required a waiver for admission. With the increased quotas for AFIT to fill
and the increased number of Air Force personnel needed elsewhere, finding students to
fill the quotas for graduate degrees is challenging, particularly in the science,
engineering, and logistics programs (Burnside, 2004; Donahue, 2004; Peterson, 2004).
Waivers from program directors are becoming common-place, yet nearly 100% of
students graduate from AFIT in the allotted 18-month time frame. This discrepancy at
AFIT calls into question whether AFIT’s admission requirements are valid or even
necessary.
Importance of Selection
Selection into the AFIT graduation program is important to a variety of people for
a variety of reasons. First, attending AFIT is an excellent opportunity for military
members to continue their education free of cost. The Air Force pays all school related
costs for a student (tuition and books.) In addition to school costs, they continue to pay
military members their salary and housing costs according to the member’s rank. For
many students (first lieutenants with three years of service through captains with six
7
years of service,) the government is paying $75K – $95K, including benefits, tuition, and
books to attend school for 18 months (DFAS, 2004). This number does not include
housing pay or career bonuses. According to Air University Financial Management
Department (2004), the total cost of one student to attend AFIT is $301,872. This cost
includes direct costs ($118,591,) indirect costs ($38,241,) student costs ($137,631,) and
command support costs ($7,409.) Considering that AFIT students are unavailable to serve
on world-wide contingencies during their studies, the Air Force is investing a
considerable amount of resources to send a student to school. With this investment, the
Air Force has a vested interest in selecting qualified students who will successfully
complete their studies; however, students also have strong motivation to be admitted to
and to succeed at AFIT.
Selection and successful graduation of the master’s program is important to the
students’ military careers. Whether or not a student receives a degree from AFIT, he/she
will likely continue to their follow-on duty station, although program extensions are
available. Regardless, the student’s training report will indicate degree receipt (on non-
receipt) which will stay in the military member’s records. The records serve as the
primary basis for selection both to future positions in the Air Force and for promotion
opportunities. Students with a report from AFIT stating the absence of degree receipt
will be looked at much less favorably by a promotion board. Students who apply for
AFIT want to be sure the 18-month program is what they are interested and motivated to
achieve. Selection of a student who is not ready for the program can hurt the student, but
it can also impact AFIT.

8
Student success at AFIT reflects upon the school’s ability to maintain their
mission and integrity, including accreditation. AFIT is accredited by two governing
bodies, the Higher Learning Commission (HLC) and the Accreditation Board for
Engineering and Technology (ABET) (for select engineering programs.) The HLC is a
member of the North Central Association (AFIT Catalog, 2002; 4). In order to maintain
accreditation through the HLC, schools must continually assess: student learning and
effective teaching; acquire, create, and apply knowledge; must have a mission and
integrity; and prepare for the future (HLC, 2003: 5-7). As mentioned earlier, nearly
100% of AFIT students graduate on time with at least a 3.0 GPA and successful
completion of a thesis. AFIT is clearly succeeding in their efforts to accomplish the
mission. However, with the increased number of students, a proportional increase in the
number of waivers given to students to attend AFIT could impact the integrity of the
school if students do not do well. Faculty can also become overburdened if too many
students require extra help to make it through the program. Therefore, selection of
qualified, motivated, and disciplined students becomes more important and requires more
effort on the part of faculty granting waivers, should they decide to wave requirements at
all. The school administration is interested in selecting students who will reflect the
school’s abilities positively through their graduate completion and GPAs.
Problem Statement and Objective
This research seeks to validate the GRE/GMAT and undergraduate GPA as AFIT
entrance criteria as well as examine alternative information necessary for both admissions
and individual instructors to assess when evaluating students for AFIT programs.

9
Investigative Questions
The following investigative questions support the research objective:
1. Do current measures of capability, such as the GRE or GMAT standardized
tests, have any predictive capability on AFIT student performance?
2. Do current measures of past performance, such as undergraduate GPAs, have
any predictive capability on AFIT student performance?
3. Is there a difference in performance between students who meet all admissions
requirements and those who require a waiver?
4. Is there a difference in performance depending on which admission
requirement is waived (GRE/GMAT scores or undergraduate GPA)?
Summary
Selection of students into AFIT is important to the Air Force, the students,
and the school’s faculty. Careful consideration of students is necessary to maintain the
integrity of the graduate program at AFIT. The department of admissions collects the
necessary information to determine eligibility; but individual program directors are faced
with the subjective decision of whether or not to waive a student who does not meet
admission requirements to attend AFIT. Due to the need for military members elsewhere
conflicting with the need for AFIT to increase enrollment by up to 500% over the next
five years as a part of increased force development (Roche, 2003), AFIT could be forced

10
to consider more students who don’t meet its fundamental admission requirements. If the
program directors better understand the likelihood of success for students they grant
waivers, they will better understand the level of commitment and dedication both
instructor and student will need to better prepare the incoming student with what lies
ahead and give the student and the Air Force assignment system more information with
which to make the decision whether or not to apply to AFIT.

11
II. Literature Review
Chapter Overview
This chapter examines current studies and measurements of graduate school
performance presented in literature. Success predictability articles saturate the literature,
correlating undergraduate GPA, gender, past work experience, GRE/GMAT test scores
(to name a few) with graduate school performance. This chapter will review criteria of
success within the literature as well as predictor variables and what researchers have
concluded thus far. The chapter will conclude with an overview of AFIT-specific theses
in the area of graduate school performance predictability. This overview indicates a need
for recurring validation of admission requirements at individual graduate schools.
Success Criteria
Graduate school performance can be measured several different ways: by grades
(Morrison and Morrison, 1995; Hoefer and Gould; 2000); comprehensive exams and
faculty ratings (Kuncel et al., 2001); degree completion (House, 1997); etc. Kuncel,
Hezlett, and Ones (2001) explored eight different measures of success through a
comprehensive meta-analysis of GRE predictability: graduate GPA; first year graduate
GPA; comprehensive examination scores; faculty ratings; number of
publications/conference papers; number of times publications are cited; degree
attainment; and time to degree attainment. Many faculty members would argue success
is much more than quantitative measures and that the objectives of most institutions are
more than academic competence (Walpole et al, 2002; Hartnett and Willingham, 1979).

12
Walpole and others (2002) conducted interviews with over 100 graduate school
staff and faculty members which revealed the most common measures of success were
not quantifiable: research/scholarly experience (amount and quality); interpersonal
skills/collegiality; broadening viewpoints; and persistence/tenacity. Such conflicting
views emphasize a theme one can see throughout graduate success predictability studies:
no study has proved to be universally applicable and no one criteria or set of criteria for
success at graduate institutions has been determined.
The Educational Testing Service (ETS) is the administrator of both the Graduate
Record Administration Test as well as the Graduate Management Administration Test,
the two most widely used standardized exams to ascertain an individual’s academic
readiness for graduate school. The ETS, in an effort to continually validate their exams,
has conducted several validity studies over a broad range of schools and disciplines
(Zwick, 1990; Willingham, 1976; Powers, 2001: Schneider and Briel, 1990). A few of
their studies have pertained specifically to the “criterion problem,” how one defines the
criteria of successful performance in an educational program (Enright and Powers, 1991;
Harnett and Willingham, 1979). Although the recommendations to develop new
quantifiable measures of success (i.e. analytical skills assessment by faculty, discipline-
specific simulation testing) are valid, most measures have yet to be implemented.
Harnett and Willingham’s (1979) report about measures of success in graduate school
discusses the nature and importance of the criterion problem:
“Notions of what constitutes successful student performance and how it ought to be measured naturally vary widely across institutions, disciplines, and types of programs. It is very much a responsibility of individual institutions and departments to wrestle with an issue so central to educational policy.” (Harnett and Willingham, 1979: 1)

13
At AFIT, degree requirements include an overall graduate GPA of at least B
(3.00,) completion of 48 coursework credit hours, and completion of a 12-hour
independent study research thesis (AFIT Catalog, 2002: 29-30). In light of the
requirements, one might assume success at AFIT is based upon graduate GPA and
completion of a thesis. Other common measurement factors such as time until degree
completion, cited publications, and quality/amount of scholarly study, are generally
constant for students at AFIT and are therefore not appropriate measures of success for
this study (Garwood, 2002: 8-17). Students are at the same institution with the same
professors, same courses (within their discipline) for the same amount of time. Also,
while each department has its own goals (AFIT Catalog, 2002,) this study will focus on
department commonalities to reduce variance in our study. Not all programs give faculty
ratings, require comprehensive exams, or encourage publications, and thus these factors
will not be considered as success criteria for the purpose of this study. Common
measures of success which apply to all students at AFIT are first year graduate GPA and
graduate GPA. Completion of a thesis will not be used as a measure of success because
students will not receive a degree without completion and the distribution of thesis grades
have been shown to be greatly skewed in programs at AFIT (Garwood, 2002: 43;
Zitzman, 2002: 60). It is safe to assume the same distribution of thesis grades can be
seen throughout several programs at AFIT.
The graduate GPA and first year GPA are the most commonly used success
criteria in graduate success predictability studies (Feldhusen and Jarwan, 1995: 506;
Kuncel et al., 2001: 168). Grades have several positive attributes which make them good

14
measures of success for validity studies. First, they are easily accessible at any
institution. In fact, Harnett and Willingham (1979: 11) discuss a study by K.M. Wilson
in 1978 which found first year graduate grades are chosen as measures of success because
they are the most reliably common criterion to all institutions. This commonality is due
at least in part to the number of students who do not complete master’s programs, but
who complete one year of studies. Because nearly 100% of AFIT students graduate, it is
reasonable to assume the final GPA will be a more robust measure of success than the 1st
year GPAs of students. Grades are also good success criterion because they presumably
represent how faculty feels a student is performing academically. Grades serve as one
achievement factor which generally communicates to students, faculty, university
administrators, and prospective employers, students’ academic ability and capability
(Roth et al., 1996: 548; Willingham, 1974: 274). While many good things can be said
about using grades as a success criterion, they have several limitations.
Two prominent limitations using GPA as a measure of performance can hinder
predictability research (Willingham, 1974: 274). First, most graduate schools
consistently give As and Bs so GPAs range from 3.0 to 4.0, which does not allow for
much differentiation. And second, grading severity can vary from one institution to
another, as well as within institution departments. By limiting this research to students at
one graduate institution, we are able to also limit the variance of grading. Also, while
this study intends to examine predictability of the whole school heterogeneously, it will
also determine predictive capability within each department, thereby limiting the effect of
grading differences within the institution.

15
Although researchers and scholars might have conflicting views about how to
define and measure graduate success, most tend to agree that the measures should be
valid, reliable, and acceptable (Willingham, 1974: 273). A valid measure will measure
precisely what we want to measure, and only what we want to measure. Grades do not
necessarily measure success, but can also be an indication of faculty or student
characteristics rather than academic knowledge (Harnett and Willingham, 1979: 13). For
example, a paper could be graded based upon a professor’s personal preference for
inductive research rather than deductive research. A reliable measure is one that is stable
and dependable from one measurement to another when all else is constant. One can
clearly and logically assume a professor’s method of grading will not always be
consistent from class to class, student to student. And an acceptable measure is one that
is accepted by the community at large, feasible, and logical (Leedy and Ormrod, 2001:
24-37; Willingham, 1974: 273). Despite the minor shortcomings of the graduate GPA in
validity and reliability, it is certainly accepted by academics at large as the most feasible
and logical measure of success we have at this time, evidenced by the large number of
research efforts which use it in their studies (Hoefer and Gould, 2000; Peiperi and
Trevelyan, 1997; House, 1994; Roth et al., 1996; Nilsson, 1995; Kuncel et al., 2001).
Now that we have identified our success criterion as the graduate GPA, we will examine
factors of predictability of success.
Factors of Predictability
According to the expectancy theory, performance is a multiplicative function of
motivation and ability (Gibson et al., 2003: 142). Further dissecting the formula reveals

16
performance components (such as graduate GPA, course grades, thesis completion, etc.)
are a function of declarative knowledge ( what we know,) procedural knowledge and skill
(application of knowledge,) and motivation, wherein ability (from the expectancy theory)
equals declarative knowledge multiplied by procedural knowledge (McCloy et. al,
1994:493-495).
Applying this definition to the confines of this study, we seek to understand what
declarative knowledge (admission requirements) predicts a specific performance
component (graduate GPA.) AFIT requires undergraduate GPA, transcripts (individual
course grades,) and GMAT or GRE scores for consideration of eligibility. The decision
to issue a letter of eligibility is based primarily on these factors (AFIT Catalog, 2002: 8).
However, when applicants do not meet the eligibility requirements and faculty must
examine records to determine whether or not to waive requirements, the process becomes
very subjective. Faculty members need guidance about what to look for other than their
own experiences in academics and in the professional working environment. Literature
shows factors other than GRE/GMAT scores and undergraduate GPA which could have
predictive capabilities include undergraduate school rating, degree type, age, gender, time
since degree completion, and work experience. The literature provides numerous studies
seeking correlations of some form of declarative knowledge, procedural knowledge and
skill, or motivation to performance components, with mixed results (House, 1994; House
1989; Hoefer and Gould, 2000; Nilsson, 1995).
Undergraduate Grade Point Average.
Like most colleges, undergraduate GPA is one criterion AFIT examines for
admission to their graduate programs (Kuncel et al., 2001; AFIT Catalog, 2002). Some
17
of the arguments against using undergraduate GPA are the inconsistent grading of
individual professors across multiple disciplines in different schools as well as the
suggestion of logical circularity of predicting GPA from GPA (Willingham, 1974: 275).
However, using the same argument of logical circularity, Willingham also points out
there is no other measure better to predict performance than that which has been used to
measure the same performance in the past. Also, having different undergraduate GPAs
across several different fields and schools tend to average each other out (Goldberg and
Alliger, 1992: 1025) Undergraduate GPA is possibly the most widely examined criteria
of any college (undergraduate or graduate) admissions departments (Willingham, 1974:
274; ETS, 2004; Kuncel et. al, 2001: 166).
In the literature reviewed for this study, nearly all the validity studies done by or
for the ETS included undergraduate GPA as a possible predictor of graduate school
success, along with the standardized test scores (Harnett and Willingham, 1979; Zwick,
1990; Wellington, 1976). Harnett and Willingham (1979) do not believe grades are the
optimal predictor of success, but they are useful in other ways. Grades can be used to
produce motivation in students, to serve students as a tool for feedback, and to function
as a good summary of a student’s education (Harnett and Willingham, 1979: 13-15).
Many researchers at ETS (ETS, 2004) agree that undergraduate GPA is not the best
predictor of success, but at the present time, it is most certainly one indicator of past
success and should be considered in admissions to undergraduate and graduate schools,
preferably along with other measures. Zwick (1990) examined the predictability of
undergraduate GPA along with GMAT scores in doctoral programs and found
undergraduate GPA alone is not a very good predictor of success, but combined with

18
other factors, such as GMAT/GRE scores, can yield very positive results. In fact, Zwick
maintains that the undergraduate GPA and standardized test scores together work as
much better predictors of doctoral program success than master’s program success, in
part due to the more selective process of doctoral students.
Similarly, outside studies and meta-analyses have included undergraduate GPA as
a predictor of success (Kuncel et. at, 2001; Willington, 1974; Abedi, 1991). Hoefer and
Gould (2000: 228) found undergraduate GPA had a correlation with graduate GPA of
.25. Kuncel and others (2001: 169-170) found that when combined, undergraduate GPA
(r = .26) and GRE scores (r = .21-.24) have lower predictability to graduate GPA than
either variables alone (undergraduate GPA, r = .30; GRE scores, r = .32-.36). When
Kuncel and others divided the population into sub-disciplines, undergraduate GPA
predictability was high for the math and physical science departments (r = .38) and
slightly lower for the social sciences (r = .29). In Willington’s 1974 study (274), he
found similar results (undergraduate GPA, r = .31). Yet in contrast, the GRE-
undergraduate GPA composite showed a much stronger correlation to graduate GPA (r =
.45). Abedi (1991: 158,) on the other hand, completely disagrees with Kuncel and others
as well as Willington and found undergraduate GPA “has virtually no relationship with
any of the measures of academic success.” He contributed the findings to a skewed
relationship in undergraduate GPAs, noting that those with low undergraduate GPAs
would typically not apply to graduate school.
General Records Examination and Graduate Management Admission Test.
The Educational Testing Service (ETS) is the administrative body which
collectively develops and administers more than 12 million tests worldwide, including the

19
Graduate Record Examination and the Graduate Management Admission Test. It is
vitally important to the ETS, and is included in their mission, vision, and values, that
their tests be both valid and fair to all students regardless of race, language, gender, age,
or any other individual characteristics (ETS, 2004). However, realizing no test is perfect
and that the results of standardized tests make up only a portion of the capabilities of an
individual, they caution institutions to use more than GRE/GMAT scores to determine
admissions and also discourages the use of GRE/GMAT “cut-off scores” whereby the
school will not consider applicants with a “lower than” GRE/GMAT score (ETS, 2004).
Several studies by the Educational Testing Service (ETS) as well as other academic
institutions have conducted validation studies on both the GRE and GMAT examinations
(Morrison and Morrison, 1995; House, 1997, 1998; Zwick, 1990; Nilsson, 1995; Kuncel
et al., 2001) but repeatedly encourage institutions to conduct their own validation study
due to the complete disagreement of the academic community as to the predictive
capabilities of any standardized test (ETS, 2004). GRE/GMAT scores will be included in
this study in an effort to continuously validate AFIT’s current practices.
In Morrison and Morrison’s (1995) meta-analysis of the predictability of the
GRE, they found moderate correlations with graduate GPAs (GRE-V, r = .28; GRE-Q, r
= .22). The sample was taken from twenty-two published studies from 1955 to 1992. J.
Daniel House (1999) found similar results in his study of psychology master’s students
(GRE-V, r = .31; GRE-Q, r = .21) though the results in his (1994) study of education
master’s students were slightly lower (GRE-V, r = .275; GRE-Q, r = .18). Kuncel and
others (2001) conducted a meta-analysis across 1,521 studies yielding 6,589 correlations
within the database, by far the most inclusive meta-analysis to date. Not only have they

20
included far more studies than any previous meta-analysis, but they have also examined
correlations across multiple disciplines using eight criterion measures. The study
supports the use of the GRE for predictive capability of graduate success (GRE-V, r =
.34; GRE-Q, r = .32).
Validity studies of the GMAT are conducted much less than for the GRE. The
GMAT is the standardized test specifically designed to “help business schools assess the
qualifications of applicants for advanced study in business and management” (GMAT,
2004). While AFIT will accept scores from the GMAT, applicants overwhelmingly use
GRE scores. Considering a portion of AFIT focuses on a management discipline,
perhaps the GMAT would serve as a better predictor of performance for students
applying to the disciplines within the management programs1. Nilsson (1995) conducted
a comparison study between the GMAT and GRE using a population from a mid-sized
southern college. Thirty subjects took the GRE and were enrolled in English, education,
psychology, sociology, and music master’s programs. Thirty others took the GMAT and
were enrolled in Master of Business, Administration, Professional Accounting, or Public
Administration programs. The results showed the GRE had a “moderate,” though
stronger, correlation to GGPA (r = .449) than did the GMAT (r = .231) (Nilsson, 1995).
The literature was unclear whether Nilsson compared verbal and quantitative scores or
only compared total scores of the GRE to total scores of the GMAT. The ETS clearly
encourage schools to carefully consider any use of composite measures and guides those
interpreting scores to view verbal and quantitative scores as separate and independent
measures (ETS, 2004). It would be interesting to examine the results of the study by
separating the tests.

21
Hoefer and Gould (2000) conducted a study in which the GMAT’s quantitative,
verbal scores, and undergraduate GPA together created the highest correlation with
GGPA (r = .45; r2 = .20) which supports the ETS’s findings to combine the GMAT/GRE
scores with the UGPA for best correlations with success in graduate school (ETS, 2004).
An interesting finding in their study is that when they separated the subjects into part-
time and full time students, the GMAT was a better predictor of performance for full time
students. AFIT students for this study are all full time students. Also, Hoefer and Gould
(2000) found the GMAT was more predictive for females than males, older students than
younger, and students from tier 1 schools than tier 2 schools (undergraduate school rating
according to “America’s Best,” US News, 1996).
Peiperi and Trevelyan (1997) also looked at characteristics other than the GMAT,
though the focus of the study was GMAT predictive capabilities. The GMAT verbal test
had a higher correlation to final GPA than the GMAT quantitative test. Also, Peiperi and
Trevelyan found the GMAT was more predictive for younger students than older
(contradictive to Hoefer and Gould,) married students than single, and that gender and
work experience had no significant relationship with GGPA (contrary to House, 1994).
However, there were no correlation values or evidence to back up the claims of this
study. Disagreements about what factors are not the only thing academics focus on.
They cannot even agree on an acceptable correlation level.
In the meta-analysis performed by Morrison and Morrison (1995), the authors
concluded the GRE-V and GRE-Q scores accounted for such small variance as to be,
“useless from a prediction standpoint” (Morrison and Morrison, 1995: 313). Similarly,
Ahmadi and others (1997) found the GMAT together with UGPA did not sufficiently

22
predict graduate success, though their results showed a correlation between GMAT and
GGPA to be higher than most studies reviewed (r = .433) (Ahmadi et al., 1997). Ahmadi
and others concur with the ETS’s philosophy that other factors should also be considered
when admitting graduate students. Goldberg and Alliger (1992) conducted a meta-
analysis across 10 studies and found correlations considerably lower than Morrison and
Morrison as well as Kuncel and others (GRE-V, r = .15; GRE-Q, r = .15), yet found the
GRE to be a significant predictor of success in graduate education. Most agree the
GRE/GMAT and UGPA cannot be the only criteria graduate schools look at when
considering admissions. They cannot universally measure a student’s motivation,
commitment, ability to work autonomously, ability to work as a group, and many other
traits necessary to succeed in a graduate program (Harnett and Willingham, 1979;
Science, 1993; Walpole, 2002; Willingham, 1974).
Other Predictors of Success found in the Literature.
As mentioned earlier, many other predictors have been examined to determine
their correlation to graduate school success: age, gender, work experience, motivation,
general cognitive abilities, specific cognitive abilities, ethnic background, undergraduate
school attended, marital status, course background, and first year graduate GPA.
However, research results often yield more contradictions about which variables are good
predictors and which are not.
Ree, Earles, and Teachout (1994: 519-521) found sufficient evidence to suggest
job or school performance is based primarily on cognitive ability. They argue specific
abilities are not necessary in today’s workforce and employers as well as academic
institutions look at general knowledge more than specific knowledge. Their findings lend

23
support to standardized exams being good predictive tools of graduate success.
Similarly, as mentioned before, McCloy, Campbell, and Cudeck (1994: 493-494) found
performance is a reflection of declarative knowledge (like standardized exams,)
procedural knowledge and skill (like hands-on job experience and training,) and
motivation (deciding to expand a certain amount of effort for a certain amount of time.)
Interviews with graduate faculty (Walpole, 2002: 9-10, 14) indicate use for more
qualitative measures when selecting students for graduate school, such as evidence of a
fit between student and program goals, writing/communication, integrity,
fairness/openness/honesty, trustworthiness, maturity, responsibility, work habits, and
consistency. Walpole’s subjects support the use of applicants submitting a written
statement to admissions stating why they want to attend the institution and what their
goals are to assess students’ writing skills and fit of the student to the program. Others
(Hoefer and Gould, 2000: 229; Willingham, 1976) agree, qualitative measure should be
used, though most seem to be unable to offer ways to quantify qualitative student
information other than through the use of interviews, which, given the large numbers of
graduate applicants, do not seem to be practical. The ETS (2004) has added a written
exam in addition to the quantitative and verbal sections of the exam (something the
GMAT already includes) to assess writing skills, but many institutions (such as AFIT) do
not require the assessment portion of the exam for entrance.
Gender is sometimes used as a predictor of success in graduation success studies,
though it comes with such mixed results, it doesn’t seem very practical a distinguisher of
applicants. Hoefer and Gould (2000) as well as House (1994) found gender to be
moderately, yet negatively, correlated to graduate GPA, meaning females performed

24
better in graduate school. Perperi and Trevelyan (1997) and Paolillo (1982) found gender
had no correlation or predictive capability of graduate GPA. It is interesting to consider,
however, how many institutions would reject applicants based on gender if gender
showed a high correlation to GPA. The same could be said for age and marital status
correlation studies, though researchers continue to look for correlations of different age
groups with graduate GPAs (Hoefer and Gould, 2000; House, 1998; Peiperi and
Trevelyan, 1997). None reviewed in this study revealed any consistent significant
differences.
Degree type can make a difference in graduate success in the science and
engineering fields due to the specific nature of work in these disciplines (Van Scotter,
1983). Faculty ratings have also shown to have predictive capabilities. Kuncel and
others (2001: 172) examined 190 records in which faculty ratings in verbal abilities as
well as quantitative abilities correlated highly with graduate GPA (r = .40 and r = .41
respectively). However, not all students have faculty ratings, they are extremely
subjective, and have not shown to be a valid measurement of students’ capabilities
(Harnett and Willingham, 1979). Kuncel and others also examined the predictability of
first year graduate GPA which correlates moderately with graduate GPA (r = .15-.27), but
if an applicant has not previously attended graduate school, admissions cannot rely on
this measure as appropriate. Previous work experience has the same limitations as first
year graduate GPA, and it has not shown to have significant predictability to graduate
GPA (Peiperi and Trevelyan, 1997: 356) This study contradicts research by McCloy and
others (1997), but supports Ree and others’ research (1994) that general cognitive ability
is all that really matters when predicting performance.

25
Although the literature has produced many research papers and studies about the
predictive abilities of measures other than standardized tests and undergraduate GPA to
graduate GPA, none have provided very useful tools to graduate institutions. Even
standardized tests, undergraduate GPAs, and written exams have provided very mixed
results for the general graduate admissions process. Like other schools, AFIT must rely
on the tools it has been given to assess candidates for its programs.
AFIT Specific Research
Currently, at least nine studies have been conducted for AFIT, in-residence,
master’s students about the predictability of success. Six theses have focused the
research on one or two particular disciplines at AFIT (Garwood, 2002; Zitzmann, 2002;
Spangler, 1989; Prokopyk, 1988; Humphreys, 1983; Keith, 1977). Similar to other
literature examined, the studies clearly show there is no consistent variable to predict
success at AFIT. One purpose of validation studies, however, is to find the most
predictive variables possible to help admission department look for the best combination
of factors when selecting students for their specific programs (ETS, 2004).
In 1977, Keith conducted the first predictability studies for AFIT’s Graduate
Systems Management and Graduate Operational Research programs. The study included
223 male U.S. Air Force officers from 1971-1976, a time when the admission
requirements and rules of graduation were quite different than they are today (Keith,
1977: 52-54; AFIT Catalog, 2002: 9-11). Keith used the traditional GRE/GMAT scores
and undergraduate GPA as measures of ability, AFIT volunteer status and number of pre-
admission tests as measures of motivation He also used marital status, age, time since

26
graduate degree, etc. as additional factors that could predict success at AFIT. At the time
of the study, students either applied to AFIT (volunteers) or were centrally identified as
highly qualified individuals and selected to attend AFIT (non-volunteers.) He found the
most significant predictors of degree receipt (his first success criterion) were included in
the motivational measures and marital status. Of the 23 students who did not receive a
degree, ten of them were single, non-volunteers to AFIT; none were single volunteers.
Twelve of the other thirteen students who did not receive a degree were married, over 30
years old, and had GMAT-T scores below 500 (or they did not take the test at all.) Keith
(1977) concluded AFIT’s admission measures were appropriate for assessing capability,
but not for assessing motivation. He also concluded the GMAT-Q (r = .437, r2 = 19.1)
was the most predictive of graduate GPA (his second success criterion) and the GMAT
was more predictive than the GRE for these two programs.
In Humphrey’s 1983 study of the Graduate Engineering Management program, he
examined 24 different variables to predict graduate GPA for a sample of 194 male U.S.
Air Force officers. Humphrey’s definition of success is a little different. He states
success is measured by whether or not a student completed the requirements on time or
not (degree receipt/non receipt,) but then categorized three different level of success
based upon graduate GPA. Twelve subjects did not graduate on time. Humphrey found
age, years in the military, months since undergraduate degree, architectural degree and
previous math experience to be contributing factors of success for this particular sample.
However, some of his results could be questioned since there was only one student in the
study who received an undergraduate architectural degree. Contrary to most other studies
in this literature review, GRE and GMAT scores apparently did not play a significant role

27
in the prediction analysis though he contributes this finding possibly due to the way the
data was manipulated during the course of the study (GRE-Q, r = .055; GRE-T, r = .096).
Prokopyk (1988) conducted a research study on the Graduate Operations
Research and Graduate Strategy and Tactics programs. Unlike Keith (1977), Prokopyk
used only graduate GPA as the success criterion, though he used as many as 29 different
predictor variables in his study. His findings were different from Keith’s eleven years
earlier. He found undergraduate GPA to be the most significant factor in predicting
graduate GPA, supporting the belief that past performance predicts future performance
(Willingham, 1974). He also made the conclusion, that although only two programs were
studied, each variable’s correlation to graduate GPA was different according to which
program students were enrolled in.
Spangler (1989) studied the Graduate Logistics Management (GLM) program
from 1986 – 1989 (N = 140). The research included eighteen predictor variables at the
beginning of his study, but in the end, found only a few variables which offered
significant correlation with graduate GPA. Although Spangler agreed with Prokopyk’s
(1988) conclusion about undergraduate GPA, he chose to add a variable of undergraduate
GPA multiplied by a school ranking score, based upon where the undergraduate degree
was obtained and how difficult the school’s admission requirements were (RATGPA).
RATGPA’s correlation was much stronger than that of undergraduate GPA alone (r = .24
vs. r = .48). Spangler also looked at undergraduate math grades and courses to be
predictive of graduate GPA, but found little correlation. This is not surprising since the
GLM requirements for graduation do not include many mathematics courses (AFIT
Catalog, 2002: 161-162). Other significant correlations were the GMAT-V (r = .449,)

28
GRE-T (r = .483,) and GRE-Q (r = .502). Interestingly, Spangler conducted a smaller
study within the study using a small sample of 1989S students who completed a
motivational survey with stronger results than any other measure (r = .514) clearly
supporting many views that motivation is a key factor in graduate school performance
(McCloy et. al, 1994; Roth et. al, 1996; Keith, 1977).
Zitzman (2002) and Garwood (2002) completed the most recent predictability
studies only two years ago. Zitzman’s study included a sample size of 146 students from
the 1995-2002 Graduate Engineering and Environmental Management program.
Garwood’s study included 106 students from the 1992-2001 Graduate Cost Analysis
program. Zitzman measured admission requirements’ (undergraduate GPA, GRE-V,
GRE-Q, and undergraduate math GPA) correlation to four success criteria (graduate
GPA, thesis grade, coursework graduate GPA, and first year graduate GPA.) Overall, the
GRE-V scores, GRE-Q scores, and undergraduate GPA correlated with graduate GPA,
coursework graduate GPA, and first year graduate GPA. However, no admission
requirements significantly predicted thesis grades (perhaps due to the largely skewed
grade distribution) and the undergraduate math GPA did not significantly correlate to any
of the success criteria (despite the overwhelming number of undergraduate engineering
degrees). Again, however, the graduate degree focus is management, not applied
engineering. Interesting to note, Zitzman (2002) conducted regression analysis on rank,
undergraduate school, gender, and ethnicity, but due to the small representation of
women and minorities (AFIT is historically white, male dominated,) he was unable to
detect any significance for gender or ethnicity. Needing significant representation of
groups within the sample was further emphasized by a good representation of variety of

29
rank and undergraduate schools, where significance was noted, though the variance
explained was not significant enough for the variables to be considered an important
factor in his study.
Garwood (2002), also noting the skewed distribution of thesis grades, removed
them from the final graduate GPA and based success primarily upon the adjusted GPA.
He conducted analyses on both GPAs, but found the adjusted GPA worked best. The
GMAT-T scores had the highest correlation to adjusted GPA (r2 = .201,) which suggests
the GMAT should be the standardized test of choice for the AFIT Cost Analysis program,
another management program. He also concluded the GRE-Q had much more predictive
capability than the GRE-V (r2 = .194 and r2 = -.032 respectively.) Garwood (2002) goes
so far as to say the GRE-V score should not even be considered in the admission criteria
of future students. Also important to note, undergraduate GPA had low predictability on
its own, but when added with other variables such as GMAT/GRE scores, its significance
increased dramatically, supporting the ETS recommendation to use both factors when
assessing prospective students (ETS, 2004). Similar to Zitzman’s (2002) findings,
Garwood (2002) found undergraduate math scores had no significance in any of the
models tested. Work experience oddly had a negative effect on final grades; the more
work experience and time in service a student had, the worse the GPA. This begs the
question of how valuable the individuals with considerable work experience consider the
AFIT degree and what they believe is essentially important in their careers as officers.
Prior enlisted students never received a grade higher than 3.8 or lower than 3.2; however,
no obvious correlation significant enough to be of consequence in this study. One other
finding was interesting in Garwood’s study: contrary to Spangler (1989) and Hoeffer and

30
Gould (2000,) but in accordance with the findings of Zitzman (2002,) undergraduate
GPA combined with an undergraduate school ranking had no significant predictive
capability for the Cost Analysis program population.
Although justification of research within individual disciplines is certainly valid
and encouraged (ETS, 2004), it is appropriate to conduct another AFIT-wide study to
include the science and engineering departments within the analysis. We expect to
notice differences in predictive variables across disciplines, but it is unclear what types of
differences we will find. At least three AFIT thesis studies have focused on AFIT-wide
predictive capabilities and application (Van Scotter, 1983; Buckley, 1989; Sny, 1991;).
All have concluded what we have already noticed in other AFIT studies: no one or two
predictors are the same for any program, or even any of the different research years
presented.
Van Scotter (1983) examined a population of 2170 students across AFIT from
1977-1982. He found no admissions criteria significantly correlated to graduate GPA for
all programs. For example, GRE-V had significant values for only 6 of the 17 masters
programs and that was the highest correlated variable. His findings, however, supported
his hypotheses, which were all to determine that each program’s needs were different, not
to find the most predictive admission criteria. He proved his hypotheses to be true in
every aspect. The variance for each predictor variable (GRE/GMAT scores, UGPA, prior
service, rank, time in service, etc.) was so great from program to program, Van Scotter
could make very few solid conclusions. He did mention, however, prior enlisted students
performed generally worse than those with no prior service and that although
undergraduate GPA and GRE/GMAT test scores were not significant across all programs,

31
he believes they should still be used to make admission decisions above subjective
“passes” into AFIT.
Sny (1981) examined a population of 4507 from 1975-1987 which duplicated Van
Scotter’s thesis efforts, though expanded the time frame. Buckley’s (1989) thesis
covered the time period of Van Scotter and Sny together (1977-1987) minus two years in
the beginning to give a comprehensive view of the two theses combined (N = 4170). Sny
and Buckley both used undergraduate GPA, GRE, and GMAT scores as predictor
variables, though Sny also included students’ age, enlisted years of service and
commissioned years of service. Collectively, they both concluded no variables were
consistent across all programs, though the GRE/GMAT scores had generally more
predictive capabilities than other factors. When they broke the population into sub-
populations according to program, there was often not enough data to give any significant
results for any program. This could be due to the lack of information technology and
poor record keeping of AFIT (Baker, 2004) of student information. Although the
researchers had sufficient populations, missing data fields probably contributed to low
uses of predictor variables in their analyses. This could also be true for Van Scotter’s
results as well.
Although only three of the nine studies examined in this literature review were
conducted for all of AFIT programs and departments, no study has been conducted to
include all AFIT students in over ten years. According to registration officials, record
and data keeping are still deficiencies being worked on at AFIT (Baker, 2004). With the
increase in information technology, every graduate school should keep records of
students if, for no other reason, than to validate school policies and admission criteria.
32
This research effort will only include the last three years of data from AFIT in an effort to
validate current practices of admissions, which are very subjective and “loose” in
accordance with the educational testing service recommendations (AFIT Catalog, 2004;
ETS, 2004) that many factors be examined when admitting students to graduate
programs.
Summary
This chapter has review historical and current literature in the area of predictive
capability of admission requirements to graduate schools. First, a thorough review of
literature about success criteria was examined. Although a variety of success criteria
exists, graduate GPA appears to be the most appropriate criterion for this study. Next,
GRE/GMAT scores, undergraduate GPA, and other criteria were examined for their
predictive capabilities of graduate school success. Although no researcher agrees on
specific predictive criteria, several studies have shown varying results for each of the
criteria which will be used in this study. And finally, this chapter covered AFIT specific
research in the area of predictive admissions criteria through the years and programs.
Once again, no specific criteria demonstrated to be the most significant for different
studies or programs, validity studies have been necessary to AFIT’s administration when
reviewing standards of admission throughout its history. Chapter 3 will explain the
methodology used in this validity study for AFIT admission requirements.

33
III. Methodology
Chapter Overview
The purpose of this chapter is to examine the methodology for this research effort. The
study is a validation study to satisfy that the requirements of AFIT admissions are
appropriate and valid. We seek to find correlations of undergraduate GPA, GRE/GMAT
scores, and graduate GPA. In addition, we seek to discover if students who require a
waiver perform as well as, worse than, or better than students who do not receive a
waiver for admissions. This chapter will present the data collection methodology,
research design, research analysis methods, and the restrictions and limitations.
Data Collection
The data for this effort was obtained from two separate databases. Military data
about students was obtained from the Air Force Personnel Data System from the military
personnel flight at AFIT. Academic information was obtained from the computer support
personnel at AFIT. The data was then combined in a single excel spreadsheet for use in
the study. Permission to view student records was given in accordance with the Air
Force Instruction 33-332, Privacy Act Program, paragraph 12.4.5, exception 5 and the
Family Educational Rights and Privacy Act of 1974 as Amended, section 34 CFR § 99.31
(a)(1).
Data was collected on 311 full time military, master’s students entering the
residence program at AFIT full time in 1999, 2000, and 2001, graduating in 2001, 2002,
and 2003 respectively. Academic data collected on each student included undergraduate

34
GPA, GRE and/or GMAT scores, graduate GPA, start time into AFIT, and graduation
date. Other information collected on each student included active duty service time, date
of commissioning (to determine whether or not a student had prior enlisted service time,)
primary Air Force Specialty Code (possible prior work experience,) marital status,
gender, and number of people within the household. Once the data was consolidated for
each student, a randomly assigned identification number was assigned to each record and
all names or identifying information was deleted from the files. All data was handled
within the limitations of the Privacy Act of 1974.
Research Design
As the literature reviewed showed, the results of similar predictability studies at
AFIT, other institutions, and across institutions have very mixed and sometimes
competing results. A correlational study, like the research shown in Chapter II,
“examines the extent to which differences in one characteristic or variable are related to
differences in one or more other characteristics or variables. A correlation exists if, when
one variable increases, another variable either increases or decreases in a somewhat
predictable fashion” (Leedy and Ormrod, 2001: 191). The purpose of this study is not to
examine every contributor to the success or failure of graduate students since no measure
exists which can include all the contributing factors of success or failure (“Predicting
Performance in Graduate School”, 1993: 494). The purpose is to validate current
admission criteria and to understand if waivers should be given to students who do not
meet the guidelines set for admission criteria. Therefore, the design of this research is to

35
choose which success criterion and predictor variables contribute solely to the objectives
of the study.
Success Criterion
As previously mentioned, the success criterion for this study will be academic
achievement measured by graduate GPA. Ultimately, the success of a student at AFIT is
degree attainment, though the GPA will be a good determinant of what students have
learned in their coursework. Two of the Higher Learning Commission’s proposed
criteria for accreditation include “student learning and effective teaching” and “acquiring,
creating, and applying knowledge” (HLC, 2003: 6-7). The measure of a GPA has proven
to be a widely accepted measure of learning and student progress (AFIT Catalog, 2002:
27, 29-30; Walpole et. al, 2002: 12).
A review of the literature showed other measures of academic achievement were
not applicable to the students at AFIT. For example, number of publications and
comprehensive exams are not a requirement of graduation. Time to completion and
degree attainment are not appropriate measures of success due to the fact that almost all
students graduate in the 18 month period. The few who do not would not statistically
make a difference in this study. Previous studies (Garwood, 2002: 43; Zitzman, 2002:
60) have shown thesis grades heavily skewed towards higher grades. Garwood theorizes
this is due to the fact that the advisor, who assigns the thesis grade, has reviewed the
document so many times that the final thesis is tailored to what the advisor is looking for,
“even if the student lacks the ability to produce that quality of document on his/her own”
(Garwood, 2002: 43). As was the case in Garwood (2002) study, the thesis grades for
this study are also skewed (Figure 1). However, this study is looking at the student’s

36
entire graduate experience which includes the thesis grade in the undergraduate GPA.
Thesis grades will be included in the final GPA of students and not considered a separate
measure of success.
Figure 1. Distribution of Thesis Grades
2 3 4
Graduate GPA was collected as a portion of the data from computer support data
system. Courses with a pass/fail grade or 0.0 credit hours (such as math laboratories and
colloquium courses required of all students) are not calculated into final grades. Also,
any transfer credits from previous graduate studies are not included in the AFIT final
GPA. Calculation of the final grade is figured by individual grades for courses multiplied
by the credit hours assigned to that course, added up and divided by the number of total
credit hours for all courses added together. The AFIT grading scale shown in Table 1
(AFIT Catalog, 2002: 24).

37
Table 1. AFIT Grade and Points System
Grade Points Grade Points A 4.0 C+ 2.3 A- 3.7 C 2.0 B+ 3.3 C- 1.7 B 3.0 D 1.0 B- 2.7 F 0.0
It is important to note that after a reorganization of the structure of AFIT, the
thesis grade increased in worth to 16.7% of the final grade, whereas it used to be only
12.1% of the final grade (Garwood, 2002: 44). This could be due to the emphasis AFIT
places on research and independent study. Part of AFIT’s mission is to “engage in
research activities that enable the Air Force to maintain its scientific and technological
dominance” (AFIT Catalog, 2002: 3). The thesis is an important part of each student’s
education and is reflected in the final GPA, our success criterion.
Predictor Variables
As discussed in chapter two, several variables have been used in the past to
predict graduate school performance such as: undergraduate GPA, GRE/GMAT scores,
faculty rating/ranking of students, letters of recommendation, gender, marital status, and
age. This research effort will focus on the current admission criteria for the whole school
as predictor variables. Admission criteria vary slightly between individual programs,
though the scope of this study will be overarching programs and we will not examine the
differences. For example, the engineering programs require an undergraduate degree in
engineering, which we will assume all students accepted into the program have obtained.
Certain programs also require undergraduate math courses through algebra or calculus,
depending on the math requirements for the master’s degree.

38
Also, this study will mainly examine predictive variables which are practical and
logical for use by AFIT. For example, we will not examine if age, or marital status have
correlation to graduate GPA because AFIT faculty would not typically use those
variables to determine a student’s eligibility to attend AFIT. Our main focus will be on
the predictability of undergraduate GPAs and GRE/GMAT scores, the primary criteria
for admissions into AFIT (AFIT Catalog, 2002: 9).
Undergraduate Grade Point Average
Undergraduate GPA is required for admissions into AFIT. The GPA must be at
least a 3.0 on a 4.0 scale from a regionally accredited university college (AFIT Catalog,
2002: 9). Once AFIT receives the transcripts of a prospective student, their
undergraduate GPA is configured according to AFIT operating procedures. The GPA is
based upon all courses taken, with no credit given for pass/fail courses or courses which
were audited. Any course that was taken twice is counted twice. For example, if a
student failed a course the first time (quality point = 0) and retook the course for a better
grade and received a B (quality point = 3,) both the 0 and 3 are added to the total quality
point value in the registrar’s new undergraduate GPA configuration and both courses are
included when computing total course hours taken.
Reconfigured GPAs only figure in whole letter grades; all plusses and minuses are
omitted (i.e. B+, B-, and B all receive a new score of 3.0). If the school uses a grading
scale of 5.0 and no grades are assigned to classes, AFIT converts the points into the
uniform scale based upon the instructions on the transcripts. If no instructions exist,
admission counselors from AFIT will call the undergraduate institution to request more
information about their grading system. All grades are assigned a point value based upon
39
the following scale: A = 4.0; B = 3.0; C = 2.0; D = 1.0; and F = 0.0. If a student has
studied at the graduate level at another institution, less weight may be placed upon the
undergraduate record. However, if the prospective student’s undergraduate GPA is
below a 3.0, he/she will still require a waiver to attend AFIT (Hoon, 2004). The value of
the AFIT system is to allow students to be evaluated for admissions based upon a
standardized system.
The undergraduate GPA for all students is maintained in their academic records as
well as within the AFIT database. Undergraduate GPAs for this study were obtained by
the computer support personnel at AFIT. Any missing undergraduate GPA fields within
the database were manually populated by going back to the student’s original, hard-copy
records. All data was handled with the guidelines set forth in the Privacy act of 1974.
Graduate Record Examination/Graduate Management Admissions Test
The GRE is divided into three separate tests, two of which are required for
entrance to AFIT. The admission criteria state a student must meet or exceed a score of
500 on the GRE Verbal reasoning exam (GRE-V) and a 600 on the GRE Quantitative
reasoning exam (GRE-Q). A student may also submit a score that meets or exceeds 550
on the total GMAT examination.
The GRE-V scores have a range from 200 to 800 with a mean of 469 and a
standard deviation of 119. Students who receive a score of 500 on their exam, the
minimum score for entrance into AFIT, performed better than approximately 59% of all
students who took the exam from 1 July 1999 through 30 June 2002. The GRE-Q scores
have the same range with a mean of 591 and a standard deviation of 148. Students who
receive a score of 600 on their exam, the minimum score for entrance into AFIT,

40
performed better than approximately 48% of the other students taking the exam during
the same year period mentioned above (ETS, 2004).
Although GRE Analytical reasoning (GRE-A) scores are not required for
admissions into AFIT, they will be included in this study. The GRE-A includes writing
tasks of “issue” and “argument.” The range for GRE-A scores is from 0 to 6, given in
half point increments. Students who took the exam from 1 July 1999 through 30 June
2002 who scored 4.5 or higher scored better than approximately 47% of examinees; 5 or
higher scored better than 67%; and 5.5, 84% higher (ETS, 2004). However, in the data
received from computer support, the scores have been converted into a range from 200 to
800 similar to the GRE-V and GRE-Q scores.
The GMAT total scores have a range from 200 to 800 as well, with a mean of 528
and a standard deviation of 112. Students who completed the GMAT from January 2000
through December 2002 and scored 550, the minimum required score for eligibility into
AFIT, scored higher than 54% of other examinees (GMAT, 2004).
AFIT Program, Air Force Specialty Codes, and Prior Work Experience
The program each student is assigned to will be examined separately as well as in
comparison to each other. The data collected contains students from each of the
following programs: Logistics Management (GLM); Information Resource Management
(GIR); Applied Physics (GAP); Astronautical Engineering (GA); Computer Systems
(GCS); Operations Research (GOR); Electrical Engineering (GE); Graduate Acquisition
management (GAQ); Space Operations (GSO); Aeronautical Engineering (GAE);
Meteorology (GM); Engineering and Environmental Management (GEE); Computer
Engineering (GCE); Nuclear Engineering (GNE); and Electro-Optics (GEO). The

41
purpose of correlating the students in each program with graduate GPAs is to possibly
establish a base-line between programs for total institution correlation with graduate
GPAs. The students in each program typically have similar courses and professors. If
the students in one program maintain high graduate GPAs while students in another
program maintain low GPAs, questions could arise as to the level of students each
program accepts or to the standards of grading and/or individual attention program
directors and faculty within the program give to students in their programs. The quality
of instruction a student receives from program faculty members can also be a reflection
of the ratio of students to professors in the separate programs as well.
We will examine the correlation of Air Force Specialty Codes, prior work
experience while in the military, and prior enlisted time as variables to predict graduate
GPA. Though the education at AFIT is similar in many ways to the general education a
student would receive at any institution, many examples in class as well as thesis topics
are focused on real situations an individual might experience in future career positions
within the military. Program directors and faculty members who decide upon waiving
requirements into their program could possibly make a better informed decision based on
how much work experience a prospective student has in the area of program studies.
All the predictive variables chosen for this study have usefulness to AFIT faculty
members as well as the students themselves. As more students apply for and/or are
chosen for AFIT, waivers could become standard practice. Currently, the main focus of
admissions is upon undergraduate GPA and standardized test scores, but as more
researchers give conflicting results from validation studies, AFIT must rely on more
subjective methods of granting admissions and waivers for admission. The predictive

42
variables within this study are quantitative examples available within student records
which they can rely on to make decisions about students who might require admission
criteria to be waived.
Research Analysis Methods
The first two investigative questions of this study are: 1) Do current
measures of capability, such as the GRE or GMAT standardized tests, have any
predictive capability on AFIT student performance? and 2) Do current measures of past
performance, such as undergraduate GPAs, have any predictive capability on AFIT
student performance? Although the main focus is on current admission criteria, we will
also examine the predictability of the variables mentioned above. The research analysis
regarding predictability of graduate performance will be through a multiple regression
model. The final two questions, 3) Is there a difference in performance between students
who meet all admissions requirements and those who require a waiver? and 4) Is there a
difference in performance depending on which admission requirement is waived
(GRE/GMAT scores or undergraduate GPA)?, will be examined using a paired difference
experiment to determine if there is a significant difference between the populations in
question.
Multiple Regression Model
Many factors contribute to the success of graduate school students. One way to
analyze the correlations of the different variables which contribute to success is through
multiple regression analysis. Multiple regression models are probabilistic models that
incorporate more than one independent variable and typically follow the general form:

43
E(y) = β0 + β1x1 + β2x2 + … + βkxk + ε
where y, the dependent variable, is a function of k independent variables (x1, x2, …xk), βk
weightings which describe the contribution of the independent variable xk, and and error
term, ε, which represents the random error within the equation to make it a probabilistic
model rather than deterministic (McClave et. al, 2001: 534). The purpose of using a
multiple regression model is to predict a future response based on historical data. This
study seeks to predict future graduate success at AFIT based on the success of previous
students.
After data collection, several steps must be taken to determine the predictability
of graduate success from our independent variables. Once the data is collected, the
information must be “coded” into appropriate parameters for use in the software. The
independent variables incorporated into this study include: undergraduate GPA, GRE-V
scores, GRE-Q scores, GRE-A scores, GMAT scores, Air Force Specialty Codes
(AFSC,) prior enlisted experience, prior work experience (work exp,) program assigned
to at AFIT (program,) gender, number in household, rank, and SCI/MGT (a dichotomous
variable indicating if a student is in a scientific program (0) or management program (1).
Because the undergraduate GPA and test scores are numeric, they will be entered exactly
as they appear. However, prior enlisted experience will also be a dichotomous variable
coded one (1) if they have prior experience in the military and zero (0) if not. The
independent variable work experience will be coded as the number of years a student has
in the military prior to entrance to AFIT, including prior enlisted time. Each program
will be coded using dummy variables. A list of the codes for dummy variables can be
found in Appendix A. For example, if a student is assigned to the GAE program, the

44
code entered will be 1, GAI will be 2, etc. One program must be coded 0 to create a
baseline for the software to interpret the information. In this study, the baseline 0 code
will be assigned to the GA program. A list of AFSCs and their dummy codes can also be
found in Appendix A.
Next, scatter plot graphs were generated to examine any correlations the
independent variables have to one another. The purpose of this step is to determine if
redundancy in the data exists. For example, if GRE total scores were one of our
independent variables, the scatter plot graphs would show a high correlation of the GRE
total scores with GRE-V, GRE-Q, and GRE-A scores. This would indicate redundancy
in the data and one of the variables would not need to be placed in the model. In fact, if
redundancy exists in the model, we will not achieve the results we would like to see, but
will incorporate biases within our analysis.
Scatter plot graphs with each individual independent variable with the dependent
variable will give indications of which variables have some predictive capability. A
pattern in the graph will show positive or negative correlations to graduate success and
can help us determine which variables to include in our full regression model.
The full regression model is not our final model, though we will treat it as one
before we begin paring it down to the kernel model. The kernel model is the best fit
model with the existing data, the most predictive model achievable given the data which
exists for the study. At this point, several diagnostic tests must be completed on the full
model as well as the reduced kernel model. A summary of fit test, analysis of variance,
Cook’s Distance plot, studentized residual plot, and a constant variance test will be
conducted to determine the reduced kernel model is the best model available. The final

45
model will indicate the predictive probabilities that our independence variables have on
graduate success, answering investigative questions one and two.
Tests of Hypothesis
Investigative questions (IQ) three and four seek to determine differences from at
least two populations. First, IQ 3 seeks to determine if there is a difference in the
graduate GPAs of students who require a waiver and those who do not. IQ 4 seeks to
determine if there is a difference in graduate GPAs of students who receive a waiver for
undergraduate GPA and students who receive a waiver for their standardized test scores.
The statistical method used will be to make inferences through tests of hypothesis.
In IQ three, our two populations are 1) students who met all the admission criteria
and 2) students who required at least one waiver to attend AFIT. This study proposes
that there will be a difference in performance between the two populations, that the
graduate GPA for students who meet all admission criteria will be larger than students
who do not meet all admissions criteria. The null hypothesis is that there is no difference
between the means of the sample graduate GPAs (1: students without a waiver and 2:
students with a waiver). Our alternative hypothesis is that the difference in the means is
greater than 0, or the mean graduate GPA of students who meet all the requirements is
greater than the mean graduate GPA of students who do not meet all the requirements.
He hypothesis test is as follows:
H0: (µ1 - µ2) = 0
Ha: (µ1 - µ2) › 0
The test statistic calculated will indicate whether or not the null hypothesis can be
rejected. If the null hypothesis is rejected, it is important to remember the results do not

46
prove the students who receive a waiver have more success, only that statistical evidence
suggests we can reject the null hypothesis, or that a positive difference in graduate GPAs
exists. The formulas we will use to determine test statistic is:
Large Sample TS = (Xbar1 – Xbar2) – 0 √[(σ1
2 / n1) + (σ22 / n2)]
where n = sample size; Xbar = sample mean; and
σ = sample standard deviation.
We will reject the null hypothesis if the value of the test statistic is greater than zα, where
α = .05, which is the standard alpha for hypothesis testing. Assumptions for using
hypothesis testing include: 1) the samples of graduate GPAs have an approximately
normal distribution and 2) the samples are randomly selected from the population
(McClave et al., 2001: 412-415). Our experiment meets both assumptions.
For IQ four, we used the same methodology as in IQ three. However, our data
was divided into four subdivisions to reflect differences in populations of undergraduate
GPA and the three separate exams. Our four tests were between the graduate GPAs of
students who required waivers for: undergraduate GPA and GMAT scores; undergraduate
GPA and GRE-V scores; undergraduate GPA and GRE-Q scores; and undergraduate
GPA and both GRE-V and GRE-Q scores. Our hypotheses for each of the four are:
H0: (µ1 - µ2) = 0
Ha: (µ1 - µ2) › 0, or (µ1 - µ2 ) ‹ 0
where µ1 is the mean of GMAT waiver students’ graduate GPA, GRE-V waiver students’
graduate GPA, GRE-Q waiver students’ GPA, and GRE-V and GRE-Q waiver students’
47
graduate GPA respectively for each of the four tests; and µ2 is the mean of undergraduate
GPA waiver students’ graduate GPA. The standard deviations and test statistics will be
configured as follows:
Large Sample TS = (Xbar1 – Xbar2) – 0; Small Sample TS - (Xbar1 – Xbar2) – 0 √[(σ1
2 / n1) + (σ22 / n2)] √[Sp
2 * (1/n1 + 1/n2)]
where Sp2 = [(n1 – 1) * S1
2 + (n2 – 1) * S22]
n1 + n2 - 2
n = sample size;
Xbar = sample mean; and
S or σ = sample standard deviation.
Due to the small sample size for three of the four tests (N ‹ 30), our test statistic
will be measured against a z-value based on n1 + n2 – 2 degrees of freedom (McClave et
al., 2001; 362). Assumptions are the same as in IQ three.
Model Validity
To test the validity of our regression model, a random twenty-five percent of the
data will be removed before developing out model. Once the model is complete, we will
run the models with the twenty-five percent to see if our results still hold. The desired
outcome is for the R2 value to be as good as it was for the reduced kernel model once the
new data is entered. This will indicate a percentage up to 100% of the variance of
graduate success (indicated by graduate GPAs) is explained by the independent variables
(undergraduate GPA, test scores, gender, etc.) of our reduced models.

48
Restrictions and Limitations
The main restrictions and limitations of this research study are the restriction in
range of student GPAs and test scores and the accuracy of the data.
The restriction in range is common in predictability studies for graduate success
(Kuncel et. al, 2001). The issue is that GPAs and test scores are taken for students who
are accepted into the school and, in AFIT’s case, graduate from the school. It is difficult
to determine how many, if any, students were turned down for AFIT eligibility, and the
data for students who did not meet the admissions criteria is not available. The impact of
range restriction is somewhat limited due to the fact that AFIT grants waivers into its
programs. This means that we have a larger (and acceptable) range for our study, of
undergraduate GPAs and test scores than if anyone who did not meet the criteria were
automatically rejected from admissions. Similarly, graduate GPAs collected are for
students who completed the program on time and graduated from AFIT. For the time
covered in this study, only six students did not complete the program, though we do not
have complete data for any of the five students and therefore cannot use them in the
study. Only one of the five withdrew due to academic reasons and one passed away
before completion of AFIT. However, due to the small number of students who did not
complete the program, the missing data should not statistically affect the outcome of the
research.
Data accuracy could also be a limitation to this research. The data was compiled
from two separate databases and does not match up completely. Several students in one
database are not included in the other and vice versa. The registrar’s office at AFIT has
been trying to correct this problem for several years and the last three years of data is
49
more accurate than any thus far (Baker, 2004). Missing data points could reduce our
population for the study, though we still expect to have a significant representation of all
programs within the institution.
Summary
This chapter has explained the methodology which will be used in this study. It
discussed the data collection methods, research design, success criteria, and predictor
variables to be used in regression analysis. This chapter also covered the specific
hypothesis testing used to answer investigative questions three and four. Investigative
questions were reiterated in statistical terms which will be the focus of this study.
Finally, this chapter discussed model validity methodology and the restrictions and
limitations of this research effort. The following chapter will be a compilation of the data
analysis.
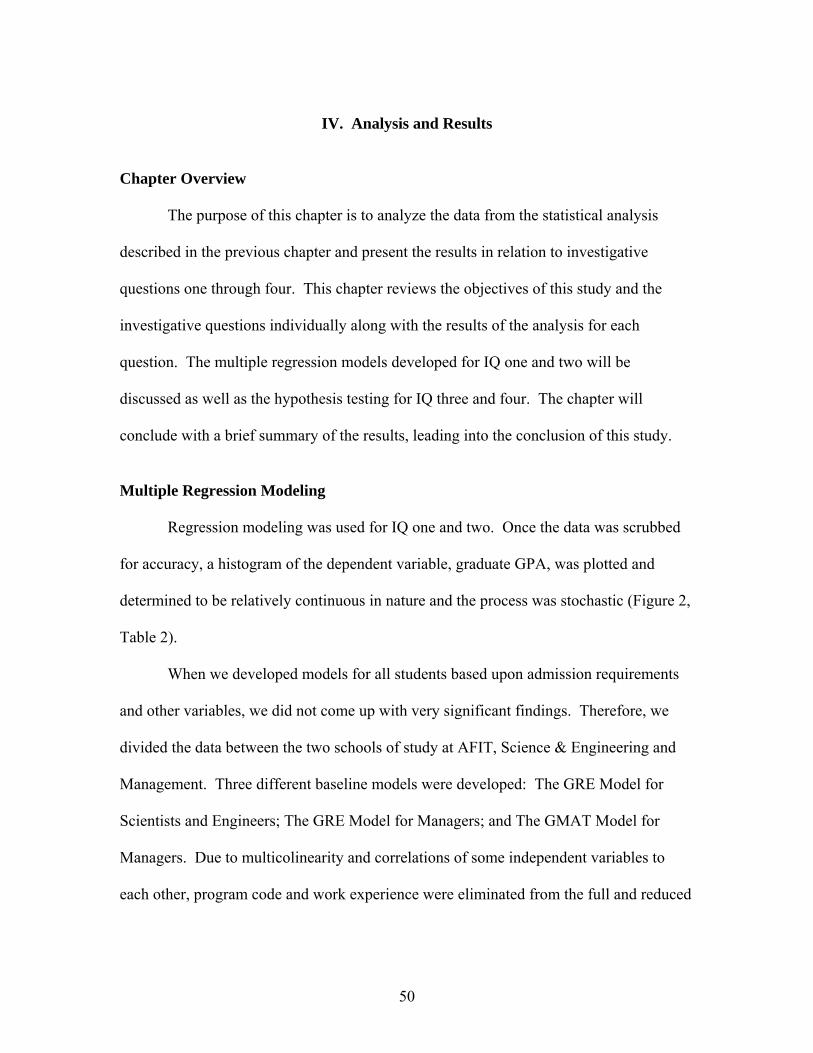
50
IV. Analysis and Results
Chapter Overview
The purpose of this chapter is to analyze the data from the statistical analysis
described in the previous chapter and present the results in relation to investigative
questions one through four. This chapter reviews the objectives of this study and the
investigative questions individually along with the results of the analysis for each
question. The multiple regression models developed for IQ one and two will be
discussed as well as the hypothesis testing for IQ three and four. The chapter will
conclude with a brief summary of the results, leading into the conclusion of this study.
Multiple Regression Modeling
Regression modeling was used for IQ one and two. Once the data was scrubbed
for accuracy, a histogram of the dependent variable, graduate GPA, was plotted and
determined to be relatively continuous in nature and the process was stochastic (Figure 2,
Table 2).
When we developed models for all students based upon admission requirements
and other variables, we did not come up with very significant findings. Therefore, we
divided the data between the two schools of study at AFIT, Science & Engineering and
Management. Three different baseline models were developed: The GRE Model for
Scientists and Engineers; The GRE Model for Managers; and The GMAT Model for
Managers. Due to multicolinearity and correlations of some independent variables to
each other, program code and work experience were eliminated from the full and reduced

51
models. GRE-A was omitted from the baseline models because the models were used to
determine the predictability of admission requirements. GRE-A is not currently an
admission requirement and greatly reduced the number of data points which could be
used for each model. For IQ one and two, graduate GPA was the dependent variable and
combinations of the other independent variables were tried. Our focus was on GMAT,
GRE-V, GRE-Q, and undergraduate GPA as predictor variables. However, various
combinations were tried to include prior enlisted time, number of household members,
gender, rank, and AFSC.
Figure 2. Graduate GPA Distribution Histogram
3 3.1 3.23.3 3.43.5 3.63.7 3.83.9 4 4.1
Table 2. Graduate GPA Goodness-of-Fit Test: Shapiro-Wilk W Test
W Prob<W0.942967 <.0001

52
GRE Baseline Model for Scientists & Engineers
The full model for Scientists & Engineers using GRE scores to predict graduate
GPA included data from 112 students for the independent variables: undergraduate GPA;
GRE-Q scores; GRE-V scores; Rank/Grade; prior enlisted; AFSC Code; Gender; and
number of members in household. Eight data points were determined to be influential
through the Cook’s Distance Influential diagnostics and removed from the full and
reduced model. The parameter estimates are shown in Table 3. All other diagnostics are
included in Appendix B. The full model had an adjusted R2 value of .1871 indicating
approximately 19% of the variability in graduate GPA can be attributed to the
independent variables used in this model.
Table 3. Parameter Estimates: Full Model GRE for Scientists & Engineers
Term Estimate = β Std Error t Ratio Prob>|t| Intercept 2.2802035 0.302292 7.54 <.0001 UGPA 0.1913769 0.056618 3.38 0.0011 GRE-Q 0.0008058 0.000348 2.32 0.0228 GRE-V -0.000094 0.000263 -0.36 0.7208 Rank/Grade 0.0539065 0.02944 1.83 0.0704 Prior Enlisted -0.118499 0.04742 -2.50 0.0143 AFSC 0.0098429 0.008049 1.22 0.2245 Gender 0.1127232 0.094629 1.19 0.2367 In Household Desc COUNT -0.005994 0.022332 -0.27 0.7890
Then, independent variables were removed through forward stepwise regression,
one at a time, to determine the most robust, parsimonious, reduced model. The reduced
model has an adjusted R2 value of .1931, an increase of less than one percent from the
full model. However, all p-values for the independent variables included in the model are
below .1, our boundary indicated in stepwise regression model building.
The reduced model for Scientists & Engineers contained four independent
variables: undergraduate GPA, GRE-Q scores, prior enlisted, and rank/grade, with
approximately 19% variability in graduate success attributed to these variables. The

53
parameter estimates are given in Table 4. Additional diagnostics are displayed in
Appendix F.
Table 4. Parameter Estimates: Reduced Model GRE for Scientists/Engineers
Term Estimate = β Std Error t Ratio Prob>|t| Intercept 2.3155586 0.294445 7.86 <.0001 UGPA 0.1976235 0.053893 3.67 0.0004 GRE-Q 0.0009257 0.000335 2.77 0.0068 Rank/Grade 0.0467071 0.027664 1.69 0.0946 Prior Enlisted -0.127741 0.045292 -2.82 0.0058
All p-values for the independent variables are less than the standard .05, indicating good
predictability, except Rank/Grade. However, deleting another variable greatly reduced
the overall predictability of the model and increased the possibility of over-fitting the
model to the data. When our model was validated, entering the 25% data points taken out
during model building, the R2 value dropped to .1732, only a 2% drop, indicating the
model is robust and does not over-fit the data used during model building. Diagnostics
on the validated model are included in Appendix H.
The F-test was used to indicate whether a positive difference in the reduced model
exists by measuring the value of the additional variables in the full model. Our F-test
indicated the reduced model was more parsimonious than the full model and appears to
provide better predictions of graduate GPA than the full model.
GRE Baseline Model for Managers
Only sevan independent variables used in the GRE baseline model for scientists
and engineers were used in the GRE baseline model for managers. Gender was
eliminated due to an insufficient number of females in the study. The sample size was 48
students. The parameter estimates are shown in Table 5. All other diagnostics are
included in Appendix C. The full model had an adjusted R2 value of .5170 indicating

54
approximately 52% of the variability in graduate GPA can be attributed to the
independent variables used in this model.
Table 5. Parameter Estimates: Full Model GRE for Managers
Term Estimate = β Std Error t Ratio Prob>|t| Intercept 2.6068535 0.364757 7.15 <.0001 UGPA 0.2096701 0.052857 3.97 0.0003 GRE-Q 0.0016187 0.000287 5.65 <.0001 GRE-V -0.00107 0.000388 -2.75 0.0088 Rank/Grade 0.0248257 0.039389 0.63 0.5321 Prior Enlisted -0.000046 0.043189 -0.00 0.9992 In Household Desc COUNT 0.016003 0.017308 0.92 0.3607 AFSC -0.014725 0.006683 -2.20 0.0334
Nine data points within the full model were shown to be influential according to
the Cook’s Distance Influence diagnostics and were removed from the model. Then,
independent variables were removed according forward stepwise regression techniques,
one at a time, to determine the most robust, parsimonious, reduced model. Interestingly,
the GRE-V variable indicates a negative correlation to graduate GPA, bringing into
question the importance of the GRE-V test to incoming students. The reduced model has
an adjusted R2 value of .5356, approximately 2% above the full model.
The reduced model for managers contained four independent variables:
undergraduate GPA, GRE-Q scores, GRE-V scores, and AFSC, with approximately 54%
variability in graduate success attributed to these variables. The parameter estimates are
given in Table 6. Additional diagnostics are displayed in Appendix F.
Table 6. Parameter Estimates: Reduced Model GRE for Managers
Term Estimate = β Std Error t Ratio Prob>|t| Intercept 2.8509723 0.245969 11.59 <.0001 UGPA 0.1978809 0.045503 4.35 <.0001 GRE-Q 0.0015296 0.000252 6.07 <.0001 GRE-V -0.001148 0.000372 -3.09 0.0035 AFSC -0.015771 0.006416 -2.46 0.0181
All p-values for the independent variables are less than the standard .05, indicating good
predictability. When our model was validated, entering the 25% data points taken out

55
during model building, the R2 value surprisingly dropped to -.3894. The p-values for all
variables increased considerably and the beta estimates (our practical significance) for
GRE-Q, GRE-V, and AFSC reversed signs for this data set. The sample size was only
13, as six data points were removed due to influencing the model too much, although the
difference in the models is too great to be explained only by the smaller sample set.
Diagnostics on the validated model are included in Appendix I.
Despite the negative validation results, the F-test indicated the reduced model was
more parsimonious than the full model and appears to provide better predictions of
graduate GPA than the full model.
GMAT Baseline Model for Managers
The full model for Managers using GMAT scores to predict graduate GPA
included data from 21 students for the independent variables: undergraduate GPA;
GMAT scores; Rank/Grade; prior enlisted; AFSC; and number of members in household.
Gender was not included in the full model because the sample was 100% male. The
parameter estimates are shown in Table 7. All other diagnostics are included in
Appendix D. The full model had an adjusted R2 value of .7877 indicating approximately
79% of the variability in graduate GPA can be attributed to the independent variables
used in this model.
Table 7. Parameter Estimates: Full Model GMAT for Managers
Term Estimate = β Std Error t Ratio Prob>|t| Intercept 2.9852362 0.287084 10.40 <.0001 UGPA 0.03616 0.040428 0.89 0.3862 GMAT 0.0010989 0.000287 3.83 0.0018 Rank/Grade 0.1085052 0.042573 2.55 0.0232 Prior Enlisted -0.131235 0.033339 -3.94 0.0015 AFSC -0.019662 0.005373 -3.66 0.0026 In Household Desc COUNT 0.0108721 0.015436 0.70 0.4928

56
Three data points within the full model were shown to be influential according to
the Cook’s D Influence diagnostics and were removed from the model. Then,
independent variables were removed according to forward stepwise regression
techniques, one at a time, to determine the most robust, parsimonious, reduced model.
Independent variables were removed until the variables left in the model displayed a p-
value less than 1.0 and the R2 value ceased increasing. The reduced model has an
adjusted R2 value of .7910, less than 1% higher than the full model.
The reduced model for managers contained four independent variables:
undergraduate GPA, GMAT scores, and prior enlisted, and rank/grade, with
approximately 79% variability in graduate success attributed to these variables. The
parameter estimates are given in Table 8. Additional diagnostics are displayed in
Appendix G.
Table 8. Parameter Estimates: Reduced Model GMAT for Managers
Term Estimate = β Std Error t Ratio Prob>|t| Intercept 3.0852446 0.266415 11.58 <.0001 GMAT 0.0011681 0.000278 4.20 0.0007 Rank/Grade 0.1128572 0.041022 2.75 0.0142 Prior Enlisted -0.122582 0.032441 -3.78 0.0016 AFSC -0.021002 0.005207 -4.03 0.0010
When our model was validated, entering the 28% data points taken out during model
building, the R2 value decreased to .6916, though still indicating a robust model. The
validation model was a very small sample of only eight datapoints and none were
removed due to being over-influential. Diagnostics on the validated model are included
in Appendix J.
Once again, the F-test indicated the reduced model was better as a whole than the
full model and appears to provide better predictions of graduate GPA than the full model.

57
Investigative Question 1
Investigative Question 1 states “Do current measures of capability, such as the
GRE or GMAT standardized tests, have any predictive capability on AFIT student
performance?” The hypothesis for this question was that GRE tests have low to moderate
predictive capability on AFIT student performance and we would be unable to determine
whether or not the GMAT had any predictive capability due to the low number of
students who take the GMAT exam.
The GRE/GMAT exams have been shown to have predictive capability in
previous studies outlined in Chapter II. However, the correlation typically show less than
30% of variation of graduate GPA is due to GRE/GMAT test scores. The GRE tests for
general cognitive ability. However, it does not take into account motivation of students,
unforeseen events in a student’s life (death in family, marriage, birth of a new child, etc.),
devote professors to help a student through a program, specific knowledge a student may
require for a degree in a specific field, and many other factors which contribute to
graduate school performance. At the master’s level, studies are not as general as they
were in undergraduate programs and a student must begin to think and process
information in a more specific manner. Therefore, students could receive an excellent
GRE score, but not be able to adjust to a master’s curriculum and do poorly, or vice
versa. The GMAT test measures general cognitive ability, but in relation to business
ideas and practices. Though it does not take into account many of the items listed above
which also have to do with graduate performance, we believe it will be a better predictor
of success for students entering the management programs at AFIT.

58
The sample used for this study can be categorized according to the pre-entrance
exams they each student took (Table 9). Scores from students who took the GRE tests
showed mixed correlations to graduate GPAs when used alone (Figures 3 and 4,
Appendix K and L). However, when used in conjunction with undergraduate GPA and
other variables, the correlations were typically stronger. The GRE-V scores showed a
moderate correlation within the GRE baseline model for managers, with good statistical
significance levels (p-values) and positive practical significance (beta estimates). The
GRE-Q scores showed a much higher correlation to graduate success in both models
developed. The adjusted R2 values for the models developed using GRE scores for
scientists & engineers and managers were .1931 and .5356 respectively. This indicates
the GRE scores are more predictive of the managers’ success than the scientists and
engineers.
The admissions office at AFIT requires minimum scores of 600 on the GRE-Q
and 500 on the GRE-V for eligibility to attend AFIT. However, every one of the students
in this data set attended AFIT and graduated with a GPA of 3.0 or higher. From the
results of this data, the admission requirement for GRE-V scores to be used at all should
be questioned, especially when they indicate predictive capabilities for management
students only, and the GMAT proves to be a much better predictor of success for
management students from this study.
Table 9. Entrance Exams of Pre-Validation Sample
Missing Data GRE-V; GRE-Q GRE-A GMAT GMAT, GRE-V, GRE-Q TOTAL66 223 95 33 11 311

59
Figure 3. Bivariate Fit of GGPA by GRE-Q
33.13.23.33.43.53.63.73.83.9
44.1
GG
PA
200 300 400 500 600 700 800GRE-Q
Figure 4. Bivariate Fit of GGPA by GRE-V
33.13.23.33.43.53.63.73.83.9
44.1
GG
PA
300 400 500 600 700GRE-V
Of the 95 students who took the GRE-A exam, a small correlation could be seen
between the GRE-A and graduate GPAs (Figure 5). The correlation is stronger for
scientists and engineers (p = .0014) than for management students (p = 1048). Also, the
GRE-Analytical exam is not required for entrance into AFIT and therefore has no real
bearing on the admissions process to determine eligibility. The trend in the data,
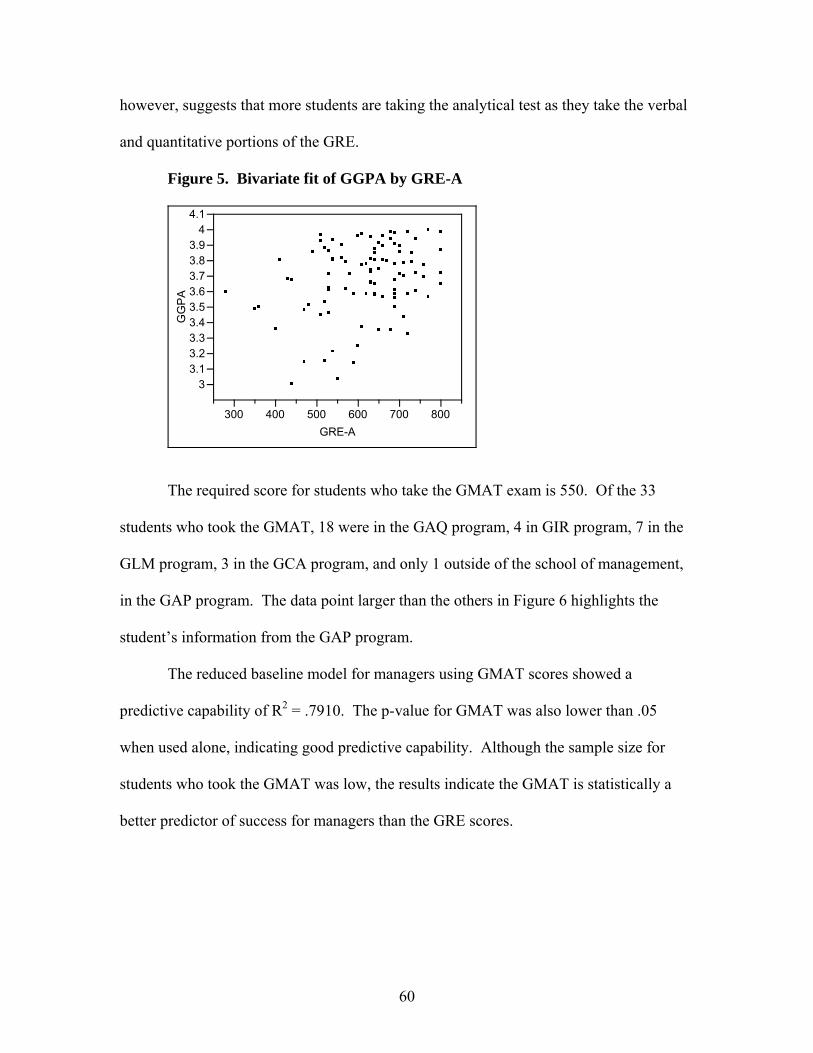
60
however, suggests that more students are taking the analytical test as they take the verbal
and quantitative portions of the GRE.
Figure 5. Bivariate fit of GGPA by GRE-A
33.13.23.33.43.53.63.73.83.9
44.1
GG
PA
300 400 500 600 700 800GRE-A
The required score for students who take the GMAT exam is 550. Of the 33
students who took the GMAT, 18 were in the GAQ program, 4 in GIR program, 7 in the
GLM program, 3 in the GCA program, and only 1 outside of the school of management,
in the GAP program. The data point larger than the others in Figure 6 highlights the
student’s information from the GAP program.
The reduced baseline model for managers using GMAT scores showed a
predictive capability of R2 = .7910. The p-value for GMAT was also lower than .05
when used alone, indicating good predictive capability. Although the sample size for
students who took the GMAT was low, the results indicate the GMAT is statistically a
better predictor of success for managers than the GRE scores.

61
Figure 6. Bivariate fit of GGPA by GMAT
33.13.23.33.43.53.63.73.83.9
44.1
GG
PA
400 500 600 700GMAT
Our hypothesis proved false. The analysis showed significant correlations of
GRE-V and GRE-Q scores to graduate GPAs for management students, particularly
GRE-Q scores with a p-value of ‹.0001. GRE-Q scores were found to be significant for
scientist and engineering students as well with a p-value of .0068 in our baseline model.
The GRE-Q scores seem to be a good predictor alone and with other variables. Similarly,
we found a strong correlation of GMAT scores to graduate GPAs, though the results
could be called into question due to the low sample size. Overall, the GMAT proved to
be a better predictor graduate GPA than GRE scores for management students at AFIT.
Investigative Question 2
Investigative Question 2 states “Do current measures of past performance, such as
undergraduate GPAs, have any predictive capability on AFIT student performance?” The
hypothesis for this question is that the undergraduate GPA will have little to no
correlation to graduate GPA performance.

62
Many researchers believe past performance predicts future performance,
especially in similar circumstances such as an academic setting. However, the early
career of an Air Force officer does not necessarily follow the same pattern as individuals
not in the military. A person can become an officer one of three ways: receive a
commission through the Air Force Academy, Air Force Reserve Officer Training Core,
or Officer Training School. If one enters through officer training school, he/she already
received their bachelor’s degree prior to entrance and typically has a higher
undergraduate GPA than an ROTC or Academy student. Students who attend ROTC and
the Air Force Academy know all they need to do to enter the Air Force as an officer is to
graduate. Most schools will award a bachelor’s degree with only a 2.0 GPA. Students
have the motivation to finish school with higher than a 2.0 GPA, higher only if they are
driven from within or another external force. Therefore, many officers do not have
exceptional undergraduate GPAs: students did not need them; students had job security
with a 2.0 GPA. I propose another reason for low undergraduate GPAs is that students
are often young when receiving their bachelor’s degree and are not of the same maturity
of those attending AFIT. They do not have the importance of their careers in mind yet
(since they have yet to start them) and often make choices to participate in other activities
rather than study.
However, when a person enters AFIT, he/she typically has at least one job tour
(typically 1-3 years) of service completed. This job initiates the officer into the adult
world of business. Though jobs are secure, students have a new understanding that job
security is based largely upon performance, which can have an impact on them and their

63
families. Typically, by the time an airmen enters AFIT, they perform better academically
than they did at an undergraduate institution.
Our results verify this claim. Of 311 students, 247 had their undergraduate
GPA’s in one of the two databases. This information can be deleted once a student
graduates or is often replaced by the new graduate GPA upon graduation from AFIT.
Figure 7 shows the visual correlation of undergraduate GPA to graduate GPA as well as
the histograms showing the relativity of number of students to GPAs. Students with prior
service typically had higher undergraduate GPAs than those without prior service.
Figure 7. Bivariate Fit of UGPA by GGPA
33.13.23.33.43.53.63.73.83.9
44.1
GG
PA
2 3 4UGPA
The statistical significance of undergraduate GPA to graduate GPA is .1392 for
scientists and engineers and .0037 for managers. Undergraduate GPA came up as a
variable in every regression model built and was included in each of our three baseline
models with p-values less than .001 in all baseline models. This indicates undergraduate
GPA is a better predictor with other variables (such as test scores) than when used alone,
supporting the claims of the Educational Testing Service. Our hypothesis about
undergraduate GPA was incorrect. The correlations of undergraduate GPA to graduate

64
GPA are statistically significant, especially when combined with other factors such as
GRE-Q and GMAT scores.
Investigative Question 3
Investigative question 3 states, “3. Is there a difference in performance between
students who meet all admissions requirements and those who require a waiver?” The
hypothesis for this question is yes, there is a positive difference in performance between
students who meet the requirements and those who require a waiver.
As the results of IQ one and two indicated, past performance indicates some level
of future performance. It is therefore logical to assume if a student receives a poor
undergraduate GPA or performs poorly on standardized tests, he/she will also struggle
with their studies at AFIT. Of course, this cannot be generalized to the entire population
at AFIT, but on average, students who perform poorly prior to AFIT should not perform
as well as those who do.
The data showed 248 prospective students submitted at least one of the following
to the AFIT admissions department: undergraduate GPA, GRE scores, or GMAT scores.
139 students, or 56%, required a waiver of at least one admission criterion (Table 10). 36
students, or 14.5%, required admission requirements to be waived in more than one area
(i.e. 2 test scores, UGPA and test scores, etc.)
Table 10. # of Students Who Required a Waive of Admission Criteria
UGPA GRE-V GRE-Q GMAT At least 1
waiver # Students who received Waiver 64 71 32 17 139 Data Points 247 223 223 33 248 Percentage (%) 25.91 31.84 14.35 51.52 56.05

65
Using a large sample test of hypothesis, our first sample was the students who did
not receive a waiver of admission criteria. Our second sample was the students who did
require a waiver. Our null hypothesis is that the differences in graduate GPA are equal.
Our alternative hypothesis is that the graduate GPAs of students who do not require a
waiver receive higher graduate GPAs on average. The test statistic for this calculation is
3.29, z.05 = 1.658, which is less than the test statistic and falls within the rejection region
for the sample. Therefore, we can reject the null that the two graduate GPAs are the
same and can reasonably assume the graduate GPAs of students who meet all admission
criteria receive higher GPAs. However, it is important to note, that based upon the
differences in mean graduate GPAs of each sample (3.73 and 3.64,) the means are very
close and do not practically indicate much of a difference. If we had chosen a smaller
alpha and took a higher risk of making a type I error (we reject the null when it is true,)
the results would be different. If we chose an alpha of .0005, for example, our test
statistic would not have fallen in the rejection region and we would say there was no
difference in the graduate GPAs of the two populations. This is important to realize
because although the statistical difference in mean graduate GPAs, the practical
difference between the two is not by very much (Table 11).
Table 11. Mean and Standard Deviation for our Random Samples (N=109)
Sample Identifier GPA Mean Standard Deviation
1 Non-Waiver
Students 3.7312 0.2335 2 Waiver Students 3.6353 0.2212

66
Investigative Question 4
Investigative question 4 states, “Is there a difference in performance depending on
which admission requirement is waived (GRE/GMAT scores or undergraduate GPA)?”
This question is divided into four subdivisions, divisions of samples as follows: GMAT
scores and undergraduate GPA; GRE-V scores and undergraduate GPA; GRE-Q scores
and undergraduate GPA; and both GRE scores and undergraduate GPA. Our hypothesis
is that yes, there is a difference in performance in all four subdivisions. We propose the
graduate GPAs of students who required a waiver for any test scores will be higher than
those of students who required a waiver for undergraduate GPA.
Many students who attend AFIT graduated from undergraduate institutions at
least three years prior to entrance into AFIT. Though not much time has elapsed from the
completion of their undergraduate education, the test scores are generally more current
than undergraduate GPAs. Also, the standardized exams reflect what they can recall
from undergraduate education; undergraduate GPAs measure what students know at the
time of the courses in undergraduate education. Therefore, the standardized test scores
reflect what a prospective AFIT student knows at the time of application and entrance
into AFIT and will better predict how well a student will perform in graduate education.
Data was selected for use in the different categories based upon waivers for that
particular discipline. For example, several students received waivers for both
undergraduate GPA and test scores. However, none of the students were included in the
hypothesis testing. Students who received a waiver for undergraduate GPA were
included if they did not have a waiver for the test it was being tested against. Table 6
shows how many students required waivers for each exam and undergraduate GPA.

67
Using large and small sample tests of hypothesis for each of the four pairs of samples, the
results are shown in Table 12.
Table 12. Results of 4 Sub-tests of Hypothesis
Hypothesis Test (sample 1, sample 2) N Hypothesis
Test Statistic
Rejection Region (based on α = .05) Result
GMAT, undergraduate GPA 11/58
H0: (µ1 - µ2) = 0 Ha: (µ1 - µ2) › 0 2.00 1.67 Reject H0
GRE-V, undergraduate GPA 57/50
H0: (µ1 - µ2) = 0 Ha: (µ1 - µ2) ‹ 0 -0.9769 1.679
Fail to Reject H0
GRE-Q, undergraduate GPA 23/55
H0: (µ1 - µ2) = 0 Ha: (µ1 - µ2) ‹ 0 -1.9199 1.671 Reject H0
GRE-V and GRE-Q, undergraduate GPA 12/45
H0: (µ1 - µ2) = 0 Ha: (µ1 - µ2) ‹ 0 -2.58 1.671 Reject H0
By rejecting H0 for three of the four tests, it can be concluded that there is
statistical evidence to suggest a difference exists between the graduate GPAs of students
who require a waiver for insufficient undergraduate GPAs and students who require a
waiver for insufficient test scores on the GMAT, GRE-Q, and both GRE tests. We can
also conclude there is no statistical evidence to suggest the graduate GPAs of students
who receive a waiver for GRE-V scores are different than graduate GPAs of students
who receive a waiver for undergraduate GPA. However, it is important to note that
practically, no difference exists. When we examine the mean graduate GPAs of students
in each group as well as their standard deviations, the difference is so small as to be
practically negligible (Table 13).
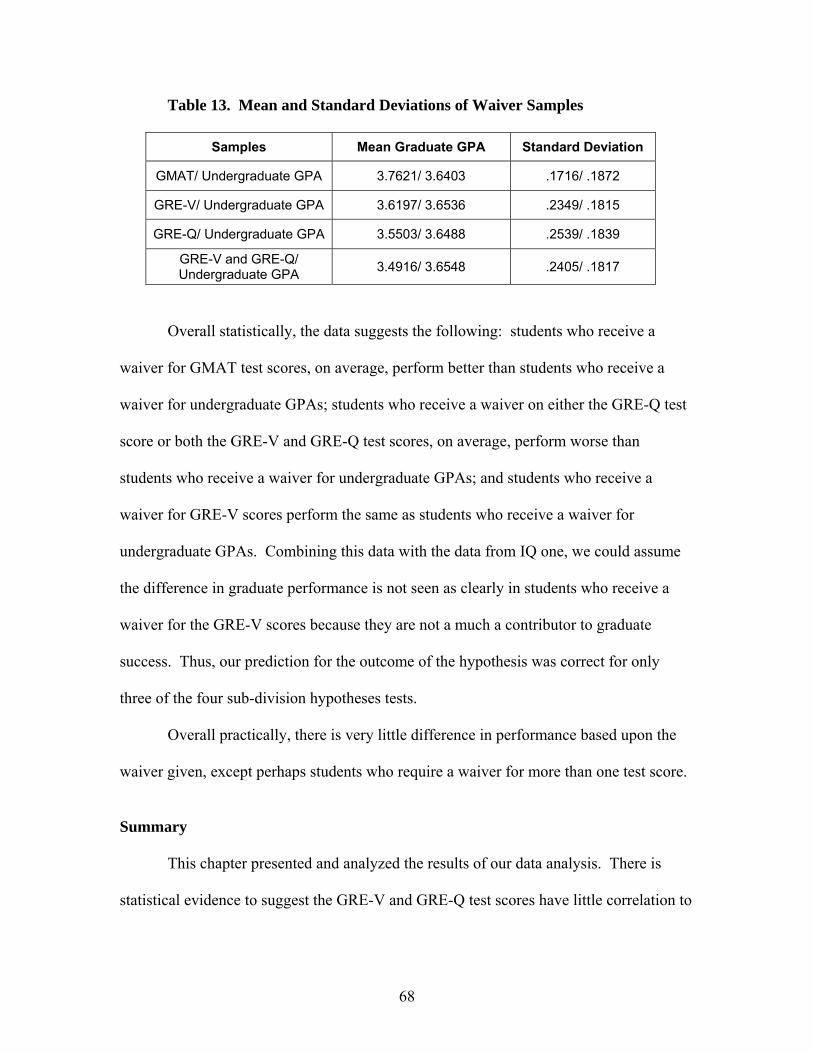
68
Table 13. Mean and Standard Deviations of Waiver Samples
Samples Mean Graduate GPA Standard Deviation
GMAT/ Undergraduate GPA 3.7621/ 3.6403 .1716/ .1872
GRE-V/ Undergraduate GPA 3.6197/ 3.6536 .2349/ .1815
GRE-Q/ Undergraduate GPA 3.5503/ 3.6488 .2539/ .1839
GRE-V and GRE-Q/ Undergraduate GPA 3.4916/ 3.6548 .2405/ .1817
Overall statistically, the data suggests the following: students who receive a
waiver for GMAT test scores, on average, perform better than students who receive a
waiver for undergraduate GPAs; students who receive a waiver on either the GRE-Q test
score or both the GRE-V and GRE-Q test scores, on average, perform worse than
students who receive a waiver for undergraduate GPAs; and students who receive a
waiver for GRE-V scores perform the same as students who receive a waiver for
undergraduate GPAs. Combining this data with the data from IQ one, we could assume
the difference in graduate performance is not seen as clearly in students who receive a
waiver for the GRE-V scores because they are not a much a contributor to graduate
success. Thus, our prediction for the outcome of the hypothesis was correct for only
three of the four sub-division hypotheses tests.
Overall practically, there is very little difference in performance based upon the
waiver given, except perhaps students who require a waiver for more than one test score.
Summary
This chapter presented and analyzed the results of our data analysis. There is
statistical evidence to suggest the GRE-V and GRE-Q test scores have little correlation to

69
graduate success as measured by graduate GPA. The GMAT test has a moderate
correlation to graduate success. Undergraduate GPA has little correlation to graduate
success when used alone. However, when combined with other variables, particularly
GRE-Q, it has a moderate correlation to graduate success. This chapter also analyzed the
importance of issuing waivers to students for admission into AFIT. Statistical evidence
suggests a very slight difference in graduate GPAs exists between students who meet
admission criteria and those who do not. Also, the type of waiver given (i.e. for
undergraduate GPA, GRE-V, GRE-Q, GMAT, or two GRE scores) is not significant if
the waiver is given for only a GRE-V score, GRE-Q score, GMAT score, or
undergraduate GPA. However, it is important when giving waivers for more than one
test, such as for both the GRE-Q and GRE-V tests, to realize the undergraduate GPA
waiver students have been shown to have higher success.
Chapter five will discuss the results of the tests. It will present the big picture
meaning for the results and how they can impact AFIT selection procedures. Also,
chapter five will suggest future research topics based upon the research in this study and
wrap up the research effort.

70
V. Conclusion
Chapter Overview
This chapter discusses the results from the analyses shown in chapter four, what
conclusions we can draw from the results, and how our results pertain to the objectives of
this study. This chapter will also cover the limitations of the research, additional areas of
interest, and future research ideas pertaining to the predictive factors of graduate success.
We will conclude with a final summary of the research effort as a whole.
Conclusion of Research Objectives
The problem the Air Force Institute of Technology and the Air Force is facing is a
conflict in personnel placement. The Air Force has a mission to achieve and needs
airmen to place around the world for the accomplishment of that mission. At the same
time, the Air Force has identified a need to educate more airmen at AFIT to improve our
warfighting capabilities. Though AFIT has a standard set of admission criteria, more
than 50% of its applicants fail to meet the criteria, yet are admitted mainly to maintain
given quotas.
Nearly 100% of AFIT students graduate with greater than a 3.0 graduate GPA and
a master’s degree in the science and engineering fields or management fields. When all
students graduate, despite failing to meet set admission criteria, the question about
whether or not AFIT needs admission criteria becomes important to consider. The main
criteria AFIT considers for admission of prospective students are undergraduate GPA,
GRE-Verbal test scores, GRE-Quantitative test scores, and GMAT scores. When a waive
71
of admissions is required, department directors must take the time to examine student
records and make the decision about whether or not to waive the requirements and allow
the student attend.
The purpose of this research was to determine if current admission criteria have
any predictive capability of a student’s graduate success and if students do not meet the
eligibility standards, whether they perform more poorly than students who meet all
standards. The research in this study indicates changes in the admissions policy should
be changed; mainly, if over 50% of students require a waiver to attend AFIT, perhaps
there shouldn’t be admission criteria at all.
Investigative Question 1
Students are required to take either the GRE-V and GRE-Q exams, or the GMAT
exam for entrance into AFIT. The GMAT is an exam specifically used for schools of
management and business and has a good predictability rate for graduate success.
Roughly 69-79% of the variability of graduate GPA for management students can be
explained in part by test scores from the GMAT exam as opposed to only 20-50%
variability explained in part by GRE test scores. The results are similar to those found in
the literature (Nilsson, 1995; Hoefer and Gould, 2000, Garwood, 2002). The
management programs at AFIT do not require this exam for entrance, however. One
explanation for the higher correlation of GMAT scores could be that students who take
the GMAT are taking it, not for AFIT, but for entrance into a business master’s program
elsewhere, and reused the score for AFIT eligibility. Students in the management
programs sometimes have other master’s degrees before entrance into AFIT. Therefore,

72
perhaps some of their success could be attributed to previous experience in a master’s
curriculum.
The GRE-A exam showed to have a high correlation to graduate success with a
strong beta weight for the science and engineering students, indicating those who do well
on the GRE-A exam will do well in graduate school. Similar results showed up for the
management students, though not quite as strong a correlation exists.
Results for the GRE-V exam were moderate to low in the models examined,
supporting the research done by Garwood (2002). GRE-Q exams showed a significant
correlation for both science and engineering students as well as management students.
This is not surprising since the majority of students at AFIT has a technical background
and typically performed well on the GRE-Q exams. The ETS recommends the GRE
scores be used in conjunction with undergraduate GPA, which this research supported.
In each model developed, the GRE/GMAT scores and undergraduate GPAs’
predictability increased when combined.
The overall conclusion of this study is that though the GRE-V exam has some
predictability on graduate success for management students, it does not contribute to the
success of science and engineering students. Also, the GMAT is a much better predictor
of success for management students. The GRE-A exam, however, does have good
predictability for science and engineering students, and should perhaps replace the
requirement for GRE-V scores for entrance into AFIT. Also, several AFIT theses have
concluded the whole school should not be assessed by the same criteria for entrance. I
disagree with that assessment. Although, models built when using the entire sample from
AFIT yielded much different results (the GMAT exam was the only variable which had

73
any predictability, due to the fact it was mainly management students who took the exam)
the school can still be assessed as a whole. The data must be divided, however, between
science and engineering students and management students. The results for each school
are similar in regards to the predictability of test scores and undergraduate GPA.
However, the additional independent variables, such as prior enlisted, number of
members in household, rank, etc. alter the data and create less than ideal results. It
appears as though additional factors other than academic performance, have a different
impact on students from each school, thought the reason for this is unclear.
Science and engineering students should continue to take the GRE-Q/GRE-A
exam prior to entrance and waivers assigned to GRE-A exams on a case-by-case
assessment. GRE-Q admission standards should also be lowered due to the high number
of waivers given for this exam. The GRE-V exam, if left in the admissions criteria
should not have a limit for eligibility at all. The predictive value of GRE-V is
insignificant and more waivers are given for the GRE-V exam than any other waiver.
Scores can be an indicator to directors about how much time and personal attention a
student might require to successfully complete the program. Similar studies for AFIT
(Garwood, 2002, Zitzmann, 2002) came to the same conclusion, although other studies
within the literature reviews disagree (Kuncel et al., 2001). While this recommendation
might not be universally applicable, each school should conduct their own study. A
student’s writing habits will not changed based on the curriculum at AFIT, yet program
directors will be able to assess the writing capabilities of students based on the GRE-A
exam scores. This way, directors will be able to understand how much time a student
74
might require to accomplish the thesis and how much editing/revision time the student
will need to do well in writing assignments.
Students in management programs should be required to take the GMAT exam
prior to entrance into AFIT. The GMAT exam includes a writing assessment test within
the exam which can indicate writing capabilities for students. While quantitative abilities
are important to the management students as well as the science and engineering students,
they are far less important within the management programs and the GMAT exam will
capture what students have the potential to accomplish in all aspects of a management
program. Scores for the GMAT exam should be examined and assessed to determine the
appropriate standard for admissions.
Investigative Question 2
Undergraduate GPA was a significant predictor of graduate success when used
alone and when combined with other variables. However, over 25% of students required
a waiver who did not have adequate undergraduate GPAs for admissions. In many cases,
this could be attributed to the “2.0 and go” phenomenon of undergraduate students who
have secured a job in the Air Force upon completion of their undergraduate degree. This
can also be attributed to immaturity of an undergraduate student. This research shows the
majority of students who enter into AFIT have an undergraduate GPA lower than 3.5, yet
graduate from AFIT with a GPA higher than 3.5. Undergraduate GPA should be used as
a guideline for directors granting waivers for test scores only and the cut-off of 3.0
undergraduate GPA should be eliminated from the admission criteria.

75
Investigative Question 3
What we now know about AFIT that we did not know before, is that program
directors give out a very high number of waivers to students for entrance into AFIT.
Many students receive more than one waiver. A few students receive waivers for every
admission criteria set by AFIT. The research in this study concluded there is a slight,
though nearly negligible difference in graduate GPAs of students who receive waivers
and students who do not. The implications of this finding are huge. The results indicate
the admission criteria do not play much part in admissions of students to AFIT. The
results also give a certain freedom to program directors upon issuing waivers in the future
if admission criteria are not changed.
Investigative Question 4
Similar to the results in IQ three, the types of waivers given does not have much
influence upon a student’s performance. If program directors are concerned about whom
to give waivers for, it could be suggested not to give multiple waivers, such as for both a
GRE-V and GRE-Q score. It might be wiser to give a waiver to a student with an
inadequate undergraduate GPA than two inadequate test scores. It might also be wiser to
give a waiver to a student with inadequate GMAT or GRE-Q scores than an inadequate
undergraduate GPA. However, in the big picture, the statistical evidence in this research
shows there’s not much difference in performance no matter which waiver is given, and
the practical evidence suggests there is not a difference at all.

76
Limitations
There were three main limitations to this research study. First, the use of
databases proved to be a limitation due to the inaccuracy and incompleteness of the data
within each database. The database included 311 subjects, presumably all full-time Air
Force officers who were assigned to AFIT from 1999-2001, 2000-2002, and 2001-2003.
However, upon closer inspection, not all subjects were assigned to AFIT during that time,
all the individuals assigned to AFIT were in the database, and not all academic and
military data were included in both databases. Therefore, it might have been a better
choice to manually review all hard-copy records of AFIT students attending AFIT during
the times described to gather more accurate data.
Along the same lines of inaccurate data, interviews with professors in each
department should have been a standard part of this research, particularly in the science
and management programs, to gain a better understanding of individual waiver
assignment processes and perspectives.
And last, civilians and other members of the armed services who attend AFIT
were not included in this study. The purpose of eliminating them from this study was due
to the fact the study was focused on the Air Force situation of assigning people to AFIT
when they are perhaps needed in other parts of the world. However, many civilians and
members of other services attend AFIT full time at government expense. Also, the
recommendation of eliminating certain, if not all, admission requirements could bring
repercussions to the institution when considering civilian applicants, either as full-time
students or as part-time students.
77
Suggestions for Future Research
I believe it is essential for all graduate institutions to assess their admission
criteria on a regular basis. Given that, a similar study should be conducted within the
next five years on the entire school, perhaps separated into science and management
programs and management programs.
Another research topic closely related to this one is what factors of motivation
influence graduate success. Consistently, test scores and undergraduate GPA account for
roughly 15-20% of the variance of graduate success, but research should be conduced to
find out what accounts for the final 80-85%. McCloy, Campbell, and Cudeck (1994)
believe performance is based on declarative knowledge, procedural knowledge and skill,
and motivation. This study showed 20% of performance is declarative knowledge. The
other areas of McCloy et al.’s formula are worth looking into at AFIT.
Walpole and others (2002) examined different criteria of success as deemed by
graduate professors and staff at graduate institutions. AFIT has two main avenues of
success criteria: graduate GPA and thesis grades. Cumulative exams for programs might
be a great indicator for AFIT to use before completion as a determinant of learning at the
institution. Currently, the Acquisition Management program (a.k.a. Strategic Purchasing)
is incorporating a cumulative exam through an affiliate organization, which upon
successful completion, awards a Certified Purchasing Manager certification to students.
The exam is comprehensive of all classes taken during the 18-month period at AFIT. A
good research direction would be to determine whether or not cumulative exams add
value to the school and programs and whether or not they truly measure learning for the
students at the institution.
78
Summary
This research is based on the conflict the Air Force and AFIT have of balancing
mission requirements of personnel needed throughout the world and training airmen in
technical fields to remain the world’s most technological force. AFIT must find
available, eligible airmen to train in their master’s degree programs. Currently, over 50%
of AFIT students do not meet the set admission requirements to attend AFIT and require
a waiver of admissions to attend. The purpose of this research was to examine current
admission criteria to determine its predictability on graduate success as well as determine
whether or not the granting of a waiver has an impact on student performance.
The literature review for this research indicated many mixed results as to the
predictability of undergraduate GPAs and standardized test scores, although the AFIT
thesis continue to show a familiar trend that the requirements are sufficient, but not
adequate. This validity study used multiple regression model building and hypothesis
testing to show admission requirements are no longer adequate. GRE-Q exam scores
should continue to be used as an admission requirement, but the standard “cut-off” score
should be lowered. GRE-V scores should not be used as an admissions requirement at
all. GRE-A scores should be added as a requirement with and appropriate standard
developed. The GMAT exam should be required for admissions by all management
students. And undergraduate GPA should be required submittal factor for admissions,
but used only as an additional guideline to determine the granting of waivers and not
have a “cut-off” standard, since it is rarely adhered to anyway. Additional factors,
particularly prior enlistment, should be examined when granting waivers as well.
79
When waivers are granted, directors should not be overly concerned with the type
a student requires, particularly if it is for a GRE-V score. However, they should be
cautious of granting waivers for inadequate scores in every admission criterion. Overall,
AFIT’s admission criteria are not adequate predictors of graduate success and should be
reexamined in lieu of the number of waivers granted to incoming students, particularly
with the increased number of students AFIT expects to educate in the coming years.

80
Appendix A: Program and AFSC Codes
AFIT Program Code
Astronautical Engineering (GA) 0 Aeronautical Engineering (GAE) 1 Aerospace and Information Operations (GAI) 2 Applied Physics (GAP) 3 Acquisition Management (GAQ) 4 Computer Engineering (GCE) 5 Computer Systems (GCS) 6 Electrical Engineering (GE) 7 Engineering and Environmental Management (GEE) 8 Electro-Optics (GEO) 9 Information Resource Management (GIR) 10 Logistics Management (GLM) 11 Meteorology (GM) 12 Nuclear Engineering (GNE) 13 Operations Research (GOR) 14 Space Operations (GSO) 15 Cost Analysis (GCA) 16
AFSC Description AFSC Code
Pilot 11xx 0 Navigator 12xx 1 Space, Missile, and Command and Control 13xx 2 Intelligence 14xx 3 Weather 15xx 4 Logistics 21xx 5 Civil Engineering 32xx 6 Communications and Information 33xx 7 Biomedical Specialist 43xx 8 Scientific 61xx 9 Developmental Engineering 62xx 10 Acquisition 63xx 11 Contracting 64xx 12 Finance 65xx 13

81
Appendix B: Full GRE Baseline Model for Scientists and Engineers
Actual by Predicted Plot
3.23.33.4
3.53.63.73.8
3.94
GG
PA
Act
ual
3.2 3.3 3.4 3.5 3.6 3.7 3.8 3.9 4.0GGPA Predicted P=0.0006 RSq=0.25RMSE=0.1791
Summary of Fit RSquare 0.252827RSquare Adj 0.187142Root Mean Square Error 0.179064Mean of Response 3.67987Observations (or Sum Wgts) 100
Analysis of Variance Source DF Sum of Squares Mean Square F Ratio Model 8 0.9873291 0.123416 3.8491 Error 91 2.9178242 0.032064 Prob > F C. Total 99 3.9051533 0.0006
Parameter Estimates Term Estimate Std Error t Ratio Prob>|t| Intercept 2.2802035 0.302292 7.54 <.0001 UGPA 0.1913769 0.056618 3.38 0.0011 GRE-Q 0.0008058 0.000348 2.32 0.0228 GRE-V -0.000094 0.000263 -0.36 0.7208 Rank/Grade 0.0539065 0.02944 1.83 0.0704 Prior Enlisted -0.118499 0.04742 -2.50 0.0143 AFSC 0.0098429 0.008049 1.22 0.2245 Gender 0.1127232 0.094629 1.19 0.2367 In Household Desc COUNT -0.005994 0.022332 -0.27 0.7890

82
Effect Tests Source Nparm DF Sum of Squares F Ratio Prob > F UGPA 1 1 0.36634268 11.4254 0.0011 GRE-Q 1 1 0.17192764 5.3620 0.0228 GRE-V 1 1 0.00412040 0.1285 0.7208 Rank/Grade 1 1 0.10750637 3.3529 0.0704 Prior Enlisted 1 1 0.20022588 6.2446 0.0143 AFSC 1 1 0.04795353 1.4956 0.2245 Gender 1 1 0.04549792 1.4190 0.2367 In Household Desc COUNT 1 1 0.00231012 0.0720 0.7890
Residual by Predicted Plot
-0.4-0.3-0.2
-0.10.00.10.2
0.30.4
GG
PA
Res
idua
l
3.2 3.3 3.4 3.5 3.6 3.7 3.8 3.9 4.0GGPA Predicted
Durbin-Watson Durbin-Watson Number of Obs. AutoCorrelation
1.4481067 100 -0.0732
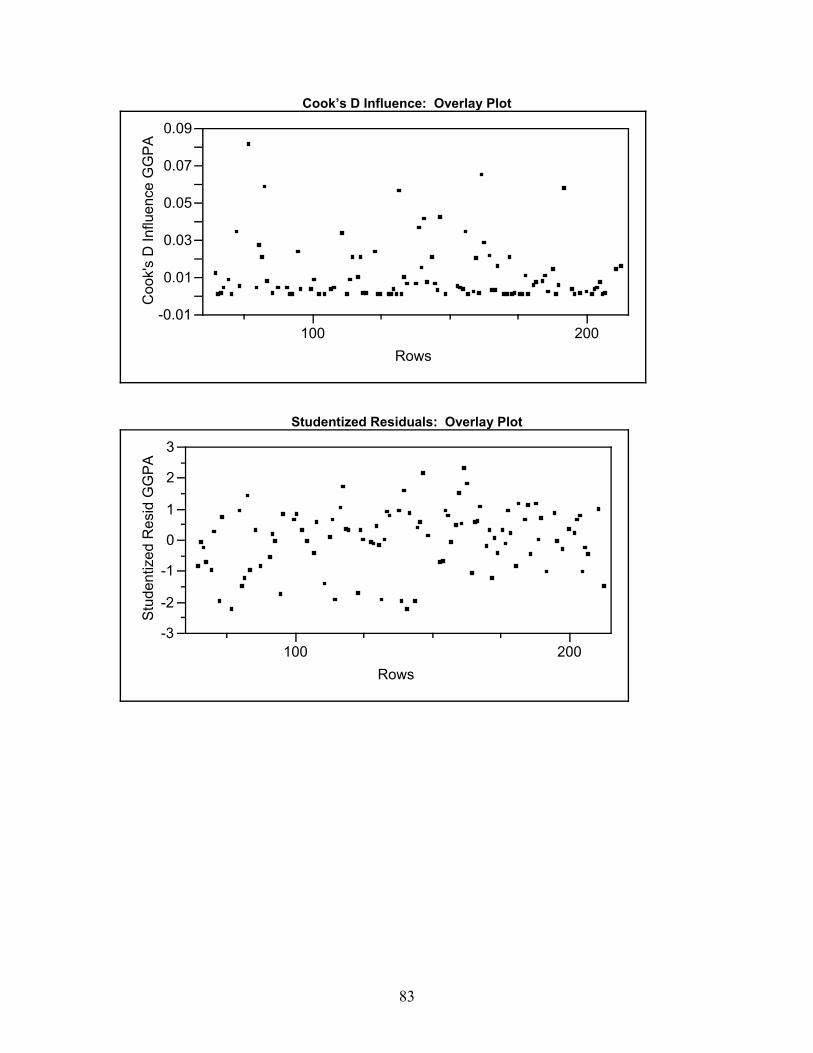
83
Cook’s D Influence: Overlay Plot
-0.01
0.01
0.03
0.05
0.07
0.09C
ook'
s D
Influ
ence
GG
PA
100 200Rows
Studentized Residuals: Overlay Plot
-3
-2
-1
0
1
2
3
Stu
dent
ized
Res
id G
GP
A
100 200Rows

84
Appendix C: Full GRE Baseline Model for Managers
Actual by Predicted Plot
3.4
3.5
3.6
3.7
3.8
3.9
4
GG
PA
Act
ual
3.1 3.23.3 3.4 3.53.6 3.7 3.83.9 4.0 4.14.2 4.3GGPA Predicted P<.0001 RSq=0.59RMSE=0.1229
Summary of Fit RSquare 0.588943RSquare Adj 0.517008Root Mean Square Error 0.122946Mean of Response 3.755625Observations (or Sum Wgts) 48
Analysis of Variance
Source DF Sum of Squares Mean Square F Ratio Model 7 0.8662870 0.123755 8.1871 Error 40 0.6046323 0.015116 Prob > F C. Total 47 1.4709193 <.0001
Parameter Estimates Term Estimate Std Error t Ratio Prob>|t| Intercept 2.6068535 0.364757 7.15 <.0001 UGPA 0.2096701 0.052857 3.97 0.0003 GRE-Q 0.0016187 0.000287 5.65 <.0001 GRE-V -0.00107 0.000388 -2.75 0.0088 Rank/Grade 0.0248257 0.039389 0.63 0.5321 Prior Enlisted -0.000046 0.043189 -0.00 0.9992 In Household Desc COUNT 0.016003 0.017308 0.92 0.3607 AFSC -0.014725 0.006683 -2.20 0.0334

85
Effect Tests Source Nparm DF Sum of Squares F Ratio Prob > F UGPA 1 1 0.23785080 15.7352 0.0003 GRE-Q 1 1 0.48186497 31.8782 <.0001 GRE-V 1 1 0.11469670 7.5879 0.0088 Rank/Grade 1 1 0.00600453 0.3972 0.5321 Prior Enlisted 1 1 1.71658e-8 0.0000 0.9992 In Household Desc COUNT 1 1 0.01292302 0.8549 0.3607 AFSC 1 1 0.07337926 4.8545 0.0334
Residual by Predicted Plot
-0.3
-0.2
-0.1
0.0
0.1
0.2
0.3
GG
PA
Res
idua
l
3.1 3.23.3 3.4 3.53.6 3.7 3.83.9 4.0 4.14.2 4.3GGPA Predicted
Durbin-Watson Durbin-Watson Number of Obs. AutoCorrelation
0.7514523 48 0.0320

86
Cook’s D Influence: Overlay Plot
-0.01
0.01
0.03
0.05
0.07
0.09
0.11C
ook'
s D
Influ
ence
GG
PA
200 300Rows
Studentized Residuals: Overlay Plot
-3
-2
-1
0
1
2
3
Stu
dent
ized
Res
id G
GP
A
200 300Rows

87
Appendix D: Full Baseline GMAT Model for Managers
Actual by Predicted Plot
3.5
3.6
3.7
3.8
3.9
4
GG
PA
Act
ual
3.5 3.6 3.7 3.8 3.9 4.0GGPA Predicted P<.0001 RSq=0.85RMSE=0.0674
Summary of Fit RSquare 0.85139RSquare Adj 0.787699Root Mean Square Error 0.06744Mean of Response 3.740238Observations (or Sum Wgts) 21
Analysis of Variance Source DF Sum of Squares Mean Square F Ratio Model 6 0.36478964 0.060798 13.3677 Error 14 0.06367417 0.004548 Prob > F C. Total 20 0.42846381 <.0001
Parameter Estimates Term Estimate Std Error t Ratio Prob>|t| Intercept 2.9852362 0.287084 10.40 <.0001 UGPA 0.03616 0.040428 0.89 0.3862 GMAT 0.0010989 0.000287 3.83 0.0018 Rank/Grade 0.1085052 0.042573 2.55 0.0232 Prior Enlisted -0.131235 0.033339 -3.94 0.0015 AFSC -0.019662 0.005373 -3.66 0.0026 In Household Desc COUNT 0.0108721 0.015436 0.70 0.4928

88
Effect Tests Source Nparm DF Sum of Squares F Ratio Prob > F UGPA 1 1 0.00363861 0.8000 0.3862 GMAT 1 1 0.06661828 14.6473 0.0018 Rank/Grade 1 1 0.02954346 6.4957 0.0232 Prior Enlisted 1 1 0.07047324 15.4949 0.0015 AFSC 1 1 0.06091082 13.3924 0.0026 In Household Desc COUNT 1 1 0.00225623 0.4961 0.4928
Residual by Predicted Plot
-0.1
0.0
0.1
GG
PA
Res
idua
l
3.5 3.6 3.7 3.8 3.9 4.0GGPA Predicted
Durbin-Watson Durbin-Watson Number of Obs. AutoCorrelation
0.5718382 21 -0.0401

89
Cook’s D Influence: Overlay Plot
0
0.1
0.2C
ook'
s D
Influ
ence
GG
PA
200 300Rows
Studentized Residuals: Overlay Plot
-2
-1
0
1
2
Stu
dent
ized
Res
id G
GP
A
200 300Rows

90
Appendix E: Reduced GRE Baseline Model for Scientists/Engineers
Actual by Predicted Plot
3.23.33.4
3.53.63.73.8
3.94
GG
PA
Act
ual
3.2 3.3 3.4 3.5 3.6 3.7 3.8 3.9 4.0GGPA Predicted P<.0001 RSq=0.23RMSE=0.1784
Summary of Fit RSquare 0.22574RSquare Adj 0.19314Root Mean Square Error 0.178402Mean of Response 3.67987Observations (or Sum Wgts) 100
Analysis of Variance Source DF Sum of Squares Mean Square F Ratio Model 4 0.8815492 0.220387 6.9244 Error 95 3.0236041 0.031827 Prob > F C. Total 99 3.9051533 <.0001
Parameter Estimates Term Estimate Std Error t Ratio Prob>|t| Intercept 2.3155586 0.294445 7.86 <.0001 UGPA 0.1976235 0.053893 3.67 0.0004 GRE-Q 0.0009257 0.000335 2.77 0.0068 Rank/Grade 0.0467071 0.027664 1.69 0.0946 Prior Enlisted -0.127741 0.045292 -2.82 0.0058
Effect Tests Source Nparm DF Sum of Squares F Ratio Prob > F UGPA 1 1 0.42796514 13.4464 0.0004 GRE-Q 1 1 0.24371090 7.6573 0.0068 Rank/Grade 1 1 0.09072919 2.8507 0.0946 Prior Enlisted 1 1 0.25317437 7.9546 0.0058

91
Residual by Predicted Plot
-0.4-0.3
-0.2-0.10.00.1
0.20.30.4
GG
PA
Res
idua
l
3.2 3.3 3.4 3.5 3.6 3.7 3.8 3.9 4.0GGPA Predicted
Durbin-Watson Durbin-Watson Number of Obs. AutoCorrelation
1.480186 100 -0.0771
Cook’s D Influence: Overlay Plot
-0.01
0.01
0.03
0.05
0.07
0.09
0.11
Coo
k's
D In
fluen
ce G
GP
A
100 200Rows

92
Studentized Residuals: Overlay Plot
-3
-2
-1
0
1
2
3
Stu
dent
ized
Res
id G
GP
A
100 200Rows

93
Appendix F: Reduced GRE Baseline Model for Managers
Actual by Predicted Plot
3.4
3.5
3.6
3.7
3.8
3.9
4
GG
PA
Act
ual
3.1 3.23.3 3.4 3.53.6 3.7 3.83.9 4.0 4.14.2 4.3GGPA Predicted P<.0001 RSq=0.58RMSE=0.1206
Summary of Fit RSquare 0.575099RSquare Adj 0.535573Root Mean Square Error 0.12056Mean of Response 3.755625Observations (or Sum Wgts) 48
Analysis of Variance Source DF Sum of Squares Mean Square F Ratio Model 4 0.8459238 0.211481 14.5500 Error 43 0.6249954 0.014535 Prob > F C. Total 47 1.4709193 <.0001
Parameter Estimates Term Estimate Std Error t Ratio Prob>|t| Intercept 2.8509723 0.245969 11.59 <.0001 UGPA 0.1978809 0.045503 4.35 <.0001 GRE-Q 0.0015296 0.000252 6.07 <.0001 GRE-V -0.001148 0.000372 -3.09 0.0035 AFSC -0.015771 0.006416 -2.46 0.0181
Effect Tests Source Nparm DF Sum of Squares F Ratio Prob > F UGPA 1 1 0.27487161 18.9113 <.0001 GRE-Q 1 1 0.53572473 36.8581 <.0001 GRE-V 1 1 0.13853804 9.5315 0.0035 AFSC 1 1 0.08781018 6.0414 0.0181

94
Residual by Predicted Plot
-0.3
-0.2
-0.1
0.0
0.1
0.2
0.3
GG
PA
Res
idua
l
3.1 3.23.3 3.4 3.53.6 3.7 3.83.9 4.0 4.14.2 4.3GGPA Predicted
Durbin-Watson Durbin-Watson Number of Obs. AutoCorrelation
0.69285 48 0.0430
Cook’s D Influence: Overlay Plot
-0.01
0.01
0.03
0.05
0.07
0.09
0.11
Coo
k's
D In
fluen
ce G
GP
A
200 300Rows

95
Studentized Residuals: Overlay Plot
-3
-2
-1
0
1
2
3
Stu
dent
ized
Res
id G
GP
A
200 300Rows

96
Appendix G: Reduced GMAT Baseline Model for Managers
Actual by Predicted Plot
3.5
3.6
3.7
3.8
3.9
4
GG
PA
Act
ual
3.4 3.5 3.6 3.7 3.8 3.9 4.0GGPA Predicted P<.0001 RSq=0.83RMSE=0.0669
Summary of Fit RSquare 0.832764RSquare Adj 0.790955Root Mean Square Error 0.066921Mean of Response 3.740238Observations (or Sum Wgts) 21
Analysis of Variance Source DF Sum of Squares Mean Square F Ratio Model 4 0.35680934 0.089202 19.9183 Error 16 0.07165447 0.004478 Prob > F C. Total 20 0.42846381 <.0001
Parameter Estimates Term Estimate Std Error t Ratio Prob>|t| Intercept 3.0852446 0.266415 11.58 <.0001 GMAT 0.0011681 0.000278 4.20 0.0007 Rank/Grade 0.1128572 0.041022 2.75 0.0142 Prior Enlisted -0.122582 0.032441 -3.78 0.0016 AFSC -0.021002 0.005207 -4.03 0.0010
Effect Tests Source Nparm DF Sum of Squares F Ratio Prob > F GMAT 1 1 0.07918037 17.6805 0.0007 Rank/Grade 1 1 0.03389555 7.5687 0.0142 Prior Enlisted 1 1 0.06394206 14.2779 0.0016 AFSC 1 1 0.07286101 16.2694 0.0010

97
Residual by Predicted Plot
-0.1
0.0
0.1
GG
PA
Res
idua
l
3.4 3.5 3.6 3.7 3.8 3.9 4.0GGPA Predicted
Durbin-Watson Durbin-Watson Number of Obs. AutoCorrelation
0.5897497 21 -0.0409
Cook’s D Influence: Overlay Plot
0
0.05
0.1
0.15
0.2
Coo
k's
D In
fluen
ce G
GP
A
200 300Rows
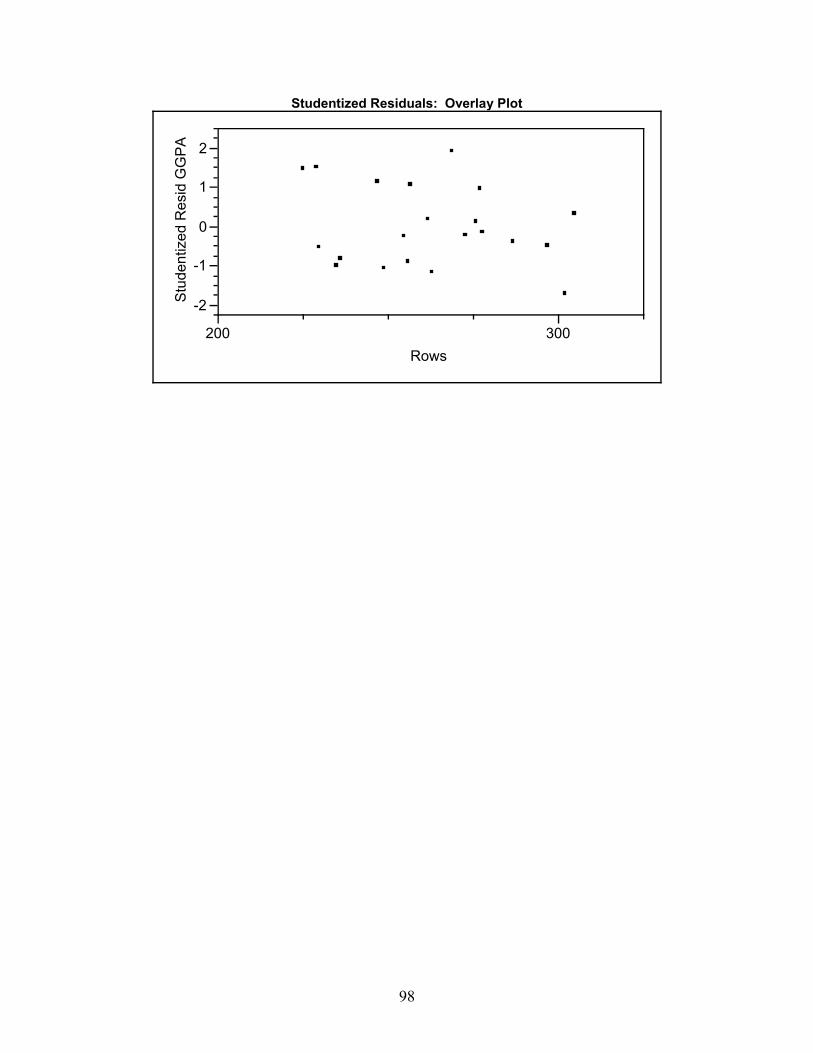
98
Studentized Residuals: Overlay Plot
-2
-1
0
1
2
Stu
dent
ized
Res
id G
GP
A
200 300Rows

99
Appendix H: Validation GRE Baseline Model for Scientists and Engineers
Actual by Predicted Plot
3.13.23.3
3.43.53.63.7
3.83.9
GG
PA
Act
ual
3.0 3.1 3.2 3.3 3.4 3.5 3.6 3.7 3.8 3.9 4.0GGPA Predicted P=0.0568 RSq=0.28RMSE=0.1835
Summary of Fit RSquare 0.279876RSquare Adj 0.173191Root Mean Square Error 0.183536Mean of Response 3.600625Observations (or Sum Wgts) 32
Analysis of Variance Source DF Sum of Squares Mean Square F Ratio Model 4 0.3534779 0.088369 2.6234 Error 27 0.9095036 0.033685 Prob > F C. Total 31 1.2629815 0.0568
Parameter Estimates Term Estimate Std Error t Ratio Prob>|t| Intercept 2.6384303 0.48006 5.50 <.0001 UGPA 0.0317524 0.086758 0.37 0.7172 GRE-Q 0.001246 0.000609 2.04 0.0508 Rank/Grade 0.0198851 0.064043 0.31 0.7586 Prior Enlisted -0.15675 0.074531 -2.10 0.0449
Effect Tests Source Nparm DF Sum of Squares F Ratio Prob > F UGPA 1 1 0.00451204 0.1339 0.7172 GRE-Q 1 1 0.14078491 4.1794 0.0508 Rank/Grade 1 1 0.00324749 0.0964 0.7586 Prior Enlisted 1 1 0.14899688 4.4232 0.0449

100
Residual by Predicted Plot
-0.3
-0.2
-0.1
0.0
0.1
0.2
0.3
GG
PA
Res
idua
l
3.0 3.1 3.2 3.3 3.4 3.5 3.6 3.7 3.8 3.9 4.0GGPA Predicted
Durbin-Watson Durbin-Watson Number of Obs. AutoCorrelation
0.2773592 32 0.0768
Cook’s D Influence: Overlay Plot
0
0.1
Coo
k's
D In
fluen
ce G
GP
A
100 200Rows

101
Studentized Residuals: Overlay Plot
-2
-1
0
1
2
Stu
dent
ized
Res
id G
GP
A
100 200Rows

102
Appendix I: Validation GRE Model for Managers
Actual by Predicted Plot
3.6
3.65
3.7
3.75
3.8
3.85
3.9
3.95
GG
PA
Act
ual
3.60 3.65 3.70 3.75 3.80 3.85 3.90 3.95GGPA Predicted P=0.9532 RSq=0.07RMSE=0.1283
Summary of Fit RSquare 0.073762RSquare Adj -0.38936Root Mean Square Error 0.128281Mean of Response 3.788692Observations (or Sum Wgts) 13
Analysis of Variance Source DF Sum of Squares Mean Square F Ratio Model 4 0.01048405 0.002621 0.1593 Error 8 0.13164872 0.016456 Prob > F C. Total 12 0.14213277 0.9532
Parameter Estimates Term Estimate Std Error t Ratio Prob>|t| Intercept 3.4734728 0.721965 4.81 0.0013 UGPA 0.0035586 0.111454 0.03 0.9753 GRE-Q -0.000041 0.000448 -0.09 0.9303 GRE-V 0.0005359 0.000815 0.66 0.5293 AFSC 0.0053646 0.014164 0.38 0.7147
Effect Tests Source Nparm DF Sum of Squares F Ratio Prob > F UGPA 1 1 0.00001678 0.0010 0.9753 GRE-Q 1 1 0.00013423 0.0082 0.9303 GRE-V 1 1 0.00711351 0.4323 0.5293 AFSC 1 1 0.00236053 0.1434 0.7147

103
Residual by Predicted Plot
-0.15
-0.10
-0.05
0.00
0.05
0.10
0.15
GG
PA
Res
idua
l
3.60 3.65 3.70 3.75 3.80 3.85 3.90 3.95GGPA Predicted
Durbin-Watson Durbin-Watson Number of Obs. AutoCorrelation
0.8292008 13 -0.1458
Cook’s D Influence: Overlay Plot
-0.10
0.10.20.30.40.50.60.7
Coo
k's
D In
fluen
ce G
GP
A
200 300Rows

104
Studentized Residuals: Overlay Plot
-2
-1.5-1
-0.5
00.5
1
1.5
Stu
dent
ized
Res
id G
GP
A
200 300Rows

105
Appendix J: Validation GMAT Model for Managers
Actual by Predicted Plot
3.13.23.33.43.53.63.73.83.9
4
GG
PA
Act
ual
3 4GGPA Predicted P=0.1106 RSq=0.87RMSE=0.1589
Summary of Fit RSquare 0.867828RSquare Adj 0.691599Root Mean Square Error 0.158923Mean of Response 3.778Observations (or Sum Wgts) 8
Analysis of Variance Source DF Sum of Squares Mean Square F Ratio Model 4 0.49749467 0.124374 4.9244 Error 3 0.07576933 0.025256 Prob > F C. Total 7 0.57326400 0.1106
Parameter Estimates Term Estimate Std Error t Ratio Prob>|t| Intercept 3.5988772 0.700884 5.13 0.0143 GMAT 0.0023116 0.000826 2.80 0.0679 Rank/Grade -0.267153 0.148373 -1.80 0.1696 Prior Enlisted -0.448834 0.187918 -2.39 0.0969 AFSC -0.024859 0.02901 -0.86 0.4545
Effect Tests Source Nparm DF Sum of Squares F Ratio Prob > F GMAT 1 1 0.19788436 7.8350 0.0679 Rank/Grade 1 1 0.08188056 3.2420 0.1696 Prior Enlisted 1 1 0.14408159 5.7047 0.0969 AFSC 1 1 0.01854580 0.7343 0.4545

106
Residual by Predicted Plot
-0.20
-0.10
0.00
0.10
0.20
GG
PA
Res
idua
l
3 4GGPA Predicted
Durbin-Watson Durbin-Watson Number of Obs. AutoCorrelation
0 8 0.0000
Cook’s D Influence: Overlay Plot
-0.1
0.1
0.3
0.5
0.7
0.9
1.1
Coo
k's
D In
fluen
ce G
GP
A
200 300Rows

107
Studentized Residuals: Overlay Plot
-2
-1
0
1
2
Stu
dent
ized
Res
id G
GP
A
200 300Rows

108

109

110
Bibliography
“10AF Strategic Plan,” Headquarters 10th Air Force Heritage Home Page. NAS Forth Worth JRB, Texas. 29 December 2003. http://www.afrc.af.mil/10AF/stratplan_3.htm
Abedi, Jamal. “Predicting Graduate Academic Success from Undergraduate Academic
Performance: A Canonical Correlation Study,” Educational and Psychological Measurement, Vol. 51: 151-160 (Spring 1991).
“AFIT Raises Graduation Quotas,” Air Force Institute of Technology Home Page, Public
Affairs. 18 March 2003. http://pa.afit.edu/afitnews.cfm. AFPCa, “Air Force Enlisted Demographics for November 2003: Tour by Career Family,
Rank, and Gender,” Headquarters Air Force Personnel Center, Analysis and Reports Branch, Randolph AFB TX, 29 December 2003. http://www.afpc.randolph.af.mil/demographics/ReportSearch.asp.
AFPCb, “Regular Officer Demographics for November 2003: Tour by Rating and
Gender,” Headquarters Air Force Personnel Center, Analysis and Reports Branch, Randolph AFB TX, 29 December 2003 http://www.afpc.randolph.af.mil/demographics/ReportSearch.asp.
Ahmadi, Mohammad, Farhad Raiszadeh, and Marilyn Helms. “An Examination of the
Admission Criteria for the MBA Program: A Case Study,” Education, 117: 540-546 (Summer 1997).
Air Force Institute of Technology, Academic Year 2002-2003 Catalog. Academic
Catalog of the AFIT Graduate School of Engineering and Management, 2002. Air Force Institute of Technology Graduate School of Engineering and Management
Home Page, Admissions Criteria. 28 December 2003. http://en.afit.edu/Admissions/admissionReq.htm.
Air University/Financial Management Directorate, Air Education and Training
Command. Spreadsheet, “Average Training Course Cost Per Graduate – AU (AFIT),” Maxwell AFB AL, 23 January 2004.
Baker, Randall B. TITLE, Air Force Institute of Technology, Wright-Patterson AFB OH.
Personal Correspondence. 9 January 2004. Buckley, Kevin W. An Evaluation of the Air Force Institute of Technology Student
Selection Criteria. MS thesis, AFIT/GSM/LSR/98S-2. School of Systems and

111
Logistics, Air Force Institute of Technology (AU), Wright-Patterson AFB OH, September 1989 (AD-A215619).
Burnside, Jeffrey M. Scientist Assignments Officer, Randolph AFB TX. Personal
Correspondence. 14 January 2004. DFAS, “2004 Military Pay Rates,” Defense Finance and Accounting Service. 4 February
2004. http://www.dfas.mil/money/milpay/pay. Donahue, Michael W., Chief, Missile and Munitions Maintenance Assignments Officer,
Chief, Air Force Special Operations Command Assignments Officer, Randolph AFB TX. Personal Correspondence. 14 January 2004.
Educational Testing Service (ETS). “Predicting Success in Graduate Education,”
“Guidelines for Use of GRE Scores,” “Guide to the Use of GRE Scores,” (January 2004). 26 January 2004. http://www.gre.org.
Enright, M.K. and D.E. Powers. “Validating the GRE Analytical Ability Measure
Against Faculty Ratings of Analytical Reasoning Skills,” GRE Board Report No. 86-06P, January 1991.
Feldhusen, John F. and Faithi Jarwin. “Predictors of Academic Success at State-
Supported Residential Schools for Mathematics and Science: A Validation Study,” Educational and Psychological Measurement, Vol. 55: 505-512 (June 1995).
Garwood, Kenneth R. Admissions Criteria and Academic Performance in the AFIT
Graduate Cost Analysis Program. MS thesis, AFIT/GAQ/ENV/02M-08. Graduate School of Engineering and Management, Air Force Institute of Technology (AU), Wright-Patterson AFB OH, March 2002 (AD-A400703).
Gibson, James L., John Ivancevich, James Donnelly Jr., and Robert Konopaske.
Organizations: Behavior Structure Processes (11th Edition). New York: McGraw-Hill Higher Education, 2003.
GMAT. “GMAT Overview,” “How Schools Use Your Scores,” “Understanding Your
GMAT Scores,” “GMAT: Interpreting Your Scores” pamphlet, Graduate Management Admissions Council website, (January 2004). 9 February 2004. http://www.mba.com/mba.
Goldberg, E.L., and G.M. Alliger. “Assessing the Validity of the GRE for Students in
Psychology: A Validity Generalization Approach,” Educational and Psychological Measurement, Vol 52: 1019-1027 (Winter 1992).

112
Hartnett, Rodney T. and Warren W. Willingham. “The Criterion Problem: What Measure of Success in Graduate Education?” GRE Board Research Report, GREB No. 77-4R. Educational Testing Service, Princeton, New Jersey, March 1979.
“The Higher Learning Commission Institutional Accreditation: An Overview,” The
Higher Learning Commission Accreditation Brochure, North Central Association of Colleges and Schools (2003). 4 January 2004 http://www.ncahigherlearningcommission.org.
Hoefer, Peter and James Gould. “Assessment of Admission Criteria for Predicting
Students’ Academic Performance in Graduate Business Programs,” Journal of Education for Business, vol 75 No. 4: 225-229 (Mar/Apr 2000).
Hoon, Craig. AFIT Admissions Counselor, Air Force Institute of Technology, Wright-
Patterson AFB OH. Telephone Correspondence. 11 February 2004. House, Daniel J. “Age Differences in Prediction of Student Achievement from Graduate
Record Examination Scores,” The Journal of Genetic Psychology, Vol. 159 No. 3: 379-382 (1998).
House, Daniel J. “Gender Differences in Prediction of Grade Performance from Graduate
Record Examination Scores,” The Journal of Psychology, Vol. 128 No. 6: 695 (November 1994).
Keith, Robert W. Success Predictors for Students to Attend AFIT Department of Systems
Management Master’s Degree Programs. MS thesis, AFIT/GSM/SM/77S-7. School of Engineering, Air Force Institute of Technology (AU), Wright-Patterson AFB OH, September 1977 (AD-A046110).
Kuncel, Nathan R., Sarah Hezlett, and Deniz Ones. “A Comprehensive Meta-Analysis of
the Predictive Validity of the Graduate Record Examinations: Implications for Graduate Student Selection and Performance,” Psychological Bulletin, Vol 127 No. 1: 162-181 (2001).
Leedy, Paul D. and Jeanne Ormrod. Practical Research Planning and Design (7th
Edition). Upper Saddle River, New Jersey: Prentice-Hall Inc., 2001. Lingle, Brandon J. Air Force Personnel Center, Personnel Readiness Division, Randolph
AFB, TX. Personal Correspondence. 29 December 2003. McClave, James T., P. George Benson, and Terry Sincich. Statistics for Business and
Economics (8th Edition). Upper Saddle River, New Jersey: Prentice-Hall Inc., 2001.

113
McCloy, Rodney A., John P. Campbell, and Robert Cudeck. “A Confirmatory Test of a Model of Performance Determinants,” Journal of Applied Psychology, Vol. 79 No. 4: 493-505 (1994).
Monson, Michael G., Financial Management Assignments Officer, Randolph AFB TX.
Personal Correspondence. 14 January 2004. Morrison, Todd and Melanie Morrison. “A Meta-Analytic Assessment of the Predictive
Validity of the Quantitative and Verbal Components of the Graduate Record Examination with Graduate Grade Point Average Representing the Criterion of Graduate Success,” Educational and Psychological Measurement, Vol. 55: 309-316 (April 1995).
Nilsson, Johanna E. “The GRE and the GMAT: A Comparison of their Correlations to
GGPA,” Educational and Psychological Measurement, Vol. 55: 637-640 (August 1995).
Peiperi, Maury A. and Rose Trevelyan. “Predictors of Performance at Business School
and Beyond: Demographic Factors and the Contrast Between Individual and Group Outcomes,” The Journal of Management Development, Vol. 16 No. 5: 354 (1997).
Peterson, Edward H., Logistics Readiness Assignments Officer, Randolph AFB TX.
Personal Correspondence. 14 January 2004. Powers, D.E. “Validity of GRE General Test Scores for Admisison to Colleges of
Veterinary Medicine,” GRE Board Report No. 98-09R, Educational Testing Services, Princeton, New Jersey, May 2001.
“Predicting Performance in Graduate School,” Science, Vol. 260: 494, 23 April 1993. Prokopyk, William N. A Study of Academic Success Predictor Variables for Students
Enrolled in AFIT’s Graduate Operations Research Programs. MS thesis, AFIT/ENS/GST/88M-10, School of Engineering, Air Force Institute of Technology (AU), Wright-Patterson AFB OH, March 1988 (AD-A190760).
Ree, Malcolm James, James A. Earles, and Mark S. Teachout. “Predicting Job
Performance: Not Much More than g,” Journal of Applied Psychology, Vol. 79 No. 4: 518-524 (1994).
Roche, James G., Secretary of the Air Force. “Adaptive Warfighting – Meeting the
Needs of the 21st Century.” Address to the United States of America Unmanned Aerial Vehicle Conference. Washington, D. C., 4 December 2003.

114
Roche, James G., Secretary of the Air Force. “Be Proud to Call Yourselves Airmen.” Address to the Worldwide First Sergeant’s Conference. Jacksonville, Florida, 14 August 2002.
Roth, Philip L., Craig A. BeVier, Fred S. Switzer III, and Jeffery S. Schippmann. “Meta-
Analyzing the Relationship Between Grades and Job Performance,” Journal of Applied Psychology, Vol. 81 No. 5: 548-556 (1996).
Schneider, L.M. and J.B. Briel. “Validity of the GRE: 1988-1989 Summary Report,”
Educational Testing Service, Princeton, New Jersey, 1990. Sobol, M. G. “GPA, GMAT and Scale: A Method for Quantification of Admissions
Criteria,” Research in Higher Education, Vol. 20: 77-88, 1984. Spangler, Mark E. A Regression Model for Predicting Academic Success of Prospective
Students in the AFIT Graduate Logistics Management Program. MS thesis, AFIT/GSM/ENS/89D-39. School of Systems and Logistics, Air Force Institute of Technology (AU), Wright-Patterson AFB OH, December 1989 (AD-A246812).
Sny, Daniel R. A Validity Study on the Air Force Institute of Technology Student
Selection Criteria for Resident Master’s Degree Program. MS thesis, AFIT/GLM/LSR/92S-59. School of Systems and Logistics, Air Force Institute of Technology (AU), Wright-Patterson AFB OH, September 1991 (AD-A246812).
Thomas, Tim, Program Management Assignments Officer, Randolph AFB TX. Personal
Correspondence. 14 January 2004. Van Scotter, James R. Predictors of Success in Air Force Institute of Technology
Residents Master’s Degree Programs: A Validity Study. MS thesis, AFIT/GSM/LSR/89S-2. School of Systems and Logistics, Air Force Institute of Technology (AU), Wright-Patterson AFB OH, September 1983 (AD-A134391).
Walpole, MaryBeth, Nancy Burton, Kamau Kanyi, and Altamese Jackenthal. “Selecting
Successful Graduate Students: In-Depth Interviews With GRE Users,” GRE Board Research Report No. 99-11R, Educational Testing Service, Princeton, New Jersey, April 2002.
Willingham, Warren W. “Predicting Success in Graduate Education,” Science, Vol 183:
273-278 (25 January 1974). Willingham, Warren W. “Validity and the Graduate Record Examinations Program,”
Educational Testing Service, Princeton, New Jersey, 1976. Zitzmann, Charles C. The Predictive Validity of the AFIT Graduate Engineering and
Environmental Management (GEEM) Admission Requirements. MS thesis,

115
AFIT/GAQ/ENV/02M-16. Graduate School of Engineering and Management, Air Force Institute of Technology (AU), Wright-Patterson AFB OH, March 2002 (AD-A400808).
Zwick, Rebecca J. “The Validity of the GMAT for the Prediction of Success in Doctoral
Study in Business Management,” GMAC Research Report No. RR-90-24. Educational Testing Service, Princeton, New Jersey, 1990.

116
REPORT DOCUMENTATION PAGE Form Approved OMB No. 074-0188
The public reporting burden for this collection of information is estimated to average 1 hour per response, including the time for reviewing instructions, searching existing data sources, gathering and maintaining the data needed, and completing and reviewing the collection of information. Send comments regarding this burden estimate or any other aspect of the collection of information, including suggestions for reducing this burden to Department of Defense, Washington Headquarters Services, Directorate for Information Operations and Reports (0704-0188), 1215 Jefferson Davis Highway, Suite 1204, Arlington, VA 22202-4302. Respondents should be aware that notwithstanding any other provision of law, no person shall be subject to an penalty for failing to comply with a collection of information if it does not display a currently valid OMB control number. PLEASE DO NOT RETURN YOUR FORM TO THE ABOVE ADDRESS. 1. REPORT DATE (DD-MM-YYYY)
23-03-2004 2. REPORT TYPE
Master’s Thesis 3. DATES COVERED (From – To)
Aug 2001 – Mar 2004 5a. CONTRACT NUMBER
5b. GRANT NUMBER
4. TITLE AND SUBTITLE THE PREDICTIVE VALIDITY OF THE AFIT GRADUATE MANAGEMENT
PROGRAM ADMISSION REQUIREMENTS: A REASSESSMENT AND EXTENSION
5c. PROGRAM ELEMENT NUMBER
5d. PROJECT NUMBER If funded, enter ENR # 5e. TASK NUMBER
6. AUTHOR(S) Woods, Sarah E., Captain, USAF
5f. WORK UNIT NUMBER
7. PERFORMING ORGANIZATION NAMES(S) AND ADDRESS(S) Air Force Institute of Technology Graduate School of Engineering and Management (AFIT/EN) 2950 Hobson Way, Building 641 WPAFB OH 45433-7765
8. PERFORMING ORGANIZATION REPORT NUMBER AFIT/GAQ/ENV/04M-03
10. SPONSOR/MONITOR’S ACRONYM(S)
9. SPONSORING/MONITORING AGENCY NAME(S) AND ADDRESS(ES)
11. SPONSOR/MONITOR’S REPORT NUMBER(S)
12. DISTRIBUTION/AVAILABILITY STATEMENT APPROVED FOR PUBLIC RELEASE; DISTRIBUTION UNLIMITED.
13. SUPPLEMENTARY NOTES 14. ABSTRACT
This research is based on the Air Force and AFIT balancing mission requirements of personnel needed for duty and training airmen in advanced studies. Currently, over 50% of AFIT students do not meet AFIT entrance requirements. The purpose of this research was to examine criteria to determine its predictability of graduate success, as measured by graduate GPA, as well as determine whether performance is different for students who require criteria to be waived. Current AFIT eligibility criteria include undergraduate GPA, GRE test scores, or GMAT test scores. Other variables examined in this study include: GRE-Analytical test scores; rank/grade; prior enlistment; AFSC; gender; and number of members in household.
This research found GMAT scores were a better predictor of success than GRE scores for management students. GRE-Q scores were good predictors for all students, while GRE-V scores were moderately good predictors for management students only. GRE-A scores should be added as a requirement with an appropriate standard. Undergraduate GPAs should be used as a guideline, not eligibility criteria into AFIT. Waivers should not be given for multiple deficiencies when possible, though there was little difference in the performance of students who met the criteria and those who did not. There was also little difference in the performance of students depending upon the type of waiver given. 15. SUBJECT TERMS Graduate Success, Predictability Study, GRE/GMAT, AFIT Admissions Criteria, Waiver Assessment 16. SECURITY CLASSIFICATION OF:
19a. NAME OF RESPONSIBLE PERSON Bryan J. Hudgens, Maj, USAF (ENV)
REPORT U
ABSTRACT U
c. THIS PAGE U
17. LIMITATION OF ABSTRACT
UU
18. NUMBER OF PAGES
117 19b. TELEPHONE NUMBER (Include area code) (937) 255-3636; e-mail: [email protected]
Standard Form 298 (Rev: 8-98) Prescribed by ANSI Std. Z39-18