Department of Regional Australia, Regional … Department of Regional Australia, Regional...
44
11 Department of Regional Australia, Regional Development and Local Government Agency resources and planned performance
Transcript of Department of Regional Australia, Regional … Department of Regional Australia, Regional...
11
Department of Regional Australia, Regional
Development and Local Government
Agency resources and planned performance

13
DEPARTMENT OF REGIONAL AUSTRALIA, REGIONAL DEVELOPMENT AND LOCAL GOVERNMENT
Section 1: Agency overview and resources ............................................................. 15 1.1 Strategic direction statement .......................................................................... 15 1.2 Agency resource statement ............................................................................ 18 1.3 Budget measures ............................................................................................ 20
Section 2: Outcomes and planned performance ..................................................... 23 2.1 Outcomes and performance information ........................................................ 23
Section 3: Explanatory tables and budgeted financial statements ....................... 39 3.1 Explanatory tables .......................................................................................... 39 3.2 Budgeted financial statements ....................................................................... 42


DEPARTMENT OF REGIONAL AUSTRALIA, REGIONAL DEVELOPMENT AND LOCAL GOVERNMENT
Section 1: Agency overview and resources
1.1 STRATEGIC DIRECTION STATEMENT
The Department of Regional Australia, Regional Development and Local Government (DRARDLG) works across the Government and in partnership with States, Territories, regional groups, Regional Development Australia Committees and Local Government to maximise economic growth, flexibility and diversity. The department is ensuring that the needs of different regions are understood and considered by Government in its policy development and service delivery functions.
The department achieves this through two outcomes:
• coordinated community infrastructure and services in rural, regional and Local Government areas through financial assistance; and
• good governance in the Australian Territories through the maintenance and improvement of the overarching legislative framework for self-governing Territories, and laws and services for non self-governing Territories.
The key roles of the department include:
• Partnering with a network of Regional Development Australia (RDA) Committees and Local Governments to ensure that policy making and advice is informed by local input and priorities, and interventions are tailored to meet the diverse needs of our regions.
• Developing specific regional policies in areas such as economic development and community-based structural adjustment in response to social, economic or environmental priorities.
• Working across all levels of government to develop and implement a place based approach to co-ordinate, integrate and leverage government initiatives and investments within regions.
• Working across all Commonwealth agencies to ensure that regional implications are embedded in broader policy considerations and program implementation.
• Developing a sound evidence base and strong analytic capacity on regional economic, social and environmental issues to inform and underpin regional policy development and program delivery, and to influence other portfolio policies and programs.
• Managing regional grants programs, to deliver community and economic infrastructure, to foster growth and to improve the economic and social outcomes in Australia’s regions and local communities.
15

DRARDLG Budget Statements
• Providing strategic direction and oversight of the Commonwealth Government’s recovery efforts in response to the flood and cyclone affected areas arising from the events of late 2010-early 2011; and secretariat support to the Australian Government Reconstruction Inspectorate.
• Administering the Territories of the Ashmore and Cartier Islands, Christmas Island, the Cocos (Keeling) Islands, the Coral Sea Islands and Jervis Bay, and oversighting national interests in the Australian Capital Authority (including through the National Capital Authority), the Northern Territory and Commonwealth responsibilities on Norfolk Island.
In 2011-12, the department will continue to develop and implement a range of new initiatives in regional areas including:
• Bringing together critical regional stakeholders and developing approaches to address the impacts of key priority issues. Areas of focus may include the Murray Darling Basin Plan, climate change and carbon pricing, digital productivity and workforce participation.
• Working with all other agencies to embed regional implications in broader policy considerations and program implementation.
• Developing myregion.gov.au interactive website - a key element of engaging with regional communities and providing better access to government information on regions.
• Establishing and supporting a Regional Development Policy Centre.
• Supporting a COAG Standing Council on regional Australia.
• Strengthening the Regional Development Australia (RDA) network and building the capacity of RDA Committees.
• Managing the Australian Government’s new Regional Development Australia Fund (RDAF) and Community Infrastructure Grants (CIG).
• Funding a number of projects including: partnering with Football NSW to construct a world class football and sporting precinct at Riverstone West; upgrading the indoor sports stadium at Port Macquarie; and contributing to the restoration of the Port of Karumba seawall.
• Supporting regional cities to implement strategic and targeted marketing strategies to promote the benefits and opportunities of living and working in those cities to the broader community.
• Working with the Queensland and Victorian Governments, and other State governments where appropriate, to ensure timely recovery and reconstruction of disaster–affected infrastructure that achieves value for money.
• Progressing a referendum on constitutional recognition of Local Government.
16

DRARDLG Budget Statements
• Upgrading essential infrastructure on Christmas Island including water and waste water pressure mains and pumping upgrade, hospital extension, fuel supply and storage facility, and an extension to the wharf.
• Providing support for the joint national program for the celebration of the Centenary of Canberra with the ACT government.
• Reforms to promote economic sustainability and improved governance for Norfolk Island.
17

DRARDLG Budget Statements
1.2 AGENCY RESOURCE STATEMENT
Table 1.1 shows the total resources from all sources. The table summarises how resources will be applied by outcome and by administered and departmental classification.
Table 1.1: Department of Regional Australia, Regional Development and Local Government Resource Statement — Budget estimates for 2011-12 as at Budget May 2011
Estimate Proposed Total Actualof prior + at Budget = estimate available
year amounts appropriationavailable in
2011-12 2011-12 2011-12 2010-11$'000 $'000 $'000 $'000
Ordinary annual services1
Departmental appropriationPrior year departmental appropriation2 6,588 3,733 10,321 - Departmental appropriation3 - 68,175 68,175 44,533 s31 relevant agency receipts4 - 60 60 45 Total 6,588 71,968 78,556 44,578
Administered expensesOutcome 1 - 202,731 202,731 100,356 Outcome 25 36,478 107,117 143,595 117,500 Total 36,478 309,848 346,326 217,856
Total ordinary annual services A 43,066 381,816 424,882 262,434
Other services6
Administered expensesSpecific payments to States,
ACT, NT and local governmentOutcome 1 - 56,249 56,249 245,272 Total - 56,249 56,249 245,272
Administered non-operatingAdministered assets and liabilities - 33,982 33,982 57,738 Total - 33,982 33,982 57,738
Total other services B - 90,231 90,231 303,010
Total available annual appropriations 43,066 472,047 515,113 565,444
Special appropriationsSpecial appropriations limited
by criteria/entitlementLocal Government (Financial Assistance) Act 1995 - s19 - 1,609,717 1,609,717 2,107,606
Total special appropriations C - 1,609,717 1,609,717 2,107,606
Total appropriations excluding Special Accounts 43,066 2,081,764 2,124,830 2,673,050
18

DRARDLG Budget Statements
Table 1.1: Department of Regional Australia, Regional Development and Local Government Resource Statement — Budget estimates for 2011-12 as at Budget May 2011 (continued)
Estimate Proposed Total Actualof prior + at Budget = estimate available
year amounts appropriation available in
2011-12 2011-12 2011-12 2010-11$'000 $'000 $'000 $'000
Special AccountsOpening balance7 - 2,800 2,800 2,800 Non-appropriation receipts to Special Accounts - 1,000 1,000 667
Total Special Account D - 3,800 3,800 3,467 Total resourcing (A+B+C+D) 43,066 2,085,564 2,128,630 2,676,517 1 Appropriation Bill (No.1) 2011-12. 2 Estimated balance carried forward from previous year. 3 Includes an amount of $1.0m in 2011-12 for the Departmental Capital Budget (refer to Table 3.2.5 for
further details). For accounting purposes this amount has been designated as 'contributions by owners'. 4 Estimate of own source receipts. 5 Includes an amount of $10.8m in 2011-12 for the Administered Capital Budget (refer to Table 3.2.10 for
further details). For accounting purposes this amount has been designated as 'contributions by owners'. 6 Appropriation Bill (No.2) 2011-12. 7 Estimated opening balance for special accounts (refer Table 3.1.2 for further details). Excludes payments for National Partnership Payments to and through the States and Territories. The Treasury holds the appropriation for these items and reports the financial details accordingly. The non-financial performance of the corresponding programs remains the responsibility of the department. All figures are GST exclusive.
19

DRARDLG Budget Statements
1.3 BUDGET MEASURES
Budget measures relating to the department are detailed in Budget Paper No. 2 and summarised below.
Table 1.2: Department of Regional Australia, Regional Development and Local Government 2011-12 Budget measures
Program 2010-11 2011-12 2012-13 2013-14 2014-15$'000 $'000 $'000 $'000 $'000
Expense measures Centenary of Canberra - a gift to the national capital 2.1
Administered - - - - - Departmental - - - - -
Total - - - - - Centenary of Canberra - contribution to a joint national program 2.1
Administered - - - - - Departmental - 122 123 124 -
Total - 122 123 124 - Community Infrastructure Grants - additional funding1 1.1
Administered - - - - - Departmental - - - - -
Total - - - - -
Department of Regional Australia, Regional Development and Local Government - additional resourcing 1.1
Administered - - - - - Departmental 2,306 17,006 11,313 9,645 9,567
Total 2,306 17,006 11,313 9,645 9,567 Efficiency dividend - temporary increase in the rate all
Administered - - - - - Departmental - (191) (535) (601) (721)
Total - (191) (535) (601) (721) Local government payments - accelerating payments 1.2
Administered 536,572 (536,572) - - - Departmental - - - - -
Total 536,572 (536,572) - - -
MyRegion website - establishment 1.1Administered - - - - - Departmental - 1,971 829 713 718
Total - 1,971 829 713 718
20

DRARDLG Budget Statements
Table 1.2: Department of Regional Australia, Regional Development and Local Government 2011-12 Budget measures (continued)
Program 2010-11 2011-12 2012-13 2013-14 2014-15$'000 $'000 $'000 $'000 $'000
Natural Disaster Recovery and Rebuilding - assistance to Queensland local governments 1.1
Administered - - - - - Departmental - - - - -
Total - - - - - Natural Disaster Recovery and Rebuilding - Commission of Inquiry into Queensland Floods all
Administered - - - - - Departmental (81) (87) - - -
Total (81) (87) - - - Natural Disaster Recovery and Rebuilding - National Disaster Recovery Taskforce and the Reconstruction Inspectorate - establishment 1.1
Administered - - - - - Departmental 1,427 6,934 3,161 - -
Total 1,427 6,934 3,161 - - Natural Disaster Recovery and Rebuilding - Priority Regional Infrastructure Program - reallocation 1.1
Administered - (50,000) (125,000) (125,000) (50,000) Departmental - - - - -
Total - (50,000) (125,000) (125,000) (50,000) Norfolk Island Government - financial assistance2 2.1
Administered 4,209 - - - - Departmental - - - - -
Total 4,209 - - - - Port Macquarie indoor sports stadium upgrade - contribution 1.1
Administered - 1,400 1,400 - - Departmental - - - - -
Total - 1,400 1,400 - - Regional Development Australia committees - additional resourcing 1.1
Administered - 3,155 3,228 3,295 3,365 Departmental - 2,085 1,702 1,717 1,730
Total - 5,240 4,930 5,012 5,095 Restoration of the Port of Karumba seawall - contribution 1.1
Administered - 2,000 - - - Departmental - - - - -
Total - 2,000 - - -
21

DRARDLG Budget Statements
Table 1.2: Department of Regional Australia, Regional Development and Local Government 2011-12 Budget measures (continued)
Program 2010-11 2011-12 2012-13 2013-14 2014-15$'000 $'000 $'000 $'000 $'000
Riverstone Football and Sporting Precinct Community Infrastructure Initiative 1.1
Administered - 2,000 5,000 1,000 - Departmental - - - - -
Total - 2,000 5,000 1,000 -
South Australian local roads - continuation of supplementary funding 1.2
Administered - 16,349 17,042 17,685 - Departmental - 696 351 - -
Total - 17,045 17,393 17,685 - Sustainable Australia - promoting regional living 1.1
Administered - 2,000 4,000 4,000 - Departmental - 620 320 420 100
Total - 2,620 4,320 4,420 100
Total expense measuresAdministered 540,781 (559,668) (94,330) (99,020) (46,635) Departmental 3,652 29,156 17,264 12,018 11,394
Total 544,433 (530,512) (77,066) (87,002) (35,241)
Capital measuresBorder Security - Christmas Island infrastructure 2.1
Administered - 13,000 21,500 9,100 - Departmental - - - - -
Total - 13,000 21,500 9,100 - Efficiency dividend - temporary increase in the rate all
Administered - (55) (90) (100) (185) Departmental - (5) (12) (21) (16)
Total - (60) (102) (121) (201)
Total capital measuresAdministered - 12,945 21,410 9,000 (185) Departmental - (5) (12) (21) (16)
Total - 12,940 21,398 8,979 (201)
1 The Government will provide additional funding for the Community Infrastructure Grants program, the cost of which will be met from within existing resources by redirecting $49m from the Priority Regional Infrastructure Program (now a part of the Regional Development Australia Fund).
2 $6.4m has been provided in 2010-11 to enable the Norfolk Island Government to continue to provide essential services to its population. The 2010-11 PAES included additional funding of $4.2m, which was a decision made after the 2010-11 Mid-Year Economic Fiscal Outlook but prior to the publication of the PAES. To ensure completeness of Budget documentation this measure will be published in the 2011-12 Budget Paper No.3 and has been reflected in these PB Statements. The additional $2.2m will be funded internally by the department and has no fiscal impact.
Prepared on a Government Finance Statistics (fiscal) basis.
22
DRARDLG Budget Statements
Section 2: Outcomes and planned performance
2.1 OUTCOMES AND PERFORMANCE INFORMATION
Government outcomes are the intended results, impacts or consequences of actions by the Government on the Australian community. Commonwealth programs are the primary vehicle by which government agencies achieve the intended results of their outcome statements. Agencies are required to identify the programs which contribute to Government outcomes over the Budget and forward years.
Each outcome is described below, together with its related programs, specifying the performance indicators and targets used to assess and monitor the performance of the department in achieving Government outcomes.
OUTCOME 1
Outcome 1: Coordinated community infrastructure and services in rural, regional and local government areas through financial assistance.
Outcome 1 Strategy Outcome 1 is delivered through the following programs:
• Regional Development.
• Local Government.
The department will advise on, and lead, national efforts to address regional and Local Government issues by:
• Developing specific regional policies in areas such as economic development and community-based adjustment in response to social, economic or environmental priorities.
• Working across all Commonwealth agencies to ensure that regional implications are embedded in broader policy considerations and program implementation.
• Developing a sound evidence base and strong analytic capacity on regional economic, social and environmental issues to inform and underpin regional policy development and program delivery, and to influence other portfolio policies and programs.
• Developing the myregion.gov.au interactive website - a key element of engaging with regional communities.
• Supporting a COAG Standing Council on regional Australia.
• Establishing, supporting and monitoring a Regional Development Policy Centre.
23

DRARDLG Budget Statements
• Partnering with a network of 55 Regional Development Australia committees, 565 Local Governments together with State and Territory governments to strengthen networks to ensure that policy making and advice is informed by local input and priorities, and interventions are tailored to meet the diverse needs of our regions.
• Managing regional grants programs, including the Australian Government’s new Regional Development Australia Fund (RDAF), the Community Infrastructure Grants (CIG) Program and targeted funding to local communities through the Regional and Local Community Infrastructure Program (RLCIP).
• Delivering the Better Regions Program.
• Supporting regional cities to promote the benefits and opportunities of living and working in those cities to the broader Australian community.
• Co-ordinating, integrating and leveraging government initiatives in its northern Australian program including establishing a Northern Australia Ministerial Forum that oversees initiatives to promote sustainable economic development across northern Australia.
• Implementing a government response to the Northern Australia Land and Water Taskforce.
• Working closely with the Western Australia Department of State Development, the Shire of Wyndham East Kimberley, and relevant Aboriginal corporations, in the implementation of the East Kimberley Development Package.
• Coordinating and working with other Commonwealth and State Government agencies to develop policy which underpins sound and innovative reconstruction and recovery efforts following the national disasters in late 2010-early 2011; and providing secretariat support to the Australian Government Reconstruction Inspectorate.
• Managing Financial Assistance Grants to Local Governments. Financial Assistance Grants consist of two components:
- a general purpose component which is distributed between the States and Territories according to population, and
- an identified local road component which is distributed between the States and Territories according to fixed historical shares.
Both components of the grants are untied in the hands of Local Government, allowing councils to spend the grants according to local priorities.
• Administering the Local Government Reform Fund.
• Progressing a referendum on constitutional recognition of Local Government.
The department will consult extensively with relevant stakeholders including local communities, State, Territory and Local Governments, the Regional Development Australia network and industry.
24

DRARDLG Budget Statements
Following COAG’s federal financial framework reforms, the Treasury is responsible for National Partnership Payments to and through the States and Territories. The Treasury holds the appropriation for these items and reports the financial details accordingly. The non-financial performance of the corresponding programs remains the responsibility of the department. The Outcome 1 programs administered by DRARDLG under this framework are the East Kimberly Development Package Program, the Local Government Reform Fund Program, the Regional Development Australia Fund, and the Natural Disaster Recovery and Rebuilding – Assistance to Queensland Local Government.
25

DRARDLG Budget Statements
Outcome expense statement
Table 2.1 provides an overview of the total expenses for outcome 1, by program.
Table 2.1: Budgeted expenses for Outcome 1 2010-11 2011-12
Estimated Estimatedactual expenses
expenses$'000 $'000
Program 1.1: Regional DevelopmentAdministered expenses
Ordinary annual services (Appropriation Bill No. 1) 99,873 202,181 Other services (Appropriation Bill No. 2) 9,301 -
Departmental expensesDepartmental appropriation1 27,117 51,760
Expenses not requiring appropriation in the Budget year2 134 457
Total for Program 1.1 136,425 254,398
Program 1.2: Local GovernmentAdministered expenses
Ordinary annual services (Appropriation Bill No. 1) 400 550 Other services (Appropriation Bill No. 2) 235,970 56,249 Special appropriations 2,082,222 1,609,717
Departmental expensesDepartmental appropriation1 4,116 6,233
Expenses not requiring appropriation in the Budget year2 20 55
Total for Program 1.2 2,322,728 1,672,804
Outcome 1 Totals by appropriation typeAdministered Expenses
Ordinary annual services (Appropriation Bill No. 1) 100,273 202,731 Other services (Appropriation Bill No. 2) 245,271 56,249 Special appropriations 2,082,222 1,609,717
Departmental expensesDepartmental appropriation1 31,233 57,993
Expenses not requiring appropriation in the Budget year2 154 512
Total expenses for Outcome 1 2,459,153 1,927,202
2010-11 2011-12Average Staffing Level (number) 241 332
Outcome 1: Coordinated community infrastructure and services in rural, regional and local government areas through financial assistance
1 Departmental Appropriation combines ‘Ordinary annual services (Appropriation Bill No. 1)’ and
‘Revenue from independent sources (s31)’. 2 Expenses not requiring appropriation in the Budget year is made up of depreciation expense,
amortisation expense and audit fees. Note: Departmental appropriation splits and totals are indicative estimates and may change in the course of the budget year as government priorities change.
26

DRARDLG Budget Statements
Contributions to Outcome 1
Program 1.1: Regional Development Program objective The Regional Development program contributes to Outcome 1 through a range of regionally focused stakeholder consultation and engagement, research, policy development, and program delivery activities. These include:
• Better Regions: delivering the Government’s 2007 election commitments by implementing important community and social infrastructure projects identified by local communities as priority investments for their regions.
• East Kimberley Development Package: Coordinating the Australian Government interest in the implementation of the package which is jointly implemented by the Western Australian Government.
• Regional and Rural Research and Development Grants: provides funding for research into issues affecting Australia’s regions, and to help communicate this research to national and regional decision makers.
• Regional Development Australia Committees: funds the operational costs of RDA committees to support their work in engaging with States, Territories, Local Government and regional communities to promote regional planning; economic development initiatives; and provide advice to Government on issues affecting, and opportunities for, regional Australia.
• Regional Development Australia Fund: funds projects that support the infrastructure needs that will enhance the economic and community development of Australia’s regions.
• Community Infrastructure Grants: delivers the Government’s 2010 election commitments by implementing important community and social infrastructure projects identified by local communities as priority investments for their regions.
• Promoting Regional Living: funds regional cities to implement strategic and targeted marketing strategies to promote the benefits and opportunities of living and working in those cities.
• Northern Australia Sustainable Futures: provides advice to the Minister on achieving sustainable development outcomes and improved coordination between governments and with key stakeholders in relation to the northern Australia agenda.
• National Disaster Recovery Taskforce: works with other Commonwealth and State Government agencies to develop policy which underpins sound and innovative reconstruction and recovery efforts.
27
DRARDLG Budget Statements
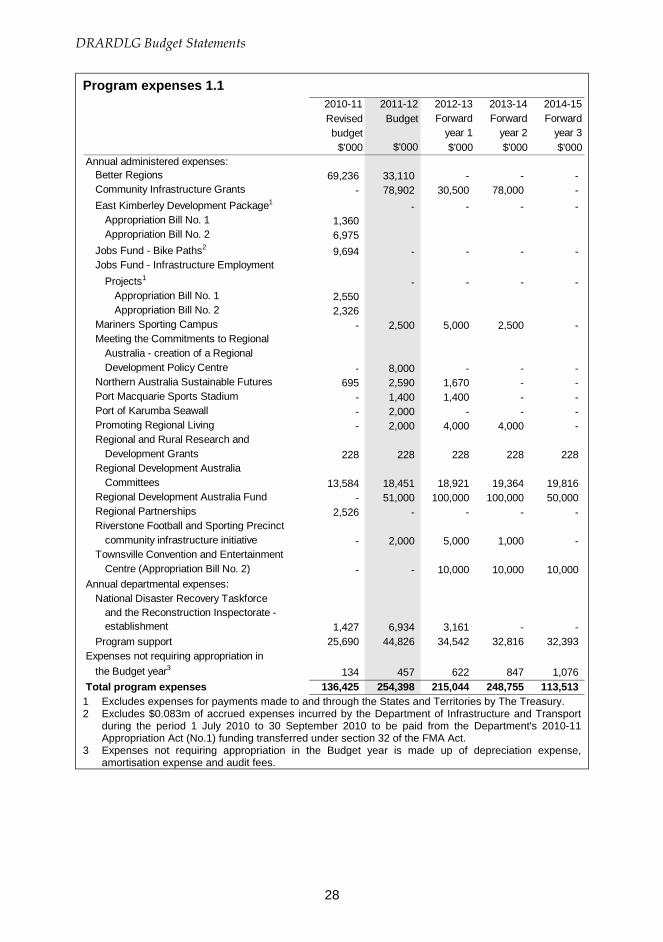
Program expenses 1.1 2010-11 2011-12 2012-13 2013-14 2014-15Revised Budget Forward Forward Forwardbudget year 1 year 2 year 3
$'000 $'000 $'000 $'000 $'000Annual administered expenses:
Better Regions 69,236 33,110 - - - Community Infrastructure Grants - 78,902 30,500 78,000 - East Kimberley Development Package1 - - - -
Appropriation Bill No. 1 1,360 Appropriation Bill No. 2 6,975
Jobs Fund - Bike Paths2 9,694 - - - - Jobs Fund - Infrastructure Employment
Projects1 - - - - Appropriation Bill No. 1 2,550 Appropriation Bill No. 2 2,326
Mariners Sporting Campus - 2,500 5,000 2,500 - Meeting the Commitments to Regional
Australia - creation of a Regional Development Policy Centre - 8,000 - - -
Northern Australia Sustainable Futures 695 2,590 1,670 - - Port Macquarie Sports Stadium - 1,400 1,400 - - Port of Karumba Seawall - 2,000 - - - Promoting Regional Living - 2,000 4,000 4,000 - Regional and Rural Research and
Development Grants 228 228 228 228 228 Regional Development Australia
Committees 13,584 18,451 18,921 19,364 19,816 Regional Development Australia Fund - 51,000 100,000 100,000 50,000 Regional Partnerships 2,526 - - - - Riverstone Football and Sporting Precinct
community infrastructure initiative - 2,000 5,000 1,000 - Townsville Convention and Entertainment
Centre (Appropriation Bill No. 2) - - 10,000 10,000 10,000 Annual departmental expenses:
National Disaster Recovery Taskforce and the Reconstruction Inspectorate - establishment 1,427 6,934 3,161 - -
Program support 25,690 44,826 34,542 32,816 32,393 Expenses not requiring appropriation in
the Budget year3 134 457 622 847 1,076 Total program expenses 136,425 254,398 215,044 248,755 113,513 1 Excludes expenses for payments made to and through the States and Territories by The Treasury. 2 Excludes $0.083m of accrued expenses incurred by the Department of Infrastructure and Transport
during the period 1 July 2010 to 30 September 2010 to be paid from the Department's 2010-11 Appropriation Act (No.1) funding transferred under section 32 of the FMA Act.
3 Expenses not requiring appropriation in the Budget year is made up of depreciation expense, amortisation expense and audit fees.
28

DRARDLG Budget Statements
Program 1.1 Deliverables
• Regional Development:
- Strategic policy and implementation advice on the delivery of the Government’s commitment to regional Australia including support for the key whole of government and cross government regionally focused fora.
- Develop and implement place based approaches to support communities in making the best of their opportunities and managing their challenges.
- Enhance engagement with the RDA networks, Commonwealth, State, Territory and Local Governments, and regional communities, to better identify issues affecting, and opportunities for, regional Australia.
- Ensure effective engagement with all stakeholders including all levels of Government, the private sector and the not-for-profit sector.
- Support regional development objectives through the effective and efficient delivery of administered items.
- Effective development and delivery of grants programs.
• Promoting Regional Living:
- Manage a competitive grants program to promote the benefits and opportunities of living and working in regional cities.
• Northern Australia Sustainable Futures:
- Provide advice to the Government concerning northern Australia issues.
- Deliver a response to the Government to the report of the Northern Australia Land and Water Taskforce.
- Continue to progress northern Australia issues, establishment and effective operation of the Northern Australia Ministerial Forum and Northern Australia Sustainable Futures Program initiatives.
• East Kimberley Development Package:
- Coordinate delivery of the East Kimberley Development Package.
29
DRARDLG Budget Statements
• National Disaster Recovery Taskforce:
- Provide responsive support to the Minister Assisting the Attorney-General for Queensland Flood Recovery and the Minister for Regional Australia, Regional Development and Local Government, the Australian Government Reconstruction Inspectorate, Prime Minister's Business Taskforce and Secretaries’ Steering Committee.
- Coordinate and maximise contribution of existing Commonwealth programs to the recovery effort.
- Assure the Commonwealth that public funding of reconstruction efforts represents value for money.
- Work collaboratively with other Commonwealth agencies to influence the development of policy to underpin sound and innovative reconstruction and recovery efforts.
Program 1.1 Key performance indicators
• Regional Development:
- High level of satisfaction of the Minister in regards to the:
• quality and timeliness of advice, briefing and support.
• collaboration with other agencies in the delivery of the department’s responsibilities.
• support for a COAG Standing Council on regional Australia.
- Issues and risks in regional service delivery, policies and program implementation are identified and actioned appropriately.
- Number of RDA engagements with State, Territory, Local Government and regional communities that facilitate sustainable economic and social development.
- RDA plans are recognised and utilised by Commonwealth and State agencies in developing their regional priorities.
- myregion.gov.au website delivered on time and on budget and effectively engages with key stakeholders through a centralised regional specific portal.
- RDAF processes effectively engage key stakeholders, applications are assessed to ensure compliance with better practice framework, and funding rounds are delivered on time and within budget.
- The Minister and RDAF Advisory Panel are well informed by relevant and timely advice founded on robust analysis.
30

DRARDLG Budget Statements
- All CIGs are assessed to ensure compliance with the value for money framework.
• Northern Australia Sustainable Futures:
- Policies and administered items promote and support the sustainable development of northern Australia.
- Northern Australia ministerial forum established and effective.
• National Disaster Recovery Taskforce:
- Ministers (and through them the Government), Cabinet, the National Disaster Recovery Committee and the Inspectorate are well informed by relevant and timely advice founded on robust analysis.
- External evaluations and stakeholder assessments demonstrate that the Taskforce's role in coordinating contributions are supporting the recovery effort.
- Percentage and number of projects that are reviewed to conform with the approved value for money framework.
- Issues and risks in the delivery of Commonwealth effort are identified and addressed in a timely manner.
31

DRARDLG Budget Statements
Program 1.2: Local Government Program objective
The Local Government program contributes to Outcome 1 through a range of Local Government focused activities. These include:
• Local Government Reform Fund: funds projects designed to improve the asset and financial management capabilities of councils around Australia.
• Regional and Local Community Infrastructure: funds a range of construction projects including parks, gardens, town halls, community centres, sporting grounds, libraries and facilities upgrades.
• Supplementary funding to South Australian councils for local roads: supplementary funds for the construction and maintenance of local roads in South Australia to June 2014 in recognition of changes in the population and circumstances of the State.
• Administers the Local Government (Financial Assistance Act) 1995.
• Consults with Local Government stakeholders and State and Territory Governments on a process for constitutional recognition of Local Government.
• Builds capacity in Local Government through the ongoing operation of the Centre of Excellence for Local Government.
• Promotes best-practice Local Government service delivery through the National Awards for Local Government.
• Facilitates Commonwealth and Local Government engagement on matters of national significance.
32

DRARDLG Budget Statements
Program expenses 1.2 2010-11 2011-12 2012-13 2013-14 2014-15Revised Budget Forward Forward Forwardbudget year 1 year 2 year 3
$'000 $'000 $'000 $'000 $'000Annual administered expenses:
Local Government Reform Fund1 400 450 - - - Regional and Local Community
Infrastructure Program (Appropriation Bill No. 2) 216,594 40,000 - - -
Supplementary Funding to South Australian Councils for Local Roads
Appropriation Bill No. 1 100 50 Appropriation Bill No. 2 15,566 16,249 16,992 17,685 -
Thornton Park commuter car park - additional funding (Appropriation Bill No. 2) 3,810 - - - -
Special Appropriations:Local Government (Financial Assistance) Act 1995 2 2,082,222 1,609,717 2,242,227 2,333,263 2,427,529
Annual departmental expenses:Program support 4,116 6,233 5,948 5,643 5,702
Expenses not requiring appropriation inthe Budget year3 20 55 98 146 190
Total program expenses 2,322,728 1,672,804 2,265,315 2,356,737 2,433,421 1 Excludes expenses for payments made to and through the States and Territories by The Treasury. 2 Excludes $25.384m of accrued expenses incurred by the Department of Infrastructure and Transport
in 2009-10 paid from the special appropriation balance transferred to the department as a result of the AAO made on 14 September 2010.
3 Expenses not requiring appropriation in the Budget year is made up of depreciation expense, amortisation expense and audit fees.
Program 1.2 Deliverables
• Local Government objectives are supported through the effective and efficient delivery of administered items, including ensuring that projects that receive funding are delivered on time and on budget.
• Improved transparency and robust reporting mechanisms through detailed quantitative and qualitative assessment processes.
• Development and implementation of guidelines, assessment processes and management of the program to support the urban agenda and regional development policy.
33
DRARDLG Budget Statements
Program 1.2 Key performance indicators
• High level of satisfaction of the Minister and other stakeholders with the:
- quality and timeliness of advice, briefing and support.
- implementation and ongoing management of programs and projects.
- engagement mechanisms used to review matters of national significance.
• Enhanced engagement with State, Territory, Local Government and regional communities to facilitate sustainable economic and social development.
• Funded projects and activities improve employment and sustainability of local communities.
• Process for a referendum on constitutional recognition of Local Government agreed.
• Maintaining high levels of awareness and participation in the National Awards for Local Government as a tool for promoting innovation and best-practice service delivery.
34

DRARDLG Budget Statements
OUTCOME 2
Outcome 2: Good governance in the Australian Territories through the maintenance and improvement of the overarching legislative framework for self-governing territories, and laws and services for non self-governing territories.
Outcome 2 Strategy The department administers the Territories of the Ashmore and Cartier Islands, Christmas Island, the Cocos (Keeling) Islands, the Coral Sea Islands and Jervis Bay; and manages national interests in the Australian Capital Territory, the Northern Territory and Norfolk Island.
Through Outcome 2, the department assists these Territories to establish and maintain good governance and manage their own futures by providing services and advice on ongoing administration. The department delivers services, provides funding support and undertakes capital works with the objective of ensuring that Territory communities enjoy the same level of services as equivalent State communities.
The department will contribute to these objectives by:
• Providing policy advice and legislation to maintain effective systems of governance and the necessary legal framework for the protection and wellbeing of the community.
• Supporting the Commonwealth’s role in the Territories through the administration of inter-government agreements and various programs, maintaining Commonwealth assets and delivering State and Local Government-type services.
Following COAG’s federal financial framework reforms, the Treasury is responsible for National Partnership Payments to and through the States and Territories. The Treasury holds the appropriation for these items and reports the financial details accordingly. The non-financial performance of the corresponding programs remains the responsibility of the department. The Outcome 2 programs administered by DRARDLG under this framework are the Commonwealth’s contribution to the Centenary of Canberra.
35

DRARDLG Budget Statements
Outcome expense statement
Table 2.1 provides an overview of the total expenses for outcome 2, by program.
Table 2.1: Budgeted Expenses for Outcome 2 2010-11 2011-12
Estimated Estimatedactual expenses
expenses$'000 $'000
Program 2.1: Services to TerritoriesAdministered expenses
Ordinary annual services (Appropriation Bill No. 1) 96,771 96,312 Special Accounts 667 1,000
Departmental expensesDepartmental appropriation1 6,893 9,207
Expenses not requiring appropriation in the Budget year2 14,414 22,029
Total for Program 2.1 118,745 128,548
Outcome 2 Totals by appropriation typeAdministered Expenses
Ordinary annual services (Appropriation Bill No. 1) 96,771 96,312 Special Accounts 667 1,000
Departmental expensesDepartmental appropriation1 6,893 9,207
Expenses not requiring appropriation in the Budget year2 14,414 22,029
Total expenses for Outcome 2 118,745 128,548
2010-11 2011-12Average Staffing Level (number)3 70 73
Outcome 2: Good governance in the Australian Territories through the maintenance and improvement of the overarching legislative framework for self-governing territories, and laws and services for non self-governing territories
1 Departmental Appropriation combines ‘Ordinary annual services (Appropriation Bill No. 1)’ and ‘Revenue
from independent sources (s31)’. 2 Expenses not requiring appropriation in the Budget year is made up of depreciation expense,
amortisation expense and audit fees. 3 Excludes administered staff of an estimated 100 ASL. Note: Departmental appropriation splits and totals are indicative estimates and may change in the course of the budget year as government priorities change.
36
DRARDLG Budget Statements
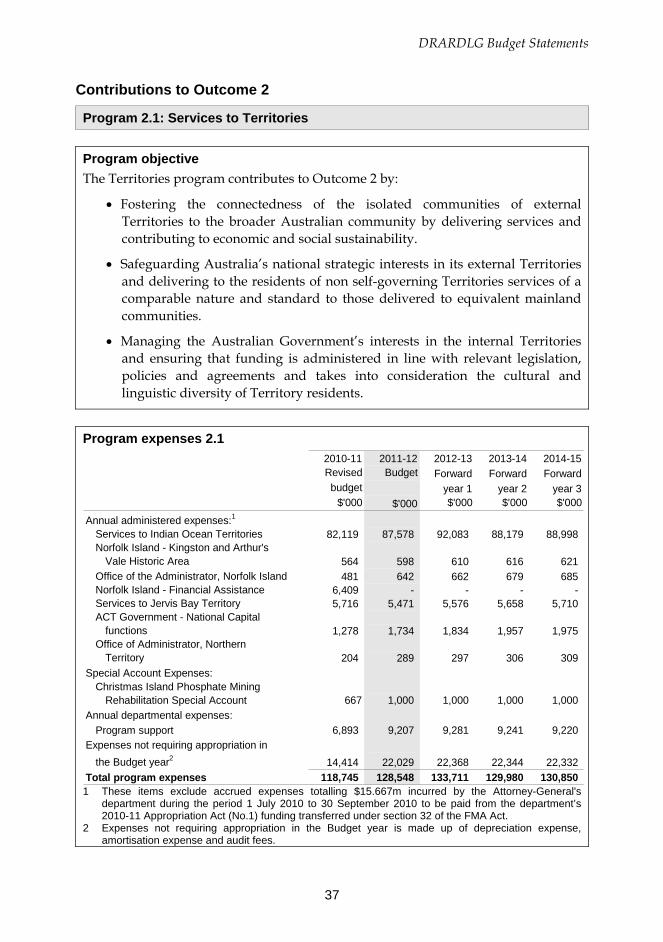
Contributions to Outcome 2
Program 2.1: Services to Territories Program objective The Territories program contributes to Outcome 2 by:
• Fostering the connectedness of the isolated communities of external Territories to the broader Australian community by delivering services and contributing to economic and social sustainability.
• Safeguarding Australia’s national strategic interests in its external Territories and delivering to the residents of non self-governing Territories services of a comparable nature and standard to those delivered to equivalent mainland communities.
• Managing the Australian Government’s interests in the internal Territories and ensuring that funding is administered in line with relevant legislation, policies and agreements and takes into consideration the cultural and linguistic diversity of Territory residents.
Program expenses 2.1
2010-11 2011-12 2012-13 2013-14 2014-15Revised Budget Forward Forward Forwardbudget year 1 year 2 year 3
$'000 $'000 $'000 $'000 $'000
Annual administered expenses:1
Services to Indian Ocean Territories 82,119 87,578 92,083 88,179 88,998 Norfolk Island - Kingston and Arthur's
Vale Historic Area 564 598 610 616 621 Office of the Administrator, Norfolk Island 481 642 662 679 685 Norfolk Island - Financial Assistance 6,409 - - - - Services to Jervis Bay Territory 5,716 5,471 5,576 5,658 5,710 ACT Government - National Capital
functions 1,278 1,734 1,834 1,957 1,975 Office of Administrator, Northern
Territory 204 289 297 306 309 Special Account Expenses:
Christmas Island Phosphate Mining Rehabilitation Special Account 667 1,000 1,000 1,000 1,000
Annual departmental expenses:Program support 6,893 9,207 9,281 9,241 9,220
Expenses not requiring appropriation inthe Budget year2 14,414 22,029 22,368 22,344 22,332
Total program expenses 118,745 128,548 133,711 129,980 130,850 1 These items exclude accrued expenses totalling $15.667m incurred by the Attorney-General's
department during the period 1 July 2010 to 30 September 2010 to be paid from the department’s 2010-11 Appropriation Act (No.1) funding transferred under section 32 of the FMA Act.
2 Expenses not requiring appropriation in the Budget year is made up of depreciation expense, amortisation expense and audit fees.
37

DRARDLG Budget Statements
Program 2.1 Deliverables • Community services, infrastructure and legal frameworks and processes in
the Territories are equivalent to comparable mainland communities.
• Social and economic links to the wider Australian community are strengthened.
• Australia’s interests in the Territories are well managed and protected.
• Reforms to promote long term financial sustainability and improved governance are progressed on Norfolk Island.
• Essential infrastructure in the Indian Ocean Territories is maintained and upgraded in line with the capital management plan.
Program 2.1 Key performance indicators
• Legislative and legal frameworks are in place in the Territories that provide the same rights and protections enjoyed by the rest of Australia.
• State-type services are delivered efficiently and effectively to residents of the non self-governing Territories.
• Essential infrastructure meets the needs of communities, border protection and other national strategic priorities.
• Grant funding is targeted, supported by the community and fully utilised.
• Inter-governmental agreements meet value-for-money criteria and deliver the required level of services to the Territories.
• The Territories Law Reform Act 2010 is implemented to provide a sustainable financial framework for Norfolk Island.
• Long term financial and governance reform for Norfolk Island is achieved through constructive partnerships with the Norfolk Island Government and the community.
• Sustainable economic, environmental and social policies are progressively implemented in the Indian Ocean Territories.
• The roles and responsibilities of the Commonwealth and the ACT Government in the National Capital are clarified.
38
DRARDLG Budget Statements
Section 3: Explanatory tables and budgeted financial statements
Section 3 presents explanatory tables and budgeted financial statements which provide a comprehensive snapshot of agency finances for the 2011–12 budget year. It explains how budget plans are incorporated into the financial statements and provides further details of the reconciliation between appropriations and program expenses, movements in administered funds, special accounts and government indigenous expenditure.
3.1 EXPLANATORY TABLES
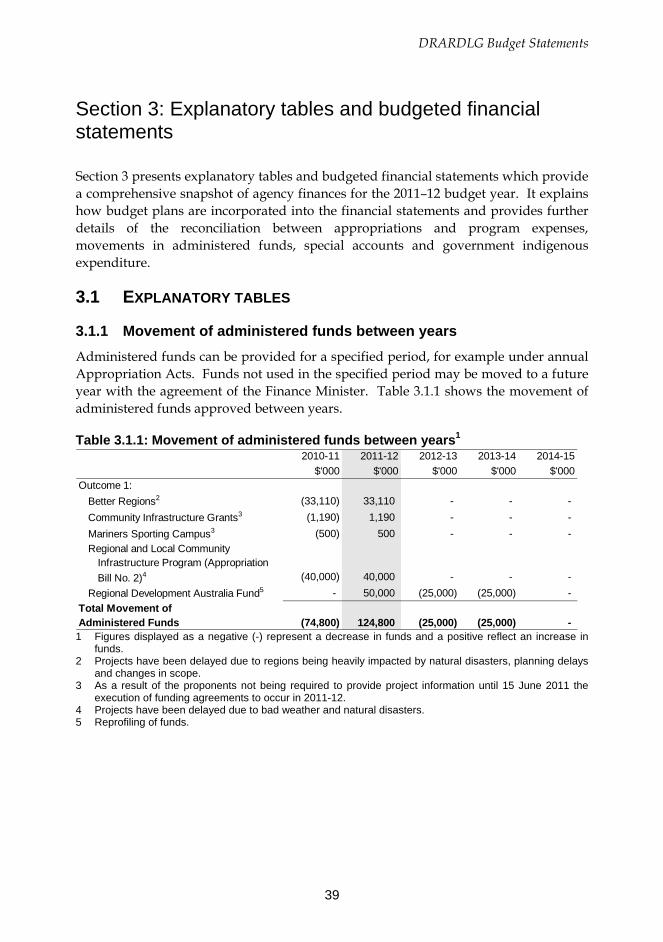
3.1.1 Movement of administered funds between years Administered funds can be provided for a specified period, for example under annual Appropriation Acts. Funds not used in the specified period may be moved to a future year with the agreement of the Finance Minister. Table 3.1.1 shows the movement of administered funds approved between years.
Table 3.1.1: Movement of administered funds between years1 2010-11 2011-12 2012-13 2013-14 2014-15
$'000 $'000 $'000 $'000 $'000Outcome 1:
Better Regions2 (33,110) 33,110 - - - Community Infrastructure Grants3 (1,190) 1,190 - - - Mariners Sporting Campus3 (500) 500 - - - Regional and Local Community
Infrastructure Program (Appropriation Bill No. 2)4 (40,000) 40,000 - - -
Regional Development Australia Fund5 - 50,000 (25,000) (25,000) - Total Movement ofAdministered Funds (74,800) 124,800 (25,000) (25,000) - 1 Figures displayed as a negative (-) represent a decrease in funds and a positive reflect an increase in
funds. 2 Projects have been delayed due to regions being heavily impacted by natural disasters, planning delays
and changes in scope. 3 As a result of the proponents not being required to provide project information until 15 June 2011 the
execution of funding agreements to occur in 2011-12. 4 Projects have been delayed due to bad weather and natural disasters. 5 Reprofiling of funds.
39
DRARDLG Budget Statements
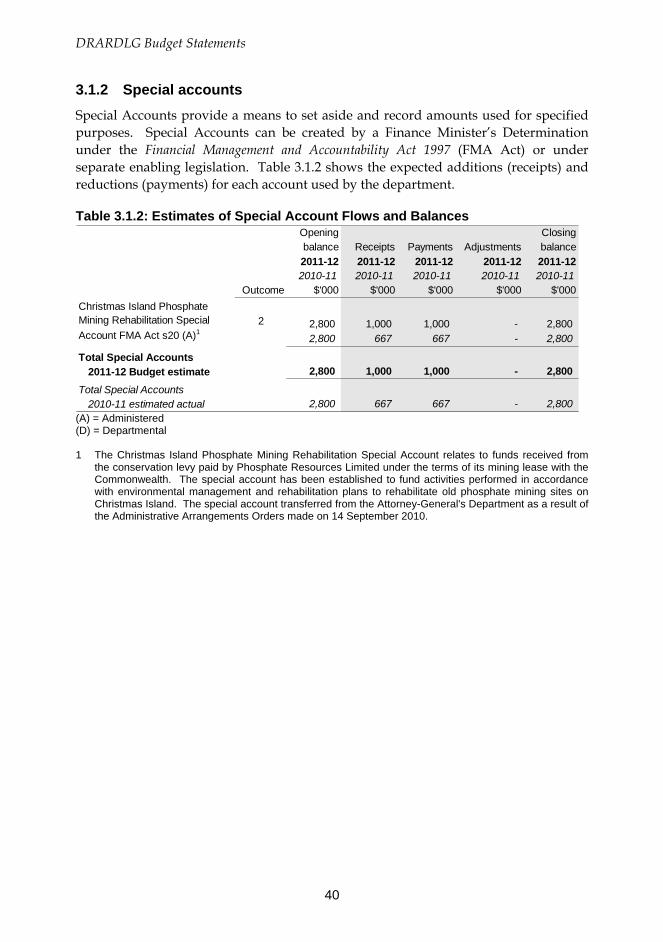
3.1.2 Special accounts Special Accounts provide a means to set aside and record amounts used for specified purposes. Special Accounts can be created by a Finance Minister’s Determination under the Financial Management and Accountability Act 1997 (FMA Act) or under separate enabling legislation. Table 3.1.2 shows the expected additions (receipts) and reductions (payments) for each account used by the department.
Table 3.1.2: Estimates of Special Account Flows and Balances Opening Closingbalance Receipts Payments Adjustments balance2011-12 2011-12 2011-12 2011-12 2011-122010-11 2010-11 2010-11 2010-11 2010-11
Outcome $'000 $'000 $'000 $'000 $'000
2,800 1,000 1,000 - 2,800 2,800 667 667 - 2,800
Total Special Accounts 2011-12 Budget estimate 2,800 1,000 1,000 - 2,800
Total Special Accounts2010-11 estimated actual 2,800 667 667 - 2,800
Christmas Island Phosphate Mining Rehabilitation Special Account FMA Act s20 (A)1
2
(A) = Administered (D) = Departmental 1 The Christmas Island Phosphate Mining Rehabilitation Special Account relates to funds received from
the conservation levy paid by Phosphate Resources Limited under the terms of its mining lease with the Commonwealth. The special account has been established to fund activities performed in accordance with environmental management and rehabilitation plans to rehabilitate old phosphate mining sites on Christmas Island. The special account transferred from the Attorney-General's Department as a result of the Administrative Arrangements Orders made on 14 September 2010.
40

DRARDLG Budget Statements
3.1.3 Australian Government Indigenous expenditure Table 3.1.3: Australian Government Indigenous Expenditure
Other Total ProgramBill Bill Special Total
No. 1 No. 2 approp approp$'000 $'000 $'000 $'000 $'000 $'000
Outcome 1Administered 2011-12 750 - - 750 - 750 1.1Administered 2010-11 235 - - 235 - 235 1.1Total outcome 2011-12 750 - - 750 - 750 Total outcome 2010-11 235 - - 235 - 235
Outcome 2Administered 2011-12 - - - - - - Administered 2010-11 248 - - 248 - 248 2.1Total outcome 2011-12 - - - - - - Total outcome 2010-11 248 - - 248 - 248
Total administered 2011-12 750 - - 750 - 750 Total administered 2010-11 483 - - 483 - 483
Total AGIE 2011-12 750 - - 750 - 750 Total AGIE 2010-11 483 - - 483 - 483
Appropriations
41

DRARDLG Budget Statements
3.2 BUDGETED FINANCIAL STATEMENTS
3.2.1 Differences in agency resourcing and financial statements The agency resource statement (Table 1.1) provides a consolidated view of all the resources available to the agency in 2011–12. For departmental items this includes appropriation receivable that is yet to be drawn down to cover payables and provisions on the balance sheet and the Departmental Capital Budget. The income statement (Table 3.2.1) shows only the operating appropriation provided in 2011-12.
3.2.2 Analysis of budgeted financial statements Departmental
Budgeted income statement
DRARDLG is budgeting for a break-even operating result, adjusted for depreciation and amortisation expense, in 2011–12 and the forward years.
The department was established by a machinery of government change on 14 September 2010. Functions from the former Department of Infrastructure, Transport, Regional Development and Local Government and the Attorney-General’s Department were transferred to the department and appropriations were amended effective 1 October 2010. The 2010-11 estimates represent nine months of operations.
Additional departmental funding has been provided to the department in 2011–12 as summarised in Table 1.2. This includes funding for the National Disaster Recovery Taskforce of $6.9 million (terminating in 2012-13) and one-off funding for specific projects such as the development of myregion.gov.au website, progressing a referendum on constitutional recognition of Local Government, establishing and supporting a Regional Development Policy Centre and promoting regional living.
Budgeted balance sheet
As a result of net cash appropriation arrangements and asset replacements being funded through capital injections, budgeted operating deficits from depreciation and amortisation expenses erode accumulated results in the forward years.
Administered
Schedule of budgeted income and expenses administered on behalf of Government
Revenue from administered activities is estimated at $24.3 million in 2011-12. This includes interest on State Government loans, mining lease royalties and municipal and facilities charges associated with the Commonwealth’s role in the Territories, all of which is returned directly to the Official Public Account.
Additional administered funding has been provided as summarised in Table 1.2. This includes funding for strengthening RDAs, extending supplementary funding for South
42

DRARDLG Budget Statements
Australian local roads, infrastructure initiatives and a competitive grants program to promote the benefits and opportunities of living and working in regional cities.
On 27 January 2011 the Prime Minister announced the Government’s response to the challenge of rebuilding flood–affected regions across Australia. This included the reallocation of $350 million over four years (including $50 million in 2011-12) from the Priority Regional Infrastructure Program (now a part of the RDAF) as a contribution to the flood loss.
In 2011-12 it is estimated that a total of $2.0 billion of expense will be administered on behalf of government. Of this, $1.6 billion (81%) represents a special appropriation under the Local Government (Financial Assistance) Act 1995. Other grants expense relates to the RDAF, the CIG, Better Regions, RLCIP and grants to the Indian Ocean Territories (IOT). Other expenses primarily relate to services to the IOT and Jervis Bay Territory (JBT).
Schedule of budgeted assets and liabilities on behalf of the Government
As at 30 June 2012 total administered assets are estimated at $811.7 million. Financial assets comprise primarily sewerage agreements with the New South Wales and Queensland Governments pursuant to the Urban and Regional Development (Financial Assistance) Act 1974. Non-financial assets represent the Commonwealth’s interest in the IOT and JBT. Additional funding has been provided in the 2011-12 Budget to upgrade essential infrastructure on Christmas Island.
43

DRARDLG Budget Statements
3.2.3 Budgeted financial statements tables Table 3.2.1: Budgeted departmental comprehensive income statement (for the period ended 30 June)
Estimated Budget Forward Forward Forwardactual estimate estimate estimate estimate
2010-11 2011-12 2012-13 2013-14 2014-15$'000 $'000 $'000 $'000 $'000
EXPENSESEmployee benefits 26,434 45,965 41,375 39,027 39,486 Supplier expenses 11,792 21,635 11,957 9,073 8,229 Depreciation and amortisation 137 355 582 848 1,109 Total expenses 38,363 67,955 53,914 48,948 48,824
LESS: OWN-SOURCE INCOMEOwn-source revenueSale of goods and rendering of services 45 60 60 60 60 Total own-source revenue 45 60 60 60 60
GainsOther 100 400 400 400 400 Total gains 100 400 400 400 400 Total own-source income 145 460 460 460 460
Net cost of (contribution by)services 38,218 67,495 53,454 48,488 48,364
Revenue from Government 38,081 67,140 52,872 47,640 47,255
Surplus (deficit) (137) (355) (582) (848) (1,109) Surplus (deficit) attributable to
the Australian Government (137) (355) (582) (848) (1,109)
Note: Reconciliation of comprehensive income attributable to the agency2010-11 2011-12 2012-13 2013-14 2014-15
$'000 $'000 $'000 $'000 $'000Operating result attributable to the
Australian Government (137) (355) (582) (848) (1,109) plus non-appropriated expenses
depreciation and amortisation expenses 137 355 582 848 1,109
Total comprehensive income (loss) attributable to the agency - - - - -
Prepared on Australian Accounting Standards basis.
44

DRARDLG Budget Statements
Table 3.2.2: Budgeted departmental balance sheet (as at 30 June)
Estimated Budget Forward Forward Forwardactual estimate estimate estimate estimate
2010-11 2011-12 2012-13 2013-14 2014-15$'000 $'000 $'000 $'000 $'000
ASSETSFinancial assets
Cash and cash equivalents 50 50 50 50 50 Trade and other receivables 10,285 11,736 10,854 10,365 10,513 Other 248 248 248 248 248
Total financial assets 10,583 12,034 11,152 10,663 10,811
Non-financial assetsProperty, plant and equipment 81 38 187 132 89 Intangibles 936 1,659 2,171 3,050 3,013 Other 6 6 6 6 6
Total non-financial assets 1,023 1,703 2,364 3,188 3,108
Total assets 11,606 13,737 13,516 13,851 13,919
LIABILITIESPayables
Suppliers 80 80 80 80 80 Other 978 978 978 978 978
Total payables 1,058 1,058 1,058 1,058 1,058
ProvisionsEmployee provisions 7,881 9,332 8,450 7,961 8,109
Total provisions 7,881 9,332 8,450 7,961 8,109
Total liabilities 8,939 10,390 9,508 9,019 9,167
Net assets 2,667 3,347 4,008 4,832 4,752
EQUITYContributed equity 1,040 2,075 3,318 4,990 6,019 Retained earnings 1,627 1,272 690 (158) (1,267)
Total non-controlling interest 2,667 3,347 4,008 4,832 4,752 Total equity 2,667 3,347 4,008 4,832 4,752
Prepared on Australian Accounting Standards basis.
45

DRARDLG Budget Statements
Table 3.2.3: Budgeted departmental statement of changes in equity — summary of movement (Budget year 2011-12)
Retained Asset Other Contributed Totalearnings revaluation reserves equity/ equity
reserve capital$'000 $'000 $'000 $'000 $'000
Opening balance as at 1 July 2011Balance carried forward from
previous period 1,627 - - 1,040 2,667 Adjustment for changes in
accounting policies - - - - - Adjusted opening balance 1,627 - - 1,040 2,667
Comprehensive incomeSurplus (deficit) for the period (355) - - - (355)
Total comprehensive income (355) - - - (355)
Transactions with ownersContributions by owners
Appropriation (departmental)capital budget - - - 1,035 1,035
Sub-total transactions with owners - - - 1,035 1,035
Estimated closing balanceas at 30 June 2012 1,272 - - 2,075 3,347
Prepared on Australian Accounting Standards basis.
46

DRARDLG Budget Statements
Table 3.2.4: Budgeted departmental statement of cash flows (for the period ended 30 June)
Estimated Budget Forward Forward Forwardactual estimate estimate estimate estimate
2010-11 2011-12 2012-13 2013-14 2014-15$'000 $'000 $'000 $'000 $'000
OPERATING ACTIVITIESCash received
Goods and services 49 65 65 65 65 Appropriations 34,348 70,873 52,872 47,640 47,255 Net GST received 1,048 1,906 1,035 776 700 Cash from the OPA 2,557 - 882 489 -
Total cash received 38,002 72,844 54,854 48,970 48,020
Cash usedEmployees 25,258 44,514 42,257 39,516 39,338 Suppliers 12,744 23,146 12,597 9,454 8,534 Cash to the OPA - 5,184 - - 148
Total cash used 38,002 72,844 54,854 48,970 48,020 Net cash from (used by)
operating activities - - - - -
INVESTING ACTIVITIESCash used
Purchase of property, plant and equipment 1,040 1,035 1,243 1,672 1,029
Total cash used 1,040 1,035 1,243 1,672 1,029 Net cash from (used by)
investing activities (1,040) (1,035) (1,243) (1,672) (1,029)
FINANCING ACTIVITIESCash received
Contributed equity 1,040 1,035 1,243 1,672 1,029 Other 50 - - - -
Total cash received 1,090 1,035 1,243 1,672 1,029
Net cash from (used by) financing activities 1,090 1,035 1,243 1,672 1,029
Net increase (decrease)in cash held 50 - - - - Cash and cash equivalents at the
beginning of the reporting period - 50 50 50 50 Cash and cash equivalents at the
end of the reporting period 50 50 50 50 50 Prepared on Australian Accounting Standards basis.
47

DRARDLG Budget Statements
Table 3.2.5: Departmental Capital Budget Statement Estimated Budget Forward Forward Forward
actual estimate estimate estimate estimate2010-11 2011-12 2012-13 2013-14 2014-15
$'000 $'000 $'000 $'000 $'000CAPITAL APPROPRIATIONS
Capital budget - Bill 1 (DCB) 1,040 1,035 1,243 1,672 1,029 Total capital appropriations 1,040 1,035 1,243 1,672 1,029 Total new capital appropriationsRepresented by:
Purchase of non-financial assets 1,040 1,035 1,243 1,672 1,029 Total Items 1,040 1,035 1,243 1,672 1,029 PURCHASE OF NON-FINANCIAL
ASSETS
Funded by capital appropriation - DCB 1,040 1,035 1,243 1,672 1,029 TOTAL 1,040 1,035 1,243 1,672 1,029
RECONCILIATION OF CASHUSED TO ACQUIRE ASSETSTO ASSET MOVEMENT TABLE
Total purchases 1,040 1,035 1,243 1,672 1,029 Total cash used to
acquire assets 1,040 1,035 1,243 1,672 1,029 Prepared on Australian Accounting Standards basis.
48

DRARDLG Budget Statements
Table 3.2.6: Budgeted departmental statement of asset movements (2011-12) Other property, Intangibles Total
plant andequipment
$'000 $'000 $'000As at 1 July 2011Gross book value 129 1,040 1,169 Accumulated depreciation/amortisation
and impairment 48 104 152 Opening net book balance 81 936 1,017 CAPITAL ASSET ADDITIONSEstimated expenditure on
new or replacement assetsBy purchase - appropriation ordinary
annual services - 1,035 1,035 Total additions - 1,035 1,035 Other movementsDepreciation/amortisation expense 43 312 355 As at 30 June 2012Gross book value 129 2,075 2,204 Accumulated depreciation/amortisation
and impairment 91 416 507 Closing net book balance 38 1,659 1,697 Prepared on Australian Accounting Standards basis.
49

DRARDLG Budget Statements
Table 3.2.7: Schedule of budgeted income and expenses administered on behalf of Government (for the period ended 30 June)
Estimated Budget Forward Forward Forwardactual estimate estimate estimate estimate
2010-11 2011-12 2012-13 2013-14 2014-15$'000 $'000 $'000 $'000 $'000
INCOME ADMINISTERED ONBEHALF OF GOVERNMENT
RevenueTaxation revenue
Other 1,340 1,840 1,840 1,840 1,840 Total taxation revenue 1,340 1,840 1,840 1,840 1,840
Non-taxation revenueSale of goods and rendering
of services 10,229 14,717 14,717 14,717 14,717 Interest 6,038 6,781 6,015 5,175 4,387 Royalties 667 1,000 1,000 1,000 1,000
Total non-taxation revenue 16,934 22,498 21,732 20,892 20,104 Total revenues administered
on behalf of Government 18,274 24,338 23,572 22,732 21,944
Total income administeredon behalf of Government 18,274 24,338 23,572 22,732 21,944
EXPENSES ADMINISTERED ONBEHALF OF GOVERNMENTEmployee benefits 8,613 11,702 11,960 12,199 12,468 Supplier expenses 80,421 77,581 81,858 77,539 78,107 Grants 2,436,170 1,876,726 2,444,232 2,574,697 2,516,296 Depreciation and amortisation 14,331 21,786 22,106 22,089 22,089
Total expenses administeredon behalf of Government 2,539,535 1,987,795 2,560,156 2,686,524 2,628,960
Prepared on Australian Accounting Standards basis.
50

DRARDLG Budget Statements
Table 3.2.8: Schedule of budgeted assets and liabilities administered on behalf of Government (as at 30 June)
Estimated Budget Forward Forward Forwardactual estimate estimate estimate estimate
2010-11 2011-12 2012-13 2013-14 2014-15$'000 $'000 $'000 $'000 $'000
ASSETS ADMINISTERED ON BEHALF OF GOVERNMENT
Financial assetsCash and cash equivalents 31 31 31 31 31 Receivables 116,895 110,119 102,556 94,261 85,431 Other 895 895 895 895 895
Total financial assets 117,821 111,045 103,482 95,187 86,357
Non-financial assetsLand and buildings 232,935 242,682 253,554 253,551 257,441 Property, plant and equipment 368,396 387,189 397,445 392,633 378,690 Intangibles 2,981 2,928 2,884 2,739 2,634 Hertitage and cultural assets 66,144 65,987 65,830 65,673 65,804 Inventories 1,908 1,908 1,908 1,908 1,908
Total non-financial assets 672,364 700,694 721,621 716,504 706,477
Total assets administered on behalf of Government 790,185 811,739 825,103 811,691 792,834
LIABILITIES ADMINISTERED ON BEHALF OF GOVERNMENT
PayablesSuppliers 30 30 30 30 30
Total payables 30 30 30 30 30
ProvisionsEmployee provisions 1,906 1,906 1,906 1,906 1,906 Other 2,983 2,983 2,983 2,983 2,983
Total provisions 4,889 4,889 4,889 4,889 4,889
Total liabilities administeredon behalf of Government 4,919 4,919 4,919 4,919 4,919
Prepared on Australian Accounting Standards basis.
51

DRARDLG Budget Statements
Table 3.2.9: Schedule of budgeted administered cash flows (for the period ended 30 June)
Estimated Budget Forward Forward Forwardactual estimate estimate estimate estimate
2010-11 2011-12 2012-13 2013-14 2014-15$'000 $'000 $'000 $'000 $'000
OPERATING ACTIVITIESCash received
Sales of goods and rendering of services 11,150 16,042 16,042 16,042 16,042
Interest 5,220 6,781 6,015 5,175 4,387 Taxes 1,340 1,840 1,840 1,840 1,840 Net GST received 8,303 5,657 6,042 5,654 5,705 Royalties 667 1,000 1,000 1,000 1,000
Total cash received 26,680 31,320 30,939 29,711 28,974
Cash usedGrant payments 2,465,153 1,876,726 2,444,232 2,574,697 2,516,296 Suppliers 111,716 84,563 89,225 84,518 85,137 Employees 8,613 11,702 11,960 12,199 12,468
Total cash used 2,585,482 1,972,991 2,545,417 2,671,414 2,613,901 Net cash from (used by)
operating activities (2,558,802) (1,941,671) (2,514,478) (2,641,703) (2,584,927)
INVESTING ACTIVITIESCash received
Other 5,653 6,776 7,563 8,295 8,830 Total cash received 5,653 6,776 7,563 8,295 8,830
Cash usedPurchase of property, plant
and equipment 18,542 50,116 43,033 16,972 12,062 Total cash used 18,542 50,116 43,033 16,972 12,062 Net cash from (used by)
investing activities (12,889) (43,340) (35,470) (8,677) (3,232)
FINANCING ACTIVITIESCash received
Other 31 - - - - Total cash received 31 - - - - Net cash from (used by)
financing activities 31 - - - - Net increase (decrease) in
cash held (2,571,660) (1,985,011) (2,549,948) (2,650,380) (2,588,159) Cash and cash equivalents at
beginning of reporting period - 31 31 31 31 Cash from OPA for:
- Appropriations 2,594,133 2,015,125 2,580,083 2,680,407 2,617,933 - Special Accounts 667 1,000 1,000 1,000 1,000
2,594,800 2,016,156 2,581,114 2,681,438 2,618,964 Cash to OPA for:
- Appropriations (22,442) (30,114) (30,135) (30,027) (29,774) - Special Accounts (667) (1,000) (1,000) (1,000) (1,000)
(23,109) (31,114) (31,135) (31,027) (30,774) Cash and cash equivalents
at end of reporting period 31 31 31 31 31 Prepared on Australian Accounting Standards basis.
52

DRARDLG Budget Statements
Table 3.2.10: Schedule of administered capital budget Estimated Budget Forward Forward Forward
actual estimate estimate estimate estimate2010-11 2011-12 2012-13 2013-14 2014-15
$'000 $'000 $'000 $'000 $'000CAPITAL APPROPRIATIONS
Capital budget - Bill 1 (ACB) 5,062 10,805 8,835 7,872 12,062 Administered assets and
liabilities - Bill 2 11,209 33,982 34,198 9,100 - Total capital appropriations 16,271 44,787 43,033 16,972 12,062 Total new capital appropriationsRepresented by:
Purchase of non-financial assets 16,271 44,787 43,033 16,972 12,062 Total Items 16,271 44,787 43,033 16,972 12,062 PURCHASE OF NON-FINANCIAL
ASSETSFunded by capital appropriations 5,880 39,311 34,198 9,100 - Funded by capital appropriation - ACB 5,062 10,805 8,835 7,872 12,062 Funded internally from reserves 7,600 - - - -
TOTAL 18,542 50,116 43,033 16,972 12,062
RECONCILIATION OF CASHUSED TO ACQUIRE ASSETSTO ASSET MOVEMENT TABLE
Total purchases 18,542 50,116 43,033 16,972 12,062 Total cash used to
acquire assets 18,542 50,116 43,033 16,972 12,062 Prepared on Australian Accounting Standards basis. Note: $5.3 million of capital expenditure funded from Bill 2 Appropriation has been rephased from 2010-11 to 2011-12 for the Christmas Island Housing Project.
53

DRARDLG Budget Statements
54
Table 3.2.11: Schedule of budgeted asset movements administered on behalf of Government (2011-12)
Land Buildings Other Heritage Intangibles Totalproperty, and culturalplant and assets
equipment$'000 $'000 $'000 $'000 $'000 $'000
As at 1 July 2011Gross book value 82,241 156,036 383,380 66,736 3,208 691,601 Accumulated depreciation/
amortisation and impairment - 5,342 14,984 592 227 21,145 Opening net book balance 82,241 150,694 368,396 66,144 2,981 670,456
CAPITAL ASSET ADDITIONSEstimated expenditure on
new or replacement assetsBy purchase - appropriation equity - 13,329 25,982 - - 39,311 By purchase - appropriation
ordinary annual services - 1,823 8,323 559 100 10,805 Total additions - 15,152 34,305 559 100 50,116
Other movementsDepreciation/amortisation expense - 5,405 15,512 716 153 21,786
As at 30 June 2012Gross book value 82,241 171,188 417,685 67,295 3,308 741,717 Accumulated depreciation/
amortisation and impairment - 10,747 30,496 1,308 380 42,931 Closing net book balance 82,241 160,441 387,189 65,987 2,928 698,786 Prepared on Australian Accounting Standards basis.