DEPARTMENT OF PUBLIC SOCIAL SERVICES - …ican.co.la.ca.us/data/dpss/12_DPSS/239-262DPSS_ICAN...
24
Page 239 DEPARTMENT OF PUBLIC SOCIAL SERVICES The Department of Public Social Services (DPSS) has an operating budget of $3.53 billion and 13,543 employees for Fiscal Year (FY) 2011-2012. The primary responsibilities of DPSS, as mandated by public law, are: To promote self-sufficiency and personal responsibility To provide financial assistance to low-income residents of Los Angeles County To provide protective and social services to adults who are abused, neglected, exploited, or need services to prevent out-of-home care, and To refer a child to protective services whenever it is suspected that the child is being abused, neglected or exploited, or the home in which the child is living is unsuitable AGENCY REPORT 2012
-
Upload
nguyendiep -
Category
Documents
-
view
213 -
download
0
Transcript of DEPARTMENT OF PUBLIC SOCIAL SERVICES - …ican.co.la.ca.us/data/dpss/12_DPSS/239-262DPSS_ICAN...

Page 239
DEPARTMENT OF PUBLIC SOCIAL SERVICES
The Department of Public Social Services (DPSS) has an operating budget of $3.53 billion and 13,543 employees for Fiscal Year (FY) 2011-2012. The primary responsibilities of DPSS, as mandated by public law, are:
To promote self-sufficiency and personal responsibility
To provide financial assistance to low-income residents of Los Angeles County
To provide protective and social services to adults who are abused, neglected,
exploited, or need services to prevent out-of-home care, and
To refer a child to protective services whenever it is suspected that the child is being
abused, neglected or exploited, or the home in which the child is living is unsuitable
AGENCY REPORT 2012

DEPARTMENT OF PUBLIC SOCIAL SERVICES
Page 240
DPSS MISSION
The mission of DPSS has changed dramatically. The focus of its programs has shifted from ongoing income maintenance to temporary assistance coupled with expanded services designed to help individuals and families achieve economic independence.
In 2004, DPSS adopted the following "DPSS Mission and Philosophy:" To enrich lives through effective and caring service.
DPSS PHILOSOPHY
DPSS believes that it can help those it serves to enhance the quality of their lives, provide for themselves and their families, and make positive contributions to the community.
DPSS believes that to fulfill its mission, services must be provided in an environment that supports its staff's professional development and promotes shared leadership, teamwork, and individual responsibility.
DPSS believes that as it moves towards the future, it can serve as a catalyst for commitment and action within the community, resulting in expanded resources, innovative programs and services, and new public and private sector partnership.
DPSS PROGRAMS
The State and Federal assistance programs that DPSS administers include California Work Opportunity and Responsibility to Kids (CalWORKs), Refugee Resettlement Program (RRP), CalFresh, and Medi-Cal Assistance Programs. DPSS also administers the General Relief (GR) program for the County's indigent adult population and Cash Assistance Program for Immigrants (CAPI). The goal of these programs is to
provide the basic essentials of food, clothing, shelter, and medical care to eligible families and individuals. In 2011, DPSS provided public assistance to a monthly average of 2.4 million individuals, including In-Home Supportive Services (IHSS).
As a result of Welfare Reform, the California Work Opportunity and Responsibility to Kids (CalWORKs) program replaced the Aid to Families With Dependent Children (AFDC) program effective January 1, 1998. The CalWORKs program is designed to transition participants from welfare to work. To achieve the goal of Welfare Reform, DPSS has developed programs which help participants achieve self-sufficiency in a time-limited welfare environment. DPSS’ Welfare-to-Work Programs currently provide the following services:
Child Care Transportation Post-Employment Services Treatment programs for Substance
Abuse, Domestic Violence, and Mental Health
Ancillary Expenses
AIDED CASELOAD
As shown in the Persons Aided chart (Figure 2), using December 2010 and December 2011 as points in time for comparison, the number of CalWORKs aided individuals decreased by 1.03% (4,530 individuals less). The number of Medi-Cal Assistance Only aided individuals increased from 1,677,283 in December 2010 to 1,695,805 in December 2011. This represents a 1.09% increase (18,522 individuals).

DEPARTMENT OF PUBLIC SOCIAL SERVICES
Page 241
In total, there was a 1.67% increase (39,946) in the number of individuals receiving assistance for all programs combined from December 2010 to December 2011.
The following represents caseload changes in programs where children are most likely to receive aid:
CALWORKS
The number of participants receiving assistance through the CalWORKs program slowly declined from December 2002 through December 2007 (Figure 6). Although recent economic turmoil and a high level of unemployment rate had caused an increase in the number of people receiving CalWORKs since 2008, there was a slight decrease from 2010 to 2011. In December 2011, 438,715 individuals received cash assistance from CalWORKs. This represents a 1.02% decrease (-4,530 individuals) from 443,245 individuals aided in December 2010 (Figure 2).
CALFRESH
The CalFresh Program has seen a steady increase in the number of participants since 2007. In December 2010, there were 978,920 individuals being aided. By December 2011, that number had risen to 1,064,647 individuals, which represent an increase of 8.05% (85,727 individuals), (Figure 2). Overall, since 2007, the CalFresh Program has seen an increase of 66.3% in the number of individuals receiving benefits.
MEDI-CAL ASSISTANCE ONLY (MAO)
In 2010, there were 1,677,283 individuals receiving Medi-Cal benefits. By December 2011, the number of individuals enrolled in Medi-Cal had increased to
1,695,805. This represents a 1.09% increase (18,522) in individuals served (Figure 2).
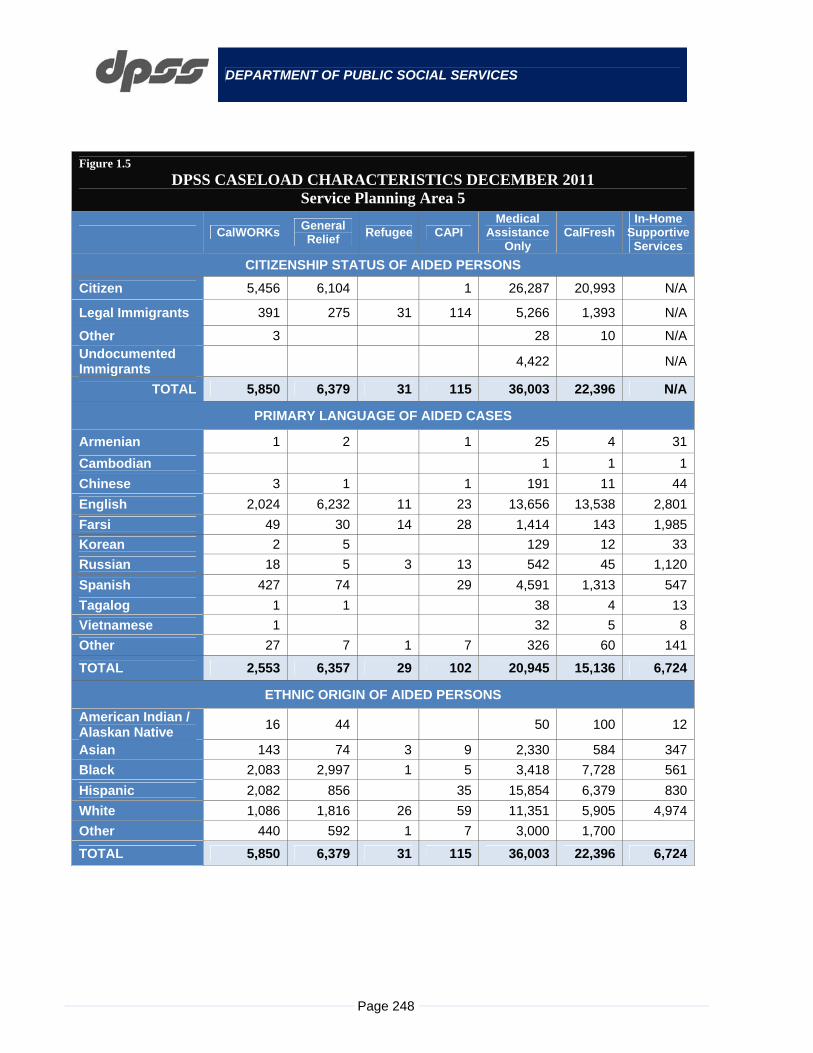
CASELOAD CHARACTERISTICS BY SERVICE PLANNING AREAS (SPA) – CITIZENSHIP STATUS, PRIMARY LANGUAGE, AND ETHNIC ORIGIN.
Figures 1 through 1.9 display the total number of individuals aided by citizenship status and ethnic origin, and the total number of cases aided by primary language for all programs by SPA.
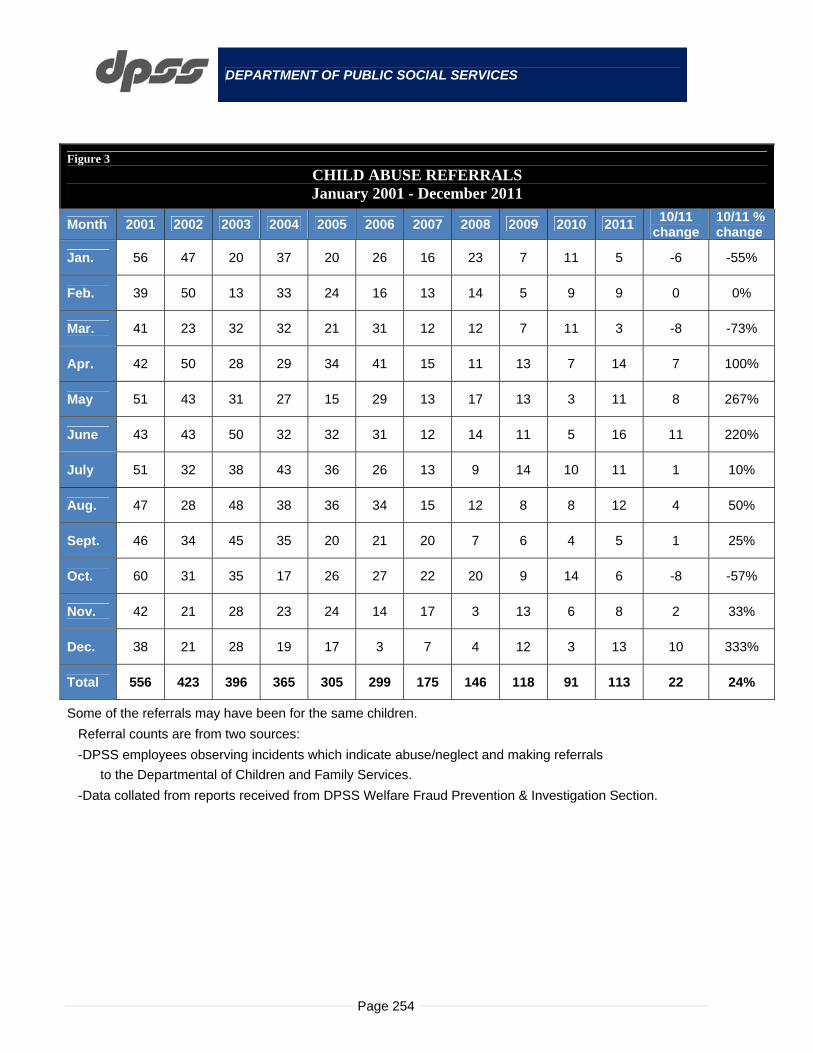
CHILD ABUSE PREVENTION, CHILD ABUSE REFERRALS, AND STAFF TRAINING
A major focus of DPSS is to ensure that all of its employees are active participants in child abuse prevention. In 1987, the DPSS Training Academy implemented a comprehensive Child Abuse Prevention training program. The primary purpose of this training is to inform DPSS public contact employees about the seriousness of the child abuse problem in Los Angeles County and the employees' mandated reporting responsibilities.
Since its inception, the Child Abuse Prevention training program has been delivered to DPSS public contact staff, including Social Workers, GAIN Services Workers, Eligibility Workers, clerical staff, and managers. To ensure that all DPSS public contact staff receive the training, the program is incorporated into the orientation course given to all new hires.
During the training session, the trainees are informed of the types of child abuse, indicators of such abuse, provisions of the reporting law, and DPSS employees' reporting responsibilities and procedures. The trainees also review and discuss

DEPARTMENT OF PUBLIC SOCIAL SERVICES
Page 242
handouts given to them related to the indicators of child abuse.
Program materials and other trainings emphasize to staff that one of the child abuse/neglect indicators is violence between household members, which often endangers the child. The Los Angeles County Domestic Violence Council provides Domestic Violence training to all of DPSS public contact staff.
In 2011, DPSS made a total of 114 child abuse referrals to the Department of Children and Family Services. This represented a 25% increase from the 91 referrals made in 2010 (Figure 3).
CAL-LEARN PROGRAM
In 2011, DPSS served a monthly average of 2,414 Cal-Learn participants. This represents a 21% decrease from a monthly average of 3,068 participants served during Calendar Year 2010 (Figure 4).

DEPARTMENT OF PUBLIC SOCIAL SERVICES
Page 243
Figure 1
DPSS CASELOAD CHARACTERISTICS DECEMBER 2011 Los Angeles County Totals
CalWORKs General Relief
Refugee CAPI Medical
Assistance Only
CalFresh In-Home
Supportive Services
CITIZENSHIP STATUS OF AIDED PERSONS
Citizen 418,756 98,336 12 1,178,993 978,952 N/A
Legal Immigrants 19,562 8,282 551 5,115 192,561 85,063 N/A
Other 323 24 18 14 1,397 596 N/A
Undocumented Immigrants
74 5 2 2 322,854 36 N/A
TOTAL 438,715 106,647 571 5,143 1,695,805 1,064,647 N/A
PRIMARY LANGUAGE OF AIDED CASES
Armenian 3,142 1,570 218 1,142 19,827 8,307 30,663
Cambodian 585 37 0 21 2,393 1,107 2,199
Chinese 445 115 33 146 23,287 3,150 14,196
English 110,433 98,056 69 318 332,567 315,766 69,628
Farsi 261 117 79 101 3,839 865 5,762
Korean 154 143 3 166 11,101 987 4,667
Russian 252 92 25 179 4,243 659 7,368
Spanish 63,138 5,511 42 2,293 306,045 160,517 36,742
Tagalog 38 43 1 89 5,282 446 4,413
Vietnamese 483 182 0 32 9,118 2,556 3,584
Other 338 88 20 104 4,758 949 2,959
TOTAL 179,269 105,954 490 4,591 722,460 495,309 182,181
ETHNIC ORIGIN OF AIDED PERSONS
American Indian / Alaskan Native
435 494 0 0 1,333 1,678 401
Asian 11,959 2,412 71 638 144,560 42,529 35,070
Black 88,620 45,382 20 63 121,017 200,881 32,410
Hispanic 290,041 33,416 44 2,574 1,213,761 681,920 51,064
White 34,796 17,222 419 1,723 154,161 100,923 63,236
Other 12,864 7,721 17 145 60,973 36,716 0
TOTAL 438,715 106,647 571 5,143 1,695,805 1,064,647 182,181

DEPARTMENT OF PUBLIC SOCIAL SERVICES
Page 244
Figure 1.1
DPSS CASELOAD CHARACTERISTICS DECEMBER 2011 Service Planning Area 1
CalWORKs General Relief
Refugee CAPI Medical
AssistanceOnly
CalFresh In-Home
Supportive Services
CITIZENSHIP STATUS OF AIDED PERSONS
Citizen 30,022 2,508 55,253 56,711 N/A
Legal Immigrants 603 104 69 5,124 2,430 N/A
Other 8 1 34 17 N/AUndocumented Immigrants
1 8,342 N/A
TOTAL 30,634 2,613 69 68,753 59,158 N/A
PRIMARY LANGUAGE OF AIDED CASES
Armenian 4 3 2 36 9 57
Cambodian 1 3 1 5
Chinese 20 4 9
English 9,852 2,484 7 16,910 17,984 5,445
Farsi 1 2 17
Korean 27 4 10
Russian 2 1 64 17 105
Spanish 1,577 1 2 6
Tagalog 88 45 8,026 4,108 1,102
Vietnamese 2 43 2 100
Other 10 30 8 13
TOTAL 11,445 2,575 59 25,162 22,139 6,869
ETHNIC ORIGIN OF AIDED PERSONS
American Indian / Alaskan Native
44 9 124 108 45
Asian 278 15 7 1,615 659 290
Black 11,635 1,001 1 11,727 18,584 2,762
Hispanic 13,309 709 52 42,553 28,452 1,819
White 4,855 791 8 10,660 10,157 1,953
Other 513 88 1 2,074 1,198
TOTAL 30,634 2,613 69 68,753 59,158 6,869

DEPARTMENT OF PUBLIC SOCIAL SERVICES
Page 245
Figure 1.2
DPSS CASELOAD CHARACTERISTICS DECEMBER 2011 Service Planning Area 2
CalWORKs General Relief
Refugee CAPI Medical
Assistance Only
CalFresh In-Home
Supportive Services
CITIZENSHIP STATUS OF AIDED PERSONS
Citizen 52,119 8,792 5 205,318 134,598 N/A
Legal Immigrants 8,278 1,985 357 1,716 44,101 24,664 N/A
Other 53 2 2 200 95 N/AUndocumented Immigrants
23 2 56,220 12 N/A
TOTAL 60,473 10,779 357 1,725 305,839 159,369 N/A
PRIMARY LANGUAGE OF AIDED CASES
Armenian 2,745 1,356 202 904 15,869 7,299 24,291
Cambodian 5 2 39 13 50
Chinese 3 3 327 23 165
English 12,092 8,431 9 84 62,682 39,028 9,105
Farsi 194 71 59 62 1,872 659 3,116
Korean 16 3 14 1,088 84 451
Russian 126 43 8 79 1,259 340 2,300
Spanish 8,939 617 12 323 54,118 24,715 5,862
Tagalog 13 7 23 1,401 122 1,196
Vietnamese 30 6 2 763 234 311
Other 122 27 8 22 1,471 329 1,238
TOTAL 24,285 10,563 298 1,516 140,889 72,846 48,085
ETHNIC ORIGIN OF AIDED PERSONS
American Indian / Alaskan Native
91 57 223 277 73
Asian 1,140 208 3 64 18,804 4,818 3,372
Black 4,236 1,802 2 4 7,725 10,776 1,542
Hispanic 38,537 3,585 13 367 198,974 97,727 7,478
White 1,430 454 1 50 10,732 4,247
Other 15,039 4,673 338 1,240 69,381 41,524 35,620
TOTAL 60,473 10,779 357 1,725 305,839 159,369 48,085

DEPARTMENT OF PUBLIC SOCIAL SERVICES
Page 246
Figure 1.3
DPSS CASELOAD CHARACTERISTICS DECEMBER 2011 Service Planning Area 3
CalWORKs General Relief
Refugee CAPI Medical
AssistanceOnly
CalFresh In-Home
Supportive Services
CITIZENSHIP STATUS OF AIDED PERSONS
Citizen 53,972 11,986 189,803 133,994 N/A
Legal Immigrants 1,688 757 58 509 36,138 10,350 N/A
Other 25 1 2 1 204 47 N/A Undocumented Immigrants
4 40,996 1 N/A
TOTAL 55,689 12,744 60 510 267,141 144,392 N/A
PRIMARY LANGUAGE OF AIDED CASES
Armenian 40 19 4 21 657 96 1,350
Cambodian 40 2 1 228 78 187
Chinese 358 91 31 112 17,673 2,501 10,557
English 14,901 11,909 7 30 57,503 42,258 8,445
Farsi 4 1 77 10 117
Korean 6 5 9 669 67 233
Russian 2 1 1 26 5 56
Spanish 6,633 473 5 220 38,468 17,749 5,258
Tagalog 3 2 13 787 67 810
Vietnamese 354 152 17 6,129 1,888 2,420
Other 42 13 3 28 828 134 520
TOTAL 22,383 12,666 52 452 123,045 64,853 29,953
ETHNIC ORIGIN OF AIDED PERSONS
American Indian / Alaskan Native
74 86 269 293 45
Asian 3,106 540 41 207 56,988 15,041 15,387
Black 4,551 2,144 3 7,682 10,549 1,839
Hispanic 41,616 6,585 5 246 173,904 100,663 8,501
White 2,316 1,282 5 25 11,745 6,304
Other 4,026 2,107 9 29 16,553 11,542 4,181
TOTAL 55,689 12,744 60 510 267,141 144,392 29,953

DEPARTMENT OF PUBLIC SOCIAL SERVICES
Page 247
Figure 1.4
DPSS CASELOAD CHARACTERISTICS DECEMBER 2011 Service Planning Area 4
CalWORKsGeneral Relief
Refugee CAPI Medical
Assistance Only
CalFresh In-Home
Supportive Services
CITIZENSHIP STATUS OF AIDED PERSONS
Citizen 43,863 16,437 3 138,371 114,262 N/A
Legal Immigrants 2,293 2,024 56 1,090 28,310 12,936 N/A
Other 59 9 14 1 254 141 N/AUndocumented Immigrants
11 2 2 51,634 11 N/A
TOTAL 46,226 18,472 72 1,094 218,569 127,350 N/A
PRIMARY LANGUAGE OF AIDED CASES
Armenian 310 174 9 201 2,831 792 4,295
Cambodian 18 2 3 193 56 125
Chinese 71 14 1 18 3,251 508 2,414
English 8,700 16,440 26 60 32,228 35,367 6,216
Farsi 3 11 1 1 190 25 280
Korean 102 103 3 86 6,505 618 2,779
Russian 92 41 13 74 2,201 238 3,635
Spanish 10,662 1,523 5 517 46,625 28,351 6,146
Tagalog 13 27 1 30 1,740 183 1,166
Vietnamese 33 14 3 688 166 240
Other 30 23 3 13 776 158 210
TOTAL 20,034 18,372 62 1,006 97,228 66,462 27,506
ETHNIC ORIGIN OF AIDED PERSONS
American Indian / Alaskan Native
57 78 126 215 38
Asian 1,532 507 22 187 26,931 6,439 7,510
Black 3,208 5,967 8 7 5,983 12,504 1,908
Hispanic 38,818 8,121 7 558 164,491 96,732 7,818
White 2,193 2,678 31 326 16,223 8,945 10,232
Other 418 1121 4 16 4815 2515
TOTAL 46,226 18,472 72 1,094 218,569 127,350 27,506
DEPARTMENT OF PUBLIC SOCIAL SERVICES
Page 248
Figure 1.5
DPSS CASELOAD CHARACTERISTICS DECEMBER 2011 Service Planning Area 5
CalWORKs General Relief
Refugee CAPI Medical
AssistanceOnly
CalFresh In-Home
Supportive Services
CITIZENSHIP STATUS OF AIDED PERSONS
Citizen 5,456 6,104 1 26,287 20,993 N/A
Legal Immigrants 391 275 31 114 5,266 1,393 N/A
Other 3 28 10 N/AUndocumented Immigrants
4,422 N/A
TOTAL 5,850 6,379 31 115 36,003 22,396 N/A
PRIMARY LANGUAGE OF AIDED CASES
Armenian 1 2 1 25 4 31
Cambodian 1 1 1
Chinese 3 1 1 191 11 44
English 2,024 6,232 11 23 13,656 13,538 2,801
Farsi 49 30 14 28 1,414 143 1,985
Korean 2 5 129 12 33
Russian 18 5 3 13 542 45 1,120
Spanish 427 74 29 4,591 1,313 547
Tagalog 1 1 38 4 13
Vietnamese 1 32 5 8
Other 27 7 1 7 326 60 141
TOTAL 2,553 6,357 29 102 20,945 15,136 6,724
ETHNIC ORIGIN OF AIDED PERSONS
American Indian / Alaskan Native
16 44 50 100 12
Asian 143 74 3 9 2,330 584 347
Black 2,083 2,997 1 5 3,418 7,728 561
Hispanic 2,082 856 35 15,854 6,379 830
White 1,086 1,816 26 59 11,351 5,905 4,974
Other 440 592 1 7 3,000 1,700
TOTAL 5,850 6,379 31 115 36,003 22,396 6,724

DEPARTMENT OF PUBLIC SOCIAL SERVICES
Page 249
Figure 1.6
DPSS CASELOAD CHARACTERISTICS DECEMBER 2011 Service Planning Area 6
CalWORKsGeneral Relief
Refugee CAPI Medical
Assistance Only
CalFresh In-Home
Supportive Services
CITIZENSHIP STATUS OF AIDED PERSONS
Citizen 105,245 19,205 2 197,579 212,824 N/A
Legal Immigrants 2,289 1,252 7 509 22,993 12,761 N/A
Other 68 5 6 227 114 N/AUndocumented Immigrants
21 1 69,508 7 N/A
TOTAL 107,623 20,463 7 517 290,307 225,706 N/A
PRIMARY LANGUAGE OF AIDED CASES
Armenian 1 21 1 4
Cambodian 11 1 25 15 38
Chinese 1 1 1 42 5 18
English 27,480 19,176 5 34 41,690 63,511 16,728
Farsi 1 2
Korean 6 14 11 607 61 283
Russian 4 1 9 5 6
Spanish 16,960 1,193 1 413 59,065 38,131 4,879
Tagalog 1 40 5 27
Vietnamese 3 1 25 8 12
Other 25 6 7 144 51 79
TOTAL 44,490 20,393 7 467 101,669 101,793 22,076
ETHNIC ORIGIN OF AIDED PERSONS
American Indian / Alaskan Native
42 26 79 100 32
Asian 560 127 1 13 2,218 1,216 555
Black 38,378 13,434 2 29 45,684 75,898 15,226
Hispanic 65,192 4,040 1 464 233,711 138,906 5,856
White 801 452 2 1 1,771 1,792 407
Other 2,650 2,384 1 10 6,844 7,794
TOTAL 107,623 20,463 7 517 290,307 225,706 22,076

DEPARTMENT OF PUBLIC SOCIAL SERVICES
Page 250
Figure 1.7
DPSS CASELOAD CHARACTERISTICS DECEMBER 2011 Service Planning Area 7
CalWORKs General Relief
Refugee CAPI Medical
AssistanceOnly
CalFresh In-Home
Supportive Services
CITIZENSHIP STATUS OF AIDED PERSONS
Citizen 56,343 3,279 170,777 124,394 N/A
Legal Immigrants 1,821 653 20 587 24,297 9,704 N/A
Other 41 1 1 1 176 65 N/AUndocumented Immigrants
8 46,195 N/A
TOTAL 58,213 3,933 21 588 241,445 134,163 N/A
PRIMARY LANGUAGE OF AIDED CASES
Armenian 7 1 3 114 16 487
Cambodian 24 2 267 63 244
Chinese 5 2 6 842 41 677
English 14,197 3,098 3 24 42,328 28,164 7,202
Farsi 1 1 2 16 4 20
Korean 9 3 19 861 55 319
Russian 1 2 23 4 32
Spanish 9,199 757 15 443 52,382 24,650 9,205
Tagalog 1 5 463 22 316
Vietnamese 6 3 3 285 35 156
Other 45 3 2 11 488 105 283
TOTAL 23,494 3,870 21 518 98,069 53,159 18,941
ETHNIC ORIGIN OF AIDED PERSONS
American Indian / Alaskan Native
48 28 195 188 70
Asian 877 80 1 45 9,649 2,374 2,431
Black 3,159 274 1 2 4,558 5,501 859
Hispanic 50,072 2,989 15 508 210,436 116,746 13,271
White 2,543 448 2 17 9,090 5,901 2,310
Other 1,514 114 2 16 7,517 3,453
TOTAL 58,213 3,933 21 588 241,445 134,163 18,941

DEPARTMENT OF PUBLIC SOCIAL SERVICES
Page 251
Figure 1.9
DPSS CASELOAD CHARACTERISTICS DECEMBER 2011 Service Planning Area Unknown*
CalWORKsGeneral Relief
Refugee CAPI Medical
Assistance Only
CalFresh In-Home
Supportive Services
Figure 1.8
DPSS CASELOAD CHARACTERISTICS DECEMBER 2011 Service Planning Area 8
CalWORKsGeneral Relief
Refugee CAPI Medical
Assistance Only
CalFresh In-Home
Supportive Services
CITIZENSHIP STATUS OF AIDED PERSONS
Citizen 62,969 25,932 163,803 159,290 N/A
Legal Immigrants 1,884 1,086 14 408 22,064 9,407 N/A
Other 58 5 1 1 234 90 N/AUndocumented Immigrants
6 2 39,002 5 N/A
TOTAL 64,917 27,025 15 409 225,103 168,792 N/A
PRIMARY LANGUAGE OF AIDED CASES
Armenian 2 42 2 58
Cambodian 475 29 15 1,594 862 1,532
Chinese 1 4 3 420 17 238
English 18,800 26,220 7 48 53,340 66,822 12,870
Farsi 4 2 7 126 6 163
Korean 7 7 19 858 60 519
Russian 4 89 4 83
Spanish 7,570 665 3 240 36,054 18,750 3,331
Tagalog 7 4 16 646 31 743
Vietnamese 49 4 5 924 170 393
Other 30 6 2 9 535 77 346
TOTAL 26,943 26,939 14 368 94,628 86,801 20,276
ETHNIC ORIGIN OF AIDED PERSONS
American Indian / Alaskan Native
50 149 196 335 82
Asian 4,111 818 89 22,353 10,646 4,900
Black 19,425 15,503 6 11 29,898 53,677 7,347
Hispanic 34,651 5,643 2 275 146,450 83,389 4,901
White 3,417 3,354 5 18 13,763 12,186 3,046
Other 3,263 1,558 2 16 12,443 8,559
TOTAL 64,917 27,025 15 409 225,103 168,792 20,276

DEPARTMENT OF PUBLIC SOCIAL SERVICES
Page 252
CITIZENSHIP STATUS OF AIDED PERSONS
Citizen 8,767 4,093 1 31,802 21,886 N/A
Legal Immigrants 315 146 8 113 4,268 1,418 N/A
Other 8 2 40 17 N/AUndocumented Immigrants
6,535 N/A
TOTAL 9,090 4,239 8 116 42,645 23,321 N/A
PRIMARY LANGUAGE OF AIDED CASES
Armenian 35 14 3 8 232 88 90
Cambodian 12 43 18 17
Chinese 3 2 3 521 40 74
English 2,387 4,066 1 8 12,230 9,094 816
Farsi 7 4 1 141 18 62
Korean 6 3 8 357 26 40
Russian 7 2 6 93 16 130
Spanish 1,171 121 1 63 6,716 2,750 412
Tagalog 1 124 10 42
Vietnamese 7 3 1 242 42 31
Other 7 3 1 6 126 18 37
TOTAL 3,642 4,219 7 103 20,825 12,120 1,751
ETHNIC ORIGIN OF AIDED PERSONS
American Indian / Alaskan Native
13 17 71 62 4
Asian 212 43 17 3,672 752 278
Black 1,945 2,260 1 4,342 5,664 366
Hispanic 5,764 888 1 69 27,388 12,926 590
White 836 903 6 25 5,369 2,971 513
Other 320 128 1 4 1,803 946
TOTAL 9,090 4,239 8 116 42,645 23,321 1,751
* Unknown counts represent cases with addresses that cannot be geocoded for various reasons such as
P.O. Box addresses, incomplete addresses, etc.

DEPARTMENT OF PUBLIC SOCIAL SERVICES
Page 253
Figure 2
INDIVIDUALS AIDED - ALL AID PROGRAMS DECEMBER 2011 Compared to December 2010
Program Dec. 2010 Dec. 2011 Change % Change
CalWORKs 443,245 438,715 -4,530 -1.02%
General Relief 107,452 106,647 -805 -0.75%
CAPI 4,405 5,143 738 16.75%
Refugee 870 571 -299 -34.37%
Medical Assistance Only
1,677,283 1,695,805 18,522 1.10%
CalFresh 978,920 1,064,647 85,727 8.76%
IHSS 184,383 182,181 -2,202 -1.19%
Total All Programs * 2,389,268 2,429,214 39,946 1.67%
* This total represents an unduplicated count of individuals across all programs since some individuals are aided in more than one program.
DEPARTMENT OF PUBLIC SOCIAL SERVICES
Page 254
Figure 3
CHILD ABUSE REFERRALS January 2001 - December 2011
Month 2001 2002 2003 2004 2005 2006 2007 2008 2009 2010 2011 10/11
change 10/11 % change
Jan. 56 47 20 37 20 26 16 23 7 11 5 -6 -55%
Feb. 39 50 13 33 24 16 13 14 5 9 9 0 0%
Mar. 41 23 32 32 21 31 12 12 7 11 3 -8 -73%
Apr. 42 50 28 29 34 41 15 11 13 7 14 7 100%
May 51 43 31 27 15 29 13 17 13 3 11 8 267%
June 43 43 50 32 32 31 12 14 11 5 16 11 220%
July 51 32 38 43 36 26 13 9 14 10 11 1 10%
Aug. 47 28 48 38 36 34 15 12 8 8 12 4 50%
Sept. 46 34 45 35 20 21 20 7 6 4 5 1 25%
Oct. 60 31 35 17 26 27 22 20 9 14 6 -8 -57%
Nov. 42 21 28 23 24 14 17 3 13 6 8 2 33%
Dec. 38 21 28 19 17 3 7 4 12 3 13 10 333%
Total 556 423 396 365 305 299 175 146 118 91 113 22 24%
Some of the referrals may have been for the same children.
Referral counts are from two sources:
-DPSS employees observing incidents which indicate abuse/neglect and making referrals
to the Departmental of Children and Family Services.
-Data collated from reports received from DPSS Welfare Fraud Prevention & Investigation Section.

DEPARTMENT OF PUBLIC SOCIAL SERVICES
Page 255
Figure 4
CAL-LEARN PARTICIPANTS SERVED January 2004 - December 2011
Month 2004 2005 2006 2007 2008 2009 2010 2011 10/11
change 10/11 % change
Jan. 2,699 2,358 2,452 2,181 2,465 2,735 3,064 2,923 -141 -5%
Feb. 2,650 2,390 2,504 2,234 2,492 2,832 3,109 2,948 -161 -5%
Mar. 2,505 2,377 2,435 2,155 2,470 2,891 3,134 2,912 -222 -7%
Apr. 2,557 2,369 2,467 2,186 2,514 2,920 3,200 2,934 -266 -8%
May 2,533 2,430 2,339 2,270 2,586 2,982 3,235 2,741 -494 -15%
June 2,554 2,355 2,412 2,307 2,549 2,953 3,149 2,350 -799 -25%
July 2,511 2,371 2,410 2,250 2,474 2,870 2,932 2,028 -904 -31%
Aug. 2,437 2,456 2,442 2,292 2,493 2,862 2,960 1,764 -1,196 -40%
Sept. 2,360 2,344 2,414 2,305 2,535 2,888 2,992 2,030 -962 -32%
Oct. 2,353 2,424 2,366 2,408 2,556 3,009 3,030 1,992 -1,038 .-34%
Nov. 2,327 2,400 2,412 2,450 2,650 3,077 3,014 2,172 -842 -28%
Dec. 2,365 2,444 2,389 2,488 2,751 3,074 2,991 2,169 -822 -27%

DEPARTMENT OF PUBLIC SOCIAL SERVICES
Page 256
Figure 5
INDIVIDUALS AIDED – ALL AIDS COMBINED January 2002 - December 2011
Month 2002 2003 2004 2005 2006 2007 2008 2009 2010 2011
Jan. 1,974,284 2,176,029 2,125,174 2,157,416 2,159,561 2,125,532 2,120,743 2,174,614 2,303,749 2,394,585
Feb. 2,004,216 2,185,622 2,121,033 2,155,158 2,151,993 2,121,183 2,121,664 2,180,687 2,306,162 2,389,716
Mar. 2,033,305 2,205,706 2,126,252 2,160,504 2,156,830 2,118,608 2,126,084 2,195,497 2,321,333 2,403,761
Apr. 2,053,985 2,220,340 2,120,822 2,143,971 2,146,245 2,112,631 2,129,358 2,206,577 2,327,154 2,403,859
May 2,077,231 2,227,731 2,107,699 2,164,290 2,143,301 2,113,264 2,131,845 2,216,924 2,331,869 2,413,553
June 1,928,402 2,202,094 2,131,565 2,170,799 2,144,293 2,111,673 2,135,562 2,232,040 2,340,068 2,416,384
July 1,871,520 1,977,951 2,205,980 2,102,765 2,165,355 2,138,980 2,112,568 2,139,790 2,249,143 2,420,344
Aug. 1,890,253 2,005,337 2,203,801 2,127,918 2,184,371 2,140,548 2,116,434 2,138,281 2,256,283 2,426,295
Sep. 1,911,380 2,018,573 2,165,470 2,137,604 2,182,116 2,137,037 2,113,352 2,144,760 2,271,473 2,431,316
Oct. 1,947,269 2,134,995 2,154,853 2,151,665 2,174,983 2,129,048 2,118,831 2,155,204 2,283,036 2,429,646
Nov. 1,975,315 2,153,486 2,142,473 2,156,602 2,164,674 2,132,091 2,119,663 2,154,415 2,287,582 2,428,279
Dec. 2,002,498 2,166,367 2,128,450 2,152,193 2,170,366 2,130,380 2,118,174 2,167,776 2,302,924 2,429,214

DEPARTMENT OF PUBLIC SOCIAL SERVICES
Page 257
Figure 6 INDIVIDUALS AIDED - CalWORKs
January 2002- December 2011
Month 2002 2003 2004 2005 2006 2007 2008 2009 2010 2011
Jan. 520,000 462,610 430,391 414,741 393,222 361,495 350,311 370,631 413,178 445,949
Feb. 521,144 459,815 430,449 411,996 389,308 357,170 349,868 373,398 412,969 445,154
Mar. 514,243 453,464 431,113 411,982 388,639 355,533 349,622 378,222 414,952 447,929
Apr. 509,779 450,140 430,219 409,394 384,683 354,031 350,448 382,959 415,809 449,363
May 504,467 448,322 426,729 405,720 382,422 353,662 350,578 385,883 418,101 451,770
June 499,743 445,039 426,184 405,630 381,675 353,094 350,570 389,509 419,613 453,164
July 488,909 438,361 424,338 403,975 378,299 351,664 352,835 392,490 426,282 449,303
Aug. 487,753 443,245 422,880 403,067 375,389 352,669 355,100 395,902 429,910 444,096
Sep. 480,849 441,248 421,714 397,342 374,190 351,816 357,008 400,534 437,714 444,308
Oct. 474,026 434,549 419,500 396,161 372,159 352,014 361,378 406,371 436,323 443,415
Nov. 474,233 433,899 417,371 392,509 368,084 355,989 362,652 406,992 439,859 440,023
Dec. 469,554 428,578 418,660 388,447 365,841 349,574 367,163 411,842 443,245 438,715

DEPARTMENT OF PUBLIC SOCIAL SERVICES
Page 258
Figure 7 INDIVIDUALS AIDED – MEDICAL ASSISTANCE ONLY
January 2002 - December 2011
Month 2002 2003 2004 2005 2006 2007 2008 2009 2010 2011
Jan. 1,166,682 1,406,522 1,353,228 1,358,470 1,610,580 1,610,495 1,601,826 1,608,284 1,652,545 1,677,657
Feb. 1,195,551 1,413,691 1,344,771 1,362,025 1,609,912 1,611,324 1,604,958 1,609,965 1,656,625 1,674,595
Mar. 1,224,869 1,433,380 1,336,927 1,361,840 1,612,873 1,606,981 1,605,420 1,612,871 1,664,015 1,681,467
Apr. 1,244,420 1,445,267 1,329,514 1,346,964 1,608,581 1,603,501 1,607,132 1,615,916 1,665,214 1,680,359
May 1,271,226 1,452,265 1,319,549 1,376,740 1,610,182 1,604,117 1,607,865 1,621,134 1,663,980 1,681,497
June 1,132,120 1,427,276 1,350,166 1,380,861 1,611,201 1,601,343 1,609,248 1,627,826 1,665,971 1,683,049
July 1,181,503 1,436,246 1,308,380 1,373,812 1,611,515 1,602,534 1,607,295 1,637,703 1,668,643 1,687,322
Aug. 1,209,942 1,423,220 1,328,548 1,392,970 1,615,820 1,603,846 1,602,051 1,639,215 1,669,561 1,694,711
Sep. 1,234,504 1,390,581 1,339,599 1,395,267 1,612,472 1,600,003 1,603,149 1,643,871 1,672,275 1,696,079
Oct. 1,358,891 1,382,429 1,356,053 1,387,259 1,607,194 1,603,238 1,607,896 1,646,630 1,677,012 1,693,154
Nov. 1,374,175 1,367,723 1,361,372 1,380,600 1,612,304 1,604,229 1,603,186 1,648,758 1,675,728 1,696,764
Dec. 1,389,420 1,361,270 1,351,417 1,389,196 1,612,219 1,602,354 1,607,228 1,655,341 1,677,283 1,695,805

DEPARTMENT OF PUBLIC SOCIAL SERVICES
Page 259
Figure 8
INDIVIDUALS AIDED - CALFRESH January 2002- December 2011
Month 2002 2003 2004 2005 2006 2007 2008 2009 2010 2011
Jan. 694,947 640,239 632,052 668,997 661,664 631,850 644,368 719,388 873,906 983,972
Feb. 694,210 639,800 638,116 663,088 653,479 625,321 642,827 728,164 877,708 982,952
Mar. 701,512 641,417 656,154 667,068 657,003 629,729 650,233 745,955 893,254 999,836
Apr. 697,071 639,816 654,400 665,689 645,412 622,860 652,132 755,533 896,310 997,431
May 693,056 641,206 654,425 665,018 644,941 624,750 656,361 767,382 902,170 1,017,987
June 663,140 639,950 651,213 663,654 642,842 624,827 659,778 782,354 912,861 1,016,668
July 678,885 636,053 662,139 664,358 638,219 627,626 670,143 799,325 930,781 1,029,907
Aug. 675,000 642,295 671,442 667,652 637,972 631,525 673,922 807,965 941,140 1,042,754
Sep. 658,674 637,365 670,871 669,642 636,555 630,752 681,301 827,823 955,463 1,052,181
Oct. 647,434 634,616 667,536 667,981 635,344 638,796 690,571 844,497 963,522 1,058,355
Nov. 647,617 634,291 666,183 667,264 633,506 639,412 695,872 852,054 968,213 1,057,476
Dec. 645,854 629,613 671,176 661,703 634,763 641,215 713,748 870,368 978,920 1,064,647
DEPARTMENT OF PUBLIC SOCIAL SERVICES
Page 260
GLOSSARY OF TERMS
DEPARTMENT OF PUBLIC SOCIAL SERVICES (DPSS)
Administers programs that provide services to individuals and families in need. These programs are designed to both alleviate hardship and promote family health, personal responsibility, and economic independence. Most DPSS programs are mandated by Federal and State laws.
CALIFORNIA WORK OPPORTUNITY AND RESPONSIBILITY TO KIDS (CALWORKS)
Provides temporary financial assistance, no-cost Medi-Cal, and employment-focused services to families with minor children who may or may not have income, and their property limit is below State maximum limits for their family size. In addition, the family must meet one of the following deprivations:
Either parent is deceased Either parent is physically or mentally
incapacitated The principal wage earner is unemployed Either parent is continually absent from
the home in which the child is living
CASH ASSISTANCE PROGRAM TO IMMIGRANTS (CAPI)
Provides cash to certain aged, blind, and disabled legal non-citizens ineligible for Supplemental Security Income/State Supplemental Payment (SSI/SSP) due to their immigration status. CAPI participants may be eligible for Medi-Cal, In-Home Supportive Services (IHSS), and/or CalFresh benefits. Individuals requesting such benefits must file an appropriate application for each program.
CALFRESH
Is the cornerstone of the federal food assistance program. The purpose of this program is to promote and safeguard the health and well-being of low-income households by raising their levels of nutrition and increasing their food purchasing power.
GENERAL RELIEF (GR)
Is a County-funded program that provides cash aid to indigent adults who are ineligible for Federal or State programs.
IN-HOME SUPPORTIVE SERVICES (IHSS)
Enables low-income, aged, blind, and disabled individuals to remain safely at home by paying caregivers to provide personal care and domestic services.
LEADER
Is an acronym for Los Angeles Eligibility, Automated Determination, Evaluation and Reporting System.
MEDI-CAL ASSISTANCE ONLY (MAO)
Provides comprehensive medical benefits to low-income families with children, pregnant women, blind or disabled individuals and adults over 65 years of age. Depending on their income and resource levels, individuals and families may be eligible for a no-cost or a share-of-cost Medi-Cal Program.
REFUGEE RESETTLEMENT PROGRAM (RRP)
Is made up of many program partners at the Federal, State, County, and community levels. Typically, refugees are eligible for the same assistance programs as citizens including CalWORKs, CalFresh, Medi-Cal, SSI/SSP, and General Relief. In addition, single adults or couples without children who are not eligible for other

DEPARTMENT OF PUBLIC SOCIAL SERVICES
Page 261
welfare assistance may receive Refugee Cash Assistance (RCA). Vital to the success of the California Refugee Program are the contributions made by Mutual Assistance Associations, and Community Based Organizations (CBOs) that provide culturally and linguistically appropriate services.
CAL-LEARN
Is a mandatory program for CalWORKs participants who are under 19 years of age, are pregnant or parenting, and have not yet completed their high school education. The Cal-Learn program is designed to address long-term welfare dependency by encouraging and assisting teen parents on the CalWORKs program to remain in or return to school. Cal-Learn focuses on providing these youths with the following supportive services needed to complete their high school education or equivalent:
Intensive case management services Payments for child care, transportation,
and school expenses $100 bonuses up to four times a year for
satisfactory school progress $500 one-time-only bonus for receiving a
high school diploma or its equivalent

Page 262