Department of Pesticide Regulation - cdpr.ca.gov · Page 5 Episode Investigation ... Fresno County...
20
Department of Pesticide Regulation Mary-Ann Warmerdam Director M E M O R A N D U M Arnold Schwarzenegger Governor 1001 I Street P.O. Box 4015 Sacramento, California 95812-4015 www.cdpr.ca.gov A Department of the California Environmental Protection Agency Printed on recycled paper, 100% post-consumer--processed chlorine-free. TO: George Farnsworth HSM10007 Environmental Program Manager I FROM: Bernardo Z. Hernandez (original signed by B. Hernandez) Research Scientist I Worker Health and Safety Branch (916) 445-5203 DATE: July 20, 2010 SUBJECT: WHS BRANCH INVOLVEMENT RELATED TO THE INVESTIGATION OF PRIORITY ILLNESS EPISODE 26-KER-05 (PROJECT 0508) Background Date of Exposures: 08-05-2005 and 08-06-2005 Pesticide: Sectagon 42 (EPA Reg. No. 61842-6) Active Ingredient: METAM-SODIUM (42%) Application Rate: 50 gallons/acre = 3,750 gallons/75 acres Application Equipment: Sprinkler Application Type: Chemigation with post-application water treatment Water System Delivery Capacity: ¼ inch of water per hour Crop: Fallow field (preplant carrots) Drift site: Vineyard (table grapes) Vineyard distance from application site: 60 feet Distance between application site and closest ill worker: Approximately 150 feet Weather data: California Irrigation Management Information System (CIMIS) station 125, Arvin-Edison WHS Observer: Bernardo Hernandez Incident Chronology At 2000 hours on August 3, 2005, Val-Mar Farm employees began treating a 75-acre fallow field (site 83A) with Sectagon 42 through the sprinkler irrigation system. The employees [applicators] worked from East to West. The application was completed in two days. The Sectagon 42 was applied through five half-mile long sprinkler lines per set. Each set covers 12.5 acres. They applied three sets per night (covering 37.5 acres each night). Each ½ mile line covered 2.5 acres at 50 gallons of Sectagon 42 per acre, thus 125 gallons of material per line equaling 625 gallons per set. The employees applied a total of 1,875 gallons of material each night. Each application set was to run for three hours each night ending at 0600 hours of the next day. The first and second sets received a 45-minute post-application water treatment, with water being applied to the third set for one hour, from 0600 to 0700 hours. On August 5, 2005, at approximately 0500 hours, six harvesting crews arrived to pick grapes at a Sun Pacific Farms’ 7th Standard Ranch vineyard site 244, 60 feet north of application site 83A (photo 1). At approximately
Transcript of Department of Pesticide Regulation - cdpr.ca.gov · Page 5 Episode Investigation ... Fresno County...

Department of Pesticide Regulation
Mary-Ann Warmerdam Director M E M O R A N D U M
Arnold Schwarzenegger Governor
1001 I Street P.O. Box 4015 Sacramento, California 95812-4015 www.cdpr.ca.gov A Department of the California Environmental Protection Agency
Printed on recycled paper, 100% post-consumer--processed chlorine-free.
TO: George Farnsworth HSM10007 Environmental Program Manager I FROM: Bernardo Z. Hernandez (original signed by B. Hernandez) Research Scientist I Worker Health and Safety Branch (916) 445-5203 DATE: July 20, 2010 SUBJECT: WHS BRANCH INVOLVEMENT RELATED TO THE INVESTIGATION OF
PRIORITY ILLNESS EPISODE 26-KER-05 (PROJECT 0508)
Background
Date of Exposures: 08-05-2005 and 08-06-2005 Pesticide: Sectagon 42 (EPA Reg. No. 61842-6) Active Ingredient: METAM-SODIUM (42%) Application Rate: 50 gallons/acre = 3,750 gallons/75 acres Application Equipment: Sprinkler Application Type: Chemigation with post-application water treatment Water System Delivery Capacity: ¼ inch of water per hour Crop: Fallow field (preplant carrots) Drift site: Vineyard (table grapes) Vineyard distance from application site: 60 feet Distance between application site and closest ill worker: Approximately 150 feet Weather data: California Irrigation Management Information System (CIMIS) station 125,
Arvin-Edison WHS Observer: Bernardo Hernandez Incident Chronology
At 2000 hours on August 3, 2005, Val-Mar Farm employees began treating a 75-acre fallow field (site 83A) with Sectagon 42 through the sprinkler irrigation system. The employees [applicators] worked from East to West. The application was completed in two days. The Sectagon 42 was applied through five half-mile long sprinkler lines per set. Each set covers 12.5 acres. They applied three sets per night (covering 37.5 acres each night). Each ½ mile line covered 2.5 acres at 50 gallons of Sectagon 42 per acre, thus 125 gallons of material per line equaling 625 gallons per set. The employees applied a total of 1,875 gallons of material each night. Each application set was to run for three hours each night ending at 0600 hours of the next day. The first and second sets received a 45-minute post-application water treatment, with water being applied to the third set for one hour, from 0600 to 0700 hours. On August 5, 2005, at approximately 0500 hours, six harvesting crews arrived to pick grapes at a Sun Pacific Farms’ 7th Standard Ranch vineyard site 244, 60 feet north of application site 83A (photo 1). At approximately

George Farnsworth July 20, 2010 Page 2 0615 hours, workers closest to the application site complained of a moderate to strong odor and began experiencing symptoms of tearing and burning eyes.
Photo 1
August 2005 Episode Area Overview
August 3 & 4/05
August 4 & 5/05
N
S
EW
One worker (# 23) also complained of feeling ill and vomited (photo 2). This worker reported it to her supervisor at around 0630 hours and stated she wanted to see a doctor. A company employee drove her to a doctor in Bakersfield. The harvest supervisor decided to move the harvesting crews to the far west side of the site 244, away from the application site, where they worked the rest of the day. At 1330 hours, a local news channel contacted the Kern County Agricultural Commissioner’s (CAC) office inquiring about the occurrence of which CAC had not been notified. Kern CAC began looking into the incident and found that Val-Mar Farms had made the sprinkler application stated above. CAC inspectors went to the incident site at 1600 hours, found no workers harvesting grapes in the area near the treatment site. They noticed properly posted warning signs around the treated field (83A) and that the sprinklers were off in the treatment site, also that the entire sight was wet and appeared to have just been irrigated. They also noted a slight southeasterly wind was blowing towards the grapes (See wind and weather data from California Irrigation Management System ([CIMIS] station 125 [appendix 1]). On August 6, the harvesting crews arrived at approximately at 0500 hours to again pick grapes north of treated site 83A. One Sun Pacific Farms human resource department employee interviewed several workers who indicated they could smell a strong odor, but continued working until 0720 hours, when a few workers began vomiting (photo 3). Six workers (#19,
George Farnsworth July 20, 2010 Page 3 #22, #23, #24, #25, and #26) reported symptoms that included headaches, burning and tearing eyes, sore throats, numbness of the tongue, and vomiting. The company’s human resource employee called Kern County Fire Department to the site. They decontaminated the six workers at the ranch and transported them to Bakersfield hospitals where doctors examined, treated and released them. No additional workers reported feeling ill that day. On Monday, August 8, 2005; more workers sought medical care at the Industrial Medical Group of Bakersfield. Worker # 23 (photo 2) sought medical care at the Clinica Sierra Vista in Lamont on August 5th. She returned to the clinic on August 12th for continuing symptoms. She returned to her home in Coachella, California and continued to feel ill. She sought medical treatment a third time on August 14, 2005 at John F. Kennedy Memorial Hospital in Indio for “cocci pneumonia”. Two days later, on August 16, 2005, a doctor admitted her to the Eisenhower Medical Center, in the adjacent community of Rancho Mirage. Her cocci pneumonia progressed to adult respiratory distress syndrome and required treatment.
Photo 2
Location of Workers Who complained of Symptoms on Friday, 8/5/2005 (Identified by WHS Worker Number)
#23 X #24
#21 #22
#19 #20
#17 #18
#9 #10 #11#13 #14 #15 #16
#5 #6 #7
#3 #4
#1 #2
#12
0.5
Mile
s
Treatm
ent S
ite
Site 83
A
#8
X = affected worker #23 who sought medical attention. Worker #23 located approximately 150 feet from treated site
George Farnsworth July 20, 2010 Page 4
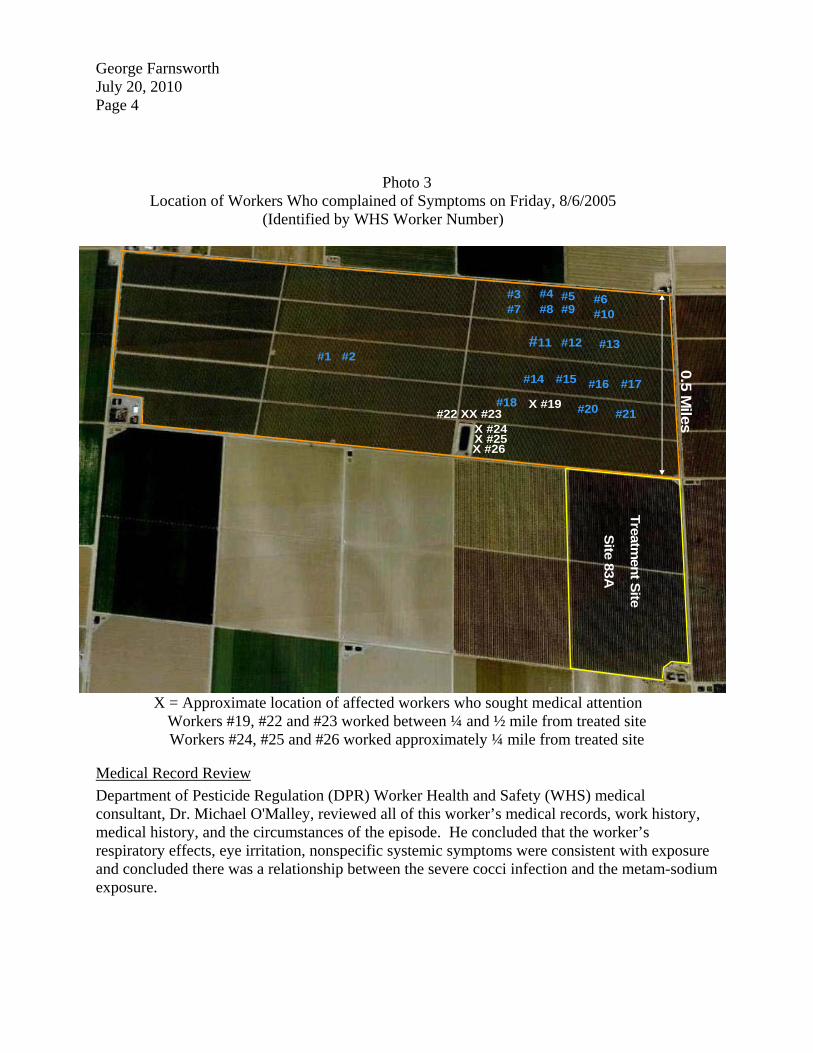
Photo 3 Location of Workers Who complained of Symptoms on Friday, 8/6/2005
(Identified by WHS Worker Number)
X #23#22 X #20#18
#16
#5#3
#1 #2#12
0.5
Mile
s
Treatm
ent S
ite
Site 83
A
#8#4
#7#6
#9 #10
#11 #13
#14 #15 #17
X #19#21
X #24X #25X #26
X = Approximate location of affected workers who sought medical attention Workers #19, #22 and #23 worked between ¼ and ½ mile from treated site Workers #24, #25 and #26 worked approximately ¼ mile from treated site
Medical Record Review
Department of Pesticide Regulation (DPR) Worker Health and Safety (WHS) medical consultant, Dr. Michael O'Malley, reviewed all of this worker’s medical records, work history, medical history, and the circumstances of the episode. He concluded that the worker’s respiratory effects, eye irritation, nonspecific systemic symptoms were consistent with exposure and concluded there was a relationship between the severe cocci infection and the metam-sodium exposure.

George Farnsworth July 20, 2010 Page 5 Episode Investigation
Pesticide Enforcement Branch Central Regional Office (CRO) supervisor Al Lomeli contacted WHS late morning of August 8, 2005 to report the episode. Kern CAC staff began the process of locating and interviewing the six field workers who sought medical treatment on August 6, the farm labor contractor, the applicators, and the grower. At this time, Bernardo Hernandez was in Fresno County working on an irrigator exposure monitoring study. WHS management redirected him to Kern County to assist Kern CAC staff with worker interviews. Since five or more workers developed symptoms from a single pesticide episode, the episode met human effects priority investigation criteria and the DPR Enforcement Branch staff assigned a priority investigation case number, 26-KER-05 [Cooperative Agreement, 2005]. Due to the employer’s reluctance to allow worker interviews, DPR’s Enforcement Branch and WHS Branch staff provided pesticide exposure questionnaires with self-addressed stamped envelopes to Sun Pacific Farm’s human resources department. The human resources department provided the questionnaires with the pay warrants to the workers of the six harvesting crews and to any other worker reporting illness symptoms. Thirty-seven of approximately 300 workers returned their completed questionnaires to WHS Branch. The workers chief complaints included burning and tearing eyes, throat irritation, vomiting, nausea, breathing difficulties, headaches, lightheadedness, abdominal pain, and diarrhea. Drift Site Investigation
Photographs 1, 2, and 3 show the incident area and worker locations within the vineyard when they experienced symptoms. Photograph 4 documents the posted warning signs around the treated field; photograph 5 shows the sprinkler system used for the application; and photograph 6 shows the treated field proximity to the vineyard (60 feet).
Photo 4 Warning signs posted around perimeter of site 83A

George Farnsworth July 20, 2010 Page 6
Photo 5 Looking northwest from site 83A, toward grape site 244
For each 12.5 acre set, the applicators applied a post-application water treatment immediately after completing the application. Each night, they ran the water for 45 minutes after the first two sets, and for one hour after the third set. The irrigation system water delivery capacity was 0.25 inches per hour. The irrigation system delivered 0.187 inches of water for the 45-minute post-application water treatments and 0.25 inches for the 1-hour post-application water treatment (See Table 1). The post-application water treatment for all six sets did not meet the 2005 Kern County metam-sodium permit condition of 0.5 inch of water within four hours of the end of the application.

George Farnsworth July 20, 2010 Page 7
Table 1 The Amount of Time and Total Water Applied During the
Post-Application Water Treatment
Set 1 Set 2 Set 3 Day Permit Required Watera
(inches)
Timeb
(minutes)Total Water
Applied (inches)
Time
(minutes)Total Water
Applied (inches)
Timeb
(minutes) Total Water
Applied (inches)
Day 1 0.5 45 0.187 45 0.187 60 0.25 Day 2 0.5 45 0.187 45 0.187 60 0.25
a. The amount of post-application water treatment required by the permit conditions within 4 hours of the end of the application.
b. The amount of time sprinklers ran for the post-application water treatment.
Photo 6 Looking west in between site 83A and site 244
Weather Data
Wind patterns: Prevailing seasonal surface air flow for the Central Valley are intense during the hottest part of the day for the summer months with air flow moving upslope during the day and down slope at night. The wind patterns are caused by the temperature difference between the warming of the day and cooling of the night [Hayes, et al.]. For the second half of July, 2005 and for August 3 – 6, 2005, the CIMIS weather data from station 125 supports the wind patterns found by Hayes. See Appendix 1 for CIMIS station 125 weather data during the days of application and the incident days (August 3 – 6, 2005) and Appendix 2 for the second half of

George Farnsworth July 20, 2010 Page 8 July (July 15 – 31, 2005). In addition, Barry [Barry, 2005] conducted a modeling study of the air conditions during the time of this incident. She obtained wind data from four of California’s Air Quality and Meteorological Information System (AQMIS) stations. She used a range of wind directions from the four AQMIS stations to account for wind direction uncertainty. The AQMIS Edison and Bakersfield-Golden State Highway stations both report wind directions that would cause a plume of MITC (centerline: 292° and 288° respectively) to move down slope from the application site towards the harvest workers in the adjacent vineyard. Barry noted that the plume shifts back and forth over a general area over shorter time periods, on the order of minutes to one hour and that air concentrations at the site of the incidents could have been within the range of MITC concentrations associated with odor and eye irritation.
Conclusion
Based on the information gathered by the Kern CAC staff, my field observations, weather data from CIMIS station 125, and photographic evidence, the following appear very likely to have contributed to worker exposure to metam sodium: 1. Miscommunication between Sun Pacific 7th Standard Ranch, and American Labor Supply
(who provided the workers). Val-Mar Farms and Sun Pacific 7th Standard Ranch agreed to no workers in the area during the metam sodium application. Sun Pacific 7th Standard Ranch appears not to have communicated this agreement to American Labor Supply.
2. American Labor Supply should not have allowed workers to enter the vineyard when they saw the application in progress.
3. The applicators applied the metam sodium to each set over a three-hour period instead of the permit required four hours.
4. The applicators applied 0.187 to 0.25 inches of water per set to the treated field, 50% or less than the permit required 0.5 inches.
5. Wind patterns on the day of the application and incident day between the hours of 2000 and 0600.

George Farnsworth July 20, 2010 Page 9 References
Barry, T. 2005. Estimation of Methyl Isothiocyanate Air Concentrations during the Arvin Incident (revised memo) EM05-09. Environmental Monitoring Branch, Department of Pesticide Regulation. Sacramento, CA.
http://www.cdpr.ca.gov/docs/emon/pubs/ehapreps/analysis_memos/1755_Goh_rev.pdf
California Irrigation Management Information System (CIMIS). 2005. Hourly Daily Report for
Arvin Station 125 from July15 to July 31, 2005, and August 3 to August 6, 2005. California Irrigation Management Information System (CIMIS). http://wwwcimis.water.ca.gov/cimis/data.jsp
Cooperative Agreement between the United States Environmental Protection Agency Region 9,
the California Department of Pesticide Regulation, and the California Agricultural Commissioners and Sealers Association. 2005. Appendix A, Priority Investigation Effects Criteria. http://www.cdpr.ca.gov/docs/county/cacltrs/penfltrs/penf2005/2005atch/attach1902.pdf
Hayes, T. P., et al. 1984. California Surface Wind Climatology, Predominant Summer Wind
Flow Pattern, Reprinted With Minor Revisions, by the Modeling and Meteorology Branch Technical Support Division June 1989. Aerometric Data Division, California Air Resources Board. Sacramento, CA.
O’Malley, M. (Unpublished memorandum, 2005) Review of Medical Records in Hospitalized
Worker Involved in 26-Ker-05 Priority Episode. Worker Health and Safety Branch, California Department of Pesticide Regulation.

George Farnsworth July 20, 2010 Page 10
Appendix 1 Arvin-Edison CIMIS Hourly Weather Station Data
August 3 – 6, 2005
Date Hour ETo (in)
Precip (in)
Sol Rad (Ly/day)
Vapor Pressure (mBars)
Air Temp (°F)
Rel Hum (%)
Dew Point (°F)
Wind Speed (MPH)
Wind Dir
(0-360)
Soil Temp (°F)
0100 0 0 0 12.4 79.4 36 50.3 7.3 200.1 90.10200 0 0 0 12.4 78.1 38 50.3 7.1 216.4 89.8 0300 0 0 0 11.7 77.1 37 48.6 4.2 151.5 89.5 0400 0 0 0 11.5 73.3 41 48.3 3.5 63.9 89.2 0500 0 0 0 12 69.4 49 49.4 3.4 42.6 88.8 0600 0 0 97 13.4 69 55 52.4 2.4 43.4 88.5 0700 0.01 0 483 15.4 75.9 50 56.1 1.8 74.8 88.2 0800 0.01 0 912 14.2 82.8 37 53.8 2.8 297.1 87.9 0900 0.02 0 1318 12 86.8 28 49.3 3.6 276 87.6 1000 0.03 0 1662 11.9 88.9 26 49.2 3.6 247.7 87.4 1100 0.03 0 1906 11.9 91.4 24 49.1 3.7 241 87.4 1200 0.04 0 2040 11.4 93.4 21 48 3.9 228.8 87.5 1300 0.04 0 2024 11.7 94.9 21 48.7 4.1 261.5 87.8 1400 0.03 0 1881 11.7 97 20 48.8 4.6 242 88.5 1500 0.03 0 1627 11.1 99.5 17 47.3 5.4 238.2 90.6 1600 0.03 0 1288 9 100.5 14 41.9 7.6 253.9 92.3 1700 0.02 0 876 8.8 100.4 13 41.1 7.4 266.5 92.7 1800 0.01 0 442 9.5 99 15 43.1 7.4 279.2 92.8 1900 0.01 0 95 11.7 93.7 22 48.7 4.4 230 92.8 2000 0 0 1 12.3 88.1 27 50.1 3.6 168.1 92.6 2100 0 0 0 10.2 87.1 23 45 4.3 136.4 92.4 2200 0 0 0 13.1 82.7 34 51.8 4.4 212.3 92.1 2300 0 0 0 13.3 77 42 52.1 2.6 57 91.8
8/3/2005
2400 0 0 0 12.9 74 45 51.4 2.7 56.9 91.5 0100 0 0 0 10.8 73.9 38 46.6 3.2 74.9 91.1 0200 0 0 0 12.8 71.7 48 51.1 2.3 93.5 90.7 0300 0 0 0 13.1 70.7 51 51.8 3.7 169.9 90.3 0400 0 0 0 13.6 69 56 52.7 2.1 107.4 89.9 0500 0 0 1 11.8 66.7 53 49 2.8 55.1 89.5 0600 0 0 92 11.8 67.8 51 49 2.5 59.5 89.1 0700 0.01 0 463 14.8 77.7 46 55.1 1.5 93.9 88.7 0800 0.01 0 882 13.1 84.8 32 51.7 2.2 296.8 88.3 0900 0.02 0 1287 13.5 86.3 32 52.6 3.4 219.7 88 1000 0.03 0 1623 13.9 88 31 53.4 3.7 241.8 87.8 1100 0.03 0 1863 14.2 89.7 30 53.9 5.4 261.1 87.7 1200 0.04 0 1980 13.7 91.4 27 53 5.1 259.6 87.8 1300 0.03 0 1953 14.7 92.9 28 54.9 3.5 263.3 88 1400 0.03 0 1842 15 94.5 27 55.4 4 240.3 88.4 1500 0.03 0 1588 15 96 26 55.5 3.9 203.3 90 1600 0.02 0 1222 15.1 97.2 25 55.6 4.2 225.5 92.4 1700 0.02 0 827 15.1 97.8 25 55.7 4.6 225.7 94.2 1800 0.01 0 425 15.9 96.4 27 57.1 5.9 220 94.8 1900 0 0 92 16 93.5 30 57.2 4 245.4 94.6 2000 0 0 1 14.6 86.9 33 54.7 3.5 121.1 94.3 2100 0 0 0 13.2 88.1 29 52 4.6 116.9 93.9 2200 0 0 0 12 87.5 27 49.3 4.6 148.6 93.6 2300 0 0 0 14.7 78.9 44 54.9 2.7 63.2 93.2
8/4/2005
2400 0 0 0 16.2 76.8 52 57.6 3.3 25.7 92.8

George Farnsworth July 20, 2010 Page 11
Appendix 1 (cont.) Arvin-Edison CIMIS Hourly Weather Station Data
August 3 – 6, 2005
Date Hour ETo (in)
Precip (in)
Sol Rad (Ly/day)
Vapor Pressure (mBars)
Air Temp (°F)
Rel Hum (%)
Dew Point (°F)
Wind Speed (MPH)
Wind Dir
(0-360)
Soil Temp (°F)
0100 0 0 0 15.1 77.4 47 55.7 3.4 97.9 92.3 0200 0 0 0 16 74.3 55 57.2 3.3 169.4 91.9 0300 0 0 0 16 72 60 57.2 2.5 81.6 91.5 0400 0 0 0 15.8 71.7 59 56.9 2.5 113.7 91.1 0500 0 0 0 15.2 70.7 59 55.7 2.4 75.6 90.7 0600 0 0 79 15.4 71.2 59 56.1 2.1 73.9 90.3 0700 0.01 0 414 17 79.7 49 58.8 1.6 42.7 89.9 0800 0.01 0 854 15.7 84.8 38 56.7 2.1 234.4 89.5 0900 0.02 0 864 16.1 85 39 57.4 4.3 230.2 89.2 1000 0.03 0 1408 17 88.2 37 58.8 3.9 232.6 89 1100 0.03 0 1780 17.4 91.2 35 59.6 4.4 263.9 88.9 1200 0.04 0 1910 16.4 93.4 31 57.9 4.7 267.9 88.9 1300 0.03 0 1902 16.2 94.8 29 57.6 3.4 252 89.1 1400 0.03 0 1912 17 96.9 28 58.9 3.3 236.7 89.8 1500 0.02 0 920 17.2 96.5 29 59.2 5.3 228.3 91.9 1600 0.02 0 1075 16.4 97.5 27 57.9 6 241.8 93.8 1700 0.02 0 730 16 97.3 27 57.3 6.2 249.6 94.4 1800 0.01 0 188 15.8 96 27 56.8 4 264.9 93.9 1900 0 0 43 17 92.4 33 58.9 3 130.1 92.7 2000 0 0 0 15.4 90.3 32 56.2 4.1 112.5 91 2100 0 0 0 15.3 87.8 34 56 3.5 89.3 89.7 2200 0 0 0 14.9 87.9 33 55.3 4.1 104.1 89.2 2300 0 0 0 17.5 84 44 59.7 3.4 10.1 89.2
8/5/2005
2400 0 0 0 17.5 80 50 59.8 2.5 83.9 89.1 0100 0 0 0 17.9 78.8 53 60.4 3.3 148.2 89 0200 0 0 0 18.6 76.7 59 61.5 2.8 79.8 88.9 0300 0 0 0 16.8 76.3 54 58.5 3.2 61.6 88.7 0400 0 0 0 16.8 76 55 58.6 2 77 88.6 0500 0 0 0 16.5 76.1 54 58.1 2.3 68.4 88.4 0600 0 0 74 17 76.1 55 58.9 2.1 59.7 88.2 0700 0.01 0 421 19.6 82.4 52 62.9 2 51.5 88 0800 0.01 0 641 17 87.1 39 59 2.3 301 87.8 0900 0.02 0 853 18.7 88.6 41 61.6 2.5 56.5 87.7 1000 0.02 0 1395 16.6 93.1 31 58.2 2.3 268 87.6 1100 0.03 0 1638 16.8 94.4 30 58.6 4.3 254.2 87.6 1200 0.04 0 1916 16 96.2 27 57.2 5 261.5 87.8 1300 0.04 0 1916 16.6 98.1 27 58.3 4.1 211.1 88.1 1400 0.03 0 1815 17 100 26 58.9 3.9 199.3 88.4 1500 0.03 0 1524 18.1 100.9 27 60.6 4.4 216.7 88.8 1600 0.02 0 1010 17.3 100.5 26 59.4 7.2 236.8 89.3 1700 0.02 0 839 16.6 101 25 58.2 6.4 234.9 89.7 1800 0.01 0 415 15.5 99.6 24 56.4 7 238.5 90.1 1900 0 0 79 15.9 94.2 29 57 4.1 174.7 90.3 2000 0 0 0 13.8 90.6 28 53.1 3.3 159.7 90.5 2100 0 0 0 16.1 85 39 57.4 2 40.5 90.5 2200 0 0 0 14.4 82.7 38 54.2 3.6 50.8 90.5 2300 0 0 0 14.3 82.7 37 54.2 2.7 79 90.4
8/6/2005
2400 0 0 0 17.7 79.3 52 60 3.6 160.2 90.2

George Farnsworth July 20, 2010 Page 12
Appendix 2 Arvin-Edison CIMIS Hourly Weather Station Data
July 15 – 31, 2005
Date Hour ETo (in)
Precip (in)
Sol Rad (Ly/day)
Vapor Pressure (mBars)
Air Temp (°F)
Rel Hum (%)
Dew Point (°F)
Wind Speed (MPH)
Wind Dir (0-360)
Soil Temp (°F)
7/15/2005 0100 0 0 0 20.3 81.7 55 63.9 2.6 162.3 89.8 0200 0 0 0 19.8 79.5 58 63.2 1.9 147.2 89.6 0300 0 0 0 19.6 76.9 62 62.9 2 47.3 89.3 0400 0 0 0 18 74.6 62 60.6 2.5 78.2 89.1 0500 0 0 2 15.6 76.8 50 56.5 3.7 80.8 88.8 0600 0 0 76 17.1 77.8 53 59.1 2.6 143.4 88.6 0700 0 0 425 19.2 82.3 51 62.4 2.3 73.3 88.3 0800 0 0 452 19.5 85.1 47 62.8 2.7 31.1 88 0900 0 0 1331 16.8 89.7 35 58.5 4.5 255.9 87.8 1000 0 0 1615 17.1 91.8 34 59.1 6.6 229.1 87.7 1100 0 0 1834 16.7 94.2 30 58.4 6.2 223.8 87.6 1200 0 0 1966 17.8 95.8 31 60.1 5.1 242.7 87.7 1300 0 0 2032 17.7 98 29 60.1 3.7 268.9 87.9 1400 0 0 1801 18.4 100.2 28 61.1 3.5 224.1 88.2 1500 0 0 1627 18.5 101.8 27 61.2 4 253.6 88.6 1600 0 0 1366 17.8 102.6 25 60.2 4.9 213 89 1700 0 0 915 19.1 100.7 28 62.1 7.3 227.4 89.4 1800 0 0 436 19 99.3 30 62 6.2 247.4 89.8 1900 0 0 142 21.2 96 36 65.1 2.4 204.1 90.1 2000 0 0 3 19.5 89.2 42 62.8 3.3 122.5 90.2 2100 0 0 0 15.3 90.9 31 56.1 4.3 111.6 90.2 2200 0 0 0 16.8 89.5 36 58.6 3.3 94.7 90.2 2300 0 0 0 20.7 80.1 59 64.5 2.4 43.2 90.1 2400 0 0 0 20.2 78.7 60 63.7 1.7 66.1 90
7/16/2005 0100 0 0 0 21.9 77.7 68 66.1 1.6 38.2 89.8 0200 0 0 0 19.5 78.2 59 62.7 3.3 187.1 89.5 0300 0 0 0 18.8 75.9 62 61.8 3.3 56.4 89.3 0400 0 0 0 16.8 77.5 52 58.6 2.9 77.9 89 0500 0 0 3 19.5 73.4 69 62.7 2.7 150.5 88.8 0600 0 0 139 18.9 75.2 63 61.9 2.7 39.5 88.5 0700 0 0 481 20.2 85.9 48 63.8 1.7 41.7 88.3 0800 0 0 884 17.7 90.5 36 60 2.8 343.2 88 0900 0 0 1267 16.6 93.3 31 58.3 2.5 294.2 87.8 1000 0 0 1582 17.8 95 32 60.2 3.6 259.5 87.7 1100 0 0 1815 18.8 97 31 61.7 3.2 240.3 87.8 1200 0 0 1904 19.3 98.6 31 62.4 4 238.5 87.9 1300 0 0 1927 18.3 100.2 28 61 4.1 303.9 88.2 1400 0 0 1821 18.2 102.2 26 60.9 3.5 219.2 88.6 1500 0 0 1594 19.3 103.3 27 62.5 3.3 195 89 1600 0 0 1236 19.6 103.6 27 62.9 5.2 244.4 89.5 1700 0 0 841 19.8 102.7 28 63.1 6.1 238.7 89.9 1800 0 0 469 18.9 102.3 27 61.8 5.1 252.5 90.3 1900 0 0 128 21.1 97.8 34 65 3 188.2 90.6 2000 0 0 3 18.2 91.6 36 60.8 3.8 129.9 90.7 2100 0 0 0 15.7 94 29 56.8 5.3 120.3 90.8 2200 0 0 0 18.2 91.9 36 60.7 4 93.1 90.8 2300 0 0 0 20.3 83.4 52 63.9 2.7 53.5 90.6 2400 0 0 0 20.8 83.4 53 64.6 2.7 259.7 90.5
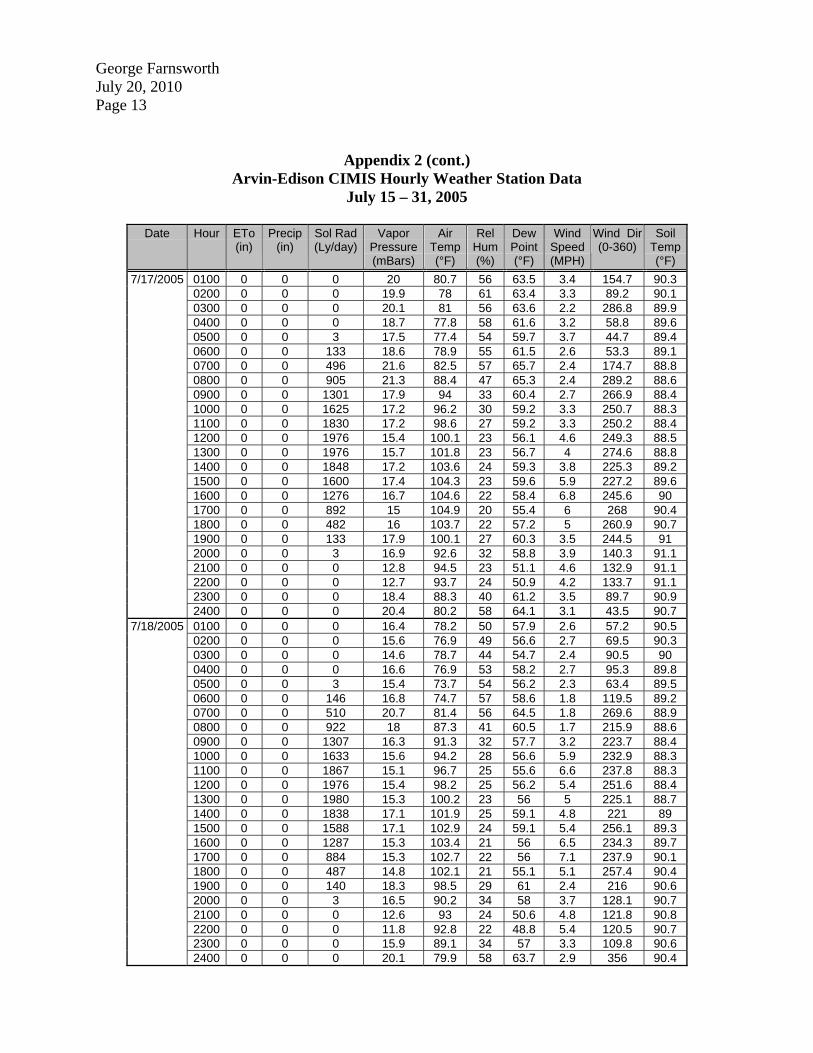
George Farnsworth July 20, 2010 Page 13
Appendix 2 (cont.) Arvin-Edison CIMIS Hourly Weather Station Data
July 15 – 31, 2005
Date Hour ETo (in)
Precip (in)
Sol Rad (Ly/day)
Vapor Pressure (mBars)
Air Temp (°F)
Rel Hum (%)
Dew Point (°F)
Wind Speed (MPH)
Wind Dir (0-360)
Soil Temp (°F)
7/17/2005 0100 0 0 0 20 80.7 56 63.5 3.4 154.7 90.3 0200 0 0 0 19.9 78 61 63.4 3.3 89.2 90.1 0300 0 0 0 20.1 81 56 63.6 2.2 286.8 89.9 0400 0 0 0 18.7 77.8 58 61.6 3.2 58.8 89.6 0500 0 0 3 17.5 77.4 54 59.7 3.7 44.7 89.4 0600 0 0 133 18.6 78.9 55 61.5 2.6 53.3 89.1 0700 0 0 496 21.6 82.5 57 65.7 2.4 174.7 88.8 0800 0 0 905 21.3 88.4 47 65.3 2.4 289.2 88.6 0900 0 0 1301 17.9 94 33 60.4 2.7 266.9 88.4 1000 0 0 1625 17.2 96.2 30 59.2 3.3 250.7 88.3 1100 0 0 1830 17.2 98.6 27 59.2 3.3 250.2 88.4 1200 0 0 1976 15.4 100.1 23 56.1 4.6 249.3 88.5 1300 0 0 1976 15.7 101.8 23 56.7 4 274.6 88.8 1400 0 0 1848 17.2 103.6 24 59.3 3.8 225.3 89.2 1500 0 0 1600 17.4 104.3 23 59.6 5.9 227.2 89.6 1600 0 0 1276 16.7 104.6 22 58.4 6.8 245.6 90 1700 0 0 892 15 104.9 20 55.4 6 268 90.4 1800 0 0 482 16 103.7 22 57.2 5 260.9 90.7 1900 0 0 133 17.9 100.1 27 60.3 3.5 244.5 91 2000 0 0 3 16.9 92.6 32 58.8 3.9 140.3 91.1 2100 0 0 0 12.8 94.5 23 51.1 4.6 132.9 91.1 2200 0 0 0 12.7 93.7 24 50.9 4.2 133.7 91.1 2300 0 0 0 18.4 88.3 40 61.2 3.5 89.7 90.9 2400 0 0 0 20.4 80.2 58 64.1 3.1 43.5 90.7
7/18/2005 0100 0 0 0 16.4 78.2 50 57.9 2.6 57.2 90.5 0200 0 0 0 15.6 76.9 49 56.6 2.7 69.5 90.3 0300 0 0 0 14.6 78.7 44 54.7 2.4 90.5 90 0400 0 0 0 16.6 76.9 53 58.2 2.7 95.3 89.8 0500 0 0 3 15.4 73.7 54 56.2 2.3 63.4 89.5 0600 0 0 146 16.8 74.7 57 58.6 1.8 119.5 89.2 0700 0 0 510 20.7 81.4 56 64.5 1.8 269.6 88.9 0800 0 0 922 18 87.3 41 60.5 1.7 215.9 88.6 0900 0 0 1307 16.3 91.3 32 57.7 3.2 223.7 88.4 1000 0 0 1633 15.6 94.2 28 56.6 5.9 232.9 88.3 1100 0 0 1867 15.1 96.7 25 55.6 6.6 237.8 88.3 1200 0 0 1976 15.4 98.2 25 56.2 5.4 251.6 88.4 1300 0 0 1980 15.3 100.2 23 56 5 225.1 88.7 1400 0 0 1838 17.1 101.9 25 59.1 4.8 221 89 1500 0 0 1588 17.1 102.9 24 59.1 5.4 256.1 89.3 1600 0 0 1287 15.3 103.4 21 56 6.5 234.3 89.7 1700 0 0 884 15.3 102.7 22 56 7.1 237.9 90.1 1800 0 0 487 14.8 102.1 21 55.1 5.1 257.4 90.4 1900 0 0 140 18.3 98.5 29 61 2.4 216 90.6 2000 0 0 3 16.5 90.2 34 58 3.7 128.1 90.7 2100 0 0 0 12.6 93 24 50.6 4.8 121.8 90.8 2200 0 0 0 11.8 92.8 22 48.8 5.4 120.5 90.7 2300 0 0 0 15.9 89.1 34 57 3.3 109.8 90.6 2400 0 0 0 20.1 79.9 58 63.7 2.9 356 90.4

George Farnsworth July 20, 2010 Page 14
Appendix 2 (cont.) Arvin-Edison CIMIS Hourly Weather Station Data
July 15 – 31, 2005
Date Hour ETo (in)
Precip (in)
Sol Rad (Ly/day)
Vapor Pressure (mBars)
Air Temp (°F)
Rel Hum (%)
Dew Point (°F)
Wind Speed (MPH)
Wind Dir (0-360)
Soil Temp (°F)
7/19/2005 0100 0 0 0 16 77.3 50 57.2 2.9 61.6 90.2 0200 0 0 0 15.3 78.5 46 56 2.2 115.1 90 0300 0 0 0 16.5 78 50 58 2.4 116.6 89.7 0400 0 0 0 17.2 76.9 55 59.3 2.8 102.3 89.5 0500 0 0 3 15.6 73.3 56 56.5 3 54.5 89.2 0600 0 0 134 16 74.8 54 57.3 2.5 57.3 88.9 0700 0 0 488 18.3 81.7 49 61 3 22.6 88.6 0800 0 0 898 17.5 86.4 41 59.7 2.8 325.8 88.4 0900 0 0 1285 17.4 88.7 38 59.5 2.5 272.1 88.2 1000 0 0 1592 16.7 91.2 33 58.4 2.8 262 88.1 1100 0 0 1846 15.4 93.5 29 56.1 3.8 266.8 88.1 1200 0 0 1964 13.8 95.8 24 53.2 3.1 242.8 88.2 1300 0 0 1962 13.4 98.3 21 52.3 3.3 239.8 88.4 1400 0 0 1840 12.7 99.9 19 50.8 4.4 198.4 88.8 1500 0 0 1596 12 101 18 49.4 4.4 208.2 89.2 1600 0 0 1259 12.3 102 18 50.1 4.3 252.5 89.6 1700 0 0 866 13.6 101.8 20 52.8 4.8 245.3 89.9 1800 0 0 461 13.8 101 20 53.1 4.4 255 90.3 1900 0 0 120 17.7 96.9 30 60 3.3 235.9 90.5 2000 0 0 3 16.1 89 35 57.4 3.6 121.6 90.7 2100 0 0 0 13 90.5 27 51.6 4.1 119.5 90.7 2200 0 0 0 14.4 91 29 54.3 4 115 90.7 2300 0 0 0 17.5 84.5 43 59.7 3 12.7 90.5 2400 0 0 0 19.5 80 56 62.7 2.9 216.8 90.4
7/20/2005 0100 0 0 0 17.2 81.9 46 59.2 6.4 199.4 90.2 0200 0 0 0 16.6 82.9 43 58.2 5.7 206.1 90 0300 0 0 0 16.3 78.3 49 57.8 2.3 75.3 89.7 0400 0 0 0 16.5 76.6 53 58 2.8 126 89.5 0500 0 0 2 16.2 75 54 57.5 2.8 94.8 89.2 0600 0 0 132 17 74.3 59 59 2.4 71.3 89 0700 0 0 472 18.4 82.7 48 61.2 2.5 22 88.7 0800 0 0 890 16.3 88 36 57.7 3.6 345.6 88.5 0900 0 0 1279 14.7 90.7 30 54.8 3.1 267.3 88.3 1000 0 0 1596 15 92.3 29 55.5 3.4 248.4 88.2 1100 0 0 1815 15.5 94.2 28 56.3 3.7 238.6 88.2 1200 0 0 1951 15.8 96.6 27 56.9 3.3 265.2 88.3 1300 0 0 1945 15 98.8 24 55.5 3.6 251.5 88.6 1400 0 0 1803 15.8 99.7 24 56.9 3.4 261.3 88.9 1500 0 0 1565 15.9 101.2 23 57.1 3.1 280 89.3 1600 0 0 962 17.1 101.4 25 59 3.1 217.5 89.7 1700 0 0 571 18.9 99.4 29 61.9 4.2 199.3 90.5 1800 0 0 223 20.6 97.4 34 64.3 3.1 216.3 93 1900 0 0 48 21.8 93.1 41 66 2.6 147.4 92.4 2000 0 0 1 19 90.7 38 62 2.9 117.2 90.8 2100 0 0 0 15.2 92.9 29 55.8 4.2 113.4 89.1 2200 0 0 0 17 91.1 34 58.9 3.3 144.4 87.6 2300 0 0 0 20.7 87.6 46 64.5 2.8 300.2 86.5 2400 0 0 0 21.9 84.8 54 66.2 4.7 173.3 86.2

George Farnsworth July 20, 2010 Page 15
Appendix 2 (cont.) Arvin-Edison CIMIS Hourly Weather Station Data
July 15 – 31, 2005
Date Hour ETo (in)
Precip (in)
Sol Rad (Ly/day)
Vapor Pressure (mBars)
Air Temp (°F)
Rel Hum (%)
Dew Point (°F)
Wind Speed (MPH)
Wind Dir (0-360)
Soil Temp (°F)
7/21/2005 0100 0 0 0 20 84.6 49 63.6 6.4 196.3 86.3 0200 0 0 0 19.8 82.5 52 63.3 2.6 352.4 86.3 0300 0 0 0 18.8 79 56 61.7 2.5 61.4 86.4 0400 0 0 0 19.1 78.4 58 62.2 2.6 120.2 86.4 0500 0 0 2 18.8 77.2 59 61.7 2.5 63.5 86.4 0600 0 0 123 18.8 77.5 58 61.7 2.7 75.9 86.4 0700 0 0 447 22.8 85.2 55 67.3 1.5 20.8 86.3 0800 0 0 882 18.2 89.9 38 60.9 2.8 323.6 86.3 0900 0 0 1218 17.9 91.3 36 60.3 2.8 231.8 86.3 1000 0 0 1569 17.6 93.8 33 59.9 2.9 227.3 86.3 1100 0 0 1811 17.9 95.9 31 60.3 3.1 247 86.5 1200 0 0 1933 17.6 98 29 59.8 3 251.1 86.8 1300 0 0 1937 17.1 100 26 59.1 3.7 231.8 87.3 1400 0 0 1803 16.7 102 24 58.4 3.9 246.5 87.8 1500 0 0 1563 15.3 103.4 21 56 4.8 256.7 88.3 1600 0 0 1245 15 104 20 55.5 5.3 261.4 88.9 1700 0 0 888 15.9 103.6 22 57.1 6.3 273.4 89.4 1800 0 0 438 17.6 101.9 25 59.9 6.1 251.3 89.8 1900 0 0 81 19.9 96.7 34 63.4 4.1 188.4 90.1 2000 0 0 2 18.4 93.5 34 61.1 4.1 178.9 90.3 2100 0 0 0 19.8 91 40 63.2 4.9 198.4 90.4 2200 0 0 0 20 88.4 44 63.4 5.8 182.7 90.4 2300 0 0 0 20 87 46 63.5 6 200.2 90.3 2400 0 0 0 20.9 84.2 52 64.7 6.6 207.8 90.1
7/22/2005 0100 0 0 0 20.3 82.1 54 64 3 189.9 89.9 0200 0 0 0 21.3 80.9 59 65.3 1.8 201.9 89.7 0300 0 0 0 21.7 78.9 64 65.8 2.5 172.7 89.5 0400 0 0 0 21.5 76.2 69 65.5 4.1 169.1 89.3 0500 0 0 2 21 74.8 71 64.9 4.2 184.9 89.1 0600 0 0 104 20.7 74.5 71 64.5 5.6 200.1 88.8 0700 0 0 442 19.9 76.1 65 63.4 6.5 219.6 88.6 0800 0 0 847 19.8 78 60 63.2 5.8 222.8 88.4 0900 0 0 1238 19.4 81.1 54 62.6 5.3 232.7 88.2 1000 0 0 1557 19.6 84.1 49 63 3.5 259.3 88 1100 0 0 1809 19.8 86.5 46 63.2 3.1 256.8 88 1200 0 0 1929 20 89.3 43 63.5 3.1 266.5 88.1 1300 0 0 1927 20.3 91.9 40 64 3.6 219.2 88.3 1400 0 0 1809 20.1 94.2 37 63.6 3.7 260.7 88.6 1500 0 0 1565 20.1 95.4 35 63.6 4.7 233.3 89 1600 0 0 1232 19.8 96.8 33 63.2 4.2 236.4 89.5 1700 0 0 839 19.8 97.3 33 63.2 4.7 254.7 89.9 1800 0 0 429 19.8 96.4 34 63.3 5 264 90.2 1900 0 0 117 21.1 93.5 39 65 4.8 262.3 90.5 2000 0 0 2 20.8 89.7 44 64.6 2.8 162.7 90.7 2100 0 0 0 21.5 85.3 52 65.5 2.1 84.3 90.7 2200 0 0 0 20.3 84.8 50 63.9 3.2 140.3 90.7 2300 0 0 0 22.5 81 62 66.9 2.5 156.6 90.6 2400 0 0 0 22.3 80.9 62 66.7 3.3 176.3 90.4

George Farnsworth July 20, 2010 Page 16
Appendix 2 (cont.) Arvin-Edison CIMIS Hourly Weather Station Data
July 15 – 31, 2005
Date Hour ETo (in)
Precip (in)
Sol Rad (Ly/day)
Vapor Pressure (mBars)
Air Temp (°F)
Rel Hum (%)
Dew Point (°F)
Wind Speed (MPH)
Wind Dir (0-360)
Soil Temp (°F)
7/23/2005 0100 0 0 0 21.6 79.4 63 65.7 6 198.2 90.3 0200 0 0 0 19.9 78.8 59 63.4 3.3 188.9 90.1 0300 0 0 0 20.1 75.6 66 63.6 2.2 66.7 89.8 0400 0 0 0 19.6 74.3 68 62.9 2.4 132.1 89.6 0500 0 0 1 19.5 72.4 72 62.8 2 74.1 89.3 0600 0 0 114 19.5 72.7 71 62.8 2.5 97.9 89.1 0700 0 0 466 21.5 79.2 63 65.5 2 162.8 88.8 0800 0 0 879 18.9 84.2 47 61.9 2.3 239.3 88.6 0900 0 0 1269 15.9 86.1 37 57.1 3.8 240.8 88.4 1000 0 0 1582 14.9 88.2 33 55.3 4.2 241.3 88.3 1100 0 0 1825 15.7 90.2 32 56.7 3.2 221.3 88.3 1200 0 0 1933 17.6 91.9 34 59.9 3.8 262.5 88.4 1300 0 0 1927 17.3 93.7 32 59.3 3.9 220.7 88.7 1400 0 0 1809 17.7 96 30 60 3.3 250.3 89.1 1500 0 0 1615 18.4 97.5 30 61.2 4.1 238.7 89.5 1600 0 0 1247 18.1 98.3 29 60.7 4.6 238.8 89.9 1700 0 0 870 18.3 98.4 29 61 5.7 236.5 90.3 1800 0 0 513 17.8 98.5 28 60.2 3.8 259.1 90.7 1900 0 0 143 18.9 96.6 32 61.9 3.9 257.3 90.9 2000 0 0 2 20.2 90.4 42 63.8 3.8 184.9 91.1 2100 0 0 0 18.5 86.6 43 61.3 3.7 95.7 91.1 2200 0 0 0 19.7 83.4 50 63 3 37.1 91.1 2300 0 0 0 18.7 84.2 47 61.6 3.8 117.6 91 2400 0 0 0 20.4 83.6 52 64 2.9 319 90.9
7/24/2005 0100 0 0 0 19.9 78.9 59 63.3 2.9 48.7 90.6 0200 0 0 0 19.4 79 57 62.7 3.6 36.4 90.4 0300 0 0 0 20.4 77.4 64 64.1 3.4 92.1 90.2 0400 0 0 0 19.1 77.8 59 62.1 3.2 62.7 90 0500 0 0 1 21.3 75.6 70 65.2 2.6 101.3 89.7 0600 0 0 114 20.1 76.6 64 63.6 2.8 65.5 89.5 0700 0 0 454 20.1 84.2 50 63.6 2.7 22.5 89.2 0800 0 0 842 18.6 88.7 40 61.4 2.7 290.1 89 0900 0 0 1200 18 90.6 37 60.5 2.6 227.8 88.8 1000 0 0 1561 18 92.5 34 60.5 4.4 219.5 88.8 1100 0 0 1751 16.1 94.9 29 57.4 5.4 244.2 88.8 1200 0 0 1910 15.6 96.5 27 56.6 4.7 269.5 89 1300 0 0 1912 17.8 98.4 29 60.2 4.5 258.4 89.2 1400 0 0 1803 15.8 100.1 24 56.9 5.3 281.3 89.6 1500 0 0 1567 14.2 100.9 21 54 5.1 239.3 89.9 1600 0 0 1235 14.1 101.6 21 53.7 4.8 204.8 90.3 1700 0 0 791 14.3 100.9 21 54.1 6.6 203.5 90.7 1800 0 0 443 16.5 98.8 26 58.1 5.9 194.8 91 1900 0 0 120 16.3 95.3 29 57.7 5.2 178.1 91.2 2000 0 0 2 15.1 91.1 30 55.7 3.8 159.5 91.3 2100 0 0 0 15.7 88.6 34 56.7 4.3 182.7 91.3 2200 0 0 0 15.3 86.6 35 56 3.6 163.9 91.2 2300 0 0 0 16 84.5 39 57.2 5.8 188.4 91.1 2400 0 0 0 16.9 84.3 42 58.7 5.7 193.5 90.9

George Farnsworth July 20, 2010 Page 17
Appendix 2 (cont.) Arvin-Edison CIMIS Hourly Weather Station Data
July 15 – 31, 2005
Date Hour ETo (in)
Precip (in)
Sol Rad (Ly/day)
Vapor Pressure (mBars)
Air Temp (°F)
Rel Hum (%)
Dew Point (°F)
Wind Speed (MPH)
Wind Dir (0-360)
Soil Temp (°F)
7/25/2005 0100 0 0 0 16.5 82.3 44 58 3.1 156.3 90.6 0200 0 0 0 17 78.1 52 58.9 2.4 115.6 90.4 0300 0 0 0 16.9 77.3 53 58.8 1.9 133.5 90.1 0400 0 0 0 19 73.2 68 62.1 2.3 50.5 89.9 0500 0 0 2 16.7 72.4 61 58.4 2.7 96.5 89.6 0600 0 0 120 16.1 74.7 55 57.4 2.8 58.1 89.3 0700 0 0 488 19.1 80.4 54 62.2 3 345.1 89 0800 0 0 906 19.4 84.9 47 62.6 1.8 224.4 88.8 0900 0 0 1309 15.7 88.3 34 56.7 3.4 261.4 88.6 1000 0 0 1646 13.8 91.1 28 53.2 3.2 280.3 88.4 1100 0 0 1838 13.5 92.5 26 52.6 4.6 276.7 88.5 1200 0 0 1960 13.1 94.7 24 51.7 3.9 271.2 88.6 1300 0 0 1962 12.1 96.5 21 49.6 4.3 282.9 88.9 1400 0 0 1867 11.6 97.9 19 48.4 4.6 273.1 89.3 1500 0 0 1646 11 99.2 17 47.2 4.5 266.2 89.7 1600 0 0 1318 11.2 99.9 17 47.6 5 246.3 90 1700 0 0 927 10.8 99.9 17 46.7 5.4 272.3 90.4 1800 0 0 512 11.5 98.9 18 48.3 5.1 259.8 90.7 1900 0 0 140 13.9 94.4 25 53.3 3 216.1 91 2000 0 0 2 13 85.7 31 51.5 4.2 133.3 91 2100 0 0 0 9.1 88.9 20 42.2 5.5 131.6 91 2200 0 0 0 11.7 83.4 30 48.6 3.7 160.6 90.9 2300 0 0 0 11.3 82.6 30 47.7 3.9 158.9 90.7 2400 0 0 0 13.2 78 40 51.9 3.1 127.2 90.5
7/26/2005 0100 0 0 0 12.9 73.2 46 51.2 3.6 59.5 90.2 0200 0 0 0 12.3 72.4 45 50.1 3.1 67.7 89.9 0300 0 0 0 14.3 68.7 60 54.2 2.8 55.6 89.6 0400 0 0 0 14.9 67.7 64 55.2 1.6 73.6 89.3 0500 0 0 1 14.7 67 65 54.8 2.7 163.1 89 0600 0 0 124 14.8 67.7 64 55 3.1 121.4 88.7 0700 0 0 502 16 74.1 56 57.2 3 52.1 88.4 0800 0 0 923 14.2 83.1 37 54 2.4 353.3 88.1 0900 0 0 1317 13.2 86.7 30 52 3 242 87.8 1000 0 0 1625 13.2 90.1 27 51.9 3.1 231.7 87.7 1100 0 0 1859 13.5 92.3 26 52.5 4.3 260.4 87.7 1200 0 0 1875 12 94.5 22 49.3 3.8 224.6 87.8 1300 0 0 1972 12 96.9 20 49.4 3.6 251 88.1 1400 0 0 1848 11.2 99 18 47.6 4.2 250.6 88.4 1500 0 0 1594 11.8 99.9 18 48.9 5 249.4 88.8 1600 0 0 1263 11.8 100.6 18 48.8 4.8 244 89.3 1700 0 0 866 11.9 100.6 18 49.1 4.8 250.3 89.7 1800 0 0 457 13.2 99.7 20 51.9 3.7 229.8 90 1900 0 0 111 16.1 95.7 28 57.4 3.6 246.9 90.2 2000 0 0 2 14.6 87.4 33 54.6 3.9 127.2 90.4 2100 0 0 0 11.1 89.8 23 47.4 4.5 124.9 90.4 2200 0 0 0 17.5 81.2 48 59.7 3.6 31 90.3 2300 0 0 0 14 81.2 38 53.5 3 22 90.2 2400 0 0 0 15.7 78.2 47 56.6 3.1 29.3 90

George Farnsworth July 20, 2010 Page 18
Appendix 2 (cont.) Arvin-Edison CIMIS Hourly Weather Station Data
July 15 – 31, 2005
Date Hour ETo (in)
Precip (in)
Sol Rad (Ly/day)
Vapor Pressure (mBars)
Air Temp (°F)
Rel Hum (%)
Dew Point (°F)
Wind Speed (MPH)
Wind Dir (0-360)
Soil Temp (°F)
7/27/2005 0100 0 0 0 14.6 75.2 49 54.8 2.2 96.7 89.8 0200 0 0 0 16.4 72.4 60 57.9 2.3 68.6 89.5 0300 0 0 0 14.7 71.9 55 54.9 2.4 60.6 89.3 0400 0 0 0 12.6 72.6 46 50.6 2.8 57.4 89 0500 0 0 1 15.3 70 61 55.9 2.3 124.5 88.8 0600 0 0 111 14.9 71 57 55.2 2 73.8 88.5 0700 0 0 466 17.7 77.8 54 60 1.8 202.1 88.2 0800 0 0 879 14.7 83.4 38 54.9 2.9 231.2 88 0900 0 0 1270 13.5 86.9 31 52.6 3.5 216.9 87.8 1000 0 0 1559 13.9 90.7 28 53.3 2.9 211.2 87.7 1100 0 0 1825 14.4 92.9 27 54.3 4.3 241.3 87.7 1200 0 0 1898 14.6 94.8 26 54.7 4.3 242.5 87.9 1300 0 0 1920 13.6 96.8 23 52.7 3.8 254.5 88.1 1400 0 0 1809 13.7 99.1 22 53 3.3 203.5 88.5 1500 0 0 1592 13.5 100.7 20 52.6 3.6 248.2 88.8 1600 0 0 1254 13.7 101.9 20 52.9 3.8 220.3 89.3 1700 0 0 855 15.1 101.4 22 55.5 4.9 234.9 89.6 1800 0 0 456 15.2 99.9 23 55.8 6.1 251.5 90 1900 0 0 103 16.7 94.5 30 58.4 3.6 208.7 90.2 2000 0 0 1 14.9 89 32 55.2 3.6 138.4 90.4 2100 0 0 0 14.1 87.2 32 53.6 2.7 128.4 90.4 2200 0 0 0 16.4 84.3 41 57.8 2.3 107.9 90.4 2300 0 0 0 18.9 80.5 53 61.9 1.7 47.3 90.3 2400 0 0 0 15.8 80.4 45 56.9 2.9 146.4 90.1
7/28/2005 0100 0 0 0 14.5 80.4 41 54.4 4 178 89.9 0200 0 0 0 14.3 79.6 41 54.1 3.4 182.6 89.7 0300 0 0 0 14.9 74.8 51 55.3 1.5 54.3 89.5 0400 0 0 0 14.7 73 53 54.9 2.4 74.9 89.2 0500 0 0 1 14.4 71.9 54 54.3 2.2 72.9 89 0600 0 0 93 15.2 72.1 56 55.8 2.1 64.5 88.7 0700 0 0 426 16.3 80 47 57.7 2.1 29.4 88.5 0800 0 0 857 14.1 86.6 33 53.7 1.9 299 88.3 0900 0 0 1257 13.7 88.1 30 53 3.3 257.9 88.1 1000 0 0 1551 13.3 90.2 27 52.2 3.8 260.2 88 1100 0 0 1828 11.9 92.6 23 49.2 3.5 276.8 88 1200 0 0 1941 12 95 21 49.3 3.4 255.1 88.1 1300 0 0 1960 13.7 97.5 23 52.9 3.6 222.2 88.4 1400 0 0 1840 13.5 99.1 21 52.6 3.8 242.2 88.7 1500 0 0 1596 12.4 101 18 50.3 3.8 248.3 89.1 1600 0 0 1268 11.9 102 17 49.2 4.3 253.2 89.5 1700 0 0 859 13.5 101.3 20 52.5 6.5 233.2 89.9 1800 0 0 448 15.2 99.2 24 55.7 6.4 217 90.2 1900 0 0 99 16.7 93.9 31 58.4 4.6 181 90.4 2000 0 0 1 14.7 90.5 30 54.8 4.3 177.2 90.6 2100 0 0 0 15 87.7 33 55.5 3.4 178.2 90.6 2200 0 0 0 16.1 84.8 39 57.5 2.2 128.8 90.5 2300 0 0 0 16.9 79.9 49 58.8 3 83.9 90.3 2400 0 0 0 16 80.6 45 57.3 3.7 176 90.2
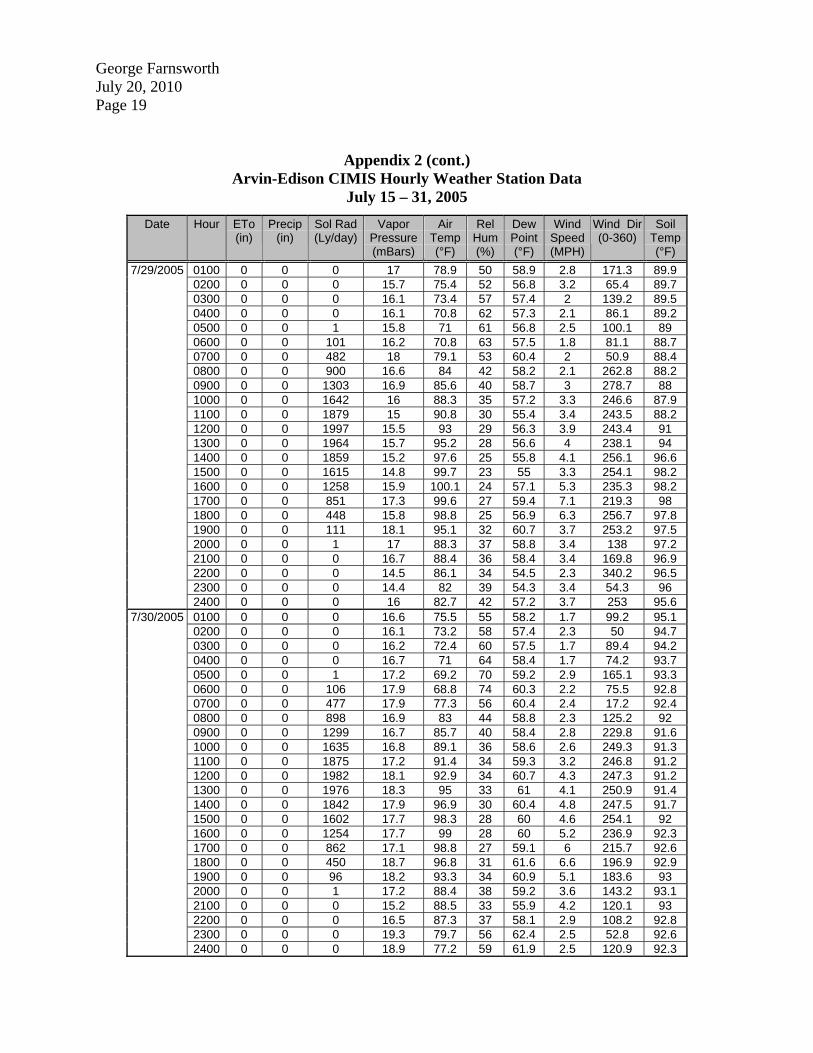
George Farnsworth July 20, 2010 Page 19
Appendix 2 (cont.) Arvin-Edison CIMIS Hourly Weather Station Data
July 15 – 31, 2005
Date Hour ETo (in)
Precip (in)
Sol Rad (Ly/day)
Vapor Pressure (mBars)
Air Temp (°F)
Rel Hum (%)
Dew Point (°F)
Wind Speed (MPH)
Wind Dir (0-360)
Soil Temp (°F)
7/29/2005 0100 0 0 0 17 78.9 50 58.9 2.8 171.3 89.9 0200 0 0 0 15.7 75.4 52 56.8 3.2 65.4 89.7 0300 0 0 0 16.1 73.4 57 57.4 2 139.2 89.5 0400 0 0 0 16.1 70.8 62 57.3 2.1 86.1 89.2 0500 0 0 1 15.8 71 61 56.8 2.5 100.1 89 0600 0 0 101 16.2 70.8 63 57.5 1.8 81.1 88.7 0700 0 0 482 18 79.1 53 60.4 2 50.9 88.4 0800 0 0 900 16.6 84 42 58.2 2.1 262.8 88.2 0900 0 0 1303 16.9 85.6 40 58.7 3 278.7 88 1000 0 0 1642 16 88.3 35 57.2 3.3 246.6 87.9 1100 0 0 1879 15 90.8 30 55.4 3.4 243.5 88.2 1200 0 0 1997 15.5 93 29 56.3 3.9 243.4 91 1300 0 0 1964 15.7 95.2 28 56.6 4 238.1 94 1400 0 0 1859 15.2 97.6 25 55.8 4.1 256.1 96.6 1500 0 0 1615 14.8 99.7 23 55 3.3 254.1 98.2 1600 0 0 1258 15.9 100.1 24 57.1 5.3 235.3 98.2 1700 0 0 851 17.3 99.6 27 59.4 7.1 219.3 98 1800 0 0 448 15.8 98.8 25 56.9 6.3 256.7 97.8 1900 0 0 111 18.1 95.1 32 60.7 3.7 253.2 97.5 2000 0 0 1 17 88.3 37 58.8 3.4 138 97.2 2100 0 0 0 16.7 88.4 36 58.4 3.4 169.8 96.9 2200 0 0 0 14.5 86.1 34 54.5 2.3 340.2 96.5 2300 0 0 0 14.4 82 39 54.3 3.4 54.3 96 2400 0 0 0 16 82.7 42 57.2 3.7 253 95.6
7/30/2005 0100 0 0 0 16.6 75.5 55 58.2 1.7 99.2 95.1 0200 0 0 0 16.1 73.2 58 57.4 2.3 50 94.7 0300 0 0 0 16.2 72.4 60 57.5 1.7 89.4 94.2 0400 0 0 0 16.7 71 64 58.4 1.7 74.2 93.7 0500 0 0 1 17.2 69.2 70 59.2 2.9 165.1 93.3 0600 0 0 106 17.9 68.8 74 60.3 2.2 75.5 92.8 0700 0 0 477 17.9 77.3 56 60.4 2.4 17.2 92.4 0800 0 0 898 16.9 83 44 58.8 2.3 125.2 92 0900 0 0 1299 16.7 85.7 40 58.4 2.8 229.8 91.6 1000 0 0 1635 16.8 89.1 36 58.6 2.6 249.3 91.3 1100 0 0 1875 17.2 91.4 34 59.3 3.2 246.8 91.2 1200 0 0 1982 18.1 92.9 34 60.7 4.3 247.3 91.2 1300 0 0 1976 18.3 95 33 61 4.1 250.9 91.4 1400 0 0 1842 17.9 96.9 30 60.4 4.8 247.5 91.7 1500 0 0 1602 17.7 98.3 28 60 4.6 254.1 92 1600 0 0 1254 17.7 99 28 60 5.2 236.9 92.3 1700 0 0 862 17.1 98.8 27 59.1 6 215.7 92.6 1800 0 0 450 18.7 96.8 31 61.6 6.6 196.9 92.9 1900 0 0 96 18.2 93.3 34 60.9 5.1 183.6 93 2000 0 0 1 17.2 88.4 38 59.2 3.6 143.2 93.1 2100 0 0 0 15.2 88.5 33 55.9 4.2 120.1 93 2200 0 0 0 16.5 87.3 37 58.1 2.9 108.2 92.8 2300 0 0 0 19.3 79.7 56 62.4 2.5 52.8 92.6 2400 0 0 0 18.9 77.2 59 61.9 2.5 120.9 92.3

George Farnsworth July 20, 2010 Page 20
Appendix 2 (cont.) Arvin-Edison CIMIS Hourly Weather Station Data
July 15 – 31, 2005
Date Hour ETo (in)
Precip (in)
Sol Rad (Ly/day)
Vapor Pressure (mBars)
Air Temp (°F)
Rel Hum (%)
Dew Point (°F)
Wind Speed (MPH)
Wind Dir (0-360)
Soil Temp (°F)
7/31/2005 0100 0 0 0 19 78.4 57 62 2.5 162.3 92.1 0200 0 0 0 20.6 75.1 69 64.3 2 34.5 91.8 0300 0 0 0 19 74.4 65 62 2.1 41 91.5 0400 0 0 0 18.8 73.1 68 61.8 2.1 40.5 91.2 0500 0 0 1 18.5 71.9 69 61.3 2.6 76.5 90.9 0600 0 0 100 18.9 72.7 69 61.9 2.8 71.4 90.6 0700 0 0 461 19.7 81 54 63 2.5 39.6 90.3 0800 0 0 886 17.6 86.3 41 59.9 2.9 285 90 0900 0 0 1285 17.4 87.8 39 59.5 4.3 219.5 89.8 1000 0 0 1619 18 90.2 37 60.5 4.2 236.8 89.6 1100 0 0 1869 17.5 92.4 34 59.7 3.8 271 89.6 1200 0 0 1972 18.1 93.9 33 60.6 4.3 242.3 89.7 1300 0 0 1987 18.2 96 31 60.7 3.9 235 90 1400 0 0 1852 18 98 29 60.5 4.4 185.9 90.3 1500 0 0 1611 17.5 99.5 27 59.7 5.6 206.4 90.6 1600 0 0 1283 16.8 100.4 25 58.6 5.9 225.7 91 1700 0 0 882 16.3 100.4 25 57.7 6.8 220.8 91.3 1800 0 0 451 18.1 98.1 29 60.7 7.6 211 91.6 1900 0 0 97 17.5 93.9 32 59.7 5.4 175 91.8 2000 0 0 1 15.9 90.4 33 57 3.6 164 91.9 2100 0 0 0 13.6 88.8 29 52.7 3.9 131.5 91.9 2200 0 0 0 13.1 89.6 28 51.7 4.8 144.7 91.7 2300 0 0 0 17.3 84.4 43 59.3 4.1 41.8 91.5 2400 0 0 0 17.1 77.5 53 59 3.6 69.9 91.3