Department of Parliamentary Services Parliament of Australia Budget 2012-13 Anne Holmes Richard...
48
Department of Parliamentary Services Parliament of Australia Budget 2012-13 Anne Holmes Richard Webb
-
Upload
garey-young -
Category
Documents
-
view
216 -
download
0
Transcript of Department of Parliamentary Services Parliament of Australia Budget 2012-13 Anne Holmes Richard...
Department of Parliamentary Services
Parliament of Australia
Budget 2012-13
Anne HolmesRichard Webb

Department of Parliamentary Services
Parliament of Australia
Fiscal Environment and Strategy
Anne HolmesDirector, Economics Section
Parliamentary Library

Department of Parliamentary Services
Parliament of Australia
Fiscal policy is limited Total Commonwealth spending in 2011-12 Budget:
– $366 billion
Increase in spending in 2011-12 Budget over 2011-12:– $16 billion
Increase in revenue in 2011-12 Budget:– $19 billion

Department of Parliamentary Services
Parliament of Australia
Medium term fiscal strategy aims at...
Budget surpluses, on average, over medium term
Taxation < 23.5 per cent of GDP
Improvement in Government’s net financial worth
Return to surplus by holding real growth in outlays to 2 per cent a year

Department of Parliamentary Services
Parliament of Australia
The fiscal situation
In 2010-11, the deficit was $49 billion, or 3.6 per cent of GDP
In the 2011-12 Budget, the deficit for 2011-12 was estimated to be $23 billion, or 1.5 per cent of GDP
In the mid-year economic and fiscal outlook, it was revised to $38.1 billion

Department of Parliamentary Services
Parliament of Australia
The fiscal situationSource Year referred
toDeficit/surplus % of GDP Forecast GDP
growth %2011-12 Budget
2010-11 - $49.4 billion -3.6 2.25 (actual)
2011-12 Budget
2011-12 - $22.6 billion - 1.5 4.0
2011-12 MYEFO
2011-12 - $37.1 billion - 2.5 3.25
2011-12 Budget
2012-13 + $3.5 billion + 0.2 3.75
2011-12 MYEFO
2012-13 + $1.5 billion + 0.1 3.25

Department of Parliamentary Services
Parliament of Australia
The macroeconomic environment Is a surplus desirable?
It depends: are the risks on the downside or the upside?
It’s a good thing to save in good times, against the possibility of bad times
The Australian economy looks to be in generally good shape
But there are some warning signs

Department of Parliamentary Services
Parliament of Australia
Positives
Unemployment at long term average
Jobs growth healthy
GDP growing at long term average
Investment high (though non-mining investment looks weak)
Interest rates relatively low

Department of Parliamentary Services
Parliament of Australia
Negatives - International
The US appears to be recovering
Eight European countries are in recession– highest unemployment for 15 years
China may be precarious – housing bubble – local government indebtedness
Department of Parliamentary Services
Parliament of Australia
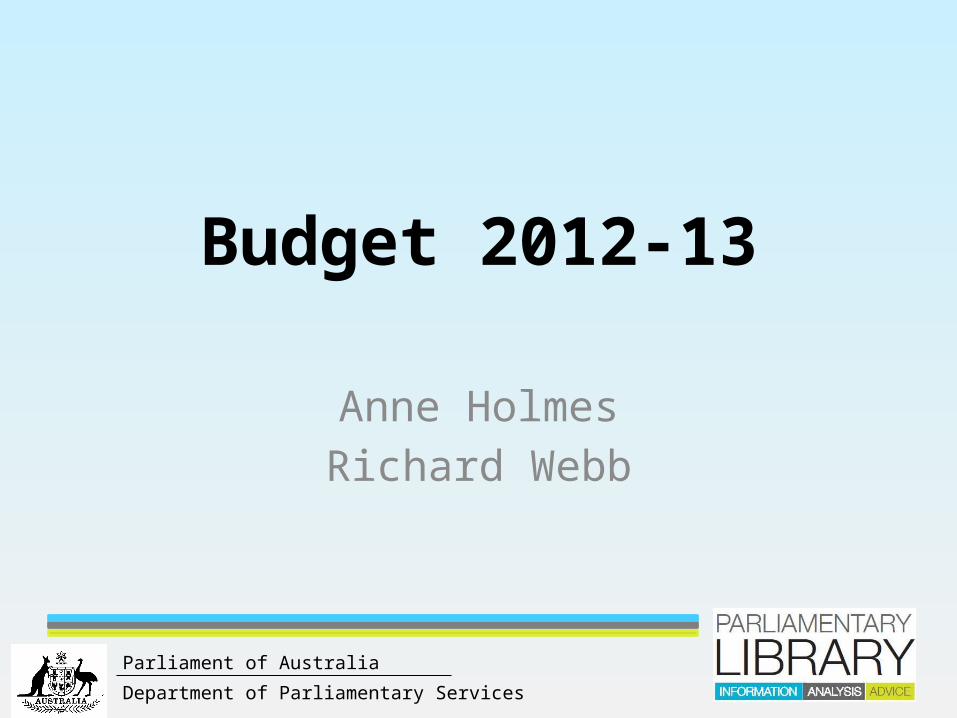
Negatives - Domestic Treasury revised its growth forecasts in MYEFO
– from 4 per cent to 3.25 per cent in 2011-12, and – from 3.75 per cent to 3.25 per cent in 2012-13
RBA has also revised down
Tax take was down by $20 billion across the forward estimates
Housing prices are flat or falling, sales slow
Service and manufacturing industries showed sharp contractions in April
Many industries have been hit by the high exchange rate

Department of Parliamentary Services
Parliament of Australia
A good time to be cautious...
...but what does caution look like?

Department of Parliamentary Services
Parliament of Australia
Budget Concepts and Measures
Richard WebbSenior Researcher, Economics Section
Parliamentary Library

Department of Parliamentary Services
Parliament of Australia
1. Budget concepts and measures1.1 Coverage
The public (whole of government) sector has three components:
general government sector public financial corporations, and public non-financial corporations.
The Budget covers the general government sector
the general government sector provides services that are mainly non-market in nature, mainly for the collective consumption of the community, and involve the redistribution of income. Examples of general government sector functions are defence, education, public order and safety, and the payment of ‘transfer payments’ such as disability pensions

Department of Parliamentary Services
Parliament of Australia
Public financial corporations provide various financial functions examples are the Reserve Bank of Australia and Medibank Private
Public non-financial corporations are bodies that the government owns or controls and which supply various services and undertake business activities
examples are Australia Post and the NBN
However, the Budget incorporates some transactions between the general government sector and the other two sectors
for example, on the revenue side, the general government sector receives dividends from Australia Post and the Reserve Bank, and
the government is injecting equity into the NBN

Department of Parliamentary Services
Parliament of Australia
1.2 How is the Budget deficit/surplus measured?
There are three measures of the Budget outcome in the Budget Papers: the headline cash balance the underlying cash balance, and the fiscal balance
The first two are cash measures the fiscal balance is an accrual measure (explain later)
Headline cash balance
This is net cash flows, that is, cash in and cash out and the resulting net cash position
Generally not referred to much in Budget discussions

Department of Parliamentary Services
Parliament of Australia
Underlying cash balance
The underlying cash balance is the measure that most commentators use
The underlying cash balance differs from the headline cash balance by excluding certain items from the headline balance
the purpose in doing so is to get a better idea of ‘business as usual’– removes net cash flows resulting from investment in and sales of financial assets (e.g.
investment in the NBN and, historically, Telstra sale)
The underlying cash balance was introduced when there were major asset sales (for example, sale of Telstra and Federal airport leases)
inclusion of the proceeds from these sales ‘distorted’ the headline cash balance
There is a reconciliation of the underlying cash balance and the headline cash balance in table 3 of statement 9 of Budget Paper No. 1
Fiscal balance (accrual)
The fiscal balance is the accrual counterpart to underlying cash balance
To explain the fiscal balance, it is necessary to explain the difference between cash and accrual accounting two examples: public service superannuation and asset purchases
Department of Parliamentary Services
Parliament of Australia
Public service superannuation
Under cash accounting, the only thing that is recorded on the expenses (expenditure) side is the amount actually paid to public servants
However, the liability for superannuation is increasing every year cash accounting thus recognises only part of the total superannuation expense
Accrual accounting recognises both the cash outlaid, and the increase in the liability (by a book entry)
Accrual accounting thus gives a superior measure of the superannuation expense in any one year
Asset purchases
Under cash accounting, the purchase of a major asset is treated as cash out
Accrual accounting recognises that an asset may yield services over several years accrual accounting brings the asset onto the balance sheet and writes it off over its lifetime as
depreciation
The jargon for expenditures measured in accrual terms is ‘expenses’
NOTE: most tables in the Budget papers are in accrual terms

Department of Parliamentary Services
Parliament of Australia
The Budget contains two financial statements—in accrual terms—for the general government sector operating statement balance sheet
The fiscal balance measure of the Budget outcome appears in the operating statement the operating statement is in statement 9 of Budget Paper No. 1

Department of Parliamentary Services
Parliament of Australia

Department of Parliamentary Services
Parliament of Australia
The fiscal balance has two components
net operating balance, and
net acquisition of non-financial assets (buildings, land etc)
– ‘other economic flows’ are essentially book entries and do not affect the fiscal balance

Department of Parliamentary Services
Parliament of Australia
1.3 Budget aggregates
The Budget aggregates are the underlying cash balance and the fiscal balance
they appear in statement 1 of Budget Paper No. 1
Note that in addition to the dollar amounts (billions), the aggregates are expressed as a percentage of gross domestic product (GDP)
the budget outcome expressed as a percentage of GDP is often the more relevant concept in discussions of the Budget than the size of the Budget outcome in dollar terms
NOTE: you can find an historical series of the underlying cash balance in dollar terms and as a percentage of GDP in statement 10 of Budget Paper No. 1 (goes back to 1970-71)

Department of Parliamentary Services
Parliament of Australia
1.4 Other Budget concepts
There are two other concepts that you may encounter in discussions of the Budget structural deficit and cyclical deficit
The reason I mention these two concepts is because some advocate eliminating the structural deficit as a policy objective
The structural component of the Budget is driven by policy decisions (discretionary fiscal policy) example of structural measure is the mining tax
The cyclical component of the budget is driven by fluctuations in economic activity fluctuations affect revenues and expenses
– revenue: for example, income and company tax revenue– expenses: for example, social security expenses (for example, unemployment benefits)

Department of Parliamentary Services
Parliament of Australia
Note that you can have situation where the Budget is in structural deficit but still be in surplus (as measured by the underlying cash balance and the fiscal balance) because the cyclical effect of increasing revenues more than offsets the structural deficit
The Budget Paper No. 1 normally does not include measures of the structural and cyclical components of a budget outcome
but statement 4 of Budget paper No. 1 for 2009-10 did
Problem: inherently very difficult to estimate the two components

Department of Parliamentary Services
Parliament of Australia
Finding Budget Information
Richard WebbSenior Researcher, Economics Section
Parliamentary Library

Department of Parliamentary Services
Parliament of Australia
2. Finding Budget information
The Budget speech
The Budget overview
The Budget Papers BP1: Budget Strategy and Outlook BP2: Budget Measures BP3: Australia’s Federal Relations BP4: Agency Resourcing
Portfolio Budget Statements main source of information on agency funding and activities
Other sources ministerial press releases and media kits

Department of Parliamentary Services
Parliament of Australia
2.1 Budget papers
Budget Paper No. 1: Budget strategy and outlookContains 10 statements
statement 1: budget overview statement 2: economic outlook statement 3: fiscal strategy and outlook statement 4: topic differs from year to year statement 5: revenue statement 6: expenses and net capital investment statement 7: asset and liability management statement 8: statement of risks statement 9: budget financial statements statement 10: historical Australian government data
Will look at only a few of these (based on experience of requests that the Library receives)
Statement 5: revenue
Main suggestion: look at the appendices especially Appendix A which contains details of revenue classified by source
The following table is accrual revenue

Department of Parliamentary Services
Parliament of Australia

Department of Parliamentary Services
Parliament of Australia
Statement 6: Expenses and Net Capital Investment
Statement 6 lists estimated expenses and net capital investment classified by function and sub-function
This is the contents page in Statement 6
Overview ..................................................................................................................... 6-3General government sector expenses ..................................................................... 6-4Reconciliation of expenses since the 2010-11 Budget ................................................ 6-4Estimated expenses by function .................................................................................. 6-5Major savings ............................................................................................................... 6-9Program expenses ..................................................................................................... 6-10General public services .............................................................................................. 6-12Defence ...................................................................................................................... 6-15Public order and safety .............................................................................................. 6-17Education ................................................................................................................... 6-18Health ......................................................................................................................... 6-21Social security and welfare ........................................................................................ 6-26Housing and community amenities ............................................................................ 6-31Recreation and culture ............................................................................................... 6-33Fuel and energy ......................................................................................................... 6-35Agriculture, forestry and fishing .................................................................................. 6-37Mining, manufacturing and construction .................................................................... 6-39Transport and communication .................................................................................... 6-40Other economic affairs ............................................................................................... 6-42Other purposes ........................................................................................................... 6-44General government net capital investment ......................................................... 6-46Reconciliation of net capital investment since the 2010-11 Budget ........................... 6-46Net capital investment estimates by function ............................................................. 6-48Trends in Australian Government staffing .................................................................. 6-51Appendix A: Expense by function and sub-function ................................................... 6-52Appendix B: The Contingency Reserve ..................................................................... 6-55Appendix C: Additional Agency Statistics .................................................................. 6-57

Department of Parliamentary Services
Parliament of Australia
The following are the tables for education expense sub-functions
Table 7: Summary of expenses — education

Department of Parliamentary Services
Parliament of Australia
Table 7.1: Trends in the major components of vocational and other education sub function expenses‑
Table 7.2: Trends in the major components of student assistance sub function expe‑ nses

Department of Parliamentary Services
Parliament of Australia
Net capital investment
The Commonwealth invests relatively little for its own purposes the main area of investment is defence
If newspaper articles are correct about cuts to defence expenditure, statement 6 is a good place to start for more information, go to the Defence portfolio budget statement
Note: Commonwealth funding for capital purposes such as schools and roads is treated as grants to the states as is thus an expense (under ‘other purposes’ function)
Statement 10: historical Australian government data
I mentioned earlier that you can find an historical series of the underlying cash balance in dollar terms and as a percentage of GDP in statement 10 of Budget Paper No. 1 (goes back to 1970-71)
Statement 10 also contains other historical data series such as net debt, interest payments and taxation receipts

Department of Parliamentary Services
Parliament of Australia
Budget Paper No. 2: Budget measures
This contains information on measures proposed in the Budget arranged by portfolio covers expense, revenue and capital measures as can be seen from the contents page
below
Note that BP 2 contains CHANGES to expenses, revenues and capital investment; it does not contain levels
you can find information on levels of expenditure in the Portfolio Budget Statements

Department of Parliamentary Services
Parliament of Australia
Part 1: Revenue Measures ........................................................................................... 1Agriculture, Fisheries and Forestry ................................................................................. 8Attorney-General's .......................................................................................................... 9Climate Change and Energy Efficiency ........................................................................ 10Education, Employment and Workplace Relations ....................................................... 11Immigration and Citizenship .......................................................................................... 12Treasury ........................................................................................................................ 13Part 2: Expense Measures .......................................................................................... 53Agriculture, Fisheries and Forestry ............................................................................... 86Attorney-General's ........................................................................................................ 94Broadband, Communications and the Digital Economy .............................................. 111Climate Change and Energy Efficiency ...................................................................... 121Cross Portfolio ............................................................................................................. 125Defence ....................................................................................................................... 126Education, Employment and Workplace Relations ..................................................... 131Families, Housing, Community Services and Indigenous Affairs ............................... 177Finance and Deregulation ........................................................................................... 199Foreign Affairs and Trade ........................................................................................... 201Health and Ageing ....................................................................................................... 211Human Services .......................................................................................................... 246Immigration and Citizenship ........................................................................................ 256Infrastructure and Transport ........................................................................................ 266Innovation, Industry, Science and Research .............................................................. 275Parliament ................................................................................................................... 282Prime Minister and Cabinet ......................................................................................... 284Regional Australia, Regional Development and Local Government ........................... 289Resources, Energy and Tourism ................................................................................. 298Sustainability, Environment, Water, Population and Communities ............................. 30

Department of Parliamentary Services
Parliament of Australia
The following is an example of an expense
Crime Stoppers Australia — continuation of funding
The Government will provide $2.0 million over four years to continue support for Crime Stoppers Australia Ltd. This funding will enable Crime Stoppers Australia to continue to provide community services including operation of the Crime Stoppers telephone hotline and initiatives to educate the community on crime reporting and prevention.
The tables show five years data the first column is for the past budget year the second column is for the current budget year, columns three, four and five are known as the forward years
Note: when ministers say how much will be spent on a particular program, they tend to quote four years figures, namely, for the Budget year plus the three forward years
Expense ($m)
2010 11‑ 2011-12 2012-13 2013-14 2014-15
Attorney General's Department ‑ -- 0.5 0.5 0.5 0.5

Department of Parliamentary Services
Parliament of Australia
Budget Paper No. 3: Australia’s Federal relationsBP3 contains information on payments to the states
Foreword ....................................................................................................................... iiiExecutive Summary ...................................................................................................... 1Part 1: Australia’s Federal Relations .......................................................................... 3Overview ......................................................................................................................... 3Major Government reforms and new developments ....................................................... 4COAG agenda ............................................................................................................... 10Reviews relating to Commonwealth-State relations ..................................................... 10Total payments to the States ........................................................................................ 12Part 2: Payments for Specific Purposes ................................................................... 17Overview of payments ................................................................................................... 17Health ............................................................................................................................ 22Education ..................................................................................................................... 48Skills and workforce development ................................................................................. 59Community services ...................................................................................................... 63Affordable housing ........................................................................................................ 70Infrastructure ................................................................................................................. 74Environment .................................................................................................................. 87Contingent payments .................................................................................................... 92Other national partnership payments ............................................................................ 94Financial assistance grants to local government ........................................................ 101Part 3: General Revenue Assistance ...................................................................... 103Overview of payments ................................................................................................. 103GST payments to States ............................................................................................. 103Other general revenue assistance .............................................................................. 110Mirror tax arrangements .............................................................................................. 112Part 4: Developments in the Consolidated Non-financial Public Sector ............ 113Introduction .................................................................................................................. 113Net operating balance ................................................................................................. 114Fiscal and cash balances ............................................................................................ 115Net debt ....................................................................................................................... 117Net interest payments ................................................................................................. 118The Australian Loan Council ....................................................................................... 119

Department of Parliamentary Services
Parliament of Australia
Payments to the states (and territories and local governments) take two forms: specific purpose payments and general revenue assistance
Specific purpose payments
These are payments made to fund a variety of activities that the states undertake such as health and education
a feature of specific purpose payments (SPPs) is that the states must spend the money on the purposes for which funds are allocated
There are several categories of SPPs as shown in the following summary table for health

Department of Parliamentary Services
Parliament of Australia
Table 2.3: Payments to support state health services
There are many more detailed tables about particular initiatives such as the following
Four hour national access target for emergency departments — capital funding component

Department of Parliamentary Services
Parliament of Australia
General revenue assistance
The following table shows general revenue assistance a feature of general revenue assistance is that unlike SPPs, the states can spend the funds
as they wish
GST is the main component of general revenue assistance
Table 3.1: General revenue assistance

Department of Parliamentary Services
Parliament of Australia
The following table shows each state’s GST entitlement
Table 3.9: Distribution of the GST entitlement pool over budget year and forward estimates

Department of Parliamentary Services
Parliament of Australia
Budget Paper No. 4: agency resourcing
Contains an introduction summary of special appropriations summary of special accounts, and agency resourcing
– that’s another way of saying the sources of funding for each agency and how it will be spent
I STRONGLY RECOMMEND READING THE INTRODUCTION
it summarises how the system of appropriations operates and explains the terminology used, for example, annual appropriations, special appropriations, and departmental and administered expenses
I will talk about special appropriations and special accounts in the next section which deals with portfolio budget statements

Department of Parliamentary Services
Parliament of Australia
2.2 Portfolio Budget Statements (PBS)
The PBS contains information on the budget of each agency, that is, where the money comes from and where it goes
The PBS contain a summary of the budget for each agency called the agency resource statement
2.2.1 Where does the money come from?
Two broad categories of revenue revenue from government and own-source income
Dealing with own-source income first: broadly falls into two categories sale of goods and services
– an example is Department of Immigration passport fees other (for example, rents, insurance)
Revenue from government: three main sources annual appropriations special appropriations
– special accounts

Department of Parliamentary Services
Parliament of Australia
Annual appropriations
Annual appropriations account for probably less than 20 per cent of total Budget funding
Constitutional requirements that there be two annual appropriation Bills section 53 provides that the Senate may not amend proposed laws appropriating money
for the ordinary annual services of the government under section 54, a proposed law appropriating money for the ordinary annual services
of the government can deal only with such appropriations.
Hence the annual appropriations are split into two Bills that provide for (a) the ordinary annual services of the government and (b) ‘other’ services
payments for ordinary annual services are authorised under Appropriation Bill (No. 1) payments for other services are authorised under Appropriation Bill (No. 2)
Nobody really knows what ordinary annual services are but essentially they are for on-going programs not authorised by special appropriations
most of the ordinary annual services funding is for departmental expenses (I’ll explain this term later)
but some programs are funded under Appropriation Bill (No. 1) examples are the Bass Strait passenger vehicle subsidy scheme and the LPG conversion
scheme for cars

Department of Parliamentary Services
Parliament of Australia
Examples of ‘other’ services under Appropriation Bill (No. 2) include so-called 'non operating' costs such as an equity injections into agencies to allow them ‑
to buy major assets administered expenses (I’ll explain later) for new outcomes
– after a new outcome has been financed once under Appropriation Bill (No. 2), it is financed under Appropriation Bill (No. 1), that is, it becomes an ordinary annual service
Special appropriations
The great majority of spending is authorised by special appropriations (perhaps about 80 per cent) a special appropriation is a provision within an Act that provides authority to spend
money for particular purposes, for example, to finance a particular project or to make social security payments
Most special appropriations are limited by criteria/entitlement examples are most social welfare payments such as age and disability pensions and most
payments to the states such appropriations are open-ended in the sense that the amounts are not limited note that as a consequence, most of the figures in the Budget are estimates and depend
on assumptions of growth, unemployment, inflation etc

Department of Parliamentary Services
Parliament of Australia
Special accounts
A special account is an appropriation mechanism that sets aside an amount to be expended for a specific purpose examples are the national cattle disease eradication account, the international marketing of education account,
and the Murray-Darling basin account
All monies received and paid for the specific purpose pass through the special account
The money that goes into special accounts comes from annual and special appropriations
I will illustrate the above using the Department of Resources agency resource statement in a minute
But before I do that, I need to introduce two terms departmental expenses and administered expenses
Departmental expenses are the costs of running programs examples are employee benefits, supplies, and depreciation
– a feature of departmental expenses is that any unspent amounts can be carried over into future years– this can happen, for example, if there are delays in implementing programs

Department of Parliamentary Services
Parliament of Australia
Administered expenses are the payments made under the programs examples are age and disability support pensions
Now turn to the Department of Resources agency resource statementEstimate Proposed Total Actualof prior + at Budget = estimate available
year amounts appropriation available in
2011-12 2011-12 2011-12 2010-11$'000 $'000 $'000 $'000
Ordinary annual services1
Departmental appropriationPrior year departmental appropriation2 16,489 16,489 Departmental appropriation3 100,432 100,432 84,661 Total 16,489 100,432 116,921 84,661
Administered expensesOutcome 14 690,006 690,006 686,155 Payments to CAC Act bodies 136,821 136,821 122,920
Total 826,827 826,827 809,075
Total ordinary annual services A 16,489 927,259 943,748 893,736
Other services5
Departmental non-operatingEquity injections 1,878 4,963 6,841 1,878 Previous Years' OutputsTotal 1,878 4,963 6,841 1,878
Administered non-operatingAdministered assets and liabilities 5,300 5,300 6,400 Payments to CAC Act bodies -
non-operating 13,181 Total 5,300 5,300 19,581
Total other services B 5,300 4,963 5,300 21,459
Total available annual appropriations 21,789 932,222 949,048 915,195
Department of Parliamentary Services
Parliament of Australia
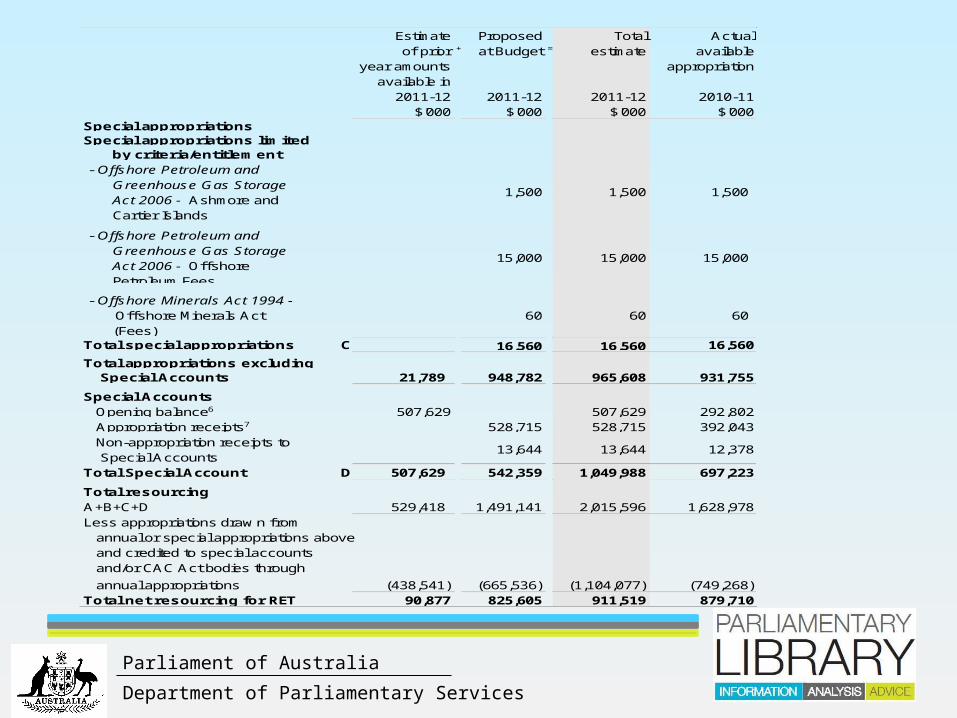
Estimate Proposed Total Actualof prior + at Budget = estimate available
year amounts appropriation available in
2011-12 2011-12 2011-12 2010-11$'000 $'000 $'000 $'000
Special appropriationsSpecial appropriations limited
by criteria/entitlement - Offshore Petroleum and Greenhouse Gas Storage Act 2006 - Ashmore and Cartier Islands
1,500 1,500 1,500
- Offshore Petroleum and Greenhouse Gas Storage Act 2006 - Offshore Petroleum Fees
15,000 15,000 15,000
- Offshore Minerals Act 1994 - Offshore Minerals Act (Fees)
60 60 60
Total special appropriations C 16,560 16,560 16,560
Total appropriations excluding Special Accounts 21,789 948,782 965,608 931,755
Special AccountsOpening balance6 507,629 507,629 292,802Appropriation receipts7 528,715 528,715 392,043Non-appropriation receipts to Special Accounts
Total Special Account D 507,629 542,359 1,049,988 697,223
Total resourcingA+B+C+D 529,418 1,491,141 2,015,596 1,628,978Less appropriations draw n from
annual or special appropriations aboveand credited to special accountsand/or CAC Act bodies through
annual appropriations (438,541) (665,536) (1,104,077) (749,268) Total net resourcing for RET 90,877 825,605 911,519 879,710
12,37813,644 13,644

Department of Parliamentary Services
Parliament of Australia
2.2.2 Where does the money go?
Expenses are classified by outcomes outcomes consist of programs and sub-programs
For example, the Department of Immigration has six outcomes outcome 1 deals with migration
– program 1.1 (visa and migration) is a program– there are several sub-programs such as 1.1.1 (visa and migration-service delivery)
Expenses incurred for outcomes/programs/sub-programs fall into two categories: departmental Administered
Departmental expenses are the costs of running programs
Administered expenses are the payments made under the programs
Departmental and administered expenses are allocated to each outcome/program/sub-program so that each is fully costed

Department of Parliamentary Services
Parliament of Australia
The following example is the expenses for program two (resources-related initiatives and management) for the Department of Resources
2010-11 2011-12 2012-13 2013-14 2014-15Revised Budget Forw ard Forw ard Forw ardbudget year 1 year 2 year 3
$'000 $'000 $'000 $'000 $'000Annual administered expenses:
- Ethanol Production Subsidy 138,596 67,137
- Global Carbon Capture and Storage Institute
100,000 25,000 35,000 20,000 20,000
- Radioactive Waste Management 4,204 2,858
- Maralinga Maintenance 239 239
- Rum Jungle 40 25 16
- Syntroleum Depreciation 1,000 1,000 1,000 1,000 1,000
Clean Energy Initiative Special Account:1
- Carbon Capture and Storage Flagships 19,180 82,325 93,000 155,000 238,138
- National Low Emissions Coal Initiative 67,768 48,656 51,870 70,567 35,000
- National CO2 Infrastructure Plan 15,000 20,000 15,000 5,650
Annual departmental expenses:
- Program support 28,464 38,664 26,660 23,968 21,988
- Expenses not requiring appropriation in the Budget year
155 155 155 155 155
Total program expenses 359,647 281,060 227,701 285,690 321,931